The probable impacts of climate change on poverty - UNDP
The probable impacts of climate change on poverty - UNDP
The probable impacts of climate change on poverty - UNDP

Create successful ePaper yourself
Turn your PDF publications into a flip-book with our unique Google optimized e-Paper software.
estimated that 1.39, 1.26 and 14.48 lakhs hectares <str<strong>on</strong>g>of</str<strong>on</strong>g> crop land was affected by flood in 2005, 2006 and 2007,<br />
respectively. Cycl<strong>on</strong>e Sidr has fully destroyed 300,940 ha <str<strong>on</strong>g>of</str<strong>on</strong>g> Transplanted Aman and partially damaged 700,533 ha<br />
(Draft report <strong>on</strong> cycl<strong>on</strong>e Sidr, CDMP). <str<strong>on</strong>g>The</str<strong>on</strong>g> following table shows yearly damage <str<strong>on</strong>g>of</str<strong>on</strong>g> rice variety by flood and<br />
cycl<strong>on</strong>e.<br />
Table 6.6 Loss <str<strong>on</strong>g>of</str<strong>on</strong>g> producti<strong>on</strong> by different types <str<strong>on</strong>g>of</str<strong>on</strong>g> hazards<br />
Year<br />
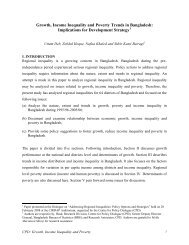
Figure 6.1 Year wise occurrence <str<strong>on</strong>g>of</str<strong>on</strong>g> flood with % <str<strong>on</strong>g>of</str<strong>on</strong>g> area inundated and damage to crops.<br />
Crop Damage (MT)<br />
1400000<br />
1200000<br />
1000000<br />
800000<br />
600000<br />
400000<br />
200000<br />
0<br />
Source: CEGIS, BBS and DAE 2007.<br />
1993 1994 1995 1996 1997 1998 1999 2000 2001 2002 2003 2004<br />
Year<br />
<str<strong>on</strong>g>The</str<strong>on</strong>g> Probable Impacts <str<strong>on</strong>g>of</str<strong>on</strong>g> Climate Change <strong>on</strong> Poverty and Ec<strong>on</strong>omic Growth and<br />
the Opti<strong>on</strong>s <str<strong>on</strong>g>of</str<strong>on</strong>g> Coping with adverse Effect <str<strong>on</strong>g>of</str<strong>on</strong>g> Climate Change in Bangladesh<br />
Loss in Producti<strong>on</strong> (M. T<strong>on</strong>s)<br />
Flood (all types) Cycl<strong>on</strong>e/Storm/Hailstorm<br />
Aus<br />
Aman Boro Aus Aman Boro<br />
1993 71,835 115,31 3 - 141 - 80,522<br />
1994 31,565 3,535 139,08 0 - - -<br />
1995 176,970 541,99 5 - - - -<br />
1996 12,558 8,677 - - - 25,012<br />
1997 30,117 6,240 - - 4,501 -<br />
1998 274,875 927,35 7 23,558 - - -<br />
1999 26,510 242,60 5 - - - -<br />
2000 - 197,97 0 - 1,572 - 317,460<br />
2001 27,540 34,870 - - - 18,440<br />
2002 52,030 131,89 0 - - - 247,760<br />
2003 177,880 43,880 - - 15,610<br />
2004 150,590 954,50 0 - - - 497,220<br />
Source: BBS<br />
Usually adverse <str<strong>on</strong>g>impacts</str<strong>on</strong>g> <str<strong>on</strong>g>of</str<strong>on</strong>g> <str<strong>on</strong>g>climate</str<strong>on</strong>g> <str<strong>on</strong>g>change</str<strong>on</strong>g> <strong>on</strong> soil quality and its subsequent effects <strong>on</strong> crop are not recognized.<br />
Experts interviewed informed that temperature variati<strong>on</strong> could increase biotic activity <str<strong>on</strong>g>of</str<strong>on</strong>g> the soil and increase<br />
deficiency <str<strong>on</strong>g>of</str<strong>on</strong>g> soil nutrient and likely to reduce crop producti<strong>on</strong>. It has also revealed that flood has both positive<br />
and negative impact <strong>on</strong> soil. In the case <str<strong>on</strong>g>of</str<strong>on</strong>g> land covered by sand which degrades the quality <str<strong>on</strong>g>of</str<strong>on</strong>g> soil while silt<br />
depositi<strong>on</strong> improves soil quality which has positive impact <strong>on</strong> crop producti<strong>on</strong>.<br />
It is evident that the higher the magnitude <str<strong>on</strong>g>of</str<strong>on</strong>g> flood, the higher the damages <str<strong>on</strong>g>of</str<strong>on</strong>g> crop agriculture. It is found that<br />
flood <str<strong>on</strong>g>of</str<strong>on</strong>g> 1998 and 2004 cause significant damage to crops. <str<strong>on</strong>g>The</str<strong>on</strong>g> following figure shows relati<strong>on</strong>ship between area<br />
inundated and damage to crop.<br />
C rop D amage Area inundated<br />
80<br />
70<br />
60<br />
50<br />
40<br />
30<br />
20<br />
10<br />
0<br />
Area Inundated (%)<br />
45