Upper mantle flow beneath and around the Hangay ... - ResearchGate
Upper mantle flow beneath and around the Hangay ... - ResearchGate
Upper mantle flow beneath and around the Hangay ... - ResearchGate

You also want an ePaper? Increase the reach of your titles
YUMPU automatically turns print PDFs into web optimized ePapers that Google loves.
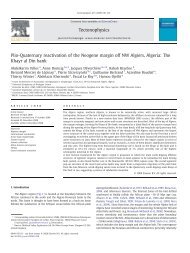
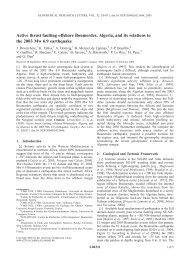
Earth <strong>and</strong> Planetary Science Letters 274 (2008) 221–233Contents lists available at ScienceDirectEarth <strong>and</strong> Planetary Science Lettersjournal homepage: www.elsevier.com/locate/epsl<strong>Upper</strong> <strong>mantle</strong> <strong>flow</strong> <strong>beneath</strong> <strong>and</strong> <strong>around</strong> <strong>the</strong> <strong>Hangay</strong> dome, Central MongoliaGuilhem Barruol a, ⁎, Anne Deschamps b , Jacques Déverchère c,d , Valentina V. Mordvinova e ,Munkhuu Ulziibat f , Julie Perrot c,d , Alex<strong>and</strong>re A. Artemiev e , Tundev Dugarmaa f , Götz H.R. Bokelmann aa Université Montpellier II, CNRS, Géosciences Montpellier, F-34095 Montpellier cedex 5, Franceb Université Nice Sophia Antipolis, CNRS, Observatoire de la Côte d'Azur, Géosciences Azur, 250, Rue Albert Einstein, F-06560 Valbonne, Francec Université Européenne de Bretagne, Franced Université de Brest; CNRS, UMR 6538 Domaines Océaniques; Institut Universitaire Européen de la Mer, Place Copernic, 29280 Plouzané, Francee Institute of <strong>the</strong> Earth's Crust SB RAS, Lermontov st. 128, Irkutsk, 664033, Russiaf Research Centre of Astronomy & Geophysics of <strong>the</strong> Mongolian Academy of Sciences (RCAG), P.O. Box 51, Ulaanbaatar, MongoliaarticleinfoabstractArticle history:Received 21 December 2007Received in revised form 16 July 2008Accepted 17 July 2008Available online 28 July 2008Editor: R.D. van der HilstKeywords:seismic anisotropySKSshear-wave splittingupper <strong>mantle</strong>Mongolia<strong>Hangay</strong> domeSiberian cratonBogd faultMongolia represents <strong>the</strong> nor<strong>the</strong>rnmost area affected by <strong>the</strong> India–Asia collision, <strong>and</strong> it is actively deformed alongtranspressive belts closely associated with large-scale strike-slip faults. The active <strong>and</strong> past <strong>mantle</strong> <strong>flow</strong> <strong>beneath</strong>this region is, however, poorly known. In order to investigate deep <strong>mantle</strong> deformation <strong>beneath</strong> central Mongolia<strong>and</strong> its relation with <strong>the</strong> surrounding major structures such as <strong>the</strong> Siberian craton, <strong>the</strong> Gobi–Altay belt <strong>and</strong> <strong>the</strong>Baikal rift, a NS-trending profile of broadb<strong>and</strong> seismic stations has been deployed in <strong>the</strong> summer 2003 from <strong>the</strong>sou<strong>the</strong>rn Siberian craton to <strong>the</strong> Gobi–Altay range, crossing <strong>the</strong> entire <strong>Hangay</strong> dome. Mantle <strong>flow</strong> is deduced from<strong>the</strong> splitting of teleseismic shear waves such as SKS phases. In eastern Mongolia, <strong>the</strong> permanent station ULN inUlaanbaatar reveals <strong>the</strong> presence of two anisotropic layers, <strong>the</strong> upper one being oriented NE–SW, close to <strong>the</strong>trend of lithospheric structures <strong>and</strong> <strong>the</strong> lower one NW–SE, close to <strong>the</strong> trend of Eurasia absolute plate motion.Along <strong>the</strong> NS profile in central Mongolia, seismic anisotropy deduced from SKS splitting reveals a homogeneousNW–SE trending structure, fully consistent with <strong>the</strong> observations made in <strong>the</strong> Altay–Sayan in western Mongolia.The observed delay times of 1.5 to more than 2.0 s favor consistent <strong>mantle</strong> <strong>flow</strong> over large <strong>mantle</strong> thicknesses.Since <strong>the</strong> lithosphere is less than 100 km thick <strong>beneath</strong> central Mongolia <strong>and</strong> since <strong>the</strong> observed fast directions areparallel to <strong>the</strong> trend of <strong>the</strong> lithospheric structures but also close to <strong>the</strong> trend of <strong>the</strong> absolute plate motion, wepropose that both <strong>the</strong> lithosphere <strong>and</strong> <strong>the</strong> as<strong>the</strong>nosphere may join <strong>the</strong>ir anisotropic effects <strong>beneath</strong> centralMongolia to explain <strong>the</strong> large delay times. Although GPS vectors represent <strong>the</strong> instantaneous displacement of <strong>the</strong>Earth's surface <strong>and</strong> SKS splitting <strong>the</strong> time <strong>and</strong> vertical integration of finite strain at depth, we use <strong>the</strong> opportunityof <strong>the</strong> dense geodetic measurements available in this region to discuss <strong>the</strong> anisotropy pattern in term of presentdaydeformation. In <strong>the</strong> Eurasia-fixed reference frame, GPS <strong>and</strong> SKS both depict a similar trend <strong>beneath</strong> centralMongolia, suggesting a lithospheric block “escaping” toward <strong>the</strong> east that could orient olivine a-axes in <strong>the</strong> upper<strong>mantle</strong>, within a transpressive tectonic regime. A different behaviour is observed in western Mongolia: <strong>the</strong> GPSvectors trend NS, close to <strong>the</strong> regional compression direction, whereas <strong>the</strong> fast SKS directions trend EW,suggesting a tectonic regime close to a mode of axial shortening, generating <strong>the</strong> development of an EW-trendingfoliation at depth. We <strong>the</strong>refore propose that Mongolia is a place where active <strong>and</strong> frozen lithosphericdeformation may add <strong>the</strong>ir effects, toge<strong>the</strong>r with <strong>the</strong> sublithospheric <strong>flow</strong>. In <strong>the</strong> three sources of anisotropyinferred, a fundamental role is played by <strong>the</strong> Siberian craton that acted as an undeformable core of <strong>the</strong> continentthrough time: <strong>the</strong> frozen Paleozoic <strong>and</strong> Mesozoic structures wrap <strong>around</strong> <strong>the</strong> craton, building up <strong>the</strong> fastanisotropic direction pattern; <strong>the</strong> present-day sublithospheric <strong>flow</strong> induced by <strong>the</strong> plate motion is likelydeflecting <strong>around</strong> its deep roots; finally, <strong>the</strong> present-day tectonic regime appears to be controlled by <strong>the</strong> presenceof <strong>the</strong> craton to <strong>the</strong> north.© 2008 Elsevier B.V. All rights reserved.1. Introduction⁎ Corresponding author. Université Montpellier II, CNRS, Laboratoire GéosciencesMontpellier, Pl. E. Bataillon, 34095 Montpellier cedex 5, France. Tel.: +33 4 67 14 34 87;fax: +33 4 67 14 36 03.E-mail addresses: barruol@gm.univ-montp2.fr (G. Barruol),deschamps@geoazur.unice.fr (A. Deschamps), jacdev@univ-brest.fr (J. Déverchère),mordv@crust.irk.ru (V.V. Mordvinova), ulzibat@rcag.url.mn (M. Ulziibat),jperrot@univ-brest.fr (J. Perrot), dugarmaa@rcag.url.mn (T. Dugarmaa),Goetz.Bokelmann@gm.univ-montp2.fr (G.H.R. Bokelmann).The crustal deformations occurring along <strong>the</strong> Siberian platform <strong>and</strong>within <strong>the</strong> Mongolian plateau (nor<strong>the</strong>rn Asia) are broadly accepted torepresent <strong>the</strong> nor<strong>the</strong>rnmost effects of <strong>the</strong> India-Eurasia collision (Fig. 1).At large scale, <strong>the</strong>se deformations most probably result from <strong>the</strong>difference in external boundary conditions to <strong>the</strong> South <strong>and</strong> <strong>the</strong> East,with compression from <strong>the</strong> south due to <strong>the</strong> India/Eurasia collision, <strong>and</strong>0012-821X/$ – see front matter © 2008 Elsevier B.V. All rights reserved.doi:10.1016/j.epsl.2008.07.027
G. Barruol et al. / Earth <strong>and</strong> Planetary Science Letters 274 (2008) 221–233223an anisotropic medium is split into two perpendicularly polarized wavesthat travel at different velocities. From three-component seismicrecords, two parameters can be measured to quantify anisotropy: <strong>the</strong>difference in arrival time (δt) between <strong>the</strong> two split waves, whichdepends on <strong>the</strong> thickness <strong>and</strong> on <strong>the</strong> degree of intrinsic anisotropy of <strong>the</strong>medium, <strong>and</strong> <strong>the</strong> azimuth Φ of <strong>the</strong> fast split shear wave polarizationplanes, which is related to <strong>the</strong> orientation of <strong>the</strong> pervasive fabric(foliation <strong>and</strong> lineation) in <strong>the</strong> anisotropic structure. Measurement ofteleseismic shear-wave splitting is <strong>the</strong>refore used to probe active orfossil <strong>mantle</strong> deformation <strong>beneath</strong> a station, with a good lateralresolution of a few tens of kilometers that can provide crucialinformation on present <strong>and</strong> past geodynamic processes that occurredin <strong>the</strong> upper <strong>mantle</strong>. Unfortunately, SKS splitting has a poor verticalresolution <strong>and</strong> <strong>the</strong> vertical location of anisotropy in <strong>the</strong> <strong>mantle</strong> is alwaysa key unknown when interpreting SKS splitting measurements. If oneassumes that most of <strong>the</strong> anisotropy affecting <strong>the</strong> vertically propagatingshear waves lies within <strong>the</strong> uppermost 400 km of <strong>the</strong> Earth (e.g., Savage,1999; Mainprice et al., 2000, 2005; Sieminski et al., 2007) <strong>and</strong> that <strong>the</strong>crust may contribute to <strong>the</strong> total observed delay times to only a fewtenths of seconds (Barruol <strong>and</strong> Mainprice, 1993; Godfrey et al., 2000),<strong>the</strong>n most of <strong>the</strong> SKS splitting has to be explained by active or fossilupper <strong>mantle</strong> deformation.In <strong>the</strong> present paper, after a description of <strong>the</strong> experiment <strong>and</strong> of<strong>the</strong> shear wave splitting measurements, we discuss <strong>the</strong> variouspossible origins of anisotropy (in <strong>the</strong> lithosphere <strong>and</strong> in <strong>the</strong> as<strong>the</strong>nosphere)in <strong>the</strong> light of independent geological <strong>and</strong> geophysical data<strong>and</strong> <strong>the</strong> current tectonic processes.2. Experiment, data <strong>and</strong> methodologyFrom April to October 2003, 18 three-component broadb<strong>and</strong>stations from <strong>the</strong> French Lithoscope program were deployed along aNS trending profile extending from <strong>the</strong> sou<strong>the</strong>rn Siberian platform to<strong>the</strong> Gobi–Altay range (Fig. 1), crossing <strong>the</strong> southwestern tip of <strong>the</strong>Baikal rift <strong>and</strong> <strong>the</strong> whole <strong>Hangay</strong> dome. This temporary seismicdeployment took place in a larger project combining o<strong>the</strong>r observationssuch as geodesy <strong>and</strong> seismotectonics in order to constrain <strong>the</strong>crustal <strong>and</strong> <strong>mantle</strong> structures but also <strong>the</strong> past <strong>and</strong> present-daytectonic processes occurring in <strong>the</strong> Baikal–Mongolia system.In order to observe distinct, high signal-to-noise ratio SKS <strong>and</strong> SKKSphases, we selected teleseismic events located at distances larger than85° <strong>and</strong> of magnitude generally greater than 5.8. The origins <strong>and</strong>locations of <strong>the</strong> events used in this study, which are reported in <strong>the</strong>supplementary material, are taken from <strong>the</strong> U.S. Geological Survey(USGS) Preliminary Determination of Epicenters. Phase arrivals arecomputed using <strong>the</strong> IASP91 Earth reference model (Kennett <strong>and</strong>Engdahl, 1991).We measured <strong>the</strong> shear wave splitting using <strong>the</strong> method of Silver<strong>and</strong> Chan (1991) which determines <strong>the</strong> ‘shear wave splittingparameters’, ϕ <strong>and</strong> δt, that best minimize energy on <strong>the</strong> transversecomponent of <strong>the</strong> seismogram for a selected time window. We alsoused <strong>the</strong> SplitLab analysis software (Wüstefeld et al., 2008) thatcombines both <strong>the</strong> Silver <strong>and</strong> Chan (1991) method <strong>and</strong> <strong>the</strong> Rotationcorrelationapproach (Bowman <strong>and</strong> Ando, 1987). SplitLab is particularlysuited to process large volumes of data, <strong>and</strong> <strong>the</strong> combination ofFig. 2. Examples of splitting measurements obtained for event 2003/208 (27-Jul-2003, 02:04, Mw=6.6, lat. −21.08N, long. −176.59E, depth 212 km, backazimuth 110°) at stationsHURE, BAYN <strong>and</strong> DALA. From left to right we show for each station <strong>the</strong> raw data (radial <strong>and</strong> transverse components of <strong>the</strong> SKS phase), <strong>the</strong> corrected fast <strong>and</strong> slow split waves, <strong>the</strong>particle motion in <strong>the</strong> horizontal plane before <strong>and</strong> after <strong>the</strong> anisotropy correction, <strong>and</strong> <strong>the</strong> map of <strong>the</strong> eigenvalues for <strong>the</strong> various ϕ <strong>and</strong> δt values.
224 G. Barruol et al. / Earth <strong>and</strong> Planetary Science Letters 274 (2008) 221–233epicentral distance during <strong>the</strong> six-month experiment, shear wavesplitting has been observed at most of <strong>the</strong> temporary stations exceptfor some located at <strong>the</strong> southwestern tip of <strong>the</strong> Baikal rift. The regionalanisotropy pattern presented in Fig. 3 can be described with respect tolarge-scale lithospheric structures.Fig. 3. SKS wave splitting measurements observed at <strong>the</strong> MOBAL temporary stations,<strong>and</strong> at <strong>the</strong> GSN permanent broad b<strong>and</strong> stations TLY <strong>and</strong> ULN. The splitting observationsare characterized by <strong>the</strong>ir azimuths <strong>and</strong> <strong>the</strong> delay time (length of <strong>the</strong> segment). Theindividual splitting measurements of fair (grey) <strong>and</strong> good (black) quality are shown ateach station. The quality of <strong>the</strong> measurement is based on <strong>the</strong> SNR of <strong>the</strong> initial SKSphase, on <strong>the</strong> initial ellipticity of <strong>the</strong> ground motion associated to <strong>the</strong> SKS phase, on <strong>the</strong>linearization of <strong>the</strong> transverse component after anisotropy correction <strong>and</strong> on <strong>the</strong>similarity between <strong>the</strong> split waveforms.i) The two MOBAL stations on <strong>the</strong> Siberian platform (KAIT, OKTB) arecharacterized by measurements of intermediate quality. Theyshow a complex pattern with fast directions trending from NW–SE to EW, similar to fast directions that have already been reportedby Gao et al. (1997) for this area. The small number of individualmeasurements does not allow any conclusive interpretation.ii) We did not succeed in detecting anisotropy at <strong>the</strong> temporarystations located at <strong>the</strong> southwestern tip of <strong>the</strong> Baikal rift: weobtained only a very limited amount of data due to instrumentationproblems in stations KIRN, ARSH, DLY2 <strong>and</strong> DALY,<strong>and</strong> only null measurements have been observed at <strong>the</strong> stationTORI that provided good quality data.iii) The eleven seismic stations aligned across <strong>the</strong> <strong>Hangay</strong> dome arecharacterized by homogeneously oriented fast split directionstrending N115°E to N134°E with an average close to N130°E withsome local exceptions such as TSET (ϕ=N170°E). This homogeneityin ϕ is visible in Fig. 4 that shows <strong>the</strong> NS variation of <strong>the</strong>mean splitting parameters. Delay times are not characterized bysimilar homogeneity. They display strong variations ranging from0.75 s (UULA) to 2.86 s (BAYN, example shown on Fig. 2)suggesting short-scale <strong>and</strong> ra<strong>the</strong>r superficial variations in <strong>the</strong>magnitude of deformation. It is worth noting that <strong>the</strong> fourstations sampling <strong>the</strong> nor<strong>the</strong>rn half of <strong>the</strong> <strong>Hangay</strong> dome (SHA2,HURE, BADR <strong>and</strong> BAYN) <strong>and</strong> two stations located on <strong>the</strong> sou<strong>the</strong>rnhalf of <strong>the</strong> dome (TUSG <strong>and</strong> BUMB) are characterized by δt largerthan 1.5 s (Fig. 4). The largest delay time of <strong>the</strong> whole profile isobserved at station BAYN located on <strong>the</strong> eastward continuation of<strong>the</strong> Bolnay senestral strike-slip fault but also above <strong>the</strong> slowestshear velocity anomaly evidenced by seismic tomography byMordvinova et al. (2007). The regional NW–SE trending fastanisotropic direction we observed across <strong>the</strong> <strong>Hangay</strong> dome isperfectly aligned with <strong>the</strong> observations made by Dricker et al.(2002) in <strong>the</strong> Altay–Sayan region fur<strong>the</strong>r west. These authors alsotwo independent techniques has been shown to provide helpfulinformation to identify <strong>and</strong> quantify weak anisotropy <strong>and</strong> nullobservations (Wüstefeld <strong>and</strong> Bokelmann, 2007). We present in Fig. 2three examples of splitting measurements obtained at stations HURE,BAYN <strong>and</strong> DALA for <strong>the</strong> Tonga event occurring on July 27 that showclear SKS phases with signal/noise ratio larger than 10 <strong>and</strong> clearsplitting with different parameters depending on <strong>the</strong> station location.We ascribe a quality factor (good, fair, or poor) to <strong>the</strong> measurements,as defined by Barruol et al. (1997), depending on <strong>the</strong> signal to noiseratio of <strong>the</strong> initial phase, on <strong>the</strong> rectilinear polarization of <strong>the</strong> particlemotion in <strong>the</strong> horizontal plane after anisotropy correction, <strong>and</strong> on <strong>the</strong>waveform correlation between <strong>the</strong> fast <strong>and</strong> slow split shear waves. Inaddition to <strong>the</strong> temporary MOBAL stations, we also processed <strong>the</strong> datarecorded during more than ten years at <strong>the</strong> two permanent IRISstations TLY (Talaya, Russia), located at <strong>the</strong> southwestern tip of <strong>the</strong>Baikal lake, <strong>and</strong> ULN (Ulaanbaatar, Mongolia).3. Shear wave splitting observations3.1. Anisotropy along <strong>the</strong> MOBAL profileThanks to <strong>the</strong> site quality, <strong>the</strong> low noise level in this region, <strong>and</strong> <strong>the</strong>occurrence of several events of sufficient magnitude at <strong>the</strong> rightFig. 4. Variations of <strong>the</strong> mean anisotropy parameters (ϕ <strong>and</strong> δt) obtained along <strong>the</strong>MOBAL profile from <strong>the</strong> high quality splitting measurements (see Table 1). For stationULN <strong>the</strong> azimuth of <strong>the</strong> lower <strong>and</strong> upper fast directions obtained from <strong>the</strong> best-fittingtwo-layer model are plotted.
226 G. Barruol et al. / Earth <strong>and</strong> Planetary Science Letters 274 (2008) 221–233Fig. 5. Analysis of splitting measurements obtained at ULN (Ulaanbaatar, Mongolia). a: anisotropic parameters of <strong>the</strong> 50 good splitting measurements in a polar diagram. b <strong>and</strong> c:apparent variations of <strong>the</strong> splitting parameters (respectively <strong>the</strong> fast direction <strong>and</strong> <strong>the</strong> delay time) as a function of <strong>the</strong> backazimuth of <strong>the</strong> incoming wave, toge<strong>the</strong>r with <strong>the</strong> bestfittingtwo-layer model found (blue line). d <strong>and</strong> e: histograms showing <strong>the</strong> statistical distribution of <strong>the</strong> upper <strong>and</strong> lower fast directions of <strong>the</strong> 1000 best two-layers models.stations on <strong>the</strong> <strong>Hangay</strong> dome <strong>and</strong> at station ULN, we propose that <strong>the</strong>structures are different: At station BAYN for instance, <strong>the</strong> 4 events thatprovided good non-null splitting measurements with ϕ trendingN115–128°E arrive with backazimuths of 104, 119, 108, <strong>and</strong> 110°. Atstation DALA fur<strong>the</strong>r south, from <strong>the</strong> 10 events providing good nonnulls,9 also arrive with backazimuths in <strong>the</strong> range 102–118° <strong>and</strong> onewith a backazimuth of 338°. At this station, all <strong>the</strong> fast split directionsare trending between N159°E to N138°E. At station ULN, all <strong>the</strong> eventsarriving with backazimuths between 100 <strong>and</strong> 130° provided welldefinedfast split directions in <strong>the</strong> range N40–60°E. In summary,analyzing 6 months of data at ULN is not likely to allow us to constraina two-layered structure, but it should give primarily a NE–SWdominant fast direction. Our measurements along <strong>the</strong> MOBAL profileshow a clear NW–SE fast direction, from which we conclude that <strong>the</strong>upper <strong>mantle</strong> pervasive structure <strong>beneath</strong> <strong>the</strong> <strong>Hangay</strong> dome <strong>and</strong>Ulaanbaatar four hundred km to <strong>the</strong> east is effectively different. Asdiscussed below, a possible geometry is that two anisotropic layers arepresent <strong>beneath</strong> Mongolia, but <strong>the</strong>ir fast directions are close to eacho<strong>the</strong>r <strong>beneath</strong> central <strong>and</strong> western Mongolia <strong>and</strong> significantlydifferent <strong>beneath</strong> eastern Mongolia.Analysis of 16 years of data recorded at <strong>the</strong> permanent station TLYlocated at <strong>the</strong> southwestern edge of <strong>the</strong> Baikal rift provided 190 nullmeasurements <strong>and</strong> only 19 non null measurements of good quality.These good splitting measurements display a more complex pattern(Fig. 3) than at ULN, <strong>and</strong> are characterized by a strong scatter of <strong>the</strong>fast split directions, with two dominant NS <strong>and</strong> EW fast directionsobserved in a very narrow backazimuthal range (N110–130°E), whichcannot be explained by <strong>the</strong> only presence of two anisotropic layers.Although <strong>the</strong> overall pattern may resemble to <strong>the</strong> pattern obtained atULN, <strong>the</strong>y are in fact notably different <strong>and</strong> a simple two-layer modeldoes not explain <strong>the</strong> observations at TLY better than a singleanisotropic layer, suggesting instead <strong>the</strong> presence of complex <strong>and</strong>heterogeneous <strong>mantle</strong> structures <strong>beneath</strong> this area, which wasalready proposed by Gao et al. (1994b, 1997) <strong>and</strong> by Vauchez et al.(1999).4. DiscussionInterpretation of shear wave splitting is not straightforward sinceit depends on our knowledge of processes of <strong>the</strong> anisotropydevelopment <strong>and</strong> on its lateral <strong>and</strong> vertical location. We discuss in<strong>the</strong> following sections three possible sources of anisotropy: i)deformation may be “frozen” in <strong>the</strong> lithosphere <strong>and</strong> related to itsbuild-up since Paleozoic times; ii) anisotropy may be located in <strong>the</strong>sublithospheric <strong>mantle</strong> <strong>and</strong> induced by <strong>the</strong> conjugate effects ofpresent-day plate drag <strong>and</strong> deeper active convection; iii) finally, upper<strong>mantle</strong> anisotropy may be related to <strong>the</strong> present-day deformation ofthis part of <strong>the</strong> continent induced by <strong>the</strong> collision of India withEurasia. We take <strong>the</strong> opportunity of <strong>the</strong> dense geodetic measurementsavailable in Mongolia to refine this discussion. An interestingconclusion is that <strong>the</strong> three origins of anisotropy are likely <strong>and</strong> mayadd <strong>the</strong>ir effects toge<strong>the</strong>r.
G. Barruol et al. / Earth <strong>and</strong> Planetary Science Letters 274 (2008) 221–2332274.1. Seismic anisotropy <strong>and</strong> role of <strong>the</strong> fossil lithospheric deformationThe present-day structure of <strong>the</strong> Mongolian lithosphere likelyresults from a long-lasting accretion of micro-continents <strong>and</strong> isl<strong>and</strong>arcsthat wrapped <strong>around</strong> <strong>the</strong> Siberian craton (<strong>the</strong> paleo-Angara plate)during Caledonian <strong>and</strong> Hercynian times (e.g., Zorin, 1999). From lateCambrian to Devonian times, an active margin extended along <strong>the</strong>present-day southwestern side of <strong>the</strong> Siberian craton. This Caledonianevent closed <strong>the</strong> paleo-ocean, <strong>and</strong> accreted several micro-continentssouth to it, such as <strong>the</strong> Tuva–Mongolia block (Delvaux et al., 1995) <strong>and</strong>developed <strong>the</strong> Sayan–Baikal fold belt. This Caledonian orogeny thataffected western Mongolia produced NW–SE trending crustal foliations<strong>and</strong> fault-related structures.From Devonian to Triassic times, ano<strong>the</strong>r active margin was presenton <strong>the</strong> sou<strong>the</strong>astern side of <strong>the</strong> craton, parallel to its border <strong>and</strong> trendingNE–SW along <strong>the</strong> Mongol–Okhotsk ocean (Delvaux et al., 1995). Thisarea underwent strong deformation, bloc accretion <strong>and</strong> graniticintrusion <strong>and</strong> formed a major part of <strong>the</strong> Hercynian Mongolianbasement. During Devonian to Carboniferous times, ano<strong>the</strong>r NW–SEtrending subduction (along <strong>the</strong> Paleo–Tethys) was active at roughly <strong>the</strong>present-day location of <strong>the</strong> Gobi–Altay range. This tectonic feature wasaccompanied by back-arc rifting, volcanism, magmatism, accretions, <strong>and</strong>by transpressional, right-lateral shearing that may have affected <strong>the</strong>whole lithosphere <strong>and</strong> that may have oriented <strong>the</strong> olivine a-axes parallelto <strong>the</strong> trend of <strong>the</strong> belt (e.g., Tikoff et al., 2004).The tectonic evolution of Mongolia during Mesozoic times isprimarily marked by <strong>the</strong> final closure of <strong>the</strong> Mongol–Okhotsk oceanthat occurred at <strong>the</strong> end of <strong>the</strong> Trias. At that time, <strong>the</strong> Mongol <strong>and</strong>Baikal lithospheres were formed. They did not suffer strong deformationuntil Cenozoic times, when <strong>the</strong> India–Asia collision started <strong>and</strong>induced a large-scale block reorganization. The present-day deformationof Mongolia started at <strong>the</strong> end of <strong>the</strong> Oligocene <strong>and</strong> appears tohave accelerated during <strong>the</strong> Pliocene (Schlupp, 1996). It is dominatedby transpressional tectonics that built elongated ranges on large-scalestrike-slip faults (Bayasgalan et al., 2005) that accommodate most of<strong>the</strong> displacements, shortening accommodated by thrust faults beingra<strong>the</strong>r limited, e.g., only 20–30 km across <strong>the</strong> Mongolian Altay(Cunningham, 2005).Large-scale structural analyses <strong>and</strong> plate-tectonics reconstructions<strong>the</strong>refore suggest that during all Paleozoic <strong>and</strong> early Mesozoic times,Mongolia was a place of continuous accretion <strong>and</strong> transpressivedeformation <strong>around</strong> <strong>the</strong> Angara Craton, with penetrative structurestrending NW–SE on <strong>the</strong> southwestern side of <strong>the</strong> Siberian platform(i.e., in <strong>the</strong> present-day western <strong>and</strong> central Mongolia) <strong>and</strong> trendingNE–SW on its sou<strong>the</strong>astern side (i.e., in <strong>the</strong> trans-Baikal ranges, ineastern Mongolia). Such deformations are expected to involve <strong>the</strong>whole lithosphere <strong>and</strong> to orient olivine a-axes parallel to <strong>the</strong>lithospheric structures <strong>and</strong> hence to induce belt-parallel shear wavesplitting (e.g., Tommasi et al., 1999; Tikoff et al., 2004). Interestingly,reactivation of preexisting structures such as large-scale deformationzones have been described in several places, suggesting an importantrole of heterogeneities <strong>and</strong> inherited structures at lithospheric scale.The Gobi–Altay range is thought for instance to represent a boundarybetween Caledonian <strong>and</strong> Hercynian terranes (Delvaux et al., 1995),Fig. 6. Topographic map of Mongolia <strong>and</strong> surrounding areas showing <strong>the</strong> mean SKS splitting measurements available in <strong>the</strong> region, toge<strong>the</strong>r with <strong>the</strong> GPS vectors <strong>and</strong> <strong>the</strong>ir ellipsoid ofuncertainty from Calais et al. (2003) as well as <strong>the</strong> absolute plate motion vectors calculated from HS3-Nuvel1A (Gripp <strong>and</strong> Gordon, 2002). Note that <strong>the</strong> vector scales are <strong>the</strong> same for<strong>the</strong> GPS <strong>and</strong> APM. The splitting observations are characterized by <strong>the</strong>ir azimuths <strong>and</strong> <strong>the</strong> delay time (length of <strong>the</strong> segment). Black lines represent <strong>the</strong> data obtained in <strong>the</strong> presentstudy whereas <strong>the</strong> blue lines represent splitting measurements previously published by Silver <strong>and</strong> Chan (1991), Vinnik et al. (1992), Gao et al. (1994b, 1997), <strong>and</strong> Dricker et al. (2002).
228 G. Barruol et al. / Earth <strong>and</strong> Planetary Science Letters 274 (2008) 221–233suggesting that pre-existing lithospheric sutures have preferentiallycontrolled Cenozoic faulting (Cunningham, 2005). The Bolnay fault isalso described to reactivate a Silurian major crustal structure (Schlupp,1996) <strong>and</strong> <strong>the</strong> Baikal pre-rift basement structure is clearly alignedwith Paleozoic crustal structures (Delvaux et al., 1995). The NE–SWtrending fast anisotropic directions in eastern Mongolia interpreted aslithospheric frozen structures also suggest that <strong>the</strong> opening of <strong>the</strong>Baikal rift could have been controlled by <strong>the</strong> rheological heterogeneitiesinduced by <strong>the</strong> adjacent Siberian craton, by <strong>the</strong> inheritedstructures, <strong>and</strong> also by <strong>the</strong> lithospheric-scale mechanical anisotropyas proposed by Vauchez et al. (1997, 1998).This schematic summary of <strong>the</strong> Mongolian lithosphere evolutionshows that <strong>the</strong> various active margins that developed since Paleozoictimes allow <strong>the</strong> accretion of micro-continents <strong>and</strong> <strong>the</strong> development ofdeformation belts that wrapped <strong>around</strong> <strong>the</strong> Siberian craton that itselfacted as an undeformable core of this continent. Interestingly, <strong>the</strong> fastsplit directions we observe also appear to wrap <strong>around</strong> <strong>the</strong> craton: incentral Mongolia ϕ trends NW–SE, i.e., parallel to <strong>the</strong> southwesternboundary of <strong>the</strong> Siberian platform (Fig. 6) <strong>and</strong> to <strong>the</strong> regionalCaledonian penetrative structures <strong>and</strong> in eastern Mongolia, ϕ trendsNE–SW as observed by Gao et al. (1994b) at <strong>the</strong>ir sou<strong>the</strong>rnmoststations but also in <strong>the</strong> upper anisotropic layer we describe at ULN.The orientations of ϕ observed at <strong>the</strong> two sou<strong>the</strong>rnmost stationsALTA <strong>and</strong> DALA close to <strong>the</strong> active Bogd fault remain largelyunexplained by this hypo<strong>the</strong>sis. The absence of parallelism betweenϕ <strong>and</strong> <strong>the</strong> fault suggests that <strong>the</strong> deformation at depth is ei<strong>the</strong>r notlarge enough or too localized to be felt by teleseismic shear waves. Theshort-scale variations in ϕ at <strong>the</strong>se stations relative to <strong>the</strong> nor<strong>the</strong>rnstations (Fig. 4) argue for shallow variations in <strong>the</strong> lithospheric fabric.Such variations may result ei<strong>the</strong>r from recent complex microblockrotations <strong>and</strong>/or by <strong>the</strong> presence of a preexisting lithosphericstructure <strong>beneath</strong> this area, at crustal or <strong>mantle</strong> depth. The latterhypo<strong>the</strong>sis is favored by recent upper <strong>mantle</strong> tomography coupledwith <strong>the</strong> inversion of gravimetric data that shows that <strong>the</strong> <strong>mantle</strong><strong>beneath</strong> <strong>the</strong> Gobi–Altai range has different characteristics than<strong>beneath</strong> <strong>the</strong> <strong>Hangay</strong> dome (Tiberi et al., submitted for publication).More investigation across <strong>and</strong> along <strong>the</strong> Gobi–Altay range could bringuseful insights on <strong>the</strong> origin of this anisotropy pattern.As sketched in Fig. 7a, <strong>the</strong> fast direction of anisotropy is parallel to<strong>the</strong> strike direction of <strong>the</strong> lithospheric units, of <strong>the</strong> ancientaccretionary belts <strong>and</strong> of <strong>the</strong> suture zones that wrap <strong>around</strong> <strong>the</strong>craton; we <strong>the</strong>refore suggest that part of <strong>the</strong> observed anisotropyresults from <strong>the</strong> lithosphere formation <strong>and</strong> deformation <strong>and</strong> remainedfrozen since <strong>the</strong> Paleozoic <strong>and</strong> Mesozoic times <strong>and</strong> is still visible. Asshown below, a sublithospheric anisotropy is however required since<strong>the</strong> lithosphere is likely not thick enough (less than 100 km) to carry<strong>the</strong> whole anisotropy signal (more than 2.0 s).4.2. Seismic anisotropy, as<strong>the</strong>nospheric <strong>flow</strong> <strong>and</strong> Eurasia plate motionIf part of <strong>the</strong> deformation may reside within <strong>the</strong> Mongolianlithosphere, shear wave splitting may also originate in <strong>the</strong> sublithospheric<strong>mantle</strong> where deformation is expected to accommodate <strong>the</strong>present-day absolute <strong>and</strong> relative motion of <strong>the</strong> plate, including <strong>the</strong>deep accommodation of <strong>the</strong> India–Asia collision. The drag-induced<strong>mantle</strong> deformation is clearly imaged <strong>beneath</strong> ocean basins byRayleigh-wave tomography (e.g., Montagner <strong>and</strong> Tanimoto, 1991;Maggi et al., 2006) but also by SKS waves (e.g., Wolfe <strong>and</strong> Solomon,1998; Fontaine et al., 2007). Such an as<strong>the</strong>nospheric anisotropysignature <strong>beneath</strong> continental areas has been debated over <strong>the</strong> lastdecades, mostly because <strong>the</strong> anisotropy in <strong>the</strong> overlying continentallithosphere can be preserved for billions of years <strong>and</strong> can notablyaffect <strong>the</strong> signal picked up by <strong>the</strong> vertically-traveling SKS waves.Due to its low velocity, <strong>the</strong> direction <strong>and</strong> velocity pattern of <strong>the</strong>Eurasian plate motion has been strongly debated <strong>and</strong> is still subject tora<strong>the</strong>r large error bars. In central Mongolia, <strong>the</strong> recent HS3-Nuvel1AFig. 7. Schematic presentation of <strong>the</strong> various possible origins of upper <strong>mantle</strong> seismicanisotropy in Mongolia. a: At lithospheric depth (e.g., 70 km), <strong>the</strong> terranes <strong>and</strong> <strong>the</strong>ir sutureswrapped <strong>around</strong> <strong>the</strong> Siberian craton. The anisotropic upper layer at ULN trends NE–SW<strong>and</strong><strong>the</strong> anisotropic fast-propagation directions <strong>beneath</strong> central Mongolia trend NW–SE. b: Atas<strong>the</strong>nospheric depth (e.g., 150 km for Mongolia), <strong>the</strong> active <strong>mantle</strong> <strong>flow</strong> (dotted lines)<strong>beneath</strong> central Mongolia is slightly deflected by <strong>the</strong> thick Siberian cratonic root. Theabsolute plate motion (APM) calculated from HS3-Nuvel1A model (Gripp <strong>and</strong> Gordon,2002) for <strong>the</strong> Siberian platform is indicated by <strong>the</strong> black arrow. The lower anisotropic layerat ULN but also <strong>beneath</strong> <strong>the</strong> <strong>Hangay</strong> dome trends NW–SE. Such structure may explain <strong>the</strong>NW–SE trending anisotropy <strong>and</strong> <strong>the</strong> large δt across <strong>the</strong> <strong>Hangay</strong> dome <strong>and</strong> <strong>the</strong> two layers ofanisotropy <strong>beneath</strong> Ulaanbaatar, with an upper layer trending NE–SW <strong>and</strong> a lower layertrending NW–SE. c: Present-day tectonic situation in Mongolia. The large arrows indicate<strong>the</strong> regional compression direction induced by <strong>the</strong> India–Asia collision <strong>and</strong> <strong>the</strong> smallarrows schematize <strong>the</strong> GPS vectors in <strong>the</strong> Eurasia-fixed reference frame from Calais et al.(2003). The GPS vectors trend close to NS in western Mongolia, i.e., parallel to <strong>the</strong> regionalcompression direction, <strong>and</strong> close to EW in central <strong>and</strong> eastern Mongolia. This suggests atectonic regime of compression in western Mongolia <strong>and</strong> of transpression in central <strong>and</strong>eastern Mongolia. In both regions as explained in <strong>the</strong> text, <strong>the</strong> fast anisotropic directioninduced by such compression system are expected to trend WNW–ESE (dotted lines), i.e.,close to <strong>the</strong> observed ϕ directions.
G. Barruol et al. / Earth <strong>and</strong> Planetary Science Letters 274 (2008) 221–233229plate motion model relative to <strong>the</strong> hotspot reference frame (Gripp <strong>and</strong>Gordon, 2002) indicates that <strong>the</strong> Eurasian plate moves towards anazimuth of 280° at a velocity of 2 cm/yr (Fig. 6). The SKS splittingdirections we observe across <strong>the</strong> <strong>Hangay</strong> dome but also those inwestern Mongolia (Dricker et al., 2002) are relatively close to thisazimuth but display a systematic clockwise rotation of 20 to 30°. Suchdifference could be considered to be within <strong>the</strong> uncertainty of Eurasiaplate motion direction but may also reflect a true differential motionbetween <strong>the</strong> Earth surface <strong>and</strong> <strong>the</strong> convective <strong>mantle</strong>, such as forinstance a deflection of <strong>the</strong> as<strong>the</strong>nospheric <strong>flow</strong> by <strong>the</strong> thick root of<strong>the</strong> Siberian platform. Fur<strong>the</strong>r east, <strong>the</strong> anisotropy pattern across <strong>and</strong>south of <strong>the</strong> Baikal rift system displays a fast azimuth trending N140–150°E, i.e., at high angle to <strong>the</strong> APM; however, in <strong>the</strong> sou<strong>the</strong>rn part of<strong>the</strong> Gao et al. (1994b) profile, ϕ trends NE–SW to E–W, i.e., closer to<strong>the</strong> APM trend (Fig. 6). At station ULN, <strong>the</strong> lower anisotropic layerevidenced in <strong>the</strong> present work is characterized by ϕ trending roughlyN130°E, i.e., parallel to <strong>the</strong> dominant fast direction <strong>beneath</strong> <strong>the</strong><strong>Hangay</strong> region <strong>and</strong> also at 30° from <strong>the</strong> APM vector. In summary, <strong>the</strong>absolute plate motion can explain most of <strong>the</strong> MOBAL observationswithin 20 to 30°, but some large angular differences observed inseveral areas suggest that more complex anisotropic structures suchas a vertical partition of <strong>the</strong> deformation, as evidenced at ULN, isprobably involved.The topography of <strong>the</strong> lithosphere–as<strong>the</strong>nosphere boundary mayobviously influence <strong>the</strong> as<strong>the</strong>nospheric <strong>flow</strong> induced by <strong>the</strong> APM <strong>and</strong>/or<strong>the</strong> India–Asia collision <strong>and</strong> may locally or regionally explain angulardifferences between SKS <strong>and</strong> APM directions (Bormann et al., 1996). Atlong wavelength, Rayleigh-wave tomography (Priestley et al., 2006)shows that <strong>the</strong> <strong>the</strong>rmal base of <strong>the</strong> cratonic root of <strong>the</strong> Siberian platformextends down to more than 200 km depth, whereas <strong>the</strong> lithosphere<strong>beneath</strong> central Mongolia is likely less than 100 km thick. The jointseismic <strong>and</strong> gravity inversion performed with <strong>the</strong> MOBAL data (Tiberiet al., submitted for publication) also exhibits a cold root <strong>beneath</strong> <strong>the</strong>Siberian craton, down to about 200 km depth, whereas <strong>the</strong> <strong>mantle</strong><strong>beneath</strong> <strong>the</strong> <strong>Hangay</strong> dome is characterized by low velocities <strong>and</strong>densities between 80 <strong>and</strong> 200 km, suggesting <strong>the</strong> presence of buoyantmaterial in <strong>the</strong> <strong>mantle</strong> sustaining <strong>the</strong> <strong>Hangay</strong> lithosphere. The primaryeffect that <strong>the</strong> thick Siberian cratonic keel may have on <strong>the</strong> as<strong>the</strong>nospheric<strong>flow</strong> is to deviate it clockwise from <strong>the</strong> APM direction in central<strong>and</strong> Western Mongolia. These rotations are indeed observed, suggestingthat at least part of our observations could have an as<strong>the</strong>nospheric originrelated to <strong>the</strong> plate motion. Fig. 7b sketches <strong>the</strong> resulting regional trendof <strong>the</strong> as<strong>the</strong>nospheric <strong>flow</strong> that may explain <strong>the</strong>se rotations. Our SKSsplitting measurements can <strong>the</strong>refore be explained partially by <strong>the</strong>frozen lithospheric structure <strong>and</strong> by a present-day as<strong>the</strong>nospheric <strong>flow</strong>deflected by <strong>the</strong> Siberian cratonic root.4.3. Seismic anisotropy <strong>and</strong> present-day tectonicsInterpretation of upper <strong>mantle</strong> seismic anisotropy in such atectonically active area requires us to discuss <strong>the</strong> large-scale signalobserved from shear wave splitting measurements that providesinformation on <strong>the</strong> deep Earth deformation with respect to <strong>the</strong>present-day tectonic processes observed at <strong>the</strong> surface. In this section,we take <strong>the</strong> opportunity to discuss our SKS splitting measurementsthat result from <strong>the</strong> time <strong>and</strong> space integration of <strong>mantle</strong> strain, inview of <strong>the</strong> dense geodetic measurements that provide <strong>the</strong> instantaneousobservable of Earth's surface deformation.The tectonics of central Mongolia, <strong>Hangay</strong> <strong>and</strong> Hövsgöl domains(Fig. 1) is dominated by large senestral strike-slip faults striking E–W,probably of lithospheric scale, such as, from north to south, <strong>the</strong> Sayan,Mondy Bolnay <strong>and</strong> Bogd faults (Baljinnyam, 1993; Ritz et al., 1995;Delouis et al., 2002; Ritz et al., 2003; Schlupp <strong>and</strong> Cisternas, 2007, <strong>and</strong>references <strong>the</strong>rein). Contrastingly, large dextral strike-slip faultsstriking NW–SE characterize active tectonics in western Mongolia(e.g., Bayasgalan et al., 2005; Cunningham, 2005, <strong>and</strong> references<strong>the</strong>rein). At <strong>the</strong> plate-scale, geodetical observations show that <strong>the</strong>India–Eurasia collision is accommodated by intracontinental deformation,dominated to first order by block motions along major strikeslipfaults <strong>and</strong> at second order by internal strain within lithosphericblocks, except in high-elevation areas (Calais et al., 2006; Thatcher,2007). Compilation of <strong>the</strong> geodetic measurements performed in Asiaby Calais et al. (2006) <strong>and</strong> <strong>the</strong> velocity field modeled from GPSvelocities <strong>and</strong> Quaternary fault slip rates (Flesch et al., 2001) bothclearly evidence that <strong>the</strong> accommodation of <strong>the</strong> 4 cm/yr convergenceof India relative to Eurasia is gradually absorbed northward <strong>and</strong> tendstowards zero on <strong>the</strong> Siberian platform. The GPS velocities are, relativeto stable Eurasia, on <strong>the</strong> order of 30 mm/yr in sou<strong>the</strong>rn <strong>and</strong> centralTibet, less than 10 mm/yr in <strong>the</strong> North China <strong>and</strong> Tien Shan area, <strong>and</strong>less than 6 mm/yr in Mongolia (Calais et al., 2003).The absence of overall correlation between GPS velocities that varygradually between Himalaya <strong>and</strong> Mongolia <strong>and</strong> <strong>the</strong> observed splittingdelay times suggests that an important source of anisotropy likelyresides in <strong>the</strong> sublithospheric <strong>mantle</strong>. We show, however, that part ofanisotropy may be related to <strong>the</strong> present-day tectonic compressioninduced by India through two complementary processes:1) The anisotropy may be generated by <strong>the</strong> active strike-slip faultsthat may have a lithospheric extension (e.g., Teyssier <strong>and</strong> Tikoff,1998): The maximum splitting delay time (δt=2.86 s) is observed atBAYN which is located at <strong>the</strong> eastern termination of <strong>the</strong> EWtrendingBolnay fault on which occurred <strong>the</strong> 1905 Mw 8.3earthquake that accommodated about 10 m of displacementalong <strong>the</strong> 375 km long left-lateral strike-slip fault (Schlupp <strong>and</strong>Cisternas, 2007). Such high δt could indicate strong anisotropyrelated to <strong>the</strong> present-day deformation associated to this strikeslipfault. Along <strong>the</strong> MOBAL profile, <strong>the</strong> azimuth ϕ of <strong>the</strong> fast splitshear waves we observe is homogeneously trending NW–SE, i.e.,relatively close to <strong>the</strong> overall trend of <strong>the</strong> active faults (EW <strong>and</strong>N100°E for <strong>the</strong> Bolnay <strong>and</strong> Bogd faults, respectively) compatiblewith pervasive strain at depth related to <strong>the</strong>se faults. Suchinterpretation seems to be, however, unlikely for <strong>the</strong> two sou<strong>the</strong>rnmoststations of <strong>the</strong> MOBAL profile (ALTA <strong>and</strong> DALA) that showlarge obliquities of ϕ with <strong>the</strong> trend of <strong>the</strong> fault, suggesting ei<strong>the</strong>r atoo discrete deformation associated to <strong>the</strong> fault itself or <strong>the</strong>presence of different lithospheric block south of <strong>the</strong> fault.2) The observed anisotropy can be induced by <strong>the</strong> ongoing India–Asiacollision that produce <strong>the</strong> NNE–SSE to NE–SW maximum compressiondirection (e.g., Petit et al., 1996) <strong>and</strong> may generatepervasive deformation at depth, in a similar way to <strong>the</strong> verticalcoherent deformation proposed by Silver (1996). Although GPSvelocities are small in Mongolia, <strong>and</strong> <strong>the</strong>refore subject to ra<strong>the</strong>rlarge uncertainties, GPS vectors relative to fixed Eurasia (Fig. 6)define several contrasted domains (Calais et al., 2003): i) WesternMongolia is characterized by roughly NS-trending vectors (2 to6 mm/yr) corresponding to a NS shortening, consistent with adominating dextral displacement on <strong>the</strong> NW–SE trending Mongolia–Altaystrike-slip faults (Schlupp, 1996; Bayasgalan et al.,2005; Cunningham, 2005) <strong>and</strong> with a ra<strong>the</strong>r limited crustalshortening (20 to 30 km (Cunningham, 2005)) accommodated by<strong>the</strong> E–W trending thrust-faults. ii) Central <strong>and</strong> eastern Mongoliaare dominated by eastward to sou<strong>the</strong>astward trending GPS vectors<strong>and</strong> velocities ranging from 1 to 4 mm/yr, likely accommodated by<strong>the</strong> Bogd <strong>and</strong> Bolnay E–W trending senestral strike-slip faults. iii)In <strong>the</strong> North, <strong>the</strong> Baikal area is subject to a NW–SE trendingextension, normal to <strong>the</strong> rift long axis <strong>and</strong> of about 3 to 4 mm/yr.The trend of ϕ close to <strong>the</strong> GPS velocity vectors in central Mongolia(Fig. 6) suggests a relation between <strong>mantle</strong> <strong>flow</strong> <strong>and</strong> <strong>the</strong> surfacecrustal block motions in this central part of <strong>the</strong> profile that can besummarized in a model of crustal blocks escaping consistently with<strong>the</strong> <strong>mantle</strong> deformation. Such regime of transpressive deformationmay orient olivine a-axes parallel to <strong>the</strong> block escape but cannot be
230 G. Barruol et al. / Earth <strong>and</strong> Planetary Science Letters 274 (2008) 221–233extrapolated to western Mongolia since GPS <strong>and</strong> anisotropy observationsare clearly oriented at high angle from each o<strong>the</strong>r (Fig. 6). In thisarea, ϕ is indeed oriented WNW–ESE to E–W <strong>and</strong> measurementsdisplay several large delay times (δt up to 2.3 s at station ERN forinstance) (Dricker et al., 2002) whereas <strong>the</strong> GPS vectors in <strong>the</strong> Eurasiareference frame trend NS to N20°E (Calais et al., 2003), i.e., close to <strong>the</strong>regional compression direction (e.g., Petit et al., 1996). GPS vectors <strong>and</strong>fast anisotropic directions are <strong>the</strong>refore normal to each o<strong>the</strong>r inwestern Mongolia, arguing for a mode of large-scale pure sheardeformation or axial shortening deformation (Tommasi et al., 1999)(Fig. 7c) that implies a consistent crust <strong>and</strong> <strong>mantle</strong> deformation.Interestingly, such crust–<strong>mantle</strong> mechanical coupling has beenrecently proposed by Wang et al. (2008) for central Asia by combiningGPS <strong>and</strong> SKS splitting analysis. Dricker et al. (2002) already evidencedthat <strong>the</strong> regional maximum stress compression (oriented NNE–SSW toNE–SW in Mongolia) deduced from <strong>the</strong> fault mechanisms (Petit et al.,1996; Flesch et al., 2001; Delouis et al., 2002) <strong>and</strong> from <strong>the</strong> GPS vectors(Calais et al., 2006) is normal to <strong>the</strong> trend of <strong>the</strong> fast split shear wavesin western Mongolia <strong>and</strong> <strong>the</strong>y proposed that <strong>the</strong> <strong>mantle</strong> anisotropyreflects this present-day compression. Although <strong>the</strong>re is no clearnatural evidence from seismic anisotropy observation of <strong>mantle</strong>deformation under pure shear or axial shortening conditions,numerical modeling of olivine fabrics <strong>and</strong> seismic properties (Tommasiet al., 1999) suggests that <strong>the</strong>se modes of deformation maypotentially generate strong SKS splitting above <strong>the</strong> deformed <strong>mantle</strong> if<strong>the</strong> strain is large enough, by developing vertical foliation planestrending normal to <strong>the</strong> compression axis <strong>and</strong> by orienting olivine a-axes in girdle within this foliation. Interestingly, <strong>the</strong> two modes ofdeformation that we propose to be active in Mongolia may induceconsistent fast split shear waves at high angle to <strong>the</strong> compressiondirection <strong>and</strong> <strong>the</strong>refore close to <strong>the</strong> observations.The difference in <strong>the</strong> present-day tectonic regime between central<strong>and</strong> western Mongolia is also constrained by numerical modeling. Thestudies of plate deformation initially performed by Lesne (1999) <strong>and</strong>fur<strong>the</strong>r developed by Vergnolle et al. (2007), using <strong>the</strong> finite elementcode SHELLS (Kong <strong>and</strong> Bird, 1995) at <strong>the</strong> Asian scale <strong>and</strong> taking intoaccount realistic absolute plate motion <strong>and</strong> GPS vectors, topography,faults geometries, heat <strong>flow</strong>, <strong>and</strong> lithosphere rheologies confirms <strong>the</strong>different behavior between western <strong>and</strong> eastern Mongolia, compatiblewith <strong>the</strong> present-day GPS observations. In <strong>the</strong> Eurasian referenceframe, western Mongolia appears in this model to be characterized bya roughly northward motion <strong>and</strong> by a NS shortening that could inducea roughly EW trending fast direction of anisotropy in a pure shearmode of deformation in <strong>the</strong> upper <strong>mantle</strong>, whereas central <strong>and</strong>eastern Mongolia are characterized by an eastward lithospheric blockescape which could be accommodated at depth by <strong>the</strong> orientation ofolivine a-axes parallel to <strong>the</strong> block escape direction. Lesne (1999)interprets this complex behavior as <strong>the</strong> result of <strong>the</strong> Siberian platformwhich acts as an undeformable block on <strong>the</strong> north, <strong>and</strong> she alsoconcludes that <strong>the</strong> Baikal rift has a passive origin, resulting from <strong>the</strong>effect of <strong>the</strong> regional stress field, on <strong>the</strong> eastward Mongolia “escape”<strong>and</strong> from <strong>the</strong> rheological contrast between <strong>the</strong> Archean craton <strong>and</strong> <strong>the</strong>folded belt. Similar conclusions were reached by Chemenda et al.(2002) based on an experimental modeling.A rough quantification of <strong>the</strong> large-scale deformation shows,however, that <strong>the</strong> present-day <strong>and</strong> recent deformation as source ofanisotropy is likely not large enough to dominate <strong>the</strong> overall SKSsplitting in this region: If one extrapolates <strong>the</strong> 1 cm/year of presentdayNS convergence across western Mongolia (Calais et al., 2003)during 8 Ma of collision (Vassallo et al., 2007) <strong>and</strong> accommodated overabout 1000 km (<strong>the</strong> width of Mongolia between <strong>the</strong> Siberian craton<strong>and</strong> <strong>the</strong> Gobi–Altay belts, Fig. 1), this suggests a roughly 80 km ofshortening, which means a cumulative strain of about 0.08. Fromexperimental deformation <strong>and</strong> numerical modeling, such deformationis expected to develop weak fabrics characterized by a J index lowerthan 2 <strong>and</strong> hence shear waves anisotropy smaller than 2% (e.g., Silveret al., 1999). Such magnitude of anisotropy can explain δt of about 0.5 sover a 100 km thick anisotropic layer. This simple calculation suggeststhat <strong>the</strong> observed shear wave splitting cannot be explained by <strong>the</strong>present-day <strong>and</strong> recent deformations alone <strong>and</strong> <strong>the</strong>refore argues foro<strong>the</strong>r sources of anisotropy, favoring <strong>the</strong> presence of fossil lithosphericdeformations <strong>and</strong> of active sublithospheric <strong>flow</strong>, as proposed in <strong>the</strong>previous sections.4.4. SKS splitting <strong>and</strong> <strong>the</strong> deep <strong>mantle</strong> structures <strong>beneath</strong> MongoliaAs shown above, <strong>the</strong> homogeneous pattern of SKS splittingextending from western to central Mongolia is likely related to severalprocesses, <strong>the</strong> effects of which may add toge<strong>the</strong>r: <strong>the</strong> frozen lithosphericdeformation inherited from its Paleozoic built-up (Fig. 7a), a sublithospheric<strong>mantle</strong> <strong>flow</strong> induced by <strong>the</strong> plate motion (Fig. 7b), <strong>and</strong> <strong>the</strong>pervasive deformation induced by <strong>the</strong> present-day compression <strong>and</strong> <strong>the</strong>deep accommodation of <strong>the</strong> India–Asia collision (Fig. 7c). We show inthis section that <strong>the</strong>se hypo<strong>the</strong>ses are compatible with <strong>the</strong> lithospherethicknesses derived from tomographic observations but also with <strong>the</strong>petrological <strong>and</strong> petrophysical data.If <strong>the</strong> short-scale lithospheric structures <strong>beneath</strong> Mongolia arepoorly known, long wavelength structures evidenced by surface wavetomography (Priestley <strong>and</strong> Debayle, 2003; Priestley et al., 2006), by<strong>the</strong> regional body wave tomography using <strong>the</strong> MOBAL data (Mordvinovaet al., 2007; Tiberi et al., submitted for publication), or by <strong>the</strong>rmalmodeling (Artemieva <strong>and</strong> Mooney, 2001) show that <strong>the</strong> Mongolianlithosphere is probably less than 100 km thick, whereas <strong>the</strong> Siberiancraton is likely more than 200 km thick.In <strong>the</strong> Baikal rift area, tomographic inversion of <strong>the</strong> teleseismicP-wave arrival times initially favored a very shallow as<strong>the</strong>nosphericupwelling, up to <strong>the</strong> bottom of <strong>the</strong> crust (Gao et al., 1994a, 2003), butjoint inversion of <strong>the</strong> gravity signal <strong>and</strong> teleseismic data suggest a muchdeeper lithosphere–as<strong>the</strong>nosphere boundary, since <strong>the</strong> low-velocityupper <strong>mantle</strong> is evidenced between 70 <strong>and</strong> 170 km depth (Tiberi et al.,2003). Modeling of <strong>the</strong> Bouguer gravity anomalies (Petit <strong>and</strong> Déverchère,2006) also argues for a lithosphere thickness between 120 to 180 km<strong>beneath</strong> <strong>the</strong> Siberian platform to <strong>the</strong> north <strong>and</strong> 60 to 80 km south of <strong>the</strong>Baikal rift.Love–Rayleigh wave dispersion curves measured between stationsULN <strong>and</strong> TLY (Lebedev et al., 2006) also evidence a thin lithosphere(60–70 km thick) underlain by a low-velocity layer that couldrepresent <strong>the</strong> low-viscosity as<strong>the</strong>nosphere. The presence of radialanisotropy (VshNVsv) in <strong>the</strong> uppermost 100 km between <strong>the</strong>sestations, toge<strong>the</strong>r with <strong>the</strong> NW–SE trending ϕ (Gao et al., 1997) ledLebedev et al. (2006) to propose a model of <strong>mantle</strong> <strong>flow</strong> rising from<strong>beneath</strong> <strong>the</strong> Siberian craton <strong>and</strong> perpendicular to <strong>the</strong> Baikal rift thatexplains not only <strong>the</strong> observed SKS splitting pattern but also <strong>the</strong>episodic volcanism occurring by decompression melting on <strong>the</strong>sou<strong>the</strong>rn side of <strong>the</strong> craton. Such a model is consistent with <strong>the</strong>conclusions reached by Mordvinova et al. (2007) in central Mongoliawhere SV velocity analysis along <strong>the</strong> MOBAL profile suggests <strong>the</strong>presence of low velocities in <strong>the</strong> subcrustal upper <strong>mantle</strong>, compatiblewith a thinned lithosphere <strong>and</strong> that could also explain <strong>the</strong> presence ofpervasive recent volcanism in this area.Petro-geochemical analyses of Mongolian basalts (Barry et al.,2002) suggest a partial melt origin at a depth larger than 120 km. Asproposed by <strong>the</strong> authors, <strong>the</strong> <strong>the</strong>rmal anomaly that may have causedthis partial melting is apparently not a deep rising plume since <strong>the</strong>re isno geophysical evidence for such a structure. They propose that this<strong>the</strong>rmal anomaly could be induced by an effect of <strong>the</strong>rmal blanketinginduced by <strong>the</strong> adjacent Eurasian lithosphere or, as proposed byLebedev et al. (2006), by decompression melting of a <strong>mantle</strong> <strong>flow</strong>rising from <strong>beneath</strong> <strong>the</strong> Siberian craton.Analyses of <strong>mantle</strong> xenoliths brought up at <strong>the</strong> surface by <strong>the</strong>recent volcanism in <strong>the</strong> Tariat area, south of <strong>the</strong> Bolnay fault in centralMongolia, show garnet-bearing peridotites, with coarse-grained
G. Barruol et al. / Earth <strong>and</strong> Planetary Science Letters 274 (2008) 221–233231textures <strong>and</strong> some evidence of metasomatism that could be producedby interactions between <strong>the</strong> lithospheric <strong>mantle</strong> <strong>and</strong> <strong>the</strong> uprisingfluids (Ionov, 2002). The P–T data deduced from <strong>the</strong>se garnetperidotites suggest that <strong>the</strong> xenoliths were equilibrated at 60–80 kmdepth range <strong>and</strong> at temperature of 1000–1100 °C, i.e. at a temperature400–500 °C higher than <strong>the</strong> <strong>mantle</strong> xenoliths sampled in <strong>the</strong> Siberiancraton at similar depths. The <strong>the</strong>rmal structure of <strong>the</strong> lithospheredetermined by Emmerson et al. (2006) suggests similar findings, witha Moho temperature of 860 °C <strong>beneath</strong> <strong>the</strong> Tariat region <strong>and</strong> in <strong>the</strong>range 550–580 °C <strong>beneath</strong> <strong>the</strong> Siberian platform. The <strong>the</strong>rmallithospheric thickness <strong>the</strong>y determine is <strong>around</strong> 90 km <strong>beneath</strong> Tariat<strong>and</strong> 225 km <strong>beneath</strong> <strong>the</strong> Siberian platform. These geophysical <strong>and</strong>geochemical observations suggest that olivine crystals at 80–100 kmdepth <strong>beneath</strong> Central Mongolia, <strong>and</strong> perhaps at smaller depth locally,likely lie in <strong>the</strong> dislocation creep field <strong>and</strong> could <strong>the</strong>refore deformplastically with <strong>the</strong> dominant (010)[100] slip system. In such asituation, both <strong>the</strong> plate motion <strong>and</strong> <strong>the</strong> regional compression shoulddevelop strong fabrics in <strong>the</strong> upper <strong>mantle</strong>, by aligning <strong>the</strong> olivine a-axes along NW–SE directions coherent between <strong>the</strong> lithosphere <strong>and</strong><strong>the</strong> as<strong>the</strong>nosphere. Such fabrics being close to <strong>the</strong> large-scale trend of<strong>the</strong> structures within <strong>the</strong> lithosphere, <strong>the</strong> different anisotropic sourcesmay add <strong>the</strong>ir own effects toge<strong>the</strong>r <strong>and</strong> may explain <strong>the</strong> high δt ofmore than 2.0 s observed at some sites. Petrophysical analyses ofupper <strong>mantle</strong> rocks (Mainprice et al., 2000, Ben Ismail et al., 2001)show indeed that such delay times require 200–250 km of anisotropic<strong>mantle</strong> with typical intrinsic S-wave anisotropy ranging between 4 to5%. Since tomographic <strong>and</strong> petrological data demonstrate that <strong>the</strong>lithosphere is clearly not thick enough to carry all <strong>the</strong> splitting signal<strong>and</strong> since <strong>the</strong> present-day <strong>and</strong> recent deformation is not large enoughto generate strong anisotropies, this suggests that a large part of <strong>the</strong>splitting delay time has to be explained by as<strong>the</strong>nospheric <strong>flow</strong>.In central Mongolia, <strong>the</strong> origin of <strong>the</strong> large-scale, high topography of<strong>the</strong> <strong>Hangay</strong> dome has been strongly debated, but <strong>the</strong> constraintsimposed by <strong>the</strong> gravity anomaly (Petit et al., 2002) <strong>and</strong> more recently byseismic tomography <strong>and</strong> receiver function analysis (Mordvinova et al.,2007) strongly favor an anomalous upper <strong>mantle</strong> <strong>beneath</strong> this area as aprimary cause of this topographic uplift: interpretation of both <strong>the</strong>topography anomaly <strong>and</strong> <strong>the</strong> large scale (200–300 km) Bouguer gravityanomaly (50 mGal) led Petit et al. (2002) to propose <strong>the</strong> presence of botha small-scale, low-density material in <strong>the</strong> subcrustal uppermost <strong>mantle</strong><strong>and</strong> a longer wavelength, low-density material at as<strong>the</strong>nospheric depth,which is compatible with <strong>the</strong> low shear wave velocities observed<strong>beneath</strong> central Mongolia (Mordvinova et al., 2007). Recent jointinversion of seismic <strong>and</strong> gravity data (Tiberi et al., submitted forpublication) along <strong>the</strong> MOBAL profile confirms <strong>the</strong> origin of <strong>the</strong> <strong>Hangay</strong>doming in <strong>the</strong> presence of low density/velocity <strong>mantle</strong> in <strong>the</strong> as<strong>the</strong>nosphericupper <strong>mantle</strong>. The Bouguer gravity anomaly in particular ischaracterized by a large, negative (−300 mGal) <strong>and</strong> long-wavelengthanomaly centered on <strong>the</strong> <strong>Hangay</strong> dome (Tiberi et al., submitted forpublication) arguing for a large-scale lithospheric thinning. Suchobservations are in contradiction with <strong>the</strong> proposition that <strong>the</strong> <strong>Hangay</strong>dome could behave as a craton or rigid microblock within Mongolia(Cunningham, 2001), <strong>and</strong> that its thickened crust <strong>and</strong> thinned lithospherecould deflect <strong>the</strong> as<strong>the</strong>nospheric <strong>flow</strong> <strong>and</strong> consequently generate<strong>the</strong> upwelling, <strong>the</strong> doming <strong>and</strong> <strong>the</strong> Cenozoic volcanism. The upper<strong>mantle</strong> velocities <strong>beneath</strong> <strong>the</strong> MOBAL profile (Mordvinova et al., 2007;Tiberi et al., submitted for publication) show no sign of any high-velocityroot <strong>beneath</strong> this area; low velocities dominate instead from <strong>the</strong> Mohoto at least 250 km depth <strong>and</strong> <strong>the</strong>refore indicate a thinned lithospherethat cannot be qualified as cratonic. Our new splitting measurementsshow a very homogeneous anisotropy pattern trending NW–SE acrosscentral <strong>and</strong> western Mongolia, inconsistent with <strong>the</strong> SW–NE <strong>mantle</strong><strong>flow</strong> proposed by Cunningham (2001).Wedonotobserveanyparticularsignature associated with <strong>the</strong> <strong>Hangay</strong> dome itself that could beinterpreted as as<strong>the</strong>nospheric <strong>and</strong> lithospheric in<strong>flow</strong> <strong>beneath</strong> <strong>the</strong><strong>Hangay</strong> dome.Toge<strong>the</strong>r with <strong>the</strong> tomographic images, our SKS splitting measurementsevidence <strong>the</strong> major influence of <strong>the</strong> deep root of <strong>the</strong> Siberiancraton on <strong>the</strong> large-scale behavior <strong>and</strong> deformation of <strong>the</strong> lithosphere<strong>and</strong> as<strong>the</strong>nosphere: The craton likely influences <strong>the</strong> pattern of as<strong>the</strong>nospheric<strong>flow</strong> deflected by its deep root. It also controlled <strong>the</strong>structuration of <strong>the</strong> lithosphere during Paleozoic times <strong>and</strong> stillinfluences <strong>the</strong> present-day large-scale compression tectonics by inducingcompressive <strong>and</strong> transpressive tectonic stress regimes in western<strong>and</strong> eastern Mongolia, respectively. A recent numerical modeling of <strong>the</strong>strength of <strong>the</strong> lithosphere in <strong>the</strong> Baikal region (Petit et al., 2008) fromgravity data, Moho <strong>and</strong> lithosphere-as<strong>the</strong>nosphere geometries evidencesthat <strong>the</strong> cratonic crust <strong>and</strong> lithospheric <strong>mantle</strong> of <strong>the</strong> Siberianplatform are strongly coupled whereas <strong>the</strong> Paleozoic–Mesozoic Mongolianlithosphere appears to be much weaker <strong>and</strong> is likely subject todecoupling between its upper crust <strong>and</strong> upper <strong>mantle</strong>. Such result is ofimportance since it may explain why <strong>the</strong> ra<strong>the</strong>r discrete deformationvisible in <strong>the</strong> upper crust from active faulting may coexist with <strong>the</strong>apparently more pervasive deformation inferred from anisotropy at<strong>mantle</strong> depth <strong>beneath</strong> Mongolia.5. ConclusionTemporary deployment of seismic stations across central Mongoliaallowed us to characterize upper <strong>mantle</strong> anisotropy <strong>beneath</strong> moststations of <strong>the</strong> MOBAL profile. Though <strong>the</strong> nor<strong>the</strong>rnmost stations on <strong>the</strong>Siberian platform <strong>and</strong> at <strong>the</strong> southwestern end of <strong>the</strong> Baikal rift did notprovide enough data <strong>and</strong> splitting measurements to allow for a clearinterpretation, <strong>the</strong> anisotropy pattern is well defined at <strong>the</strong> o<strong>the</strong>rstations, particularly across <strong>the</strong> <strong>Hangay</strong> dome, with a dominating NW–SE trending ϕ <strong>and</strong> relatively large δt. Geophysical <strong>and</strong> geochemicalarguments favor a lithosphere thinner than 90 km <strong>beneath</strong> centralMongolia, contrasting with a thick (at least 200 km) Siberian platform.This suggests that <strong>the</strong> splitting across <strong>the</strong> <strong>Hangay</strong> dome cannot beexplained by a lithospheric deformation alone. Beneath Ulaanbaatar ineastern Mongolia, we image a two-layered structure compatible withlithospheric fast anisotropic direction trending NE–SW over an as<strong>the</strong>nospheric<strong>flow</strong> trending NW–SE. The parallelism of ϕ observed on <strong>the</strong>Siberian craton <strong>and</strong> in central Mongolia suggests also a common origin,that could be an as<strong>the</strong>nospheric <strong>flow</strong> resulting from <strong>the</strong> interaction of<strong>the</strong> APM, <strong>the</strong> deeper <strong>mantle</strong> <strong>flow</strong> <strong>and</strong> <strong>the</strong> shape of <strong>the</strong> craton's keel.These observations led us to propose that <strong>the</strong> observed pattern of SKSsplitting in Mongolia originates from both lithospheric <strong>and</strong> as<strong>the</strong>nosphericdeformation. The lithospheric anisotropy likely results from <strong>the</strong>long-lasting geological evolution along active margins but also from <strong>the</strong>recent <strong>and</strong> present-day deformation of <strong>the</strong> Mongolian lithosphere along<strong>the</strong> large-scale strike-slip faults <strong>and</strong> under <strong>the</strong> regional NNE–SSWcompression regime. The deeper anisotropy is likely related to <strong>the</strong>as<strong>the</strong>nospheric <strong>flow</strong> induced by <strong>the</strong> relative motion of <strong>the</strong> present-dayEurasian plate <strong>and</strong> <strong>the</strong> deep <strong>mantle</strong> circulation. The present study alsoconfirms a strong control of <strong>the</strong> root of <strong>the</strong> Siberian craton on <strong>the</strong>anisotropy pattern by two complementary ways:(1) it acted as a rigidbody during <strong>the</strong> early stages of lithospheric block accretions, or during<strong>the</strong> more recent deformation induced by <strong>the</strong> India–Asia collision, <strong>and</strong> (2)it may deflect a present-day as<strong>the</strong>nospheric <strong>flow</strong> <strong>beneath</strong> Mongolia.AcknowledgmentsThis work was performed with funding from <strong>the</strong> French CNRS (CentreNational de la Recherche Scientifique) PICS (International program forscientific collaboration) program 1251, <strong>and</strong> DYETI CNRS contract <strong>and</strong>Lithoscope French mobile instrumentation. We also thank <strong>the</strong> Institute of<strong>the</strong> Earth's Crust RSA, Irkutsk, RCAG, Ulan Bator <strong>and</strong> DASE/CEA, France for<strong>the</strong>ir support. We thank everybody involved in instrumentationpreparation, field work <strong>and</strong> data processing in France, Siberia <strong>and</strong>Mongolia. The data are available at <strong>the</strong> site http://bdsis.obs.ujf-grenoble.fr/ maintained by C. Pequegnat (Université de Grenoble/CNRS).
232 G. Barruol et al. / Earth <strong>and</strong> Planetary Science Letters 274 (2008) 221–233The facilities of <strong>the</strong> IRIS Data Management System, <strong>and</strong> specifically<strong>the</strong> IRIS Data Management Center, were used for access to waveform<strong>and</strong> metadata required in this study.The paper benefited from discussions with J.F. Ritz, M. Heintz, E.Calais <strong>and</strong> Guust Nolet. We thank P. Silver for his splitting analysis code<strong>and</strong> A. Wüstefeld for <strong>the</strong> SplitLab software (Wüstefeld et al., 2008) thatis available at http://www.gm.univ-montp2.fr/splitting/ toge<strong>the</strong>r with<strong>the</strong> interactive world SKS splitting database. We used SAC (LawrenceLivermore Nat. Lab) for <strong>the</strong> seismic analysis <strong>and</strong> GMT software (SOEST,U. of Hawaii) for producing <strong>the</strong> maps. The manuscript benefited from<strong>the</strong> comments provided by L. Flesch <strong>and</strong> an anonymous reviewer.Appendix A. Supplementary dataSupplementary data associated with this article can be found, in<strong>the</strong> online version, at doi:10.1016/j.epsl.2008.07.027.ReferencesArtemieva, I.M., Mooney, W.D., 2001. Thermal thickness <strong>and</strong> evolution of Precambrianlithosphere: a global study. J. Geophys. Res. 106, 16387–16414.Baljinnyam, I., 1993. Ruptures of major earthquakes <strong>and</strong> active deformation in Mongolia<strong>and</strong> its surroundings. Mem. Geol. Soc. Amer. 181 62 pp.Barruol, G., Mainprice, D., 1993. A quantitative evaluation of <strong>the</strong> contribution of crustalrocks to <strong>the</strong> shear wave splitting of teleseismic SKS waves. Phys. Earth Planet. Int.78, 281–300. doi:10.1016/0031-9201(93)90161-2.Barruol, G., Silver, P.G., Vauchez, A., 1997. Seismic anisotropy in <strong>the</strong> eastern US: deepstructure of a complex continental plate. J. Geophys. Res. 102, 8329–8348.Barry, T.L., Saunders, A.D., Kempton, P.D., Windley, B.F., Pringle, M.S., Dorjnamjaa, D.,Sa<strong>and</strong>ar, S., 2002. Petrogenesis of Cenozoic basalts from Mongolia: evidence for <strong>the</strong>role of as<strong>the</strong>nospheric versus metasomatized lithospheric <strong>mantle</strong> sources. J. Petrol.43, 55–91.Bayasgalan, A., Jackson, J., McKenzie, D., 2005. Lithosphere rheology <strong>and</strong> active tectonics inMongolia: relations between earthquakes source parameters, gravity <strong>and</strong> GPSmeasurements. Geophys. J. Int.163, 1151–1179. doi:10.1111/j.1365-246X.2005.02764.x.Ben Ismail, W., Barruol, G., Mainprice, D., 2001. The Kaapvaal craton seismic anisotropy:petrophysical analyses of upper <strong>mantle</strong> kimberlite nodules. Geophys. Res. Lett. 28,2497–2500.Bormann, P., Gruenthal, G., Kind, R., Montag, H., 1996. <strong>Upper</strong> <strong>mantle</strong> anisotropyunderneath central Europe: effect of absolute plate motion <strong>and</strong> lithosphere–as<strong>the</strong>nosphere boundary topography? J. Geodyn. 22, 11–32.Bowman, J.R., Ando, M., 1987. Shear-wave splitting in <strong>the</strong> upper-<strong>mantle</strong> wedge above<strong>the</strong> Tonga subduction zone. Geophys. J. R. Astron. Soc. 88, 25–41.Calais, E., Vergnolle, M., San'kov, V., Lukhnev, A., Miroshnitchentko, A., Amarjargal, S.,Déverchère, J., 2003. GPS measurements of crustal deformation in <strong>the</strong> Baikal–Mongolia area (1994–2002): implications for current kinematics of Asia. J. Geophys.Res. 108. doi:10.1029/2002JB002373.Calais, E., Dong, L., Wang, M., Shen, Z., Vergnolle, M., 2006. Continental deformation inAsia from a combined GPS solution. Geophys. Res. Lett. 33. doi:10.1029/2006GL028433.Chemenda, A., Déverchère, J., Calais, E., 2002. Three-dimensional laboratory modellingof rifting: application to <strong>the</strong> Baikal Rift, Russia. Tectonophysics 356, 253–273.Cunningham, D., 2001. Cenozoic normal faulting <strong>and</strong> regional doming in <strong>the</strong> sou<strong>the</strong>rn<strong>Hangay</strong> region, central Mongolia: implications for <strong>the</strong> origin of <strong>the</strong> Baikal riftprovince. Tectonophysics 331, 389–411.Cunningham, D., 2005. Active intracontinental transpressionnal mountain buildingin <strong>the</strong> Mongolian Altai: a new class of orogen. Earth Planet. Sci. Lett. 240,436–444.Delouis, B., Déverchère, J., Melnikova, V., Radziminovitch, N., Loncke, L., Larroque, C.,Ritz, J.F., San'kov, V., 2002. A reappraisal of <strong>the</strong> 1950 (Mw 6.9) Mondy earthquake,Siberia, <strong>and</strong> its relationship to <strong>the</strong> strain pattern at <strong>the</strong> south-western end of <strong>the</strong>Baikal rift zone. Terra Nova 14, 491–500.Delvaux, D., Moeys, R., Stapel, G., Melnikov, A., Ermikov, V., 1995. Palaeostressreconstruction <strong>and</strong> geodynamics of <strong>the</strong> Baikal region, Central Asia, Part I. Palaeozoic<strong>and</strong> Mesozoic pre-rift evolution. Tectonophysics 252, 61–101.Dricker, I., Roecker, S., Vinnik, L., Rogozhin, E.A., Makeyeva, L., 2002. <strong>Upper</strong>-<strong>mantle</strong>anisotropy <strong>beneath</strong> <strong>the</strong> Altai–Sayan region of central Asia. Phys. Earth Planet. Int.131, 205–223.Emmerson, B., Jackson, J., McKenzie, D., Priestley, K., 2006. Seismicity, structure <strong>and</strong>rheology of <strong>the</strong> lithosphere in <strong>the</strong> lake Baikail region. Geophys. J. Int. 167,1233–1272. doi:10.1111/j.1365-246X.2006.03075.x.Flesch, L.M., Haines, A.J., Holt, W.E., 2001. Dynamics of <strong>the</strong> India–Eurasia collision zone.J. Geophys. Res. 106, 16435–16460.Fontaine, F.R., Barruol, G., Tommasi, A., Bokelmann, G.H.R., 2007. <strong>Upper</strong> <strong>mantle</strong> <strong>flow</strong><strong>beneath</strong> French Polynesia from shear-wave splitting. Geophys. J. Int. 170,1262–1288. doi:10.1111/j.1365-246X.2007.03475.x.Gao, S., Davis, P.M., Liu, H., Slack, P.D., Zorin, Y.A., Logatchev, N.A., Kogan, M., Burkholder,P.D., Meyer, R.P., 1994a. Asymmetric upwarp of <strong>the</strong> as<strong>the</strong>nosphere <strong>beneath</strong> <strong>the</strong>Baikal rift zone, Siberia. J. Geophys. Res. 99, 15319–15330.Gao, S., Davis, P.M., Liu, H., Slack, P.D., Zorin, Y.A., Mordvinova, V.V., Kozhevnikov, V.M.,Meyer, R.P., 1994b. Seismic anisotropy <strong>and</strong> <strong>mantle</strong> <strong>flow</strong> <strong>beneath</strong> <strong>the</strong> Baikal rift zone.Nature 371, 149–151.Gao, S., Davis, P.M., Liu, H., Slack, P.D., Rigor, A.W., Zorin, Y.A., Mordvinova, V.V.,Kozhevnikov, V.M., Logatchev, N.A., 1997. SKS splitting <strong>beneath</strong> continental riftzones. J. Geophys. Res. 102, 22781–22797.Gao, S., Liu, K.H., Davis, P.M., Slack, P.D., Zorin, Y.A., Mordvinova, V.V., Kozhevnikov, V.M.,2003. Evidence for small-scale <strong>mantle</strong> convection in <strong>the</strong> upper <strong>mantle</strong> <strong>beneath</strong> <strong>the</strong>Baikal rift zone. J. Geophys. Res. 108. doi:10.1029/2002JB002039.Godfrey, N.J., Christensen, N.I., Okaya, D.A., 2000. Anisotropy of schists: contribution ofcrustal anisotropy to active source seismic experiments <strong>and</strong> shear wave splittingobservations. J. Geophys. Res. 105, 27991–28007.Gripp, A.E., Gordon, R.B., 2002. Young tracks of hotspots <strong>and</strong> current plate velocities.Geophys. J. Int. 150, 321–361.Huang, W.C., Ni, J.F., Tilmann, F., Nelson, D., Guo, J., Zhao, W., Mechie, J., Kind, R., Saul, J.,Rapine, R., Hearn, T.M., 2000. Seismic polarization anisotropy <strong>beneath</strong> <strong>the</strong> centralTibetan plateau. J. Geophys. Res. 105, 27979–27989.Ionov, D., 2002. Mantle structure <strong>and</strong> rifting processes in <strong>the</strong> Baikal–Mongolia region:geophysical data <strong>and</strong> evidence from xenoliths in volcanic rocks. Tectonophysics 351,41–60.Kennett, B.L.N., Engdahl, E.R., 1991. Traveltimes for global earthquake location <strong>and</strong>phase identification. Geophys. J. Int. 105, 429–465.Kong, X., Bird, P., 1995. SHELLS: a thin plate program for modeling neotectonics ofregional or global lithosphere with faults. J. Geophys. Res. 100, 22129–22132.doi:10.1029/95JB02435.Lebedev, S., Meier, T., Van der Hilst, R., 2006. As<strong>the</strong>nospheric <strong>flow</strong> <strong>and</strong> origin ofvolcanism in <strong>the</strong> Baikal rift area. Earth Planet. Sci. Lett. 249, 415–424. doi:10.1016/j.epsl.2006.07.007.Lesne, O., 1999. Dynamique de l'extension intracontinentale dans le rift du Baikal(Sibérie) - Apport de mesures GPS et modèles numériques. Doctorat Thesis,Université Paris VI, Paris, 184 pp.Li, A., Chen, C.C., 2006. Shear wave splitting <strong>beneath</strong> <strong>the</strong> central Tian Shan <strong>and</strong> itstectonic implications. Geophys. Res. Lett. 33. doi:10.1029/2006GL027717.Maggi, A., Debayle, E., Priestley, K., Barruol, G., 2006. Azimuthal anisotropy of <strong>the</strong> Pacificregion. Earth Planet. Sci. Lett. 250, 53–71. doi:10.1016/j.epsl.2006.07.010.Mainprice, D., Barruol, G., Ben Ismail, W., 2000. The seismic anisotropy of <strong>the</strong> Earth's<strong>mantle</strong>: from single crystal to polycrystal. In: Karato, S.I., Forte, A., Liebermann, R.C.,Masters, G., Stixrude, L. (Eds.), Earth's deep interior: Mineral Physics <strong>and</strong>Tomography from <strong>the</strong> atomic to <strong>the</strong> global scale. . Geophysical Monograph. AGU,Washington, D.C., pp. 237–264.Mainprice, D., Tommasi, A., Couvy, H., Cordier, P., 2005. Pressure sensitivity of olivineslip systems <strong>and</strong> seismic anisotropy of earth's upper <strong>mantle</strong>. Nature 433, 731–733.McNamara, D.E., Owens, T.J., Silver, P.G., Wu, F.T., 1994. Shear wave anisotropy <strong>beneath</strong><strong>the</strong> Tibetan plateau. J. Geophys. Res. 99, 13655–13665.Molnar, P., Deng, Q.D., 1984. Faulting associated with large earthquakes <strong>and</strong> <strong>the</strong> averagerate of deformation in Central <strong>and</strong> Eastern Asia. J. Geophys. Res. 89, 6203–6227.Montagner, J.P., Tanimoto, T., 1991. Global upper <strong>mantle</strong> tomography of seismicvelocities <strong>and</strong> anisotropies. J. Geophys. Res. 96, 20337–20351.Mordvinova, V.V., Deschamps, A., Dugarmaa, T., Déverchère, J., Ulziibat, M., Sankov, V.A.,Artem'ev, A.A., Perrot, J., 2007. Velocity structure of <strong>the</strong> lithosphere on <strong>the</strong> 2003Mongolian–Baikal transect from SV waves. Izv. - Phys. Solid Earth 43, 119–129.Nicolas, A., Christensen, N.I., 1987. Formation of anisotropy in upper <strong>mantle</strong> peridotites-Areview. In: Fuchs, K., Froidevaux, C. (Eds.), Composition, Structure <strong>and</strong> Dynamics of <strong>the</strong>Lithosphere-As<strong>the</strong>nosphere System. Geodyn. Ser. AGU, Washington, D. C., pp.111–123.Petit, C., Déverchère, J., 2006. Structure <strong>and</strong> evolution of <strong>the</strong> Baikal rift: a syn<strong>the</strong>sis.Geochem. Geophys. Geosyst. 7. doi:10.1029/2006GC001265.Petit, C., Fournier, M., 2005. Present-day velocity <strong>and</strong> stress fields of <strong>the</strong> Amurian Platefrom thin-shell finite-element modeling. Geophys. J. Int. 160, 357–369.Petit, C., Déverchère, J., Houdry, F., San'kov, V., Melnikova, V., Delvaux, D., 1996. Presentdaystress field changes along <strong>the</strong> Baikal rift <strong>and</strong> tectonic implications. Tectonics 15,1171–1191.Petit, C., Déverchère, J., Calais, E., Sankov, V., Fairhead, D., 2002. Deep structure <strong>and</strong>mechanical behavior of <strong>the</strong> lithosphere in <strong>the</strong> Hangai–Hövsgöl region, Mongolia:new constraints from gravity modeling. Earth Planet. Sci. Lett. 197, 133–149.Petit, C., Burov, E., Tiberi, C., 2008. Strength of <strong>the</strong> lithosphere <strong>and</strong> strain localisation in<strong>the</strong> Baikal rift. Earth Planet. Sci. Lett. 269, 522–528. doi:10.1016/J.epsl.2008.03.012.Pollitz, F., Vergnolle, M., Calais, E., 2003. Fault interaction <strong>and</strong> stress triggering oftwentieth century earthquakes in Mongolia. J. Geophys. Res. - Solid Earth 108.Priestley, K., Debayle, E., 2003. Seismic evidence for a moderately thick lithosphere<strong>beneath</strong> <strong>the</strong> Siberian platform. Geophys. Res. Lett. 30. doi:10.1029/2002GL015931.Priestley, K., Debayle, E., McKenzie, D., Pilidou, S., 2006. <strong>Upper</strong> <strong>mantle</strong> structure ofeastern Asia from multimode surface waveform tomography. J. Geophys. Res. 111.doi:10.1029/2005JB004082.Ritz, J.F., Brown, E.T., Bourlès, D.L., Philip, H., Schlupp, A., Raisberg, G.M., Yiou, F., Enkhtuvshin,B., 1995. Slip-rates along active faults estimated with cosmic-ray exposure dates:application to <strong>the</strong> Bogd fault, Gobi–Altai, Mongolia. Geology 23, 1019–1022.Ritz, J.F., Bourles, D., Brown, E.T., Carretier, S., Chery, J., Enhtuvshin, B., Galsan, P., Finkel,R.C., Hanks, T.C., Kendrick, K.J., Philip, H., Raisbeck, G., Schlupp, A., Schwartz, D.P.,Yiou, F., 2003. Late Pleistocene to Holocene slip rates for <strong>the</strong> Gurvan Bulag thrustfault (Gobi–Altay, Mongolia) estimated with Be-10 dates. J. Geophys. Res. 108, 2162.doi:10.1029/2001JB000553.Savage, M.K., 1999. Seismic anisotropy <strong>and</strong> <strong>mantle</strong> deformation: what have we learnedfrom shear wave splitting? Rev. Geophys. 37, 65–106.Schlupp, A., 1996. Néotectonique de la Mongolie occidentale analysée à partir desdonnées de terrain, sismologiques et satellitaires. Doctorat Thesis, Université LouisPasteur, Strasbourg, 256 pp.
G. Barruol et al. / Earth <strong>and</strong> Planetary Science Letters 274 (2008) 221–233233Schlupp,A.,Cisternas,A.,2007.Sourcehistoryof<strong>the</strong>1905greatMongolianearthquakes(Tsetserleg, Bolnay). Geophys. J. Int.169,1115–1131. doi:10.1111/j.1365-246X.2007.03323.x.Sieminski, A., Liu, Q.Y., Trampert, J., Tromp, J., 2007. Finite-frequency sensitivity of bodywaves to anisotropy based upon adjoint methods. Geophys. J. Int. 168, 1153–1174.doi:10.1111/j.1365-246X.2007.03528.x.Silver, P.G., 1996. Seismic anisotropy <strong>beneath</strong> <strong>the</strong> continents: probing <strong>the</strong> depths ofgeology. Ann. Rev. Earth Planet. Sci. 24, 385–432.Silver, P.G., Chan, W.W., 1991. Shear wave splitting <strong>and</strong> subcontinental <strong>mantle</strong>deformation. J. Geophys. Res. 96, 16429–16454.Silver, P.G., Savage, M.K., 1994. The interpretation of shear-wave splitting parameters in<strong>the</strong> presence of two anisotropic layers. Geophys. J. Int. 119, 949–963.Silver, P.G., Mainprice, D., Ben Ismail, W., Tommasi, A., Barruol, G., 1999. Mantlestructural geology from seismic anisotropy. In: Fei, Y., Bertka, C., Mysen, B. (Eds.),Mantle petrology: Field observations <strong>and</strong> high pressure experimentation: a tributeto Francis R. (Joe) Boyd. Stony Brooks, pp. 79–103.Teyssier, C., Tikoff, B., 1998. Strike-slip partitioned transpression of <strong>the</strong> San Andreas faultsystem: a lithospheric-scale approach. In: Holdsworth, R.E., Strachan, R.A., Dewey, J.F.(Eds.), Continental transpressional <strong>and</strong> transtensional tectonics. Geological Society,London, pp. 143–158. Special Publication.Thatcher, W., 2007. Microplate model for <strong>the</strong> present-day deformation of Tibet. J. Geophys.Res. 112. doi:10.1029/2005JB004244.Tiberi, C., Diament, M., Déverchère, J., Petit-Mariani, C., Mikhailov, V., Tikhotsky, S.,Achauer, U., 2003. Deep structure of <strong>the</strong> Baikal rift zone revealed by joint inversionof gravity <strong>and</strong> seismology. J. Geophys. Res. 108. doi:10.1029/2002JB001880.Tiberi, C., Deschamps, A., Déverchère, J., Petit, C., Perrot, J., Appriou, D., Mordvinova, V.V.,Dugarmaa, T., Ulziibat, M. <strong>and</strong> Artem'ev, A.A., submitted for publication. Alithosphere-as<strong>the</strong>nosphere structure from <strong>the</strong> Siberian craton to Central Mongoliadetermined by seismic <strong>and</strong> gravity data (MOBAL experiment). Geophys. J. Int.Tikoff, B., Russo, R., Teyssier, C., Tommasi, A., 2004. Mantle-driven deformation oforogenic zones <strong>and</strong> clutch tectonics. In: Grocott, J., McCaffrey, K., Taylor, G., Tikoff, B.(Eds.), Vertical <strong>and</strong> horizontal decoupling in <strong>the</strong> lithosphere. Geol. Soc. LondonSpec. Publ., London, pp. 41–64.Tommasi, A., Tikoff, B., Vauchez, A., 1999. <strong>Upper</strong> <strong>mantle</strong> tectonics: three-dimensionaldeformation, olivine crystallographic fabrics <strong>and</strong> seismic properties. Earth Planet.Sci. Lett. 168, 173–186.Vassallo, R., Jolivet, M., Ritz, J.F., Braucher, R., Larroque, C., Sue, C., Todbileg, M.,Javkhlanbold, D., 2007. Uplift age <strong>and</strong> rates of <strong>the</strong> Gurvan Bogd system (Gobi–Altay)by apatite fission track analysis. Earth Planet. Sci. Lett. 259, 333–346.Vauchez, A., Barruol, G., Tommasi, A., 1997. Why do continents break-up parallel toancient orogenic belts? Terra Nova 9, 62–66.Vauchez, A., Tommasi, A., Barruol, G., 1998. Rheological heterogeneity, mechanicalanisotropy, <strong>and</strong> tectonics of <strong>the</strong> continental lithosphere. Tectonophysics 296,61–86. doi:10.1016/S0040-1951(98)00137-1.Vauchez, A., Barruol, G., Nicolas, A., 1999. Comment on “SKS splitting <strong>beneath</strong> riftzones”. J. Geophys. Res. 104, 10787–10789.Vergnolle, M., Calais, E., Dong, L., 2007. Dynamics of continental deformation in Asia.J. Geophys. Res. 112. doi:10.1029/2006JB004807.Vinnik, L.P., Makeyeva, L.I., Milev, A., Usenko, A.Y., 1992. Global patterns of azimuthalanisotropy <strong>and</strong> deformations in <strong>the</strong> continental <strong>mantle</strong>. Geophys. J. Int. 111,433–437.Walker, K.T., Bokelmann, G.H.R., Klemperer, S.L., Bock, G., 2005. Shear-wave splitting<strong>around</strong> <strong>the</strong> Eifel hotspot: evidence for a <strong>mantle</strong> upwelling. Geophys. J. Int. 163.doi:10.1111/j.1365-246X.2005.02636.x.Wang, C.Y., Flesch, L.M., Silver, P.G., Chang, L.J., Chan, W.W., 2008. Evidence formechanically coupled lithosphere in central Asia <strong>and</strong> resulting implications.Geology 36, 363–366. doi:10.1130/G24450A.1.Wolfe, C.J., Solomon, S.C., 1998. Shear wave splitting <strong>and</strong> implication for <strong>mantle</strong> <strong>flow</strong><strong>beneath</strong> <strong>the</strong> MELT region of <strong>the</strong> East Pacific Rise. Science 280, 1230–1232.Wüstefeld, A., Bokelmann, G.H.R., 2007. Null detection in shear wave splittingmeasurements. Bull. Seismol. Soc. Amer. 97, 1204–1211. doi:10.1785/0120060190.Wüstefeld, A., Bokelmann, G.H.R., Zaroli, C., Barruol, G., 2008. SplitLab: a shear-wavesplitting environment in Matlab. Comput. Geosci. 34, 512–528. doi:10.1016/j.cageo.2007.08.002.Zorin, Y.A., 1999. Geodynamics of <strong>the</strong> western part of <strong>the</strong> Mongolia–Okhotsk collisionalbelt, Trans–Baikal region (Russia) <strong>and</strong> Mongolia. Tectonophysics 306, 33–56.Zorin, Y.A., Mordvinova, V.V., Turutanov, E.K., Belichenko, V.G., Artemyev, A.A., Kosarev,G.L., 2002. Low seismic velocity layers in <strong>the</strong> Earth's crust <strong>beneath</strong> Eastern Siberia(Russia) <strong>and</strong> central Mongolia: receiver function data <strong>and</strong> <strong>the</strong>ir possible geologicalimplication. Tectonophysics 359, 307–327.