STATISTICS SINGAPORE - Rebasing of the Consumer Price Index ...
STATISTICS SINGAPORE - Rebasing of the Consumer Price Index ...
STATISTICS SINGAPORE - Rebasing of the Consumer Price Index ...
Create successful ePaper yourself
Turn your PDF publications into a flip-book with our unique Google optimized e-Paper software.
Statistics Singapore Newsletter March 2010importance <strong>of</strong> each item in <strong>the</strong> CPI basket, asa proportion <strong>of</strong> household expenditure.The weighting pattern for <strong>the</strong> 2009-basedCPI was derived from <strong>the</strong> expenditure valuescollected from <strong>the</strong> HES 2007/08. Theseexpenditure values were fur<strong>the</strong>r updated toprice level in 2009, taking into account pricechanges from 2007/08 to 2009. Chart 1presents <strong>the</strong> weighting pattern for 2004-basedand 2009-based CPI.Housing and food were <strong>the</strong> two most importantmain groups in <strong>the</strong> 2009-based CPI basket.Housing share increased from 21 per centin <strong>the</strong> 2004-based CPI to 25 per cent in <strong>the</strong>2009-based CPI, reflecting higher expenditureon both rented and owner-occupied housing(OOH). Food was ranked second, despite itsweight declining slightly from 23 per cent in2004-based CPI to 22 per cent in 2009-basedCPI. Within <strong>the</strong> food group, households spentproportionately less on “non-prepared meals”and more on “prepared meals”.The shares <strong>of</strong> transport as well as recreation& o<strong>the</strong>rs fell 1 percentage point each to 16per cent in <strong>the</strong> 2009-based CPI. The declinein transport share reflected lower weightsfor cars, road tax and public road transport.Lower expenditure on holiday expensesand government levy on domestic maidscontributed to <strong>the</strong> decline in <strong>the</strong> weight forrecreation & o<strong>the</strong>rs.CHART 1CPI WEIGHTING PATTERN, 2004-BASED AND 2009-BASED CPI2004-based2009-based25%23%22%21%17%16%17%16%4%3%5% 5%8%7%5%6%FoodClothing &FootwearHousing Transport CommunicationEducation&StationeryHealth CareRecreation &O<strong>the</strong>rs2
Statistics Singapore Newsletter March 2010Compared with <strong>the</strong> 2004-based CPI, <strong>the</strong>share <strong>of</strong> education & stationery fell from 8per cent to 7 per cent in 2009-based CPI dueto lower weights for personal computers andoverseas university tuition fees. Health careshare went up from 5 per cent in 2004-basedCPI to 6 per cent in <strong>the</strong> 2009-based CPI asa result <strong>of</strong> higher expenditure on specializedmedical treatment and dental services aswell as pharmaceutical products and medicalinsurance premiums. Communication retainedits share at 5 per cent in <strong>the</strong> 2009-based CPI.Expanded Coverage <strong>of</strong>Items and OutletsDuring <strong>the</strong> rebasing exercise, <strong>the</strong> CPI basket<strong>of</strong> goods and services as well as <strong>the</strong> sample <strong>of</strong>outlets were reviewed and updated to reflectcurrent consumption patterns.The goods and services included for pricing in<strong>the</strong> CPI are representative <strong>of</strong> those commonlypurchased by <strong>the</strong> majority <strong>of</strong> <strong>the</strong> households.For <strong>the</strong> 2009-based CPI, <strong>the</strong> number <strong>of</strong>brands selected was expanded to 6,500, from5,170 in <strong>the</strong> 2004-based CPI. Some examples<strong>of</strong> new items included were surgical operationand procedures, home medical and nursingservices, budget airfares, bundled packages(fixed-line, mobile and broadband services)and compressed natural gas.The outlets covered in <strong>the</strong> CPI included awide range <strong>of</strong> retailers and service providerscommonly patronised by shoppers. The totalnumber <strong>of</strong> outlets selected for pricing in <strong>the</strong>2009-based CPI was increased to 4,200, from3,000 outlets in <strong>the</strong> 2004-based CPI.Methodological ImprovementsMethodological changes were also introducedin <strong>the</strong> 2009-based CPI, taking into accountrecommendations by <strong>the</strong> International LabourOrganisation (ILO) and o<strong>the</strong>r countries’ bestpractices.(a)Inclusion <strong>of</strong>One-Person HouseholdsThe coverage for <strong>the</strong> 2009-based CPI wasexpanded to include one-person householdsin <strong>the</strong> derivation <strong>of</strong> <strong>the</strong> weighting pattern.This group <strong>of</strong> households was includedto reflect its increasing share in <strong>the</strong> totalresident households.(b) Adopting More Timely PricingIndicator for Owner-OccupiedHousing (OOH) CostsFor <strong>the</strong> computation <strong>of</strong> OOH index in <strong>the</strong>housing group, DOS has adopted <strong>the</strong> rentalequivalence approach which measures <strong>the</strong>shelter cost in terms <strong>of</strong> <strong>the</strong> expected rental<strong>the</strong> owner would have to pay if he were atenant <strong>of</strong> <strong>the</strong> premise (i.e. imputed rental).In <strong>the</strong> 2004-based CPI, <strong>the</strong> Annual Value(AV) was <strong>the</strong> pricing indicator used to trackchanges in OOH costs as it coincided with<strong>the</strong> concept <strong>of</strong> imputed rental. However, as<strong>the</strong> Inland Revenue Authority <strong>of</strong> Singapore(IRAS) usually reviews AVs <strong>of</strong> residentialproperties only once a year, changes in rentalscannot be reflected in <strong>the</strong> monthly CPI in atimely manner. For <strong>the</strong> 2009-based CPI, rentaldata which are available on a monthly basisfrom IRAS are used as <strong>the</strong> pricing indicatorfor OOH costs instead. This will enable changesin OOH costs to be reflected in <strong>the</strong> CPI ona more timely basis.3
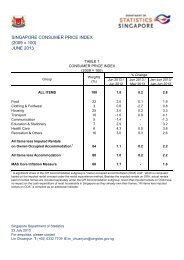
Statistics Singapore Newsletter March 2010Revision <strong>of</strong> <strong>the</strong>2009 Inflation RateThe 2009 inflation rate had been revised to0.6 per cent based on <strong>the</strong> 2009-based CPI(Table 1). The rate based on <strong>the</strong> 2004-basedCPI was 0.2 per cent.TABLE 1PERCENT CHANGE IN CPI,2009 OVER 2008Per CentMain Group 2004-based2009-basedAll Items 0.2 0.6Food 2.3 2.3Clothing & Footwear 1.1 0.8Housing -0.3 1.7Transport -3.6 -3.2Communication 1.6 0.2Education & Stationery 0.3 0.8Health Care 2.9 2.0Recreation & O<strong>the</strong>rs -0.1 -0.3All Items lessAccommodation-0.5 -0.5as methodological improvements. Excludingaccommodation costs, <strong>the</strong> CPI fell by 0.5 percent in 2009, both before and after rebasing.Among <strong>the</strong> main groups, <strong>the</strong> CPI for housingin 2009 rose by 1.7 per cent under <strong>the</strong>2009-based CPI instead <strong>of</strong> <strong>the</strong> 0.3 per centdecline under <strong>the</strong> 2004-based CPI. The use <strong>of</strong>monthly rental data from IRAS instead <strong>of</strong> AVas a pricing indicator for OOH costs enabled<strong>the</strong> 2009-based housing CPI to reflect moretimely <strong>the</strong> month-to-month changes in OOHcosts, in tandem with <strong>the</strong> underlying marketrental trend.O<strong>the</strong>r major groups also recorded differencesin inflation rates. Transport and education& stationery registered relatively higherrates under <strong>the</strong> 2009-based CPI whileclothing & footwear, communication, healthcare and recreation & o<strong>the</strong>rs experiencedrelatively lower inflation rates under <strong>the</strong>2009-based CPI.The revised 2009 inflation rate reflectedbetter <strong>the</strong> price changes experienced by<strong>the</strong> households in 2009 as it encompassedmore up-to-date weighting pattern andcomposition <strong>of</strong> goods and services, as wellConclusionThe CPI has been rebased to base year 2009to reflect more up-to-date weighting patternand composition <strong>of</strong> goods and services, aswell as methodological improvements.Details on <strong>the</strong> rebasing <strong>of</strong> <strong>the</strong> CPI can be found in <strong>the</strong> Information Paper on“The <strong>Rebasing</strong> <strong>of</strong> <strong>the</strong> <strong>Consumer</strong> <strong>Price</strong> <strong>Index</strong> (Base Year 2009 = 100)”, available for freedownloading from <strong>the</strong> SingStat website athttp://www.singstat.gov.sg/pubn/papers/economy/ip-e36.pdf4


