Math 121 Test #2 Spring 2012
Math 121 Test #2 Spring 2012
Math 121 Test #2 Spring 2012

You also want an ePaper? Increase the reach of your titles
YUMPU automatically turns print PDFs into web optimized ePapers that Google loves.
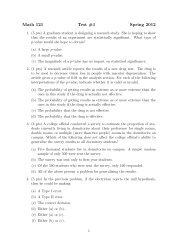
4. (4 pts) Five histograms are presented below. Each histogram displays testscores on a scale of 0 to 10 for one of five different statistics classes. Which ofthe classes would you expect to have the lowest standard deviation, and why?(a) Class A, because it has the most values close to the mean.(b) Class B, because it has the smallest number of distinct scores.(c) Class C, because there is no change in scores.(d) Class A and Class C, because they both have the smallest range.(e) Class E, because it looks the most normal.16161414<strong>121</strong>2Frequency1086Frequency1086442200 1 2 3 4 5 6 7 8 9 10Scores00 1 2 3 4 5 6 7 8 9 10ScoresClass AClass B16161414<strong>121</strong>2Frequency1086Frequency1086442200 1 2 3 4 5 6 7 8 9 10Scores00 1 2 3 4 5 6 7 8 9 10ScoresClass CClass D161412Frequency10864200 1 2 3 4 5 6 7 8 9 10ScoresClass E2
7. (12 pts) For the standard normal distribution, find each of the following.(a) (3 pts) The area between z = 1.2 and z = 1.9.(b) (3 pts) The area to the left of z = 1.2.(c) (3 pts) The area to the right of z = 1.9.(d) (3 pts) The 85 th percentile.8. (12 pts) Theoretically IQ scores are normally distributed and have a mean of100 and a standard deviation of 15.(a) (3 pts) What is the probability that a person selected at random has anIQ score of at least 112?(b) (3 pts) What is the probability that a person selected at random has anIQ score between 76 and 124?(c) (3 pts) What proportion of the population has an IQ score less than 70?(d) (30 pts) A very elite college will admit only students whose IQ scores arein the top 10% of the population. What is the minimum IQ score one musthave to be eligible for acceptance to this college?9. (10 pts) There are two bags: Bag A and Bag B. Each bag contains millions ofvouchers, worth from $5 to $10. (All values between $5 and $10 are possible, notjust the whole numbers.) The following two diagrams show the distributions ofvouchers in the two bags.0.40.40.05 10Bag A0.05 10Bag BWe are presented with one of the two bags, but we do not know which one it is.We draw one voucher from the bag and, based on its value, decide which bagwe believe we are holding. The hypotheses areH 0 : It is Bag A.H 1 : It is Bag B.(a) (2 pts) What is the direction of extreme?(b) (4 pts) Let our decision rule be to reject H 0 if the value of the chosenvoucher is at least 9. Find the value of α.(c) (4 pts) Using the decision rule in part (b), find the value of β.4
10. (18 pts) According to a Rasmussen poll released on March 20, 40% of likelyvoters strongly disapprove of President Obama’s performance.(a) (8 pts) Suppose we take a sample of 2 likely voters and let ˆp be the sampleproportion (out of 2) that strongly disapprove of the president’s performance.Use a tree diagram to find the sampling distribution of ˆp. Be sureto list each possible value of ˆp and its probability.(b) (6 pts) Now suppose that we take a sample of 600 likely voters and letˆp be the sample proportion (out of 600) that strongly disapprove of thepresident’s performance. Use the Central Limit Theorem to describe thesampling distribution of ˆp. Be sure to give all important features.(c) (4 pts) Continuing part (b), find the probability that at least 44% of thesample strongly disapprove of the president’s performance.11. (4 pts) A certain manufacturer claims that they produce 50% brown candies.Sam plans to buy a large family size bag of these candies and Kerry plans tobuy a small fun size bag. Which bag is more likely to have more than 70%brown candies? (Only one answer is correct.)(a) Sam’s, because there are more candies, so his bag can have more browncandies.(b) Sam’s, because there is more variability in the proportion of browns amonglarger samples.(c) Kerry’s, because there is more variability in the proportion of browns amongsmaller samples.(d) Kerry’s, because most small bags will have more than 50% brown candies.(e) Both have the same chance because they are both random samples.12. (4 pts) Imagine you have a barrel that contains thousands of candies with severaldifferent colors. We know that the manufacturer produces 35% yellow candies.Five students each take a random sample of 20 candies, one at a time, andrecord the percentage of yellow candies in their sample. Which sequence belowis the most plausible for the percent of yellow candies obtained in these fivesamples?(a) 30%, 35%, 15%, 40%, 50%.(b) 35%, 35%, 35%, 35%, 35%.(c) 5%, 60%, 10%, 50%, 95%.(d) Any of the above5