

Schedules forming part of the Financial ... - Thomas Cook India
Schedules forming part of the Financial ... - Thomas Cook India
Schedules forming part of the Financial ... - Thomas Cook India

Create successful ePaper yourself
Turn your PDF publications into a flip-book with our unique Google optimized e-Paper software.
<strong>Thomas</strong> <strong>Cook</strong> (<strong>India</strong>) Limited<br />
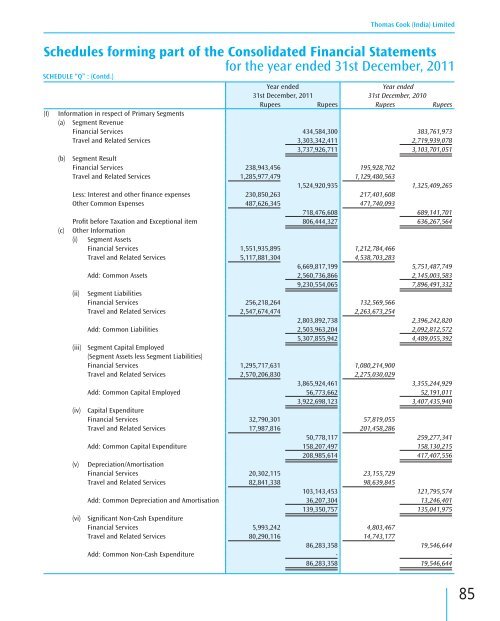
<strong>Schedules</strong> <strong>forming</strong> <strong>part</strong> <strong>of</strong> <strong>the</strong> Consolidated <strong>Financial</strong> Statements<br />
for <strong>the</strong> year ended 31st December, 2011<br />
SCHEDULE “Q” : (Contd.)<br />
Year ended<br />
Year ended<br />
31st December, 2011<br />
31st December, 2010<br />
Rupees Rupees Rupees Rupees<br />
(I) Information in respect <strong>of</strong> Primary Segments<br />
(a) Segment Revenue<br />
<strong>Financial</strong> Services 434,584,300 383,761,973<br />
Travel and Related Services 3,303,342,411 2,719,939,078<br />
3,737,926,711 3,103,701,051<br />
(b) Segment Result<br />
<strong>Financial</strong> Services 238,943,456 195,928,702<br />
Travel and Related Services 1,285,977,479 1,129,480,563<br />
1,524,920,935 1,325,409,265<br />
Less: Interest and o<strong>the</strong>r finance expenses 230,850,263 217,401,608<br />
O<strong>the</strong>r Common Expenses 487,626,345 471,740,093<br />
718,476,608 689,141,701<br />
Pr<strong>of</strong>it before Taxation and Exceptional item 806,444,327 636,267,564<br />
(c) O<strong>the</strong>r Information<br />
(i) Segment Assets<br />
<strong>Financial</strong> Services 1,551,935,895 1,212,784,466<br />
Travel and Related Services 5,117,881,304 4,538,703,283<br />
6,669,817,199 5,751,487,749<br />
Add: Common Assets 2,560,736,866 2,145,003,583<br />
(ii) Segment Liabilities<br />
9,230,554,065 7,896,491,332<br />
<strong>Financial</strong> Services 256,218,264 132,569,566<br />
Travel and Related Services 2,547,674,474 2,263,673,254<br />
2,803,892,738 2,396,242,820<br />
Add: Common Liabilities 2,503,963,204 2,092,812,572<br />
(iii) Segment Capital Employed<br />
(Segment Assets less Segment Liabilities)<br />
5,307,855,942 4,489,055,392<br />
<strong>Financial</strong> Services 1,295,717,631 1,080,214,900<br />
Travel and Related Services 2,570,206,830 2,275,030,029<br />
3,865,924,461 3,355,244,929<br />
Add: Common Capital Employed 56,773,662 52,191,011<br />
(iv) Capital Expenditure<br />
3,922,698,123 3,407,435,940<br />
<strong>Financial</strong> Services 32,790,301 57,819,055<br />
Travel and Related Services 17,987,816 201,458,286<br />
50,778,117 259,277,341<br />
Add: Common Capital Expenditure 158,207,497 158,130,215<br />
208,985,614 417,407,556<br />
(v) Depreciation/Amortisation<br />
<strong>Financial</strong> Services 20,302,115 23,155,729<br />
Travel and Related Services 82,841,338 98,639,845<br />
103,143,453 121,795,574<br />
Add: Common Depreciation and Amortisation 36,207,304 13,246,401<br />
(vi) Significant Non-Cash Expenditure<br />
139,350,757 135,041,975<br />
<strong>Financial</strong> Services 5,993,242 4,803,467<br />
Travel and Related Services 80,290,116 14,743,177<br />
86,283,358 19,546,644<br />
Add: Common Non-Cash Expenditure - -<br />
86,283,358 19,546,644<br />
85


