
Create successful ePaper yourself
Turn your PDF publications into a flip-book with our unique Google optimized e-Paper software.
Printing of the <strong>Proceedings</strong> is madepossible, in part, by an educationalgrant from GE Healthcare.
Dear Colleagues,On behalf of your Executive Committee, I am pleased to welcome our members as well as the entireneuroscience community to Seattle, Washington for the Neuroradiology Education and Research (NER)Foundation Symposium and the 42nd Annual Meeting of the American Society of Neuroradiology (<strong>ASNR</strong>).Why do we go to meetings? To learn, network and have a little fun in the process. The <strong>ASNR</strong> 42nd AnnualMeeting offers you all of this in the span of a week.Victor M. Haughton, MD, Program Chair, and his dedicated Program Committee, have planned a programthat continues in the tradition of providing world-class educational programming on the newest clinical andtechnological developments in Neuroradiology.The <strong>ASNR</strong> <strong>2004</strong> Annual Meeting will have over 20 Focus Sessions developed by the American Society ofHead and Neck Radiology (ASHNR), American Society of Pediatric Neuroradiology (ASPNR), AmericanSociety of Interventional and Therapeutic Neuroradiology (ASITN) and the American Society of SpineRadiology (ASSR), covering a wide range of topics of interest for both the sub-specialist in neuroradiology aswell as the general neuroradiologist. I wish to extend a special thanks to the following Co-Chairs for theirefforts in organizing the programming for the following specialty areas…American Society of Head and Neck Radiology (ASHNR), Vijay M. Rao, MDAmerican Society of Pediatric Neuroradiology (ASPNR), Charles R. Fitz, MDAmerican Society of Spine Radiology (ASSR), Gregg H. Zoarski, MDAmerican Society of Interventional and Therapeutic Neuroradiology (ASITN), Gary R. Duckwiler, MDOther program highlights include the Advanced Imaging Seminars providing an in-depth look at advancedimaging techniques (perfusion, diffusion, fMRI spectroscopy, functional mapping), a Research Grant WritingSeminar, a Pediatric Interesting Case Conference, ELC Workshop and Lectures and the successful How-ToSession programming will be offered and includes breakfast, lunch and reception sessions during the week.All in all, the <strong>ASNR</strong> 42nd Annual Meeting offers programming for every type of practice, in a diversifiedformat with something for everyone. The meeting also provides excellent opportunities to renew oldfriendships and make new ones at the Welcome Reception with Technical Exhibitors on Monday evening andthe “Pike Place Market” Reception on Wednesday featuring the “Best of the Northwest” fine craft show, ashowcase of work by local Pike Place artists.Don’t Miss the Seattle ExperienceFollowing a day of informative educational sessions for the mind, treat your spirit to an evening of feastingon the sights and tastes of Seattle and the Puget Sound. Attendees have an opportunity to see the city andenjoy dinner and evening with family and friends through the evening dinner tours offered through theexpanded Optional Tour Program.On behalf of the entire Executive Committee, we welcome you to Seattle,Washington for the NER Foundation Symposium and <strong>ASNR</strong> 42nd AnnualMeeting where advanced technology, clinical imaging and interventionalneuroradiological excellence come together.Sincerely,Charles M. Strother, MDPresidentAmerican Society of Neuroradiology
Welcome MessageWELCOME MESSAGEVictor M. Haughton, MDANSR President-Elect/Program Chair<strong>ASNR</strong> 42nd Annual Meeting Seattle, WashingtonPlease note: If movie is not playing Quicktime®needs to be downloaded and installed.<strong>ASNR</strong> <strong>2004</strong>
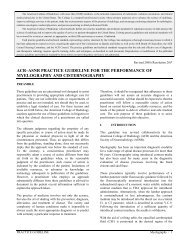
How to use your <strong>Proceedings</strong> CD-RomWith free Acrobat Reader ® software, you can view and print Adobe PDF files. If your computer doesn’t alreadyhave Acrobat installed you can simply download either a Macintosh® or Windows® version from this CD-Rom.With this CD-Rom you can search the data in many different ways as shown in the examples below:To access the author search section simply clickon the button found at the bottom of the Table ofContents page.<strong>ASNR</strong> 42nd Annual Meeting Seattle, WashingtonUser can link from the Table ofContents to pages throughout theCD-Rom as shown above by simplyclicking on the links in the file.Convenient Bookmarks make it easy to jump to specificsessions throughout the week’s program.You can easily move to a page of your choice.The Thumbnail palette displays a small image of each pagein the proceedings for quick viewing.II<strong>ASNR</strong> <strong>2004</strong>
<strong>ASNR</strong> 42nd Annual Meeting Seattle, Washington2003-<strong>2004</strong> <strong>ASNR</strong> Executive CommitteeCharles M. Strother, MDPresidentVictor M. Haughton, MDPresident-Elect/Program ChairPatricia A. Hudgins, MDVice President, Secretary andHead and Neck RepresentativeM. Judith Donovan Post, MDTreasurerJohn J. Connors, III, MDInterventional RepresentativeCharles R. Fitz, MDPediatric RepresentativeGregg H. Zoarski, MDSpine RepresentativePatrick A. Turski, MDFirst Past-PresidentWilliam P. Dillon, MDSecond Past-PresidentWilliam S. Ball, Jr., MDThird Past-PresidentCOMMITTEESJ. Arliss Pollock, MDClinical Practice Committee ChairLaurie A. Loevner, MDEducation Committee ChairJames M. Provenzale, MDMember-at-Large & Research ChairJohn R. Hesselink, MD, FACRRules Committee ChairMauricio Castillo, MDPublications Committee ChairAndrew W. Litt, MDAMA DelegateJames B. Gantenberg, CHE<strong>ASNR</strong> Executive Director/CEOCommercial Relations Committee ChairKelly K. Koeller, MDACR RepresentativeRobert R. Lukin, MDABR RepresentativeWilliam G. Bradley, MDACR Neuro/MR Commission Liaison2003-<strong>2004</strong> Meeting Arrangements CommitteesScientific Program CommitteeVictor M. Haughton, MDChairVijay M. Rao, MDHead and Neck RepresentativeGary R. Duckwiler, MDInterventional RepresentativeCharles R. Fitz, MDPediatric RepresentativeGregg H. Zoarski, MDSpine RepresentativeMichael Brant-Zawadzki, MDR. Gilberto Gonzalez, MD, PhDPatricia A. Hudgins, MDGregory L. Katzman, MDLaurie A. Loevner, MDCarolyn Cidis Meltzer, MDSuresh K. Mukherji, MDJay J. Pillai, MDJ. Arliss Pollock, MDJames M. Provenzale, MDRobert M. Quencer, MDTimothy P.L. Roberts, PhDHoward A. Rowley, MDDavid Saloner, PhDHervey D. Segall, MDA. Gregory Sorensen, MDCharles M. Strother, MDWilliam T.C. Yuh, MD, MSEEIV<strong>ASNR</strong> <strong>2004</strong>
2003-<strong>2004</strong> Meeting Arrangements Committees (continued)Audio Visual CommitteeEdward A. Michals, MDChairErin M. Simon, MD, OTRVice ChairRose Marie Holt, MD, PhDSpecial ConsultantRobert M. Barr, MDAlexander B. Baxter, MDJacqueline A. Bello, MDRichard M. Berger, MDBrian C. Bowen, MD, PhDOrest B. Boyko, MD, PhDPhillip W. Chao, MDDale A. Charletta, MDDianna Chooljian, MDRaquel Del Carpio-O’Donovan, MDColin P. Derdeyn, MDDavid B. Granato, MDAnil Khosla, MDKelly K. Koeller, MDRobert A. Koenigsberg, DO, FACRWarren W. Lam, MDJohn I. Lane, MDGina M. Lowe, MDJoel R. Meyer, MDPratik Mukherjee, MD, PhDWalter L. Olsen, MDTina Young Poussaint, MDHarish N. Shownkeen, MDMurray A. Solomon, MDJeffrey A. Stone, MDVance E. Watson, MDElectronic Learning Center (ELC) CommitteeGregory L. Katzman, MDELC Chair, Program EditorHervey D. Segall, MDChair EmeritusRichard M. Berger, MDVice Chair, Moderators and Technical CoordinationRichard H. Wiggins, III, MDVice Chair, Syllabus EditorCOMMITTEESScientific Exhibits CommitteeStephen Gebarski, MDChairLinda A. Heier, MDVice ChairGary M. Nesbit, MDConsultantDavid M. Yousem, MDConsultantRichard M. Berger, MDNancy J. Fischbein, MDSandra W. Horowitz, MDJill V. Hunter, MDPrabhakar P. Kesava, MDLeena M. Ketonen, MDBernadette L. Koch, MDKelly K. Koeller, MDJonathan S. Lewin, MDSusan Palasis, MDGregory W. Petermann, MDJordan M. Prager, MDErin M. Simon, MD, OTREvelyn M. Sklar, MDTechnical Exhibits CommitteeLawrence N. Tanenbaum, MDChairRay A. Brinker, MDTaher El Gammal, MDAndrei I. Holodny, MDJonathan Kleefield, MDJohn Perl, II, MDC. Douglas Phillips, MDRobert L. Waldron, II, MD, FACRAlan L. Williams, MD, FACR, MBADavid S. Willig, MDLocal Arrangements CommitteeJoseph M. Eskridge, MDKenneth R. Maravilla, MDJune 7 – 11, <strong>2004</strong><strong>ASNR</strong> 42nd Annual MeetingV
42nd Annual Meeting Invited SpeakersNolan R. Altman, MDMiami Children’s HospitalYoshimi Anzai, MDUniversity of WashingtonFaris A. Bandak, PhDUniformed Services University of the Health SciencesA. James Barkovich, MDUniversity of California, San FranciscoPatrick D. Barnes, MDStanford University Medical CenterJohn D. Barr, MDMid South Imaging and TherapeuticsClifford J. Belden, MDAlbany Medical CenterStephen M. Belkoff, MDThe Johns Hopkins University,Bay View Medical CenterC. Craig Blackmore, MD, MHSHarborview Medical CenterR. Nick Bryan, MD, PhDUniversity of Pennsylvania Health SystemJonathan H. Burdette, MDWake Forest University, Baptist Medical CenterKim M. Cecil, PhDChildren’s Hospital Medical Center, CincinnatiSoonmee Cha, MDUniversity of California, San FranciscoJohn J. Connors, III, MDMiami Cardiac and Vascular InstituteThomas E. Conturo, MD, PhDWashington University, St. LouisRobert W. Dalley, MDUniversity of Washington Medical CenterH. Christian Davidson, MDUniformed Services University of Health SciencesColin P. Derdeyn, MDWashington University School of MedicineJacques E. Dion, MDEmory University School of MedicineChistopher F. Dowd, MDUniversity of California, San Francisco Medical CenterGary R. Duckwiler, MDUniversity of California, Los AngelesUlrike Dydak, PhDUniversity and ETH Zurich, SwitzerlandRichard I. Farb, MD, FRCPCToronto Western Hospital University, CanadaMassimo Fillippi, MDScientific Institute Ospedale, San Raffaele, ItalyINVITED SPEAKERSNancy J. Fischbein, MDUniversity of California, San Francisco Medical CenterMelanie B. Fukui, MDAllegheny General HospitalP. Ellen Grant, MDMassachusetts General HospitalRobert I. Grossman, MDNew York University Medical CenterH. Ric Harnsberger, MDUniversity of Utah School of MedicineAnton N. Hasso, MD, FACRUniversity of California, Irvine Medical CenterAndrei I. Holodny, MDMemorial Sloan-Kettering Cancer CenterPatricia A. Hudgins, MDEmory University School of MedicineJill V. Hunter, MDTexas Children’s HospitalJ. Randy Jinkins, MD, FACP, FECFonar CorporationBernadette L. Koch, MDCincinnati Children’s HospitalJames M. Kofler, Jr., PhDMayo ClinicSpyros S. Kollias, MDInstitute of Neuroradiology University HospitalZurich, SwitzerlandChristiane Kuhl, PhDUniversity of Bonn, GermanyTimothy L. Larson, MDSeattle RadiologistsMichael H. Lev, MDHarvard Medical SchoolRobert B. Lufkin, MDUniversity of California, Los AngelesLuigi Manfre, MDA.O. Cannizzaro Hospital, Catania, ItalyBruce McCandliss, PhDWeill Medical College of Cornell UniversityThomas E. Merchant, DO, PhDSt. Jude Children’s Research HospitalDavid J. Mikulis, MDToronto Western Hospital, CanadaPratik Mukherjee, MD, PhDUniversity of California, San FranciscoJune 7 – 11, <strong>2004</strong><strong>ASNR</strong> 42nd Annual MeetingVII
<strong>ASNR</strong> 42nd Annual Meeting Seattle, Washington42nd Annual Meeting Invited Speakers (continued)Suresh K. Mukherji, MDUniversity of Michigan Health SystemYuichi Murayama, MDUniversity of California. Los Angeles Medical SchoolKieran P.J. Murphy, MDThe Johns Hopkins University School of MedicineF. Reed Murtagh, MDUniversity of South Florida College of MedicineDiego B. Nunez Jr., MD, MPHHospital of St. Raphael, New Haven, CTRoger Packer, MDChildren’s National Medical Center, Washington, DCJames J. Pekar, PhDKennedy Krieger InstituteC. Douglas Phillips, MDUniversity of Virginia Health SystemJohn A. Plunkett, MDRegina Medical Center, Hastings, MNJ. Arliss Pollock, MDRadiological Associates, Sacramento, CATina Young Poussaint, MDChildren’s Hospital, BostonJames M. Provenzale, MDDuke University Medical CenterJanet S. Rasey, PhDUniversity of WashingtonTimothy P.L. Roberts, PhDUniversity of Toronto, Princess Margaret Hospital,CanadaLucy B. Rorke, MDThe Children’s Hospital of PhiladelphiaHoward A. Rowley, MDUniversity of Wisconsin Hospitals and ClinicsKurt P. Schellhas, MDCenter for Diagnostic Imaging, St. Louis Park, MNINVITED SPEAKERSJeffrey Silber, MDLong Island Jewish Medical Center/North Shore UniversityWendy R.K. Smoker, MD, FACRUniversity of Iowa College of MedicineJeffrey A. Stone, MDMedical College of GeorgiaPatrick W. Stroman, PhDNational Research Council of Canada, WinnipegSteven M. Stufflebeam, MDMassachusetts General HospitalGordon K. Sze, MDYale University Medical CenterLawrence N. Tanenbaum, MDEdison Radiological GroupThomas A. Tomsick, MDUniversity of Cincinnati Medical CenterJ. Pablo Villablanca, MDDavid Geffen School of Medicineat University of California, Los AngelesAjay K. Wakhloo, MD, PhDUniversity of Miami, Jackson Memorial HospitalMichael W. Weiner, MDUniversity of California, San Francisco Medical CenterDaniel W. Williams, III, MDWake Forest University School of MedicineJoan C. Wojak, MDOur Lady of Lourdes Regional Medical Center,LouisianaDavid M. Yousem, MDThe Johns Hopkins University School of MedicineRobert A. Zimmerman, MDThe Children’s Hospital of PhiladelphiaVIII<strong>ASNR</strong> <strong>2004</strong>
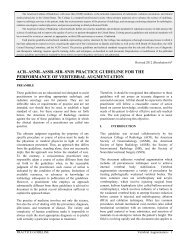
About Seattle, WashingtonSEATTLE, WAdestination for visitors. Situated on the shores of twoThe diversity of cultural and outdoor venues makesSeattle and the Puget Sound region an excitinglarge lakes and Puget Sound, with remote wildernessless than an hour away, Seattle is flanked by two majormountain ranges (Olympics and Cascades), providingvisitors with dramatic views of Mount Rainier and atemperate climate year-round.The opportunities for sightseeing abound with worldclassattractions practically at the doorstep of theSheraton Seattle Hotel and Towers, the headquarterhotel for the <strong>ASNR</strong> 42nd Annual Meeting. Among themost popular urban attractions are the Seattle Centerand the Space Needle, Pike Place Market, PioneerSquare, and the International District.Seattle is home to the nation’s 7th largest population ofartists, supported in part by an innovative public artsfunding program. The arts scene includes the Seattle ArtMuseum, Seattle Asian Art Museum, ExperienceMuseum Project rock and roll museum, SeattleSymphony, now in the world class Benaroya Hall,Seattle Opera and the Pacific Northwest Ballet. Thesymphony and ballet have performances scheduledduring the annual meeting dates.The internationally known glass artist Dale Chihuly, alsomakes his home in Seattle. <strong>ASNR</strong> meeting attendeeswho stay at the headquarter hotel, the Sheraton SeattleHotel and Towers, will experience the beauty of glassblown art daily as the hotel houses one of the renownedPilchuck Glass collections including pieces by Chihuly.June 7 – 11, <strong>2004</strong>Walking Map of Seattle, Washington<strong>ASNR</strong> would like to thank NORTHSTAR Travel Media, LLC for the use of their Seattle, WA downtown area map.<strong>ASNR</strong> 42nd Annual MeetingIX
F45F45G45 G45 G45G45 G45G45 G454BScientific PostersP154P126P099P098P071P070P043P042P154aP153P128P125P100P097P072P069P044P041P014P013P155P152P129P124P101P096P073P068P045P040P015P012P156P151P130P123P102P095P074P067P046P039P016P011Level 4P177P176P157P158P160P150P149P148P131P132P133P122P121P120P103P104P105P094P093P092P075P076P077P066P065P064P047P048P049P038P037P036P017P018P020P010P009P008(As of 4/21/<strong>2004</strong>)P178P179P180P175P174P173P161P162P164P147P146P145P134P135P136P119P118P117P106P107P108P091P090P089P078P079P080P063P062P061P050P051P052P035P034P033P021P022P023P007P006P005MICRUSCORP.P181P182P172P171P165P166P144P143P137P138P116P115P109P110P088P087P081P082P060P059P053P054P032P031P024P026P004P00320'MENP183P170P16915'P167P168P142P14115'P139P140P114P11315'P111P112P086P08515'P083P084P058P057P055P056P030P02915' 15'P027P002P001116<strong>ASNR</strong> 42nd Annual Meeting Seattle, Washington454COAT CHECKMENEXIT1 2ESCALATORSFLOORS 4 & 6ONLYEXITSE110SE115SE114SE111SE113SE11212'15'WOMENSE105SE106SE107SE108SE109UP6'-T 6'-TAMA INFOCAEExhibitsSE104SE89SE103SE90RESTAURANT INFOSE102SE91SE101SE92SE100SE93SE99SE94SE98SE95SE97SE9612'DOWNScientific Exhibits8'-TJOB POSTINGSSE88SE73SE87SE74SE8612'MEN8'-TANNOUNCEMENTSCAE21CAESE75SE85SE76SE84SE78SE83SE79SE82SE80SE81SE72SE57SE71SE58SE70SE59SE69SE60SE68SE61SE67SE62SE66SE63SE65SE6412'EXITCAECAE12'20 19 18 17 16 15 14 13 12 111 2 3 4 5 6 7 8 9 10CAECAECAE CAE CAE12'SE56SE41SE55SE42SE54SE43SE53SE44SE52SE45SE51SE46SE50UP TO 5SHOWEXITCAE CAE CAESE47SE4812'6'-TSE40SE25SE39SE26SE38SE27SE37SE28SE36SE29SE35SE30SE34SE31SE33SE3212'EntranceFILL-IN6'-TEXITEXITSE24SE10SE23SE11SE22SE12SE21SE13SE20SE14SE19SE15SE18SE15aSE17SE1612'SOUTHLOBBYON-SITE REGISTRATIONRC RC RC RC6'-T6'-TSE8SE7SE6SE5SE4SE3SE2SE1PUBLICPHONES6'-T6'-TStorage4'-T8'-T4'-T8'-T4'-T6'-T8'-T6'-TMICROVENTION20'SCOTT &WHITEVIRTUALRADIOLOGIC20'1004'-T 8'-T 4'-T 8'-T 4'-TVITALIMAGES,INC.Storage439 438110106104E-ACCESS/MESSAGING CENTEREXPRESSREGISTRATIONRCRCG45 G45 G45 G45 G45G456'-TPUBLICPHONES6'-TR6'-TX<strong>ASNR</strong> <strong>2004</strong>OUTDOORPLAZA
F45F45G45 G45 G45G45 G45G45 G45G45G45F45F454ATechnical ExhibitsP042P041P040P039P038P037P036P014P015P016P017P018P020P013P012P011P010P009P008DISC-O-TECH224NIGHTHAWK222FOOD SERVICE<strong>ASNR</strong>225WFNRS KYPHON223 322CARDINALHEALTH325MRI MEDRADDEVICES323 422RCLEADRETRIEVALLevel 4P035P034P033P032P031P021P022P023P024P026P007P006P005P004P003MICRUSCORP.20'20'STRYKER20'20'BOSTONSCIENTIFIC20'20'PHILIPSMEDICALSYSTEMS20'(As of 4/21/<strong>2004</strong>)P030 P027P02915'P002P001116117 217317SE24SE10SE23SE11SE22SE12SE21SE13SE20SE14SE19SE15SE18SE15aSE17SE1612'6'-TSE8SE7SE6SE5SE4SE3SE2SE16'-TMICROVENTIONSCOTT &WHITEVIRTUALRADIOLOGICVITALIMAGES,INC.20'100GE HEALTHCARESPRINGER-VERLAGBERLEXIMAGING20'20' 20'11010610411110710120'AMERSHAMHEALTHFOOD SERVICE4-DNEURO.20'SIEMENSMEDICALSOLUTIONSELSEVIER206 207 30620' 20'201HITACHIMEDICALSYSTEMSFOOD SERVICEBRACCODIAG.30320'COOKINCORP.20'20'ARTHROCAREINTEGRASPINALSPECIAL.413NMFAP311 411MEDNOVUS409NLM407LIPPINCOTT,WILLIAMS,WILKINS301 400 401June 7 – 11, <strong>2004</strong>EXITncePUBLICPHONESPUBLICPHONESEntranceUP TO 5SHOWMENWOMENCWFStorageStorage439 438EXIT4'-T8'-T4'-T8'-T4'-T8'-T4'-T 8'-T 4'-T 8'-T 4'-TGRANDSTAIRWAYLOUNGEPUBLICPHONESE-ACCESS/MESSAGING CENTERUP TO 5 & 6GRANDSTAIRWAYSOUTHLOBBYON-SITE REGISTRATIONRCRCRCRCEXPRESSREGISTRATIONRCRCRCRCG45 G45 G45 G45 G45 G45 G45 G45G456'-T 6'-T 6'-T 6'-T 6'-T 6'-T 6'-T 6'-T 6'-TRCEXIT6'-TEXITEXITNORTH<strong>ASNR</strong> 42nd Annual MeetingOUTDOORPLAZAXI
12DOWNUPLevel 6<strong>ASNR</strong> 42nd Annual Meeting Seattle, Washington(As of 4/21/<strong>2004</strong>)SOUTHCEILING HEIGHT VARIESPUBLICPHONESESCALATORSFLOORS 4 & 6ONLYUPSTAIRS6 7DOWNESCALATORSFLOORS 4 TO 6EASTLOBBY601TERRACEFOOD SERVICEMENWOMENHeadquartersOfficeWESTLOBBY614 613EXITCME PavilionPUBLICPHONESCOATSPUBLICPHONESPUBLICPHONES603 602EXIT608607612620 615Food ServiceSeatingFood ServiceSeating BreakoutSession 36DElectronicLearning CenterMon. – Thurs.National Libraryof MedicineTue., Wed.FIRSTAID619 6F616611BreakoutSession 2Press Room609 606604A/V StorageMENWOMENWOMENMEN618 617610 605SpeakerReady RoomPUBLICPHONES6EBreakoutSession 16C 6BGeneralSession6AWSCTCUSE431EXITEXITXII<strong>ASNR</strong> <strong>2004</strong>
Scientific Posters and Computer Assisted ExhibitsNote: A missing number indicates an abstract has been withdrawn.SCIENTIFIC POSTERSAdult Brain ......................1-93Head and Neck..........94-108Interventional............109-148Pediatrics..................149-168Spine..........................169-185Hall 4B — Level 4(As of 4/21/<strong>2004</strong>)P154P154aP155P156P153P152P151P128P129P130P126P125P124P123P099P100P101P102P098P097P096P095P071P072P073P074P070P069P068P067P043P044P045P046P042P041P040P039P014P015P016P013P012P011June 7 – 11, <strong>2004</strong>P157P150P131P122P103P094P075P066P047P038P017P010P158P149P132P121P104P093P076P065P048P037P018P009P177P176P160P148P133P120P105P092P077P064P049P036P020P008P178P175P161P147P134P119P106P091P078P063P050P035P021P007P179P174P162P146P135P118P107P090P079P062P051P034P022P006P180P173P164P145P136P117P108P089P080P061P052P033P023P005P181P172P165P144P137P116P109P088P081P060P053P032P024P004P182P171P166P143P138P115P110P087P082P059P054P031P026P003P183P170P167P142P139P114P111P086P083P058P055P030P027P002P169P168P141P140P113P112P085P084P057P056P029P001COMPUTER ASSISTED EXHIBITSAdult Brain ......................1-15Head and Neck ............17-22Interventional ................24-31Pediatrics ......................32-33Socioeconomics ................34Spine ..............................35-40CAE21CAECAECAECAE CAE CAE20 19 18 17 16 15 14 13 12 111 2 3 4 5 6 7 8 9 10CAECAECAE CAE CAEUnless otherwise indicated, all Computer AssistedExhibits can be viewed from any computer station.<strong>ASNR</strong> 42nd Annual MeetingXV
Scientific ExhibitsNote: A missing number indicates an abstract has been withdrawn.Hall 4B — Level 4(As of 4/21/<strong>2004</strong>)SCIENTIFIC EXHIBITS<strong>ASNR</strong> 42nd Annual Meeting Seattle, WashingtonAdult Brain ......................1-66Head and Neck ............67-84Interventional ................85-94Pediatrics ....................95-107Spine..........................108-115SE115SE105SE106SE107SE108SE109SE110SE114SE111SE113SE112SE104SE89SE103SE90SE102SE91SE101SE92SE100SE93SE99SE94SE98SE95SE97SE96SE88SE73SE87SE74SE86SE75SE85SE76SE84SE78SE83SE79SE82SE80SE81SE72SE57SE71SE58SE70SE59SE69SE60SE68SE62SE67SE63SE66SE64SE65SE56SE41SE55SE42SE54SE43SE53SE44SE52SE46SE51SE47SE50SE48SE40SE25SE39SE26SE38SE27SE37SE28SE36SE29SE35SE30SE34SE31SE33SE32SE24SE10SE23SE11SE22SE12SE21SE13SE20SE14SE19SE15SE18SE15aSE17SE16SE8SE7SE6SE5SE4SE3SE2SE1XVI<strong>ASNR</strong> <strong>2004</strong>
Technical ExhibitsFOOD SERVICEHall 4A — Level 4(As of 4/21/<strong>2004</strong>)DISC-O-TECH224<strong>ASNR</strong>225CARDINALHEALTH325MICRUSCORP.20'20'STRYKERNIGHTHAWK22220'WFNRS22320'BOSTONSCIENTIFICKYPHON32220'MRIDEVICESPHILIPSMEDICALSYSTEMSMEDRAD323 42220'20'June 7 – 11, <strong>2004</strong>116117 217317MICROVENTION20'GE HEALTHCARE20' 20'110111FOOD SERVICE20'HITACHIMEDICALSYSTEMS20'INTEGRASPINALSPECIAL.413NMFAP311 411MEDNOVUS409SCOTT &WHITE106SPRINGER-VERLAG107AMERSHAMHEALTH4-DNEURO.ELSEVIER206 207 306FOOD SERVICENLM407VIRTUALRADIOLOGIC10420'VITALIMAGES,INC.10020'BERLEXIMAGING10120'SIEMENSMEDICALSOLUTIONS20' 20'201BRACCODIAG.303COOKINCORP.20'ARTHROCARELIPPINCOTT,WILLIAMS,WILKINS301 400 401<strong>ASNR</strong> 42nd Annual MeetingXVII
Technical Exhibits (As of 4/21/<strong>2004</strong>)TECHNICAL EXHIBITSWashington State Convention & Trade Center — Exhibit Hall 4CMonday, June 7 — Welcome Reception ................................................................................6:00 pm – 7:30 pmTuesday, June 8 through Thursday, June 10..........................................................................9:30 am – 4:00 pmWednesday, June 9 — Reception ............................................................................................6:00 pm – 7:30 pm4-D Neuroimaging ..................................Booth 2079727 Pacific Heights BoulevardSan Diego, CA 92121Cook Incorporated..................................Booth 301750 Daniels Way, P.O. Box 489Bloomington, IN 47402-0489<strong>ASNR</strong> 42nd Annual Meeting Seattle, WashingtonAmersham Health ..................................Booth 206101 Carnegie CenterPrinceton, NJ 08540ArthroCare Spine ....................................Booth 400680 Vaqueros AvenueSunnyvale, CA 94085<strong>ASNR</strong>/NER Foundation ........................Booth 2252210 Midwest Road, Suite 207Oak Brook, IL 60523-8205Berlex Imaging ........................................Booth 101P.O. Box 100Montville, NJ 07045Boston Scientific ....................................Booth 21747900 Bayside ParkwayFremont, CA 94538Bracco Diagnostics, Inc. ........................Booth 303107 College Road EastPrinceton, NJ 08543Cardinal Health........................................Booth 3251500 Waukegan RoadMcGaw Park, IL 60085Disc Orthropaedic Technologies, Inc. ....Booth 2247 Centre Drive, Suite 1Monroe Township, NJ 08831Elsevier ......................................................Booth 30615021 75 Avenue NEKenmore, WA 98028-4649GE Healthcare ..........................................Booth 1113000 N. Grandview Boulevard, W-402Waukesha, WI 53188Hitachi Medical SystemsAmerica, Inc. ............................................Booth 3111959 Summit Commerce ParkTwinsburg, OH 44087Integra Spinal Specialties ....................Booth 41312001 Network, Building F 208San Antonio, TX 78249Kyphon Inc.................................................Booth 3221221 Crossman AvenueSunnyvale, CA 94089Lippincott, Williams & Wilkins ............Booth 4014816 139th Place SESnohomish, WA 98296XVIII<strong>ASNR</strong> <strong>2004</strong>
Technical Exhibits (As of 3/26/<strong>2004</strong>)TECHNICAL EXHIBITSMednovus, Inc./Quantum Magnetics, Inc.,an Invision Technologies Company ......Booth 409664 Hymettus AvenueLeucadia, CA 92024Philips Medical Systems ......................Booth 3173000 Minuteman RoadAndover, MA 01810Medrad, Inc. ..............................................Booth 422One Medrad DriveIndianola, PA 15051MicroVention, Inc. ..................................Booth 11075 Columbia, Suite AAliso Viejo, CA 92656Micrus Corporation ................................Booth 116610 Palomar AvenueSunnyvale, CA 94085Scott & White Health Systems............Booth 1062401 South 31st StreetTemple, TX 76508Siemens Medical Solutions ................Booth 20151 Valley Stream Parkway, #H-33Malvern, PA 19355Springer-Verlag New York, Inc. ..........Booth 107175 Fifth AvenueNew York, NY 10010-7858June 7 – 11, <strong>2004</strong>MRI Devices Corporation......................Booth 3231515 Paramount DriveWaukesha, WI 53186National Library of Medicine (NLM) ........Booth 407University of Washington, Box 357155Seattle, WA 98195Stryker ........................................................Booth 1174100 East MilhamKalamazoo, MI 49001Virtual Radiologic Consultants ..........Booth 1045995 Opus Parkway, Suite 200Minneapolis (Minnetonka), MN 55343-9058National Medical Foundationfor Asset Protection (NMFAP) ............Booth 4112230 North University Parkway, #2-CProvo, UT 84604NightHawk Radiology Services ..........Booth 222250 Northwest Boulevard, Suite 202Coeur d’Alene, ID 83814Vital Images, Inc. ....................................Booth 1003300 Fernbrook Lane North, Suite 200Plymouth, MN 55447World Federation of NeuroradiologicalSocieties (WFNRS) ................................Booth 223Meeting Dates:Adelaide, Australia – March 19-24, 2006<strong>ASNR</strong> 42nd Annual MeetingXIX
General Information<strong>ASNR</strong> 42nd Annual Meeting Seattle, WashingtonMEETING REGISTRATIONGENERAL INFORMATIONRegistration will take place in the South Lobby (Level 4)of the Washington State Convention & Trade Center. Theregistration desk will be open during the following hours:Friday, June 4 ....................................5:00 pm - 8:00 pmSaturday, June 5 ..............................8:00 am - 6:00 pmSunday, June 6..................................6:30 am - 6:00 pmMonday, June 7 ................................6:30 am - 6:00 pmTuesday, June 8 ................................6:30 am - 6:00 pmWednesday, June 9..........................6:30 am - 6:00 pmThursday, June 10 ............................6:30 am - 6:00 pmFriday, June 11................................6:30 am - 11:45 amSPEAKER READY ROOM LOCATION & HOURSWashington State Convention & Trade Center —Room 605/610 (Level 6)Friday, June 4 ....................................5:00 pm - 8:00 pmSaturday, June 5 throughThursday, June 10 ........................8:00 am - 6:00 pmFriday, June 11................................6:00 am - 11:45 amNAME BADGESPlease wear name badges at all times while you areattending the scientific sessions, social programs, andtechnical exhibits. Badge colors are identified as follows:<strong>ASNR</strong>, ASHNR, ASPNR, ASITN,or ASSR Member ....................................................BlueNon-Member..............................................................GreenFellow/Trainee ................................................................TanOther Professional ..................................................YellowGuest ..........................................................................PeachExhibitor ........................................................................GoldStaff ............................................................................PurpleCME/CPD PAVILIONWashington State Convention & Trade Center —Room 613-614 (Level 6)Saturday, June 5 ..............................1:00 pm - 9:00 pmSunday, June 6 throughThursday, June 10 ........................6:30 am - 9:00 pmFriday, June 11 ..................................6:30 am - 1:00 pmCOMMITTEE/SPECIALTY/REGIONAL SOCIETY MEETINGSPlease refer to the Daily Postings on the Meetings &Announcements Board located in the Washington StateConvention & Trade Center South Lobby (Level 4).MEETINGS & ANNOUNCEMENTS BOARDAND MESSAGE CENTERThe Meetings & Announcements Board and MessageCenter is located in the South Lobby (Level 4) of theWashington State Convention & Trade Center. Pleaserefer to the Daily Postings on the Meetings &Announcements Board and the Message Center forinformation on committee meetings.CONVENTION CENTER INFORMATIONWashington State Convention & Trade Center800 Convention PlaceSeattle, WA 98101-2350Phone: 206-694-5000EMERGENCY SERVICE PROCEDUREWithin the Washington State Convention &Trade Center:In the event of a medical emergency, please contactSecurity Control immediately. Attendees may contactSecurity Control by dialing extension 5127 from anyhouse phone located in the facility. In addition, there arered “hot line” phones located around the facility. Thesephones ring directly into the Security Control office.Emergency personnel will be dispatched immediately toyour location.The caller should provide the following:1. Determine name of specific meeting room or exhibithall where the situation has occurred.2. Identify yourself as an <strong>ASNR</strong> attendee, referenceyour exact location, and provide details on thenature of the emergency situation.3. Provide a brief but concise description of theproblem, be prepared to answer any questions thatthe operator may ask you, and remain on the line.Contacting Security Control will greatly minimizeresponse time in the event an emergency medical unitneeds to report to the Convention Center. Securitypersonnel can quickly assess the situation and bringemergency personnel directly to the scene, savingprecious minutes. For this reason, the WashingtonState Convention & Trade Center managementrequests that attendees not contact 911 directly.XX<strong>ASNR</strong> <strong>2004</strong>
General InformationGENERAL INFORMATIONHarborview Medical CenterNEAREST HOSPITAL325 9th AvenueSeattle, WA 98101Phone: 206-731-3000NEAREST PHARMACYRite Aid1319 Pike StreetSeattle, WA 98101Phone: 206-223-0512Hours: Mon. – Fri. 6:00 am - 9:00 pmSat. 8:00 am - 9:00 pmSun. 9:00 am - 6:00 pmNEAREST 24-HOUR PHARMACYBartell Drugs600 1st Ave NSeattle, WA 98101Phone: 206-284-1353HOTEL INFORMATIONSheraton Seattle Hotel and Towers1400 Sixth AvenueSeattle, WA 98101Phone: 206-621-9000Fax: 206-621-8441SHERATON SEATTLE HOTEL AND TOWERSBUSINESS CENTER SERVICESThe Sheraton Seattle Hotel and Towers BusinessCenter is conveniently located near the escalators onthe second floor. The Business Center offers copying,faxing, and binding on a fee basis.Hours: Mon. — Fri. 7:30 am - 5:00 pmSat. 10:00 am - 2:00 pm(24-hour self-service)PHOTOCOPY SERVICE &WSCTC BUSINESS CENTER SERVICESKinko’sWashington State Convention & Trade Center735 Pike StreetSeattle, WA 98101Phone: 206-467-1767Fax: 206-467-1321Hours: Mon. 7:00 am – Fri. 10:00 pm(24 hour basis)Sat. & Sun. 9:00 am - 9:00 pmFOOD SERVICE<strong>ASNR</strong> Food Service will be served in Exhibit Hall 4Aduring technical exhibition hours or in Ballroom 6 B/CFoyer/East Lobby (Level 6).Continental Breakfasts, Morning and Afternoon CoffeeService and Box Lunches are provided complimentarythroughout the week. Please refer to the schedule below.Continental BreakfastsSunday, June 6 ..............................East Lobby (Level 6)Monday, June 7 throughFriday, June 11............................East Lobby (Level 6)Use Room 619/620 for additional seating Sundaythrough Friday.How-To Session BreakfastsMonday, June 7 throughFriday, June 11 ................Ballroom 6 B/C Foyer andEast Lobby (Level 6)Morning BreaksSunday, June 6 throughMonday, June 7................Ballroom 6 B/C Foyer andEast Lobby (Level 6)Tuesday, June 8 throughThursday, June 10 ..............................................Hall 4AFriday, June 11 ....................Ballroom 6 B/C Foyer andEast Lobby (Level 6)Box LunchesSunday, June 6 throughMonday, June 7 ..........................East Lobby (Level 6)Tuesday, June 8 throughThursday, June 10 ..............................................Hall 4AFor Breaks and Lunches, use Room 619/620 foradditional seating Saturday through Monday &Friday when Technical Exhibition is closed.How-To Session LunchesTuesday, June 8 throughThursday, June 10 ..........Ballroom 6 B/C Foyer andEast Lobby (Level 6)Afternoon BreaksSaturday, June 5 throughMonday, June 7................Ballroom 6 B/C Foyer andEast Lobby (Level 6)Tuesday, June 8 throughThursday, June 10 ..............................................Hall 4AHow-To Session with RefreshmentsThursday, June 10(6:15 pm - 7:15 pm) ..................Ballroom 6 B/C FoyerJune 7 – 11, <strong>2004</strong><strong>ASNR</strong> 42nd Annual MeetingXXI
General Information (continued)<strong>ASNR</strong> 42nd Annual Meeting Seattle, WashingtonGENERAL INFORMATIONWashington State Convention & Trade CenterMEETING LOCATIONNOTE: All scientific sessions and exhibits are locatedat the Washington State Convention & Trade Center.RegistrationSouth Lobby (Level 4)CME/CPD Pavilion TerminalsRoom 613-614 (Level 6)E-Access/Messaging CenterSouth Lobby (Level 4)General SessionBallroom 6 B/CHow-To Breakfast/Lunch/Reception SessionsBallroom 6 B/CFocus/Scientific Paper SessionsBallroom 6 B/C, Ballroom 6 A, Room 606-609 andRoom 611-612ELECTRONIC LEARNING CENTER (ELC) SESSIONSWorkshopsRoom 602-603 (Level 6)LecturesRoom 606-609 or Room 611-612 (Level 6)NATIONAL LIBRARY OF MEDICINE (NLM) SESSIONSWorkshopsRoom 602-603 (Level 6)LecturesRoom 611-612 (Level 6)EXHIBITSScientific Exhibits, Electronic Scientific Exhibit (eSE) PilotProject, Scientific Posters, Computer Assisted ExhibitsHall 4B (Level 4)Technical ExhibitsHall 4A (Level 4)MISCELLANEOUSPast-Presidents’ and Executive Committee OfficeRoom 306 (Level 3)Headquarters OfficeRoom 601 (Level 6)Message Center and Meetings & Announcements BoardSouth Lobby (Level 4)Press RoomRoom 604 (Level 6)Coat CheckRoom 454 (Level 4)Hours of Operation:Saturday, June 5 ..............................8:00 am - 6:00 pmSunday, June 6 throughThursday, June 10 ........................6:30 am - 6:00 pmFriday, June 11................................6:00 am - 11:45 am<strong>ASNR</strong> <strong>2004</strong>XXII
Optional Tour Desk HoursSheratonOPTIONALSeattle Hotel and Towers – Fuller’sTOURSRestaurant (Lobby Level)Saturday, June 5 ..................................................................................................................................12:00 pm – 4:00 pmSunday, June 6 through Thursday, June 10......................................................................................8:00 am – 2:00 pmSocial ProgramAn exciting social program has been planned for registrantsSOCIALand their registered guestsPROGRAMduring the NER FoundationSymposium and <strong>ASNR</strong> 42nd Annual Meeting.Welcome Reception with Technical ExhibitorsMonday, June 7................................6:00 pm – 7:30 pmWashington State Convention & Trade Center –Exhibit Hall 4A (Level 4)The Welcome Reception with Technical Exhibitors offersthe perfect opportunity to get a preview of this year’sTechnical Exhibit, the <strong>ASNR</strong>’s annual showcase for thenewest products and services for the field ofNeuroradiology. Enjoy complimentary hors d’oeuvresand beverages while you learn about the newesttechnology. Connect with old friends, make new onesand meet representatives from the companiesparticipating in this year’s technical exhibition.This casual social setting allows plenty of time forinformal discussion with the company representatives.So bring your product and service challenges and comein search of solutions to the place where advancedtechnology and diagnostic and interventionalneuroradiological excellence come together.The Scientific Exhibition (scientific exhibits, electronicscientific exhibit pilot project, scientific posters andcomputer assisted exhibits) will also be available forviewing throughout the evening’s reception.Ticket required for admission. A ticket to the WelcomeReception with Technical Exhibitors is included in thefee for registration categories that include Monday, June7 and in the guest hospitality fee. Tickets for nonregisteredguests may be purchased at on-siteregistration if event is not sold out.“Pike Place Market” ReceptionWednesday, June 9 ........................6:00 pm – 7:30 pmWashington State Convention & Trade Center –Exhibit Hall 4A (Level 4)America’s Emerald City, Seattle, is a magical place thatcan dazzle the senses. Whether admiring the glow ofdowntown from the shores of Lake Union or viewing Mt.Rainier from the Space Needle, Seattle is the place toenjoy many flavors.Attendees and their guests are invited to experience anincredible evening at the <strong>ASNR</strong> re-created Pike PlaceMarket. This evening’s pre-dinner reception will offer thedelightful tastes, sounds and camaraderie of Seattle’sfamous Pike Place Market, the oldest farmer’s market inthe country. Smell the wonderful seafood, taste thefresh fruits and vegetables and the delicacies offered byinternational vendors, enjoy tastings from WashingtonState’s award winning wineries, or drink a cup of the richcoffee with a sweet treat.Sample the true Seattle during the reception bybrowsing through the “Pacific Northwest” craft showfeaturing artists who sell their wares at the Pike PlaceMarket. You won’t be able to resist taking home atreasure that represents the art that is unique to thePacific Northwest.Ticket required for admission. A ticket to the PikePlace Market Reception is included in the fee forregistration categories that include Wednesday, June9 and in the guest hospitality fee. Tickets for nonregisteredguests may be purchased at on-siteregistration if event is not sold out.June 7 – 11, <strong>2004</strong><strong>ASNR</strong> 42nd Annual MeetingXXIII
<strong>ASNR</strong> 42nd Annual Meeting Seattle, WashingtonGuest HospitalityGUEST HOSPITALITYGUEST HOSPITALITYSheraton Seattle Hotel and TowersFuller’s Restaurant (Lobby Level)The Guest Hospitality area is offered for <strong>ASNR</strong>registered guests on a complimentary basis. Teens andyounger individuals who are with registered guests, butare not themselves registered, may also visit thehospitality room. Afternoon snacks and beverages willbe offered on Saturday, June 5. Continental breakfast,snacks and beverages will be available from Saturday,June 5 - Friday, June 11 based on program hours.Guest Hospitality is a great place to start your morningsand plan the remainder of your day. It’s an ideal locationto see old friends and meet new acquaintances.A representative from the Seattle area will be availableto acquaint you with suggestions on what to see anddo in the Seattle area. Be sure to stop by to pick upvisitor information and brochures available in GuestHospitality on citywide attractions, downtown maps,and shopping and restaurant guides to assist you inplanning your week.GUEST HOSPITALITY HOURSSheraton Seattle Hotel and TowersFuller’s Restaurant (Lobby Level)Saturday, June 5 ..........................12:00 pm – 4:00 pmSunday, June 6 throughThursday, June 10........................8:00 am – 2:00 pmFriday, June 11 ..............................8:00 am – 11:30 amSPECIAL PROGRAMS IN GUEST HOSPITALITYA highlight of the Guest Hospitality program is aschedule of complimentary entertaining presentationson a variety of interesting topics. Guests will meet inFuller’s Restaurant five minutes before thepresentations. Presentations will take place in Room416 at the Sheraton Seattle Hotel and Towers.Sunday, June 6 ..................10:00 am – 11:00 amTuesday, June 8 ....................10:00 am – 11:00 am“Welcome to Seattle” OrientationThis session will highlight Seattle’s many outstandingand unique attractions, activities and neighborhoods.Learn about those “out of the way” dining spots favoredby locals. Discover which places offer the mostspectacular views and the most fun. Find out where toget the greatest bargains when shopping for treasuresto take home.Monday, June 7 ..................10:00 am – 11:00 amIntroduction to Seattle Glass ArtSeattle is a thriving center for artisans specializing in theancient art of glass blowing. The Sheraton Seattle Hoteland Towers is home to an extensive collection of glassartworks including many Pilchuck and Chihuly pieces.Margery Aronson, noted Seattle art advisor and curatorof the Sheraton’s collection, will present a narrated slideshow highlighting the many facets of this excitingmedium, how Seattle developed as a center of worldclassglass art and what to look for when purchasingglass art pieces. This presentation is a perfectintroduction to the Seattle Glass Blowing Studiooptional tour on June 8.Wednesday, June 9 ............10:00 am – 11:00 amSeattle Underground: History with HumorSeattle Underground is known for its hilarious “belowthe surface” Seattle history tours. One of the theirknowledgeable and comical guides will introduce you tothe stories behind the official history of Seattle. Hearhow the Founding Fathers’ squabbling led to Seattle’scomplicated street system and how the solutions to thecity’s plumbing problems affected the town’s elevation.Through tales of Seattle’s frontier past, you’lllearn about its villains and its heroes and the manyobstacles Seattle has overcome to grow into thebustling metropolis it is today.XXIV<strong>ASNR</strong> <strong>2004</strong>
Future <strong>ASNR</strong> Annual Meetings200543rd Annual MeetingMay 21 - 27Metro Toronto Convention CentreToronto, Ontario, Canada200644th Annual MeetingApril 29 – May 5San Diego Convention CenterSan Diego, California200745th Annual MeetingFUTURE MEETINGSJune 9 - 15Hyatt Regency Chicago HotelChicago, Illinois200846th Annual MeetingMay 31 — June 6Morial Convention CenterNew Orleans, Louisiana200947th Annual MeetingMay 16 - 22Vancouver Convention &Exhibition CentreVancouver, British Columbia, Canada201048th Annual MeetingMay 15 - 21Hynes Convention CenterBoston, Massachusetts<strong>ASNR</strong> Past Presidents and FoundersPAST PRESIDENTS1962-64 Juan M. Taveras, MD*1964-65 Mannie M. Schechter, MD*1965-66 Donald L. McRae, MD*1966-67 Ernest H. Wood, MD*1967-68 Harold O. Peterson, MD*1968-69 Colin B. Holman, MD1969-70 Giovanni Di Chiro, MD*1970-71 D. Gordon Potts, MD1971-72 Norman E. Chase, MD1972-73 Fred J. Hodges, III, MD1973-74 T. Hans Newton, MD1974-75 Hillier L. Baker, Jr., MD1975-76 Irvin I. Kricheff, MD1976-77 Norman E. Leeds, MD1977-78 Sadek K. Hilal, MD*1978-79 Stephen A. Kieffer, MD1979-80 David O. Davis, MD1980-81 George Wortzman, MD1981-82 Gabriel H. Wilson, MD1982-83 Arthur E. Rosenbaum, MD1983-84 O. Wayne Houser, MD1984-85 Samuel M. Wolpert, MD1985-86 R. Thomas Bergeron, MD1986-87 Derek C. Harwood-Nash, MD*1987-88 Michael S. Huckman, MD1988-89 Anne G. Osborn, MD1989-90 Joseph F. Sackett, MD1990-91 Anton N. Hasso, MD, FACR1991-92 R. Nick Bryan, MD, PhD1992-93 David Norman, MD1993-94 Glenn Forbes, MD1994-95 Robert M. Quencer, MD1995-96 Robert R. Lukin, MD1996-97 Burton P. Drayer, MD1997-98 Richard E. Latchaw, MD1998-99 A. James Barkovich, MD1999-00 Eric J. Russell, MD, FACR2000-01 William S. Ball, Jr., MD2001-02 William P. Dillon, MD2002-03 Patrick A. Turski, MDFOUNDING MEMBERSNorman E. Chase, MDGiovanni Di Chiro, MD*William N. Hanafee, MDFred J. Hodges, III, MDColin B. Holman, MDNorman E. Leeds, MDEugene V. Leslie, MDDonald L. McRae, MD*Thomas H. Newton, MDHarold O. Peterson, MD*D. Gordon Potts, MDMannie M. Schechter, MD*Juan M. Taveras, MD*Ernest H. Wood, MD**deceasedJune 7 – 11, <strong>2004</strong><strong>ASNR</strong> 42nd Annual MeetingXXV
<strong>ASNR</strong> 42nd Annual Meeting Seattle, WashingtonPast <strong>ASNR</strong> Annual MeetingsPAST MEETINGSOrganizational MeetingMay 19, 1962Keene’s English ChophouseNew YorkSecond Business MeetingOctober 5, 1962Shoreham HotelWashington, DCFirst Annual MeetingOctober 7, 1963Queen Elizabeth HotelMontrealSecond Annual MeetingSeptember 23, 1964Waldorf AstoriaNew YorkThird Annual MeetingJune 11, 1965Dennis HotelAtlantic CityFourth Annual MeetingJune 15-16, 1966Sheraton-Park HotelWashington, DCFifth Annual MeetingMay 15, 1967Columbia UniversityNew YorkSixth Annual MeetingSeptember 27-28, 1968Jung HotelNew OrleansSeventh Annual MeetingMay 13-19, 1969Joint Meeting with American Association ofNeurological SurgeonsSheraton-Cleveland HotelClevelandEighth Annual MeetingFebruary 12-13, 1970Washington HiltonWashingtonNinth Annual MeetingMay 27-29, 1971Fairmont HotelSan FranciscoTenth Annual MeetingFebruary 21-24, 1972Maria-lsabel SheratonMexico CityEleventh Annual MeetingMay 26-28, 1973Statler HiltonBostonTwelfth Annual MeetingMarch 14, 1974(In conjunction with X Symposium Neuroradiologicum)Convention CenterPunta del Este, UruguayThirteenth Annual MeetingJune 3-7, 1975Bayshore InnVancouverFourteenth Annual MeetingMay 18-22, 1976Peachtree PlazaAtlantaFifteenth Annual MeetingMarch 27-31, 1977Hamilton Princess HotelBermudaSixteenth Annual MeetingFebruary 26-March 2, 1978Hyatt RegencyNew OrleansSeventeenth Annual MeetingMay 20-24, 1979Hotel TorontoTorontoEighteenth Annual MeetingMarch 16-21, 1980Century PlazaLos AngelesNineteenth Annual MeetingMay 5-9, 1981Marriott HotelChicagoTwentieth Annual MeetingOctober 10-16, 1982(In conjunction with XII Symposium Neuroradiologicum)Washington HiltonWashington, DCTwenty-First Annual MeetingJune 5-9, 1983St. Francis HotelSan Francisco<strong>ASNR</strong> <strong>2004</strong>XXVI
Past <strong>ASNR</strong> Annual Meetings (continued)PAST MEETINGSTwenty-Second Annual MeetingJune 2-7, 1984Westin Copley Place HotelBostonTwenty-Third Annual MeetingFebruary 18-23, 1985Marriott HotelNew OrleansTwenty-Fourth Annual MeetingJanuary 19-23, 1986Sheraton Harbor Island HotelSan DiegoTwenty-Fifth Annual Meeting(Silver Anniversary)May 10-15, 1987New York HiltonNew YorkTwenty-Sixth Annual MeetingMay 15-20, 1988Chicago Hilton & TowersChicagoTwenty-Seventh Annual MeetingMarch 19-24, 1989The Peabody OrlandoOrlandoTwenty-Eighth Annual MeetingMarch 19-23, 1990Century Plaza Hotel & TowerLos AngelesTwenty-Ninth Annual MeetingJune 9-14, 1991The Washington Hilton and TowersWashington, DCThirtieth Annual MeetingMay 31-June 5, 1992Adam’s MarkSt. LouisThirty-First Annual MeetingMay 17-20, 1993Vancouver Trade and Convention CentreVancouverThirty-Second Annual MeetingMay 3-7, 1994Opryland Hotel and Conference CenterNashvilleThirty-Third Annual MeetingMay 23-27, 1995Sheraton Chicago Hotel and TowersChicagoThirty-Fourth Annual MeetingJune 23-27, 1996Washington State Convention & Trade CenterSeattleThirty-Fifth Annual MeetingMay 18-22, 1997Metro Toronto Convention CentreTorontoThirty-Sixth Annual MeetingMay 17-21, 1998(In conjunction with XVI Symposium Neuroradiologicum)Pennsylvania Convention CenterPhiladelphiaThirty-Seventh Annual MeetingMay 23-28, 1999San Diego Convention CenterSan DiegoThirty-Eighth Annual MeetingApril 4-8, 2000Hyatt Regency AtlantaAtlantaThirty-Ninth Annual MeetingApril 23-27, 2001Hynes Convention CenterBostonFortieth Annual MeetingMay 13-17, 2002Vancouver Convention & Exhibition CentreVancouverForty-First Annual MeetingApril 28 – May 2, 2003Marriott Wardman Park HotelWashington, DCJune 7 – 11, <strong>2004</strong><strong>ASNR</strong> 42nd Annual MeetingXXVII
Awards and Honors<strong>2004</strong> <strong>ASNR</strong> Gold Medal AwardsAWARDS & HONORSThe Gold Medal fosters the highest standards of the American Society of Neuroradiology, basedon exceptional quality, service, and excellence, and not necessarily on fame. It emphasizes bothprofessional and personal attributes… individuals who are superb neuroradiologists, clinicians, orscientists, and truly outstanding. The recipients are individuals who have extended themselvesbeyond furthering their own careers through contributions at all levels of professional strata, withan accent on consistency and duration of these outstanding contributions.<strong>ASNR</strong> 42nd Annual Meeting Seattle, WashingtonDr. Ralph Heinz MD, FACRDr. Heinz was born inCleveland, Ohio in 1929, andgrew up in Charleston, WestVirginia. He was an All Statebasketball center in highschool, played at West VirginiaUniversity just before JerryWest, and played professionallyfor several years (not NBA). Hegraduated from the Universityof Pennsylvania in 1955, andafter practicing internal medicine and general surgery inthe U.S. Public Health Services (USPHS), trained inradiology at the Philadelphia General Hospital, thenmoved to the Neurological Institute as one of the firstNational Institute of Health (NIH) sponsored specialfellows with Dr. Taveras.In 1964, Dr. Heinz introduced neuroradiology and“special procedures” to the Southeast United Stateswhen he moved to Emory University in Atlanta. At thistime radiologists in the U.S. did the fluoroscopy inmyelograms for the neurosurgeons but did not do anyprocedures, as we know them today. He performed andtaught all types of general angiography, as well asneuroradiologic procedures. Realizing the inadequacyof the standard retrograde brachial angiograms forposterior fossa diagnosis of aneurysms and otherpathology, Dr. Heinz began to catheterize the brachialartery for vertebral angiography, which gave much moredetail. As soon as this was accepted, he began to usefemoral catheterization to reach all the brachiocephalicbranches to replace the standard method of the period,which was direct carotid puncture in the neck. Over thenext few years, he taught many other neuroradiologiststo use this method.In 1965, he was appointed Member, NINCDS/NIHNeurological Science Research and Training Committee(1965-1969) taking Dr. Taveras’ place in pushingneuroradiology ahead at the national level. Later, he<strong>ASNR</strong> <strong>2004</strong>served a second term (1975-79) with the NIH. In eachof these periods, he was involved with the financing andawarding of sponsored training programs inneuroradiology at major universities throughout theUnited States. At Emory, he was successful in obtainingone of the first NIH sponsored neuroradiologicprograms in the United States (1965).Dr. Heinz moved to Yale University in 1967. There heworked on the development of non-thrombogeniccatheters to reduce clotting complications. A number ofpublications discussed the pathology, and thepathophysiology of Normal Pressure Hydrocephalus(NPH). Beginning in 1967, in an attempt to developsuperior “painless” gas myelography, and in an attemptto salvage sub-dural injections in lumbarpneumoencephalography, Dr. Heinz developed thelateral C1-2 puncture, which was then used extensivelyby neuroradiologists.In 1969, Dr. Heinz moved to University of Pittsburgh asChairman. In Pittsburgh, a strong neuroradiologic teamdeveloped, including Drs. Drayer, Kerber, Rosenbaum,Dubois, Bank, Horton and Maravilla. At the same time,basic investigation in what was then called “electronicimaging” ensued. In 1971, the first “InternationalSymposium of Electronic Imaging” took place at theUniversity of Pittsburgh. These were the first efforts touse the amplifier, with its enormously increasedefficiency in photo utilization, for permanent recordingrather than just for fluoroscopy. This methodology isused every day in angiography, and in other aspects ofmodern radiology.Moving to Duke in 1978, with Drs. Drayer and Dubois,a new neuroradiology section was formed. Work on3D reformations of the carotid artery, and a series ofinvestigations into the diagnosis of hippocampalsclerosis (1985), pathology, outcomes afterlobectomy, and PET applications followed. In 1984,the textbook “Neuroradiology” as a part of the 5volume series in “Clinical Neurosciences” waspublished. In addition, Dr. Heinz has published 133scientific papers, and 32 book chapters.None of these accomplishments could have happenedwithout the support of family, wife, Ann, and children, Tad,Christopher, Dana, and Lindsey. Dr. Heinz continues towork and teach at Duke.XXVIII
Awards and Honors<strong>2004</strong> <strong>ASNR</strong> Gold Medal Awards (continued)AWARDS & HONORSStephen A. Kieffer, MD, FACRStephen Kieffer was born inMinneapolis in 1935, andeducated in the publicschools of St. Paul. Followingundergraduate and medicalstudies at the University ofMinnesota and a rotatinginternship at the VA Center inWest Los Angeles (1959-60),he returned to Minneapolis toenter residency training in radiology. His residency wasinterrupted in 1962 by the Berlin wall crisis, and heserved as chief of radiology at U.S. Army hospitals inFort Polk, Louisiana, and Fort Harrison, Indiana.Resuming his residency at the University of Minnesota in1964, Steve worked closely with Kurt Amplatz learningthe technique of percutaneous transfemoral “fourvessel” angiography. A rotation with Harold O.Peterson, pioneer neuroradiologist and chair of thedepartment, sealed his interest in neuroradiology. InJanuary 1966, he became the second NIH sponsoredfellow in neuroradiology at Minnesota, and was named aJames Picker Foundation Scholar in RadiologicalResearch. His research into the aging of theintervertebral disk as visualized on postmortemdiskography with gross and microscopic anatomiccorrelation was presented to the American Society ofNeuroradiology in 1967; he was elected to membershipin the Society at that meeting.In 1967, Dr. Kieffer joined the faculty of the Departmentof Radiology at Minnesota, and in 1968, he assumedthe directorship of radiology at the Minneapolis VAHospital. For the next six years, he continued to teachand do research at both the VA and the UniversityHospitals. Working with his chair and mentor HaroldPeterson, Steve explored the applications of largevolume Pantopaque Myelography in the evaluation ofcongenital abnormalities of the spine, degenerative diskdisease and intrathecal metastases. His study of thenormal scinticisternogram using radioactive labeledalbumin was selected as the outstanding paper at the1970 <strong>ASNR</strong> meeting. A textbook by Drs. Peterson andKieffer, “Introduction to Neuroradiology”, was publishedin 1972 and was well received.During the late sixties and well into the seventies, the<strong>ASNR</strong> was a relatively small and closely-knit alliance ofenthusiastic clinical researchers and teachers whorapidly expanded the body of neuroradiologicalknowledge and applications. In 1971, at the request of<strong>ASNR</strong> President Norman Chase, Steve headed acommittee that created the Cornelius G. Dyke MemorialAward, annually recognizing the outstanding originalresearch paper presented by a young neuroradiologist.In 1974, he left Minnesota to become Chair of Radiologyat the State University of New York Upstate MedicalUniversity in Syracuse, a position he held through 1998.Working with a remarkable faculty, including Drs. E.Robert Heitzman and John G. McAfee, he encouragedthe department’s clinical, educational and researchproductivity. A neuroradiology fellowship program wasestablished with the aid of Eugene Binet. When watersolubleagents were developed for myelography, theSyracuse group participated in their early clinicalevaluation. Application of computed tomographywithout and with intrathecal contrast to the diagnosis ofdiseases of the spine and spinal cord became a majorclinical research thrust. “An Atlas of Cross-SectionalAnatomy”, compiled by the State University of New York,Syracuse radiologists and coedited by Drs. Kieffer andHeitzman, was published in 1979.As President of the <strong>ASNR</strong> in 1978-79, Steve’s majoreffort was to move forward on a proposal by SamuelWolpert that the Society consider establishing its ownjournal. At the 1979 Annual Meeting, the membersapproved the recommendation of a committee headedby Norman Leeds that the <strong>ASNR</strong> had the size andmaturity necessary to pursue this challenge. TheAmerican Journal of Neuroradiology began publicationin January 1980, with Juan Taveras as Editor. In theensuing 24 years, under the leadership of Drs. Taveras,Michael Huckman and Robert Quencer, the AJNR hasgreatly advanced the field of Neuroradiology.Dr. Kieffer was a founding member of the EasternNeuroradiological Society and served as its President in1991-92. The ENRS has established an annual awardin his name for the best paper by a neuroradiologyfellow. He also served as President of the New YorkState Radiological Society (1987-88) and as <strong>ASNR</strong>Councilor to the American College of Radiology (1986-92). He currently co-chairs the College’s Guidelinesand Standards Committee for Neuroradiology and MR.He headed the <strong>ASNR</strong>’s Clinical Outcomes ResearchSubcommittee in the mid 90’s, and remains active in the<strong>ASNR</strong>’s Evidence Based Medicine and Guidelines andStandards Subcommittees.When Sadek Hilal was selected as President of the16th Symposium Neuroradiologicum, he invited Steveto serve as Vice President. When Dr. Hilal becameseriously ill in 1994, Steve assumed responsibility fororganizing the Symposium, ably supported by MichaelHuckman and R. Nick Bryan, and by the <strong>ASNR</strong> staff andExecutive Committee. Over 1,600 neuroradiologistsattended the Symposium in May 1998 in Philadelphia, intandem with the <strong>ASNR</strong>’s Annual Meeting.XXIXJune 7 – 11, <strong>2004</strong><strong>ASNR</strong> 42nd Annual Meeting
<strong>ASNR</strong> 42nd Annual Meeting Seattle, WashingtonAwards and Honors<strong>2004</strong> <strong>ASNR</strong> Gold Medal Awards (continued)AWARDS & HONORSStepping down from the Radiology Chair at StateUniversity of New York Upstate Medical University after24 years, Steve undertook a very rewardingminisabbatical in neuroradiology with RobertGrossman, David Yousem and Laurie Loevner at theUniversity of Pennsylvania to update his diagnosticskills. He then returned to the full time clinical practiceand teaching of neuroradiology, first in Syracuse withJack Chang and, since early in 2001, with CharlesTruwit at the University of Minnesota, where he ispresently Professor of Radiology and Director of theNeuroradiology Fellowship Program. He greatlyenjoys being challenged by both the inquiring minds ofhis students and the increasing wonders of his field.Past <strong>ASNR</strong> Gold Medal Award Recipients1995Juan M. Taveras, MD*T. Hans Newton, MD1996Sadek K. Hilal, MD*Giovanni Di Chiro, MD*1997Derek C. Harwood-Nash, MB, ChB.,DSc, FRCPC, FACR, RCRAD(SA)*1998Irvin I. Kricheff, MDD. Gordon Potts, MD1999Grant B. Hieshima, MDMichael S. Huckman, MDTo date, Dr. Kieffer has participated in more than ninetyoriginal scientific publications, twenty-three chapters intextbooks, and two books. He has presented numerouslectureships and participated in many national andinternational refresher and postgraduate courses.Steve and his wife Cyrile have been married forty-fiveyears and have four children, Alisa, Mitchell, Stuart andPaula. They enjoy biking on the trails of their beautifulcity and are happy to be living close to Mitchell, his wife,Valeria and their granddaughters, Sophia and Luiza.2000Hillier L. “Bud” Baker, Jr., MD2001O. Wayne Houser, MDJ. Arliss Pollock, MD2002R. Thomas Bergeron, MDDavid O. Davis, MD2003Norman E. Leeds, MD, FACRAnne G. Osborn, MD, FACR*deceased<strong>ASNR</strong> <strong>2004</strong>XXX
Awards and Honors<strong>2004</strong> <strong>ASNR</strong> Honorary MemberAWARDS & HONORSDennis Le Bihan, MD, PhDDr. Le Bihan, a neuroradiologistand a physicist, graduatedfrom the University of Paris.At the completion of histraining he spent seven yearsat NIH in Bethesda, Maryland.He also spent several yearsat Georgetown University,Washington D.C., as a clinicalprofessor in neuroradiology.He is currently the Director ofthe Research Institute on Functional and AnatomicalNeuroimaging in Orsay, France, and a member of theFrench Academy of Sciences. Dr. Le Bihan has madeoutstanding contributions to the development andclinical applications of new MRI methods allowing toimage human brain function. In particular, he has beeninternationally well-recognized and frequently emulatedPast <strong>ASNR</strong> Honorary Member Recipientsfor his pioneering work on diffusion MRI which is todayused worldwide both for research and clinicalapplications. Diffusion MRI has become an exquisiteapproach to study normal and diseased brain anatomyand function, especially in acute brain ischemia, andwhite matter and connectivity disorders.Dr. Le Bihan has also significantly contributed to thefield of functional MRI, both methodologically andclinically. For his contributions, Dr. Le Bihan wasawarded the Gold Medal of the International Society forMagnetic Resonance in Medicine in 2001, theprestigious Lounsbery Award from the National (U.S.)and French Academies of Sciences in 2002 and theLouis D. Foundation Award from the Institut de Francein 2003. Dr. Le Bihan has authored or co-authored morethan 200 publications. He is very much in demand as aspeaker at international conferences and has served onthe Board of many prestigious institutions, radiologicalsocieties and journals.June 7 – 11, <strong>2004</strong>Torsten Almen, MDJames W. Bull, MDGraeme M. Bydder, MD, ChBM. Paul Capp, MDSten Cronqvist, MDB. G. Ziedses des Plantes, MDGeorge du Boulay, MDRichard R. Ernst, MDTorgny V. B. Greitz, MDGodfrey N. Hounsfield, PhDYun Peng Huang, MDIan Isherwood, MDPierre Lasjaunias, MD, PhDMarco Leonardi, MDErik LindgrenClaude H. Manelfe, MDJoseph Ransohoff, MD*Jesus Rodriguez-Carbajal, MDLee F. Rogers, MDProf. Lucy Balian RorkeMichael Radford Sage, MD, FRANZCR, FRCR,FRCPC (Lon), FRCPC (Ed), FHKCR (Hon)George SchuylerS. I. Seldinger, MDFjodor Serbinenko, MDMutsumasa Takahashi, MDMichel Ter Pogossian, MDGaldino E. Valvassori, MDMarjo S. van der Knaap, MDProf. Jacqueline VignaudM. Gazi Yasargil, MDIan R. Young, BSc, PhDPaul C. Lauterbur, PhD*deceased<strong>ASNR</strong> 42nd Annual MeetingXXXI
Awards and Honors<strong>ASNR</strong> 2003 Outstanding Presentation AwardsAWARDS & HONORS<strong>ASNR</strong> is pleased to announce the winners of the Outstanding Presentation Awards given annually to the toppaper or poster presentation from the prior Annual Meeting in general neuroradiology and the fourneuroradiology specialities. A $1,000 award was given to each winner.<strong>ASNR</strong> 42nd Annual Meeting Seattle, WashingtonGeneral Neuroradiology“Superiority of PROPELLER FSE over ConventionalFSE for Eight-Channel Phased-Array Brain Imaging inClinical Practice”L. N. Tanenbaum 1 , J. Pipe 2 , A. Gaddapati 3 ,M. Hartley 3 , J. Debbins 3 , N. Eshkar 11New Jersey Neuroscience Institute – EIA, Edison, NJ;2Barrow Neurological Institute, Phoenix, AZ;3GE Medical Systems, Waukesha, WIBerlex Best Paper Award in GeneralNeuroradiology“Initial Experience with Diffusion and PerfusionMR Imaging in Patients Undergoing IntraarterialThrombolysis”P. W. Schaefer, L. Roccatagliata, C. J. Ledezma,L. Schwamm, R. G. GonzalezMassachusetts General Hospital, Boston, MAHead and Neck Radiology“Positional Vertebrobasilar Ischemia: Pathogenesisand Diagnosis”D. W. Morton 1 , W. A. Cohen 2 , D. W. Newell 2 ,R. Goodkin 3 , M. Vilela 1 , C. Douville 21University of Washington Medical Center, Seattle, WA;2Harborview Medical Center, Seattle, WA; 3 SeattleVeteran’s Administration Puget Sound Health CareSystem, Seattle, WAInterventional Neuroradiology(The Michael Brothers Memorial Award)“Concentric MERCI Retriever for the Treatment ofNeurovascular Thrombotic Occlusions: A Phase INonrandomized Trial”G. R. Duckwiler, MERCI Phase I Trial ParticipantsUniversity of California Los Angeles School ofMedicine, Los Angeles, CAPediatric Neuroradiology(The Derek C. Harwood-Nash Award)“Changes in Ethical Issues Based on EvolvingExperience of In Utero MR Imaging for Fetal CNSAbnormalities”P. D. Griffiths, E. H. Whitby, I. D. Wilkinson,M. N. J. PaleyUniversity of Sheffield, Sheffield, United KingdomSpine Radiology“Thoracic Intervertebral Disks: In VivoCharacterization of Intradiskal Pressure in HealthyVolunteers During Various Maneuvers”K. P. Schellhas 1 , D. J. Polga 2 , K. B. Wood 2 ,G. R. Buttermann 3 , B. P. Beaubien 4 , P. M. Kallemeier 21Center for Diagnostic Imaging, St. Louis Park, MN;2University of Minnesota, Minneapolis, MN; 3 MidwestSpine Institute, Stillwater, MN; 4 Midwest OrthopaedicResearch Foundation and Minneapolis MedicalResearch Foundation, Minneapolis, MNXXXII<strong>ASNR</strong> <strong>2004</strong>
Awards and Honors2003 Regional Society AwardsAWARDS & HONORSThe American Society of Neuroradiology is pleased to announce the recipients of the 2003 Regional SocietyAwards. These individuals were selected by the respective regional societies as having the best presentation ateach society’s 2003 Annual Meeting.Eastern Neuroradiological Society (ENRS)(The Norman E. Leeds Award)“Molecular Imaging and Neuroradiology”Dawid Schellingerhout, MBChBMassachusetts General Hospital,Boston, MassachusettsSoutheastern Neuroradiological Society(SENRS)“Diffusion Tensor Imaging Analysis of Tract Involvementof Diffuse Brainstem Gliomas in Children withNeurological Correlation”K. J. Helton, N. Phillips, R. B. Khan, F. A. Boop,R.A. Sanford, P. Zou, J. Langston, R. OggSt. Jude Children’s Research Hospital,Memphis, TennesseeWestern Neuroradiological Society (WNRS)(The Gabriel H. Wilson Award)“Assessment of the Reproducibility of Post-ProcessingDynamic Computed Tomography Perfusion (CTP)Data: Impact of the Optimization of Post-EnhancementImage Selection”David J. Fiorella, MD, PhDBarrow Neurological Institute, Phoenix, ArizonaJune 7 – 11, <strong>2004</strong>The Neuroradiology Education and Research (NER) Foundation Award forOutstanding Contributions in ResearchThis newly created award, in recognition ofconsistent excellence and lifelongaccomplishment in basic or clinicalneuroscience research, is given to an<strong>ASNR</strong> senior member over the age of 50 recognized inthe neuroradiology field for distinguished long termachievement in basic or clinical research.The recipient of the award is:Robert I. Grossman, MDNew York University Medical Center,New York, New YorkRobert I. Grossman, MDRobert I. Grossman is recognizedworldwide for his contributions toradiology research. He has lecturedextensively and is the recipient ofmany awards and honors. In 1999,he received the Javits NeuroscienceInvestigator Award for his work onmultiple sclerosis, one of only tenscientists in the country to receivethe award.A charter member and Chairman of the DiagnosticRadiology Study Section at National Institutes of Health(NIH), Dr. Grossman has recently been appointed toserve as a member of the National Advisory Council forBiomedical Imaging and Bioengineering which providesrecommendations on the conduct and support ofbiomedical imaging, bioengineering research andresearch training.He is the author of over 300 publications andcoauthor of four books including the respectedtextbook, Neuroradiology: The Requisites. Hecurrently serves as a Senior Editor of the AmericanJournal of Neuroradiology. associate editor ofMagnetic Resonance in Medicine and Yearbook ofOphthalmology, and is on the editorial boards ofseveral scientific journals.He has held many leadership roles at the <strong>ASNR</strong>, wasrecently elected Vice President, and will assume thepresidency in May, 2006.<strong>ASNR</strong> 42nd Annual MeetingXXXIII
Seattle, WashingtonAwards and Honors<strong>2004</strong>-2005 Berlex/NER Foundation Fellowship in Basic Science Research Award(Formerly known as the Berlex/<strong>ASNR</strong> Fellowship in Basic Science Research Award)AWARDS & HONORSThis fellowship, first awarded in 1986, was created bythe <strong>ASNR</strong> with the support of Berlex Laboratories tostimulate the scientific development of promising youngmen and women, and to aid them in embarking on acareer in academic radiology. It is specifically designedto provide educational opportunities for youngradiologists who are not yet professionally established inthe radiologic sciences to gain further insight intoscientific investigation, and to develop competence inresearch. These fellowships are jointly sponsored byBerlex Laboratories, Inc. and the NeuroradiologyEducation and Research (NER) Foundation of theAmerican Society of Neuroradiology.The recipients of the <strong>2004</strong>-05 fellowships are:Tuong Huu Le, MD, PhDUniversity of California, San Francisco“Structural and Functional Correlates of AxonalShearing in Traumatic Brain Injury: A Combined DTI,fMRI and MSI Study”Whitney B. Pope, MD, PhDDavid Geffen School of Medicine at University ofCalifornia, Los Angeles“Identification of Unstable Atheroscelerotic Plaque atthe Carotid Bisfurcation Using High-Resolution CT-PET Imaging: Correlation to Histopathology andPatient Symptoms”Past Berlex/NER Foundation Fellowship in Basic Science Research Award1986-87Jeremy B. Rubin, MD,Stanford University Medical Center“New Methods Using MRI to Assess VentricularShunt Function and Measure IntravenousPressure Non-invasively in Patients with VentricularShunt Catheters”1987-88No Award1988-89Apichai Jarenwattananon, MD,University of Wisconsin Medical Center“In-Vivo Sodium MRI (Na-MRI) in Canine Model ofStatus Epilepticus”Warren A. Stringer, MD,Loma Linda University Medical Center“Evaluation of the Relationships Between CerebralPerfusion, Ventilation, and Intracranial Pressure byXenon-enhanced Computed Tomography in Childrenwith Cerebral Edema”1989-90Todd Lempert, MD,University of California at San Francisco“Evaluation of the Healing Response to ThrombogenicCoil Occlusion of Experimental Aneurysms”1990-91Lori L. Baker, MD,Stanford University Medical Center“Evaluation of MR Diffusion Imaging Versus MagneticSusceptibility Enhanced Mapping of Perfusion Pool inRegional Cerebral Ischemia”Lee H. Monsein, MD,The Johns Hopkins University School of Medicine“Primate Model of Reversible RegionalCerebral Ischemia”1991-92Steven N. Breiter, MD, The Johns Hopkins Hospital“Proton MRS in the Determination of Lactic AcidConcentration in Seizures, Both Human and Animal”Frank J. Lexa, VII, MD, University of Pennsylvania“MRI Demonstration of Axonal Transport in theMammalian CNS”1992-93Michael A. Kraut, MD, PhD,The Johns Hopkins Hospital“Lactate Production and Metabolism inCerebral Activation”Brian W. Chong, MD,University of California at San Diego“A Search for Hidden MRI Flow Patterns inHuman Cranial Vessels”<strong>ASNR</strong> <strong>2004</strong>XXXIV
Awards and HonorsPast Berlex/NER Foundation Fellowship in Basic Science Research Award (Continued)AWARDS & HONORSThomas E. Conturo, MD, PhD,1993-94The Johns Hopkins Hospital andJohns Hopkins University“Mechanisms of the Phase Enhancement Effects ofBolus-Injected Paramagnetic Contrast Agents andApplications in Quantitative Cerebral Blood Volumeand Flow Imaging”John P. Karis, MD, Barrow Neurological Institute“Epilepsy Localization: Advanced High ResolutionMRI-PET FDG Correlation”1994-95Jerry Burke, MD, Bowman Gray School of Medicine“Serial Positron Emission Tomography and FunctionalMR Imaging of Stroke”Robert Fulbright, MD,Yale University School of Medicine“Functional MR Imaging of the Spine”1995-96Norman J. Beauchamp, MD,The Johns Hopkins Hospital“The Natural History of ‘Areas of Risk of Infarction’ asDefined by Perfusion MRI and MR Spectroscopy”Anthony Masaryk, MD,University of Wisconsin-Madison“Analysis of Aneurysm Hemodynamics UsingMRI/MRA Morphology and Flow MeasurementsCorrelated with Hemodynamic Numerical Analysisand Simulation”1996-97Joseph T. Lurito, MD, PhD,The Johns Hopkins Hospital“Functional MRI and Electrophysiologic Correlates ofSub-modality Specific Somatosensory Activation”Jeffrey L. Sunshine, MD,University Hospitals of Cleveland“Early Identification of Ischemic Penumbra byDiffusion and Perfusion MR in Acute Stroke”1997-98Huy M. Do, MD,University of Virginia Health Sciences Center“The Neuroprotective Effect of IntraarterialNerve Growth Factor (HGF) in a Rabbit EmbolicStroke Model”1998-99William F. Marx, MD, University of Virginia“Endovascular Treatment of Experimental AneurysmsUsing Biologically Modified Embolic Coils: Promotionof Permanent Occlusion via Intra-aneurysmalFibroblast Delivery”1999-00Kevin R. Moore, MD,Univeristy of Utah Center for Advanced MedicalTechnology“Meg-Constrained High-Resolution Surface-Coil MRImaging and MR Spectroscopy for EvaluatingMedically Refractory Epilepsy”John G. Short, MD, University of Virginia“Induction of Spinal Interbody Fusion Using GeneTherapy Tissue Engineering Techniques”2000-01John Port, MD, PhD,The Johns Hopkins Medical Institution“Imaging Selective Attention Mechanisms”Eric Schwartz, MD,Hospital of the University of Pennsylvania“Diffusion-based MR Imaging in a Rat Spinal CordFollowing Injury and Transplantation”2001-02Pratik Mukherjee, MD, PhD,Mallinckrodt Institute of Radiology,Washington University School of Medicine“Comparison of Magnetic Resonance Imaging andPositron Emission Tomography in the Study ofCerebral Hemodynamics”2002-03John G. Dalle, DO,University of Utah School of Medicine“Polymer-Chelate Conjugates for DiagnosticCancer Imaging”Christopher Lascola, MD, PhD,Duke University Medical Center“Magnetic Resonance Imaging of SpreadingDepression-Induced Reactive Gliosis in Mice”2003-04Dheeraj Gandhi, MD,University of Michigan Health System“Can the Choline/Creatine Ratio Predict EarlyTreatment Response of Head and Neck SquamousCell Carcinma Treated with Radiation Therapy in anAnimal Model: A Prospective Study”Susan M. Kealey, MD,Duke University Medical Center“Correlation of MR Permeability Measurements withHistologic Markers of Angiogenesis in Rodent High-Grade Brain Tumors Before and After Treatment withAntiangiogenesis Agent PTK 787”June 7 – 11, <strong>2004</strong><strong>ASNR</strong> 42nd Annual MeetingXXXV
Awards and HonorsNeuroradiology and Education Research (NER) Foundation Scholar Award inNeuroradiology Research* (* Formerly known as the <strong>ASNR</strong> Foundation Award in Neuroradiology Research)AWARDS & HONORSSince 1995, the NER Foundation has been in the processof raising funds to support neuroradiology research. Thisis one of the most important goals of the NER Foundation,and of the <strong>ASNR</strong> as the premier organization forneuroradiology. This award was created for younginvestigators in the early stages of their careers, toenhance their competency in areas important to the futureof neuroradiology, including health services research,physiological imaging and interventional neuroradiology. Italso affords the Foundation the opportunity to begin todevelop leadership in these areas.The recipient of the <strong>2004</strong> scholar award is:Pratik Mukherjee, MD, PhDUniversity of California, San Francisco“Diffusion Tensor MR Imaging and QuantitativeTractography of Brain Development in PrematureNewborns”<strong>ASNR</strong> 42nd Annual Meeting Seattle, WashingtonPast NER Foundation Scholar Award in Neuroradiology Research Recipients1999L. Santiago Medina, MD, MPHChildren’s Hospital Medical Center, Cincinnati, OH“The Role and Cost-Effectiveness of Imaging inNewborns with Suspected Occult Spinal Dysraphism”2000Melanie B. Fukui, MDUniversity of Pittsburgh Medical Center, Pittsburgh, PA“Carotid Stenosis Evaluation: Cost-Effectiveness ofComputed Tomographic Angiography vs. MagneticResonance Angiography”2001Soonmee Cha, MDNew York University Medical Center, New York, NY“Dynamic Contrast Enhanced T2*-weighted MRI andHistopathological Assessment of Experimental Glioma”<strong>2004</strong> NER Foundation/Boston Scientific (formerly Target Therapeutics, Inc.) Fellowship inCerebrovascular Disease ResearchEstablished in 2002, this fellowship expanded eligibilityto allow both Neuroradiology fellows and all faculty atthe Assistant Professor level to apply. It was created toprovide an opportunity for a young neuroradiologist topursue research in a topic that will advance thediagnosis and treatment of cerebrovascular disease,and is supported by Boston Scientific.2002James D. Eastwood, MDDuke University Medical Center, Durham, NC“CT Perfusion Imaging in Subarachnoid HemorrhageRelated Vasospasm”2003Steven G. Imbesi, MDUniversity of California, San Diego Medical Center“Alteration of Intracranial Aneurysm Flow Dynamics:Development and Evaluation of PotentialNeurointerventional Endovascular TreatmentRegimens of Wide Necked Aneurysms”The recipient of the <strong>2004</strong> fellowship is:Timothy J. Kaufmann, MDMayo Clinic and Foundation, Rochester, MN“A Prospective Clinical Trial of 3.0T MR Angiographyin the Follow-Up of Intracranial Aneurysms Treatedwith Endovascualr Coils”XXXVI<strong>ASNR</strong> <strong>2004</strong>
Awards and Honors<strong>2004</strong> <strong>ASNR</strong> Cornelius G. Dyke Memorial AwardAWARDS & HONORSThis award was established to honor Cornelius G. Dyke, one of the pioneers in neuroradiology, and is given to atrainee or junior faculty member in neuradiology for excellence as demonstrated in a paper, which representsoriginal, unpublished research in some aspect of neuroradiology.Eric D. Schwartz, MDDr. Eric D. Schwartz graduatedfrom Dartmouth College in1991 with a Bachelor of Artsdegree in History. Hegraduated from Johns HopkinsSchool of Medicine in 1995and went on to a DiagnosticRadiology residency at theUniversity of Miami, where hewas chief resident andreceived the RSNA Roentgen Resident Research Award.He completed his Neuroradiogy fellowship in 2001 at theUniversity of Pennsylvania where he has continued and iscurrently an Assistant Professor.He was granted the 2000-2001 <strong>ASNR</strong>/Berlex BasicScience Fellowship for the study of high-resolutiondiffusion imaging of experimental spinal cord injury, andhe currently has an NIH K-award in the same subject.The recipient of the <strong>2004</strong> Cornelius G. Dyke award is:Eric D. Schwartz, MDHospital of the University of Pennsylvania,Philadelphia, PA“Apparent Diffusion Coefficients Within Spinal CordTransplants and Surrounding White Matter CorrelateWith Degree of Axonal Dieback Following Injury”June 7 – 11, <strong>2004</strong>Past <strong>ASNR</strong> Cornelius G. Dyke Memorial Award Recipients1972George M. McCord, MD“The Venous Drainage to The Inferior Sagittal Sinus”1973Barton Lane, MD“Cerebrospinal Fluid Pulsations at Myelography:A Video-Densitometric Study”1974Jacques Theron, MD“Anatomical-Radiological Correlates of the AnteriorChoroidal Artery”1975Thomas P. Naidich, MD“The Normal Anterior Inferior Cerebellar Artery”1976No Award1977Burton P. Drayer, MD“The Capacity for CT Diagnosis of Cerebral Infarction.An Experimental Study in the Non-Human Primate”1978Joseph A. Horton, MD“The Grain in the Stone: A Computer Search forHidden CT Patterns”1979Dieter R. Enzmann, MD“Experimental Brain Abscess Evolution Studied withthe CT Scan and Neuropathological Correlation”1980No Award1981A. Ronald Cowley, MD“The Influence of Fiber Tracts on the CTAppearance of Cerebral Edema: An AnatomicalPathological Correlation”1982B. Ludwig, MD“Postmortem CT and Autopsy in PerinatalIntracranial Hemorrhage”<strong>ASNR</strong> 42nd Annual MeetingXXXVII
<strong>ASNR</strong> 42nd Annual Meeting Seattle, WashingtonAwards and HonorsPast <strong>ASNR</strong> Cornelius G. Dyke Memorial Award Recipients (continued)1983No Award1984Val M. Runge, MD“Contrast Enhanced Magnetic Resonance Evaluationof a Brain Abscess Model“1985No Award1986Jeremy B. Rubin, MD“Part 1 Imaging Spinal CSF Pulsation by2DFT Magnetic Resonance: Significance DuringClinical Imaging”“Part 2 Harmonic Modulation of Proton MRPrecessional Phase by Pulsatile Motion Origin ofSpinal CSF Flow Phenomenon”1987No Award1988Vincent P. Mathews, MD“Gadolinium Enhanced MR Imaging ofExperimental Bacterial Meningitis: Evaluationand Comparison of CT”1989Allen D. Elster, MD“Europium-DTPA: Development and Testingof a Gadolinium Analogue Traceable byFluorescence Microscopy”1990Marvin D. Nelson, Jr, MD“The Search for Human TelencephalicVentriculofungal Arteries”1991Udo P. Schmiedl, MD“Quantitation of Pathological Blood-Brain BarrierPermeability in an Astrocytic Glioma using ContrastEnhanced MR”1992R. Gilberto Gonzalez, MD“Quantitative In Vivo Human Brain Lithium MagneticResonance Spectroscopy”Frank J. Lexa, VII, MD“Wallerian Degeneration in the Feline Visual System:Characterization by Magnetization Transfer Ratewith Histopathologic Correlation”AWARDS & HONORS1993Marc Jouandet, MD“Mapping the Human Cerebral Cortex with Brainprints”1994A. Gregory Sorensen, MD“Functional Magnetic Resonance Imaging of BrainActivity and Perfusion in Patients with ChronicCortical Stroke A”1995John L. Ulmer, MD“Magnetization Transfer or Spin-Lock? AnInvestigation of Off-Resonance Saturation PulseImaging Using Varying Frequency Offsets”1996John C. Strainer, MD“fMRI of Primary Auditory Cortex: An Analysis ofPure Tone Activation and Tone Discrimination”1997Stephen G. Imbesi, MD“Why Do Ulcerated Atherosclerotic Caroid ArteryPlaques Embolize? A Flow Dynamics Study”David F. Kallmes, MD“Guglielmi Detachable Coil Embolization forUnruptured Aneurysms in Neurosurgical Candidates:A Cost Effectiveness Exploration”1998No Award1999Aquilla S. Turk, DO“Definition of Aneurysm Ostium (Neck) andMorphology Using Intravascular Ultrasound:An Experimental Study in Canines”2000William F. Marx, MD“Endovascular Treatment of Experimental AneurysmsUsing Biologically Modified Embolic Devices: Coil-Mediated Intra-Aneurysmal Delivery of FibroblastTissue Allografts”2001No Award2002Mehmet Kocak, MD“Functional MR Imaging of the Motor Homunculus:Towards Optimizing Paradigms for Clinical Scenarios”2003No AwardXXXVIII<strong>ASNR</strong> <strong>2004</strong>
CME/CPDContinuing Medical Education (CME)/Continuing Professional Development (CPD)SCIENTIFIC PROGRAM AND MEETING EVALUATIONThe <strong>2004</strong> Continuing Medical Education (CME)/Continuing Professional Development (CPD) Pavilionallows online recording of CME/CPD credits via theInternet. The improvements have created a faster andmore user-friendly system for evaluating sessions andspeakers and recording CME/CPD hours electronically.The CME/CPD Pavilion is easily accessible in Room613-614 (Level 6). Please complete the evaluations foreach session to assist in planning future meetings and tohelp us maintain accreditation of this and future programs.CME/CPD PAVILIONTo access the CME evaluation program, run the“ExpoCard” included in your registration packet throughthe card reader at one of the terminals and follow thesimple directions for selecting and evaluating thesessions you have attended. The CME/CPD credithours claimed for a session will automatically berecorded in your record when the evaluation for asession is completed. Evaluations can be completed atthe end of a session, during breaks, at the end of the dayor the end of the week. You will be able to view a recordof the sessions you have evaluated and the estimatednumber of CME/CPD credit hours earned throughoutthe program. It will also be possible to printout a copyof your certificate and transcript to take home with you.Please Note: To receive CME/CPD credit forsessions attended at the NER Foundation Symposiumand <strong>ASNR</strong> 42nd Annual Meeting, all evaluations mustbe entered by the end of the meeting. The CME/CPDPavilion replaces the CME/CPD booklet of previousyears and is the only method available for receiving yourCME credit.NEW THIS YEAR – TAKE YOUR OFFICIAL CONTINUINGMEDICAL EDUCATION (CME/CPD) CERTIFICATE HOMEWITH YOU!An enhancement of the Continuing Medical Educationonline evaluation system now allows for attendees toprint out their official CME/CPD certificate for thenumber of hours claimed during the NER FoundationSymposium and <strong>ASNR</strong> 42nd Annual Meeting and takeit with them when they leave. Go to any terminal in theCME/CPD Pavilion and follow the simple directions forprinting out an official NER Foundation Symposium and<strong>ASNR</strong> 42nd Annual Meeting CME/CPD Certificate.Following the meeting, the <strong>ASNR</strong> <strong>2004</strong> CME/CPDCertificate site will be available online for 90 days forattendees to print out their CME/CPD certificates.Please Note: Due to the availability of CME/CPDCertificates online, no certificates will be mailed toattendees this year.LETTER OF ATTENDANCEIf you wish to obtain a Letter of Attendance, pleaserequest one at the Registration Desk located in theSouth Lobby (Level 4) of the Washington StateConvention & Trade Center.AccreditationACCREDITATIONStatementThe American Society of Neuroradiology is accredited by the Accreditation Council for Continuing MedicalEducation (ACCME) to provide continuing medical education for physicians. The American Society ofNeuroradiology takes responsibility for the content, quality, and scientific integrity of this CME/CPD activity.The American Society of Neuroradiology designates this educational activity for a maximum of 33.25 Category 1credits towards the AMA Physician’s Recognition Award. Each physician should claim only those credits that heor she actually spent in the activity.TargetAUDIENCEAudienceThe <strong>ASNR</strong> 42nd Annual Meeting is designed specifically for the practicing general neuroradiologist who wishes tointegrate advanced imaging such as magnetic resonance spectroscopy, diffusion and perfusion imaging, andfunctional magnetic resonance imaging into his/her daily practice. Programming is also focused toward theneuroradiologist who seeks to better understand modern imaging techniques applied to a practice which includesadults or children, disorders of the spine, head and neck disease, and neurovascular intervention.June 7 – 11, <strong>2004</strong><strong>ASNR</strong> 42nd Annual MeetingXXXIX
<strong>ASNR</strong> 42nd Annual Meeting EducationalOBJECTIVESObjectivesAt the conclusion of this meeting, participants will be able to:<strong>ASNR</strong> 42nd Annual Meeting Seattle, Washington▲▲▲▲▲▲▲▲▲▲▲▲▲▲▲▲▲▲▲▲▲Assess the current status of neuroradiological imaging of the head, neck and spine and interventionalimaging in both adult and pediatric populations.Apply state of the art techniques in diffusion imaging, perfusion imaging, MRS, fMRI, and DTI in thetreatment of both adult and pediatric populations.Utilize MRS as one treatment strategy for cerebral tumors in the pediatric patient.Determine management strategy options and increase skills in imaging the patient with a treatedcerebral neoplasm.Discuss current imaging methodologies for head and neck carcinoma in the adult patient.Apply CT, MRI and PET imaging in the management of the previously treated head and neck patient.Identify spinal disorders and degenerative disease in the pediatric population.Utilize MDCT in the evaluation of congenital and neoplastic conditions of the sinonasal cavity.Apply current diagnostic criteria and identify imaging strategies for the treatment of neck masses in thepediatric population.Apply state of the art imaging techniques in the assessment of patients with sensorineural hearing loss.Identify and implement state of the art imaging techniques in the treatment of skull base neoplasms in adults.Demonstrate the basic knowledge of the use of the computer in the practice of Neuroradiology withreference to hardware, operating system and peripherals for both the Macintosh and PC platforms.Assess developmental lesions of the head and neck and determine appropriate imaging strategies.Evaluate the use of higher field strength and new functional imaging techniques in the diagnosis of spinalproblems in the adult population.Compare current treatment modalities in spinal vascular imaging.Discuss recent advances in multidetector CT imaging of the spine.Evaluate interventional procedures for use in management of the disorders and diseases in the adult spine.Assess the role of dynamic and upright MR imaging as an option for diagnosis and treatment of theadult spine.Assess state of the art imaging procedures utilized in the treatment of atherosclerosis.Assess the clinical role of functional mapping utilizing fMRI and MEG imaging.Evaluate new imaging techniques and procedure options for the diagnosis and management of stroke andcerebral aneurysm in the adult population.XL<strong>ASNR</strong> <strong>2004</strong>
ELCElectronic Learning Center <strong>2004</strong> Workshops & LecturesGregory L. Katzman, MD, Chair, ProgramHervey D. Segall, MD, Chair EmeritusRichard M. Berger, MD, Co-Chair, ModeratorsRichard H. Wiggins, III, MD, Co-Chair, Technical & Syllabus EditorELC WorkshopsElectronic Learning Center (ELC) workshops provide the opportunity for participants to learn new electronicmethods in an interactive small group environment. The workshop format allows for hands-on and experientiallearning with computers, software, and knowledgeable assistants. Attendance is limited to 40 participants.NOTE: 2 participants per computerThe <strong>2004</strong> ELC workshops and lectures will update attendees on the use of electronic methods useful for thepracticing neuroradiologist and neuroradiologist-educator. This year’s program will build on the sessions offered atthe 2003 meeting.Workshop registrants will receive a copy of the ELC <strong>2004</strong> Syllabus, an invaluable CD-ROM designed tocomplement the ELC program.The faculty and assisting moderators at the workshops include both PC and Mac users.PLEASE NOTE: There is an additional registration fee per workshop of $50 Member/Non member/OtherProfessional*; $10 Fellow/Trainee*. This fee includes the ELC <strong>2004</strong> Syllabus CD.* Letter from Neuroradiology Fellowship Program Director confirming status is required. Letter from place ofemployment to confirm position is required for Other Professionals.NOTE: All ELC Workshops will be held in Room 602-603 (Level 6)ELC Workshop A: PowerPoint for the NoviceMonday, June 7 ..........................10:15 am – 11:45 amTuesday, June 8................................8:00 am – 9:30 amDavid S. Martin, MDJohn L. Go, MDThe goal of this Workshop is to instruct registrants in thecreation of educational presentations by learning thecore concepts of Microsoft PowerPoint software. Learnhow lecture material can be developed for display usingLCD projectors. Learning Objectives of this Workshopinclude: creating a new presentation from scratch; usingthe Office and Presentation Assistants; copying,deleting, and modifying the sequence of slides;formatting and editing the text in slides; working withClip Art, pictures, and other objects; preparing an entirepresentation; saving a presentation in normal and HTMLformats; and printing audience and speaker notes.ELC Workshop B: PowerPoint for Advanced UsersMonday, June 7................................3:00 pm – 4:30 pmTuesday, June 8 ..............................3:00 pm – 4:30 pmH. Christian Davidson, MDRichard H. Wiggins, III, MDThis Workshop will address the more advancedtechniques of PowerPoint presentation construction,including insertion of graphs or tables, linking of objects,transitions, animations, and adding sound or video clips.Learn how to create more dynamic presentations bymaking items appear and disappear on slides andinserting “hidden” controls in the slides. The lecturerswill demonstrate how to link one PowerPointpresentation to another to control the flow of informationand enable toggling between presentations. Lastly,comments will be made on the appropriate use ofmultimedia components for keeping a talk interesting yetavoiding audience distraction by too much flash.ELC Workshop C: Image Manipulation with PhotoshopTuesday, June 8 ..........................10:15 am – 11:45 amWednesday, June 9 ........................3:00 pm – 4:30 pmRichard M. Berger, MDThis workshop will enable the attendee to becomefamiliar with the more advanced graphics editingtechniques and options available in Adobe Photoshop.This hands-on, interactive Workshop will provideparticipants with the opportunity to learn how to editimages from any origin. Topics covered will includedetermining optimal image size and resolution for print,PowerPoint, and email graphics; adding text and arrowannotations; re-windowing and leveling; cropping andremoving extraneous text and markings; and convertingto gray-scale. Attendees will also use the more commonPhotoshop tools such as airbrush, blur, rubber stamp,eyedropper, magic wand, paint bucket, and others.June 7 – 11, <strong>2004</strong><strong>ASNR</strong> 42nd Annual MeetingXLI
<strong>ASNR</strong> 42nd Annual Meeting Seattle, WashingtonELCELC Workshop D: Website Creation for the NoviceWednesday, June 9 ........................8:00 am – 9:30 amThursday, June 10 ..........................8:00 am – 9:30 amRichard H. Wiggins, III, MDThis course is geared toward anyone who is beginningto think about creating a website for work or personaluse. Through a series of practical demonstrations andhands-on exercises, this Workshop will help you acquirethe skills necessary to build and maintain a basicwebsite. Topics to be covered include: how a standardweb editor works, how to create a basic web pageusing images and text, creating links between webpages, formatting text and paragraphs, creating andchanging the layout of tables, and putting your pages onthe web.ELC <strong>2004</strong> Workshops & LecturesELC Workshop E: Website Creation for Advanced UsersThursday, June 10 ......................10:15 am – 11:45 amDale A. Charletta, MDThis hands-on experience will cover the effective use of,and creating advanced content for the Internet. Thesession will cover various editors available for creatingweb pages in HTML (HyperText Markup Language) aswell as how to insert XML (eXtensible MarkupLanguage). Familiar tools, such as Microsoft Word andNetscape Communicator, will be discussed with a focuson the use of images, links, tables, and uploadingcontent via FTP (file transfer protocol) to a web server.Advanced topics such as DHTML (dynamic HTML),CSS (cascading style sheets), Javascript, Java, Perl, andother languages used for web page creation will also bediscussed.ELC LecturesThe ELC lectures were introduced in 2001 in responseto the overwhelming demand for computer educationbeyond what could be accommodated in smallworkshops. The ELC lectures focus on topics that areof general interest and in which the hands-on experienceis not as crucial to the learning process. ELC lecturesare held in one of the main session rooms toaccommodate a large audience and are included in theAnnual Meeting registration fee. No preregistration orticket is required for admission.ELC Lecture A: The Radiologist’s Computer: PC andMacintosh PerspectivesMonday, June 7 ................................8:00 am – 9:00 amHervey D. Segall, MDGregory L. Katzman, MDUp to date basics of computer hardware and operatingsystems will be covered, including both the Macintoshand PC platforms. Components inside the computer(e.g. motherboard, processor, chipsets, drives, cards,etc.), peripherals (e.g. monitors, speakers, keyboards,etc.), and lastly connections will be discussed.ELC Lecture B: PDA’s and the RadiologistMonday, June 7................................1:00 pm – 1:30 pmRichard H. Wiggins, III, MDAttendees will obtain the current understanding of PDAhardware features, expansion interfaces, and thedifferences between the various operating systems. Thetechnological future for PDA’s will be discussed in lightof the rapid evolution of these types of products.ELC Lecture C: High Speed Connectivity and Networking forWork and HomeMonday, June 7................................1:30 pm – 2:00 pmGerard J. Muro, MDAttendees will learn about the different types of highbandwidthInternet access as well as the advantagesand limitations of each. Basic principles in connecting ahigh-bandwidth Internet connection to a personal useLAN (Local Area network) will also be presented with adiscussion of networking for both work and home.ELC Lecture D: CD & DVD Expertise: What You Need to KnowMonday, June 7 ..............................4:40 pm – 5:40 pmChar Branstetter, MDBoth hardware and software CD topics will bepresented for the Macintosh as well as PC platforms,including recommendations for purchase that are basedon the speaker’s experiences and opinions. Lastly, pros,cons, and caveats of DVD technology will be offered.ELC Roundtable: Q & A with Today’s SpeakersMonday, June 7................................5:40 pm – 6:10 pmChar Branstetter, MD, H. Christian Davidson, MD,John L. Go, MD, Gregory L. Katzman, MD, DavidS. Martin, MD, Gerard J. Muro, MD, Hervey D.Segall, MD, Richard H. Wiggins, III, MDThe ELC Roundtable offers an open session where theLecture and Workshop speakers of the day will beavailable to answer questions in an open forum session.<strong>ASNR</strong> <strong>2004</strong>XLII
ELCELC <strong>2004</strong> Workshops & LecturesELC Lecture E: Building a Multimedia Conference Roomfrom ScratchTuesday, June 8 ..............................1:00 pm – 2:00 pmVenkata Nataranjan, PhDThis lecture will outline the creation of a modern digitalmultimedia conference room to facilitate more efficientpresentation of radiology learning materials. Topics willinclude video requirements (projection devices,cameras, screens, and monitors) audio systems,teaching aids (laser pointers, lecterns, and interactivescreens), presentation devices (computers, VCR/DVDplayers, slide projectors, overhead projectors, PACSand Workstations), network considerations (LAN andWAN), and overall ergonomics (lighting, soundproofing,seating, and room architecture).ELC Lecture F: Overview of Digital Cameras andCamcordersTuesday, June 8 ..............................4:40 pm – 5:40 pmRichard M. Berger, MDRichard H. Wiggins, III, MDTopics include how to pick a digital camera andcamcorder, avoiding pitfalls during use, taking pictures andvideo, transferring the results to your computer, fileorganization, and image optimization. Recommendationsfor camera and camcorder purchase will be made basedon the speakers’ experiences and opinions.ELC Roundtable: Q & A with Today’s SpeakersTuesday, June 8 ..............................5:40 pm – 6:10 pmRichard M. Berger, MD, H. Christian Davidson,MD, John L. Go, MD, David S. Martin, MD, VenkataNataranjan, PhD, Richard H. Wiggins, III, MDThe ELC Roundtable offers an open session where theLecture and Workshop speakers of the day will beavailable to answer questions in an open forum session.ELC Lecture G: Capturing and Using Image FilesWednesday, June 9 ........................4:40 pm – 5:10 pmRichard H. Wiggins, III, MDThe audience will get an appreciation for some of thetechnical details of digital images, requirements fordigital presentations, methods for obtaining digitalimages, and tricks for making PowerPoint lectures.Recommendations will also be made for image storageand organization.ELC Lecture H: Synopsis of Scanners: Film, Flatbed, and SlideWednesday, June 9 ........................5:10 pm – 5:40 pmHervey D. Segall, MDGary M. Miller, MDThe various types of scanners for use in daily practicewill be discussed, including technical specifications,connections, and software. Purchase recommendationswill also be given based on the speakers’ experiencesand opinions.ELC Roundtable: Q & A with Today’s SpeakersWednesday, June 9 ........................5:40 pm – 6:10 pmRichard M. Berger, MD, Gary M. Miller, MD,Hervey D. Segall, MD, Richard H. Wiggins, III, MDThe ELC Roundtable offers an open session where theLecture and Workshop speakers of the day will beavailable to answer questions in an open forum session.ELC Lecture J: Advanced Image Processing in MRIThursday, June 10 ..........................1:00 pm – 2:00 pmTodd B. Parrish, PhDNeuroradiologists and medical physicists rely heavily onprocessing of MRI raw image data in order to generatemore useful results. Topics presented will include MIP(Maximum Intensity Projection), MPR (Multi-PlanarReconstruction), phase contrast MRA, contrastenhancedMRA, fMRI, diffusion, and perfusionprocessing.ELC Lecture I: Digital Teaching Files: An Overview ofTechniquesThursday, June 10 ..........................4:40 pm – 5:10 pmGregory L. Katzman, MDThis lecture is directed at the novice, who may beconsidering constructing electronic digital teaching fileson his or her desktop computer, either at work, on alaptop, or at home. Several simple methodologies will bepresented, all of which are easily learned andinexpensive. Department wide solutions and networkswill not be discussed.ELC Roundtable: Q & A with Today’s SpeakersThursday, June 10 ..........................5:40 pm – 6:10 pmDale A. Charletta, MD, Gregory L. Katzman, MD,Todd B. Parrish, PhD, Richard H. Wiggins, III, MDThe ELC Roundtable offers an open session where theLecture and Workshop speakers of the day will beavailable to answer questions in an open forum session.Open Forum with the ELC Chair: What Would You Like forthe 2005 ELC?Friday, June 11............................10:00 am – 10:30 amGregory L. Katzman, MDXLIIIJune 7 – 11, <strong>2004</strong><strong>ASNR</strong> 42nd Annual Meeting
NLMNational Library of MedicineSHORT DEMONSTRATION LECTURES & WORKSHOPSNLM will be offering demonstrations and hands-on workshops focusing on PubMed ® andMedlineplus throughout the <strong>ASNR</strong> Annual Meeting. PubMed ® is the National Library ofMedicine’s web-based portal to the MEDLINE database. Searchable without charge,PubMed ® provides bibliographic access to the health literature, currently containing over15 million citations to articles written over the past 50 years. NLM also producesMedlineplus, a free consumer-friendly source of up-to-date health information for patients.Visit and consult with expert librarians or test-drive these and other NLM resources.There is no registration fee for these lectures and workshops. To register for a workshop, please sign up at theELC/NLM desk located outside Room 602-603 (Level 6).<strong>ASNR</strong> 42nd Annual Meeting Seattle, WashingtonLECTURESNLM Lectures are located in Room 611-612 (Level 6).Monday, June 7................................2:00 pm – 2:30 pmPUBMED ® /MEDLINE Short Demonstration LectureLinda MilgromThursday, June 10 ..........................2:00 pm – 2:30 pmPUBMED ® /MEDLINE Short Demonstration LectureLinda MilgromFriday, June 11............................10:30 am – 11:00 amMEDLINEplus Short Demonstration LectureGail KouameWORKSHOPSRoom 602-603 (in cooperation with the ElectronicLearning Center (ELC) Committee).Tuesday, June 8 ..............................1:30 pm – 2:30 pmPUBMED ® /MEDLINE: Advanced Tips And TricksHands-On WorkshopLinda MilgromWednesday, June 9........................1:30 pm – 2:30 pmPUBMED ® /MEDLINE: Advanced Tips And TricksHands-On WorkshopLinda Milgrom<strong>ASNR</strong> <strong>2004</strong>PLEASE NOTE: CME credit will not be granted for these sessions.XLIV
How-To Sessions (As of 5/4/<strong>2004</strong>)InHOW-TOaddition to the TechnicalSESSIONSExhibition, the leadership of the<strong>ASNR</strong> is pleased to announce theeighth annual slate of instructionalHow-To forums. These sessions, presented inconjunction with major corporate contributors, deal withadvances in imaging and procedures as well asprinciples in neuroradiology and image informationmanagement. How-To Luncheon Sessions arescheduled Tuesday, June 8 through Thursday, June 10.How-To Breakfast Sessions are scheduled Monday,June 7 through Friday, June 11. Again in <strong>2004</strong>, How-ToSession programming will be offered during specificbreakfast, lunch and reception sessions.Friday, June 11..............................6:50 am - 7:50 am“Matrix Detachable Coils – Clinical Update”Fernando Vinuela, MD; Jacques Moret, MD;Anil Gholkar, MD; Michael J. Alexander, MDWednesday, June 9......................6:50 am - 7:50 am“CTA: State of the Art”David Enterline, MD“New Developments and New Agents for Contrast-Enhanced MRI”William G. Bradley, Jr. MD, PhD, FACRThe How-To Sessions offer a unique opportunity forneuroradiologists to discuss techniques, procedures, andproducts with their colleagues as well as with technicalspecialists from the imaging industry. Comments andsuggestions from meeting registrants over the last sevenyears were integrated into this year’s format.The sessions vary and include both didacticpresentations and demonstrations, all with a strongpractical emphasis. A significant portion of eachsession is devoted to questions and answers.Indications, problems, and solutions relating to imagingtechniques will be addressed including advances inhelical CTA, CT perfusion, MDCT applications and MRIof the brain.Sunday, June 6..............................6:45 am - 7:45 am“Combining Functional and Diffusion Tensor MagneticResonance Imaging”Dae-Shik Kim, PhDTuesday, June 8 ......................11:50 am - 12:50 pm“Modern Pediatric Neuroimaging: Function in Additionto Anatomy”Lidia Nagae-Poetscher, MD“40 Channel Detector Computed Tomography Usein High Resolution CTA”George Ebert, MD, PhDJune 7 – 11, <strong>2004</strong>Tuesday, June 8 ............................6:50 am - 7:50 am“Why 3T MRI Will Replace 1.5T Over theNext Few Years”William G. Bradley, Jr. MD, PhD, FACR“Propeller MR Imaging”Emanuel Kanal, MDThursday, June 10 ..................11:50 am - 12:50 pm“Aneurysm Imaging: Screening, Emergency, andPost-Treatment”Howard A. Rowley, MDThursday, June 10........................6:15 pm - 7:15 pmWednesday, June 9 ................11:50 am - 12:50 pm“New (Year’s) Resolutions for Neuro MRI”A. Gregory Sorenson, MDThursday, June 10 ........................6:50 am - 7:50 amMonday, June 7 ............................6:50 am - 7:50 amPLEASE NOTE: Due to the direct financial supportfrom these companies and the commercial content,CME credit will not be granted for these sessions.XLV<strong>ASNR</strong> 42nd Annual Meeting
Seattle, Washington<strong>ASNR</strong> 42nd Annual MeetingScientificPROGRAMProgram OverviewOVERVIEW(As of 4/21/<strong>2004</strong>)Meals and Breaks: Breakfasts, Morning and Afternoon Coffee Service, and Box Lunches will be providedthroughout the week. PLEASE NOTE: 42nd Annual Meeting food service locations vary throughout week basedon Technical Exhibit hours and How-to Session programming.NOTE: Boxed copy signifies concurrent programming.<strong>ASNR</strong> 42ND ANNUAL MEETINGMonday, June 76:30am - 7:50amBREAKFAST6:50am - 7:50amHOW-TO SESSION BREAKFAST7:55am - 8:00am(1) OPENING REMARKSCharles M. Strother, MD, <strong>ASNR</strong> President8:00am - 9:00am(2) ELC LECTURE A:THE RADIOLOGIST’S COMPUTER:PC AND MACINTOSH PERSPECTIVESHervey D. Segall, MD; Gregory L. Katzman, MD8:00am - 9:30am(3) NONACCIDENTAL INJURY (NAI)OF THE DEVELOPING BRAIN:ISSUES, CONTROVERIES, ANDTHE MIMICS (ASPNR)8:00am - 8:30amClinical and Pathologic AspectsJohn A. Plunkett, MD8:30am - 9:00amBiomechanics of Traumatic Shaking InjuryFaris A. Bandak, PhD9:00am - 9:30amNeuroimaging AspectsPatrick D. Barnes, MD8:00am - 9:30am(4) HEAD AND NECK CARCINOMA:WHAT THE CLINICIANS NEED TOKNOW (ASHNR)8:00am - 8:30amLarynxSuresh K. Mukherji, MD8:30am - 9:00amOral Cavity and OropharynxRobert B. Lufkin, MD9:00am - 9:30amNasopharynxNancy J. Fischbein, MD8:00am - 12:00pm(5) <strong>ASNR</strong> GRANT WRITING SEMINAR:PRACTICAL TIPS ON GETTING YOURGRANT FUNDED – PART IJanet S. Rasey, PhD9:30am - 10:05amMORNING BREAK10:15am - 11:45am(6) PARALLEL SCIENTIFIC PAPER SESSIONSSession 6a – Adult Brain: General and HighField Imaging (ends at 11:50am)Session 6b – Adult Brain: CerebrovascularDisease and StrokeSession 6c – Head & Neck: GeneralSession 6d – Pediatrics: Fetal and NeonatalImaging10:15am - 11:45am(7) ELC WORKSHOP A:POWERPOINT FOR THE NOVICEDavid S. Martin, MD; John L. Go MD11:45am - 12:50pmLUNCH BREAK1:00pm - 1:30pm(8) ELC LECTURE B:PDA’s AND THE RADIOLOGISTRichard H. Wiggins, III, MD<strong>ASNR</strong> <strong>2004</strong>XLVI
PROGRAM OVERVIEW3:00pm - 4:30pmScientific Program Overview (continued) (As of 4/21/<strong>2004</strong>)Monday, June 7 (continued)1:00pm - 2:30pm(9) LEARNING DISABILITIES IN CHILDHOOD(ASPNR)1:00pm - 1:30pmOverview of Learning Disorders:Current Concepts, Biological Foundations,and ResearchBruce McCandliss, PhD1:30pm - 2:00pmFunctional MR Imaging in Children: Techniques,Current UsefulnessBruce McCandliss, PhD2:00pm - 2:30pmPediatric Applications of fMRINolan R. Altman, MD1:00pm - 2:30pm(10) CT, MRI AND PET IMAGING IN TREATEDNECK (ASHNR)1:00pm - 1:30pmRole of PET/CT in Imaging of the NeckMelanie B. Fukui, MD1:30pm - 2:00pmPostoperative Imaging of the NeckDaniel W. Williams, III, MD2:00pm - 2:30pmPosttreatment Imaging of LarynxDavid M. Yousem, MD1:30pm - 2:00pm(11) ELC LECTURE C:HIGH SPEED CONNECTIVITY ANDNETWORKING FOR WORK AND HOMEGerard J. Muro, MD2:00pm - 2:30pm(11A) NATIONAL LIBRARY OF MEDICINE:PUBMED ® /MEDLINE SHORTDEMONSTRATION LECTURELinda Milgrom2:30pm - 2:55pmAFTERNOON BREAK(12) PARALLEL SCIENTIFIC PAPER SESSIONSSession 12a – Adult Brain: Neoplasms(ends at 4:35pm)Session 12b – Adult Brain: CerebrovascularDisease and StrokeSession 12c – Head & Neck: GeneralSession 12d – Pediatrics: General,Developmental and CongenitalDisorders3:00pm - 4:30pm(13) ELC WORKSHOP B:POWERPOINT FOR ADVANCED USERSH. Christian Davidson, MD;Richard H. Wiggins, III, MD4:40pm - 5:40pm(14) ELC LECTURE D: CD & DVD EXPERTISE:WHAT YOU NEED TO KNOWBarton F. Branstetter, IV, MD4:40pm - 6:10pm(15) TREATMENT OF CNS PEDIATRICNEOPLASTIC DISEASE: RESPONSE &COMPLICATIONS (ASPNR)4:40pm - 4:50pmOverview of Pediatric CNS NeoplasmsRoger Packer, MD4:50pm - 5:10pmNeuroradiologists’ Approach to PediatricCNS NeoplasmsRobert A. Zimmerman, MD5:10pm - 5:30pmThe Central Role of Neuroimaging in RadiationTherapy Planning: Delivery & Follow-upThomas E. Merchant, DO, PhD5:30pm - 5:50pmRole of Chemotherapy & Molecular TargetedTherapy for Brain TumorsRoger Packer, MD5:50pm - 6:10pmComplications of Radiation and ChemotherapyLucy B. Rorke, MD4:40pm - 6:10pm(16) STUMP THE STARS (ASHNR)Panelists: Patricia A. Hudgins, MD, Suresh K.Mukherji, MD; H. Ric Harnsberger, MDJune 7 – 11, <strong>2004</strong><strong>ASNR</strong> 42nd Annual MeetingXLVII
<strong>ASNR</strong> 42nd Annual Meeting Seattle, WashingtonPROGRAM OVERVIEW4:40pm - 6:10pmScientific Program Overview (continued) (As of 4/21/<strong>2004</strong>)(17) ADVANCED IMAGING SEMINAR -DIFFUSION4:40pm - 5:05pmOverview of Physiologically -Specific NeuroimagingMichael W. Weiner, MD5:05pm - 5:30pmBasics and Clinical Applications of DWIP. Ellen Grant, MD5:30pm - 5:55pmDiffusion Tensor Imaging (DTI)Techniques and TerminologyThomas E. Conturo, MD, PhD5:55pm - 6:10pmDiffusion Tensor Imaging (DTI)Fiber TrackingPratik Mukherjee, MD, PhD5:40pm - 6:10pm(18) ELC ROUNDTABLE:Q & A WITH TODAY’S SPEAKERSBarton F. Branstetter, IV, MD; H. ChrisitanDavidson, MD; John L. Go, MD; Gregory L.Katzman, MD; David S. Martin, MD; Gerard J.Muro, MD; Hervey D. Segall, MD; Richard H.Wiggins, III, MD6:00pm - 7:30pmTECHNICAL EXHIBITORWELCOME RECEPTIONTuesday, June 86:30am - 7:50amBREAKFAST6:50am - 7:50amHOW-TO SESSION BREAKFAST8:00am - 9:30am(19) TUMORS (ASPNR)8:00am - 8:30amPediatric Brain Tumor Imaging Protocols andDiffusion Imaging ApplicationsTina Young Poussaint, MD8:30am - 9:00amUsefulness of MR Spectroscopy in PediatricBrain TumorsKim M. Cecil, PhD9:00am - 9:30amMR Perfusion and Pediatric Brain TumorsSoonmee Cha, MD8:00am - 9:30am(20) MDCT IN THE EVALUATION OFSINONASAL DISEASE (ASHNR)8:00am - 8:30amSinus Inflammatory DiseaseYoshimi Anzai, MD8:30am - 9:00amSinus NeoplasmsC. Douglas Phillips, MD9:00am - 9:30amDevelopmental/Congenital LesionsAnton N. Hasso, MD, FACR8:00am - 9:30am(21) ELC WORKSHOP A:POWERPOINT FOR THE NOVICEDavid S. Martin, MD; John L. Go MD8:00am - 12:00pm(22) <strong>ASNR</strong> GRANT WRITING SEMINAR:PRACTICAL TIPS ON GETTING YOURGRANT FUNDED – PART IIJanet S. Rasey, PhD9:30am - 10:10amMORNING BREAK10:15am - 11:45am(23) PARALLEL SCIENTIFIC PAPER SESSIONSSession 23a – Adult Brain: EpilepsySession 23b – Head & Neck: GeneralSession 23c – Pediatrics: General,Functional and VascularImaging (ends at 11:56am)Session 23d – Pediatrics: General andLeukoencephalopathy(ends at 11:50am)XLVIII<strong>ASNR</strong> <strong>2004</strong>
PROGRAM OVERVIEW1:30pm - 2:00pmScientific Program Overview (continued) (As of 4/21/<strong>2004</strong>)Tuesday, June 8 (continued)10:15am - 11:45am(24) ELC WORKSHOP C: IMAGEMANIPULATION WITH PHOTOSHOPRichard M. Berger, MD11:45am - 12:50pmLUNCH BREAK11:50am - 12:50pmHOW-TO SESSION LUNCH11:50am - 12:50pm(25) AMERICAN SOCIETY OF PEDIATRICNEURORADIOLOGY (ASPNR) ANNUALBUSINESS MEETING (Members Only)1:00pm - 2:00pm(26) ELC LECTURE E: BUILDING AMULTIMEDIA CONFERENCE ROOMFROM SCRATCHVenkata Nataranjan, PhD1:00pm - 2:30pm27. ENT (ASPNR)1:00pm - 1:20pmCongenital Masses of the Head and NeckSuresh K. Mukherji, MD1:20pm - 1:40pmMRS of the Head and NeckSuresh K. Mukherji, MD1:40pm - 2:00pmPediatric Head and Neck Soft Tissue MassesBernadette L. Koch, MD2:00pm - 2:20pmPediatric Head and Neck Osseous LesionsBernadette L. Koch, MD2:20pm - 2:30pmDiscussion1:00pm - 2:30pm(28) ADVANCED CT AND MR IMAGINGOF THE SKULL BASE (ASHNR)1:00pm - 1:30pmAnterior Skull Base LesionsTimothy L. Larson, MD1:30pm - 2:00pmCentral and Posterior Skull Base LesionsH. Ric Harnsberger, MD2:00pm - 2:30pmCraniovertebral JunctionWendy R.K. Smoker, MD, FACR(28A) NATIONAL LIBRARY OF MEDICINE:PUBMED ® /MEDLINE: ADVANCED TIPSAND TRICKS HANDS-ON WORKSHOPLinda Milgrom2:30pm - 2:55pmAFTERNOON BREAK3:00pm - 4:30pm(29) PARALLEL SCIENTIFIC PAPER SESSIONSSession 29a – Adult Brain: Vascular Imaging(ends at 4:33pm)Session 29b – Adult Brain: Functional Imaging(fMRI, MSI, MRS, PET)Session 29c – Adult Brain: New Techniques,Postprocessing/TraumaSession 29d – Pediatrics: General3:00pm - 4:30pm(30) ELC WORKSHOP B:POWERPOINT FOR ADVANCED USERSH. Christian Davidson, MD;Richard H. Wiggins, III, MD4:40pm - 5:40pm(31) ELC LECTURE F: OVERVIEW OF DIGITALCAMERAS AND CAMCORDERSRichard M. Berger, MD;Richard H. Wiggins, III, MD4:40pm - 6:10pm(32) INTERESTING PEDIATRIC CASESESSION (ASPNR)4:40pm - 6:10pm(33) DEVELOPMENTAL LESIONSIN THE HEAD AND NECK (ASHNR)4:40pm - 5:10pmCongenital Malformations of the EarH. Christian Davidson, MD5:10pm - 5:40pmApproach to Imaging of the Globeand OrbitClifford J. Belden, MD5:40pm - 6:10pmDevelopmental Anomalies of the NeckRobert W. Dalley, MDJune 7 – 11, <strong>2004</strong><strong>ASNR</strong> 42nd Annual MeetingXLIX
<strong>ASNR</strong> 42nd Annual Meeting Seattle, WashingtonPROGRAM OVERVIEW4:40pm - 6:10pmScientific Program Overview (continued) (As of 4/21/<strong>2004</strong>)(34) ADVANCED IMAGING SEMINAR -PERFUSION, PERMEABILITYAND BEYOND4:40pm - 5:05pmAn Overview of Perfusion ParametersHoward A. Rowley, MD5:05pm - 5:30pmMR Imaging vs. CT TechniquesMichael H. Lev, MD5:30pm - 5:55pmPermeability ImagingJames M. Provenzale, MD5:55pm - 6:10pmReactivity and Oxygen Extraction FractionDavid J. Mikulis, MD5:40pm - 6:10pm(35) ELC ROUNDTABLE:Q & A WITH TODAY’S SPEAKERSRichard M. Berger, MD; H. ChrisitanDavidson, MD; John L. Go, MD; David S.Martin, MD; Venkata Nataranjan, PhD;Richard H. Wiggins, III, MDWednesday, June 96:30am - 7:50amBREAKFAST6:50am - 7:50amHOW-TO SESSION BREAKFAST8:00am - 9:30am(36) PERSPECTIVES ON SUBMISSION OFGRANT APPLICATIONS8:00am - 8:30amGrantsmanship: The Art of Writing a GrantColin P. Derdeyn, MD8:30am - 9:00amThe NIH Review ProcessR. Nick Bryan, MD, PhD9:00am - 9:30amResearch Funding Opportunities forNeuroradiologistsJames M. Provenzale, MD8:00am - 9:30am(37) SPECIAL SESSION: CAN THE PRESENTPRACTICE OF NEURORADIOLOGYSURVIVE? MEETING THE CHALLENGESOF MARGINILIZATION AND CHANGE8:00am - 8:05amIntroductionVictor M. Haughton, MD8:05am - 8:20amThe End of One-Time CertificationPatricia A. Hudgins, MD8:20am - 8:40amThe “R” Word?Robert I. Grossman, MD8:40am - 9:00amReimbursement Rates for NeuroradiologyProceduresJ. Arliss Pollock, MD9:00am - 9:30amThe Role of the <strong>ASNR</strong> in the Facilitation of theNeuroradiology PracticeA. James Barkovich, MD8:00am - 9:30am(38) ELC WORKSHOP D:WEBSITE CREATION FOR THE NOVICERichard H. Wiggins, III, MD9:30am - 9:55amMORNING BREAK10:00am - 10:15am(39) <strong>ASNR</strong> PRESIDENTIAL ADDRESSCharles M. Strother, MD, <strong>ASNR</strong> President<strong>ASNR</strong> <strong>2004</strong>L
PROGRAM OVERVIEW11:15am - 11:45amScientific Program Overview (continued) (As of 4/21/<strong>2004</strong>)Wednesday, June 9 (continued)10:15am - 11:10am(40) <strong>ASNR</strong> AWARDS PRESENTATION10:15am - 10:30amPresentation of Gold Medal AwardsModerators: Charles M. Strother, MD, <strong>ASNR</strong>President; Victor M. Haughton, MD, Chair,Gold Medal Awards Committee10:30am - 10:40amPresentation of <strong>2004</strong> <strong>ASNR</strong>Honorary Member AwardModerator: Norman E. Leeds, MD, Chair,Honorary Member Committee10:40am - 10:50amPresentation of <strong>2004</strong> Cornelius G. DykeMemorial AwardModerators: Charles M. Strother, MD, <strong>ASNR</strong>President, Victor M. Haughton, MD, <strong>ASNR</strong>President-Elect/Program Chair10:50am - 10:55amAnnouncement of 2003 OutstandingPresentation AwardsModerator: Laurie A. Loevner, MD, Chair,Education Committee10:55am - 11:10amPresentation of NER Foundation Award forOutstanding Contribution in ResearchModerator: A. James Barkovich, MD, Chair,NER FoundationAnnouncement of <strong>2004</strong> NER FoundationScholar Award in Neuroradiology ResearchAnnouncement of <strong>2004</strong> NERFoundation/Boston Scientific (formerly TargetTherapeutics, Inc.) Fellowship inCerebrovascular Disease ResearchAnnouncement of <strong>2004</strong> Berlex/NERFoundation Fellowship in Basic ScienceResearch AwardsModerator: James M. Provenzale, MD, Chair,Research Committee11:10am - 11:15am(41) ANNOUNCEMENT OF SYMPOSIUMNEURORADIOLOGICUM (SNR)XVIII/WORLD FEDERATION OFNEURORADIOLOGICAL SOCIETIESMichael S. Huckman, MD(42) AMERICAN SOCIETY OFNEURORADIOLOGY (<strong>ASNR</strong>)ANNUAL BUSINESS MEETING(Members Only)11:45am - 12:50pmLUNCH BREAK11:50am - 12:50pmHOW-TO SESSION LUNCH1:00pm - 2:30pm(43) NEW IMAGING TECHNIQUES IN SPINE(ASSR)1:00pm - 1:20pmNew Imaging Techniques inConventional MR ImagingLawrence N. Tanenbaum, MD1:20pm - 1:40pmDiffusion Imaging in the SpineGordon K. Sze, MD1:40pm - 2:00pmFunctional MR Imaging in the SpinePatrick W. Stroman, PhD2:00pm - 2:20pmMagnetization Transfer in the SpineMassimo Fillippi, MD2:20pm - 2:30pmASSR <strong>2004</strong> Mentor Award: ProspectiveAnalysis of Clinical Outcomes AfterPercutaneous Vertebroplasty for PainfulOsteoporotic Vertebral Body FracturesHuy M. Do, MD1:00pm - 2:30pm(43A) NEURONEWS: DEVELOPINGRESEARCH AND EMERGING TRENDS1:30pm - 2:30pm(43B) NATIONAL LIBRARY OF MEDICINE:PUBMED ® /MEDLINE: ADVANCED TIPSAND TRICKS HANDS-ON WORKSHOPLinda Milgrom2:30pm - 2:55pmAFTERNOON BREAKJune 7 – 11, <strong>2004</strong><strong>ASNR</strong> 42nd Annual MeetingLI
<strong>ASNR</strong> 42nd Annual Meeting Seattle, WashingtonPROGRAM OVERVIEW4:40pm - 6:10pmScientific Program Overview (continued) (As of 4/21/<strong>2004</strong>)Wednesday, June 9 (continued)3:00pm - 4:30pm(44) PARALLEL SCIENTIFIC PAPER SESSIONSSession 44a – Adult Brain: Vascular Imagingin Tumor and IschemiaSession 44b – Spine: SpinalInjections/VertebroplastySession 44c – Adult Brain: Functional Imaging(fMRI, MSI, MRS, PET)Session 44d – Spine: Trauma and Intervention3:00pm - 4:30pm(45) ELC WORKSHOP C: IMAGEMANIPULATION WITH PHOTOSHOPRichard M. Berger, MD4:40pm - 5:10pm(46) ELC LECTURE G:CAPTURING AND USING IMAGE FILESRichard H. Wiggins, III, MD4:40pm - 6:10pm(47) SPINAL VASCULAR IMAGING (ASSR)4:40pm - 5:00pmOverview of Vascular Neuroanatomy of the SpineF. Reed Murtagh, MD5:00pm - 5:20pmContrast-Enchanced MR Angiography of SpinalVessels and Vascular DiseaseSpyros Kollias, MD5:20pm - 5:40pmElliptic-Centric MR Aniography of SpinalVascular LesionsRichard I. Farb, MD, FRCPC5:40pm - 6:00pm3D DSA and the Endovascular Approach toSpinal Vascular DiseaseAjay K. Wakhloo, MD, PhD6:00pm - 6:10pmDiscussion(48) ADVANCED IMAGING SEMINAR -ADVANCED MR AND MRSPECTROSCOPY4:40pm - 5:05pmAn Overview of High vs Low Field ImagingTimothy P.L. Roberts, PhD5:05pm - 5:30pmBasic MR Spectroscopy and ClinicalApplicationsJill V. Hunter, MD5:30pm - 5:55pmParallel Imaging in NeuroradiologyChristiane Kuhl, PhD5:55pm - 6:10pmAdvanced MRSI TechniquesUlrike Dydak, PhD5:10pm - 5:40pm(49) ELC LECTURE H:SYNOPSIS OF SCANNERS:FILM, FLATBED, AND SLIDESHervey D. Segall, MD; Gary M. Miller, MD5:40pm - 6:10pm(50) ELC ROUNDTABLE:Q & A WITH TODAY’S SPEAKERSRichard M. Berger, MD; Gary M. Miller, MD;Hervey D. Segall, MD;Richard H. Wiggins, III, MD6:00pm - 7:30pmRECEPTION - “PIKE PLACE MARKET”Thursday, June 106:30am - 7:50amBREAKFAST6:50am - 7:50amHOW-TO SESSION BREAKFAST<strong>ASNR</strong> <strong>2004</strong>LII
PROGRAM OVERVIEW10:15am - 11:45amScientific Program Overview (continued) (As of 4/21/<strong>2004</strong>)Thursday, June 10 (continued)8:00am - 9:30am(51) MULTIDETECTOR CT FOR SPINEIMAGING (ASSR)8:00am - 8:20amPost Processing and 3D Renderingfor TraumaDiego B. Nunez, Jr., MD, MPH8:20am - 8:40amCT Screening for Cervical Spine TraumaC. Craig Blackmore, MD, MHS8:40am - 9:00amDegenerative Spine Disease ApplicationsJeffrey A. Stone, MD9:00am - 9:20amMultislice Physics and Radiation SafetyJames M. Kofler, Jr., PhD9:20am - 9:30amQ & A Session8:00am - 9:30am(52) SPINAL VASCULAR INTERVENTIONS(ASITN)8:00am - 8:30amImagingKieran P.J. Murphy, MD8:30am - 9:00amPathophysiologyJacques E. Dion, MD-m9:00am - 9:30amTreatmentChistopher F. Dowd, MD(55) ELC WORKSHOP E: WEBSITECREATION FOR ADVANCED USERSDale A. Charletta, MD11:45am - 12:50pmLUNCH BREAK11:50am - 12:50pmHOW-TO SESSION LUNCH11:50am - 12:50pm(56) AMERICAN SOCIETY OF SPINERADIOLOGY (ASSR) ANNUAL BUSINESSMEETING (Members Only)1:00pm - 2:30pm(57) DYNAMIC AND UPRIGHT MRI/SCIENCE(ASSR)1:00pm - 1:20pmSpinal InstabilityLuigi Manfre, MD1:20pm - 1:40pmDynamic Imaging of the Posterior ElementsJ. Randy Jinkins, MD, FACR, FEC1:40pm - 2:00pmNormal and Abnormal DisksJeffrey Silber, MD2:00pm - 2:15pmDynamic Disk Pressure MeasurementsKurt P. Schellhas, MD2:15pm - 2:30pmDynamic Vertebral Body MechanicsStephen M. Belkoff, MDJune 7 – 11, <strong>2004</strong>8:00am - 9:30am(53) ELC WORKSHOP D:WEBSITE CREATION FOR THE NOVICERichard H. Wiggins, III, MD9:30am - 10:10amMORNING BREAK10:15am - 11:45am(54) PARALLEL SCIENTIFIC PAPER SESSIONSSession 54a – Spine: Degenerative DiskDisease and BiomechanicsSession 54b – Interventional New Devices(ends at 11:55am)Session 54c – Adult Brain: NeoplasmsSession 54d – Spine: General, Spinal Cord1:00pm - 2:30pm(58) ATHEROSCLEROSIS (ASITN)1:00pm - 1:30pmPatient SelectionColin P. Derdeyn, MD1:30pm - 2:00pmIntracranial Angioplasty/StentingJoan C. Wojak, MD2:00pm - 2:30pmCervical Carotid DiseaseJohn J. Connors, III, MD<strong>ASNR</strong> 42nd Annual MeetingLIII
<strong>ASNR</strong> 42nd Annual Meeting Seattle, WashingtonPROGRAM OVERVIEW4:40pm - 6:10pmScientific Program Overview (continued) (As of 4/21/<strong>2004</strong>)Thursday, June 10 (continued)1:00pm - 2:00pm(59) ELC LECTURE J: ADVANCED IMAGINGPROCESSING IN MRITodd B. Parrish, PhD2:00pm - 2:30pm(59B) NATIONAL LIBRARY OF MEDICINE:PUBMED ® /MEDLINE SHORTDEMONSTRATION LECTURELinda Milgrom2:30pm - 2:55pmAFTERNOON BREAK3:00pm - 4:30pm(60) PARALLEL SCIENTIFIC PAPER SESSIONSSession 60a – Adult Brain: GeneralSession 60b – Interventional: AneurysmsSession 60c – Adult Brain: General andDiffusion ImagingSession 60d – Adult Brain: General and 3.0T4:40pm - 5:40pm(61) ELC LECTURE I: DIGITAL TEACHINGFILES: AN OVERVIEW OF TECHNIQUESGregory L. Katzman, MD4:40pm - 6:10pm(62) ANEURYSMS (ASITN)4:40pm - 5:10pmNew Devices/TreatmentsJohn D. Barr, MD5:10pm - 5:40pmHemodynamicsAjay K. Wakhloo, MD, PhD5:40pm - 6:10pmBiological TreatmentYuichi Murayama, MD(63) ADVANCED IMAGING SEMINAR -FUNCTIONAL MAPPING4:40pm - 5:05pmfMRI BasicsJonathan H. Burdette, MD5:05pm - 5:30pmfMRI Clinical ApplicationsAndrei I. Holodny, MD5:30pm - 5:55pmMEG and MSI“From Squiggles to Surgery”Steven M. Stufflebeam, MD5:55pm - 6:10pmfMRI Analysis TechniquesJames J. Pekar, PhD5:40pm - 6:10pm(64) ELC ROUNDTABLE:Q & A WITH TODAY’S SPEAKERSDale A. Charletta, MD; Gregory L. Katzman,MD; Todd B. Parrish, PhD;Richard H. Wiggins, III, MD6:15pm - 7:15pmHOW-TO SESSION RECEPTIONFriday, June 116:30am - 7:50amBREAKFAST6:50am - 7:50amHOW-TO SESSION BREAKFAST8:00am - 9:30am(65) PARALLEL SCIENTIFIC PAPER SESSIONSSession 65a – Interventional: Aneurysms(ends at 9:41am)Session 65b – Adult Brain: Functional Imaging(fMRI, MSI, MRS, PET)(ends at 9:36am)Session 65c – Interventional: General(ends at 9:36am)Session 65d – Adult Brain: Vascular Imaging9:30am - 9:55amMORNING BREAKLIV<strong>ASNR</strong> <strong>2004</strong>
ScientificPROGRAMProgram OverviewOVERVIEW(continued) (As of 4/21/<strong>2004</strong>)Friday, June 11 (continued)10:00am - 10:30am(66) OPEN FORUM WITH THE ELC CHAIR:WHAT WOULD YOU LIKE FOR THE2005 ELC?Gregory L. Katzman, MD10:00am - 11:30am(67) STROKE (ASITN)10:00am - 10:30amDevices UpdateGary R. Duckwiler, MD10:30am - 11:00amCurrent Imaging of StrokeJ. Pablo Villablanca, MD11:00am - 11:30amThrombolysis UpdateThomas A. Tomsick, MD10:30am - 11:00am(68) NATIONAL LIBRARY OF MEDICINE:MEDLINEplus SHORT DEMONSTRATIONLECTUREGail KouameJune 7 – 11, <strong>2004</strong>11:30am-11:45amCLOSING REMARKSVictor M. Haughton, MD, <strong>ASNR</strong> President<strong>ASNR</strong> ANNUAL MEETING CONCLUDES12:00pm-1:30pmAMERICAN SOCIETY OF INTERVENTIONALAND THERAPEUTIC NEURORADIOLOGY(ASITN) ANNUAL BUSINESS MEETING(Members Only)& in Sheraton Seattle Hotel and TowersJuniper Room<strong>ASNR</strong> 42nd Annual MeetingLV
1NOTE ABOUT SCANNED IMAGES: Scanned images are included in theproceedings book. Some submitted images were reduced during the printing process, therebydecreasing clarity. The images as originally submitted can be viewed within the abstract on the<strong>ASNR</strong> website at www.asnr.org/<strong>2004</strong>.Monday MorningMonday MorningMonday7:55 AM - 8:00 AMBallroom 6 B/C8:00 AM - 9:30 AMRoom 606 - 609(1) Opening Remarks— Charles M. Strother, MD, <strong>ASNR</strong> President(3) Nonaccidental Injury (NAI) of theDeveloping Brain: Issues,Controversies, and the Mimics(ASPNR)Monday Morning8:00 AM - 9:00 AMBallroom 6 A(2) ELC Lecture A: The Radiologist’sComputer: PC and MacintoshPerspectives(3a) Clinical and Pathologic Aspects— John A. Plunkett, MD(3b) Biomechanics of Traumatic Shaking Injury— Faris A. Bandak, PhD(3c) Neuroimaging Aspects— Patrick D. Barnes, MD— Hervey D. Segall, MD— Gregory L. Katzman, MDModerator:Patrick D. Barnes, MDClinical and Pathologic AspectsJohn A. Plunkett, MDDr. Plunkett is a general and forensic pathologist at ReginaMedical Center in Hastings, MN and also is the ReginaLaboratory and Medical Education Director. He has a specialinterest in the mechanisms and morphology of headinjury in infants. Regina is a small community hospital at thejunction of the St. Croix and Mississippi Rivers approximately25 miles southeast of St. Paul. Dr. Plunkett's wife,Donna, is a Software Engineer for Unisys. They have twogrown children and two granddaughters. They live on a farmin Welch, MN with seven horses and five cats.LEARNING OBJECTIVESUpon completion of this session, participants will be able to:1) Correlate brain injury morphology with injury mechanisms2) Describe and discuss natural disease processes that maybe misinterpreted to represent an inflicted trauma.
2MondayPRESENTATION SUMMARYThe morphology of trauma in the immature brain and skull,and the emphasis that morphology alone cannot differentiate"accidental" from "inflicted" injury will be discussed.Nontraumatic causes of cerebral damage, including corticalvenous thrombosis and meningitis, that have been misinterpretedclinically and pathologically to represent inflictedtrauma also will be shown. The mechanism and morphologyof brain injury in an infant is fundamentally different fromthat in an older child or adult. Deformation-induced skullstress and brain strain are the causes for both focal and diffusebrain damage in an infant, while impulsive-loading(acceleration/deceleration) is the mechanism for diffusebrain injury in an adult. Infant head impact at low velocity,below adult thresholds, may cause damage in the brain andextraaxial spaces even without fracture. The injuries mayinclude contusional tears and subdural hemorrhage (SDH) asprimary events, and cerebral edema and retinal hemorrhage(RH) as cascade phenomena. If the SDH is large, it tends tobe beneath the point of impact, in contrast to the commonlocation in an adult. If the SDH is small, it tends to be "diffuse"and a "thin-film," and the mechanism may not be ruptureof bridging veins or "acceleration/deceleration." I willshow examples of RH. Specific patterns of RH have beencited as pathognomonic for inflicted trauma. However, theeye only knows that there is a force or energy applied to it,and has no way to differentiate intent in order to initiate itsresponse. Recent studies suggest that the common pathwayfor RH is functional or structural venous obstruction, andthat the characteristics of the bleeding cannot be used todetermine the ultimate cause. Traumatic diffuse axonalinjury (DAI) rarely if ever occurs in an infant with adeformable skull. Morphologically, it may be impossible todifferentiate anoxic DAI from traumatic DAI. The newerimmunostains such as beta-APP have confused, notresolved, this issue. Finally, accurate mapping of patterns ofbrain injury requires large whole-mount histologic sections,a technique rarely used in the United States.REFERENCES1. Geddes JF, Hackshaw AK, Vowles GH, Nickols CD, WhitwellHL. Neuropathology of Inflicted Head Injury in Children. I.Patterns of Brain Damage. Brain 2001;124:1290-12982. Geddes JF, Vowles GH, Hackshaw AK, Nickols CD, Scott IS,Whitwell HL. Neuropathology of Inflicted Head Injury inChildren. II. Microscopic Brain Injury in Infants. Brain2001;124:1299-13063. Prange MT, Coats B, Duhaime A-C, Margulies SS.Anthropomorphic Simulations of Falls, Shakes, andInflicted Impacts in Infants. J Neurosurg 2003;99:143-1504. Lantz P. Perimacular Retinal Folds from Childhood HeadTrauma: Case Report with Evidence-Based Enquiry. BMJ<strong>2004</strong> (in press)5. Goldsmith W, Plunkett J. A Biomechanical Analysis of theCauses of Traumatic Brain Injury in Infants and Children.Am J Forens Med Pathol <strong>2004</strong> (in press)Biomechanics of Traumatic Shaking InjuryFaris A. Bandak, PhDLEARNING OBJECTIVES1) Define the role of biomechanics in distinguishing traumaticshaking injury causation2) Distinguish between infant shaking levels of forces andforces of falls from great heights3) Assess potential mechanisms of injury in infant shakingPRESENTATION SUMMARYThe Shaken Baby Syndrome as a diagnosis has becomesomewhat synonymous with inflicted cerebral trauma asindicated by radiological and clinical findings. We willexplore shaking injury causation and introduce the biomechanicaldimension to the understanding of the mechanismsof traumatic shaking injury. An overview of the biomechanicallyrelevant infant head, neck, and chest anatomy will begiven and head loadings commonly ascribed to the ShakenBaby Syndrome addressed. The types of head loadings commonlysuspected in causing head injury will be describedand head injuries will be categorized according to their biomechanicalgenesis. The mechanical features leading to aparticular injury or set of injuries distinguishing primary andsecondary injuries will be described. Primary injuries aretaken to be those caused directly by the mechanical insultand secondary injuries to be those comprising the pathophysiologicprogression following primary injury. We willdiscuss the relationship and differences between contact andnoncontact loading. From an injury perspective, the noncontactclassification is really just a subset of the contact typethat generally differs in magnitude, time duration, and inoperative biomechanisms of injury. We will address valuesof "force" and their relationship to major structural failurethat can be detectable by imaging.REFERENCES1. Caffey J. On the Theory and Practice of Shaking Infants. ItsPotential Residual Effects of Permanent Brain Damage andMental Retardation. Am J Dis Child 1972;124:161-1692. Guthkelch AN. Infantile Subdural Hematoma and ItsRelationship to Whiplash Injuries. Brit Med J1971;2:430-4313. Johnson, W.H. and Kennedy, J. A., 1961, RadiographicAnatomy of the Human Skeleton, Baltimore, Williams andWilkins4. Duhaime A-C, Gennarelli TA, Thibault LE, Bruce DA,Margulies SS, Wiser R. The Shaken Baby Syndrome: AClinical, Pathological and Biomechanical Study. I 1987;66:409-415Neuroimaging AspectsPatrick D. Barnes, MDLEARNING OBJECTIVESUpon completion of this session, participates will be able to:1) Review the neuroimaging findings in nonaccidental injury(NAI) as well as in the mimics of NAI2) Review the role of neuroimaging in the clinical and forensicevaluation of children with suspected nonaccidentalinjury
3) Correlate the neuroimaging findings with neuropathologyand biomechanics in NAI vs accidental injury and nontraumaticmimics4) Review the role of the radiologist as a medicolegal consultantand expert witness in cases of alleged NAIPRESENTATION SUMMARYOne of the most controversial areas of nonaccidental injury(NAI) is the medical and forensic diagnosis of "inflicted"central nervous system (CNS) injury because of its profoundimpact on medical, social, and legal outcomes for childrenand families. Some past and more recent cases and reportshave brought forward information based upon clinical, surgical,imaging, pathologic, biomechanical, social, and legalobservations that raise serious doubt regarding NAI and the"shaken baby syndrome" (SBS) as the cause in all cases ofinfant CNS injury otherwise attributed to "abuse" using traditionaldiagnostic criteria for NAI/SBS. This presentationaddresses neuroimaging and the role of the radiologist in theclinical care of the child and as a treating or expert medicalwitness in cases of CNS injury in alleged NAI.REFERENCES1. Barnes PD. Ethical Issues in Imaging Nonaccidental Injury:Child Abuse. Top Magn Reson Imag 2002;13(2): 85-942. Kleinman PK, Barnes PD. Head Trauma. In: Kleinman PK,ed. Imaging of Child Abuse, 2nd ed. Saint Louis: Mosby YearBook;19983. Donohoe M. Evidence-Based Medicine and Shaken BabySyndrome. Part 1: Literature Review, 1966-1998. Am JForen Med Pathol 2003;24:239-2424. Geddes JF, Tasker RC, Hackshaw AK, et al. DuralHaemorrhge in Non-Traumatic Infant Deaths: Does ItExplain the Bleeding in 'Shaken Baby Syndrome'?Neuropathol Appl Neurobiol 2003;29:14-225. Duhaime AC, Gennarelli TA, Thibault LE, et al. The ShakenBaby Syndrome. A Clinical, Pathological, andBiomechanical Study. J Neurosurg 1987;66:409-4156. Plunkett J. Fatal Pediatric Head Injuries Caused by Short-Distance Falls. Am J Foren Med Pathol 2001;22:1-127. Ommaya AK, Goldsmith W, Thibault L. Biomechanics andNeuropathology of Adult and Paediatric Head Injury. Brit JNeurosurg 2002;16(3):220-2423Monday Morning8:00 AM - 9:30 AMBallroom 6 B/C(4) Head and Neck Carcinoma: Whatthe Clinicians Need to Know(ASHNR)(4a) LarynxLarynxSuresh K. Mukherji, MD— Suresh K. Mukherji, MD(4b) Oral Cavity and Oropharynx— Robert B. Lufkin, MD(4c) NasopharynxModerators:— Nancy J. Fischbein, MDWilliam P. Dillon, MDLaurie A. Loevner, MDLEARNING OBJECTIVESUpon completion of this session, participants will be able to:1) Review the anatomy of the larynx2) Describe the imaging appearance of tumors that involvethese specific anatomical sites with a concentration on squamouscell carcinoma3) Develop a checklist of specific information that radiologistsshould include in their reports for imaging studies performedin patients with tumors of the larynx that will affectdirectly the treatment and management of these patientsPRESENTATION SUMMARYThe development of modern imaging techniques has alteredsignificantly the treatment and management of malignanciesof the upper aerodigestive tract. Important decisions thatonce were made intraoperatively are made now in advanceof surgery by using information from CT and MR imaging.Imaging helps to determine tumor resectability and theextent of surrounding tissue that needs to be resected in orderto insure adequate margins. Because it improves the accuracyof staging, pretreatment imaging is accepted as an importantadjunct to physical examination in patients with malignanciesof the upper aerodigestive tract. Detailed counselingis important for patients with head and neck malignancies, assurgical treatment of tumors in this region results in anatomicalalterations that can cause significant lifestyle changes.Properly performed imaging provides detailed informationMonday
Mondayon the extent and depth of tumors; information that oftencannot be ascertained by physical examination. Althoughmucosal spread is detected better by direct visualization,deep extension is evaluated better by cross-sectional imagingrather than by endoscopy. Pretreatment imaging providesinformation that may determine whether patients are candidatesfor organ preservation therapy; either surgical or radiotherapy.Because of advancements in head and neck imaging,some otolaryngologists or radiation oncologists may notbe aware of its impact on the treatment and management ofsquamous cell carcinomas (SCCA) of the larynx. Similarly,some radiologists may not be familiar with the specific informationthat needs to be conveyed to the referring clinician.The intent of this presentation is to provide guidelines onspecific information that needs to be transmitted to the referringotolaryngologist or radiation oncologist and which willalter the treatment of patients with SCCA of the larynx.Oral Cavity and OropharynxRobert B. Lufkin, MDLEARNING OBJECTIVESUpon completion of this session, participants will be able to:1) Describe anatomy of the oropharynx and oral cavity2) Identify certian diseases of this area3) Discuss and summarize new developments and futurepotential of this areaPRESENTATION SUMMARYThe role of CT, MR imaging, and PET in the assessment ofthe patient with pathology of the oropharynx and oral cavity.Like elsewhere in the head and neck, a thorough understandingof the regional anatomy is essential in adequatelyinterpreting imaging studies. The utility of CT in evaluationof inflammatory conditions, calcification, and fibro-osseousdisease will be reviewed. The added value of MR imaging inassessing neoplastic disease, perineural extensions, marrowinvolvement, and soft tissue pathology also will be covered.The emerging role of PET and CT/PET in defining CT andMR imaging negative early or recurrent malignancies andmetastasis as well as potential pitfalls will be emphasized.4unchecked growth of carcinoma in this region may lead tosignificant clinical deficits and significantly complicate apatient's treatment. Unfortunately, many patients are diagnosedat an advanced stage, after bony involvement, cranialnerve involvement, and/or intracranial extension already hasoccurred. In this presentation, we will review the normalanatomy of the nasopharynx and adjacent structures. Thevaried imaging presentations of nasopharyngeal carcinoma(small primary with bulky neck disease, large primary withno evidence of neck disease, skull base involvement, cranialnerve involvement, etc.) then will be reviewed, as will thestaging system for this cancer. We also will discuss the optimalimaging evaluation of these patients (CT vs MR imaging,role of PET and PET CT). The difficulties of diagnosingrecurrent disease also will be discussed. Pitfalls and pearls ofimaging diagnosis that may help the radiologist in his or herapproach to the patient with unsuspected, suspected, orknown NPC in daily practice also will be reviewed.Nasopharyngeal carcinoma is treated with radiation therapy,with chemotherapy added in all but the earliest stage lesions.Modern treatment involves the use of intensity modulatedradiation therapy (IMRT), a technique whereby high-doseradiation can be delivered to a tumor in a highly conformalmanner. The push toward more exact anatomically conformaltherapy requires radiologists to be thoroughly familiarwith the patterns of spread of NPC and aware of the siteswhere failures may occur. Complete radiologic assessmentof tumor is an essential part of the ongoing improvements inlocal control of nasopharyngeal carcinoma.REFERENCES1. Chin SC, Fatterpekar G, Chen CY, Som PM. MR Imaging ofDiverse Manifestations of Nasopharyngeal Carcinomas.AJR Am J Roentgenol 2003;180(6):1715-17222. Chong VF, Mukherji SK, Ng SH, Ginsberg LE, Wee JT, ShamJS, et al. Nasopharyngeal Carcinoma: Review of HowImaging Affects Staging. J Comput Assist Tomogr1999;23(6):984-9933. Kim YI, Han MH, Cha SH, Sung MW, Kim KH, Chang KH.Nasopharyngeal Carcinoma: Posttreatment Changes ofImaging Findings. Am J Otolaryngol 2003;24(4):224-2304. Ng SH, Chong VF, Ko SF, Mukherji SK. Magnetic ResonanceImaging of Nasopharyngeal Carcinoma. Top Magn ResonImag 1999;10(5):290-303NasopharynxNancy J. Fischbein, MDLEARNING OBJECTIVESUpon completion of this session, participants will be able to:1) Review the complex anatomy of the nasopharynx2) Review of imaging appearance and radiologic staging ofnasopharyngeal carcinoma3) Identify pertinent clinical questions to be answered in apatient with nasopharyngeal carcinomaPRESENTATION SUMMARYCancer of the nasopharynx most commonly occurs in thoseof Southern Chinese descent, but can occur in any ethnicgroup. Early identification of this lesion is important, as thelocation of the nasopharynx adjacent to the central skull baseand many critical neurovascular structures means that
Monday Morning8:00 AM - 12:00 PMRoom 305(5) <strong>ASNR</strong> Grant Writing Seminar:Practical Tips on Getting Your GrantFunded - Part I— Janet S. Rasey, PhD5Part 2 of the workshop focuses on Writing the Grant.Part 3 covers After You've Written: The Review Process andwill examine abilities and skills looked for by reviewers.Monday Morning10:15 AM - 11:50 AMBallroom 6 B/C(6a) Adult Brain: General and HighField Imaging(Scientific Papers 1 - 12A)Monday<strong>ASNR</strong> Grant Writing Seminar: Practical Tips on GettingYour Grant Funded - Part 1Janet S. Rasey, PhDJanet S. Rasey, Ph.D. is Professor of Radiation Oncology(now retired) and Director of the Research Funding Service(still active) at the University of Washington Medical Centerin Seattle, WA. She holds degrees from the University ofMichigan (B.S. in Zoology), Oregon State University (M.S.in Radiological Health) and the University of Oregon (Ph.D.in Biology). Her principle research interests include cancerimaging, radiation biology, and the role of tumor hypoxia incancer therapy and tumor progression. These research programshave been supported by grants from the NIH, includinga MERIT Award (1990-98), and business concerns. In1989 Dr. Rasey founded the Research Funding Service atUW, which she continues to direct. This service helps investigatorsin the Health Sciences schools (Medicine, Dentistry,Nursing, Public Health, Pharmacy, and Social Work) findsources of research funds, understand the art of grantsmanship,and learn to write effective grants. Dr. Rasey hasreceived numerous invitations to speak at universities,national scientific meetings, and the NIH on grantsmanship,grant writing, and grant review.LEARNING OBJECTIVESUpon completion of this session, participants will be able to:1) Assess the prewriting homework that an applicant needsto do before writing a research grant proposal2) Identify major parts on an NIH grant research plan3) Review specific strategies for writing the different parts ofan NIH grant research plan4) Determine what grant reviewers look for in an NIH proposalPRESENTATION SUMMARYThe objectives of this workshop are to teach the elements ofwriting a competitive research grant, with emphasis on NIHR01 proposals, and to explain grant review procedures andpsychology.The workshop, presented over 2 days (4 hr/day) is dividedinto three parts.Part 1 covers the topic, Before You Write.See also Parallel Sessions(6b) Adult Brain: Cerebrovascular Disease and Stroke(6c) Head & Neck: General(6d) Pediatrics: Fetal and Neonatal ImagingModerators:Paper 1 Starting at 10:15 AM, Ending at 10:23 AMQuantitative Analysis of Fiber Density in the CorpusCallosum Using Diffusion Tensor ImagingStewart, J. E. · Port, J. D.Mayo ClinicRochester, MNDavid J. Seidenwurm, MDMichael L. Lipton, MDPURPOSEMR diffusion tensor imaging coupled with fiber tractographyhas demonstrated significant utility in the identification andclassification of white matter fibers in the brain. Much of thework to date has focused on the qualitative evaluation of brainconnectivity in normal and diseased states. The purpose of ourresearch is to develop a quantitative measure of fiber densityin the brain.MATERIALS & METHODSSpin-echo echo-planar diffusion tensor images are acquiredon eight normal volunteers in the axial plane using a GE1.5T LX MR scanner. A linear multiple regression algorithmstatistically estimates the diffusivity constants of the resultantsuper-tensor (13 axis) data sets, followed by diagonalizationand calculation of eigenvalues and eigenvectors.Sixty 128 x 128 images are acquired with a slice thickness of4.0 mm with a 2.0 mm offset. These images are super-sampledand 60 additional images are interpolated linearly for atotal three-dimensional (3D) matrix size of 256 x 256 x 120with a voxel aspect ratio of 0.9375 x 0.9375 x 1.0 mm. Thefractional anisotropy (FA) at each voxel is calculated and 3Dcurves are constructed from these images in the direction of
Mondaythe principal eigenvector. These 3D curves are the mathematicalequivalent of white matter fibers. Two methods offiber tract initialization are evaluated. The first technique,uniform spatial initialization (USI), begins new curves inevery voxel above a predetermined FA threshold. It is consideredby many to be the method of choice for fiber tractography.We have developed a second technique, neuroncell body initialization (NCBI) that predicts the origin ofaxons at the gray/white interface and initiates 3D curves onlyfrom these voxels. The corpus callosum in the images of theeight normal patients are segmented in a semiautomatedfashion and divided into ten regions from anterior to posterior.The number of curves (fibers) passing through theseregions were counted, normalized, and compared to histologicfiber densities of 20 normal patients as described byAboitiz, et al., 1992.RESULTSThe average error for the NCBI algorithm was only 14.2 %vs 24.5% for USI. Maximum fiber density was seen in thegenu, connecting prefrontal areas and in the splenium, connectinghigher-order processing areas of the temporal andparietal lobes. This is in excellent agreement with histologicdata and multiple published neuroanatomical tracing studies.A plot of normalized fiber length in the corpus callosumshows a direct correlation between fiber density and lengthfor the USI algorithm. This undesirable and nonphysiologicfeature is a direct result of multiple 3D curves being initiatedalong existing fiber pathways. The NCBI algorithm significantlyreduces this effect and more closely approximatesactual corpus callosum fiber density.CONCLUSIONThis study demonstrates the accuracy of the NCBI algorithmin measuring fiber density within the human corpus callosum.While the utility of this algorithm in other white mattertracts has yet to be proven, we believe NCBI should be ofsignificant value in the identification and management ofpatients with white matter disease in the future.KEY WORDS: Tractography, diffusion tensor imaging, postprocessingPaper 2 Starting at 10:23 AM, Ending at 10:31 AMNuclei and Tracts of the Human Medulla: MRMicroscopy at 9.4 TNaidich, T. P. · Tai, A. W.·Delman, B. N. · Delgado, J.E.·Aguinaldo, J. G. S. · Perl, D. P. · Wolfe, D. E. · Hof, P.R.·Drayer, B. P.Mount Sinai Medical CenterNew York, NYPURPOSEThe purpose of this study was to explore how well MRmicroscopy (MRM) could display the fine anatomical detailand 3D organization of the nuclei and fiber tracts of thehuman medulla.MATERIALS & METHODSUsing previously reported methods (1), the normal nuclei andtracts of the human medulla were displayed in three orthogonalplanes at a resolution of 60-70 microns (in plane) by 500microns (slice thickness) using a Brüker Avance 9.4 T unit,6intermediate-weighted pulse sequences (TR 2000, TE 30, 20NEX, 3-3.5 cm field of view, 512 x 512 matrix) and three formalin-fixedhuman medullae from cadavers with no knownneurologic disease. Nissl and Luxol fast blue stains providedprecise correlation between the MR appearance and thenuclear and fiber tract anatomy of the very same specimens.RESULTSMR microscopy convincingly displays the sites, contours,and relationships among the hypoglossal, dorsal vagal, solitary,medial/inferior vestibular, dorsal/ ventral cochlear, andspinal trigeminal nuclei and their tracts. The gracilus andcuneatus (medial and lateral) are seen to continue throughthe internal arcuate fibers, and then decussate to become themedial lemnisci. The dorsal longitudinal, medial longitudinal,and anterolateral fasciculi are defined clearly in relationto these structures. The inferior, the medial accessory and thedorsal accessory olivary nuclei are displayed beautifully inrelation to their encompassing amiculum. The pyramids,external arcuate fibers and nuclei, dorsal and ventral spinocerebellartracts, restiform bodies and medullary striaedefine the surface. Multiple individual fascicles of thehypoglossal nerve are traced easily through the full thicknessof the medulla from their origin in the hypoglossal nucleusdorsally, to course between the inferior and medial olivarynuclei, and then exit ventrally (Figure). Cine display permitsthe physician to trace individual structures through thelength of the stem and helps to integrate their 3D relationshipsinto a coherent image of brainstem structure.CONCLUSIONMR microscopy at 9.4 T greatly advances the anatomicaldetail demonstrable in specimen medullae. Those familiarwith this anatomy may well be able to appreciate fineranatomical features on clinical images obtained with thehigher field 4.7 T, 7 T, and 8 T units now being introduced atselected sites.REFERENCES1. Fatterpekar GM, Naidich TP, Delman BN, et al.Cytoarchitecture of the Human Cerebral Cortex: MRMicroscopy of Excised Specimens at 9.4 Tesla. AJNR Am JNeuroradiol 2002;23:1313-1321KEY WORDS: Medulla, anatomy brain, MR microscopy
Paper 3 Starting at 10:31 AM, Ending at 10:39 AMDiffusion Tensor Imaging in Pediatric Brainstem Glioma(BSG) Patients, With Neurologic CorrelationHelton, K. J. · Phillips, N. · Khan, R. B. · Boop, F. A. ·Sanford, A. · Ogg, R.St. Jude's Children's Research HospitalMemphis, TN7Paper 4 Starting at 10:39 AM, Ending at 10:47 AMPreliminary Study with High-Resolution SENSE DTI at3 T: DTI and Fiber Tracking Study in Multiple SclerosisCampi, A. 1 · Staempfli, P. 2 · Jaermann, T. 2 · Summers, P. 1 ·Goebels, N. 1 · Boesiger, P. 2 · Valavanis, A. 11University Hospital Zurich, Zurich, SWITZERLAND,2ETH, Zurich, SWITZERLANDMondayINTRODUCTIONAlthough magnetic resonance imaging has allowed subcategorizationof brainstem tumors by both location, and degreeof focality, thereby impacting therapeutic options and prognoses,risk stratification remains unsatisfactory. Diffusiontensor imaging (DTI) is a promising tool to assess the degreeof tract involvement, and better define focality.MATERIALS & METHODSDTI data (whole head echo-planar, 1.5 Tesla) were analyzedin a retrospective study of 8 patients with diffuse brain stemglioma (BSG), 5 patients with supratentorial tumors, and 5normal controls. Fractional anisotropy (FA) and apparentdiffusion coefficient (ADC) values were calculated from thediffusion tensor for each pixel. FA and ADC were evaluatedin regions of interest drawn around the bilateral corticospinaltracts, transverse pontine fibers, and medial lemnisci at thelevel of the middle cerebellar peduncles, and compared withthe corresponding neurological exam.RESULTSThere were statistically significant differences in both FAand ADC between diffuse BSG patients vs other subjects inthe corticospinal tracts, transverse pontine fibers, and mediallemnisci. Where neurological records were available,severity of neurological tract involvement correspondedwith decreasing FA and increasing ADC values.CONCLUSIONDiffusion tensor imaging provided outstanding visualizationand quantification of the degree of tract involvement in diffuseBSG patients. The correspondence observed betweendiffusion parameters and neurological deficits suggests thatDTI may be a sensitive indicator of tumor invasion of whitematter tracts. Further prospective studies may demonstratethat DTI is useful for delineating tumor focality, and contributeto improved risk stratification in children with thisheterogeneous group of tumors.This paper was selected to receive the Best Paper Award bythe Southeastern Neuroradiology Society (SENRS) at its27th Annual Meeting held in October, 2003.Robert Ogg, MD will be presenting this paper.PURPOSETo evaluate the ability of DTI fiber tracking to differentiatebetween the white matter tracts in MS lesions and normalappearing white matter (NAWM).MATERIALS & METHODSFive patients (3F, 2M) with clinically definite relapsingremitting(RR = 3) and secondary progressive (SP = 2) MSand 4 healthy volunteers (2F, 2M) underwent conventionalT2-weighted imaging and DTI on a 3 T whole body MR system.The DTI acquisition used a single-shot SE-EPI scheme(matrix/FOV/3 slices/SLT: 96 x 94/200 x 200 x 105 mm/35/3mm, TE/TR: 71 ms/7751 ms, SENSE reduction factor R =2.1) with a b-factor of 1000 s/mm2 was used along each ofsix directions, complemented by one scan with b = 0. Meandiffusivity, fractional anisotropy (FA) and color-coded directionof maximum anisotropy maps were generated for eachsubject. Regions of interest were defined in lesion areas onthe T2-weighted imaging of patients and in the contralateralNAWM. Corresponding areas also were defined in thehealthy volunteers. Fractional anisotropy was measured inthese 2D ROIs, and the ROIs subsequently were used as seedareasfor fiber tracking based on a line propagation algorithm.RESULTSPatient 1 (RR MS) is representative. A lesion in the left posteriorcorona radiata, not detectable 1 month earlier, appearedas a de novo contrast-enhancing lesion. Three weeks later,this lesion no longer enhanced and the T2-weighted imagingabnormality was markedly smaller. T1-weighted imagingshowed less hypointensity of this area. Mean FA of this areawas 0.50. A second, old lesion in the left parietal white matterwas highly hypointense on T1 with FA of 0.15. The depictionrate of fiber tracts in both lesion areas was inferior to thatof the contralesional side. However, the newer lesion showedfocal reduction of the depiction rate (Figure 1a ) while the oldlesion showed overall reduction in the depiction rate of fibertracts (Figure 1b). Similar lesion-related reduction in depictionrate was seen in the other patients.
8MondayCONCLUSIONOur preliminary study suggests that fiber tracking may helpin differentiating different pathologic substrates of MSlesion areas. The tracking results, which likely reflect thechange in FA values, appear to provide significant supplementaryinformation to the known observed changes in signalintensity on T1-weighted imaging.KEY WORDS: DTI, fiber tracking, MSPaper 5 Starting at 10:47 AM, Ending at 10:55 AMDoes Ischemia or Hypoxia Play a Role in TumofactiveMultiple Sclerosis and ADEM?Bert, R. J.Tufts-New England Medical CenterBoston, MAPURPOSETo discuss the possible roles of ischemia and/or hypoxia inthe pathophysiology of demyelinating disease presenting inthe acute phase with tumofactive appearances. We presentfour (or more) index cases with advanced MR analysis(DWI, PWI, MRS, ?BOLD and conventional MR imaging)of acute demyelinating disease (2 ADEM, 2 MS, 1 caseremaining indeterminate; possible additions) leading to thisdiscussion.MATERIALS & METHODSStandard MR imaging protocols were obtained in all cases,consisting of sagittal and axial T2 FLAIR, axial T2 TSE, T2GE, precontrast T1 and postcontrast T1 images. Additionalpostcontrast coronal T1 images were obtained also.Echoplanar DWI images with B values of 0, 500, and 1000and tensor ADC maps were obtained in all cases. Singleand/or multivoxel MRS (PRESS, TEs of 138 and 270 msec)were obtained in all cases, with short TE (20 or 30 msec)spectra collected in select cases. Echoplanar/GE PWI wasobtained in three cases. Fifteen ccs of Gd were administeredusing a pressure injector, 18 G antecubital vein IV and rateof 5 cc/sec. Fifty image sets (~15 baseline, 35 PC) wereobtained. Curves were fitted with standard commercial software(Siemen’s Medical) and TTP and CBV standard mapspresented. Additional perfusion parameter’s were evaluatedoff-line. In two cases, biopsy results were obtained whentumor and acute infection were included in the differentialdiagnoses.RESULTSAll of the index cases demonstrated evidence of anaerobicmetabolism, as indicated by elevated lactate on MR spectroscopy.Only a single case demonstrated restricted diffusionbased on DWI criteria. On PWI, one case demonstratedgeneralized hypoperfusion, while another showed centralhypoperfusion (decreased CBV, lengthened TTP) with marginalminimally increased perfusion (increased CBV, shortenedTTP). Biopsy results from two index cases clearlydemonstrated classical active demyelinating disease withperivenular lymphocytic infiltration. Very minimal ringenhancement was demonstrated in two cases on conventionalMR spectoscopy.CONCLUSIONIncreased lactate in our index cases is consistent with anaerobicmetabolism occurring during demyelinating disease inits active state, when a tumofactive appearance occurs.Neuronal loss occurring with demyelinating disease hasbeen reported previously. We propose, based on these twoobservations, that hypoxia or ischemia may play a role in thepathophysiology of demyelinating disease in some cases.Decreased perfusion, occurring in the center of the tumofactivelesions, favors ischemia. I suggest that this may resultfrom venous microthrombi (reported by others) or byperivenular restriction of interstitial fluid resorption occurringat the postcapillary venules. Alternatively, mitochondrialdysfunction, based on free radical injury or other inhibitoryprocess, could lead to hypoxia without decreased perfusion(ischemia). I will describe ways of testing thesehypotheses in detail at the meeting. Despite the frequentoccurrence of lactate in tumofactive demyelinating lesions,restricted diffusion is observed infrequently. Possible explanationsof this anomaly will be discussed.KEY WORDS: Tumofactive ms, demyelinating disease,hypoxia, ischemiaPaper 6 Starting at 10:55 AM, Ending at 11:03 AMNuclei and Tracts of the Human Midbrain: MRMicroscopy at 9.4 TNaidich, T. P. · Delgado, J. E. · Delman, B. N. · Tai, A. W. ·Aguinaldo, J. G. S. · Gultekin, H. S. · Perl, D. P. · Hof, P. R.· Drayer, B. P.Mount Sinai Medical CenterNew York, NYPURPOSEThe purpose of this study was to explore how well MRmicroscopy (MRM) could display the fine anatomical detailand 3D organization of the nuclei and fiber tracts of thehuman mesencephalon.MATERIALS & METHODSUsing previously reported methods (1), the normal nucleiand tracts of the human midbrain were displayed in threeorthogonal planes at a resolution of 60-70 microns (in plane)by 500 microns (slice thickness) using a Brüker Avance 9.4T unit, intermediate-weighted pulse sequences (TR 2000, TE30, 20 NEX, 3-3.5 cm field of view, 512 x 512 matrix) andthree formalin-fixed human mesencephala from cadaverswith no known neurologic disease. Nissl and Luxol fast bluestains provided precise correlation between the MR appearanceand the nuclear and fiber tract anatomy of the verysame specimens.RESULTSMR microscopy convincingly displays the individual grayand white strata of the inferior and superior colliculi, theirdecussations and peduncles, and the intercollicular nuclei.The central gray matter is related to the dorsal and mediallongitudinal fasciculi, the nuclei and tracts of the trochlearnerve, the nuclei and tracts of the mesencephalic trigeminalnerve, and the tectospinal tracts. Surrounding these, concentrically,lie the cuniform and interstitial nuclei, the spinothalamic,dorsal trigeminothalamic, and central tegmental tractsand the anterolateral fasciculi, enclosed by an outer ring
formed by the medial lemnisci and red nuclei. The ventralmidline displays the oculomotor and accessory oculomotornuclei, the multiple individual fascicles of the third nerve(Figure), and the interpeduncular nuclei. The partes compactaeand reticulatae of the substantiae nigrae and the tractsof the cerebral peduncles lie ventrolaterally. The trochlearnerves decussate in the superficial medullary velum of thefourth ventricle and emerge just lateral to its frenulum. Cinedisplay permits the physician to trace individual structuresthrough the length of the stem and helps to integrate their 3Drelationships into a coherent image of brainstem structure.9Paper 7 Starting at 11:03 AM, Ending at 11:11 AMDetection of Lesions in Encephalomyelitis Disseminataby 2D Fluid-Attenuated Inversion Recovery and Single-Slab 3D Fluid-Attenuated Inversion Recovery Sequenceat 3.0 TBink, A. 1 · Gaa, J. 1 · Schmitt, M. 2 · Mugler, J. P. 3 ·Lanfermann, H. 1 · Zanella, F. E. 11Johann Wolfgang Goethe University, Frankfurt/Main,GERMANY, 2 Siemens Medical Solutions, Erlangen,GERMANY, 3 University of Virginia, Charlottesville, VAMondayCONCLUSIONMR microscopy at 9.4 T greatly advances the anatomicaldetail demonstrable in specimen mesencephala. Those familiarwith this anatomy may well be able to appreciate fineranatomical features on clinical images obtained with thehigher field 4.7 T, 7 T, and 8 T units now being introduced atselected sites.REFERENCES1. Fatterpekar GM, Naidich TP, Delman BN, et al.Cytoarchitecture of the Human Cerebral Cortex: MRMicroscopy of Excised Specimens at 9.4 Tesla. AJNR Am JNeuroradiol 2002;23:1313-1321KEY WORDS: Midbrain, anatomy brain, MR microscopyPURPOSEComparison of a conventional 2D FLAIR and a single-slab3D FLAIR sequence in patients with encephalomyelitis disseminata(ED).MATERIALS & METHODSTen patients with ED were examined by a 2D FLAIR (sagittal,slice thickness: 5 mm, 25 slices, FOV read 220 mm FOVphase 100 %, FA: 42 degree, matrix: 256 x 320, TR: 10 000,TE: 97, bandwidth: 200 Hz/Pixel, TA: 6:22 min) and a single-slab3D FLAIR sequence (sagittal, resolution: 1.0 x 1.0x 1.1 mm, 114 slices, FOV read 250 mm FOV phase 85.9 %,matrix: 250 x 256, TR: 6 000, TE: 353, bandwidth: 930Hz/Pixel, TA: 7:20 min) at 3.0 T (Magnetom TRIO, SiemensMedical Solutions, Erlangen, Germany). Images were analyzedwith respect to the following locations: supratentorial:periventricular, subcortical; infratentorial: cerebellum andbrain stem.RESULTSIn the inspected areas, a total of 424 lesions were foundusing 2D FLAIR while with the 3D FLAIR sequence 739lesions could be found. With 2D/3D FLAIR sequence weredetected periventricular: 163/271, subcortical: 252/444,cerebellum: 6/15 and brain stem: 3/9 lesions. In comparisonto 3D FLAIR only 58% supratentorial and 37.5% infratentoriallesions were found by 2D FLAIR sequence.Significantly (p < 0.05) more supratentorial lesions werefound by the 3D FLAIR sequence.CONCLUSIONThese are the first results using a newly developed singleslab3D FLAIR sequence at 3.0 T for detection of EDlesions. The performance of the single-slab 3D FLAIRsequence was clearly superior for detection of ED lesions incomparison to a conventional 2D FLAIR sequence.KEY WORDS: Encephalomyelitis disseminata, 2D/3DFLAIR sequence, 3.0 TThe authors of this work have indicated the following affiliations/disclosures:Siemens Medical Systems: Full-timeemployment.
MondayPaper 8 Starting at 11:11 AM, Ending at 11:19 AMValue of Different MR Sequences in the Diagnosis ofCreutzfeldt-Jacob DiseaseKallenberg, K. · Jatrow, U. · Schulz-Schaeffer, W. J. · Poser,S. · Zerr, I. · Knauth, M.Georg-August University Medical CentreGoettingen, GERMANYPURPOSEThe diagnosis of Creutzfeldt-Jacob disease (CJD) is made byautopsy or biopsy of brain tissue. The clinical suspicion issubstantiated by technical or chemical tests like EEG or theevaluation of the CSF protein 14-3-3. MR imaging plays anincreasingly important role in the diagnosis of CJD, sincebasal ganglia abnormalities on T2-weighted and proton density-(PD) weighted images have been described. Recentlythere have been reports of improved diagnostic accuracy bythe use of fluid-attenuated inversion-recovery (FLAIR)sequences or by diffusion-weighted imaging (DWI). The aimof our study was to compare the value of different MRsequences (T2-weighted, PD-weighted, FLAIR, DWI) in thediagnosis of CJD.MATERIALS & METHODSOne hundred fifty-four CJD patients underwent MR exams,92 neuropathologic diagnosed, 62 clinically classified asCJD through the German CJD surveillance unit (probabilityof 95%). There was no standard MR protocol so the examsincluded only 141 T2-weighted, 43 PD-weighted, 84 FLAIRand 44 DWI. The MR images were reviewed for pathologicchanges of the basal ganglia, thalamus, and cerebral cortex.RESULTSThirty-eight percent (54/141) of the T2-weighted imagesshowed hyperintense signal changes in the putamen. Thecorresponding values for the other MR sequences were 58%(25/43) for PD-weighted, 37% (31/84) for FLAIR and 45%(20/44) for DWI, respectively. Comparable results wereobtained for changes in the caudate nucleus: 35% (50/141)for T2-weighted, 63% (27/43) for PD-weighted, 48%(40/84) for FLAIR and 64% (28/44) for DWI. Corticalhyperintensities were detected in 8 of 141 cases (6%) on T2-weighted, PD-weighted 19% (8/42), FLAIR 50% (42/84)and DWI 77% (34/44). Thalamic changes were rare: only5% (7/141) of the patients showed abnormal signal on T2-weighted, respectively 19% (8/43) on PD-weighted, 8%(7/84) on FLAIR and 14% (6/44) on DWI.CONCLUSIONIn comparison PD-weighted and DWI showed only marginallybetter results in the diagnosis of signal changes in thebasal ganglia compared to T2-weighted and FLAIR.However, in the diagnosis of cortical changes in CJD, bothFLAIR and DWI were clearly superior to the other MR techniques.Diffusion-weighted imaging was the most sensitivetool in the detection of cortical changes in CJD.KEY WORDS: Creutzfeldt-Jacob disease, MR sequences, diffusion-weightedimaging10Paper 9 Starting at 11:19 AM, Ending at 11:27 AMQuality Assessment for Routine Clinical MRSpectroscopyLindquist, D. M. 1 · Glasier, C. M. 21University of Arkansas for Medical Sciences, Little Rock,AR, 2 Arkansas Children’s Hospital, Little Rock, ARPURPOSEOne of our clinical spectroscopy exams failed due to instrumentalproblems. We felt that this could be prevented withregular quality control scans. Several papers have addressedquality control in MR spectroscopy for research sites.However, these approaches to quality control require specialphantoms and procedures that are difficult for purely clinicalsites to implement. Quality control at these sites is equallyimportant. This paper presents a simple protocol for weeklyquality control monitoring.MATERIALS & METHODSWe use the standard head coil to collect an axial image of acommercial MR spectroscopy phantom. Then we place an 8cm 3 voxel in each of three regions along a diagonal withinthe phantom in the order center, upper right quadrant, andbottom left quadrant. These correspond roughly to the positionsof the thalamus, frontal lobe, and occipital lobe inpatients. We acquire 35 ms and 144 ms echo-time spectrawith a repetition time of 2000 ms. After we acquire the spectra,we acquire a voxel image using the same sequence withthe 35 ms echo time and a shorter repetition time. The totaltime to acquire the data is about 30 minutes. We determinethe image uniformity of the axial localizer in accordancewith the American College of Radiology method (1). Wedetermine the quality of the localization by measuring therelative intensities of the signal from the voxel and from anysurrounding artifacts. We also compare the size of the artifactwith the size of the voxel. We analyze the spectra usingthe manufacturer’s automated software, which reports peakheights for N-acetylaspartate, creatine, choline, myo-inositol,and water normalized for receiver gains and line width.We record the percent image uniformity, the signal intensities,and sizes of the voxel and any artifacts in a logbook. Wealso record the line width of water as reported by the scannerand the peak heights of N-acetyl aspartate, creatine,choline, myo-inositol, and water. Weekly values are comparedto preceding entries to ensure that the instrument performancedoes not change significantly over time.RESULTSThe average percent deviation for the 35 ms echo time datawas 7.23% and the average percent deviation for the 144 msecho time data was 4.55%. We also found that the systemconsistently reported larger values for the peaks along thediagonal from the upper right to the lower left. This variationin peak heights corresponded to the image inhomogeneityand was not statistically significant. Voxel contaminationwas minimal.
CONCLUSIONThe data from the phantom are reproducible and provide anindication of the stability and reliability of the instrument.The quality control protocol described here is easy to implement,requires minimal scan time, requires minimal time toanalyze, and provides a reliable assessment of the instrumentperformance over time. Since implementing this procedure,we have had no further problems with poor clinical spectradue to instrument problems.REFERENCES1. Phantom Test Guidance for the ACR MRI AccreditationProgram. American College of Radiology 2000;16-18KEY WORDS: Quality control, MR spectroscopyPaper 10 Starting at 11:27 AM, Ending at 11:35 AMSusac’s Syndrome: MR Imaging Evaluation of 24PatientsSonne, D. C. 1 · Gean, A. D. 1 · Glastonbury, C. M. 1 · Murtagh,F. R. 2 · Susac, J. O. 31University of California San Francisco, San FranciscoGeneral Hospital, San Francisco, CA, 2 University of SouthFlorida, Tampa, FL, 3Neurology and NeurosurgeryAssociates, Winter Haven, FLPURPOSESusac’s syndrome (SS) is a self-limited microangiopathyinvolving the brain, retina, and cochlea, which is thought tobe immune-mediated. Diagnosis is based on a clinical triadconsisting of encephalopathy, branch retinal artery occlusions,and hearing loss. Because the disease typically affectsyoung women, and the imaging findings include multifocalperiventricular white matter (WM) lesions with involvementof the corpus callosum (CC), SS may be misdiagnosed asmultiple sclerosis (MS) or acute disseminatedencephalomyelitis. The goal of this study was to evaluate theMR imaging manifestations of SS, and to identify findingsthat may distinguish it from other white matter diseases.MATERIALS & METHODSThe MR images of 24 patients with clinically confirmed SSwere reviewed. The studies included at least T2-weighted orFLAIR sequences. Lesions were categorized by location(CC, supratentorial WM, basal ganglia and thalami (BG),brainstem, cerebellum), signal characteristics, and morphology.Follow-up imaging in 2/3 of patients ranged from 2-21months.11RESULTSAll patients had multifocal supratentorial WM lesions withinvolvement of the CC. In the early stages of the disease, theCC lesions were noted to have a round or “snowball” appearance.The majority of these lesions involved the central callosalfibers with relative sparing of the peripheral fibers andcallosal undersurface. Seventy-three percent had involvementof the BG, which was sometimes the dominant imagingfinding and coincided with or followed the developmentof CC lesions. Other common locations included the cerebellum(both white and gray matter - 60%) and brainstem(73%). Ninety percent of patients showed scattered punctateleptomeningeal or parenchymal contrast enhancement. Inaddition to the focal lesions, diffuse ill-defined T2 hyperintensitywas noted throughout the background supratentorialWM. Importantly, many of the distinguishing features of MSwere not seen. For example, the halo of bright T1 signal wasnot observed, CC involvement was disproportionate to thatof the supratentorial WM, and the central pons was involvedto an equal or greater extent than the middle cerebellarpeduncles. Follow-up studies showed residual cavitarylesions within the CC. Global cerebral volume loss andmarked CC thinning were seen in the late stage of disease.CONCLUSIONMR imaging of SS may show a distinctive pattern of multifocalsupratentorial WM lesions that always involve the CC(typically the central fibers). In the early stages of the disease,the lesions may have a round or “snowball” morphology.BG lesions may be the dominant finding and be presentconcurrently with or develop subsequently to the CC lesions.There is frequent involvement of the cerebellum and brainstem,as well as frequent contrast enhancement. All of thesecharacteristics should help differentiate SS from MS. In thechronic stage, however, the imaging findings may overlapwith demyelinating diseases, thus making a specific diagnosismore difficult.REFERENCES1. Susac JO. Susac Syndrome: The Triad of Microangiopathyof the Brain and Retina with Hearing Loss in Women.Neurology 1994;44:591-593KEY WORDS: White matter, corpus callosum, demyelinationPaper 11 Starting at 11:35 AM, Ending at 11:40 AMMR Spectroscopic and Perfusion Imaging toDifferentiate Tumefactive Plaque from Malignant TumorTaing, B. · Pomper, M. G. · Barker, P. B.The Johns Hopkins University School of MedicineBaltimore, MDPURPOSEPatients presenting with a brain mass often undergo stereotacticbiopsy for characterization prior to resection.Tumefactive plaques due to multiple sclerosis (MS) oftenmimic malignant lesions such as gliomas. In an attempt toavoid biopsy, we used proton MR spectroscopic (MRS) andperfusion (rCBV) imaging to differentiate tumefactiveplaque from glioma in patients presenting with a solitarybrain mass.MATERIALS & METHODSTwo patients, each with a brain mass of unknown etiology,presented for MR imaging prior to stereotactic biopsy.Clinically, patient 1 presented with slurred speech andpatient 2 presented with a tonic-clonic seizure. In addition toMonday
Mondayconventional MR imaging, the patients underwent MRS (TE= 280) (1) and rCBV imaging (2, 3). Parametric maps indicatingcholine (Cho), creatine (Cr) and n-acetylaspartate(NAA) concentrations (arbitrary units) were generated aswere maps indicating rCBV (mL/100 g brain). The mapswere analyzed by visual inspection.RESULTSThe metabolite maps in patient 1 demonstrated increasedcholine both within the lesion, in regions adjacent to thelesion, and in the contralateral hemisphere. The correspondingrCBV map showed decreased CBV within the lesioncompared to contralateral white matter. The metabolite mapsin patient 2 showed increased choline only within the lesion,which also showed normal rCBV. Despite elevated cholinewithin the masses of both patients, the normal or reducedrCBV taken together with the clinical data provided sufficientlycompelling justification to obviate biopsy in eachcase. Furthermore, the multifocal and contralateral increasesin choline in patient 1 provided even greater confidence thatthe mass was a tumefactive plaque rather than a glioma.Follow-up MR imaging studies in patients 1 and 2 showed adecrease in size and stability of the original mass, respectively.CONCLUSIONMultiparametric clinical MR imaging can enable the diagnosisof tumefactive plaque with sufficient confidence suchthat brain biopsy can be avoided.REFERENCES1. Golay X, Gillen J, van Zijl PC, Barker PB. Scan TimeReduction in Proton Magnetic Resonance SpectroscopicImaging of the Human Brain. Magn Reson Med2002;47(2):384-3872. Wityk RJ, Goldsborough MA, Hillis A, Beauchamp N, BarkerPB, Borowicz LM, Jr., et al. Diffusion- and Perfusion-Weighted Brain Magnetic Resonance Imaging in Patientswith Neurologic Complications after Cardiac Surgery. ArchNeurol 2001;58(4):571-5763. Cha S, Pierce S, Knopp EA, Johnson G, Yang C, Ton A, et al.Dynamic Contrast-Enhanced T2*-Weighted MR Imaging ofTumefactive Demyelinating Lesions. AJNR Am J Neuroradiol2001;22(6):1109-1116KEY WORDS: Multiple sclerosis, MR spectroscopy, perfusion12Paper 12 Starting at 11:40 AM, Ending at 11:45 AMTacrolimus-Induced Myelinolysis: Involvement of theCerebellar Peduncle and Corpus Callosum on Diffusion-Weighted ImagingMoritani, T. · Ketonen, L. · Hiwatashi, A. · Wang, H. ·Ekholm, S. · Westesson, P.University of RochesterRochester, NYPURPOSETo report a case of tacrolimus-induced myelinolysis, involvingthe cerebellar peduncle and corpus callosum on diffusion-weightedimaging.MATERIALS & METHODSA 54-year-old man with end-stage liver disease secondary tohepatitis C and hepatocellular carcinoma underwent a livertransplant 1 month earlier. He presented with new-onsetslurred speech and confusion that started 5 days before MRimaging. He had taken antifungal and antibiotic therapy,steroids, and tacrolimus after the liver transplant. His confusionwas alleviated after the discontinuation of tacrolimus.He has a history of hypertension, esophageal varices,cholelithiasis, degenerative joint disease of both knees, andleft-sided Bell’s palsy. He has no significant family history.Laboratory data showed no abnormality except for an anemia.Diffusion-weighted imaging and ADC maps (b = 0,1000 sec/mm 2 , 3 orthogonal orientations) were obtained. MRimaging included T1, T2 and Gd-enhanced T1-weighted,and FLAIR images.RESULTST2 and FLAIR images showed multiple hyperintense lesionsin the pons, bilateral middle cerebellar peduncles, the spleniumof the corpus callosum, and periventricular and deepwhite matter. DWI revealed mildly hyperintense lesions inthe central portion of the pons associated with increasedADC (0.98 x 10 -3 /mm 2 /s), which may represents vasogenicedema. In bilateral middle cerebellar peduncles and the spleniumof the corpus callosum, diffusion-weighted imagingdemonstrated round or oval hyperintense lesions associatedwith decreased ADC (0.36-0.56 x 10 -3 /mm 2 /s), representingcytotoxic edema. These findings are consistent withtacrolimus-induced myelinolysis.CONCLUSIONDiffusion-weighted imaging clearly shows involvement ofthe pons, cerebellar peduncles, and corpus callosum intacrolimus-induced myelinolysis. We discuss the pathophysiologyof tacrolimus-induced myelinolysis.REFERENCES1. Mangat KS, Sherlala K. Cerebellar Peduncle Myelinolysis:Case Report. Neuroradiology 2002;44:768-7692. Ravaioli M, Guarino M, Stracciari A, et al. Speech DisorderRelated to Tacrolimus-Induced Pontine Myelinolysis afterOrthotopic Liver Transplantation. Transpl Int 2003;16:507-509KEY WORDS: Diffusion-weighted imaging, cerebellarpeduncle, corpus callosum
Paper 12A Starting at 11:45 AM, Ending at 11:50 AMReading Brain CT Scans On Computer Displays: IsThere An Optimum Image Display Rate?Mamourian, A. C. · Khwaja, A. B. · Saykin, A. J. · Wishart,H. A. · McDonald, B. C. · Johnson, D. P.Dartmouth Hitchcock Medical CenterLebanon, NHPURPOSEFilmless radiology departments using computer workstationshave fundamentally altered the way that radiologistsread cross sectional examinations. Instead of viewing multipleimages displayed simultaneously, the images are usuallyviewed individually and for most studies, rapidly. Currentcomputers allow rapid display with frame rates of eightframes a second or more. We wondered how this capabilityof rapid review affects the accuracy of reading of head CTscans. We designed a study to test our hypothesis that morefalse negatives would occur at frame rates above two persecond even though the workstation technology allow muchhigher rates.MATERIALS & METHODSTen study subjects were shown one of four sets of twelvehead CT scans of varying difficulty. Each case was accompaniedby limited but appropriate history and was displayedat a frame rate of either one slice every two seconds, two persecond, five per second, or eight per second. Each of the foursets of images included all the same cases but all four rateswere randomly assigned to each of the four sets. Two normalswere in the mix of twelve cases. The abnormals variedin difficulty and one case had two unrelated findings. Theimages were stored on a CD and displayed on a high resolutionlaptop liquid crystal display. Prior to viewing the casesthe subjects were asked to choose which of the frame ratesthey usually use to view images from a choice of the fourrates which were displayed simultaneously. The case imageswere displayed only once with no option to go back andreview individual images. The data sheet allowed the subjectto rate their confidence level for their diagnosis in each caseas well as their comfort level with the specific display ratefor each case. The subjects were all either staff radiologists,residents, or fellows in our program. These included twoCAQ neuroradiologists, one first year radiology resident ona neuro rotation, three third year residents, two fourth years,one CVIR fellow and one cross sectional fellow.RESULTSThere was no significant difference in the accuracy of thereaders between the four display rates. Their confidencelevel was lower for the abnormals at the higher rates but theirconfidence level for the normals decreased at the slowerrates. Four of the subjects chose the rate of five per secondas their usual rate, four chose two per second and two choseone every two seconds. None of the subjects correctly identifiedthe second abnormal findings in the case with twounrelated abnormalities any speed.13CONCLUSIONRadiologist can acquire and integrate a surprising amount ofdiagnostic information at display rates up to eight images asecond. While there did not appear to be a significant differencein their accuracy at the different display rates, confidencelevels decreased at the fastest and slowest rates.Multiple lesions present a potential pitfall however.AbnormalSpeed* Number Accuracy Confidence** Comfort***Mean Std Dev Mean Std Dev Mean Std Dev0.5 24 0.75 0.44 12.1 20.8 46.7 18.72 26 0.69 0.47 16.6 26.3 71.6 19.25 26 0.75 0.45 21.5 27.4 85 12.68 24 0.67 0.48 21 25.7 92.5 12.3NormalSpeed* Number Accuracy Confidence** Comfort***Mean Std Dev Mean Std Dev Mean Std Dev0.5 6 0.83 0.41 60.8 12.7 74.5 212 4 1 0 66.3 0.5 82 17.25 4 1 0 72.5 12.3 80.3 21.88 6 0.67 0.52 53.5 16.6 97 4.1*Speed is given as Images/Second**Confidence Scale: 0 = Definitely Abnormal, 100 =Definitely Normal***Comfort Scale: 0 = Way too Slow, 50 = Perfect Speed,100 = Way too FastKEY WORDS: FilmlessMonday Morning10:15 AM - 11:45 AMBallroom 6 A(6b) Adult Brain: CerebrovascularDisease and Stroke(Scientific Papers 13 - 23)See also Parallel Sessions(6a) Adult Brain: General and High Field Imaging(6c) Head & Neck: General(6d) Pediatrics: Fetal and Neonatal ImagingModerators:Ellen G. Hoeffner, MDEric J. Russell, MD, FACRMonday
MondayPaper 13 Starting at 10:15 AM, Ending at 10:23 AMAccuracy of Dynamic Perfusion CT with Deconvolutionin Detecting Acute Hemispheric StrokeWintermark, M. 1,2 · Fischbein, N. J. 2 · Smith, W. S. 2 · Ko, N.U. 2 · Quist, M. 3 · Dillon, W. P. 21Lausanne University, Lausanne, SWITZERLAND,2University of California San Francisco, San Francisco, CA,3Philips Medical Systems, Best, NETHERLANDSPURPOSEDynamic perfusion CT (PCT) with deconvolution producesmultiple maps: time-to-peak (TTP), mean transit time(MTT), regional cerebral blood flow (rCBF), and regionalcerebral blood volume (rCBV). Computer programs implementingthresholds also have been used to create automatedmaps detailing infarction and ischemic penumbra. All thesemaps are interpreted with noncontrast CT (NCT) in patientswith suspected stroke. The goal of this study was to determinethe accuracy of PCT maps in comparison to noncontrastCT, in patients presenting with suspected acute hemisphericstroke.MATERIALS & METHODSForty-six patients were enrolled in our study, who had suspectedhemispheric stroke of 12-hours duration or less andunderwent NCT and dynamic PCT on admission, as well asfollow-up CT or MR scan. NCT examinations werereviewed by two observers for stroke signs. PCT maps werereviewed by the same observers for TTP, MTT, rCBF, andrCBV abnormalities. Sensitivity, specificity, and accuracy, aswell as interobserver agreement, were calculated and comparedwith Wilcoxon tests. NCT and PCT also werereviewed for the stroke extent according to ATLANTIS andASPECTS-derived methods. Finally, sensitivity, specificity,and accuracy of a computerized automated map of infarctand penumbra were evaluated for the detection and theextent of brain ischemia.RESULTSPCT maps have a significantly higher accuracy than NCT inthe detection of stroke (75.7% to 86.0% vs 66.2%, p < 0.01).MTT maps are significantly more sensitive than NCT(77.6% vs 69.2%, p < 0.01). rCBF and rCBV maps are significantlymore specific than NCT (90.0% for rCBF / 92.7%for rCBV vs 65.0% for NCT, p < 0.01). With respect to thestroke extent, PCT maps are significantly more sensitivethan NCT (kappa up to 94.4% vs 42.9%, p < 0.01), and alsoshow a significantly higher interobserver agreement (up to0.763). The sensitivity, specificity, and accuracy of the computerizedautomated map of ischemia were 68.2%, 92.3%,and 88.1% for the detection of brain ischemia, and 72.2%,91.8%, and 87.9% for the extent of brain ischemia.14CONCLUSIONDynamic PCT maps are more accurate than NCT in thedetection of hemispheric strokes. Despite limited spatialcoverage, PCT is accurate in showing strokes of more thanone third of the MCA territory.KEY WORDS: Perfusion CT, acute stroke, accuracyThe authors of this work have indicated that they will be discussing/presentingan unapproved or investigative use ofperfusion CT prototype software made by Philips MedicalSystems for brain perfusion assessment.The authors of this work have indicated the following affiliations/disclosures:Philips Medical Systems: Employee.Paper 14 Starting at 10:23 AM, Ending at 10:31 AMDynamic Perfusion CT in the Management of AcuteIschemic Stroke: Diagnostic Accuracy and PatientSelection for Intraarterial ThrombolysisGasparotti, R. · Mardighian, D. · Pavia, M. · Pinelli, L. ·Florio, S. · Liserre, R. · Magoni, M.University of BresciaBrescia, ITALYPURPOSEThere is increasing evidence that patient selection for acutestroke therapy based on cerebral hemodynamics may lead toexpansion of the therapeutic window, improved outcomes,and lower complication rates. Perfusion CT (PCT) was performedin acute stroke to determine its clinical utility in theevaluation of patients who undergo intraarterial thrombolysis.MATERIALS & METHODSFirst-pass double-section PCT was performed in 61 patients,with acute hemispheric stroke within 5 hours from the onsetof symptoms. Time-to-peak (TTP), relative mean transittime (rMTT), relative cerebral blood volume (rCBV) andcerebral blood flow (rCBF) maps were computed offlinewith a commercial software. Infarct “core” was defined asthe lesion area identified on CBF maps. TTP maps identifiedthe sum of ischemic penumbra and core. Regions of interest(ROI) were placed manually in ACA, MCA, and PCA territoriesof both hemispheres, obtaining relative indices.Neurologic status was assessed at admission (NationalInstitutes of Health Stroke Scale; NIHSS) and on day 90(modified Rankin Score; mRS). Twenty patients were selectedfor intraarterial thrombolysis with superselective injectionof Urokinase and mechanical thrombus fragmentation,on the basis of clinical (10 < NIHSS < 30) and angiographiccriteria (8 carotid T occlusions, 2 ICA occlusions + MCAembolism, 10 MCA occlusions). Evolution of the ischemicregions was assessed by comparing PCT maps with followupCT at 21 days.RESULTSNoncontrast CT had 64% sensitivity and 100% specificity indetecting early ischemic changes, TTP maps 98% sensitivityand 80% specificity, CBV and CBF maps 75% sensitivityand 100 % specificity. Two PCT patterns were identified: A)Corresponding perfusion deficits in the 4 maps, indicating
absence of ischemic penumbra; B) TTP/CBF mismatch,indicating presence of ischemic penumbra. In 12 of 31untreated patients with pattern A the final infarct sizematched the initial perfusion deficit in 100% of subjects(NIHSS 15.71 ± 6.62). In 3 of 20 treated patients with patternA, despite arterial recanalization, infarct size equalledthe initial perfusion deficit (mRS 4 n = 2, mRS 6 n = 1). In19 of 31 untreated patients with pattern B infarct sizematched ischemic penumbra in 6 cases (NIHSS 8.5 ± 6.2). In17 of 20 treated patients with pattern B the final infarct sizematched the ischemic core only when arterial recanalizationoccurred (n = 13) (mRS £ 2 n = 6, mRS 3-5 n = 7), whileinfarct size equalled the penumbra in the remaining 4 withno recanalization (mRS 3-5 n = 3, mRS 6 n = 1). The quantitativeanalysis of the ischemic ROIs showed a statisticallysignificant difference between core (DTTP 13.57 ± 7.55,rCBV 0.61 ± 0.27, rCBF 0.37 ± 0.28) and penumbra (DTTP3.13 ± 2.80, rCBV 1.14 ± 0.27, rCBF 0.74 ± 0.20) (p
MondayPaper 16 Starting at 10:39 AM, Ending at 10:47 AMComparison of Perfusion CT and CT AngiographySource Images with Perfusion-Weighted and Diffusion-Weighted Imaging in Patients with Acute Stroke < 6HoursSchramm, P. 1 · Schellinger, P. D. 1 · Klotz, E. 2 · Fiebach, J. B. 1· Sartor, K. 11University of Heidelberg, Heidelberg, GERMANY, 2 SiemensMedical Solutions CTC AP, Forchheim, GERMANYPURPOSEWhile stroke MR imaging is the evolving diagnostic goldstandard, many stroke patients are admitted to hospitalswithout 24/7 MR imaging availability. We aimed to determinethe diagnostic accuracy of the combination of noncontrast-enhancedCT (NECT), CT angiography (CTA) includingCTA source images (CTA-SI) and perfusion CT (PCT) incomparison with a multiparametric stroke MR protocol inacute stroke < 6 hours.MATERIALS & METHODSNoncontrast-enhanced CT, PCT, CTA, stroke MR imaging,including diffusion-weighted and perfusion-weighted imaging,and MR angiography (MRA) were performed in patientswith symptoms of acute stroke < 6 hours. We analyzedinfarct volumes on patients’ arrival as shown on NECT, PCT,CTA-SI, diffusion-weighted and perfusion-weighted imaging(Wilcoxon, Spearman) and compared it to the finalinfarct lesion as shown on day 5 NECT.RESULTSTwenty-three stroke patients underwent CT and MR scanningwithin 6 hours. Neither did PCT TTP volumes differfrom perfusion-weighted imaging TTP (p = 0.586), nor didPCT CBV differ from perfusion-weighted imaging CBV (p= 0.642). CTA-SI volumes did not differ from diffusionweightedimaging volumes (p = 0.272). Lesion volumesmeasured in PCT Maps significantly correlated with lesionvolumes on perfusion-weighted imaging (p < 0.0001 r =0.935 for TTP; p < 0.0001 r = 0.898 for CBV). Also, highlysignificant correlation between PCT CBF lesion volumesand final infarct volume was found.CONCLUSIONIn hyperacute stroke, a multiparametric CT protocol allowsa comprehensive diagnosis within less than 15 minutes bycombining noncontrast-enhanced CT (NECT), perfusion CT(PCT), and CT angiography (CTA). When stroke MR imagingis not available, multiparametric stroke CT can givenearly equivalent information, and is significantly morecomprehensive than NECT alone.KEY WORDS: Acute stroke, perfusion CT, perfusion MRimagingThe authors of this work have indicated the following affiliation/disclosure:Siemens Medical Solutions CTCAP:Employee.16Paper 17 Starting at 10:47 AM, Ending at 10:55 AMAssessment of Tissue Viability with Quantitative CTPerfusion in Acute Ischemic Stroke Patients Treated withIntraarterial ThrombolysisSchaefer, P. W. · Roccatagliata, L. · Ledezma, C. J. ·Gonzalez, R. G. · Koroshetz, W. J. · Lev, M. H.Massachusetts General HospitalBoston, MAPURPOSECT perfusion imaging reflects pathophysiologic changesduring stroke evolution. We sought to determine parametersthat distinguish brain regions destined to infarct from thosethat will survive despite hypoperfusion in patients treatedwith intraarterial (IA) thrombolysis.MATERIALS & METHODSCT perfusion images were obtained in 9 patients with proximalMCA emboli treated with IA thrombolysis within 6hours. Cerebral blood volume (CBV) and CBF values wereobtained in 1) infarct core with low CBV, low CBF and follow-upabnormality, 2) penumbra that infarcts with normalCBV, low CBF, and follow-up abnormality and 3) penumbrathat remains viable with normal CBV, low CBF, and normalfollow-up. Cerebral blood volume and CBF ratios were calculated.Cerebral blood flow values were also obtained inROIs placed within gray matter (GM) or white matter (WM).RESULTSMean CBF ratios for all tissue were 0.20, 0.31, and 0.43 forregions 1, 2, and 3, respectively and were significantly different.Mean CBF values for GM in regions 1, 2, and 3 were13.2, 19.5, and 29.6 ml/100 gm/min, respectively and weresignificantly different. Mean CBF values for all tissue were9.3, 19.0, and 21.1 ml/100 gm/min in regions 1, 2, and 3,respectively. Mean CBF values for WM were 4.49, 9.5, and10.6 ml/100 gm/min in regions 1, 2, and 3 respectively.Mean CBV values for all tissue were 1.00, 2.3, and 2.4ml/100 gm in regions 1, 2, and 3, respectively. Mean CBVratios for all tissue were 1.00, 2.3, and 2.4 ml/100 gm inregions 1, 2, and 3, respectively. For all tissue CBF, WMCBF, all tissue CBV and CBV ratios, regions 2 and 3 weresignificantly different (p, 32.4 ml/100gm/min, and CBF WM > 18.4 ml/100 gm/min remainedviable. Regions 2 and 3 had ROIs with CBV elevated abovenormal.Region 1 Region 2 Region 3 P value R2 vs R3Mean CBF 9.3 19.0 21.1 NS(ml/100 gm/min)Mean CBF Ratio 0.20 0.31 0.43 0.02Mean CBF GM 13.2 19.5 29.6 0.05(ml/100 gm/min)Mean CBF WM 4.5 9.5 10.6 NS(ml/100 gm/min)Mean CBV 1.0 2.3 2.4 NS(ml/100 gm)Mean CBV Ratio 0.49 0.82 0.91 NS
17CONCLUSIONMean CBF ratios and absolute CBF GM values are useful indistinguishing hypoperfused tissue likely to infarct fromhypoperfused tissue likely to survive with IA thrombolysis.Other CBF and CBV values may provide adjunctive information.This information may be useful in differentiatingpatients likely to benefit from reperfusion therapy from thosewho are not.MondayKEY WORDS: CT perfusion, acute strokePaper 18 Starting at 10:55 AM, Ending at 11:03 AMAre There Time-Dependent Differences of MR ImagingParameters within 6 Hours after Stroke Onset?Fiehler, J. · Kucinski, T. · Thomalla, G. · Weiller, C. · Rother,J. · Zeumer, H.University of HamburgHamburg, GERMANYPURPOSEStroke heterogeneity in CT-based studies has been attributedas main cause for missing efficacy of intravenous rtPA therapywithin 3 to 6 hours. The success of the PROACT II studywithin the 6-hours time window might be attributed at leastin part to the design focused on the angiographically provenMCA occlusion. We investigated early time-dependent differencesin acute stroke pathophysiology by multiparametricMR imaging.MATERIALS & METHODSDiffusion- and perfusion-weighted MR imaging and MRangiography of 112 acute ischemic stroke patients within < 6hours after were dichotomized into a < 3-hour group (n = 52)and a 3-6-hour group (n = 60). Lesion volumes were determinedfor apparent diffusion coefficient (ADC_man) and thesub-region with ADC values < 550 x 10 -9 mm -1 s 2 (ADC 8 s.Mean values were computed for ADC and TTP delay withinthese volumes and in the mismatch (ADC_man-TTP > 2 s).To correct for the heterogeneity of occlusion types betweenboth groups, an analysis of patients presenting with occlusionof the MCA_trunk (n = 36) and MCA_branches (n = 30)was performed.RESULTSADC lesion volumes and TTP > 2 s lesion volume were notdifferent in the < 3-hour group compared to 3-6-hour group.There was a greater ratio of ADC < 550 within the entireADC lesion, most pronounced in patients with MCA trunkocclusions (32% vs 49%, p = 0.017). Patients with occlusionof the MCA_trunk in the < 3-hour group showed initiallymore severe neurologic symptoms and a larger mismatchvolume (p = 0.047). The tissue volume with a TTP-delay of> 8 s was significantly smaller and the tissue volume with aTTP-delay of 2-4 s was significantly larger compared to the3-6-hour group in patients with MCA_branch occlusions.This resulted in a less severe TTP delay in the mismatchregion.Figure: Diagrams for the lesion volumes of MCA_trunk andMCA_branch. Stacked bars for ADC show more severeADC decreases (ADC < 550) than less severe (ADC > 550)after 3-6 hours of the in MCA_trunk (a) and no difference inMCA_branch (b). There was no significant difference in thecomposition of the perfusion abnormality in MCA_trunk (c).In MCA branch there was smaller volume with severe TTPdelay (> 8 s) after 3-6 hours.CONCLUSIONThe ADC values are lower after 3-6 hours within a stablelesion volume; lesions in perfusion-weighted imaging areeither smaller or show a less severe deficit as compared to
Mondayrecanalization strategies. The degree of the initially disturbedtissue metabolism in stroke can be estimated using theapparent diffusion coefficient (ADC).MATERIALS & METHODSInitial ADC lesions of 120 acute ischemic stroke patientswithin < 6 hours after stroke onset, on day 1 and on days 5-8 were investigated. These patients were categorized to predefinedvessel occlusion sited using MR angiography. Weused spatially normalized 3D maps of the ADC to assess thevolume and distribution of the initial metabolic impairment.Lesion volumes of ADC were determined by manual delineationand by a threshold method for ADC values < 550 x 10 -9mm -1 s 2 . Infarct volumes were analyzed on days 5-8 afterstroke onset either on T2-weighted (n = 109) or CT images(n = 11). Three-dimensional probability maps of initial ADClesions were used to visualize the anatomical distribution foreach occlusion type. Vessel recanalization was analyzedfrom the follow-up MR study on day 1 on the basis of theperfusion-weighted and MR angiography studies.RESULTSPatients were categorized as follows: proximal ICA and MCA(n = 19), carotid-T (n = 16), combined ACA/MCA (n = 4),MCA_trunk (n = 39), MCA_trif (n = 9), MCA branch (n =33). Mean lesion volumes in ADC550/ADCman/infarct wereproximal ICA and MCA (18/45/88 mL), carotid-T (18/54/144mL), combined ACA and MCA (14/59/121 mL), MCA_trunk(16/41/71 mL), MCA_trif (17/42/48), MCA_branch (7/27/29mL). The highest rate of reperfusion was found afterMCA_branch occlusion (64.3%) whereas lowest rate wasseen in CTO and occlusion of ICA/MCA (7.7% and 38.5%).Figure: Spatial distribution of severe ADC decreases belowa threshold of 550 x 10 -9 mm -1 s 2 . Most severe ADC decreaseswere observed in the striatum, which is supplied predominantlyby terminal branches, probably due to the rapidbreakdown of tissue metabolism. Severe decreases also inwhite matter and cortical regions can be observed in occlusionsof the ICA/MCA and MCA_trunk.CONCLUSIONThe early ischemic tissue impairment estimated by the ADCcan be small even in patients with proximal vessel occlusions.In case of low recanalization rates, these small lesionsare followed by large infarcts and a bad clinical outcome.This scenario suggests a considerable lesion growth overtime, which might be averted by therapeutic vessel recanalization.The development of therapeutic interventions toimprove the recanalization rates is mandatory in patientswith proximal vessel occlusions.KEY WORDS: Stroke, therapy, MR imaging18Paper 20 Starting at 11:11 AM, Ending at 11:19 AMAsymmetric Oxygen-Related Cerebrospinal FluidHyperintensity on Fluid-Attenuated Inversion-RecoveryImaging in Patients with Focal HemodynamicAbnormalities: A New Marker for Brain Tissue OxygenLevels?Zaharchuk, G. 1 · Martin, A. J. 1,2 · Higashida, R. T. 1 · Su, H.S. 3 · Dillon, W. P. 11University of California San Francisco, San Francisco, CA,2Philips Medical Systems, Best, NETHERLANDS,3University of Pennsylvania, Philadephia, PAPURPOSECerebrospinal fluid (CSF) hyperintensity on fluid-attenuatedinversion-recovery (FLAIR) imaging has been identified inpatients breathing supplemental oxygen, and probably representsthe effect of T1 shortening caused by increased CSFoxygenation (1, 2). Given the contiguity of CSF and thecerebral extracellular spaces, these changes may be sensitiveto the oxygen level of surrounding brain tissue (3). Previousreports have demonstrated oxygen-related FLAIR hyperintensityin a bilateral, symmetric pattern. This reportdescribes several patients with hemodynamic abnormalitiesdemonstrating asymmetric FLAIR CSF hyperintensity in thesetting of supplemental oxygen administration.MATERIALS & METHODSEight patients with asymmetric FLAIR (TR/TE/TI =11000/140/2800 ms) hyperintensity during or following supplementaloxygen were identified. A 66-year-old woman hada chronic subcortical right hemispheric infarction and rightICA stenosis; 6 patients were imaged after carotid arterystenting; 1 patient was imaged during intracarotid balloontest occlusion (BTO). The latter two groups were studiedusing an integrated angiography-MR suite, supported duringor immediately prior to MR imaging with nasal or facemaskoxygen.RESULTSIn the chronic stroke patient, there was marked hyperintensitywithin the left hemispheric CSF spaces following oxygen;the right hemispheric CSF spaces were normal. One hourlater, noncontrast CT demonstrated normal CSF signal bilaterally,excluding subarachnoid hemorrhage. Cerebralangiography later that day demonstrated thrombus near thetakeoff of the right CCA and 80% right ICA stenosis. Nocrossfilling to the right during left ICA injection was seen;50% stenosis of the left ICA was present. Of 8 carotid stentpatients studied, 6 demonstrated unilateral hyperintensity inthe convexity CSF after stenting in the territory of the stentedartery. No prestent images with oxygen were performed;however, postcontrast FLAIR images were normal. In 1 of 2patients imaged with oxygen during BTO, CSF hyperintensitywas present over the convexities ipsilateral to the occlusion.In the stent and BTO patients, Gd-DTPA was administeredseveral hours earlier; the possibility that the unilateralCSF hyperintensity reflects extravasated contrast cannot beexcluded, but is considered unlikely.
19of the parameters on PCT results is mostly unknown. Thegoal of this study was to assess the influence of the temporalsampling rate and the contrast bolus volume on PCT results.MATERIALS & METHODSSixty consecutive patients, all with ischemic hemisphericstroke of 12-hours duration or longer, underwent PCT examinationsthat varied only in the volume of contrast materialused for the bolus. The patients were divided into 4 groupsof 15 patients based on the volume of contrast used for PCT30 mL, 40 mL, 50 mL, and 60 mL. For each group ofpatients, regional cerebral blood volume (rCBV), flow(rCBF), mean transit time (MTT), and time-to-peak (TTP)maps were calculated using 7 different temporal samplingintervals: 0.5, 1, 2, 3, 4, 5 and 6 seconds. PCT results werecompared using Wilcoxon (Mann-Whitney) tests, with a significancelevel set at 0.01 to account for the multiple testing.Signal-to-noise ratios, time duration of arterial entrance tovenous exit, and radiation dose also were assessed for eachbolus volume.MondayCONCLUSIONAsymmetric FLAIR CSF hyperintensity in the setting ofsupplemental oxygen was observed in several patients withunderlying hemodynamic abnormalities and following neurointerventionalprocedures. Quantitative CSF T1 measurementswith and without oxygen may provide insight intocerebrovascular hemodynamics and local brain tissue oxygenation.REFERENCES1. Filippi CG, Ulug AM, Lin D, et al. Hyperintense SignalAbnormality in Subarachnoid Spaces and Basal Cisterns onMR Images of Children Anesthetized with Propofol: NewFluid-Attenuated Inversion Recovery Finding. AJNR Am JNeuroradiol 2001;22:394-3992. Deliganis AV, Fisher DJ, Lam AM, et al. Cerebrospinal FluidSignal Intensity Increase on FLAIR MR Images in PatientsUnder General Anesthesia: The Role of Supplemental O2.Radiology 2001;218:152-1563. Jarnum S, Lorenzen I, Skinhoj E. Cisternal Fluid OxygenTension in Man. Neurology 1964;14:703-707KEY WORDS: FLAIR, oxygen, CSFThe authors of this work have indicated the following affiliations/disclosures:Philips Medical Systems: Employee.Paper 21 Starting at 11:19 AM, Ending at 11:27 AMDynamic Perfusion CT: Optimizing the TemporalResolution and Contrast Volume for Calculation ofPerfusion CT Parameters in Stroke PatientsWintermark, M. 1,2 · Smith, W. S. 2 · Ko, N. U. 2 · Quist, M. 3 ·Schnyder, P. 1 · Dillon, W. P. 21Lausanne University, Lausanne, SWITZERLAND,2University of California San Francisco, San Francisco, CA,3Medical IT - Advanced Development, Philips MedicalSystems, Best, NETHERLANDSRESULTSWith increasing temporal sampling intervals, rCBV, rCBF,and TTP values were overestimated significantly, and MTTvalues significantly underestimated compared with the classicaltemporal sampling interval of 1 second. Maximalallowable sampling intervals to avoid overestimation ofrCBV, rCBF, and TTP, and underestimation of MTT, werefound as: 2, 3, 3, and 4 seconds 1 for the 30 mL, 40 mL, 50mL, and 60 mL bolus volumes, respectively. Venous exit ofcontrast was observed in 97.5% of patients after 36, 42, 42,and 48 seconds, respectively, for the four bolus volumes. Onthe other hand, there was no difference in signal-to-noiseratios for the four volumes. Finally, the brain effective radiationdose varied between 0.852 and 1.867 mSv, dependingon the PCT protocol used; cine mode with two injections of40 mL boluses and toggling-table technique with injection ofone 60 mL bolus were associated with the lowest radiationdoses.CONCLUSIONA temporal sampling interval greater than 1 second can beused for PCT scanning, without altering the quantitativeaccuracy of PCT results. Increasing the sampling intervalreduces the radiation dose to the patient and perhaps mayallow for an increased spatial coverage.KEY WORDS: Perfusion CT, acquisition technique, strokeThe authors of this work have indicated that they will be discussing/presentingan unapproved or investigative use ofperfusion CT prototype software made by Philips MedicalSystems for brain perfusion assessment.The authors of this work have indicated the following affiliations/disclosures:Philips Medical Systems: Employee.PURPOSENumerous parameters are involved in the acquisition of adynamic perfusion CT (PCT) series. The relative influence
MondayPaper 23 Starting at 11:35 AM, Ending at 11:43 AMAssessment of Cerebral Hemodynamics and VascularReserve in Patients with Symptomatic Carotid ArteryOcclusion or Critical Carotid Stenoses: An IntegratedMR MethodGriffiths, P. D.University of SheffieldSheffield, UNITED KINGDOMPURPOSEWe describe an MR-based methodology designed to studycerebral hemodynamic compromise in patients with symptomaticcarotid occlusions and critical stenoses.MATERIALS & METHODSTwelve patients were studied, all with unilateral transientischemic attacks ipsilateral to either an occluded carotidartery (8) or a stenosis of 95-99% severity (4). Imaging consistedof MR angiography of the cervical carotids and circleof Willis, MR imaging of the brain and dynamic gadoliniumMR perfusion studies before and after the intravenous injectionof acetazolamide (1000 mg). All examinations were performedon a 1.5 T superconducting system (Eclipse, PhilipsMedical Systems). The perfusion studies consisted of singleshot,gradient-recalled echo-planar technique (T2*-weighted).Those studies were analyzed using the proprietary softwareto calculate transit time (TTfm) and relative cerebralblood volume (rCBV); however only TTfm data are discussedin this paper. We have described previously theappropriateness of performing repeat perfusion studies at thesame MR event (1).RESULTSAll patients showed increased TTfm in the symptomatichemisphere at rest. In the hemispheres over occluded vesselsthis ranges from 0.9s to 9.9s when compared to the oppositeside and 1.8s to 3.8s over critically stenosed vessels. Theasymmetries in TTfm became more pronounced after acetazolamidein all patients. There was an inverse correlationbetween the degree of increased TTfm and the degree of collateralizationaround the circle of Willis.CONCLUSIONAssessment of cerebrovascular reserve using an acetazolamidechallenge can be performed in one MR imagingevent. The demonstration of both the macroscopic vascularanatomy and microvascular reserve in patients with possiblelow-flow states is important for full assessment.REFERENCES1. Pandaya H, Wilkinson ID, Griffiths PD. Sequential DynamicGadolinium MR Perfusion Weighted Imaging: Effects onTransit Time and Cerebral Blood Volume Measurements.Presented at British Society of Neuroradiology, Amsterdam,October 2003KEY WORDS: Carotid stenosis20Monday Morning10:15 AM - 11:45 AMRoom 606 - 609(6c) Head & Neck: General(Scientific Papers 24 - 35)See also Parallel Sessions(6a) Adult Brain: General and High Field Imaging(6b) Adult Brain: Cerebrovascular Disease and Stroke(6d) Pediatrics: Fetal and Neonatal ImagingModerators:Nancy J. Fischbein, MDPatricia A. Hudgins, MDPaper 24 Starting at 10:15 AM, Ending at 10:23 AMMR Imaging of Fetal Head and Neck MassesRobson, C. D. 1 · Barnewolt, C. E. 1 · Rahbar, R. 1 · Ozgen, B. 2· Levine, D. 3 · Estroff, J. 1 · Fishman, S. 1 · Jennings, R. 11Children’s Hospital, Boston, MA, 2 Brigham and Women’sHospital, Boston, MA, 3 Beth Israel Deaconess MedicalCenter, Harvard Medical School, Boston, MAPURPOSEFetal head and neck masses commonly are encountered onroutine prenatal sonography. Fetal MR imaging has emergedas a useful tool for further characterization of these masses.The purpose of this paper is to retrospectively evaluate MRimages of 10 patients found to have fetal head or neck masses,and to evaluate the utility of MR imaging in providingaccurate diagnoses and guiding further intervention.MATERIALS & METHODSThe medical records and imaging studies of 10 women foundto have fetal head or neck masses were reviewed. All patientswere referred following the detection of a mass on sonography.All patients underwent MR imaging using a longextremity coil and single-shot fast spin-echo T2-weightedimages. Maternal ages ranged from 20 to 39 years. The gestationalage at the time of the MR imaging ranged from 24 to35 weeks.RESULTSFetal MR imaging demonstrated complex, partly cysticmasses with an accurate diagnosis of teratoma in 4 fetuses.MR imaging demonstrated compression of the airway inthese 4 patients, who subsequently were delivered withCaesarian section and the EXIT (ex-utero intrapartum treatment)procedure. All babies underwent surgical resection oftumor shortly after birth. Macrocystic lymphatic malformationswere diagnosed accurately on MR imaging in 4 fetuseswith multicystic masses, with a differential diagnosis of ter-
atoma in one case. Trisomy 21 was diagnosed on amniocentesisin one patient. Another fetus in a twin pregnancy sufferedin utero demise with massive hydrops fetalis and wasdiagnosed with Turner syndrome on amniocentesis. Threebabies were born, diagnosed with lymphatic malformationbased clinical examination and postnatal imaging, and managedconservatively. One patient had a massive solid scalpmass, diagnosed initially as congenital hemangioma, or possiblyother tumor. Subsequent MR images demonstrated adecrease in size of the mass consistent with hemangioma,with postnatal correlation. One patient had a small cysticmass adjacent to the nose on fetal imaging. Antenatally thiswas thought to be a cephalocele or dermoid cyst. Followingbirth the correct diagnosis of a supernumerary nostril wasmade.CONCLUSIONFetal head and neck masses are well characterized on MRimaging, which provides useful and sometimes diagnosticsoft tissue characterization. Information about airway compressionis essential for planning safe delivery. Figure 1 (a)SSFSE T2 weighted sagittal MR image reveals a heterogeneousmass protruding out of the mouth. A diagnosis of teratomawas made and confirmed following delivery with theEXIT procedure. (b) Sagittal SSFSE MR image revealssevere fetal hydrops (small arrow) in one fetus of a twin gestation.There is a higher signal intensity cystic appearingmass surrounding the neck consistent with lymphatic malformation.The brain is hypointense. Turner syndrome withfetal demise was diagnosed.KEY WORDS: Fetus, tumor, malformationPaper 25 Starting at 10:23 AM, Ending at 10:31 AMImaging of Foregut Duplication Cysts of the Neck andTongue in ChildrenOzgen, B. 1 · Robson, C. D. 2 · Rahbar, R. 2 · Nose, V. 2 ·Sherman, D. 31Brigham and Women’s Hospital, Boston, MA, 2 Children’sHospital, Boston, MA, 3 Albany Medical College, Albany,NY21MATERIALS & METHODSThe imaging studies (3 MR images and 2 CT) of five caseswith the histopathologic diagnosis of FDC resected from theneck and tongue were reviewed retrospectively.RESULTSFive patients (4 boys and 1 girl) with ages ranging from 5days to 6 years were evaluated. Two cases were asymptomatic,two had feeding problems and one had speech difficultyat the time of presentation due to the location of thelesion. The cysts were located at the anterior part of thetongue in 3 cases and along the anterior aspect of the neck in2 cases (one overlying the left infrahyoid strap muscle andone immediately anterior to the trachea, between the thyroidgland and the thymus). All lesions were sharply marginated,tubular or circumscribed in shape, with low attenuation onCT and isointense with CSF on MR imaging. Contrast wasadministered in all studies with no enhancement of any ofthe lesions.Figure (a). Axial contrast-enhanced CT image reveals aunilocular hypodense, nonenhancing mass ventral to the trachea.(b). Sagittal fat-suppressed T2-weighted MR image ina 2nd patient reveals a serpigenous, midline mass within thetongue that is isointense with CSF.CONCLUSIONForegut duplications cysts occur rarely in the neck andtongue but should be considered in the differential diagnosisof cystic masses in infants and young children, especially forcongenital midline cystic lesions of the anterior third of thetongue. It is particularly important to differentiate FDC fromthyroglossal duct cysts, as the surgical treatment for thesetwo entities differs.KEY WORDS: Foregut duplication cysts, children, head andneckMondayPURPOSEForegut duplication cysts (FDC) are congenital anomaliesthat occasionally occur in the neck and tongue. In this location,they usually are misdiagnosed radiologically as dermoidcysts, thyroglossal duct cysts, or vascular malformations.We evaluated the clinical and imaging features of fivecases of FDC occurring in the neck and tongue, in an effortto better define the imaging characteristics of these uncommonlesions.
MondayPaper 26 Starting at 10:31 AM, Ending at 10:39 AMBulging Oval Window: HR CT and MR Imaging in theDiagnosis of Perilymphatic HydropsBooth, T. N. 1,2 · Brenski, A. 1,2 · McClay, J. 1,2 · Rollins, N. K. 1,2· Roland, P. 1,21Children’s Medical Center of Dallas, Dallas, TX,2University of Texas Southwestern Medical Center, Dallas,TXPURPOSEPerilymphatic hydrops is caused by abnormal communicationbetween CSF and the perilymph of the inner ear. Theresultant increase in pressure leads to displacement and orperforation of the stapes footplate. We report the clinicalpresentation and imaging findings in children with perilymphatichydrops associated with inner ear anomalies. We willdemonstrate the appearance of a bulging oval window,which commonly was found in our patients and has not beendescribed in the literature.MATERIALS & METHODSAll patients (n = 3) presented with SNHL. Only 2 patientshad a history of recurrent meningitis. Ages - 5, 9, and 9years. HR CT was performed in all patients using 1 mm collimationand targeted magnified reconstruction. ThreedimensionalFSE T2-weighted MR imaging was obtained in2 patients. All patients were evaluated by a pediatric otolaryngologist.Two of the patients have surgical confirmation.RESULTSSevere inner ear anomalies were present in all patients. Thecochlea was absent in 5/6 ears and the vestibular systemdemonstrated severe dysplasia in 5/6 ears. The IAC was normal(n = 1), large (n = 2), and small (n = 3). An undulatingcontour to the bony margins of the IAC was present in 2 ears.One ear demonstrated a large facial nerve canal. A deficientlamina cribrosa was noted in 3/6 ears, although the structurewas difficult to evaluate in patients with a small IAC. Abulging oval window was defined as fluid density or intensitymaterial protruding from the vestibule through the ovalwindow and was present in 5/6 ears (figure). HR CT and MRimaging both demonstrated the presence of a bulging ovalwindow. The one ear that did not demonstrate this findingalso had a nearly atretic IAC (1.2 mm).22CONCLUSIONPreoperative diagnosis of perilympatic hydrops is important.Perforation of the stapes can be a source of recurrent meningitisespecially in a child with SNHL. The presence ofhydrops may lead to a stapes gusher during surgical manipulationand could affect the continuation of the surgical operation,cause further loss of hearing, as well as increase therisk of meningitis. We believe direct visualization of abulging oval window is an additional finding that will beuseful in the preoperative diagnosis of perilymphatichydrops associated with inner ear anomalies. Findings suchas an enlarged, undulating IAC and deficient lamina cribrosawere found less frequently in our group of patients. Theseabnormalities should be sought after in any patient presentingwith SNHL and or recurrent meningitis.REFERENCES1. Phelps PD, Reardon W, Pembrey M, Bellman S, Luxom L. X-Linked Deafness, Stapes Gushers and a Distinctive Defect ofthe Inner Ear. Neuroradiology 1991;33:326-3302. Sykora GF, Kaufman B, Katz RL. Congenital Defects of theInner Ear in Association with Meningitis. Radiology1980;135:379-382KEY WORDS: Temporal bone, congenital, meningitisPaper 27 Starting at 10:39 AM, Ending at 10:47 AMHigh Resolution Volumetric CT of Temporal BonePathology Using Digital Flat-Panel Array DetectorGupta, R. 1,2,3 · Bartling, S. 4 · Caruso, P. 2 · Grasruck, M. 3 ·Stieristorfer, K. 3 · Flohr, T. 3 · Curtin, H. 2 · Brady, T. 11Massachusetts General Hospital, Boston, MA,2Massachusetts Eye and Ear Infirmary, Boston, MA,3Siemens Medical Solutions, Forschheim, GERMANY,4Siemens Medical, Forschhiem, GERMANYPURPOSEVolumetric CT (VCT) scanners offer very high resolution byvirtue of a digital flat-panel array. We have shown that normaltemporal bone anatomy is better visualized using a VCTscanner as compared with multidetector CT scanners(MDCT) (Gupta, et al., <strong>ASNR</strong> 2002 and RSNA 2003). Thepurpose of this study is to determine if VCT offers superiordepiction of temporal bone abnormalities.MATERIALS & METHODSFifteen temporal bone specimens, 9 abnormal and 6 normal,were scanned using VCT and MDCT scanners. The abnormalspecimens included patients with acquired and congenitalsensory neural hearing loss (n = 4), congenital type II collagendisorder (n = 2), otospongiosis (n = 2), and otospongiosis,status poststapedectomy and stapes prosthesis (n = 1).Two normal temporal bone specimens and two normalcadaveric head specimens (n = 4 ears) were scanned also.The VCT scanner consists of a 40 x 30 cm square digital flatpanel detector mounted on a Sensation-16 (Siemens,Forchhiem) gantry. The detector consists of a matrix of 2K x1.5K detector elements, each at 200 micron-square. Fivehundred eighty projections were acquired in a 360 deg rotationat 80 kV and 20 mA. A modified Feldkamp algorithmwas used for cone beam reconstruction. A volumetric stackwith an isometric voxel size of 250 micron-cube, was reconstructedfrom the projection data. The specimens were
scanned in the VCT scanner at moderate dose (50 mA, 120Kv), and at low dose (20 mA and 120 kV). The samples alsowere scanned in VolumeZoom 4 and Sensation-16.RESULTSImage quality was better with VCT. There were multipleinstances where dehiscence in the bony covering of the facialnerve was better visualized on VCT. There was better depictionof the interscalar septum of the cochlea of potential benefitfor the assessment of congenital malformations.Reformats benefited from the isotropic resolution offered byVCT. For example, the assessment of the incudo-stapedialjoint was accomplished better using oblique slices from theVCT data as compared with MDCT data. The integrity of thestapes wire prosthesis and its articulation with the incus andwith the oval window was assessed better on VCT.CONCLUSIONVolumetric CT offers high resolution and excellent depictionof temporal bone abnormalities at potentially lower radiationdoses than MDCT.KEY WORDS: Temporal bone, CT, detectorThe authors of this work have indicated the following affiliations/disclosures:Siemens Medical Solutions: Consultant,employee.Paper 28 Starting at 10:47 AM, Ending at 10:55 AMHigh Field-Strength MR Imaging in Two Animal Modelsof Menerie’s Disease: Findings and Insights into theEtiology of this DisorderJewells, V. L. · Marshall, A. F. · Lee, Y. Z. · Kranz, P. · Lin,W. · Hardy, S. M. · Skaggs, J. D. · Zdanski, C.University of North Carolina at Chapel HillChapel Hill, NCPURPOSEMeniere’s disease (MD) is thought to be due to endolymphatichydrops. No definitive imaging study for hydrops currentlyexists, and the diagnosis remains a mainly presumptiveclinical one. The purposes of our study were: to determineif high field-strength MR imaging can be used todemonstrate MD in two different animal models, to correlatethese MR findings with histology, and to try to glean insightinto the etiology and development of this disease based onMR features.MATERIALS & METHODSOf 14 guinea pigs, seven underwent surgical ablation of thevestibular aqueduct, five underwent continuous infusion ofvasopressin (VP) during separate periods of 7 and 14 days,and two were used as controls. MR imaging was obtainedpre and 4 hours postcontrast on a 3 T unit with a surface coil.All animals were imaged prior to any intervention and thosewho had surgery were studied at 8 and 12 weeks. Thosetreated with VP were imaged prior to infusion periods, at 1or 2 weeks after initiation of infusion of VP, and with a secondinfusion period and at 1 week after cessation of infusion.The size and enhancement patterns of the cochleae wereevaluated subjectively and ROIs were used to measure the23signal changes in the scalae (media and vestibularis/tympani)and whole cochleae. All animals were sacrificed and thesize and histology features of the cochleae assessed.RESULTSSurgically- and VP-treated animals showed an apparentincrease in cochlear volume by MR imaging which was confirmedhistologically. Statistically significant increases inscalar and whole cochlear contrast enhancement were seen at1 and 2 weeks in VP treated animals. One week after cessationof VP infusion, four animals showed progressivecochlear enhancement, and in one animal the ROIs returnedto baseline. In the surgically-treated animals, a statisticallysignificant contrast enhancement was seen in scalae mediameasurements but not in whole cochlea, or scalae vestibularis/tympanimeasurements. Additionally, differences werefound in the intensity of enhancement between the scalamedia (endolymph) and scala vestibularis (perilymph) inboth groups.CONCLUSIONGuinea pigs may be used successfully to study MD whichmay be induced by surgery or VP administration. Animalswith VP-induced MD showed greater contrast enhancement.Both surgery and VP-induced MD show similar changes incochlear chamber size at MR imaging. Asymmetricalenhancement in the cochlear compartments, and differencesbetween the surgical and VP groups supports the hypothesisthat intracochlear membrane ruptures are present in MD, andthat aquaporin 2-channel water transit induced by VP resultsin MD/endolymphatic hydrops.KEY WORDS: Meniere’s, endolymphatic hydropsPaper 29 Starting at 10:55 AM, Ending at 11:03 AMPhysiologic Enhancement of the LabyrinthDemonstrated on Delayed FLAIR ImagingButman, J. A.Warren G. Magnuson Clinical Center, National Institutes ofHealthBethesda, MDPURPOSEHyperintense labyrinthine signal on FLAIR imaging canindicate inner ear pathology. We present several cases ofbilateral labyrinth hyperintensity on FLAIR, each resultingfrom contrast injected several hours prior to imaging.MATERIALS & METHODSRoutine 1.5 T brain MR images included immediate (within15 minutes of injection) postcontrast FLAIR in patients froma variety of clinical protocols. Sequence parameters: TR9000-11000, TE 135-145, ETL 22, BW 31 kHz, FOV 22 cm,matrix 256 x 192, thickness 5 mm, gap 0 mm, 2 acquisitions.Medical records were reviewed. The timing of brain MRimaging relative to other enhanced MR images was determined.RESULTSSeven examinations in four patients were identified withlabyrinthine hyperintensity on FLAIR bilaterally. Each ofthese patients had a normal appearance ot the labyrinth on atleast one occasion within 6 months of the abnormal MRMonday
Mondayimaging. No clinical evidence of inner ear pathology waspresent. Creatinine was normal (< 1.5) for 5 of the 6 abnormalexams. In one case, creatinine was 5.1. Review of themedical record revealed that contrast enhanced MR imaging(cardiac or abdominal) had been performed within 12 hoursin all cases. In one case, brain MR imaging and cardiac MRimaging were performed on the same day on five separateoccasions. On visits 1, 3, and 5, cardiac MR imaging precededbrain MR imaging by 3-5 hours, and on visits 2 and 4,brain MR imaging preceded cardiac MR imaging.Hyperintensity in the cochlea was observed only on the threeoccasions where the brain MR imaging followed the cardiacMR imaging. T1-weighted images did not demonstratehyperintensity within the labyrinth. Hyperintensity in theanterior chamber of the globe also could be observed indelayed FLAIR images and was not observed on immediateFLAIR images.CONCLUSIONLabyrinthine signal is normally completely suppressed onFLAIR. Altering the T1 of endolymph or perilymph changesthe inversion time of inner ear fluid, resulting in markedhyperintensity as seen on T2-weighted images. Such alterationsmay occur with Gd enhancement from inflammationor neoplasm. Contrast-enhanced FLAIR is much more sensitiveto this contrast entry than is T1-weighted imaging (1) .Ineach of these cases, FLAIR signal abnormality was presentin the absence of inner ear symptoms. Artefactual failure ofFLAIR suppression (e.g., from inadequate inversion thickness)was excluded. Identification of contrast injections precedingthe brain MR imaging by several hours explains thelabyrinthine signal on “delayed” FLAIR. In animals,enhancement of the cochlea develops slowly following ivinjection of Gd-DTPA, continuing to increase even 90 minutesfollowing injection (2). This provides a physiologicexplanation for the labyrinthine hyperintensity on delayedFLAIR. Further investigation of this phenomenon shouldprovide insights into labyrinthine fluid homeostasis in normaland pathophysiologic states.REFERENCES1. Butman JA, et al. FLAIR Imaging of the Inner Ear. 40th<strong>ASNR</strong> 2002;SE502. Counter SA, et al. Neuroreport 2000;11(18):3979-3983KEY WORDS: Cochlea, hearing, perfusion24Paper 30 Starting at 11:03 AM, Ending at 11:11 AMCT Characterization of Cochlear Dysplasia: DoesDilation at the Junction of the First and Second TurnCorrelate with Sensorineural Hearing Loss?Caruso, P. 1 · Numa, W. 2 · Merchant, S. 1 · Curtin, H. 11Massachusetts Eye and Ear Infirmary, Boston, MA, 2 Tufts-New England Medical Center, Boston, MAPURPOSEThe rate of detection of inner ear dysplasia on HRCT inpatients with sensorineural hearing loss (SNHL) has beenestimated between 28-31% (1, 2). The diagnostic yield ofHRCT for cochlear dysplasia has been estimated at between5-12% (3, 4). Multidetector scanners allow for fine collimationand high quality reformatted images of the temporalbone, not previously available. Histopathologic studies ofhuman temporal bones suggest that in minor cochlear dysplasiathere is dilation of the cochlea beginning at the junctionof the first and second turns (5). The purpose of ourstudy is to measure the junction of the first and second turnsof the cochlea using multidetector CT in normal patients, todetermine how the normal measurement differs from that ofpatients with cochlear dysplasias, and to determine if the useof this normal measurement may be used to exclude cochleardysplasias.MATERIALS & METHODSTemporal Bone CT scans were examined retrospectively inpatients with congenital SNHL as well as in a group of normalcontrols. Images were evaluated by multiplanar reconstructionsin the oblique axial, Pöschl, and Stenvers projections.The diameter of the cochlear lumen at the junction ofthe first and second turns (CDj12) was measured in a standardizedfashion. Normal control values were comparedwith measurements obtained from scans of patients withcongenital SNHL and cochlear dysplasias.RESULTSMeasurement of the CDj12 in normal patients yielded a constantvalue that was independent of age. The CDj12 inpatients with congenital SNHL and cochlear dysplasia measuredconsistently higher than that of normal controls.CONCLUSIONMeasurement of the CDj12 in normal patients yields a regularvalue that may serve to detect or to exclude cochlear dysplasiain patients with congenital sensorineural hearing loss.REFERENCES1. Bamiou DE, Phelps P, Sirimanna T. Temporal BoneComputed Tomography Findings in Bilateral SensorineuralHearing Loss. Arch Dis Child 2000;82(3):257-2602. Bamiou DE, Savy L, O’Mahoney C, Phelps P, Sirimanna T.Unilateral Sensorineural Hearing Loss and Its Aetiology inChildhood: The Contribution of ComputerisedTomography in Aetiological Diagnosis and Management.Intern J Ped Otorhinolaryngol 1999;51(2):91-993. Jackler RK, Luxford WM, House WF. CongenitalMalformations of the Inner Ear: A Classification Based onEmbryogenesis. Laryngoscope 1987; 97(3 Pt 2 Suppl 40):2-14
4. Antonelli PJ, Varela AE, Mancuso AA. Diagnostic Yield ofHigh-Resolution Computed Tomography for PediatricSensorineural Hearing Loss. Laryngoscope1999;109(10):1642-16475. Schuknecht HF. Mondini Dysplasia: A Clinical andPathological Study. Ann Otology, Rhinol, Laryngol 1980;Suppl 89(1 Pt 2):1-23KEY WORDS: Cochlea, dysplasia, hearingPaper 31 Starting at 11:11 AM, Ending at 11:19 AMCochlear Implant Candidate: Correlation between Ageand Presence of Inner Ear Anomalies on High ResolutionMR Imaging at 3 T and 1.5 TLane, J. I. · Witte, R. · Driscoll, C.Mayo ClinicRochester, MNPURPOSEThe association of anomalies of the inner ear with congenitalor childhood onset sensorineural hearing loss (SNL) hasbeen well established in the literature. We retrospectivelyreviewed high resolution MR studies in 66 cochlear implantcandidates from 8/00 to 12/03 to determine the incidence ofanomalies in both the pediatric and adult population.MATERIALS & METHODSAll patients who are evaluated for profound SNL at ourCochlear Implant Clinic and found to qualify clinically forthe procedure undergo high resolution MR imaging at 3 T or1.5 T utilizing phased-array surface coils. Protocol included3D FSE T2 or 3D CISS sequences acquired in the axial andoblique sagittal planes. All imaging studies were reviewedretrospectively by 2 neuroradiologists. Anomalies were classifiedbroadly as to location (cochlea, endolymphaticduct/sac, vestibule, and IAC/cochlear nerve). Study populationwas split into those patients with onset of profound SNLbefore and after the age of 18 years. The incidence of anomaliesin both groups was calculated.RESULTSInner ear anomalies were found in 8 of 25 pediatric patients(31%) and in 8 of 41 adult patients (20%). Anomalies inadults consisted mainly of cases of dilatation of vestibularaqueduct/sac and modiolar deficiencies. Severecochleovestibular anomalies were seen only in the pediatricage group.CONCLUSIONAlthough the incidence of inner ear anomalies was greater inthe pediatric age group, the presence of these anomalies wasnot insignificant in the adult group. Onset of profound bilateralSNL in an adult does not preclude the presence of congenitalanomalies of the inner ear.KEY WORDS: Inner ear anomalies, cochlear implant, highresolutionMR imaging25Paper 32 Starting at 11:19 AM, Ending at 11:27 AMCorrelation between Initial and Early Follow-Up CTPerfusion Parameters with Endoscopic Tumor Responsein Patients with Advanced Squamous Cell Carcinomas ofOral Cavity/Oropharynx Treated with OrganPreservation TherapyGandhi, D. 1 · Chepeha, D. B. 2 · Sacco, A. 2 · Carlos, R. 2 ·Karamchandani, R. 2 · Mukherji, S. K. 11University of Michigan Hospitals, Ann Arbor, MI,2University of Michigan Hospitals, Farmington Hills, MIPURPOSECurrent organ preservation regimens for oral cavity/oropharyngealcancer are limited by the requirement of repeatedendoscopic procedures under general anesthesia to evaluatethe tumor volume and treatment response. The purpose ofour study was to prospectively assess if pretherapy and earlyfollow-up CT perfusion measurements correlate withresponse to induction chemotherapy and could be used assurrogate markers for tumor response.MATERIALS & METHODSNine patients with advanced (Stage III, IV) squamous cellcarcinoma of the oral cavity or oropharynx were enrolled ina prospective trial in which response to neoadjuvantchemotherapy was assessed. Patients underwent direct laryngoscopyand CT perfusion prior to treatment and after onecycle of neoadjuvant chemotherapy. The outcome variableswere the surgeon’s estimate of tumor volume duringendoscopy with biopsy under anesthesia and values of CTperfusion parameters (capillary permeability, blood volume,blood flow, and mean transit time). Wilcoxon rank sumanalysis was used to correlate the baseline values of bloodflow and blood volume with response to inductionchemotherapy. Comparison of agreement between the reductionin tumor volume and change in CT perfusion parameterswas performed using Kappa estimate.RESULTSBaseline (pretherapy) values of blood volume showed significantcorrelation with endoscopic tumor response (p
MondayPaper 33 Starting at 11:27 AM, Ending at 11:32 AMUncommon CT Findings in Relapsing PolychondritisBranstetter, B. F.University of PittsburghPittsburgh, PAPURPOSERelapsing polychondritis is a rare autoimmune disorder inwhich the autoantibodies target cartilage. Clinical findingsmay appear at any age. The bridge of the nose, the pinnae ofthe ears, and the laryngobronchial tree commonly are affected.In unusual cases, inflammation of other cartilages willprecede the involvement of the nose and the pinna, producinga diagnostic dilemma for clinicians. There are severalsubtle radiologic findings that can suggest this rare entity.MATERIALS & METHODSA previously healthy 20-year-old male presented with a 3-month history of “recurrent anaphyllactic episodes,” themost recent of which required intubation. He had a longstandinghistory of “multiple external ear infections.” Noabnormalities of the nose or pinna were evident. CTs of theneck, chest, and paranasal sinuses were performed. The diagnosisof relapsing polychondritis was suggested on the basisof radiographic findings and confirmed with biopsy. Thepatient responded well to steroid therapy.RESULTSNeck CT revealed near-complete calcification of the laryngealcartilages, unusual in a 20-year-old. There were areas ofmarked cricoid cartilage thickening with a symmetric traintrackcalcification pattern (Figure A). Other portions of thelaryngeal cartilages showed marked thinning. The subglottictrachea was markedly narrowed, with thickening of thewalls. On thoracic CT, scattered calcifications were seenthroughout the walls of the tracheobronchial tree. The leftlower lobe was collapsed completely, with narrowing of thecentral bronchi. CT of the paranasal sinuses revealed thickeningof the cartilaginous walls of the external auditorycanals, with complete sparing of the bony portions of thewalls (Figure B). The nose and pinna were normal.26CONCLUSIONUnusual radiologic findings of relapsing polychondritis canprecede the characteristic radiologic and clinical manifestations.Knowledge of these subtle early findings may allowthe radiologist to diagnose relapsing polychondritis and helpavoid disease complications.KEY WORDS: Relapsing polychondritis, polychondritisPaper 34 Starting at 11:32 AM, Ending at 11:37 AMCricoarytenoid Rheumatoid Arthritis: An ImportantConsideration in Aggressive Laryngeal LesionsChen, J. J. · Myers, E. N. · Branstetter, B. F.University of PittsburghPittsburgh, PAPURPOSEThe most frequent cause of an aggressive laryngeal mass issquamous cell carcinoma (SCC). Rheumatoid arthritis isknown to affect the larynx, but usually does not produce anaggressive mass.MATERIALS & METHODSWe present a case of a 63-year-old female with rheumatoidarthritis, presenting with acute airway obstruction.Computed tomography (CT) was obtained and interpreted asSCC. With the presumed diagnosis of SCC, the patientunderwent surgical biopsies which revealed rheumatoidarthritis of the cricoarytenoid joint. The patient was dischargedon an increased dose of antiinflammatory medications.On follow-up visits, the patient was doing well with noclinical evidence of laryngeal mass.RESULTSOn CT, an erosive mass on the right cricoid cartilage withsignificant destruction of the surrounding structures was presumedto represent SCC (Figure). The results of the laryngoscopy,in particular the submucosal nature of the lesion,were not available at the time of initial CT interpretation.CONCLUSIONLaryngoscopy is used to differentiate SCC from rheumatoidarthritis. In addition to showing the distinctive features ofrheumatoid arthritis at the cricoarytenoid joint, laryngoscopyis used to distinguish between mucosal and submucosallesions. Submucosal lesions are much less likely to be SCC.When a submucosal lesion is observed, CT is employed toanalyze the mass and define its extent. Malignant tumors ofthe larynx are invasive masses, often with central necrosis.Cartilage erosion on CT strongly suggests the presence oftumor. Unfortunately, these CT findings are not specific for
SCC. When a patient with a history of rheumatoid arthritispresents with a submucosal laryngeal mass, cricoarytenoidrheumatoid arthritis should be considered. Communicationwith the referring physician is important to obtain a completehistory and to make the radiologist aware of the mucosal orsubmucosal nature of the pathology. Failure to diagnoserheumatoid arthritis of the larynx may subject the patient tounnecessary surgery and anxiety about a potentially lethaldisease.REFERENCES1. Lawry GV, Finerman ML, Hanafee WN, Mancuso AA, Fan PT,Bluestone R. Laryngeal Involvement in RheumatoidArthritis: A Clinical, Laryngoscopic, and ComputerizedTomographic Study. Arthritis Rheum 1984;27:873-8822. Curtin HD. The Larynx. In: Som PM, Curtin HD, eds. Headand Neck Imaging, 4th ed. St. Louis, Mo: Mosby 2003;1595-1699KEY WORDS: Rheumatoid arthritis, larynx, cricoarytenoidjoints27Monday Morning10:15 AM - 11:45 AMRoom 611 - 612(6d) Pediatrics: Fetal and NeonoatalImaging(Scientific Papers 36 - 46)See also Parallel Sessions(6a) Adult Brain: General and High Field Imaging(6b) Adult Brain: Cerebrovascular Disease and Stroke(6c) Head & Neck: GeneralMondayPaper 35 Starting at 11:37 AM, Ending at 11:42 AMAnomalous Course of Carotid Artery through MiddleEar Detected by CT AngiographyModerator:Vincent P. Mathews, MDCharles L. Truwit, MDTeng, M. M. H.Taipei Veterans General Hospital and National Yang MingUniversityTaipei, TAIWAN REPUBLIC OF CHINAPURPOSETo show the value of CT angiography in demonstrating theanomalous course of internal carotid artery through middleear cavity and sphenoid sinus.MATERIALS & METHODSThere has been some difficulty in removal of bony structureswhile preserving arteries passing through the skull base onCT angiography. Demonstration of the whole course of arteriesin the head and neck similar to digital subtractionangiogram remains a difficult task. For this reason, CTangiography has been less popular than conventional X-rayangiography, or MR angiography for head and neck region.We encountered two patients with anomalous course of theinternal carotid artery. In one case the carotid artery passesthrough the middle ear cavity, and in the other it passesthrough the sphenoid sinus.RESULTSThese anomalous courses of the internal carotid artery wereboth demonstrated on CT angiography. They were notdetected on previous MR angiography or conventional X-rayangiography.CONCLUSIONDemonstration of bony structure and artery in the skull baseon CT angiography facilitate the detection of anomalouscourse of the carotid artery.KEY WORDS: Anomalous course of carotid artery, CTangiographyPaper 36 Starting at 10:15 AM, Ending at 10:23 AMFetal MR Imaging in the Detection of Malformations ofCortical DevelopmentGlenn, O. A. · Goldstein, R. B. · Norton, M. E. · Barkovich,A.University of California San FranciscoSan Francisco, CAPURPOSETo determine if malformations of cortical development canbe detected better on fetal MR imaging as compared withprenatal ultrasound.MATERIALS & METHODSWe searched our imaging data base for cases of cortical malformationson fetal MR imaging. Referring indications forfetal MR imaging were either small head size or other suspectedmajor brain abnormalities on prenatal ultrasound. Weexcluded cases of periventricular heterotopia in the absenceof other cortical malformations. Fetal MR images werereviewed by two pediatric neuroradiologists. An ultrasonographerand neuroradiologist reviewed prenatal ultrasoundimages.RESULTSThere were six cases of cortical malformations. Gestationalage at the time of MR imaging was 19 weeks to 34 weeks.The six cases included: diffuse cortical dysgenesis (N = 3)associated with specific syndromes (Walker-Warburg,Aicardi, classical lissencephaly), schizencephaly (N = 2)(one with bilateral open lip schizencephalies, and anotherwith open and closed lip schizencephalies and diffuselyabnormal gyral pattern), and unilateral polymicrogyria (N =1). In all six cases, the cortical malformations were sonographicallyoccult. In 3 cases, other fetal brain abnormalities(agenesis of the corpus callosum, abnormal cerebellum and
Mondaybrainstem, and irregularity of the ventricular margin) identifiedwith sonography, prompted the MR imaging. In thefourth case, holoprosencephaly was suspected on the basis ofthe sonogram but fetal MR imaging demonstrated bilateralopen lip schizencephalies, not holoprosencephaly. In twopatients, referred for fetal MR imaging due to decreasedhead size, MR imaging identified classical lissencephaly inone and polymicrogyria in the other. Fetal MR findings wereconfirmed on postnatal MR imaging in two cases and neuropathologicexamination in one.CONCLUSIONFetal MR imaging can detect malformations of corticaldevelopment, such as schizencephaly, polymicrogyria, focaland diffuse abnormal gyral patterns, and lissencephaly, asearly as 19 weeks gestation. This subset of fetal brain malformationscan be sonographically occult. The identificationof cortical malformations on fetal MR imaging has significantprognostic implications since they can be associatedwith developmental delay, cognitive impairment, cerebralpalsy, and epilepsy.KEY WORDS: Fetal MR imaging, cortical malformation,developmental malformationPaper 37 Starting at 10:23 AM, Ending at 10:31 AMFetal Brain MR Imaging in Placental ImpairmentPrayer, D. · Brugger, P. C. · Mittermayer, C. · Chalubinski,K. · Kasprian, G. · Blaicher, W.University of ViennaVienna, AUSTRIAPURPOSEA functional feto-placental unit is essential for adequateblood supply to the fetal brain. Impaired placental functionmay interfere with normal fetal brain development (1). Thismay be the case in premature rupture of membranes(PROM), infections, placental abruption, and may be associatedwith pathologic umbilical artery Doppler, eclampsia,intrauterine growth restriction (IUGR), and feto-fetal transfusionsyndrome (FFTS). Aim of this study was to evaluatewhether fetal MR imaging may detect pathologic changes inthe brain in these situations.MATERIALS & METHODSFifty-one pregnant women underwent 1-4 MR examinationsbetween the 18th and 39th gestational week, because ofPROM (21), history of infection (2), pathologic umbilicalDoppler values (17), eclampsia (1), IUGR (5), FFTS (3), andplacental abruption (2). MR imaging was done with a 1.5 Tsuperconducting unit (Philips), using ultrafast T2-weighted,T1-weighted GRE-, FLAIR, diffusion-weighted, andadvanced gradient-echo sequences in all orthogonal sectionplanes with a slice thickness of 3-5 mm. In addition to thefetal central nervous system the placenta and the umbilicalcord were assessed too.28RESULTSCerebral lesions/delay of brain development were diagnosedin 19 cases (4 PROM/6 pathologic Doppler/1 infection/3FFTS). Hemorrhages appeared in 5, ischemic lesions in 8,with 3 only vizualized on diffusion-weighted images, and 5also or only on T2-weighted sequences. Retarded brain-maturation(delayed myelination/gyration or small brain size)occurred in 6. Postnatal/postmortal workup is to date availablein 16/51 cases. Eleven of 56 fetuses died. Placentalabnormalities (defined as deviations from the normal agerelatedpatterns that had been established on a sample of 110normals), consisting of hemorrhages or premature degenerativechanges (mainly infarctions) were found in 43, andpathologic appearance of the umbilical cord was seen in 3.CONCLUSIONImpaired placental function may lead to changes that can bevizualized by MR imaging (84% in our series). Cerebralcompromise may be the consequence, as seen in 37% of ourcases, that showed lesions or retarded cerebral development.The combination of conventional fetal MR imagingsequences with diffusion-weighted imaging enhances thesensitivity to detect cerebral lesions. Even if is not yet clearwhich and what extent of pathologic placental changes mighthave an impact on fetal brain development (2), the assessmentof the placenta and umbilical cord should be includedin the evaluation of MR imaging of fetuses with suspectacquired brain pathology.REFERENCES1. Scher MS. Fetal Neurologic Consultations. Pediatr Neurol2003;29(3):193-2022. Gagnon R. Placental Insufficiency and Its Consequences.Eur J Obstet Gynecol Reprod Biol 2003;110 Suppl 1:S99-107KEY WORDS: Fetal MR imaging, placenta, diffusion-weightedimagingPaper 38 Starting at 10:31 AM, Ending at 10:39 AMIn Utero MR Spectroscopy of the Human Fetal BrainGirard, N. J. 1,2 · Confort-Gouny, S. 1 · Viola, A. 1 · Viout, P. 1 ·Chaumoitre, K. 1 · Fur, Y. 1 · Ranjeva, J. P. 1 · Cozzone, P. 11Hopital Nord, Université de la Méditerranée, Marseille,FRANCE, 2 UMR-CNRS 6612, Faculté de Médecine,Marseille, FRANCEPURPOSETo demonstrate the efficiency of H MR spectroscopy (MRS)of the human fetal brain.MATERIALS & METHODSSpectra were acquired on a 1.5 T MR device (SymphonyMaestro) with PRESS sequences including short and longecho-time (TR of 1500 ms, TE of 30 and 135 ms). The volumeof interest (VOI) was of 20 x 15 x 15 (4.5 ml) and locatedwithin the cerebral hemisphere (at the level of the centrumsemi ovale whenever possible). Eighty patients havebeen examined, MRS being performed in the same sessionof the standard fetal brain MR imaging. The gestational age(GA) ranged from 27 to 39 weeks including normal (n = 50)and pathologic brains (n = 30). Normative metabolic valueswere obtained in cases with normal standard MR imagesand/or normal neurologic outcome at 6 months of age.Abnormal MR imaging included malformations, destructivelesion, isolated ventricular dilatation, pregnancy at risk ofbrain damage (i.e., twin-to-twin transfusion syndrome). Theconcentration of cerebral metabolites was obtained by amethod of relative quantification; each metabolite concentrationbeing represented by its area divided by the sum of
the areas of all other metabolites. The cerebral metabolitestaken into account were myoinositol (Ins), choline (Cho),creatine (Cr), glutamate-glutamine (Glx), aspartate (Asp), n-acetylaspartate (NAA). The results were expressed also as aratio of areas of metabolites.RESULTSThere is a significant increase of NAA, decrease of Ins in thenormal brain with increasing GA. A tendency in increase ofGlx and in decrease in Cho was seen also with increasingGA. Analysis of the pathologic brains showed no specificmetabolic pattern in the different groups of pathology.However some characterization was possible: increasedlevel of Cr was seen in hypoxic cases, suggesting white mattergliosis. A case of mild ventriculomegaly with ependymalcysts showed very low level of Cr and NAA of unknown origin.Cases of mild ventriculomegaly showed spectra similarto normal controls at the same gestational age, suggesting anunderlying normal brain associated to the ventricular dilatation.CONCLUSIONFetal brain MRS is becoming a tool in the evaluation of thebrain maturation and development. The definition of normalspectra at different gestational ages is necessary in order tocharacterize brain abnormalities especially when subtlechanges are seen on conventional MR sequences (i.e., isolatedventriculomegaly, twin-to-twin transfusion syndrome,and infections).KEY WORDS: MR spectroscopy, fetal brainPaper 39 Starting at 10:39 AM, Ending at 10:47 AMMR Imaging of the Fetal Cerebellar Vermis In Utero:Criteria for Abnormal Development, withUltrasonographic and Clinicopathologic CorrelationRobinson, A. J. 1 · Blaser, S. 1 · Toi, A. 2 · Chitayat, D. 2 · Ryan,G. 2 · Pantazi, S. 2 · Gundogan, M. 2 · Laughlin, S. 11Hospital for Sick Children, Toronto, ON, CANADA,2Mount Sinai Hospital, Toronto, ON, CANADAPURPOSEOur previous study produced an atlas of easily identifiableand reproducible measurements and markers of normalanatomical development of the fetal cerebellar vermis invivo from 17.5 weeks gestational age to term. This study isto demonstrate easily identifiable and reproducible measurementsand markers of abnormal development, with ultrasonographicand clinicopathologic correlation where available.Virtually all previous studies of development of thecerebellum have been performed on fetal specimens, andfew in vivo studies discuss development of the cerebellarvemis per se.MATERIALS & METHODSRetrospective analysis of the midline sagittal views of thecerebellar vermis was performed in over 130 consecutivefetal MR examinations performed for CNS and non-CNSindications. Analysis included identification of the fastigialpoint and vermian fissures, degree of coverage of the fourthventricle, cerebellar growth and proportions, tegmento-vermianangle, and associated abnormalities of the posteriorfossa, brainstem and CNS.29RESULTSGestational age ranged from 14.9 to 38.6 weeks with a meanof 26.6 weeks. Useful midline sagittal views were obtainedin over 100 studies. Approximately one quarter of these hadabnormalities affecting the posterior fossa. These includedfetuses with classic Dandy-Walker malformations and otherswithin the Dandy-Walker spectrum which we subdividedaccording to presence of dysplasia or hypoplasia, abnormaltegmento-vermian angle, size of cisterna magna, and associatedCNS abnormalities. Correlation with coronal and axialMR images and ultrasonographic images is demonstrated inaddition to clinicopathologic and genetic diagnoses whereavailable, however the final numbers are few.CONCLUSIONWe demonstrate MR imaging appearances of the normal andabnormal cerebellar vermis and posterior fossa with ultrasonographicand clinicopathologic correlation.Part 2 of 2. See abstract 852 for part 1.KEY WORDS: Vermis, fetal MR, Dandy-WalkerPaper 40 Starting at 10:47 AM, Ending at 10:55 AMEarly Laminar Organization of the Human CerebrumDemonstrated by Automatic Segmentation of DiffusionTensor MR Images in Extremely Premature InfantsMukherjee, P. · Maas, L. C. · Carballido-Gamio, J. ·Veeraraghavan, S. · Miller, S. P. · Partridge, S. C. · Henry, R.G. · Barkovich, A. J. · Vigneron, D. B.University of California San FranciscoSan Francisco, CAPURPOSEDiffusion tensor imaging (DTI) has been used to reveal thetransient early laminar architecture of the developing fetalmouse brain ex vivo (1), many features of which are notapparent on conventional MR imaging. We present herein anautomatic segmentation technique applied to DTI to delineatethe early cerebral laminar organization of prematurehuman newborns in vivo.Monday
MondayMATERIALS & METHODSTwo extremely premature infants were imaged at 25 and 27weeks gestation with a high sensitivity neonatal head coilincorporated into an MR-compatible incubator. Diffusiontensor imaging was acquired with a multirepetition, singleshotechoplanar sequence. The apparent diffusion coefficient(ADC) and fractional anisotropy (FA) were calculated. Basedon the pattern of ADC and FA values observed at the differentcerebral lamina, manual segmentation was performed,and an automatic segmentation technique based on fuzzylogic was developed. First, ADC values were clustered intolow, medium, and high ADC groups using fuzzy c-meansclustering: CSF (high ADC), subplate (medium ADC), deepto-subplateand cortical layers (low ADC). Cerebral spinalfluid pixels were removed for subsequent segmentation, andremaining pixels were clustered according to their FA valuesinto subplate (low FA), deep-to-subplate and cortical layers(medium FA), and noise (high FA). Then a Mamdani-typefuzzy inference system was built to segment the subplate.Each input was fuzzified by two Gaussian membership functionswhich were created based on the means and standarddeviations of the low and medium ADC and FA groups, andthe segmentation was accomplished with the following tworules: 1. If the ADC is medium and the FA is low, then thepixel is subplate. 2. If the ADC is low and the FA is medium,then the pixel is nonsubplate. Nonsubplate pixels then weresegmented based on their position relative to the subplate intocortical and deep-to-subplate layers.RESULTSThe automatic segmentation was comparable to manual segmentationfor both subjects. Figure 1 shows the manual (left)and automatic (right) segmentation results for the right cerebralhemisphere of the 25-week newborn, applied to ADC(top row) and FA (bottom row). ADC vs FA pixel values inthe images of Figure 1, with pixel classification by automaticsegmentation, is shown in Figure 2: high ADC for CSF(yellow); medium ADC and low FA for subplate (red); lowADC and medium FA for the cortical (green) and deep-tosubplatelayers (blue).CONCLUSIONWe have developed an automatic segmentation techniquebased on fuzzy logic to delineate the early laminar organizationof the premature human brain depicted by DTI.Automatic segmentation of the different lamina of the developinghuman cerebrum will enable volumetric studies to betterunderstand and characterize normal and abnormal maturationduring early human brain development.REFERENCES1. Mori, et al. Magn Reson Med 2001;46:18-23KEY WORDS: Diffusion, development, maturation30Paper 41 Starting at 10:55 AM, Ending at 11:03 AMMicrostructural vs Macrostructural Features of CorticalDevelopment in Premature Newborns: Comparison ofDiffusion Tensor Imaging with Cortical GyrationdeIpolyi, A. · Mukherjee, P. · Henry, R. G. · Partridge, S. C.· Jin, H. · Lu, Y. · Miller, S. P. · Vigneron, D. B. · Barkovich,A. J.University of California San FranciscoSan Francisco, CAPURPOSETraditionally, imaging of human cortical development hasbeen limited to the assessment of macrostructural gyrationand sulcation. Recent studies suggest that diffusion tensorimaging (DTI) can characterize cortical maturation at themicrostructural level (1-3). We examined the relationshipbetween gyration and DTI in the developing peri-rolandiccortex of preterm infants. We hypothesized that DTI providesmicrostructural information about cortical developmentindependent of macrostructural gyration, and that,therefore, cortical DTI parameters will not correlate withgyration score beyond their common association with gestationalage (GA).MATERIALS & METHODSUsing an MR-compatible incubator with a high-sensitivityneonatal head-coil, we performed 37 MR exams in 26 prematurenewborns born at 24-33 weeks GA, and imaged at25-37 weeks GA, with 2 serial exams in 11 infants. Whitematter injury was scored on T1- and T2-weighted images(4). The protocol included DTI and 3D spoiled gradientrecalled(SPGR) T1-weighted images that were reformattedinto a consistent axial orientation. We identified 4 regions ofinterest on the DTI images (left and right pre and postcentralgyri) on 3 slices just above the roof of the lateral ventricles,and calculated the apparent diffusion constant (ADC), fractionalanisotropy (FA), and eigenvalues (l 1 , l 2 , l 3 ) in allregions. Using the axial SPGR images, we scored gyrationsimilar to van der Knaap et al. (5), though we precisely calculatedthe ratio of gyral depth to gyral width in the pre andpostcentral gyri, generating a continuous quantitative variable.We determined the correlation coefficients relating GA,gyration score, ADC, FA, and the eigenvalues, calculatingthe Fisher’s p value for each relationship, and using a mixedrandom-effects model for multivariate regression.RESULTSThere were no focal cortical abnormalities in any of the MRexams. White matter injury was absent in 11 exams, minimalin 16 exams, moderate in 7 exams, and severe in 3 exams.Cortical FA, major eigenvalue l 1 , and ADC all showed significantinverse correlations with GA, whereas the minoreigenvalues l 2 and l 3 did not. Gyration score correlated positivelywith GA. Cortical gyration also correlated with corticalFA and l 1 , but not ADC, l 2 or l 3 . In a mixed randomeffectsmodel accounting for GA, white matter injury, andrepeated measures for serial scans, neither FA nor l 1 showedany significant residual correlation with gyration score.
CONCLUSIONQuantitative DTI parameters in the developing peri-rolandiccortex of premature infants show no significant correlationwith gyration, once the common association with gestationalage has been accounted for. This suggests that DTI mayprovide unique microstructural information not revealed bymacrostructural cortical gyration. Further research is ongoingto discover whether DTI is superior to conventional MRimaging in detecting abnormal cortical maturation and injuryin premature newborns.REFERENCES1. McKinstry RC, et al. Cereb Cortex 2002;12:1237-12432. Mukherjee P, et. al. Proc ISMRM, 2003, Toronto, 5403. Mukherjee P, et. al. Proc ISMRM, 2003, Toronto, 20944. Miller SP, et al. J Magn Reson Imag 2002;16:621-6325. van der Knaap MS, et al. Radiology 1996;200:389-396KEY WORDS: Maturation, anisotropy, cortexPaper 42 Starting at 11:03 AM, Ending at 11:11 AMRegional Age Dependence of Human Brain MetabolitesInvolved in Apoptosis and Oxidative Stress UsingQuantitative Proton MR Spectroscopy, a Neonatal HeadCoil, and MR Compatible IncubatorPanigrahy, A. · Tesoriero, L. · Friedlich, P. · Seri, I. ·Erberich, S. · Nelson, M. D. · Bluml, S.Children’s Hospital Los AngelesLos Angeles, CAPURPOSEApoptosis and oxidative stress have been hypothesized toplay a role in mediating perinatal white matter injury. Thepurpose of this study was to establish a normal longitudinalquantitative developmental database of metabolites whichare known to be involved in apopotosis and oxidative injuryin the developing brain using proton MR spectroscopy, aneonatal head coil, and MR-compatible incubator.MATERIALS & METHODSMR imaging was performed on a 1.5 T GE clinical scanner(GE, Milwaukee, WI). Single voxel 1H spectra wereacquired using a single voxel PRESS sequence with an echotime of TE = 35 ms, a repetition time of TR = 1.5 sec, and128 signal averages. The region of interest (ROI) size andposition were placed in the periatrial white matter and theoccipital cortex (gray matter). Proton spectra were processedusing the LCModel software (Stephen Provencher Inc.,LCModel Version 6). The set consisted of 18 componentsincluding standard metabolities including those involved inapoptosis (lipids) and oxidative stress (glutamate, taurine,and creatine). Unpaired two-tailed students t-tests were usedfor statistical comparisons of gray and white matter of differentage groups. An MR-compatible incubator with aneonatal head coil was used.RESULTSA total of 161 spectra were analyzed which fit the selectionprocess of likely being a “normal” case (50 white matterspectra and 111 gray matter spectra). For the gray matter, 39cases less that 1 year of age (including 21 neonates) werestudied and 72 cases between 1 year and 15 years. For whitematter, 18 cases were less than 1 year of age ( including 631neonates) were studied and 32 cases between 1 year and 15years were studied. The metabolites known to be involved inoxidative stress demonstrates similar developmental trendsin gray and white matter. Taurine is elevated in the neonatalperiod and decreases dramatically in levels after the firstyear of life (p < 0.0001). Glutamate levels remain low in theneonatal period and increase during development. (p < 0.03).There was no significant change in the levels of creatinine inboth the gray and white matter. The major marker of apoptosisin our study (lipids) demonstrated different developmentalprofiles comparing gray and white matter. Lipids dropdramatically in concentration after the first year of life in thewhite matter (p < 0.02) compared to gray matter. The overalldevelopmental trend of the standard metabolities (NAA,Choline and Myo-inostitol) were similar in gray and whitematter; NAA increases with age, (p < 0.0001), cholinedecreases with age ( p < 0.001); and myo-inositol decreaseswith age ( p < 0.001).CONCLUSIONThere is a critical period in the normal development ofmetabolites involved in apoptosis (lipids) and oxidativestress (taurine, creatine, and glutamate) in periventricularwhite matter. The developmental trends described in thisdata base support previously published studies. This studyestablishes quantitative longitudinal baseline data for the invivo MR spectroscopic evaluation of abnormalities ofmetabolites which are involve in apoptosis and oxidativestress in neonates with perinatal white matter injury.KEY WORDS: Perinatal white matter injury, glutamatePaper 43 Starting at 11:11 AM, Ending at 11:19 AMBrain Lateralization in the Neonate: A Functional MRImaging StudyErberich, S. G. · Bluml, S. · Panigrahy, A. · Tesoriero, L. ·Friedlich, P. · Nelson, M. D. · Seri, I. · Gilles, F.Children’s Hospital Los Angeles, University of SouthernCaliforniaLos Angeles, CAPURPOSEIt is believed that lateralization of function between hemispherestakes place during the third trimester of intrauterinelife. Some evidence of asymmetric brain development andearly lateralization has been derived from intrauterine behavioralobservation of more frequent right-arm movementscompared to left-arm movements in 17- to 27-week-oldbabies. Direct measurements of cortical activation and subsequentdemonstration of hemispheric asymmetries for lateralizedsensory stimulation do not exist so far. The purpose ofthis study was to investigate, if lateralization exists in thepreterm and term neonate by using functional MR imaging(fMRI) of a sensory-motor task in the left and the righthands.MATERIALS & METHODSForty-two preterm and term newborn patients of the NICU inneed for routine MR imaging were enrolled in this study (GA25-41, mean = 37 weeks). All parents gave written consentfor this IRB approved study. Patients were sedated beforeimaging using chloral hydrate (50 mg/kg). Newborns wereprepared and placed in the MRCI (Lammers MedicalMonday
MondayTechnology, Lübeck, Germany and AIRI, Cleveland, OH)equipped with the newborn head-coil. During imaging vitalsigns, movement, and sleep state was constantly monitored.Imaging was performed with a 1.5 T MR system (CV/i, 8.4software, General Electric Medical System, Milwaukee, WI).Functional acquisition: Single-shot gradient-echo echo-planarimaging (GR EPI) sequence (TR 3000, TE 50, FOV 180,FA 90, 64 x 64 matrix, 3 x 3 x 3 voxel resolution) and T2-weighted FSE images used to overlay. Two experiments, passivesensory-motor stimulation (A) of the left and the righthand, were conducted with the sleeping babies, provoking agrasp movement by repeated inflating/deflating of a rubberair-bulb (~2Hz) vs rest (R). We used an alternating block paradigmof RARARA lasting 30 s for each phase and a totalscanning time of 3 minutes. Statistical Parametric Mappingsoftware (SPM99) was used for spatial preprocessing and t-test statistics. Areas of activation/deactivation were identified(p < 0.01) and were accounted for hemispheric differences inthe post and precentral gyri and in the whole cerebrum.RESULTSMorphologic findings: 24 neonates with normal gyri/sulcipattern; 16 with abnormal findings; 2 dismissed. Fifty-sevenexperiments were performed (33 right and 24 left hand). Noadverse effects were observed. We found activation similarto the mature brain for the sensory-motor task in the contralateralgyrus pre/postcentralis (~58%), ipsilateral (~42%),bihemispheric thalamic, prefrontal, and occipital (~30%). Inthe abnormal cases, partial absence of activation could belinked to brain pathology. Head motion was insignificant,
Paper 45 Starting at 11:27 AM, Ending at 11:35 AMImaging and Clinical Follow-Up of Newborns withSeizures and Bright Diffusion-Weighted Imaging/Decreased Apparent Diffusion Coefficient LesionsGrant, P. E. 1,2 · Matsuda, K. M. 1,2 · Lopez, C. J. 2 · Sorensen,A. G. 1,2 · Gonzalez, R. G. 1,2 · Krishnamoorthy, K. S. 11Massachusetts General Hospital, Boston, MA, 2 A.A.Martinos Center for Biomedical Imaging, Charlestown, MAPURPOSETo determine the initial apparent diffusion coefficient (ADC)as well as imaging outcome of lesions identified on diffusionweightedimaging (DWI) in term infants presenting withseizures and to determine the corresponding clinical outcome.MATERIALS & METHODSTerm infants presenting with seizures, lesions with increasedDWI signal, and decreased ADC in the first week of life,imaging follow-up of at least 1 month and clinical follow-upof at least 12 months were included in this study. Diffusionweightedimaging patterns of abnormality were classified as1) central (VL thalamus and lateral lentiform), 2) peripheral(watershed) or 3) focal vascular territory lesions. Initial DWIand ADC maps as well as follow-up T2-weighted imageswere coregistered to the initial T2-weighted images. Regionsof interest were drawn on the initial DWI, transferred toADC maps, and the mean ADC of the DWI abnormalitydetermined. Abnormalities on follow-up T2-weightedimages were compared to initial area of involvement on thepresenting DWI study with volume loss and increased T2signal qualitatively graded as smaller, similar, or larger thaninitial DWI abnormality. Standardized neurologic assessmentswere performed at a minimum of 12 months of age.RESULTSFourteen patients met these criteria: one had a central patternof DWI bright signal, 6 had peripheral patterns, 7 had vascularterritory lesions. The mean ADC of pattern 1 was 1321 +/-154, pattern 2 was 840 +/- 129 and pattern 3 was 840 +/- 167x 10 -6 mm 2 /s. (Contralateral normal regions could not be calculatedin many cases due to the bilateral nature of the lesionsand therefore ratios compared to normal were not attempted).Imaging follow-up was obtained between 3 months and 2years and showed that the outcome of bright DWI areas wasvariable ranging from no detectable abnormality, volume losswith no T2 abnormality, volume loss with increased T2 signal,to cystic encephalomalacia with multiple outcomesoccurring in each lesion. In general, the structural outcome ofDWI lesions was a lesion smaller in size than the initial DWIabnormality but pattern 3 structural outcomes were worsethan pattern 2. On neurologic assessments at 12 -72 months,none had microcephaly or major motor disability and only 1developed a seizure disorder.CONCLUSIONIn these selected cases, bright lesions on DWI withdecreased ADC were not predictive of the severity of structuralinjury or of the degree of neurologic disability. Furtherneurologic follow-up and neuropsychological assessments atschool age are required to fully evaluate the consequence ofthese lesions.KEY WORDS: Neonate, seizures, ADC33Paper 46 Starting at 11:35 AM, Ending at 11:43 AMQuantitative MR Diffusion Fiber Tracking to AssessWhite Matter Pathways in Newborns with CongenitalHeart DiseasePartridge, S. C. · Miller, S. P. · Berman, J. I. · Glenn, O. A. ·McQuillen, P. · Henry, R. G. · Barkovich, A. · Ferriero, D.M. · Vigneron, D. B.University of California San FranciscoSan Francisco, CAPURPOSEWe recently described the occurrence of preoperative strokein newborns with D-transposition of the great arteries(TGA), a population at high risk of neurodevelopmentalimpairment (1). As neonatal repair of TGA results in nearnormal cardiovascular physiology, these newborns providean opportunity to study the effect of early injury on subsequentneonatal brain development. MR diffusion tensorimaging (DTI) identifies developmental changes in whitematter (WM) and gray matter microstructure (2). Diffusiontensorimaging fiber tractography (DTT) enables the 3D segmentationof axonal bundles, based on preferential directionof water diffusion along axons, allowing quantitation of DTIparameters in specific WM pathways (3, 4). Our purposewas to investigate corticospinal tract development in newbornswith TGA using pre and postoperative DTI and tractbasedquantitation of fractional anisotropy (FA) and directionallyaveraged diffusion (Dav).MATERIALS & METHODSSix term newborns with TGA undergoing an arterial switchoperation were studied with MR imaging and DTI pre andpostoperatively at a median of 4 (range, 2 - 9) and 16.5(range, 12 - 21) days of age respectively. Three newbornshad focal injury on MR imaging: (1) stroke (caudate head),(1) germinal matrix hemorrhage (caudothalamic notch), and(3) paratrigonal WM injury. Imaging was performed usingan MR-compatible incubator with a high-sensitivity neonatalhead coil (5). Diffusion-tensor imaging was acquired witha 4.8 min single-shot, multi-repetition echo-planar sequence;TR/TE = 7s/100 ms, 3 NEX, 256 x 128 matrix, 360 x 180mm FOV, 3 mm slice thickness, no gap. Diffusion gradientswere applied in 6 directions with b = 0 and 700s/mm2. DTTfiber tracks originating in cerebral peduncle were filteredthrough the internal capsule and centrum semiovale; FA andDav were measured on images from voxels containing fibertracks (4).RESULTSThe corticospinal tracts had a median FA of 0.32 (range: 0.27- 0.36) and median Dav of 1.12 mm 2/s (0.98 - 1.26). Infantswithout injury had increasing FA with age, median 9.1% perweek (2.9 -17.2%), and decreasing Dav with age, median -5% per week (-4% to -8%). Infants with injury had less dramaticchanges with age: median FA increase of 5% (2-5%),and median Dav decrease of -3% (-3 to -5%) per week. Of theinfants with injury, one had expected DTI values and maturationalchanges (increasing FA and decreasing Dav with age),one had asymmetry in the corticospinal tracts with reducedFA (-7.5%) on the affected side at both time-points, and onehad decreased Dav (-6%) on the affected side acutely.Monday
34MondayMonday Afternoon1:00 PM - 1:30 PMBallroom 6 A(8) ELC Lecture B: PDAs and theRadiologist— Richard H. Wiggins, III, MDMonday AfternoonCONCLUSIONThese preliminary data suggest that DTT might be used tocharacterize development of specific WM tracts in newborns.Further investigation is needed to determine the patternof abnormal microstructural development followingfocal brain injury, and whether maturational changes measuredin specific WM tracts may help assess risk of neurodevelopmentalimpairment in newborns with congenital heartdisease.REFERENCES1. Miller SP, et al. Ann Thor Surg in press2. Miller SP, et al. JMRI 2001;16:621-6323. Mori S, et al. Ann Neurol 1999;45:2654. Glenn OA, et al. JMRI 2003;18:641-6485. Dumoulin CL, et al. Magn Reson Engrg 2002;15:117-128KEY WORDS: Diffusion tensor imaging, neonatal, maturationalchangesMonday Morning10:15 AM - 11:45 AMRoom 602 - 6031:00 PM - 2:30 PMRoom 606 - 609(9) Learning Disabilities in Childhood(ASPNR)(9a) Overview of Learning Disorders: CurrentConcepts, Biological Foundations, andResearch— Bruce McCandliss, PhD(9b) Functional MR Imaging in Children:Techniques, Current Usefulness— Bruce McCandliss, PhD(9c) Pediatric Applications of Functional MRImaging— Nolan R. Altman, MDModerators :Carolyn Cidis Meltzer, MDNolan R. Altman, MD(7) ELC Workshop A: PowerPoint forthe NoviceOverview of Learning Disorders: Current Concepts,Biological Foundations, and ResearchBruce McCandliss, PhD— David S. Martin, MD— John L. Go, MD
35Functional MR Imaging in Children: Techniques,Current UsefulnessBruce McCandliss, PhDPediatric Applications of Functional MR ImagingNolan R. Altman, MDDr. Nolan R. Altman is currently and has been for the past 6years the Chief of the Department of Radiology at MiamiChildren’s Hospital. He is a volunteer associate professor ofRadiology at the University of Miami School of Medicine.He received his Medical Degree from the University ofMiami School of Medicine and completed a residency inRadiology at the Mount Sinai Medical Center of GreaterMiami. He did a fellowship in Pediatric Neuro andInterventional Radiology at the Hospital for Sick Children inToronto. He has been at Miami Children’s Hospital for thepast 20 years. He has written over 50 articles and 6 bookchapters of which 7 recent articles and 2 chapters dealspecifically with functional MR imaging.LEARNING OBJECTIVESUpon completion of this session, participants will be able to:1) Determine the role that fMRI plays in the pediatric patient2) Identify Constraints of fMRI in the pediatric patient3) Describe tasks to perform for successful fMRI in children4) Describe the application of fMRI to cognitive functionevaluation in childrenPRESENTATION SUMMARYThe role of fMRI in children will be addressed. The use offMRI in children is growing and the ability to investigatelanguage and learning disorders makes this techniqueinvaluable to investigate functions which are uniquelyhuman and developed in childhood. Functional MR imagingat Miami Children's Hospital has been performed for the past4 years with over 518 cases performed to date. Patients (290)have been evaluated for motor, language, visual, and cognitivemapping. Patients who benefit from this include thosewith preoperative planning for epilepsy and tumor surgery.Specific tasks will be presented that lend themselves to thepediatric patient. Investigational studies in sedated childrenfor language and visual paradigms will be reviewed.Comparison of normal subjects with disorders of speech andlearning (ADHD) will be addressed.REFERENCES1. Bernal B, Altman NR. Auditory Functional MR Imaging.AJR Am J Roentgenol 2001;176:1009-10152. Altman NR, Bernal B. Brain Activation in Sedated Children:Auditory and Visual Functional MR Imaging. Radiology2001;221:56-633. Jayakar P, Bernal B, Medina S, Altman NR. FalseLateralization of Language Cortex on Functional MRI aftera Cluster of Focal Seizures. Neurology 2002;58:490-4924. Bernal B, Altman NR. Speech Delay in Children: AFunctional MR Imaging Study. Radiology 2003;229:651-658Monday Morning1:00 PM - 2:30 PMBallroom 6 B/C(10) CT, MRI and PET Imaging inTreated Neck (ASHNR)(10a) Role of Positron Emission Tomography/CT inImaging of the Neck— Melanie B. Fukui, MD(10b) Postoperative Imaging of the Neck— Daniel W. Williams, III, MD(10c) Posttreatment Imaging of Larynx— David M. Yousem, MDModerators:Laurie A. Loevner, MDDavid M. Yousem, MDRole of Positron Emission Tomography/CT in Imaging ofthe NeckMelanie B. Fukui, MDLEARNING OBJECTIVES1) Describe the advantages of combined PET/CT imagingover retrospective fusion2) Review PET/CT in the evaluation of head and neck neoplasm3) Recognize limitations of PET/CT imagingPRESENTATION SUMMARYFDG PET is effective for monitoring head and neck cancer.Lack of anatomical landmarks, variable physiologic uptake,and asymmetric tracer distribution in the neck, however, canconfound image interpretation. This is particularly true in thetreated neck where distortion of normal tissue planes makesdetection of early disease recurrence difficult with static CTand MR imaging. Positron emission tomography/CT combinesthe physiologic data of PET with the anatomical precisionof CT. The mobile head and neck benefits from prospectiveimage fusion since movement between separatelyacquired CT and PET images may result in misregistrationduring retrospective image fusion. Indications for PET/CT inhead and neck imaging will be discussed, including recurrenthead and neck carcinoma, recurrent thyroid carcinoma,recurrent cranial base neoplasm, facilitating biopsy, detectionof the undiscovered primary site, staging of head andneck cancer, and tumor surveillance (1). Potential pitfallsthat include physiologic FDG uptake, scanner resolution,Monday
Mondayrecent radiation therapy, inflammatory processes, andtumors of low FDG avidity will be addressed. Cases thatillustrate the use of PET/CT imaging in preventing misinterpretationof FDG PET in head and neck cancer will be presented.REFERENCES1. Fukui MB, Blodgett TM, Meltzer CC. PET/CT Imaging inRecurrent Head and Neck Cancer. Semin US CT MR2003;24(2):157-163Postoperative Imaging of the NeckDaniel W. Williams, III, MDLEARNING OBJECTIVESUpon completion of this session, participants will be able to:1) Review and summarize recently revised neck dissectionclassification2) Distinguish with reconstruction techniques utilized followingsurgery for head and neck cancer3) Recognize the expected posttreatment appearance of theneck on CT and MR imaging4) Describe and identify complications and/or imaging pitfallsfollowing treatment for head and neck cancerPRESENTATION SUMMARYEvaluating patients following treatment for head and neckcancer is difficult for the surgeon or radiation oncologist andfor the radiologist. It is critical for the radiologist interpretingpostoperative CT or MR exams to understand neck dissection(ND) and reconstruction techniques. Surgical changes followingtreatment for head and neck cancer complicate interpretationof imaging exams and can lead to erroneous conclusions.This presentation will attempt to give the radiologista framework with which to approach these difficult postoperativeexams. The various types of NDs for head and neck cancerwill be discussed from both the surgical as well as theimaging point of view. The classification system that wasrevised in 2001 will be reviewed extensively. The typicalimaging appearance of NDs will be highlighted, along withpotential postoperative complications. Changes that are presentroutinely on CT or MR imaging following radical, modifiedradical, and selective NDs will be emphasized. Next,postoperative reconstruction techniques (myocutaneousflaps) will be discussed utilizing intraoperative photographsto illustrate the major procedures. The imaging appearance ofthese flaps then will be demonstrated, along with potentialcomplications and/or imaging pitfalls. Finally, there will be abrief discussion of radiation changes visible on imagingexams and potential ways to detect the current tumors followingtreatment for head and neck cancer.REFERENCES1. Som PM, Lawson W, Urken ML. The Posttreatment Neck:Clinical and Imaging Considerations. In: Som PM, CurtinHD, eds., Head and Neck Imaging, 4th edition. Mosby: St.Louis, 2003:2239-22722. Robbins KT, et al. Neck Dissection Classification Update.Arch Otolaryngol Head Neck Surg 2002;128:751-7583. Hudgins PA. Flap Reconstruction in the Head and Neck:Expected Appearance, Complications, and RecurrentDisease. Eur J Radiol 2002;44:130-13836Posttreatment Imaging of LarynxDavid M. Yousem, MDLEARNING OBJECTIVESUpon completion of this session, participants will be able to:1) Recognize the normal postoperative appearance aftervoice conservation procedures2) Apply knowledge of normal postop larynx surgery to beable to better detect recurrent tumors3) Distinguish the contraindications for supraglottic andsupracricoid laryngectomiesPRESENTATION SUMMARY:After laryngeal conservation surgery the normal architectureof the larynx will be grossly distorted. How much normalcartilage and laryngeal anatomy remains is a function ofwhether a supraglottic laryngectomy, vertical hemilaryngectomy,or supracricoid laryngectomy has been performed. Inthe latter a single arytenoid from the supracricoid laryngectomywill be used to appose to the base of the tongue orepiglottis to create a sphincter for speech and airway protection.The thyroid cartilage and usually the epiglottis willhave been removed unless a cricohyoidoepiglottopexy hasbeen performed. The cricoid cartilage is elevated. Expect tosee redundant mucosa and a narrowed laryngeal airway inthe postoperative setting of this surgery. After a total laryngectomythe normal cartilaginous structures of the larynxwill have been removed. In its place one will identify the“neopharynx” which is derived by suturing the two openends of the hypopharyngeal and/or pharyngeal tissuestogether into a tube to be used for swallowing. This mucosapreoperatively would have been in contiguity with the laryngealmucosa, and therefore marginal recurrences are possible.REFERENCES1: Maroldi R. Imaging of Postoperative Larynx and Neck.Semin Roentgenol 2000;35(1):84-1002: Maroldi R, Battaglia G, Nicolai P, Maculotti P, Cappiello J,Cabassa P, et al. Related Articles, Links CT Appearance ofthe Larynx after Conservative and Radical Surgery forCarcinomas. Eur Radiol 1997;7(3):418-431Monday Afternoon1:30 PM - 2:00 PMBallroom 6 A(11) ELC Lecture C: High SpeedConnectivity and Networking for Workand Home— Gerard J. Muro, MD
37458Monday Afternoon2:00 PM - 2:30 PMRoom 611 - 612(11A) National Library of Medicine(NLM): PUBMED Ò /MEDLINE ShortDemonstration LectureMonday Afternoon3:00 PM - 4:35 PMBallroom 6 B/C(12a) Adult Brain: Neoplasms(Scientific Papers 47 - 58A)— Linda MilgromMATERIALS & METHODSFifty patients with brain tumors near the pyramidal tractswere assigned randomly to trial (DTI navigation) or controlgroup (traditional navigation). The cases in control groupunderwent traditional navigation surgery. Those in trialgroup underwent DTI and T1-weighted 3D navigational MRstudies. FA maps were generated in workstation. The mainwhite matter tracts were constructed by the FA datasets, andmerged to the anatomical structure delineated from 3D navigationalMR imaging. The relationship between the tumorsand adjacent pyramidal tracts were segmented and reconstructedfor three-dimensional visualization.RESULTS(1) There were 25 cases in trial group and 25 in controlgroup, respectively. The statistical analysis confirmed wellbalance of main variations in two groups. (2) The lesionswere resected completely in 13 cases (52.0%) of controlgroup and 20 cases (80.0%) of trial group. (3) Postoperativeaggravated contralateral extremities weakness or hemiplegiaoccurred in 72% cases of control group, while only 20.0%cases in trial group. (4) The mean Karnofsky scales were69.58 ± 23.49 in control group and 84.80 ± 23.49 in trialgroup, respectively. The excellent outcome ratio (Karnofskyscale = 90~100) was 44.0% in control group and 72.0% intrial group, respectively. Fractional anisotropy MR imagesdepicted white matter features not typically seen on conventionalMR images (e.g., external capsule, internal capsule,callus, pyramidal tract). Fiber mapping images showed theipsilateral pyramidal tract as either discontinuous due toimpaired anisotropy or compressed due to mass effect inpatients with brain lesions.WithdrawnMondaySee also Parallel Sessions(12b) Adult Brain: Cerebrovascular Disease andStroke(12c) Head & Neck: General(12d) Pediatrics: General and Developmental andCongenital DisordersModerators:Aaron S. Field, MD, PhDPamela W. Schaefer, MDCONCLUSIONDiffusion tensor imaging provides new information regardingthe detailed relationship between tumor and nearby whitematter tracts applicable as important information in intraoperativeneuronavigation and in planning brain tumor surgery.Diffusion tensor imaging should be used routinely in neuronavigationsurgery of brain tumor involving pyramidaltracts to plan the optimal trajectory and ensure total resectionof the lesions during operation, as well as to decrease potentialdisability and length of stay postoperatively.MondayKEY WORDS: Brain tumor, frameless stereotaxy, diffusiontensor imagingPaper 47 Starting at 3:00 PM, Ending at 3:08 PMRole of Diffusion Tensor Imaging in NeuronavigationSurgery of Brain Tumors Near Pyramidal TractsHong, X. 1 · Wang, D. 1 · Wu, J. 2 · Shen, T. 2 · Chen, X. 21Jiangsu Province Hospital, Nanjing, CHINA, 2 HuashanHospital, Fudan University, Shanghai, CHINAPURPOSETo integrate three-dimensional reconstruction and imagesfusion of the pyramidal tract gained from MR diffusion tensorimaging (DTI) into a customized neuronavigation systemand to evaluate its usefulness during brain tumor surgery.WithdrawnPaper 48 Starting at 3:08 PM, Ending at 3:16 PMTracking Brain Tumor Invasion with MR Imaging byMeasuring Subvoxel Distribution of Water DiffusionRatesBennett, K. M. 1 · Hyde, J. S. 2 · Rand, S. D. 2 · Schmainda, K.M. 21National Institutes of Health, NINDS, Bethesda, MD,2Medical College of Wisconsin, Milwaukee, WIPURPOSEThe goal of this work was to develop a method of diffusionweighted(1) MR imaging (DWI) to detect the presence ofinvasive tumor cells in the brain, outside of the main tumorin glioblastoma multiforme (GBM). Detection of invasion iscrucial because these cells are blamed for the failure of conventionaltherapies to eradicate the tumor (2, 3).
MondayMATERIALS & METHODSEight Sprague-Dawley rats were inoculated with C6 gliomacells to model GBM invasion. Cells were injected 3 mmbelow the dura. Rats underwent MR imaging 14-15 days aftertumor inoculation. In three cases, glioma cells were labeledwith the PKH26 fluorescent dye. Five healthy controls wereimaged. The rats were anesthetized with urethane (1.2 g/kg).Rats were imaged on a Bruker 3T/60 scanner using DWI witha 64 ˘ 64 matrix, FOV of 6.4 cm, slice thickness of 1.0 mm,and a TE of 46 ms. The b-value was varied from 0 to 6500s/mm 2 . Rats were injected with gadopentate after DWI, andT1-weighted images were acquired. The DWI data were fittedwith the stretched-exponential model, described in reference4. From this “a-DWI” analysis, a heterogeneity index aand a distributed diffusion coefficient (DDC), were obtained.Regions of interest (ROIs) were created in tumor, peri-tumor,normal gray matter (GM) and white matter (WM). Five m mthick frozen sections of the brain were examined by fluorescencemicroscopy (FM).RESULTSThere was a significantly (p < 0.01, Student’s t-test) lowervalue of a in voxels in the peri-tumor and tumor voxels thanin GM. The value of a was significantly higher in the peritumorregion than in WM, but not in the tumor region. DDCwas significantly lower in the tumor and peri-tumor ROIs thanin WM, but was only significantly higher than GM in thetumor ROI. FM confirmed the presence of tumor cells in theperi-tumor region. There was no increase in T2 or proton-densitysignal in the peri-tumor region, making edema an unlikelysource of the change. Invasion could not be identified byconventional postcontrast images. The Figure shows that aand DDC can be used to identify the peri-tumor regions fromnormal voxels. Each point is the average value in a single rat.CONCLUSIONA decrease in a tracks brain tumor invasion in the rat brain.Once developed for clinical use, aDWI may guide surgicalremoval invading GBM cells.REFERENCES1. Chenevert TL, et al. Clin Cancer Res 1997;3:1457-14662. Giese A, Westphal M. Neurosurgery 1996;39:235-2503. Burger PC, et al. J Neurosurg 1983;58:159-1694. Bennett KM, et al. Magn Reson Med 2003;50:727-734KEY WORDS: DWI, invasion, brain tumorThe authors of this work have indicated the following affiliations/disclosures:National Institutes of Health/NationalCancer Institute: CA082500; MCW Cancer Center.38Paper 49 Starting at 3:16 PM, Ending at 3:24 PMValidity of Diffusion Tensor MR Imaging Prior toNeurosurgical Procedures: Preliminary ResultsKitzler, H. 1 · Werner, A. 1 · Mucha, D. 1 · Dymora, M. 1 ·Steinmeier, R. 1 · Sorensen, G. 2 · von Kummer, R. 11University of Technology, Dresden, GERMANY,2Massachusetts General Hospital, Boston, MAPURPOSEPreventing damage to eloquent areas and hence to improvethe quality of surgical procedures is an important issue especiallyfor brain tumors, which can infiltrate the pyramidaltract (PT). To keep morbidity low, its preoperative visualizationis of utmost importance because it might be dislocatedby tumor growth or invasion. Integrating diffusion tensorimaging (DTI) data into neurosurgical planning providesinformation about orientation, shape, and connectivity offiber pathways. The aim of this study is to prove functionalvalidity of presurgical-obtained DTI data.MATERIALS & METHODSPatients (n = 17) with unilateral high (n = 12) and low grade(n = 5) gliomas located in the vicinity of the PT underwentneuroimaging including DTI prior to navigational-guidedtumor resection. Based on the combined constellation of thealteration of the T2 signal and the fractional anisotropy (FA)in sections of the PT adjacent to tumor tissue patients wereclassified in either dislocated, edematous, infiltrated, or disrupted.Measurements were performed on a 1.5 T scanner(Sonata, Siemens Medical Solutions, Germany), using a diffusion-weightedEPI sequence [TR/TE: 4000/129 ms; FOV:230 x 230 mm; slice thickness: 2 mm; matrix:128 2 ; EPI-factor:128;single b-value (750/1000) applied to 6 directions].Postprocessing of the DTI data was performed with the“DTI-Task-Card” tool (MGH, Boston, MA). Additionally,contrast-enhanced T1 maps using a 3D FLASH sequence(TR/TE: 6/3 ms, a = 10°, FOV: 250 x 250 mm, matrix: 256 2 ,eff. slice thickness: 2 mm, and T2 maps (TR/TE:3000/109ms, a = 150°, FOV:250 x 250 mm, matrix: 256 x 198, eff.slice thickness: 2 mm) were generated.RESULTSTumor influence on PT was classified by its maximum disturbanceof functional integrity, i.e., dislocation, edema,infiltration (n = 7) or disruption (n = 10) of at least one sectionof the PT. Whereas disruption of the PT was correlatedwith an overall deficit of contralateral motor performance in50% (n = 5) of all glioma patients, infiltration of PT sectionsshowed correlation to motor deficit in 29% (n = 2).Considering low-grade gliomas infiltrating or disrupting thePT, 50% (n = 1) and 67% (n = 2), respectively, had a motordeficit, whereas 20% (n = 1) and 43% (n = 3), respectively,were found in high-grade gliomas. Only 3 of all patients(18%) showed postoperative deterioration of motor performance.
39MATERIALS & METHODSWe investigated the correlations between MR imaging featureson preoperatory scan, histopathologic diagnosis, andthe genetic molecular profile in 36 patients with grade II orgrade III oligoastrocytomas, defined according to morphologiccriteria. Loss of heterozigosity (LOH) with differentmicrosatellite markers was studied in chromosomes 1p, 10q,17p, and 19q in 36 OA (15 low grade and 21 high grade).The MR images were examined for location of the tumor,mass effect, sharpness of the border on T1-weighted images,homogeneity of tumor signal on T1- and T2-weightedimages and presence of contrast enhancement.MondayFigure: Pyramidal tract dystopiaCONCLUSIONSince neuroepithelial tumors differ in their behavior to infiltrateneuronal fiber pathways, preoperative neuroimagingincluding DTI can distinguish between disruption, infiltration,edema, and dislocation (see Figure). Although DTIrequires final clinical validation it potentially offers animportant tool for presurgical visualization of eloquent brainstructures therefore preventing additional postoperative morbidity.Its integration into neuronavigational systems mightpossibly offer additional support to the surgeon.Intraoperative validation as well as postsurgical evaluationof the applied method is mandatory for future systematicstudies.KEY WORDS: Diffusion tensor imaging, brain tumors,pyramidal tractThe authors of this work have indicated the following affiliations/disclosures:Center for Biomarkers in Imaging, MGHBoston, MA, and Siemens Medizintechnik AG, Germany:providing the DTI-Task-Card.Paper 50 Starting at 3:24 PM, Ending at 3:32 PMRelationship between MR Imaging and GeneticMolecular Profiles in OligoastrocytomasMaccagnano, C. · Bruzzone, M. G. · Bissola, L. · DeSimone, T. · Silvani, A. · Pollo, B. · Bianchessi, D. ·Finocchiaro, G. · Eoli, M.National Neurological InstituteMilan, ITALYPURPOSETo determine whether different genetic molecular profiles inoligoastrocytomas (OA) could be linked with peculiar featuresin MR imaging and histopathologic characterization ofthese tumors.RESULTSIn our series of 36 cases MR findings suggestive of highgradegliomas were found frequently in oligoastrocytomaswith LOH 10q while tumors with LOH 1p and 19q, althoughclassified as anaplastic oligoastrocytomas had more oftenMR findings consistent with low-grade gliomas. A correlationwas observed between 1p and/or 19q LOH and homogeneousT1 and T2 signal (p = 0.02, 15/22 patients) and withtumor location other than temporal. Indistinct border, T1 andT2 lack of homogeneity and presence of contrast enhancementwere associated significantly with LOH on 10q (p
MondayPaper 51 Starting at 3:32 PM, Ending at 3:40 PMRelative Cerebral Blood Volume Maps Corrected forContrast Agent Extravasation Significantly Correlatewith Glioma Tumor Grade whereas Uncorrected MapsDo NotBoxerman, J. L. 1 · Rand, S. D. 2 · Krouwer, H. G. J. 2 ·Schmainda, K. M. 21Rhode Island Hospital, Providence, RI, 2 Medical College ofWisconsin, Milwaukee, WIPURPOSERelative cerebral blood volume (rCBV) estimates computedwith dynamic susceptibility contrast MR imaging for highgradetumors are artificially lowered by contrast extravasationthrough disrupted blood-brain barrier. We hypothesizedthat rCBV corrected for agent leakage would correlate significantlywith histopathologic tumor grade, whereas uncorrectedrCBV would not.MATERIALS & METHODSWe computed rCBV maps for 40 patients with cerebral neoplasms.Prior to dynamic imaging, 0.05 mmol/kg of Gd-DTPA were administered to diminish T1 effects that mightresult from agent extravasation. For some very leaky highgradetumors, this may be required to produce any discernablesignal drop during bolus passage. Single shot gradientechoimages were acquired for 1 minute before and 2 minutesafter a 0.25 mmol/kg bolus of Gd-DTPA (five 7 mmslices, TE/TR = 30/1000 ms, FOV = 24 cm, 64 x 64 matrix).DR2(t) derived from signal intensity data for each voxel wasintegrated numerically, with and without correction for contrastextravasation, to generate rCBV maps. A linear correctionalgorithm was applied to the signal time course to estimatethe effects of contrast agent leakage (1, 2).Representative tumor rCBV was computed from a ROIplaced over enhancing tumor, excluding regions of necrosisdemonstrated on postcontrast T1-weighted images (spinecho, TE/TR = 11/500 ms, 256 x 256 matrix, NEX = 2), andwas normalized to contralateral brain. The statistical correlationbetween normalized rCBV (corrected and uncorrected)and histopathologic tumor grade (determined from biopsy orgross resection) was computed with the Spearman rank correlationtest, with significance threshold p = 0.05.RESULTSTen, eight, and 22 patients had tumors classified as WHOgrades II, III, and IV, respectively. Uncorrected normalizedrCBV (mean ± std dev) for grades II, III, and IV was 1.28 ±0.95, 2.50 ± 1.71, and 2.12 ± 1.82, respectively. Correctednormalized rCBV was 1.29 ± 0.94, 3.14 ± 1.85, and 3.83 ±2.07. The percent difference between uncorrected and correctedrCBV (mean, (range)) was 2% (0-21%), 21% (0-142%), and 64% (0-254%) for grades II, III, and IV, respectively.In those cases where no difference was noted, predoseGd-DTPA probably limited T1 contamination during boluspassage by diminishing the extravasation gradient. TheSpearman rank correlation coefficient between correctedrCBV and tumor grade was 0.54, with significant correlation(p = 0.0004). By comparison, uncorrected rCBV and tumorgrade were not correlated significantly, with a Spearmanrank correlation coefficient of 0.17 (p = 0.29).40CONCLUSIONFor most high-grade gliomas, correcting for contrast agentextravasation is necessary to produce accurate rCBV estimatesthat are correlated significantly with WHO tumorgrade. Artificially lowered rCBV may be construed erroneouslyto reflect a lower-grade tumor in the absence of correction.REFERENCES1. Weisskoff RM, Boxerman JL, et al. Simultaneous BloodVolume and Permeability Mapping Using a Single Gd-BasedContrast Injection. In: Second Meeting, Society of MagneticResonance. San Francisco, 19942. Donahue KM, Krouwer HG, et al. Utility of SimultaneouslyAcquired Gradient-Echo and Spin-Echo Cerebral BloodVolume and Morphology Maps in Brain Tumor Patients.Magn Reson Med 2000;43(6):845-853KEY WORDS: Cerebral blood volume, glioma grade, contrastagent leakage correctionThe authors of this work have indicated that they will be discussing/presentingan unapproved or investigative use ofOmniscan made by Nycomed-Amersham, Inc. for cerebralblood volume mapping.Paper 52 Starting at 3:40 PM, Ending at 3:48 PMTumor Blood Flow Measurements at 3 T UsingContinuous Arterial Spin Labeled Perfusion MRImagingWolf, R. L. · Wang, J. · O’Rourke, D. M. · Judy, K. D. ·Melhem, E. R. · Detre, J. A.University of Pennsylvania Medical CenterPhiladelphia, PAPURPOSETo measure blood flow in brain neoplasms using continuousarterial spin labeled perfusion MR imaging, exploiting higherfield strength (3 T) for improved signal-to-noise (SNR),and improved spin labeling due to increased T1.MATERIALS & METHODSContinuous arterial spin labeled (CASL) perfusion imageswere obtained in 12 contiguous axial sections from 7 subjectswith brain neoplasms using a 3 T Siemens Trio scannerand product T/R head coil. Continuous arterial spin labeledwas implemented using a postlabeling delay of 1200 msec aspublished previously for 1.5 T imaging (1, 2), and reducedRF amplitude of labeling pulses (22.5 mG) along with weakerlabeling gradient to remain within FDA guidelines for RFdeposition. Pathology of neoplasms included 1 diffuse largeB cell lymphoma and 6 gliomas with WHO grade IV (n = 3),grade III (n = 1), and grade II (n = 2). Regions of interest(ROIs) were drawn over areas of increased perfusion. Whentumor blood flow was not obviously increased (ordecreased), ROIs were placed over regions of signal abnormalityon conventional images (T2-weighted, FLAIR,and/or T1-weighted with contrast), excluding regions suggestiveof vasogenic edema. Mirror ROIs were drawn incontralateral brain. Blood flow was calculated in each ROIas described previously (3). Global cerebral blood flow(CBF) was measured over all 12 imaging locations.
RESULTSHigh quality quantitative perfusion images were obtained inall cases. The table shows tumor blood flow as a relativemeasure (rTBF = ipsilateral/contralateral blood flow inROIs) and as a normalized measure (nTBF = TBF/globalCBF) for each subject. Normalized TBF (nTBF) was > 1 forWHO grade III and IV neoplasms, and < 1 for WHO gradeII neoplasms and the case of lymphoma. Relative TBF(rTBF) showed a similar distribution with one exception,where a grade II neoplasm showed rTBF > 1 (1.27). Theseresults are consistent with those published previously usinga pulsed arterial spin labeled (PASL) perfusion method at 1.5T (4).Normalized and Relative Tumor Blood FlowSubject Pathology nTBF rTBF1 WHO grade IV 1.20 1.472 WHO grade IV 2.37 2.533 WHO grade III 2.30 2.154 WHO grade II 0.91 1.275 WHO grade II 0.62 0.746 WHO grade IV 1.29 1.157 Lymphoma 0.67 0.73CONCLUSIONContinuous arterial spin labeled perfusion MR imaging at 3T yields high-quality quantitative perfusion images.Preliminary results suggest that tumor blood flow normalizedto global cerebral blood flow may provide the best distinctionbetween high-grade (WHO grade III and IV) andlow-grade neoplasms (WHO grade II and lymphoma in thisstudy). This provides a noninvasive alternative to dynamicsusceptibility contrast perfusion MR images, where measuresof relative cerebral blood volume have been shown tobe useful in predicting grade in brain neoplasms (5).REFERENCES1. Alsop DC, Detre JA. J Cereb Blood Flow Metab 1996;16:1236-12492. Alsop DC, Detre JA. Radiology 1998;208:410-4163. Wang J, Alsop DC, Li L, Listerud J, et al. Magn Reson Med2002;48:242-2544. Warmuth C, Gunther M, Zimmer C. Radiology 2003;228:5235. Law M, Yang S, Wang H, Babb JS, et al. AJNR Am JNeuroradiol 2003;24:1989-1998KEY WORDS: Arterial spin labeling (ASL), cerebral bloodflow (CBF), CNS neoplasmsPaper 53 Starting at 3:48 PM, Ending at 3:56 PMVolume of Bolus Tracking Perfusion AbnormalityPredicts Emergence of Contrast Enhancement inGlioblastoma MultiformeCrawford, F. W. · Cha, S. · Lupo, J. M. · Sadarangani, P. A.· Berger, M. S. · Chang, S. · Dillon, W. P. · Nelson, S. J.University of California San FranciscoSan Francisco, CAPURPOSEExternal beam radiation therapy (XRT) is the most effectiveadjunctive therapy to control rapid tumor progression inhigh-grade gliomas following initial surgical resection. Theresidual contrast-enhancing tumor, widely accepted as themost malignant portion of the tumor, is an important target41for radiation therapy (1). Contrast enhancement representsan area of blood-brain barrier breakdown and may not besynonymous with malignancy or angiogenesis. Bolus trackingperfusion MR imaging may be useful in assessing tumorangiogenesis indirectly (2, 3) and may provide additionalinformation on changes in tumor characteristics during irradiation.We correlated the preirradiation bolus tracking perfusionabnormality with the postirradiation contrastenhancement pattern in patients with glioblastoma multiforme(GBM).MATERIALS & METHODSMR imaging was performed on 14 patients with untreatedGBM using conventional anatomical imaging and bolustracking T2*-weighted echo-planar MR imaging. Allpatients underwent subtotal resection with minimal residualcontrast enhancement. The patients were imaged 4 weeksafter surgery but before irradiation, after irradiation, and at 2months interval thereafter. Peak height and percent recoverymaps of the post bolus DR2* signal were calculated.RESULTSThe volume of residual perfusion abnormality before irradiationcorrelates with the volume of contrast enhancement onT1-weighted images on both the immediate post-XRT scan(n = 14, R 2 = 0.854) and at 2 months post-XRT (n = 8, R 2 =0.934). There was poor correlation (n = 10, R 2 = 0.178)between pre-XRT contrast enhancement and post-XRT contrastenhancement.CONCLUSIONThe results of our study suggest that there is a strong correlationbetween pre-XRT perfusion abnormality and emergenceof contrast enhancement post-XRT, and that there isno correlation between pre-XRT contrast enhancement volumeand post-XRT contrast enhancement volume for a giventumor in patients with GBM. The emergence of contrastenhancement following XRT probably represents dynamicMonday
Mondaychanges in tumor microvasculature as opposed to true emergenceof recurrent tumor or failure of therapy. Contrastenhancement on a pre-XRT scan is nonspecific and may representresidual tumor or postsurgical granulation tissue,which may account for the lack of correlation between pre-XRT and post-XRT contrast enhancement volume.Progression of contrast enhancement may be expected inregions of tumor but not in regions of postoperative damage.Therefore, the pre-XRT residual perfusion abnormality maybe a more accurate assessment of residual tumor than theimmediate postoperative scan, and hence, a better target forradiation therapy planning.REFERENCES1. Prados MD, Levin V. Biology and Treatment of MalignantGlioma. Semin Oncol 2000;27:1-102. Cha S, Knopp EA, Johnson G, Wetzel SG, Litt AW, Zagzag D.Intracranial Mass Lesions: Dynamic Contrast-EnhancedSusceptibility-Weighted Echo-Planar Perfusion MRImaging. Radiology 2002;223:11-293. Knopp EA, Cha S, Johnson G, et al. Glial Neoplasms:Dynamic Contrast-Enhanced T2*-Weighted MR Imaging.Radiology 1999;211:791-797KEY WORDS: Perfusion, CBV, glioblastoma multiformeThe authors of this work have indicated the following affiliations/disclosures:1. P50 CA97297; 2. National Institutes ofHealth NS045013: Research support.Paper 54 Starting at 3:56 PM, Ending at 4:04 PMThe Steroid, Dexamethasone, Normalizes Brain TumorHemodynamics in a Rat Tumor Model as Indicated byDynamic Susceptibility Contrast MR Imaging PerfusionParametersQuarles, C. C. · Ward, B. D. · Rand, S. D. · Krouwer, H. G.· Schmainda, K. M.Medical College of WisconsinMilwaukee, WIPURPOSEThe purpose of this study was to determine the therapeuticeffect of dexamethasone on the rat 9L gliosarcoma modelusing perfusion-weighted dynamic susceptibility MR imaging(DSC MRI).42MATERIALS & METHODSTwenty-four Fisher rats were inoculated with 9L gliosarcomabrain tumor cells. Of these, 15 were treated with 3 mg/kgof dexamethasone (i.p.) and 9 served as (untreated) controls.All MR experiments were performed on a 3 T system 14days postinoculation. Just prior to the perfusion scan, a 0.05mmole/kg loading dose of a gadolinium contrast agent wasadministered to diminish T1 leakage effects that may occurduring the subsequent perfusion scan. Next, a 2 min simultaneousGE/SE EPI pulse sequence was used for the DSC perfusionscan. At 1 min, a 0.2 mmol/kg bolus of gadoliniumwas administered via the femoral vein. To determine theenhancing tumor area T1-weighted SE images were acquiredafter the DSC perfusion scan. Gradient echo and SE CBF,CBV, and MTT maps were created using the SVD approach(1). Intravoxel transit time distributions (TTDs) were calculatedfrom the negative derivative of the residue function (2).The maximum difference between a voxel’s cumulative TTDand a normal cumulative TTD (averaged over a normal ROI)also were computed. Unpaired two-tailed t-tests were used tocompare the effects of treatment, using an a = 0.05 level ofsignificance.RESULTSA significant decrease in tumor volume following dexamethasonetreatment was observed. The GE nCBF doubled(not significantly) while the GE nCBV and nMTT decreasedsignificantly with treatment. The SE nCBF increased whilethe nMTT decreased, both significantly. Following treatmentthe tumor TTD appeared more like normal brain tissue.There was a significant change between the treated anduntreated maximum differences for normal and tumor cumulativeTTD.CONCLUSIONIn addition to the previously reported decreases in nCBV andvessel diameter (3) we now show that these morphologicchanges in the tumor vasculature, following dexamethasonetreatment, are accompanied by functional changes in thetumor hemodynamics. The normalization of nMTT followingtreatment may indicate an increased perfusion efficiency,so that it is more like that of normal tissue. Given that dexamethasonehas been shown to inhibit VEGF expression, itis possible that the effect observed here results from the normalizationof the balance of angiogenic factors, followed bya renormalization of the vascular morphology. Thus, the newperfusion parameters described here can provide more specificinformation about a tumor’s vascular response to therapy,thus aiding in the optimization and evaluation of novelantiangiogenic therapies.REFERENCES1. Ostergaard L, et al. MRM 1996; 36:715-7252. Ostergaard L, et al. J Cereb Blood Flow Metab 1999;19:690-6993. Badruddoja MA, et al. Neuro Oncol 2003;5(4)KEY WORDS: Antiangiogenic therapy, dynamic susceptibilitycontrast, tumor perfusionThe authors of this work have indicated the following affiliations/disclosures:National Institutes of Health/NationalCancer Institute: CA082500.Paper 55 Starting at 4:04 PM, Ending at 4:12 PMStimulated Proliferation of Canine Bone MarrowStromal Cells Following Exposure to GadodiamideFujimoto, T. · Purdy, P. · May, H. · Miller, S. · McFarland,W. R. · Fujimoto, H. · Finnegan, M.University of Texas Southwestern Medical CenterDallas, TXPURPOSEBone marrow stromal (BMS) cells isolated from themedullary canal of long bones possess the potential to differentiateinto various cell types and have been proposed asa suitable source of stem cells for reconstructive tissue engineeringin clinical therapeutics. In order to perform cellulartransplants in various tissues, imaging techniques will needto be applied to detect effects from the transplants. MR
imaging should be suitable for this purpose. However, thereare no reports investigating the effect of MR imaging contrastagent on BMS cells. The purpose of this study is togauge the effect of an MR imaging contrast agent on canineBMS cells.MATERIALS & METHODSAdult, canine BMS cells were harvested from femoral shaftsand placed in culture medium. After 14 days, cultures weredivided and cells were plated and divided into nine groups,including test groups exposed to 0.01%, 0.1%, and 1% gadodiamide,test groups exposed to 10 -3 , 10 -4 , 10 -5 , and 10 -6 Mfree gadolinium ion, and control groups for each test set.Gadodiamide groups were further subdivided into 1, 6, 12,and 24 hours of exposure to the agent. Free gadoliniumgroups were obtained by using those concentrations of ion inthe culture medium. Morphologic observation as well asanalysis of cell proliferation by measurement of DNA synthesisand cell number were performed on both the gadodiamideand gadolinium groups.RESULTSDilutions of gadodiamide ranging from 0.01% to1% stronglystimulated the cell proliferation of canine BMS cell whencompared to a control group [p < .05(*) to p < .01(**)](Figure). Time of exposure and density concentrations ofgadodiamide affect canine BMS cell proliferation, with stimulationincreasing with increasing exposure, but even 1 hourof exposure showed stimulation (p < .05). Although freegadolinium cation stimulated the proliferation of canineBMS cells, that effect is expressed more weakly than wasobserved with gadodiamide.CONCLUSIONGadodiamide strongly stimulates the cell proliferation ofcanine BMS cells in a dose- and time-dependent manner.Free gadolinium has a stimulatory effect which is less pronouncedthan the gadolinium-containing contrast material incanine bone marrow stromal cultures.KEY WORDS: Gadodiamide, cellular proliferation, bone marrowstromal cells43Paper 56 Starting at 4:12 PM, Ending at 4:20 PMVascular Supply to Meningiomas: Correlation ofQuantitative Analysis of T2* Susceptibility during BolusTracking Perfusion MR Imaging with DigitalSubtraction AngiographyHoghooghi, D. · Cha, S. · Cullen, S. P. · Lupo, J. M. ·Halbach, V. V. · Dillon, W. P.University of California San FranciscoSan Francisco, CAPURPOSEVascular supply to intracranial meningiomas assessed bydigital subtraction angiography (DSA) is derived most commonlyfrom the external carotid artery (ECA) but also fromthe internal carotid artery (ICA). To reduce tumor vascularity,preoperative embolization only can be performed safelyon ECA branches. Dynamic contrast-enhanced bolus trackingT2* perfusion MR imaging (pMRI) provides quantitativeassessment of tumor vascularity but the derived blood volumemeasurement may not be reliable in tumors withoutblood-brain barrier (1). The purpose of this study was to correlatequantitative analysis of T2* susceptibility during bolustracking pMRI and DSA in meningiomas.MATERIALS & METHODSThirty patients with previously untreated meningiomas werestudied. All patients underwent preoperative anatomical andbolus tracking susceptibility pMRI as well as DSA. Axialfluid-attenuated inversion recovery and postcontrast T1-weighted spoiled gradient recalled images were acquired andused to define regions of T2 or T1 contrast enhancing abnormality.Bolus tracking pMRI was performed using susceptibilityweighted images acquired during the first pass of Gd-DTPA (0.1mmole/kg) with a TR/TE of 1000-1250/54 ms,35 o flip angle, FOV of 26 ˘ 26 cm 2 , 128 ˘ 128 acquisitionmatrix, and 3-6 mm slice thickness. The perfusion series wasresampled to a 32 ˘ 32 grid in-plane with a 16 x 16 cm 2 FOVso that the observed signal changes had sufficient signal-tonoiseratio to be analyzed reliably on a voxel-by-voxel basis.The T2* signal time curve was converted to relaxivity timecurve, DR2 *. Peak height (PH) and percent recovery of T2*relaxivity were normalized to the peak of a model curvefunction derived from normal-appearing brain based on histogramanalysis of the precontrast echo-planar images.Voxels with PH values greater than twice the model curvewere considered abnormal. The minimum percent recovery(MPR) of T2* signal at the end of the first pass was recorded.RESULTSMeningioma vascular supply, determined by DSA, was asfollows: six ICA, ten ECA, and 14 mixed. In the ICA group(n = 6), the mean MPR was 42.5 ± 16.8, in the ECA group(n = 10), the mean MPR was 21.8 ± 13.2, and in the mixedgroup (n = 14), the mean MPR was 20.5 ± 17.11. The differencein mean MPR between ICA and ECA (p = 0.03) andICA and ECA plus mixed (p = 0.02) were significant. Therewas no statistical difference in the mean PH between thegroups.Monday
MondayCONCLUSIONOur data suggest that percent recovery of T2* relaxivity duringbolus tracking pMRI can provide indirect information onvascular supply to meningiomas. We found that the minimumpercent recovery was significantly greater in meningiomassupplied predominantly by the ICA compared withthe ECA. Wide variation of T2* signal recovery in the mixedgroup likely reflects variable contribution from both arterialbranches. Further studies with image coregistration betweenpMRI and DSA will aid in more precise correlation of tumorvascular supply between the two methods.REFERENCES1. Cha S, Knopp EA, Johnson G, et al. Intracranial MassLesions: Dynamic Contrast-Enhanced Susceptibility-Weighted Echo-Planar Perfusion MR Imaging. Radiology2002;223:11-29KEY WORDS: Meningioma, perfusion MR imaging, angiographyPaper 57 Starting at 4:20 PM, Ending at 4:25 PMPrimary Leptomeningeal Melanosis with MalignantDegenerationKeiper, M. D. · Jones, W. · Horsley, W.Scottsdale Medical ImagingScottsdale, AZPURPOSETo describe the radiographic findings, natural history, andapplicable world literature of adult primary leptomeningealmelanosis through a clinical case report which utilizes newtechniques for imaging of this entity.MATERIALS & METHODSThis case report follows the clinical course of a 67-year-oldwhite female with pathologically proven leptomeningealmelanosis with subsequent malignant degeneration from initialpresentation in February 2002 to end stage disease inFebruary 2003. Imaging studies performed at initial presentationin which the patient complained of right body numbness,right extremity weakness, and dizziness include CT,MR imaging, and four-vessel angiography. Subsequent follow-upimaging 6 months and 1 year after initial presentationinclude CT, MR imaging, and positron emission tomographyCT (PET CT). Clinical findings, cerebrospinal fluid cytology,and surgical pathology will be presented.RESULTSAt inital presentation, CT imaging demonstrated gyriformand sulcal high attenuation in the midline frontal regions presumedto represent hemorrhage. MR imaging revealed gyriformand sulcal high signal on short TR imaging with sulcalenhancement and prominent leptomeningeal veins interpretedby a nonneuroradiologist as probable cortical hemorrhageand/or subarachnoid hemorrhage from subacute infarction,vasculitis, or leptomeningeal vascular malformation.Angiography revealed no vasculitis and no vascular malformation.The patient subsequently was followed with presumedclinical diagnosis of subacute infarct. Follow-up CTscan at 6 months revealed no significant change. Ultimately,1 year after initial presentation, the patient presented withmarked deterioration in mental status and possible seizure44activity. MR imaging at that time revealed progression ofsignal intensity abnormality in the bilateral frontal regions,additional new leptomeningeal disease, and a new region ofparenchymal edema, mass and enhancement in the medialleft frontal lobe. This study was interpreted by a neuroradiologistwho diagnosed probable primary leptomeningealmelanosis with malignant degeneration. Subsequent clinicalexamination and metastatic work-up revealed no primaryskin, occular or other soft tissue melanoma. In addition, PETCT revealed hypermetabolic activity in the regions of malignantdegeneration in the brain with no activity in the regionsof bland melanosis or within the remainder of the body.Pathologic analysis from surgical biopsy confirmed malignantmelanoma with parenchymal invasion in the medialfrontal lobe.CONCLUSIONPrimary leptomeningeal melanosis is a rare disorder with anonspecific clinical presentation but with relatively specificradiographic findings which may be misinterpreted by generalradiologists and neuroradiologists unaware of the potentialmanifestations of this disease. This case report describesthese radiographic findings, follows the natural history ofdisease in a patient, and evaluates the use of PET CT in diagnosisand staging.REFERENCES1. Byrd SE, Reyes-Mugica M, Darling CF, Chou P, Tomita T. MRof Leptomeningeal Melanosis in Children. Eur J Radiol1995;20:93-992. Son YJ, Wang KC, Kim SK, et al. Primary IntracranialMalignant Melanoma Evolving from LeptomeningealMelanosis. Med Pediatr Oncol 2003;40:201-204KEY WORDS: Melanosis, leptomeningeal melanoma,positron emission tomographyPaper 58 Starting at 4:25 PM, Ending at 4:30 PMNeuroblastoma Mimicking Subdural Hematoma atOnsetWatanabe, K. · Koyama, M. · Ishii, M.Okazaki City Hosiptal, Aichi, JAPANOkazaki, Aichi, JAPANPURPOSETo describe a extremely rare condition of neuroblastomaoriginating from convexity dura matter. The symptoms andthe CT findings had developed just like chronic subduralhematoma.MATERIALS & METHODSA 46-year-old man had been suffering from headache for acouple of weeks. CT scan revealed hyperdense subduralhematoma at right convexity (Figure - left). Since thehematoma was thin, the patient was observed at out-patientclinic for 2 months. As the hematoma gradually increased insize, aspiration procedure was attempted resulting in failure.MR imaging showed both sub/epidural mass lesion, which isisointensity on T2-weight images, compressing and invadingthe brain parenchyma with slight edema (Figure - right). MRimaging also depicted the adjacent skull abnormality.
45RESULTSThe patient underwent craniotomy; the tumor was removedpiecemeal. The tentative pathology reported the tumor ashighly malignant. Irradiation therapy was scheduled but thetumor recurred before start. Immunohistochemical examinationshowed the tumor cells were positive for neuron-specificenolase, negative for synaptophysin and chromogranin. Inconjunction with the histologic study, the final diagnosis ofneuroblastoma was determined. Systemic studies revealedno other primary tumors and the tumor first appeared atepidural space, later extended to subdural space. These findingssuggest the tumor is the neuroblastoma arising fromconvexity dura matter.CONCLUSIONNeuroblastoma primarily originating from dura matter isextremely rare. We speculate the tumor occurred from theheterotopic neuroglial nest cells of meninges. At an earlystage of growth, the tumor might arise in epidural space andspread along the dura matter. Later on, the tumor invadedsubdural space and brain as well as the skull.KEY WORDS: Neuroblastoma, dura matter, subduralhematomaPaper 58A Starting at 4:30 PM, Ending at 4:35 PMCerebellopontine Angle Meningiomas: DifferentiatingClinical and Imaging FeaturesJess, S. J. R. · Salzman, K. L. · Harnsberger, H. R.University of UtahSalt Lake City, UTPURPOSEWhen cerebellopontine angle (CPA) meningiomas extendinto the internal auditory canal (IAC) they may be difficultto differentiate both clinically and radiologically from themore common vestibulocochlear schwannoma. The purposeof our study was to evaluate clinical and radiologic characteristicsof CPA meningiomas with particular attention toIAC extension and frequency of sensorineural hearing loss(SNHL) vs other cranial neuropathies.MATERIALS & METHODSA retrospective review of all patients with CPA meningiomaswho were evaluated or imaged at our institution over a 16-year period from 1987 to 2003 was performed. Clinical datacollected included demographics, presenting symptoms, andrecurrent or residual tumor following surgery. MR, CT, andangiographic data were reviewed to determine general imagingcharacteristics, and specifically record how often intracanalicularIAC extension, bony changes, and brain edemaoccurred.RESULTSTwenty-six patients with CPA meningioma were identified.There were18 female and 8 male patients. Patient age rangedfrom 41 to 84 years, mean of 58 years. A variety of cranialnerves was affected in 19/26 cases, including V, VI, VII,VIII, IX, and X. Isolated ipsilateral SNHL was less commonoccurring in 7/26 cases. All masses were ovoid, isointense togray matter signal on T1- and T2-weighted images withstrong homogeneous enhancement and a centrifugal growthpattern. The vast majority 23/26 had a dural tail. Bonychanges were variable on the available CT studies, withhyperostosis noted in 5/9 cases. Edema was an uncommonfinding, noted in only 4/26 cases, whereas intracanalicularIAC extension occurred in 14/26 cases. Of the 17 patientswho underwent surgery, 8/17 had residual or recurrent tumornoted on follow-up imaging.CONCLUSIONCPA meningiomas most commonly present with complexcranial neuropathies with isolated SNHL as a less commonfeature. Differentiating imaging features of CPA meningiomasinclude centrifugal growth pattern and dural tails aswell as hyperostosis. Given their unique location, morbidityis increased with multiple cranial nerves at risk and residualor recurrent disease is not uncommon. Intracanalicular IACextension is a common finding. The combination of a complexclinical presentation mixed with radiologic appearanceof a dural-based enhancing mass with IAC extension, duraltails, and hyperostosis, makes accurate preoperative diagnosisof CPA meningioma possible.REFERENCES1. Voss NF, Vrionis FD, Heilman CB, Robertson JH.Meningiomas of the Cerebellopontine Angle. Surg Neurol2000 May;53:439-4462. Mallucci CL, Ward V, Carney AS, O’Donoghue GM, RobertsonI. Clinical Features and Outcomes in Patients with Non-Acoustic Cerebellopontine Angle Tumors. J NeurolNeurosurg Psychiatry 1999;66:768-7713. Smirniotopoulos JG, Yue NC, Ruching EJ. CerebellopontineAngle Masses: Radiologic-Pathologic Correlation.Radiographics 1993;13:1131-1147KEY WORDS: Cerebellopontine angle, meningioma, MRimagingMonday
MondayMonday Afternoon3:00 PM - 4:30 PMBallroom 6 A(12b) Adult Brain: CerebrovascularDisease and Stroke(Scientific Papers 59 - 69)See also Parallel Sessions(12a) Adult Brain: Neoplasms(12c) Head & Neck: General(12d) Pediatrics: General and Developmental andCongenital DisordersModerators:William T.C. Yuh, MD, MSEERobert D. Zimmerman, MDPaper 59 Starting at 3:00 PM, Ending at 3:08 PMImprovement in Angiographic Vasospasm with a 20-HETE Enzyme Inhibitor in a Subarachnoid HemorrhageDog ModelHacein-Bey, L. · Harder, D. R. · Meier, H. T. · Lauer, K. K.· Roman, R. J.Medical College of WisconsinMilwaukee, WIPURPOSEArachidonic acid derivatives, primarily 20-hydroxyeiscosatetraenoicacid (20-HETE), are potent vasoconstrictormetabolites produced in the cerebral circulation, which contributesignificantly to subarachnoid hemorrhage (SAH)-induced vasospasm. 20-HETE is produced by enzymes ofthe CYP4A family that are expressed in the vascular smoothmuscle of cerebral arteries. The effect on vasospasm of anew 20-HETE enzyme inhibitor, TS-011 (N-(3-Chloro-4-morpholin-4-yl)-phenyl-N’-hydroxyimidoformamide), wasevaluated in a dog SAH model.MATERIALS & METHODSSubarachnoid hemorrhage was induced in 26 adult beagledogs, weighing 9-12 kgs, by cisterna magna injection ofautologous blood (0.5 ml/kg) on days #1 and #4.Angiography of the vertebrobasilar system was performedand venous blood and cerebrospinal fluid were collected ondays #1, #4, and #7. Twelve dogs were used as controls. In 9dogs, TS-011 was administered intravenously (1 mg/kg bid)starting on day #1 or day #4 through day #7. Five dogsreceived TS-011 on day #7 at the time that delayedvasospasm was documented, and then an additionalangiogram was obtained 1 hour later. Angiographic imageswere obtained with the consistent inclusion of an external46caliper of known size, transferred digitally onto a computerprogram (Adobe Photoshop®), cropped to standardize magnification,and measurements of basilar artery diameters(BAD) were made at its mid-level to assess the degree ofvasospasm.RESULTSVasospasm was induced consistently in all dogs using thedouble cisterna magna injection method. Vasospasm wasassessed as DBAD = change in basilar artery diameter relativeto baseline BAD. In 12 control animals, vasospasm wassignificant at day #4 (DBAD 25%; range 14-35%) andsevere at day #7 (DBAD 54%; range 32-90%). All but one ofthe TS-011-treated dogs showed significant vasospasm atday #4 (DBAD 31%; range 5-52%), and in all 14 but one ofTS-011-treated dogs, angiographic vasospasm at day #7(DBAD 24%; range 5-64%)was reduced by 50% relative tothat seen in the control dogs. There was also significantreversal in the degree of vasospasm within 1 hour in the controldogs who received a bolus of TS-011at day #7.CONCLUSIONAs there is evidence of enhanced turnover of fatty acids andincreased formation of 20-HETE and other vasoconstrictormetabolites of arachidonic acid following SAH, as well asevidence that vasoconstrictor peptides (endothelin,angiotensin II, 5 HT) in turn stimulate 20-HETE formationin vascular smooth muscle, it is expected that blockade of20-HETE synthesis will provide some degree of neuroprotection.In this study, experimental inhibition of 20-HETEappears to result in significant angiographic improvement ofSAH-induced vasospasm in this dog model. The earlier 20-HETE blockade following the onset of SAH, the greater theangiographic improvement. 20-HETE enzyme inhibitorsalso appear to improve angiographic vasospasm on day #7 inthe double injection model.KEY WORDS: Arachidonic acid, subarachnoid hemorrhage,vasospasmThe authors of this work have indicated the following affiliations/disclosures:Taisho Pharmaceutical Co., Ltd.:Sponsoring research study.Paper 60 Starting at 3:08 PM, Ending at 3:16 PMImaging of Microvascularity during Acute IschemicStroke with and without Intravascular Contrast Agenton High Resolution Ultrahigh Field MR Imaging in aRodent Model with Histopathologic CorrelationChristoforidis, G. A. · Yang, M. · Mohammad, Y. ·Abduljalil, A. · Heverhagen, J. T. · Chakeres, D. W. · Knopp,M. V.The Ohio State UniversityColumbus, OHPURPOSETo assess microvascularity during acute ischemic stroke in amiddle cerebral artery occlusion (MCAO) rodent modelusing high resolution, ultrahigh field MR imaging with andwithout intravenous administration of an intravascular contrastagent.
MATERIALS & METHODSHigh resolution, ultrahigh field (UHF) 8 T MR imaging andultrasmall particle iron oxide (USPIO) intravascular contrastagent, (SHU555C, Supravist, Schering AG, Berlin) dosagewere optimized to define microvascularity in 12 normal maleWistar rats. Ten male Wistar rats underwent 2-hour transientintraluminal filament MCAO while controlling physiologicparameters. They were imaged at 8 T on a Bruker AVANCE(Bruker, Billerica, MA) interfaced with Techron (CrownInternational, Elkhart, IN) gradient amplifiers and Manexgradients (Magnex Scientific, Abingdon, England) using acustom-built radio frequency front end. A custom made 4 cmdiameter birdcage coil was tuned to the head of the rat at 340MHz while the rat was in the prone position. Imaging includeda gradient-recalled echo (GRE) sequence (TR/TE 700/16msec, flip angle 45 o , NEX = 2, 512 x 512 matrix and 78 m min-plane resolution) and was acquired 2 and 24 hours postocclusionbefore and after USPIO (2 mg Fe/kg) administration.The rodents were sacrificed after the second imagingsession and their brains removed and placed in 2, 3, 5-triphenyltetrazoliumchloride (TTC). The brain specimens thenwere placed in a matrix and sectioned at 1 mm intervals. Foreach image including the area of infarction the number ofcortical penetrating vessels and the number of deep graynuclei perforators that could be identified before and aftercontrast enhancement were calculated separately for theinfarcted and noninfarcted hemispheres. These values thenwere compared. Statistical significance was calculated usingstudent t-test. TTC stained specimens were compared to 8 Timages in order to identify whether the area of infarction correspondedto any changes in microvascularity on the 8 Timages.RESULTSMicrovasculature on the side of the infarction was more conspicuousthan the unaffected side in all rats imaged at 2hours. Table 1 indicates that microvascular conspicuity relativeto the unaffected side was highest at 2 hours postocclusionand was significant both before and after contrastadministration. At 24 hours the difference between theaffected and the nonaffected side is less dramatic. USPIOcontrast agent significantly increased microvascular conspicuitywhen administed.Areas of increased microvascularity corresponded with thearea of infarction identified on TTC stained specimens.Number of microvessels identified in the ischemichemisphere and normal hemisphereNumber of vessels identified (mean standard error)2hours 2 hours 24 hours 24 hourswithout USPIO with USPIO without USPIO with USPIONormal side 1.3 (0.6) 8.3 (1.3) 3.6 (0.7) 9.4 (0.8)Ischemic side 7.9 (1.9) 11.8 (1.5) 4.4 (1.5) 10.8 (1.3)p-value 0.0041 0.0033 0.5423 0.2048CONCLUSIONMicrovascularity appears to increase during hyperacuteMCA occlusion and normalize after reperfusion. Ultrasmallparticle iron oxide contrast agent does not appear to make asubstantial impact on this particular observation but doesincrease microvascular conspicuity when imaging with GREhigh resolution MR imaging at 8 T field strength.KEY WORDS: Stroke, high field MR imaging, iron oxide47Paper 61 Starting at 3:16 PM, Ending at 3:24 PMMeasurement of Cerebrovascular Reserve Capacity byContrast Perfusion CT, Dynamic SusceptibilityPerfusion-Weighted MR Imaging and Positron EmissionTomography in Chronic Carotid Stenotic DiseaseDonnerstag, F. G. F. · Bisdas, S. · Berding, G. · Witt, M. ·Weissenborn, K. · Becker, H.Hannover Medical SchoolHannover, GERMANYPURPOSEEvaluate in patients with chronic carotid stenotic disease thedegree of correlation in measurements of cerebral blood flowand cerebrovascular reserve capacity between differentmethods: contrast perfusion CT, dynamic susceptibility perfusion-weightedMR imaging (PWI MR) and positron emissiontomography (PET).MATERIALS & METHODSNine patients, 3 with unilateral (left, 75%) and 6 withbilateral ( 75%, contralateral < 75%) internal carotid arterystenosis underwent perfusion CT, PWI MR and PET studiesat rest and after acetazolamide challenge. CT CBF mapsresulted from a deconvolution of the parenchymal time-concentrationcurves by a reference arterial curve. MR imagingCBF maps were calculated by deconvolution of the tissuesusceptibility time curve with an arterial input function. PETwas performed after bolus injection of 3.7 GBq [ 15 O]H 2 Owith simultaneous arterial blood sampling. PET CBF mapswere constructed using multilinear least-squares minimizationprocedure based on the one-compartment model (1).Cerebrovascular reserve capacity was determined by the differencein CBF before and after acetazolamide challenge. Incorresponding transaxial tomograms CBF values wereextracted using standardized regions of interest. Statisticalanalysis was performed using linear regression analysis andpaired t-tests for matched variables.RESULTSCerebral blood flow values measured by CT and MR imagingbefore acetazolamide challenge were correlated for bothhemispheres (r= 0.37, P < .05, right hemisphere; r = 0.46, P< .01, left hemisphere). Cerebral blood flow values measuredby PWI MR and PET were positively correlated forboth hemispheres (right: r = 0.72, P < .0001; left: r = 0.62, P< .0001). Perfusion-weighted MR CBF values in basal gangliaand middle cerebral artery territory correlated at highestdegree (r = 0.76, P = .01, r = 0.96, P = .0001, respectively)with those measured by PET. A correlation between perfusionCT and PET was noted only on the right hemisphere (r= 0.35, P < .05). The increase in CBF after acetazolamidechallenge in perfusion CT was 13.8 ± 16.3 (median, 9.02)ml/min 100 g, in PWI MR 7.9 ± 21 (median, 5.52)ml/min100 g, and in PET 9.5 ± 10.6 (median, 10.1) ml/min 100 g;nevertheless, a significant difference between methods wasnot observed.Monday
MondayCONCLUSIONCerebral blood flow values measured by perfusion CT andperfusion-weighted MR imaging in patients with high-gradeinternal carotid artery stenosis before and after acetazolamidechallenge were correlated significantly. More distinctcorrelation was detected between PW MRI and PET imaging,confirming in this way recent work (2). Perfusion CTand PWI MR can provide measurements of vascular reservecapacity for patients with chronic carotid stenosis comparableto PET. Additionally, larger studies are required to furthersubstantiate that vascular reserve capacity measurements byperfusion CT, PWI MR are as reliable as those obtained withPET.REFERENCES1. Van den Hoff J, Burchert W, Müller-Schauenburg W, Meyer GJ,Hundeshagen H. Accurate Local Blood Flow Measurementwith Dynamic PET: Fast Determination of Input FunctionDelay and Dispersion by Multilinear Minimization. J NuclMed 1993;34:1770-17772. Mukherjee P, Kang HC, Videen TO, McKinstry RC, PowersWJ, Derdeyen CP. Measurement of Cerebral Blood Flow inChronic Carotid Occlusive Disease: Comparison ofDynamic Susceptibility Contrast Perfusion MR Imagingwith Positron Emission Tomography. AJNR Am JNeuroradiol 2003;24:862-871KEY WORDS: Brain perfusion, correlation, CT, MR, PETPaper 62 Starting at 3:24 PM, Ending at 3:32 PMRelationship between Reduced Apparent DiffusionCoefficient Values, Perfusion Deficits, and MetabolicChanges in Acute and Hyperacute Ischemic StrokeStengel, A. · Neumann-Haefelin, T. · Singer, O. · Zanella, F.· Lanfermann, H. · Pilatus, U.Johann Wolfgang Goethe UniversityFrankfurt am Main, GERMANYPURPOSEAcute stroke is characterized by a reduction of the apparentdiffusion coefficient (ADC) values, often a perfusion deficitand a diffusion-weighted/perfusion-weighted imaging(DWI/PWI) mismatch. Recent studies indicate that parts ofthe DWI/PWI mismatch and the DWI lesion may still beviable in the acute and hyperacute phase of stroke. In thepast, only few studies have investigated the potential ofspectroscopy (SVS, CSI) as an additional tool for better differentiationof reversibly and irreversibly damaged tissue,mainly due to the long time required for data acquisition. Inthis study, multiple spin-echo spectroscopic imaging (MSE-SI or TSI) (1) could be performed in approximately 6 minutesproviding spectroscopic images with a spectral resolutionsufficient for absolute quantification of lactate (Lac) andN-acetylaspartate (NAA).48MATERIALS & METHODSTen acute and hyperacute stroke patients were examinedwithin 24 hours of symptom onset. The MR examinationswere performed on a 1.5 T Philips Gyroscan Intera scannerincluding DWI, MSE-SI (acquisition of four spin-echoes atmultiples of 144 ms) and PWI. For an accurate detection ofLac, the lipid signals from the skull were suppressed usingvolume preselection by PRESS and multiple-slice outer volumesuppression. Spectra quantification was performed bypeak integration using the csx2 software (courtesy of PBBarker, JHU Baltimore, MA). Absolute concentrations weredetermined using the phantom replacement method adaptedto the acquisition of multiple spin-echoes.The spectroscopicquantification method was validated in vitro for Lac andNAA and in vivo for NAA (2). For coregistration of MRimages (ADC, PWI) with MSE SI three adjacent slices withreduced matrix size were added.RESULTSIn 9/10 acute stroke patients we found metabolic changes(increased Lac and normal or decreased NAA) extendingbeyond the borders of the ADC lesion (3). The only patientwithout Lac outside the ADC lesion had no DWI/PWI mismatch.Perfusion-weighted imaging data from 5 acute strokepatients could be analyzed in terms of rCBF (Stroke Tool, HJWittsack). Figure 1 shows the maximum Lac concentrationinside and outside the ADC lesion plotted vs the respectivechange of rCBF (in % compared to contralateral). MaximumLac of 18 mmol/l was observed at a decrease of rCBF to22%.Figure. rCBF plotted vs maximum Lac.CONCLUSIONSpectroscopic imaging can be used as an additional tool forassessment of tissue damage in acute stroke. Lac is correlatedwith the perfusion deficit.REFERENCES1. Duyn JH, Moonen CT. Fast Proton Spectroscopic Imaging ofHuman Brain Using Multiple Spin-Echoes. Magn Reson Med1993;30:409-4142. Stengel A, et al. Turbo Spectroscopic Imaging in AcuteStroke: Preliminary Results. Proc ISMRM Toronto 2003;22513. Stengel A, et al. Mismatch between Lactate and ADCChanges in Acute Stroke. Proc ESMRMB Rotterdam,MAGMA 2003;16 (Suppl.1): 167-168KEY WORDS: Acute stroke, spectroscopic imaging, lactate
Paper 63 Starting at 3:32 PM, Ending at 3:40 PMHemorrhagic Transformation after IntraarterialThrombolysis: Clinical Utility of Pretreatment CTPerfusionSchaefer, P. W. · Ledezma, C. J. · Roccatagliata, L. ·Schwamm, L. M. · Gonzalez, G. R. · Lev, M. H.Massachusetts General HospitalBoston, MA49MondayPURPOSEHemorrhagic transformation (HT) is a major complication ofthrombolytic treatment for acute ischemic stroke. Our purposewas to assess the clinical utility of CT perfusion in differentiatinginfarctions that will undergo hemorrhagic transformationfrom those that will not in patients treated withintraarterial thrombolysis.MATERIALS & METHODSQuantitative CT perfusion images were obtained in 8patients with proximal MCA emboli who presented within 6hours of stroke onset and who were treated successfully withintraarterial thrombolysis. Follow-up CT or T2-weightedMR images were obtained at 1 to 8 days. Five of 8 MCAinfarctions had hemorrhagic transformation. Regions ofinterest (ROIs) were drawn around the whole region of lowCBF on each slice in each patient and were copied onto theCBV maps. The cerebral blood flow and cerebral blood volumefor each pixel within the ROIs were calculated.Subsequently, the percentage of pixels with a CBF of lessthan 2 ml/100 gm/min and the percentage of pixels with aCBV of less than 1 ml/100 gm were calculated.RESULTSA significantly greater percentage of pixels possessed lowerCBFs (less than 2 ml/100 gm/min) in HT lesions comparedwith non HT lesions (23% vs 8%, p < 0.001). All 5 patientswith HT had a higher number of voxels with CBF less than2 ml/100 gm/min compared to the 3 patients without HT. Asignificantly greater percentage of pixels possessed lowerCBVs (less than 1 ml/100 gm) in HT lesions compared withnon HT lesions (37% vs 27%, p < 0.001). Four of 5 patientswith HT had a higher number of voxels with CBV less than1 ml/100 gm compared to 2/3 patients without HT.CONCLUSIONAcute infarctions that undergo hemorrhagic transformationhave a significantly higher percentage of pixels with lowCBFs and CBVs. Cerebral blood flow and CBV values maybe useful in differentiating ischemic tissue likely to hemorrhagefrom ischemic tissue that is not likely to hemorrhage,and may be important in differentiating patients likely tobenefit from intraarterial thrombolysis from those who arenot.KEY WORDS: CT perfusion, hemorrhagic transformation,acute strokePaper 64 Starting at 3:40 PM, Ending at 3:48 PMUsefulness of Diffusion- and Perfusion-Weighted MRImaging for Prediction of Hemorrhagic TransformationFollowing Acute StrokeKim, S. · Kim, H. · Lee, J. · Lee, D. · Suh, D. · Choi, C. ·Lee, H.Asan Medical Center, University of UlsanSeoul, REPUBLIC OF KOREAPURPOSEWe intended to evaluate the usefulness of diffusion- and perfusion-weightedMR imaging in acute stroke for predictionof subsequent hemorrhagic transformation.MATERIALS & METHODSForty patients of acute stroke with subsequent hemorrhagictransformation were included. For comparison, we randomlyselected a nonhematoma group which consisted of 48patients with acute territorial infarction. MR imaging wasperformed in hyperacute stage and within 7 days after symptomonset. Our imaging protocol included T2-, diffusion-,perfusion-weighted images, gradient-echo images and MRangiography. Patients with hematomas were categorized intolarge (n = 18) and small hematoma group (n = 22); the inclusioncriterion for large group was the presence of mass effectof the hematoma. Infarct volume and relative apparent diffusioncoefficient (rADC) value of the infarct were measuredby using diffusion weighted images (DWI) and comparedamong the two hematoma groups and nonhematoma group.Perfusion-weighted MR was obtained in 22 patients ofhematoma groups and 32 patients of nonhematoma groupand relative cerebral blood volume (rCBV) and relative cerebralblood flow (rCVF) were compared among the threegroups.
MondayRESULTSInfarct volume in large, small, and nonhematoma groups was72.1 ± 49.5, 40.8 ± 25.2, 20.2 ± 28.2 cc, respectively. Thedifference was significant among the three groups (ANOVA,p < 0.05), but not significant between small and nonhematomagroups (Bonferroni post hoc, p > 0.05). Relativeapparent diffusion coefficient value was 59.1 ± 10.1, 66.8 ±11.5, 72.7 ± 14.8 %, respectively and the difference was significantbetween large and nonhematoma groups (Bonferronipost hoc, p < 0.05), but not significant between large andsmall and small and nonhematoma groups (p > 0.05).Relative cerebral blood volume in large, small and nonhematomagroups was 26.2 ± 11.1, 44.6 ± 24.5, and 48.3 ±18.8 %, respectively and rCBF was 19.7 ± 8.0, 37.5 ± 19.1,and 41.2 ± 19.5 %, respectively. The difference of rCBV andrCBF value between large and small hematoma groups werenot significant, but it was significant between large and nonhematomagroups (ANOVA, Bonferroni post hoc, p < 0.05).CONCLUSIONThe large hemorrhagic transformation group had largerinfarct volume, lower rADC value, and lower rCBV andrCBF values on initial DWI or perfusion-weighted imagescompared to small or nonhematoma groups. Our conclusionis diffusion- and perfusion-weighted images may be usefulin predicting hemorrhagic transformation in acute infarctionpatients.KEY WORDS: MR imaging, strokePaper 65 Starting at 3:48 PM, Ending at 3:56 PMMeasurement of Cerebral Hemodynamics with DynamicPerfusion CT: Comparison with Pre andPostacetazolamide [15O]H2O Positron EmissionTomography in Patients with Carotid Artery StenosisBisdas, S. · Donnerstag, F. · Berding, G.Hannover Medical SchoolHannover, GERMANYPURPOSEOur purpose was to evaluate the accuracy of cerebral bloodflow (CBF) measurements obtained by using dynamic perfusionCT, including the effect of arterial input function (AIF)selection, compared with those obtained by positron emissiontomography (PET) in patients with internal carotidartery (ICA) stenosis before and after acetazolamide challenge.50MATERIALS & METHODSTwelve patients with ICA stenosis underwent dynamic perfusionCT and PET studies at rest and after acetazolamidechallenge. Cerebral blood flow values on perfusion CTresulted from a deconvolution of parenchymal time-concentrationcurves by a reference arterial curve. The region ofinterest (ROI) that provided the AIF was placed in the largerof the two anterior cerebral arteries; the venous outflowfunction ROI was selected automatically by the perfusionsoftware. The same protocol was followed placing the AIFROI in each A. choroidea anterior, which originates directlyfrom ICA, and was identified in the lower level of thescanned section in 9 patients, who subsequently were classifiedinto two groups. Group A included 4 patients with unilateral(right = 75%) and group B 5 patients with bilateral (>75%, contralateral < 75%) ICA stenosis. Cerebral blood flowwas measured by [ 15 O]H 2 O PET using multilinear leastsquaresminimization procedure based on the one compartmentmodel. In corresponding transaxial tomograms CBFvalues were extracted using standardized ROIs. Statisticalanalysis was performed using linear regression analysis andpaired t tests for matched variables.RESULTSArterial input function in anterior cerebral artery in perfusionCT delivered in all patients CBF values that were correlatedpositively with those measured by PET before and afteracetazolamide challenge (Table 1). In group A, AIF in anteriorchoroidal artery ipsilateral as well as contralateral to thestenotic ICA delivered CBF values significantly correlatedwith those obtained by PET. Nevertheless, a more distinctcorrelation was observed with AIF ipsilateral to the stenoticICA. In group B, the choice of AIF ipsilateral or contralateralto the stenotic ICA made statistically significant difference(P < .01) between CT and PET CBF values before and afteracetazolamide challenge (Table 1). Furthermore, the choiceof AIF ipsilateral to the more affected ICA delivered inpatients of group B CBF values significantly correlated withthose measured by PET (Table 1).Table 1. Correlation of CBF values measured by perfusionCT and PET, including AIF selectionAIF in anterior AIF in right anterior AIF in left anteriorcerebral artery choroidal artery choroidal arteryBefore After Before After Before Afterchallenge challenge challenge challenge challenge challengeGroup A (right r=0.6 r=0.5 r=0.7 r=0.6 r=0.4 r=0.5ICA stenosis) n=4 P
Paper 66 Starting at 3:56 PM, Ending at 4:04 PMEvaluation of 20-Hydroxyeiscosatetraenoic Acid Levelsin Normal and Abnormal Blood and Cerebral SpinalFluidHacein-Bey, L. · Roman, R. J. · Lemke, D. M. · Lauer, K. K.· Varelas, P. N. · Torbey, M. T. · Cusick, J. F. · Harder, D. R.Medical College of WisconsinMilwaukee, WIPURPOSEThe role of vasoconstrictors in stroke and vasospasm isbeing investigated increasingly. There is evidence ofenhanced turnover of fatty acids and increased formation ofvasoconstrictor metabolites of arachidonic acid (AA) followingstroke and intracranial hemorrhage. 20-hydroxyeiscosatetraenoicacid (20-HETE) is the primary vasoconstrictormetabolite of AA produced in the cerebral circulation.20-HETE is produced by enzymes of the CYP4A familyexpressed in vascular smooth muscle arteries. The mechanismof action of 20-HETE is via activation of protein kinaseC and depolarization of vascular smooth muscle cells, resultingin inhibition of large conductance Ca 2+ channel sensitiveK Ca channels. 20-HETE also increases Ca 2+ influx byincreasing the activity of L-type Ca 2+ channels in the cerebralvasculature and plays a critical role in cerebral autoregulationin the rat. Vasoconstrictor peptides (endothelin,angiotensin II, and serotonin) stimulate 20-HETE formationin vascular smooth muscle and 20-HETE potentiates vasoconstrictorresponse to these agents. There is recent evidencethat inhibition of the synthesis of 20-HETE reduces the acutefall in CBF following subarachnoid hemorrhage (SAH) andreduce infarct size following ischemia and reperfusion in thebrains of rats.We sought to 1) identify 20 HETE levels in theblood and CSF of normal human subjects and patients withischemic stroke and subarachnoid hemorrhage; 2) determinethe degree of 20-HETE level elevation in stroke and SAH.MATERIALS & METHODSBlood and CSF samples were obtained from patients withsubarachnoid hemorrhage (SAH) (n = 10), ischemic stroke(n = 10) and normal subjects (n = 10). Normal controls werepatients without neurologic conditions admitted for minorabdominal surgery under spinal analgesia. In stroke patients,CSF was collected only after ruling out intracranial massesand herniation. In SAH patients, CSF was collected fromventricular or lumbar drains. Clinical data prospectively collectedincluded neurologic condition upon admission(Rankin score, Hunt & Hess score), infarct and hemorrhagesize, comorbidities, and TCD and angiographic data. 20-HETE levels were measured using LC/MS/MS assays.RESULTSIn 12 control patients, the concentrations of 20-HETE in theCSF were below the minimal detectable level, < 20 pg/ml.Normal levels of 20-HETE in the plasma were 275 pg/ml,(range 184-425). In SAH patients, marked elevations in CSF20-HETE levels were found with a mean level of 146 pg/ml(range 20-331). There was a trend toward a correlationbetween elevated 20-HETE levels and severity of vasospasmassessed by TCD and angiography. In stroke patients, 20-HETE levels, both in blood and CSF, were not significantlydifferent from those of normal controls.51CONCLUSION20-HETE levels can be measured accurately in normal subjects,and stroke and SAH patients. 20-HETE levels aremarkedly elevated in the CSF of patients with SAH, and maybe commensurate to the degree of vasospasm present inthese patients. In stroke patients, no significant increase in20-HETE levels, in either the blood or CSF, could be identifiedas compared to normal subjects.KEY WORDS: Arachidonic acid, stroke, subarachnoid hemorrhageThe authors of this work have indicated the following affiliations/disclosures:Taisho Pharmaceutical Co., Ltd.:Sponsoring research study.Paper 67 Starting at 4:04 PM, Ending at 4:12 PMIntrathecal Steroid Ameliorates Infarction Volume inFocal Cerebral Ischemia in RatsGoericke, S. L. 1 · Engelhorn, T. 1 · Speck, U. 2 · Becker, W. P. 1· Forsting, M. 1 · Doerfler, A. 11University of Essen Medical School, Essen, GERMANY,2Humboldt University of Berlin, Berlin, GERMANYPURPOSEThe aim of our study was to evaluate the neuroprotectiveefficacy of intrathecally administered triamcinolonacetonide(TCA) on infarction volume in acute focal cerebral ischemiain rats.MATERIALS & METHODSFocal cerebral ischemia was induced in 102 Wistar rats usingan endovascular occlusion technique of the middle cerebralartery (MCAO). In a first dose-finding study, different dosesof TCA (0.3, 0.03, 0.012, 0.006, or 0.003 mg/kg bodyweight)were administered into the cisterna magna of 12 rats each 30minutes after MCAO. Twelve animals received equivolumetricsaline intrathecally. In a second MR-controlled confirmationstudy, the neuroprotective efficacy of the mosteffective dose was compared to controls in 15 rats each.Infarction volume was calculated 24 hours after MCAO byTTCstaining in all animals.RESULTSExperiment 1: Compared to controls (18.2 ± 5.0%), infarctionvolume was significantly reduced using TCA at a doseof 0.012 mg/kg (13.4 ± 5.3%, p = 0.04). TCA 0.03 mg/kg(17.7 ± 6.9%, p = 0.84), 0.006 mg/kg (15.9 ± 4.2%, p =0.24), and 0.003 mg/kg (14.5 ± 5.2%, p = 0.11) did notreduce infarction size significantly, whereas TCA 0.3 mg/kgresulted in bilateral infarction with increased infarction volume(19.8 ± 5.0%, p = 0.49). Experiment 2: MR imaging(diffusion-weighted images, T1-weighted images) confirmedsuccessful MCAO and intrathecal administration inall animals. Compared to controls (20.0 ± 8.0%) infarctionvolume was reduced significantly in animals treated withTCA 0.012 mg/kg (13.4 ± 6.5%, p = 0.02).Monday
MondayCONCLUSIONIntrathecally administered steroid triamcinolonacetonidemay reduce infarction volume significantly in permanentfocal cerebral ischemia in rats. Further studies, focusing onlong-term effects and clinical outcome, are necessary toassess the therapeutic value.KEY WORDS: Cerebral infarction, glucocorticoids, neuroprotectionPaper 68 Starting at 4:12 PM, Ending at 4:20 PMMiddle Cerebral Artery Infarction: Relationship ofCavernous Carotid Artery CalcificationBabiarz, L. S. 1 · Yousem, D. M. 1 · Bilker, W. 2 · Wasserman,B. A. 11Johns Hopkins Hospital, Baltimore, MD, 2 University ofPennsylvania School of Medicine, Philadelphia, PAPURPOSEThis study was designed to determine whether calcificationof the cavernous carotid artery could be as predictive of cerebrovascularevents as coronary artery calcification scoring isindicative of myocardial infarctions. In our retrospectiveanalysis we sought to correlate grade of cavernous carotidartery calcification with middle cerebral artery (MCA) distributionsinfarctions.MATERIALS & METHODSThe unenhanced brain CT scans of 40 MCA distributionstroke patients, 34 non-MCA distribution stroke patients,and 94 age-matched nonstroke control patients werereviewed. The degree of circumferential calcification andthickness of calcification were graded for the cavernouscarotid arteries on the bases of CT bone window findings.Scores were determined for the left and right cavernouscarotid artery for the patients with infarctions and for thecontrol subjects only the higher of the two scores wasrecorded with no designation of the side. Two-sample t testsand Fisher’s exact tests were used to detect differencesbetween all stroke cases and all controls, MCA stroke casesand non-MCA stroke, MCA stroke cases and controls, non-MCA stroke cases and controls, and side of higher calcificationand side of stroke.RESULTSThere were no statistically significant differences betweenthe cavernous carotid artery calcification scores of the variousgroups that were compared. In addition, the results werenot affected by the manner in which calcification wasscored; the circumferential involvement, thickness of calcium,or the aggregate of the two yielded no significant differencebetween the groups analyzed herein.CONCLUSIONThere was no correlation between the circumferential degreeor thickness of cavernous artery calcification and the presenceof MCA and/or non-MCA infarction or noninfarction.The cavernous carotid artery calcification score is not differentbetween patients with strokes and without strokes.KEY WORDS: Middle cerebral artery infarction, cavernouscarotid artery, calcification52Paper 69 Starting at 4:20 PM, Ending at 4:28 PMVirchow Robin Space Dilatation Is a Sensitive Indicatorof Microvascular Disease: A Study in Elderly Patientswith Depression and DementiaPatankar, T. A. F. · Baldwin, R. · Varma, A. · Jeffries, S. ·Neary, D. · Burns, A. · Jackson, A.Imaging Science and Biomedical EngineeringManchester, UNITED KINGDOMPURPOSEOur aim was to test the hypothesis that dilation of VirchowRobin spaces (VRS) can act as a surrogate marker formicrovascular disease and is associated with subcortical vasculardementia and with treatment resistance in elderlydepressed individuals.MATERIALS & METHODSFifty patients with late-onset major depressive disorder (29who were responders to antidepressant monotherapy (Res)and 21 who were nonresponders (NRes), 75 consecutivepatients with dementia (vascular dementia (VaD; n = 24),Alzheimer’s disease (AD; n = 35) and frontotemporaldementia (FTD; n = 16) and 35 normal volunteers (Norm)were recruited. Imaging included: 1) fluid attenuated inversionrecovery (FLAIR); 2) T1-weighted inversion recovery(IR) and 3) variable echo, fast spin-echo (VE) images.Assessment of deep white matter and periventricular hyperintensitieswas performed on matched IR and FLAIR images(1, 2). Virchow Robin spaces were scored separately in thecentrum semiovale, mesencephalon and the subinsularregion. Virchow Robin spaces in the basal ganglia werescored using two separate scoring schemes, the first of thesereflects the anatomical distribution of basal ganglia VRS(BG1) and the second reflects both the distribution and number(BG2). Statistical analysis was performed to identify differencesbetween groups, diagnostic specificity, and relativediagnostic power.RESULTSThe BG2 score was significantly different between the Res,NRes, and normal groups (p < 0.001). Pairwise a posterioricomparisons demonstrated significantly higher values in theNRes than in the Res (p < 0.01) or normal volunteer groups(p < 0.001). In a multiple regression analysis BG2 VRSscore accounted for 38% of the variance in the regressionmodel and Schelten’s PVH score acted as an independentpredictive factor accounting for an additional 6%. In thedementia group (AD, FTD, VaD, Norm) Schelten’s PVH,basal ganglia hyperintensity and overall score were significantlygreater in patients with VaD than in AD or normals (p< 0.01). The basal ganglia scores BG1 and BG2 were significantlyhigher in vascular dementia than in normal volunteers(p < 0.005 and p < 0.001 respectively), patients withAD (p < 0.001) or patients with FTD (p < 0.01). Centrumsemiovale VRS were significantly more frequent in patientswith FTD than in normals (p < 0.01). Multiple regressionanalysis in the dementia group showed that the BG2 VRSscore acted as an independent predictive factor accountingfor 29% of the variance in the regression model, the centrumsemiovale VRS score accounted for a further 9% and theSchelten`s PVH score accounted for only 2%.
53CONCLUSIONOur studies show that scores of VRS dilatation in diseaseswith cerebral microvascular abnormalities have diagnosticspecificity which is more specific than that provided by thedistribution and nature of T2-weighted abnormalities.REFERENCES1. Scheltens P, et al. A Semiquantative Rating Scale for theAssessment of Signal Hyperintensities on MagneticResonance Imaging. J Neurol Sci 1993;114(1):7-122. Barkhof F, Scheltens P. Imaging of White Matter Lesions.Cerebrovasc Dis 2002;13 Suppl 2:21-30KEY WORDS: Virchow Robin spaces, dementia, depressionMonday Afternoon3:00 PM - 4:30 PMRoom 606 - 609(12c) Head & Neck: General(Scientific Papers 70 - 80)See also Parallel Sessions(12a) Adult Brain: Neoplasms(12b) Adult Brain: Cerebrovascular Disease andStroke(12d) Pediatrics: General and Developmental andCongenital DisordersModerators:Laurie A. Loevner, MDSuresh K. Mukherji, MDPaper 70 Starting at 3:00 PM, Ending at 3:08 PMCT-Guided Aspirations: The First 200 AssessmentsSherman, P. M. 1 · Yousem, D. M. 1 · Loevner, L. A. 21Johns Hopkins Hospital, Baltimore, MD, 2 University ofPennsylvania Medical Center, Philadelphia, PAPURPOSETo determine the reliability of CT-guided aspiration over anexperience of 216 consecutive cases performed.MATERIALS & METHODSThe histopathologic findings and CT-guided procedure notesfrom 216 consecutive head and neck fine needle aspirations(FNAs) performed by one radiologist from 1993 to 2003were reviewed retrospectively. The types of needles used,number of passes required, location of the lesion, initialcytologic diagnosis, and final histopathologic diagnosis orfinal clinical diagnosis were reviewed retrospectively.RESULTSA diagnostic sample was obtained in 195/216 (90.3%) of thelesions with 21 (9.7%) inadequate samples. A correct diagnosiswas made in 191/216 cases (88.4%). Inaccurate samplesin which the final diagnosis was discordant with the fineneedle aspiration were present in 4/216 (1.9%) of the specimens,with the parapharyngeal space and parotid gland havingthe highest rate. The range in number of passes requiredto make a final diagnosis was one to six, with a mean of 2.6passes per specimen (SD 1.13) and a median of 2.0.Accuracy of CT-guided FNADiagnosis PPS Thyroid Parotid Paraspinal Other TotalCorrect 23 (85%) 49 (92%) 29 (81%) 25 (100%) 65 (87%) 191Non-DX 3 (11%) 4 (8%) 6 (17%) 0 8 (11%) 21Wrong DX 1 (4%) 0 1 (2%) 0 2 (2%) 4Total 27 53 36 25 75 216CONCLUSIONCT-guided FNA is a safe, well-tolerated, and accurate tool indiagnosis of head and neck lesions. Our series demonstratesan improvement in the percent of diagnostic samplesobtained when compared with prior reports and an overalllow diagnostic error rate, possibly related to on-site evaluationby the cytopathologist and improved FNA technique.KEY WORDS: Fine needle aspiration, CT guidance, head andneckPaper 71 Starting at 3:08 PM, Ending at 3:16 PMOpen MR Image-Guided Injection of the AnteriorScalene Muscle for Thoracic Outlet Syndrome:Technique, Complications, and ResultsTsuruda, J. S. 1 · Filler, A. G. 1 · Williams, V. B. 21Neurografix, Institute of Nerve Medicine, Santa Monica,CA, 2 Kerlan-Jobe Orthopaedic Clinic, Los Angeles, CAPURPOSEThoracic outlet syndrome (TOS) may arise from compressionof the roots of the brachial plexus between the anteriorand middle scalene muscles (1). Muscle fiber structuralchanges from prolonged contraction can occur in the anteriorscalene muscle (ASM) (2, 3). Anterior scalene muscleanesthetic blocks may predict which patients may benefitfrom surgical decompression and usually are performedusing surface landmarks, electrophysiologic guidance (4) orCT. MR imaging has advantages including real-time guidancefor needle placement and injectate distribution andavoiding critical structures.MATERIALS & METHODSOver the past 4 months, 12 adult subjects (7 F/5M) with theclinical diagnosis of TOS were referred for ASM injectionunder open MR imaging guidance (Siemens Viva). Thepatient was positioned supine, with the inferior neck in theisocenter with a belt coil (Siemens MP35 s). Axial T1-SEwas used to identify the ASM, typically at the C7 level, andto plan a near horizontal needle (Lufkin 22 G/10 cm) trajectoryto maximize needle identification based on susceptibility.Insertion was performed parallel to a series of 8 mmthick, 3 slice axial FLASH (90 TR, 7.4 TE, 40 flip, 40 FOV,96 x 256 matrix, 20 secs) sections. The midportion of themuscle was targeted, avoiding external jugular veins, carotidand interscalene space, pulmonary apex, vertebral artery, andMonday
Mondaysympathetic chain. Marcaine (0.5%, 4-6 cc) and Kenalog (40mgs) were injected, which is hypointense, and can be followedreadily during placement, adjusting the needle tip toensure muscle infiltration and reduce extravasations.Follow-up T2 SE was used to document injectate position.Total procedural time is < 45 minutes.RESULTSIn all instances, there was successful introduction of injectateinto the ASM. On T2 SE images, the hyperintense intramuscularinjectate was noted to infiltrate the ASM as follows:100% replacement (1 case), 75-80% (4), 50-70% (4).In 3, the injectate infiltrated the central 75% of the muscle,dividing the uninjected areas into medial and lateral portions.Mild extravasations were noted in the majority ofcases, predominately lateral to the ASM, with medial extensionin 5 cases and posterior in 2 cases. Postprocedure armweakness/numbness was noted to be mild in 6, moderate in1, and there was transient nausea in 2, all symptoms resolvedwithin 24 hours. There was no evidence of Horner sign, orother complications.CONCLUSIONOpen MR imaging is a rapid, accurate modality to performASM injections, with low transient complications. Of importanceis its ability to evaluate its success of intramuscularplacement. Operator skill is required. Additional proceduressuch as middle scalene injection and/or botulinum chemodenervationalso can be performed during the same setting.REFERENCES1. Ranney D. Thoracic Outlet: An Anatomical Redefinitionthat Makes Clinical Sense. Clin Anat 1996;9:50-522. Machleder H, Moll F, Verity M. The Anterior Scalene Musclein Thoracic Outlet Compression Syndrome. Histochemicaland Morphometric Studies. Arch Surg 1986;121:1141-11443. Hawkes C. Neurosurgical Considerations in Thoracic OutletSyndrome. Clin Orthop 1986;207:24-284. Jordan S, Machleder H. Diagnosis of Thoracic OutletSyndrome Using Electrophysiologically Guided AnteriorScalene Blocks. Ann Vasc Surg 1998;12:260-264KEY WORDS: Thoracic outlet syndrome, interventional MRimaging, scalene blockPaper 72 Starting at 3:16 PM, Ending at 3:24 PMCT Perfusion in Head and Neck Cancer: A Pilot StudyRumboldt, Z. · Al-Okaili, R. · Roberts, D. · Deveikis, J.Medical University of South CarolinaCharleston, SCPURPOSEThis study was performed to evaluate the feasibility, reproducibility,and reliability of perfusion computerized tomography(CTP) in the head and neck (H&N) following a regularenhanced CT, and to attempt to differentiate benign frommalignant processes.54MATERIALS & METHODSPerfusion computerized tomography was attempted on 15patients 5 minutes after regular H&N contrast-enhanced CT(CECT), with injection of 40 ccs of contrast at 4 cc/sec. Theregions of interest, based on CECT, were scanned with fourconsecutive 5 mm thick CT images every second for 50 seconds.The data was postprocessed using a commercial vendorsoftware package utilizing a deconvolution-based technique.Internal carotid artery (ICA) and, where possible,external carotid artery (ECA) were used as arterial input vesselsand the internal jugular vein as the venous output vessel.The data were processed into maps for each arterial inputthat represented blood volume (BV) (mL/100 g), blood flow(BF) (mL/100 g x min), mean transit time (MTT) (sec), andcapillary permeability surface product (CP) (mL/100 g xmin). Two observers independently performed all the stepsand obtained ROIs through the primary site (PS), salivaryglands (SG), thyroid gland, paraspinous muscles (PSM),muscles of mastication, sternocleidomastoid muscle, base oftongue (TB), and subcutaneous fat (SQ). The differentrepeated measurements were compared using ANOVA test.Histologic specimens of all lesions were obtained.RESULTSOne case was excluded due to poor bolus timing. Three caseswere excluded due to extensive laryngeal motion. Of theremaining 11 cases 5 had cancer, 3 had benign lesions, and 3had no evidence of the clinically suspected cancer.The study revealed no significant interobserver difference,the lowest p value was 0.13 for the parotid gland, and thehighest was 0.81 for the PSM, and for the PS it was 0.35. Thestudy also failed to reveal significant difference betweenCTP with ICA vs ECA arterial input with the lowest p valueof 0.45 for the parotid gland and the highest 0.89 for thePSM and it was 0.57 for the PS. Measurements obtained forthe SQ and TB were extremely variable and excluded. Asseen in the Table muscles maintain low BV, BF, and CP valuesbut have a long MTT. The thyroid and SGs demonstratehigh BV, BF, and CP and have a low MTT. Differentiationbetween malignant and nonmalignant lesions was most reliablewith MTT. The measurements obtained were comparableto the values in the literature.Mean/standard deviationBF BV MTT CPThyroid 137.28/39.46 14.95/3.62 7.38/1.79 24.25/7.44Masseter 14.65/14.38 1.49/0.37 16.1/8.78 9/4.67PSM 4.74/2.65 1.13/0.63 20.82/6.85 6.46/5.30Sternocliedomastoid 16.39/10.05 1.41/0.73 10.63/5.1 5.35/4.03SG 62.41/50.15 4.11/1.68 6.26/2.68 34.86/10.11Malignant lesions 80.93/47.94 3.97/2.02 3.74/1.11 21.9/6.66Benign lesions 30.4/3.61 3.3/0.32 9.4/2.12 29.67/11.88CONCLUSIONPerfusion computerized tomography in the H&N is feasibleexcept at laryngeal level. Perfusion computerized tomographyperformed after regular enhanced CT of the H&N usingICA for the arterial input provides reliable and reproducibleresults that are not observer dependent. Perfusion computerizedtomography shows promise in distinguishing benignand malignant processes, primarily by MTT, while someoverlap exists between malignant lesions, salivary and thyroidglands.KEY WORDS: CT perfusion, cancer, feasibility
Paper 73 Starting at 3:24 PM, Ending at 3:32 PMDiagnostic Accuracy of CT Angiography for Traumaticor Atherosclerotic Lesions of the Carotid and VertebralArteries: A Systematic ReviewHollingworth, W. · Nathens, A. B. · Kanne, J. P. · Crandall,M. L. · Crummy, T. A. · Hallam, D. K. · Wang, M. C. ·Jarvik, J. G.University of WashingtonSeattle, WAPURPOSEHelical CT angiography (CTA) has become an establishedtechnique for evaluating atherosclerosis of the cerebrovasculararteries. However, the role of CTA in penetrating andblunt trauma to the carotid and vertebral arteries is not welldefined. We conducted a systematic literature review todetermine the diagnostic accuracy of CTA for atherosclerotic,penetrating and blunt lesions in the carotid and vertebralarteries.MATERIALS & METHODSWe searched MEDLINE and EMBASE data bases to identifystudies evaluating the diagnostic accuracy of CTA of thecarotid and vertebral arteries published between January 11992 and December 31 2002. Two reviewers independentlyassessed abstracts and full text to determine study eligibility.Studies were included if they met the following criteria: (1)primary data on humans, (2) more than ten subjects, (3) evaluatesthe diagnostic accuracy of CTA, (4) images the carotidor vertebral arteries, (5) uses conventional angiography orsurgical findings as the reference standard, (6) not a study ofnontraumatic aneurysm or tumor. Information on methodologicquality, imaging technique, and diagnostic accuracywas abstracted from all eligible studies by three independentreviewers. We pooled sensitivity and specificity data fromdiagnostic accuracy studies of high methodologic quality.RESULTSForty-three articles met the inclusion criteria and wereincluded in the review. Thirty studies examined atheroscleroticdisease, two blunt trauma, two penetrating trauma, andnine examined patients with other pathology. Pooled datafrom 15 higher quality studies demonstrated that CTA had asensitivity of 95% [91% to 97%; 95% confidence interval(CI)] for detecting severe (> 70%) atherosclerotic stenosis ofthe carotid artery. The specificity of CTA for severe stenosiswas also high 98% (96% to 99%; CI). CT angiographyremained a sensitive technique (95%; 93% to 97% CI) whenthe criterion for a positive result is relaxed to moderate orgreater (> 30%) stenosis. The two studies raised concernsabout the use of CTA in the blunt trauma setting suggestingthat CTA may not be sensitive for detecting small intimalinjuries (sensitivity < 70%). However, the results from thesetwo studies were heterogeneous and both studies used oldertechnologies for either obtaining or viewing images.Conversely, two penetrating trauma studies concluded thatthe sensitivity of CTA was high.55CONCLUSIONOur findings demonstrate that CTA is both a sensitive andspecific imaging technique for identifying severe atheroscleroticstenosis and occlusion of the carotid arteries. However,there currently is not enough high quality evidence to accuratelyestimate the sensitivity and specificity of CTA in thesetting of blunt or penetrating trauma. Further studies capitalizingon newer imaging technology (for example multidetectorCT) and better viewing techniques (for examplePACS) are required to validate the use of CTA in the settingof trauma.KEY WORDS: CT, carotid arteries, meta analysisPaper 74 Starting at 3:32 PM, Ending at 3:40 PMDo We Need to Inject More Than 60 ccs of Contrast forNeck CT Angiography with an Automated TriggerTechnique?Sherman, P. M. · Takhtani, D. L.Johns Hopkins HospitalBaltimore, MDPURPOSETo determine the reliability of low-dose contrast neck CTangiography (CTA) by measuring the Hounsfield units (HU)in the vessels, assessing the degree of venous contamination,and evaluating the adequacy of the image quality.MATERIALS & METHODSTwo neuroradiologists retrospectively reviewed the imagesof 20 patients (11 female, 9 male, ages 9-82 years) whounderwent low-dose contrast neck CTA (60 cc Iohexol 350iv [predominantly antecubital vein], injection rate 3-4 cc/sec;the exception was a 9 year old who received a 40 cc [1 cc/kg]dose). Images were acquired on a 16 multislice ToshibaAquilion scanner from the aortic arch to the suprasellar cisternat 1 mm collimation, a pitch factor of just less than 1(15/16), and a scan time of 11-14 seconds. A region of interest(ROI) was placed on the aortic arch with trigger point setbetween 140-160 HU. Three-dimensional processing wasdone on a Vitrea (Vital Images, Plymouth, MN) workstation.HUs were measured at the aorta, just below the commoncarotid artery (CCA) bifurcation, at the internal carotidartery (ICA) terminus, and at the mid basilar artery (BA).Venous contamination was graded as complete if neck veinswere opacified fully on the volume rendered images; partialwhen veins overlying the CCA bifurcations were just opacified;and absent when the CCA bifurcations were visualizedclearly without changing the preset windows. Image qualitywas assessed subjectively as diagnostic or nondiagnostic.RESULTSAll scans were of diagnostic quality. In no case was a repeatCTA exam or diagnostic angiogram required. Venous contaminationwas absent in 10/20 (50%) cases; partial in 8/20(40%) cases; and complete in 2/20 (10%) cases. We determinedthat 250 HUs or higher within the vessels is desiredfor high quality CTA. The range of HUs was as follows: 1)Arch, 170-352 HU; 2) CCA, 208-639 HU; 3) ICA terminus,175-480 HU; and 4) basilar artery, 179-469 HU. In 14/20(70%) cases there was an expected rise in HUs after automatedtrigger scan initiation and persistent HU measurementsabove 250 in the distal ICAs and basilar artery. In theMonday
Mondayremaining 6/20 (30%) of cases there was an initial increasein HUs in the CCAs followed by a decrease in HUs in theICAs and BA, with the total dropping below the desiredlevel of 250 HU (lowest was 175 HU). Though the imageswere of adequate quality to interpret, the 3D volume renderedimages were mildly degraded.CONCLUSIONOur neck CTA protocol provides the clinical benefit ofdecreased dose of iodinated contrast with diminished chanceof contrast-related complications such as nephrotoxicity andis more economical. When the automatic trigger is performedproperly, injection of more than 60 ccs of contrast isnot necessary as excess contrast may still be in the arm,lungs, and heart and noncontributory towards the angiogram.However, in patients with poor cardiac output, those requiringlonger scan time due to larger area of coverage, or ivaccess more distal to the antecubital vein, it may be necessaryto increase the dose of contrast to 80-90 ccs.KEY WORDS: CT angiography, neck CTA, low-dose contrastPaper 75 Starting at 3:40 PM, Ending at 3:48 PMOptic Neuritis Secondary to Cat Scratch Disease:Distinguishing MR Imaging Features to Other Types ofOptic NeuropathiesSchmalfuss, I. M. · Dean, C. · Sistrom, C. · Bhatti, T.University of FloridaGainesville, FLPURPOSEMR imaging characteristics of optic neuritis caused by catscratch disease (CSD) have not been described yet.However, such knowledge may guide laboratory evaluation,prevent incorrect diagnosis, and contribute to the immediateinitiation of appropriate antibiotic therapy. Therefore, thepurpose of this study was to establish MR features distinguishingoptic neuritis secondary to CSD from other types ofoptic neuropathies.MATERIALS & METHODSAll patients (n = 98) who presented to the University ofFlorida Eye Clinic with signs and symptoms of an optic neuropathybetween April 1997 and March 2003 and had an MRexamination available for review were included in this retrospectivestudy. Two readers (one neuroradiologist and oneneuroophthalmologist) reviewed the MR images independentlyin regards to presence, location, and extent of opticnerve enhancement. In addition, presence and extent of cerebralwhite matter lesions was recorded. Correlation of theMR findings to the final diagnosis was made.RESULTSNine percent (9/98) of the patients received the final diagnosisof CSD. Forty percent (38/98) of all patients demonstratedenhancement of one or both optic nerves. None of thepatients with CSD showed bilateral optic nerve enhancement.In comparison, bilateral enhancement was seen in 21%(7/33) of the other patients. The optic nerve enhancement inCSD patients (5/38) was localized to a 3-4 mm segment atthe optic nerve-globe junction. All other optic neuritispatients (32/38) with one exception showed enhancementaway from the optic nerve junction or a long segment56enhancement when the optic nerve globe junction also wasinvolved. None of the patients with optic neuritis due to CSDdemonstrated cerebral white matter lesions. Four of thepatients with final diagnosis of CSD did not show any opticnerve MR abnormalities. Therefore, the specificity of theMR findings for CSD was 83.3% and the sensitivity 55.6%.CONCLUSIONUnilateral, short segment enhancement at the optic nerveglobejunction is highly specific for CSD as underlyingcause of optic neuritis and should initiate confirmatory laboratorytesting for Bartonella henselae, the causative organismof CSD. However, the lack of optic nerve enhancementdoes not exclude the possibility of optic neuritis caused byCSD as reflected in the low sensitivity value.KEY WORDS: Cat scratch disease, optic neuropathy, MRimagingPaper 76 Starting at 3:48 PM, Ending at 3:56 PMDifficulty in Defining Lymphatic Extension toSupraclavicular Fossa for Staging of NasopharyngealCarcinoma by MR ImagingChan, J. · Lau, K. · Lee, A. · Sze, W. · Kan, W. · Ng, W. ·Yau, T.Pamela Youde Nethersole Eastern HospitalHong Kong, HONG KONG SPECIAL ADMINISTRATIVEREGION OF CHINAPURPOSEThe UICC Staging System (5th edition) for nasopharyngealcarcinoma (NPC) includes lymphatic extension to supraclavicularfossa (SCF) as one of the staging criteria for N3 disease.While clinicians have little difficulty in recognizing thedemarcating boundaries, radiologists cannot easily mark theboundary that stretches from the sternal end of the clavicle tothe point where the neck meets the shoulder. Som et al.(1999)hence recommended that the visualized portion of theclavicle, as seen on each of the axial images, be used as theimaging marker for the SCF. To assess the accuracy of thisradiologic landmark in correlating with clinically palpablenodes in SCF.
MATERIALS & METHODSAmong the newly diagnosed NPC patients investigated withMR in our hospital during 2000 to 2002, 21 patients had palpableSCF nodes detected/ confirmed by experienced oncologists.All patients were scanned from the base of skull to theinferior border of clavicles using 1.5 T MR (Symphony,Siemens Medical Systems). Their axial films (includingpostgadolinium T1 weighted images with fat saturation)were reviewed by two qualified radiologists.RESULTSThe median time interval between clinical examination andMR was 16 days (range: 7-25). Of the 21 patients with clinicallypalpable SCF nodes, 15 (71%) did not show any lymphadenopathyin the SCF defined radiologically with theclavicle as the landmark. Only 4 (19%) patients showed definiteextension both clinically and radiologically, while 2(10%) were equivocal.CONCLUSIONRadiologic demarcation of SCF is difficult and the landmarkcurrently recommended by Som et al. might under-stagesubstantial proportion of patients with clinical N3 disease. Amore accurate way for MR delineation of SCF should beexplored.KEY WORDS: Supraclavicular fossa lymphadenopathy, radiologiclandmark, under-stagePaper 77 Starting at 3:56 PM, Ending at 4:04 PMParapharyngeal Masses: The Value of DynamicContrast-Enhanced MR in Predicting their HistologyCevasco, F. I. · Enochs, W. · Rao, V.Thomas Jefferson UniversityPhiladelphia, PAPURPOSETo determine the utility of dynamic contrast-enhanced MRimaging compared to conventional MR imaging in the evaluationof parapharyngeal masses and whether it is predictiveof their histology.MATERIALS & METHODSWe retrospectively examined MR imaging studies obtainedat our institution over the past 6 years on patients with parapharyngealmasses (8 glomus tumors, 5 schwannomas, 7pleomorphic adenomas, 6 metastatic lymph nodes, and 8reactive lymph nodes). When possible, pathologic and/orsurgical confirmation of the diagnosis was accomplished.The MR imaging protocol included axial T1-weighted SE,axial STIR, dynamic contrast-enhanced FMPSPGR with fatsaturation, and equilibrium contrast-enhanced SE with fatsaturation sequences. Relative contrast enhancement wascalculated objectively as a ratio of the absolute signal intensityof the lesion to that of normal muscle.RESULTSGlomus tumors showed two different behaviors, one withintermediate-to-high signal intensity on T2-weightedimages, characteristic flow voids, and early intense enhancementafter administration of contrast, with some washout butoverall intense persistence of enhancement. The other groupshowed uniformly high signal on T2-weighted images and57early intense enhancement but with progressive washout ofthe contrast. Schwannomas and pleomorphic adenomasshowed a similar pattern of early moderate heterogeneousenhancement with a gradual intense increase over time.However, the schwannomas had very high signal intensityon T2-weighted images, while the pleomorphic adenomashad a much lower signal intensity. Metastatic and reactivelymph nodes were indistinguishable, demonstrating high signalon T2-weighted images and early modest diffuseenhancement with a gradual intense increase.CONCLUSIONDynamic gadolinium-enhanced MR imaging is superior toconventional MR imaging in the evaluation of parapharyngealmasses and may be predictive of their histology.REFERENCES1. Yabuuchi H, Fukuya T, Tajima T, Hachitanda Y, Tomita K,Koga M. Salivary Gland Tumors: Diagnostic Value ofGadolinium-Enhanced Dynamic MR Imaging withHistopathologic Correlation. Radiology 2003;226:345-354KEY WORDS: Parapharyngeal space, glomus tumor, dynamiccontrast-enhanced MR imagingPaper 78 Starting at 4:04 PM, Ending at 4:12 PMAssessment of Salivary Gland Function ofNasopharyngeal Carcinoma Patients ReceivingRadiotherapy by Using Dynamic Contrast-EnhancedMR Imaging and Pharmacokinetic AnalysisChin, S. · Chen, C.Tri-Service General HospitalTaipei, TAIWAN REPUBLIC OF CHINAPURPOSERadiotherapy is the main treatment for nasopharyngeal carcinoma(NPC). The price to be paid for this effective treatmentis universal xerostomia. Salivary glands have beenproved to be extremely radiosensitive. We try to develop anobjective measurement for evaluating the salivary glandfunction as correlated with the fluctuation of saliva amountduring treatment.MATERIALS & METHODSTwenty patients with newly diagnosed NPC and no previoustreatment were studied by MR imaging. The anatomicalimages included high-resolution T1-weighted, fat-saturatedfast spin-echo T2-weighted, and contrast-enhanced T1-weighted images. The dynamic contrast-enhanced MR imagingwas performed by using a 2D fast spoiled-gradientrecalled sequence with single dose bolus injection of contrastagent. Calculated values included time to peak, peakenhancement, maximum slope, and washout slope for theenhancement. The designed pharmcokinetic parameterswere employed also in this study. All patients underwentradiotherapy as part of treatment protocol and the imagingresults were correlated with the data of saliva collection.Monday
MondayRESULTSDynamic contrast-enhanced MR imaging and saliva amountcomparisons were obtained. After radiotherapy, the salivarygland, especially the parotid gland, has a longer time to peak,reduced peak enhancement, reduced maximum slope, andslower washout slope. Our data, assisted by pharmacokineticanalysis, are consistent with decreased transfer of contrastagent to tissue and reduced volume of the extravascularextracellular space that had been radiated.CONCLUSIONAnalysis of dynamic contrast-enhanced MR imaging candifferentiate normal from radiated salivary gland tissue inNPC patients. The correlation with clinical decreased salivaamount also is fairly good.KEY WORDS: Salivary gland, MR imaging, nasopharyngealcarcinomaPaper 79 Starting at 4:12 PM, Ending at 4:20 PMExpanding the Role of Multislice CT: Do the Three-Dimensional Multiplanar Reformats of the Neck GiveAdditional Information?Taing, B. G. · Takhtani, D.The Johns Hopkins School of MedicineBaltimore, MDPURPOSETo retrospectively compare routine interpretation of the neckCT on axial images with the findings after the evaluation onthree-dimensional (3D) multiplanar workstation.MATERIALS & METHODSThe study includes 17 patients who underwent neck CT forvarious indications. These exams were interpreted alreadyonly on the 3 mm thick axial images by different staff neuroradiologists.The neck CTs were acquired at 1.00 mmreconstruction with 50% overlap. Except one, all received90-100 ccs of iodinated contrast intravenously. The data thenwere reevaluated by two neuroradiologists on 3D Vitreaworkstation (Vital Images, Plymouth, MN) using multiplanarreformats, curved reformats, and other 3D renderingtechniques.RESULTSThe additional findings after 3D interpretations of theimages were divided into three categories: 1. That wouldchange the clinical management; 2. That may or may notchange the clinical management; 3. Additional findings oflittle or no clinical significance. Two patients had categoryone findings, which were clinically significant: one withright palatine swelling and other lingual tonsilar mass. Sevenpatients had category two findings: one vocal cord paralysis,extent of the tongue carcinoma in two patients, tracheal narrowingin two patients, eccentric thickening of the epiglottisin a patient with treated carcinoma and extent of neck lymphadenopathyin one. In rest of the 8 patients, there was nosignificant additional information.CONCLUSIONWhile the role of the 3D reformats is well established in thecervical spine CT and the CT angiography, it has not beenexplored fully in the routine neck CT interpretations. Eyes58are prone to overlook any gradual change in a structure ormass if the images are scrolled one by one; however, if thesame data are reconstructed in 3D, we get an overall view ofthe structure or the lesion much better. Newer generation CTscanners provide volume data that can be used for 3D multiplanarreformat. There are several structures in the neck,which ideally should be looked at in multiple planes forcomplete evaluation. The airway including vocal cords,tongue, cranio-caudal dimension and level of the lymphnodes, cranio-caudal dimension of the masses, vasculardeviations, prevertebral and retropharyngeal spaces are betterappreciated when seen in the entirety. Thinner slices alsomake it possible to get very good quality 3D reformats.KEY WORDS: Multislice CT, neck, 3D reformatsPaper 80 Starting at 4:20 PM, Ending at 4:25 PMImaging Findings in a Patient with IntraorbitalExtramedullary HematopoiesisIvanovic, V. · Watson, R. E.Mayo ClinicRochester, MNPURPOSETo describe the imaging findings in a patient with intraorbitalextramedullary hematopoiesis.MATERIALS & METHODSA 69-year-old female presented with 1-month history ofbilateral orbital pain, progressive swelling, redness, blurryvision, and photophobia. Past medical history was significantfor long-standing myelofibrosis with myeloid metaplasia.Physical exam revealed marked bilateral periorbitalswelling with conjunctival erythema and photophobia. Theextraocular movements and vision were intact.RESULTSMR examination of the head revealed bilateral intraconalmasses that partially encased the optic nerves. They demonstratedlow T1, high T2 signal intensity and intense enhancementwith gadolinium. There was mild proptosis. There wasalso diffuse low T1 signal marrow abnormality. Given thesefindings, extramedullary hematopoiesis was suggested,which was confirmed with Tc99 sulfur colloid scan.CONCLUSIONNervous system involvement by extramedullaryhematopoiesis is uncommon and presents as T2 shorteningand intense gadolinium enhancement. Most common CNSsites of extramedullary hematopoiesis include dura matter(along cerebral convexities, falx cerebri, and epidural spaceof the spinal canal) and choroid plexus (1). Paraspinal softtissues also can be involved with extension through the neuralforamina into the spinal canal. Intraorbital involvement israre, with only one case report of MR findings in intraorbitalextramedullary hematopoiesis found in our review of the literature(2).
REFERENCES1. Koch BL, Bisset GS 3rd, Bisset RR, Zimmer MB. IntracranialExtramedullary Hematopoiesis: MR Findings withPathologic Correlation. AJR Am J Roentgenol1994;162(6):1419-14202. Pless M, Rizzo JF 3rd, Shang J. Orbital Apex Syndrome: ARare Presentation of Extramedullary Hematopoiesis: CaseReport and Review of Literature. J Neuro-Oncol2002;57(1):37-40KEY WORDS: Extramedullary hematopoiesis, orbital,myelofibrosisMonday Afternoon3:00 PM - 4:30 PMRoom 611 - 612(12d) Pediatrics: General andDevelopmental and CongenitalDisorders(Scientific Papers 82 - 93)See also Parallel Sessions(12a) Adult Brain: Neoplasms(12b) Adult Brain: Cerebrovascular Disease andStroke(12c) Head & Neck: GeneralModerators:Bernadette L. Koch, MDThomas P. Naidich, MDPaper 82 Starting at 3:00 PM, Ending at 3:08 PMMitochondrial Disorders: Variability of ImagingFindings and Evolution over TimeDietrich, R. B. 1 · Press, G. 2 · Nabangchang, C. 1 · Koopmans,S. 1 · Barshop, B. 1 · Haas, R. H. 11University of California San Diego Medical Center, SanDiego, CA, 2 Kaiser Permanente, San Diego, CAPURPOSETo describe the spectrum of neuroimaging findings and theirevolution over time in children with mitochondrial disorders.MATERIALS & METHODSBrain MR images were obtained of 70 children with mitochondrialdisorders. Age at onset, sex, blood or CSF lactatelevels and pyruvate levels and clinical course were known inall cases. Diagnostic muscle biopsy was performed for mitochondrialDNA studies with isolation of mitochondria for59electron transport chain enzyme assay in the majority.Diagnoses included pyruvate dehydrogenase deficiency(PDH), cytochrome oxidase deficiency (COX), complex Ideficiency, T8993G mutation causing neuropathy, ataxia,and retinitis pigmentosa (NARP), Kearns-Sayre syndromeand mitochondrial encephalopathy with lactic acidosis andstroke-like episodes (MELAS). Sequential MR studies wereobtained in 25 of the children. Degree of atrophy and T2 signalabnormality within specific brain structures were gradedfrom 0, no involvement to 3, severe depending on the proportionof the structure involved.RESULTSAlthough patients frequently demonstrated symmetricabnormal signal intensity in the caudate, putamen, midbrainand brainstem as classically described in mitochondrial disorders,the distribution of brain MR changes was variablewithin the series. Variations included sparing of basal gangliawith marked infratentorial involvement, predominantwhite matter or cortical involvement and marked asymmetryof signal abnormalities. Patients with NARP demonstratedsignificant brainstem and cortical atrophy. Sequential studiesshowed striking variability of imaging findings over time,even in children with the same biochemical defect. Temporalchanges ranged from localized lesions which remained staticover years to rapidly progressive lesions involving extensiveareas of brain within months. Disappearance of high T2signal intensity often was followed by atrophy in involvedstructures but progressive atrophy occurred in the absence ofT2 changes. Appearance and disappearance of T2 signalabnormalities was a common finding and frequentlyoccurred rapidly.CONCLUSIONA wide variation of imaging findings may be seen in patientswith mitochondrial disorders. Serial brain MR imaging maybe necessary to identify a neurodegenerative picture suggestiveof these diseases.KEY WORDS: Mitochondrial disorders, pediatric brain, MRimagingPaper 83 Starting at 3:08 PM, Ending at 3:16 PMMR Assessment of Pre and Postnatal Posterior FossaMorphology and Correlation with Clinical Signs of theChiari II Malformation in Children Undergoing In UteroMyelomeningocele RepairZarnow, D. M. · Simon, E. M. · Rintoul, N. · Bilaniuk, L. T.· Johnson, M. P. · Sutton, L. N. · Adzick, N. S.Children’s Hospital of PhiladelphiaPhiladelphia, PAPURPOSECompare posterior fossa morphology on fetal MR prior to inutero myelomeningocele (MMC) repair with serial postnatalMR and correlate the findings with clinical signs of theChiari II malformation.MATERIALS & METHODSPosterior fossa morphology was evaluated with MR in 33fetuses (19 to 26 weeks gestation) with MMC and Chiari IImalformation, using the following scale: Grade 1 - visualizationof 4th ventricle and cisterna magna (CM), Grade 2 -Monday
Mondayvisualization of 4th ventricle or CM, Grade 3 - no 4th ventricleor CM visualized. Postnatal MR examinations (ages:28 weeks to 3 years) were evaluated for cervicomedullarykinking (none, mild, moderate), presence or absence of tectalbeaking, and cerebellar herniation (in mm). Postnatal follow-upMR imaging at greater than or equal to 1 year of agewas available in 24 patients. Pre and postnatal MR findingswere correlated with signs of Chiari II malformation, includingneed for ventricular shunting, stridor, apnea, strabismus,and feeding difficulties.RESULTSOn fetal MR, hindbrain herniation was present in all patients.Three patients were grade 1, 12 patients were grade 2, and 18patients were grade 3. Following in utero MMC repair, significantlyimproved cerebellar herniation was seen in 84.8%(28/33) of patients. At 1 year of age, worsening cerebellarherniation was present relative to immediate postnatal scanin 50% (12/24) of patients. Cervicomedullary kinkingimproved, but tectal beaking remained present in 93.9%(31/33) of patients. Fifty-one and one-half percent (17/33) ofpatients required ventricular shunting. Of these, 58.8%(10/17) had greater than 1 mm of residual cerebellar herniationon initial postnatal MR imaging. Fifty percent (6/12) ofpatients with increasing cerebellar herniation on postnatalfollow-up scans required shunting. Twelve and one-tenthpercent (4/33) of patients had clinical signs referable toChiari II malformation. Of these patients, 75% (3/4) hadgreater than 1 mm of cerebellar herniation on postnatal follow-up.Seventy-five percent (3/4) of symptomatic patientsrequired shunting.CONCLUSIONFollowing in utero MMC repair, there is significant improvementin cerebellar herniation. Tectal beaking remains presentin the majority of patients while cervicomedullary kinkingresolves. At 1 year of age, progressive cerebellar herniationmay be seen. Patients with residual or increasing herniationwere more likely to require ventricular shunting. In patientswith signs referable to Chiari II malformation, the majoritywill have residual cerebellar herniation and require shunting.Correlation with imaging of the spine is planned to assess forinterval retethering of the spinal cord as the etiology of theprogressive herniation.KEY WORDS: Pediatric, Chiari II malformation, fetal MRimagingPaper 84 Starting at 3:16 PM, Ending at 3:24 PMLimited Dorsal Myeloschisis: MR Findings withEmbryologic CorrelationRossi, A. · Piatelli, G. · Ravegnani, M. · Cama, A. · Tortori-Donati, P.G. Gaslini Children’s Research HospitalGenoa, ITALYPURPOSETo present the MR findings of limited dorsal myeloschisis(LDM) and to discuss the embryologic substratum of thisrare subset of closed spinal dysraphisms.60MATERIALS & METHODSThere were three newborns with large, sessile, midline posteriormasses located at cervical, thoracic, and thoracolumbarlevel, respectively. The dome of the mass was covered bythickened, dystrophic epithelium, whereas the base and lateralwalls were covered by intact skin. All newborns wereneurologically intact. MR imaging of the whole neuraxiswas performed prior to surgical repair.RESULTSIn all cases, MR imaging showed a thin stalk emanatingfrom the dorsal aspect of an otherwise normal spinal cord,crossing a narrow posterior bony spina bifida, and fanningout into a posterior meningocele to connect to the inneraspect of the dome. Dilatation of the ependymal canal justcranial to the origin of the posterior stalk was detected in onecase. A Chiari II malformation was associated in one case.CONCLUSIONClosed spinal dysraphisms with subcutaneous mass occurringat cervicothoracic level are exceedingly rare, and aresignificantly different from those occurring at lumbosacrallevel. They are characterized by a large skin-coveredmeningocele crossed by a fibroneurovascular stalk thatattaches to the dome of the meningocele (so-called skin-coveredmyelomeningocele). Rarely, a hydromyelic cavity thatis continuous with the ependymal canal dissects the stalk(i.e., nonterminal myelocystocele). These lesions are betterdefined embryologically as variants of an LDM spectrum.The pathogenesis is represented by localized failure of thefinal fusion of the apposed neural folds after most of neurulationhas been completed. Limited, incomplete fusion of thedorsal neural folds results in failed separation of the cutaneousfrom the neural ectoderm. This results in a fibroneurovascularstalk emanating from the dorsal aspect of thespinal cord and penetrating through a narrow dorsal duralopening into the posterior meningocele, to eventually connectto the skin. Because the extent of the myeloschisis isminimal, formation of the superficial tissues is not prevented,resulting in a skin-covered malformation. In our opinion,the denomination “myelomeningocele” is not completelysatisfactory on account of the striking differences from lumbosacralmyelomeningoceles (i.e., the presence of a skincoverage to the malformation and the fact that affected newbornsare significantly less impaired than those with classi-
cal myelomeningoceles). Moreover, the Chiari II malformationis present in only a minority of cases, perhaps becausethe limited extent of the myeloschisis makes it less likely forenough CSF hypotension to occur within the developingneural tube. MR imaging is crucial to identify the variouscomponents of the malformation and to plan surgical repair.REFERENCES1. Pang D, Dias M. Cervical Myelomeningoceles. Neurosurgery1993; 33:363-3732. Steinbok P, Cochrane DD. Cervical Meningoceles andMyelocystoceles: A Unifying Hypothesis. Pediatr Neurosurg1995; 23:317-322KEY WORDS: Spinal dysraphism, myelomeningocele, myelocystocelePaper 85 Starting at 3:24 PM, Ending at 3:32 PMAppearance of the Germinal Matrix and DevelopingNeocortex on Postmortem MR ImagingGriffiths, P. D.University of SheffieldSheffield, UNITED KINGDOMPURPOSEDevelopmental abnormalities of cortical formation are commonfindings in pediatric neuroradiology. The cortex isformed by the passage of neurons and glia from the periventriculargerminal matrices to the future cortex. PostmortemMR imaging provides an opportunity to study the fetal germinalmatrix at different gestational ages in fetuses with normalbrains as well as fetuses with brain malformations. Inthis paper we present our experience of imaging the fetalgerminal matrix postmortem.MATERIALS & METHODSPostmortem fetal imaging has been performed as a researchstudy in Sheffield with approval from the local ethics committee.So far 180 procedures have been performed, the vastmajority having some form of abnormality. In this report wedescribe the size and appearance of the germinal matrix in 15fetuses with no demonstrable brain or somatic abnormalitieson autopsy. All fetal brains were imaged in situ on a 1.5 Tsuperconducting system (Eclipse, Philps Medical Systems)using either a knee or ankle coil depending on the size of thefetal head. High-resolution FSE T2-weighted images weretaken in the three orthogonal planes. The area of the germinalmatrices and the hemispheric thickness was measured onanatomically consistent regions on the coronal images in allcases. Those values were correlated with gestational agemeasured after the last menstrual period.RESULTSThe germinal matrix is demonstrated easily on the T2-weighted images as it shows marked T2 shortening whencompared to the adjacent brain. The thickness of the hemisphereshowed positive linear correlation with increasinggestational age, whereas the absolute area measurements ofthe germinal matrix increase up to 22 weeks and thendecrease. However, there is a gradual decline in the proportionatesize of the germinal matrix when compared with thehemisphere from 14 weeks (the earliest case).61CONCLUSIONThere is an absolute increase in the size of the fetal germinalmatrix up to 22 weeks followed by a reduction to a degreethat no matrix is seen after 32 weeks. In proportion to thehemispheric size the germinal matrix is largest at 14 weeks,which was the earliest fetus studied. We will show theappearance of fetal germinal matrices in a range of brainmalformations for comparison with the normal data.KEY WORDS: Germinal matrixPaper 86 Starting at 3:32 PM, Ending at 3:40 PMSurface and Nonorthogonal Reconstructions forAssessing Abnormalities of Cortical FormationGriffiths, P. D.University of SheffieldSheffield, UNITED KINGDOMPURPOSEThe detection of developmental abnormalities of the neocortexremains a significant radiologic challenge when focaland anatomically limited. This is relevant because childrenand young adults with focal seizures are imaged often with aview to possible neurosurgical interventions if an appropriatelesion can be defined confidently. In this paper we evaluatethe role of using 3D data sets to produce curvilinearreformats and surface rendered images in order to increasethe certainty of diagnosis of neocortical malformations.MATERIALS & METHODSFifty-eight patients were studied all of whom had beenreported as having, or suspicious of having, a developmentalcortical abnormality on clinical MR imaging at theUniversity of Sheffield between 2000 and 2003. All patientswere examined on superconducting 1.5 T systems(Eclipse/Infinion, Philips Medical Systems) and hadreceived gradient-echo T1-weighted volume imaging eitherwith 0.8 mm or 1.0 mm thick partitions. In all cases the 3space data sets were reconstructed retrospectively using theproprietary workstation to produce non orthogonal reformationsof the area of interest. The 3 space data sets wereimported in SPM and normalized into standardized spaceusing a template provided by the Montreal NeurologicalInstitute. The images then were transferred to MRICrowhere a script was used to isolate the brain image from thecranium/superficial structures and perform reconstructionsof the cortical surface.RESULTSA total of 58 cases were studied falling into the followingcategories as suggested by Barkovich et al. (1).Disorder of Abnormal Radiologic Diagnosis NumbersProliferation Hemimegalencephaly 5Migration Lissencephaly 4Heterotopia 15Cortical organization Polymicrogyria only 33Schizencephaly and PMG 1High quality 3D data sets were acquired in all patients. Allcases of hemimegalencephaly, lissencephaly, and schizencephalywere diagnosed confidently on routine imaging butthe reformations gave a better appreciation of the extent of theabnormality. The nonorthogonal reformats made a positiveMonday
Mondaycontribution to the diagnostic process in all cases, whereassome small areas of polymicrogyria and heterotopia did notproduce significant distortions of the surface-rendered images.CONCLUSIONNonorthogonal reformation and surface-rendered reformatsmake a positive contribution to the certainty of detection ofsubtle abnormalities of cortical formation. Even in caseswith obvious abnormalities on routine imaging extra informationcan be obtained with respect to anatomical extent.REFERENCES1. Barkovich AJ, Kurniecky RI, Dobyns WB, et al. AClassification Scheme for Malformations of CorticalDevelopment. Neuropediatrics 1996;27(2):59-63KEY WORDS: Brain malformationsPaper 87 Starting at 3:40 PM, Ending at 3:48 PMSepto-Optic Dysplasia: Classification and DefinitionsBrugger, P. C. 1 · Prayer, D. 1 · Riedl, S. 1 · Frisch, H. 1 ·Raybaud, C. 21University of Vienna, Vienna, AUSTRIA, 2 Université de laMéditerranée, Marseille, FRANCEPURPOSEThe classification of midline anomalies is still controversial.Although well recognized, septo-optic dysplasia (SOD)remains an ill-defined malformation and is in need of a definition.Aim of the present study was to establish definitionsof this heterogenous group of malformations.MATERIALS & METHODSSixty-nine patients (0-33 years, median 3.9 years) with clinicallysuspect SOD underwent MR imaging at different institutions.Minimum protocols included axial T2-weightedsequences and at least one 1-3 mm thick sequence thatallowed to assess the pituitary and optic structures. Detailedmedical records were available in 51 cases. Thirteen morphologicfeatures were assessed (septum pellucidum, corpuscallosum, fornix, hippocampi, mamillary bodies, optic structures,pituitary, infundibulum, olfactory nerves, cortex, falxcerebri, anterior commissure, anterior cerebral arteries,pineal gland).RESULTSThe following cases were excluded from further analysis:Isolated absence of septum pellucidum (8), isolated opticnerve hypoplasia (8), corpus callosum agenesis (5), isolatedposterior pituitary ectopia (1), anophthalmia (1), holoprosencephaly(2), muscle-brain-eye disease (1). Within theremaining group six different types can be distinguishedaccording to their morphologic patterns: 1. SOD sensu strictu(10 cases) defined as: Brain with two hemispheres separatedby an interhemispheric fissure and connected by a corpuscallosum, absent septum pellucidum (ASP) (septal remnantsfrequently present), fornices present, normal pituitary,normal sized eyes, at least one small optic nerve, no othercerebral malformation, although malrotated hippocampiwere present in 50%. Falx cerebri present. 2. SOD plus pituitaryinvolvement (7 cases): as above, but with absent (6/7)or ectopic (1/7) bright spot, small anterior pituitary. Variousor combined hormone deficiencies except GnRH. Secondary62hypopituitarism. 3. SOD plus cortical malformation (5cases): ASP, small optic structures, normal pituitary, corticalmalformation. 4. Three patients were characterized by ASP,normal optic structures, ectopic posterior pituitary, smalladenohypophysis and frontal cortical dysplasia with maldevelopedcallosal genu. 5. Absent rostral falx was the salientfeature in this group (8 cases): Small optic structures (8/8),ectopic (2/8) or absent (6/8) bright spot, small anterior pituitary(8/8), thin (5/8) or absent (3/8) infundibulum, ASP(4/8), absent anterior commissure (3/8), cortical malformations,3/8, malrotated hippocampi (5/8), one case with absentolfactory nerves and additional GnRH deficiency. 6.Schizencephaly: ASP (8/10), pituitary normal (9/10), normalhippocampus, optic structures normal (6/10). A hypoplasticcorpus callosum was found in 10/15 patients which wereolder than 1 year and had hormone deficiencies. Dysplasticcorpora callosa were seen in cases of schizencephaly or corticaldysplasia. Hippocampal malrotation usually was associatedwith small mamillary bodies.CONCLUSIONA detailed morphologic analysis allows to distinguish welldefined groups within this spectrum of malformations. Theterm SOD should be restricted to group one. Callosalhypoplasia is an additional indicator of hormonal dysfunction.The proposed classification correlates better with outcomeand may provide additional clues on the pathogenesis.These findings point to an etiology which primarily affectsthe embryonic prosencephalon involving the di-telencephalicjunction, the exact nature of which remains to be determined.Exact definitions and detailed descriptions are essentialto finally cut this Gordian knot.KEY WORDS: Septo-optic dysplasia, brain malformation,pituitaryPaper 88 Starting at 3:48 PM, Ending at 3:56 PMAnomalies of the Cerebral Commissures: MR Analysis ofthe Phenotypic SpectrumHetts, S. W. · Sherr, E. H. · Chao, S. D. · Gobuty, S. ·Barkovich, A. J.University of California San FranciscoSan Francisco, CAPURPOSEAnomalies of the cerebral commissures (ACC, including thecorpus callosum, anterior commissure, and hippocampalcommissure) are associated with a variable spectrum of neurologic,behavioral, and cognitive deficits. The estimatedincidence of ACC is 1 in 4000 live births. To better addressthe current limited understanding of the etiology and naturalhistory of ACC, we have initiated a project to establish phenotypicgroupings of patients with ACC.MATERIALS & METHODSThe radiology database (1985 to 2003) at our institution wasqueried with: “callosum” and “hypogenesis” or “dysgenesis”or “agenesis.” This yielded 198 patients. We reviewed dictationsto identify all likely cases of ACC, which yielded n =167 cases. An additional 25 cases were drawn from MRexaminations of members of the ACC Network, a nationalsupport organization for patients with callosal anomalies.Exclusion criteria included inadequate scan quality, second-
ary commissural anomalies (as from congenital hydrocephalusor large destructive injuries to the brain), holoprosencephaly,and those that are part of known MCA syndromes.The last 3 excluded groups are considered as separateentities and are being evaluated in separate studies. Thescans of included patients were evaluated for type and severityof commissural anomalies, presence and type of interhemisphericcyst (if present), presence and type of malformationsof cortical development, distortions of the cerebralventricles, anomalies of white matter (normal or reducedvolume, location of reduced volume), presence or absence ofProbst bundles, and anomalies of the cerebellum, brainstem,orbits, and olfactory apparatus.RESULTSOf 167 patients from our institution, 82 MR studies wereavailable and all 25 ACC network patients had available MRimages; thus, studies from 107 patients were reviewed.Forty-four patients had callosal agenesis, 40 had dysgenesis/hypogenesis,1 had either agenesis or dysgenesis, and 22were excluded from further review (callosum intact, MCAsyndrome, technically limited studies). Fourteen patients hadinterhemispheric cysts (7 type I and 7 type II) and 3 had aninterhemispheric lipoma. An anterior commissure wasabsent in 36 patients and abnormal in size in 21. No hippocampalcommissure was present in 58 patients and abnormalin size in 3. Cortical malformations were present in 52patients, with heterotopias and abnormal sulcation patternsmost common. Cerebral ventricles were dilated or dysplasticin 74 patients, ranging from mild colpocephaly to severehydrocephalus. Reduced white matter volume was present in80 patients, with abnormal myelination in 24. Probst bundleswere apparent in 24 patients. Anomalies of the cerebellum,brainstem, orbits, and olfactory apparatus also were evidentin several patients.CONCLUSIONCallosal anomalies were by far the most common commissuralanomalies. Isolated commissural anomalies are rareamong the population of patients examined. Most cases ofcommissural agenesis or dysgenesis are associated withcomplex telencephalic, diencephalic, or rhombencephalicmalformations. White matter abnormalities are the most frequentMR finding, seen in greater than 80%, while malformationsof cortical development are seen in more than halfof patients, suggesting that most commissural anomalies areonly one part of an overall cortical and white matter dysgenesis.KEY WORDS: Corpus callosum, agenesis, dysgenesis63Paper 89 Starting at 3:56 PM, Ending at 4:04 PMPituitary Volume in Children Diagnosed with GrowthHormone DeficiencyFerraro, G. R. · Himel, A. · Bamji, N. · DeLuca, F. ·Timoshin, A. · Noto, J. · Noto, R. · Tenner, M.New York Medical CollegeWhite Plains, NYPURPOSEA retrospective study of MR imaging with contrast of thebrain with particular attention to the pituitary gland wasundertaken to determine the pituitary size in patients diagnosedwith growth hormone deficiency (growth hormone
MondayTable 1. Comparison of pituitary volumes in controls vsgrowth hormone deficient patients.All Patients Pre-Pubertal Patients Pubertal Patientscontrol GH deficient control GH deficient control GH deficient# patients 54 32 38 20 16 12volume (cm 3 )mean pituitary 254.94 343.68 271.68 217.93 514.66 316.63p-value for pair 0.016 0.064 0.015Pituitary volumes for each of the three pairs demonstrate thatgrowth hormone deficient patients have smaller pituitaryglands than their control counterparts. The growth hormonedeficient patients as a whole and the pubertal growth hormonedeficient patients as a group show a significant difference inpituitary size compared to their corresponding controls. Thedifference in pituitary size between the prepubertal deficientpatients and their controls was almost significantly different,and a greater number of patients probably would make this differencesignificant. The data presented here clearly demonstratethat patients with growth hormone deficiency have onaverage diminished pituitary volume, particularly in the pubertalage group. That, coupled with significant CNS lesionsfound on MR imaging clearly obligates one to perform MRimaging in all children who are growth hormone deficient.CONCLUSIONChildren with growth hormone deficiency have significantlysmaller pituitary volume vs controls and should all undergoCNS MR imaging with contrast with particular attention tothe pituitary gland.KEY WORDS: Pituitary, growth hormone, endocrinologyPaper 90 Starting at 4:04 PM, Ending at 4:12 PMBrain MR Examinations for Developmental Delay inChildren Less than Two Years of Age: The Value ofGadolinium Administration and a Review of RadiologicFindingsKsar, J. · Smythe, J. · Maly, P. V. · Jennings, J. · Petrou, M.· Eldevik, P. · Sundgren, P. C.University of MichiganAnn Arbor, MIPURPOSETo review the radiologic findings and associated clinicalsymptoms in the MR imaging work-up of developmentaldelay in children less than 2 years of age and evaluate theadded utility of gadolinium administration.MATERIALS & METHODSDuring a 7.5-year period (1995-2002), 189 gadoliniumenhancedbrain MR examinations were performed on childrenunder 2 years of age for the evaluation of clinical developmentaldelay. We retrospectively reviewed the medicalrecords, stated indications and MR findings on all 189 cases.RESULTSDevelopmental delay was the primary clinical concern thatprompted MR examination in 117 studies (group A) and wassecondary to more significant clinical symptoms in 72 studies(group B). Out of these 189 examinations, abnormal contrastenhancement was present in 15 cases (8%). In 4 of the15, (i.e., 2% of the total number of examinations involvingdevelopmental delay) the radiologic finding would have64been missed by noncontrast MR imaging alone. The onlycase with developmental delay as a primary clinical concern(group A) in which noncontrast MR imaging would havemissed a finding represented an incidental venous angioma.The three remaining cases involved developmental delayonly as a secondary clinical concern (group B). One case wasmeningitis that already was suspected clinically and easilyconfirmed by lumbar puncture, and in the other 2 cases theenhancement proved to be artifact. Group A had 4 cases withabnormal contrast enhancement (3% of group A), which representedincidental findings not related to the primary clinicalquestion (1 intracranial venous angioma, 1 scalp hemangioma,1 mastoiditis, and 1 Chiari malformation with a distortedchoroid plexus). Group B had 11 cases with abnormalenhancement (15% of group B) in which gadoliniumincreased the confidence and/or clarified the diagnosis in 7cases (3 neoplasms, 3 tuberous scleroses, and 1 neurofibromatosis1) and highlighted artifact or incidental findings inthe remaining 4. The radiologic findings of the 189 examinationswere distributed as follows: normal- 36%, congenitalabnormality- 25%, white matter/demyelinating abnormality-14%, hydrocephalus- 9%, stroke/ischemia- 6%, neoplasm-5%, other- 5%. The differences between groups Aand B were small except for the percentage of normal findings-43% vs 24%, respectively. The most common symptomto accompany developmental delay was seizures (28%of cases). Other prominent symptoms were neurologicdeficits, cranial nerve abnormalities, and failure to thrive.CONCLUSIONAdministration of gadolinium in the brain MR imaging workupof developmental delay as the primary clinical concern forchildren less than 2 years of age did not provide clinicallyuseful positive information in this series of examinations.KEY WORDS: Developmental delay, brain imaging, gadoliniumPaper 91 Starting at 4:12 PM, Ending at 4:20 PMFrequency of Incidental Subdural Hematoma afterDeliveryGriffiths, P. D.University of SheffieldSheffield, UNITED KINGDOMPURPOSESubdural hematoma are a common sequelae of cranialnonaccidental injury (NAI) in children. In such cases it is acommon legal defense to claim that the subdural hematomawas the result of trauma at delivery. In this study we haveused MR imaging to estimate the frequency of clinicallysilent subdural hematoma present in the first few days of life.We have correlated those findings with the mode of deliveryand the natural history of the subdural hematoma.MATERIALS & METHODSThis study was undertaken at the Jessop Wing of the RoyalHallamshire Hospital, Sheffield that has 6000 deliveries peryear. The study was approved by the South Sheffield EthicsCommittee and was performed with the full informed consentof the parent(s). All neonates were completely asymptomaticat the time of the MR examination and have shown nodevelopmental/neurologic problems on follow-up to 24
months. The MR examination was performed on a 0.2 T permanentmagnet system (Niche, Innervision Ltd.) after feedingwithout sedation or anesthesia, within 48 hours of delivery.Imaging consisted of SE T1-weighted images in thethree natural orthogonal planes and SE T2-weighted imagesin the coronal plane. The total occupancy time was in theorder of 20-25 minutes. The examinations were reported byan experienced neonatal radiologist (EW) and pediatric neuroradiologist(PDG) without prior knowledge of the mode ofdelivery. Neonates with subdural hematoma were reimagedevery 4 weeks until the hematoma had resolved.RESULTSOver the first 18 months of the study 111 neonates werestudied and had clinical follow-up to 24 months. Pathologyother than subdurals was seen in one case (cortical infarction).Subdural hematoma were seen in 9 cases with the followingrelationship to mode of delivery.Mode of delivery Total number Subbdurals Risk (%)Normal vaginal 49 3 6.1Caesarean 25 0 0Forceps only 4 0 0Ventouse only 13 1 7.7Failed ventouse to other method 20 5 20All of the subdural hematomas defined in the first week oflife had resolved on the first follow-up scan at 4 weeks.CONCLUSIONSubdural hematoma do occur asymptomatically with an estimatedfrequency of 8.1%. Delivery assisted by forceps andventouse have a much higher rate of subdurals. These abnormalitiesremain asymptomatic and have resolved radiologicallyby 4 weeks of age.KEY WORDS: Subdural hematomaPaper 92 Starting at 4:20 PM, Ending at 4:25 PMNeonatal Alexander Disease: Review and Comparison ofCT, MR Imaging, and MR Spectroscopy FindingsBurrowes, D. M. 1 · Nguyen, P. H. 2 · Joshi, A. 3 · Bassuk, A. 1 ·Larsen, M. 11Children’s Memorial Hospital, Chicago, IL, 2 University ofIllinois Chicago-Michael Reese Hospitals, Chicago, IL,3Northwestern Memorial Hospital, Chicago, ILPURPOSEAlexander disease is a progressive neurodegenerative disordercharacterized by rostral-to-caudal progression ofhistopathologic and MR findings. The presentation may bein three forms: infantile, juvenile, and adult. A small subsetof patients with the onset during the neonatal period areassociated with a severe disease course leading to death.Identification of this early onset is especially important asseizures and signs of increased intracranial pressure maymislead the diagnosis, and none of the clinical or neurologicfindings are pathognomonic.MATERIALS & METHODSWe report here on two cases of the neonatal form ofAlexander disease which presented at our institution over a20-year period, and review the radiologic findings, includingthe advances of MR imaging with MR spectroscopy, andcompare with CT findings, then and now.65RESULTSIn both cases the infants presented with similar nonspecificneurologic symptoms including poor feeding, weight loss,altered respirations with episodes of oxygen desaturation,hypotonia, increased head circumference, and seizures. CTfindings in both cases showed hydrocephalus, bilateral basalganglia hypodensities, bifrontal and temporal lobe whitematter hypodensities, and periventricular white matterhyperdensities. The more recent case also had characteristicMR findings including bifrontal and temporal white mattersignal abnormalities on T1 and T2, with abnormal signalchanges also seen in the basal ganglia. We also report a newfinding of serial increases in the lactate and choline peaksand decreases in the N-acetylaspartate peak at MR spectroscopy.Rosenthal fibers were identified in both cases, aunique identifier for this disease process. Finally, thehistopathologic analysis of the more recent case demonstrateda novel mutation in the glial fibrillary acidic protein(GFAP) gene, which has been associated recently with thisdisease.CONCLUSIONAlexander disease is a rare progressive lethal leukodystrophycharacterized by progressive failure of central myelinationand accumulation of Rosenthal fibers in astrocytes, predominantlyin the subpial, perivascular, and subependymalareas. The underlying defect is not known yet. Laboratoryinvestigations are not helpful in establishing the diagnosis,and biochemical markers do not exist. Previously, Alexanderdisease was diagnosed histopathologically, but there isagreement that the diagnosis can be made with typical clinicalsigns and neuroradiologic findings. Our review of thesetwo cases supports this conclusion.REFERENCES1. Bassuk AG, Joshi A, Burton BK, Larsen, MB, Burrowes DM,Stack C. Alexander Disease with Serial MRS and a NewMutation in the Glial Fibrillary Acidic Protein Gene.Neurology 2003;61:1014-10152. Trommer B, Naidich TP, Dal Canto M, McLone DG, LarsenMB. Noninvasive CT Diagnosis of Infantile AlexanderDisease: Pathologic Correlation. J Comput Tomogr1983;7(3):509-5163. Brockmann K, Hanefeld F, et al. Cerebral Proton MagneticResonance Spectroscopy in Infantile Alexander Disease. JNeurol 2003;250:300-3064. Van der Knapp MS, Powers JM, et al. Alexander Disease:Diagnosis with MR Imaging. AJNR Am J Neuroradiol2001;22:541-552KEY WORDS: Alexander disease, MR imaging, neurodegenerativeMonday
MondayPaper 93 Starting at 4:25 PM, Ending at 4:30 PMCortical Dysplasia in Nevus Linear SebaceousSyndrome: A Further CaseFernandes, A. L. 1 · Calado, E. 21S. Jose Central Hospital, Lisbon, PORTUGAL, 2 DonaEstefania Pediatric Hospital, Lisbon, PORTUGALPURPOSETo describe the MR findings, clinical evolution, and thechallenges in the diagnosis of the cranial abnormalities in acase of nevus linear sebaceous syndrome (NLSS).MATERIALS & METHODSWe followed until now a child who presented to the neuropediatricoutpatient clinic with seizures when he was 8months old. He is now 17 years old. The CT and MR scansand cerebral biospy results were checked. The literature wasreviewed.RESULTSThe NLSS is a rare neurocutaneous syndrome characterizedby epidermal nevi and cranial abnormalities such as skullasymmetry, hemimegalencephaly, and ventricular systemasymmetry. A spectrum of pathologic findings had beendescribed in the brain parenchyma: cortical dysplasia,glioneural hamartomas, neuronal heterotopias, micropoligyria.Very rarely the malformation involves frank tumorssuch as desmoplastic neuroepithelial tumor, pilocytic astrocytoma,and choroid plexus papiloma, according to the casesreported. Herein we report a case of a child who developedWest syndrome and left hemiparesis by the age of 8 months.MR imaging showed an abnormal high signal in the rightcortical and subcortical parietal and temporal regions on T2-weighted images. No significant surrounding edema normass effect were observed. The lesion didn’t enhance aftergadolinium. At that time a brain biopsy was inconclusivebetween two possible diagnosis: ganglioglioma and ballooncell dysplasia. By the age of 10 the appearance of the epidermicnevi lead to the definitive diagnosis of NLSS andboth clinical and radiologic evolution suggest associateddysplasia rather than tumor.CONCLUSIONIn this case only through the finding of the cutaneous lesionand the subsequent clinical and radiologic evolution did thefinal diagnosis lead to NLSS.KEY WORDS: Phakomatosis, dysplasia, nevus linear sebaceous66Monday Afternoon3:00 PM - 4:30 PMRoom 602 - 603(13) ELC Workshop B: PowerPoint forAdvanced UsersMonday Afternoon4:40 PM - 5:40 PMRoom 606 - 609— H. Christian Davidson, MD— Richard H. Wiggins, III, MD(14) ELC Lecture D: CD & DVDExpertise: What You Need to Know— Barton F. Branstetter, IV, MD
Monday Afternoon4:40 PM - 6:10 PMRoom 611 - 612(15) Treatment of CNS PediatricNeoplastic Disease: Response &Complications (ASPNR)(15a) Overview of Pediatric Central NervousSystem NeoplasmsRoger Packer, MD(15b) Neuroradiologists' Approach to Pediatric CNSNeoplasmsRobert A. Zimmerman, MD(15c) The Central Role of Neuroimaging inRadiation Therapy Planning: Delivery &Follow-upThomas E. Merchant, DO, PhD(15d) Role of Chemotherapy and MolecularTargeted Therapy for Brain TumorsRoger Packer, MD(15e) Complications of Radiation andChemotherapyLucy B. Rorke, MDModerators:Robert A. Zimmerman, MDLucy B. Rorke, MDOverview of Pediatric Central Nervous SystemNeoplasmsRoger Packer, MDLEARNING OBJECTIVESUpon completion of this session, participants will be able to:1) Recognize the incidence of childhood brain tumors2) Discuss the likelihood of long-term survival and quality ofsurvival of children with brain tumors3) Describe new approaches in the management of childhoodbrain tumorsPRESENTATION SUMMARYThe incidence and outcome of brain tumors occurring inchildhood will be addressed. Emphasis will be placed on theevent-free and overall survival rates of pediatric brain67tumors. Specifically, the improved survival rate for childrenwith medulloblastoma will be reviewed and factors associatedwith survival will be discussed. In addition, the role ofchemotherapy to potentially decrease radiation-associatedtreatment sequelae will be covered. In contrast, outcome forchildren with high-grade gliomas, especially brain stemgliomas, remains dismal and new approaches for managementnow are under evaluation. Pediatric infantile braintumors remain a highly problematic subset of pediatric braintumors. Over the past decade, a new subset of tumors, theatypical teratoid/rhabdoid neoplasm, has been characterizedand comprises a significant proportion of embryonal braintumors in children less than three years of age. Also, the highmorbidity associated with pediatric brain tumor “cure” willbe discussed.REFERENCES1. Packer RJ, Goldwein J, Nicholson HS, et al. Treatmentof Children with Medulloblastomas with Reduced-Dose Craniospinal Radiation Therapy and AdjuvantChemotherapy: Children’s Cancer Group Study. I1999;17:2127-21362. MacDonald TJ, Rood BR, Santi MR, et al. Advances inthe Diagnosis, Molecular Genetics and Treatment ofPediatric Embryonal CNS Tumor. The Oncologist2003;8:174-1863. Packer RJ, Biegel JA, Blaney S, et al. AtypicalTeratoid/Rhabdoid Tumor of the Central NervousSystem: Report on Workshop. J Ped Hematol/Oncol2002:24:337-342Neuroradiologists' Approach to Pediatric CNSNeoplasmsRobert A. Zimmerman, MDLEARNING OBJECTIVESUpon completion of this session, participants will be able to:1) Define an approach to the interpretation of pediatric neuroimagingstudies in the follow-up of brain tumor therapythat will lead to recognition of both radiation and chemotherapeuticcomplications2) Identify that therapeutic CNS complications of systemichematologic malignancy initiate diffusion imaging, MRVand MRA, in addition to routine MR imagingPRESENTATION SUMMARYThe information and experience derived over the past 20years of MR imaging have made the neuroradiologist comfortablewith the recognition and differential diagnosis ofprimary pediatric CNS neoplasms. The more recent additionof newer techniques, MRS and diffusion imaging, has furtherhelped in this regard. The frontier in imaging is now inthe response to treatment and the differentiation of complicationsof treatment, radiation and chemotherapeutic damagefrom recurrent or new primary neoplasms. This session is tofocus our attention on the problem, relative to the insight ourcolleagues in neurooncology, radiation therapy, and neuropathologycan provide, in better understanding the pathophysiologythat underlies the image.Monday
MondayThe Central Role of Neuroimaging in Radiation TherapyPlanning: Delivery & Follow-upThomas E. Merchant, DO, PhDDr. Merchant is Chief of Radiation Oncology at St. JudeChildren’s Research Hospital in Memphis, Tennessee. Hispractice is devoted exclusively to children and predominantlybrain tumors at the largest pediatric radiotherapy facilityin the Western Hemisphere. Dr. Merchant has practiced atSt. Jude since 1996. Prior to that time, he worked as a residentand later was an attending physician in the Departmentof Radiation Oncology at Memorial Sloan-Kettering CancerCenter in New York. At Memorial Sloan-Kettering CancerCenter, he was also an American Cancer Society ClinicalOncology Fellow. Dr. Merchant was trained as a nuclearengineer at the University of Michigan. He worked for theFrench Atomic Energy Commission prior to attending medicalschool at the Chicago College of Osteopathic Medicine.After medical school he was selected as a Fulbright Scholarto the Netherlands at the University of Utrecht. There hereceived his Ph.D., cum laude, in experimental pathology.The focus of Dr. Merchant’s current work is the applicationof advanced radiotherapy treatment technology in childrenwith brain tumors and the study of radiation-related CNSeffects. He has a laboratory devoted to investigating theeffects of radiation on cerebral vascular permeability andinflammation. His current trial of conformal radiation therapyfor localized primary CNS tumors in pediatric patientshas provided the necessary preliminary data for the nextgeneration of COG studies and is likely to enhance ourunderstanding of the clinical effects of radiotherapy on theCNS in children. Dr. Merchant has authored and coauthoredmore than 100 papers in the primary scientific literature.He also has contributed to numerous chapters andmeeting abstracts. He is actively involved in the CNS committeeof the Children’s Oncology Group. He is principleinvestigator for the COG ependymoma study and serves asthe radiotherapy coordinator for numerous other studies inCOG and the pediatric brain tumor consortium. Hisresearch has been funded by the American Cancer Society,the Genentech Foundation for Growth and Development,and the American Lebanese Syrian Associated Charities.LEARNING OBJECTIVESUpon completion of this session, participants will be able to:1) Recognize the current role of neuroimaging in radiationtherapy2) Identify the relationship between radiation dosimetry andside effects68PRESENTATION SUMMARYThree-dimensional neuroimaging is the basis for modernradiation therapy for childhood brain tumors and is requiredfor dose calculation as well as normal and target volume definitionand follow-up. Although MR-based dose calculationsare envisioned for the future, tissue density derived from CTdata is still used to discriminate tissue types and performdose calculations. The trend to target and treat smaller volumesmandates the incorporation of MR imaging in the treatmentplanning process to define the target volume (tumor ortumor bed), the region at risk for recurrence and normal tissuesto be spared in the development of the optimal treatmentplan. Tissue-specific imaging sequences and the use ofmultimodality imaging further refines target and normal tissuedefinitions and remains a strong area of research. Thetiming of imaging is pertinent for patients who receive radiationtherapy: changes in ventricle volume and the shift ofintracranial contents must be stable at the time of planning,imaging during radiation therapy has been found to be necessaryfor patients with tumor types prone to cyst enlargementand changes observed after radiation therapy may confoundinterpretation and response evaluation. Knowledge ofthe distribution of dose within specific volume of the braincan be used to predict for radiation-related treatment effects.Efforts to optimize treatment in the future will be based onrefining treatment dosimetry to spare functional elements ofthe brain.Role of Chemotherapy and Molecular Targeted Therapyfor Brain TumorsRoger Packer, MDLEARNING OBJECTIVESUpon completion of this session, participants will be able to:1) Define new approaches utilizing molecular targeted therapyfor childhood brain tumors2) Indicate new neuroradiographic techniques required inassessing the efficacy and toxicity of molecular targetedtherapy and antiangiogenesis drugs3) Recognize new delivery approaches utilized in managementof childhood brain tumors, including convection deliveryPRESENTATION SUMMARY:The changing treatment of childhood brain tumors will bediscussed. Over the past decade, there has been an explosionin the understanding of childhood brain tumors, especiallythe molecular genetic changes associated with the developmentof brain tumors. These molecular genetic alterationsare being used already to stratify patients into risk groups.Molecular targeted therapy is being incorporated into pediatricbrain tumor trials utilizing drugs that interrupt with cellsignaling pathways and block cell surface growth factorreceptors. In addition, antiangiogenesis drugs are in clinicaltrials. These therapies, which often are used as adjuncts tostandard chemotherapy and radiation therapy, require carefulneuroradiographic assessment for both efficacy and toxicity.Early experience with antigrowth factor receptor agents utilizedwith radiotherapy suggests an increased incidence ofintratumoral hemorrhage. The neuroradiographic needs forthese types of studies will be addressed. In addition, newdrug delivery systems are being investigated in pediatrics.Neuroradiographic assessment will be critical in the assessmentof the utility of such approaches.REFERENCES1. Pomeroy SL, Tamayo P, Gaasenb EEK, et al. Prediction ofCentral Nervous System Embryonal Tumor Outcome Basedon Gene Expression. Nature 2002;415:436-4422. MacDonald TJ, Brown KM, Laffleur B, et al. ExpressionProfiling of Medulloblastoma: PDGFRA and theRAS/MAPK Pathway as Therapeutic Targets for MetastaticDisease. Nature Genetics 2001;29:143-149
69Complications of Radiation and ChemotherapyLucy B. Rorke, MDLEARNING OBJECTIVESUpon completion of this session, participants will be able to:1) Identify treating children with CNS tumors that use ofradiation and chemotherapy is simultaneously both beneficialand harmful2) Recognize treating children with CNS tumors that use ofradiation and chemotherapy can damage the child in a numberof specific ways quite different from the direct effects ofthe tumor itselfPRESENTATION SUMMARYThere are four major morphologic complications that mayoccur following radiation/chemotherapy for CNS tumors inchildhood. These include a variety of vascular lesions, tissuenecrosis, changes in histologic features of the tumor anddevelopment of a second tumor years after treatment.Damage to the vessels may take the form of necrosis, sclerosiswith our without calcification, aneurysm formation orabnormal proliferation. Necrosis is typically bland and attimes undergoes calcification. Changes in the histology aresometimes dramatic and occasionally involve complete transformationof original diagnostic features to a partial or completechange in phenotype. This generally involves an overgrowthof one cell type that was a component of the originaltumor. For example, one child had an ependymoma thatunderwent transformation into a primitive neuroectodermaltumor with ependymal differentiation. Another with a complexAT/RT at biopsy, was composed solely of bizarre rhabdoidcells postmortem. Probably most important is the genesisof a second tumor years after apparent cure of the primaryneoplasm. These vary in type, although anaplastic astrocytomaand glioblastoma multiforme are the most common.Monday Afternoon4:40 PM - 6:10 PMBallroom 6 B/C(17) Advanced Imaging Seminar -Diffusion(17a) Overview of Physiologically SpecificNeuroimagingMichael W. Weiner, MD(17b) Basics and Clinical Applications of Diffusion-Weighted ImagingP. Ellen Grant, MD(17c) Diffusion Tensor Imaging Techniques andTerminologyThomas E. Conturo, MD,PhD(17d) Diffusion Tensor Imaging Fiber TrackingPratik Mukherjee, MD, PhDModerators:Timothy P.L. Roberts, PhDHoward A. Rowley, MDMondayMonday Afternoon4:40 PM - 6:10 PMBallroom 6 A(16) Stump the Stars (ASHNR)Moderator:Patricia A. Hudgins, MDSuresh K. Mukherji, MDH. Ric Harnsberger, MDDavid M. Yousem, MDOverview of Physiologically Specific NeuroimagingMichael W. Weiner, MDMichael W. Weiner, M.D. is the Director of the MagneticResonance Unit at the Veteran's Administration MedicalCenter in San Francisco, and Professor of Radiology,Medicine, Psychiatry and Neurology at the University ofCalifornia San Francisco. He has been performing researchsince 1968 and was one of the first scientists to obtain MRspectroscopy (MRS) spectra from an intact animal, and haspublished over 310 peer-reviewed journal publications, ofwhich 250 have been clinical MR imaging/MRS studies.Since his early MRS studies showing reduced N-acetylaspartate in epilepsy and AD, he has focused on the use ofMR imaging/MRSI to characterize effects of aging anddementia and other neurodegenerative diseases. Althoughhis early work on AD focused on MRS, he and his coworkerssubsequently used MR imaging tissue segmentation and hippocampalvoluming alone and together with MRS to investigatechanges associated with normal aging, white matterlesions, vascular and mixed dementia, and frontotemporaldementia in addition to AD. More recently, he has usedstructural MR imaging to investigate rates of hippocampal,entorhinal cortex, and whole brain tissue change in normalaging, effects of cerebrovascular disease, and AD.
MondayLEARNING OBJECTIVESUpon completion of this session, participants will be able to:1) Identify the principles of arterial spin labeled MR imaging2) Describe the information derived from MRSI3) Distinguish between the advantages and disadvantages ofMR imaging at fields above 1.5 T4) Define the changes which occur in neurodegenerative diseases5) Define the changes which occur in epilepsyPRESENTATION SUMMARYThe role of structural MR imaging, perfusion MR imaging,and MR spectroscopy to measure function, physiology, andmetabolism will be addressed. Emphasis will be on the useof these techniques to determine effects of various neurodegenerativediseases. Specifically, various brain diseases canbe identified largely by the regionality of changes, ratherthan the specific nature of the change. Examples from thepresenters research on Alzheimer's disease and other dementias,cerebrovascular disease, and eplipsy will be presented.Finally, the advantages of MR imaging at fields greater than1.5 T will be discussed.REFERENCES1. Schuff N, Capizzano AA, Du AT, Amend DL, O'Neill J,Norman D, et al. Different Patterns of N-AcetylaspartateLoss in Subcortical Ischemic Vascular Dementia and AD.Neurology 2003;61(3):358-3642. Boxer AL, Rankin KP, Miller BL, Schuff N, Weiner MW,Gorno-Tempini M-L, et al. Cinguloparietal AtrophyDistinguishes Alzheimer's Disease from Semantic Dementia.Arch Neurol 2003;60:949-9563. Du AT, Schuff N, Zhu XP, Jagust WJ, Miller BL, Reed BR, etal. Atrophy Rates of Entorhinal Cortex in AD and NormalAging. Neurology 2003;60(3):481-4864. Mueller SG, Suhy J, Laxer KD, Flenniken DL, Axelrad J,Capizzano AA, et al. Reduced Extrahippocampal NAA inMesial Temporal Lobe Epilepsy. Epilepsia 2002;43(10):1210-12165. Hsu YY, Schuff N, Amend DL, Du A-T, Norman D, Chui HC,et al. Quantitative Magnetic Resonance Imaging DifferencesBetween Alzheimer Disease With and Without SubcorticalLacunes. Alzheimer Disease and Associated Disorders2002;16(2):58-6470PRESENTATION SUMMARYThis talk will focus on the practical clinical applications ofdiffusion-weighted imaging (DWI) and the interpretation ofDWI findings in a wide spectrum of disorders seen in clinicalpractice when imaging both children and adults. Thebasic concepts of diffusion-weighted imaging will bereviewed briefly with comments on b value optimization andeddy current corrections. Although DWI first gained popularityin the diagnosis of hyperacute and acute stroke, thereare many clinical situations in which bright DWI and lowapparent diffusion coefficient (ADC) lesions are seen. Thepossible etiologies and differential diagnosis of brightDWI/low ADC lesions will be reviewed and a number ofclinical examples in each category provided. In general, itappears that decreased ADC can be associated with 1)Failure or dysfunction of cellular energy metabolism, 2)Some types of myelin vacuolization/activedemyelination/axonal swelling, 3) High cellular density or 4)Turbid or viscous material. Unusual cases with apparentADC reversal and with delayed onset of ADC decrease willbe discussed.Diffusion Tensor Imaging Techniques and TerminologyThomas E. Conturo, MD, PhDDr. Conturo received his bachelor's degree in chemistry andbiochemistry at the University of Pennsylvania in 1981. Hethen received his M.D. and Ph.D. (in biophysics) fromVanderbilt University in 1989, doing his Ph.D. work in MRIphysics. He did a residency in Diagnostic Radiology atJohns Hopkins from 1989-1993, including an NIH NCI postdoctoralfellowship. He then became Assistant Professor ofRadiology at Mallinckrodt Institute of Radiology atWashington University in St. Louis in 1993, and thenAssociate Professor in 1999. He previously has held an<strong>ASNR</strong> Basic Science Research Fellowship, and is board-certifiedin Diagnostic Radiology.LEARNING OBJECTIVESUpon completion of this session, participants will be able to:1) Review diffusion tensor imaging (DTI) terminology2) Describe the various parameters that can be measured byDTI, and their image appearance3) Determine various DTI anisotropy parameters and theiruse4) Define new variations of diffusion measurements thathave neuroradiologic potentialBasics and Clinical Applications of Diffusion-WeightedImagingP. Ellen Grant, MDLEARNING OBJECTIVESUpon completion of this session, participants will be able to:1) Identify the types of disorders associated with low ADC2) Examine the clinical situations where regions with decreasedADC return to normal with minimal to no tissue destruction3) Illustrate and assess the limitations of DWI and ADC indetecting cell deathDiffusion Tensor Imaging Fiber TrackingPratik Mukherjee, MD, PhDLEARNING OBJECTIVESUpon completion of this session, participants will be able to:1) Identify the physical basis for diffusion tensor imaging(DTI) fiber tracking and review the practical considerationsinvolved in acquiring DTI images suitable for fiber tracking2) Define the potential clinical applications of diffusion tensorimaging (DTI) fiber tracking as well as its current limitations3) Determine the strengths and weaknesses of the differenttechniques for performing DTI fiber tracking
71PRESENTATION SUMMARYDiffusion tensor imaging (DTI) is an area of burgeoningresearch in both technical refinements and clinical applications.Diffusion MR images reflect information on a microscopicspatial scale, allowing researchers and clinicians anunprecedented ability to noninvasively probe tissue microarchitecture.White matter tracts in the human brain that havefibers coherently organized into parallel bundles exhibit diffusionanisotropy: water diffusion along the direction of thefiber tracts is greater than that perpendicular to the fibertracts. With DTI, the fiber orientation within these whitematter tracts can be determined; hence, fiber tractographybased on DTI can reveal the three-dimensional white matterconnectivity of the human brain. In this presentation, currenttechniques for performing DTI fiber tracking are examined,broadly categorized into "streamline" and "probabilistic"methods. The present limitations of each of these methodsalso are considered, as well as the issue of validating theresults of fiber tracking. Examples are provided of the normalanatomy of the human brain delineated with DTI tractography,such as the separation of associational, projectional,and commissural white matter tracts. Methods for quantifyingthe results of DTI fiber tracking are introduced, withapplications that include the quantitative assessment ofwhite matter development in newborns and children. Finally,areas of ongoing clinical research are reviewed, includingthe presurgical mapping of white matter pathways in combinationwith functional localization techniques such as functionalMR imaging (fMRI), magnetoencephalography(MEG), and intraoperative cortical stimulation.MondayMonday Afternoon5:40 PM - 6:10 PMRoom 606 - 609(18) ELC Roundtable: Q & A withToday’s SpeakersBarton F. Branstetter, IV, MDH. Christian Davidson, MDJohn L. Go, MDGregory L. Katzman, MDDavid S. Martin, MDGerard J. Muro, MDHervey D. Segall, MDRichard H. Wiggins, III, MD
MondayNotes:
73NOTE ABOUT SCANNED IMAGES: Scanned images are included in theproceedings book. Some submitted images were reduced during the printing process, therebydecreasing clarity. The images as originally submitted can be viewed within the abstract on the<strong>ASNR</strong> website at www.asnr.org/<strong>2004</strong>.Tuesday Morning8:00 AM - 9:30 AMRoom 606 - 609(19) Tumors (ASPNR)(19a) Pediatric Brain Tumor Imaging Protocols andDiffusion Imaging Applications— Tina Y. Poussaint, MD(19b) Usefulness of MR Spectroscopy in PediatricBrain Tumors— Kim M. Cecil, PhD(19c) MR Perfusion and Pediatric Brain Tumors— Soonmee Cha, MDModerators:Tina Y. Poussaint, MDGilbert Vezina, MDvivo characterization of rate and direction of white matter diffusion.Such information is useful for presurgical planning orcoregistration of tractography data with radiosurgical planningand functional MR data (6). Fractional anisotropy using DTImay prove helpful for assessment of treatment-induced whitematter injury in children (7).REFERENCES1. Kono K, Inoue Y, Nakayama K, et al. The Role of Diffusion-Weighted Imaging in Patients with Brain Tumors. AJNR AmJ Neuroradiol 2001;22:1081-10882. Mardor Y, Roth Y, Lidar Z, et al. Monitoring Response toConvection-Enhanced Taxol Delivery in Brain TumorPatients Using Diffusion-Weighted Magnetic ResonanceImaging. Cancer Res 2001;61:4971-49733. Gauvain KM, McKinstry RC, Mukherjee P, et al. EvaluatingPediatric Brain Tumor Cellularity with Diffusion-TensorImaging. AJR Am J Roentgenol 2001;177:449-4544. Ross BD, Chenevert TL, Rehemtulla A. Magnetic ResonanceImaging in Cancer Research. Eur J Cancer 2002;38:2147-21565. Maier SE, Bogner P, Bajzik G, et al. Normal Brain and BrainTumor: Multicomponent Apparent Diffusion CoefficientLine Scan Imaging. Radiology 2001;219:842-8496. Witwer BP, Moftakhar R, Hasan KM, et al. Diffusion-TensorImaging of White Matter Tracts in Patients with CerebralNeoplasm. J Neurosurg 2002;97:568-5757. Khong PL, Kwong DL, Chan GC, et al. Diffusion-TensorImaging for the Detection and Quantification of Treatment-Induced White Matter Injury in Children withMedulloblastoma: A Pilot Study. AJNR Am J Neuroradiol2003;24:734-740TuesdayPediatric Brain Tumor Imaging Protocols and DiffusionImaging ApplicationsTina Y. Poussaint, MDLEARNING OBJECTIVESUpon completion of this session, participants will be able to:1) Develop standardized imaging protocols for pediatricbrain tumors2) Apply diffusion imaging of children with brain tumorsPRESENTATION SUMMARYNeuroimaging protocols for pediatric brain tumors will bereviewed and emphasized. The role and requirements of standardizedbrain imaging protocols through multicenter consortiawill be addressed. The added value of MR diffusion imagingin pediatric brain tumors will be covered. Diffusion imagingusing echo-planar or line scan techniques has been helpfulin the assessment of tumor cellularity, classification of tumorgrade, and assessing response to therapy (1-4). Diffusionimaging of brain tumors using multi-b factors especially in thehigh range of b factors may play a future role in distinguishingedema from tumor (5). Diffusion tensor imaging providesvisualization of fiber bundle direction and integrity with inUsefulness of MR Spectroscopy in Pediatric BrainTumorsKim M. Cecil, PhDLEARNING OBJECTIVESUpon completion of this session, participants will be able to:1) Recognize key metabolic features useful for discriminatingpediatric neoplasms2) Describe how to protocol the spectroscopic examination3) Integrate spectroscopic interpretation with conventionaland advanced imaging findingsPRESENTATION SUMMARYThis session will familiarize and update the neuroradiologistwith the usefulness of MR spectroscopy (MRS) in assessingpediatric brain tumors. MR spectroscopy can aid with the initialdiscrimination of benign vs malignant pediatric neoplasms.In this session, we will identify the metabolitechanges useful for discriminating tumor from other pathologies(i.e., dysplasia) as well as tumor grade classification (i.e.,low grade glioma). As some brain regions are surgically inaccessible,such as the brainstem, a noninvasive metabolic
Tuesday"biopsy" provided by MRS is especially useful in the pediatricpopulation. Planning surgical and/or radiation therapiesrequires knowledge of the tumor grade and the extent of themalignancy. Sampling with multiple echo times affords usefulinformation for grading the tumor. MR spectroscopic imagingprovides a sensitive method for detecting the extent of tumorinvolvement. MR spectroscopy when combined withadvanced imaging techniques such as diffusion and perfusion,enables higher diagnostic specificity. The integration of spectroscopyand advanced imaging is especially important in thefollow-up of treated brain tumors. While no one technique is100% sensitive and specific, the combination of spectroscopicand imaging techniques are continually improving our abilityto discriminate tumor from treatment effects.MR Perfusion and Pediatric Brain TumorsSoonmee Cha, MDLEARNING OBJECTIVESUpon completion of this session, participants will be able to:1) Recognize basic technique and clinical application of dynamicsusceptibility contrast-enhanced perfusion MR imaging2) Assess potential added value of perfusion MR imaging inevaluating pediatric patients presenting with intracranialmass lesion3) Describe pathophysiologic and biologic correlate of perfusionMR imaging.4) Assess pitfalls and limitations of perfusion MR imagingPRESENTATION SUMMARYThe basic principle and clinical application of dynamic susceptibilitycontrast-enhanced perfusion MR imaging in pediatricbrain tumors will be presented. Emphasis will be on theutility of perfusion MR imaging in evaluating pediatricpatients with intracranial mass lesion and in differentiatingbrain neoplasm from tumor-mimicking lesion such asabscess, developmental dysplasia, and demyelinating disease.Perfusion MR imaging protocol, image processing, andquantitative analysis method will be reviewed briefly. Theadded value of perfusion MR imaging in assessing tumortype and grade, angiogenesis, and permeability will be discussed.Perfusion MR imaging features of low-grade tumorswith unique vascular morphology such as juvenile pilocyticastrocytoma, ganglioglioma, and dysembryoplastic neuroepithelialtumor will be introduced. Potential pitfalls and limitationsof perfusion MR imaging, especially in imaging posteriorfossa tumors in pediatric patients, will be addressed.REFERENCES1. Rosen BR, Belliveau JW, Vevea JM, Brady TJ. PerfusionImaging with NMR Contrast Agents. Magn Res Med1990;14:249-2652. Cha S, Knopp EA, Johnson G, Wetzel SG, Litt AW, Zagzag D.Intracranial Mass Lesions: Dynamic Contrast-EnhancedSusceptibility- Weighted Echo-Planar Perfusion MRImaging. Radiology 2002;223:11-293. Chang YW, Yoon HK, Shin HJ, Roh HG, Cho JM. MRImaging of Glioblastomain Children: Usefulness ofDiffusion/Perfusion-Weighted MRI and MR Spectroscopy.I2003;33:836-8424. Pollack IF. Pediatric Brain Tumors. Semin Surg Oncol1999;16:73-9074Tuesday Morning8:00 AM - 9:30 AMBallroom 6 B/C(20) MDCT in the Evaluation ofSinonasal Disease (ASHNR)(20a) Sinus Inflammatory Disease— Yoshimi Anzai, MD(20b) Sinus NeoplasmsSinus Inflammatory DiseaseYoshimi Anzai, MD— C. Douglas Phillips, MD(20c) Developmental/Congenital LesionsModerators:— Anton N. Hasso, MD, FACRPatricia A. Hudgins, MDH. Ric Harnsberger, MDLEARNING OBJECTIVESUpon completion of this session, participants will be able to:1) Describe normal anatomy of paranasal sinuses andanatomical variations2) Review sinus drainage patterns and imaging features ofsinus inflammatory disease3) Define key imaging features to assist endoscopic sinussurgery4) Describe various types of endoscopic sinus surgery andpost-op CT findingsPRESENTATION SUMMARYCT has long been an imaging modality of choice for sinusinflammatory disease. There are 3 types of protocols in ourinstitution depending on clinical indications. Screening sinusCT is a quick and low-cost evaluation of sinuses and widelyperformed to diagnose or exclude acute sinusitis. Fine cutcoronal CT is preferred for preoperative evaluation of chronicsinusitis by primarily ENT surgeons. High-resolution volumetricacquisition with multiplanar reconstruction isemployed for intraoperative assistant for endoscopic sinussurgery. The recent advent of multidetector CT technologyprovides greater scanning speed and routine multiplanar displaycapability. Paranasal sinuses have fairly complex anatomywith wide range of variation, as the sinus is considered"finger printing" of head and neck structures. Detailedknowledge of 3-dimensional anatomies of paranasal sinusesis essential to assist functional endoscopic sinus surgery as
well as evaluate postop patients with recurrent or persistentsymptoms. We will discuss the following materials in thislecture. 1. Normal sinus anatomy and anatomical variations.2. Sinus drainage patterns. 3. Imaging features of sinusinflammatory disease: a. Acute bacterial sinusitis, b. Chronicsinusitis, c. Allergic sinusitis, d. Fungal sinusitis, e.Granulomatous disease. 4. Imaging findings to assist FESS(functional endoscopic sinus surgery): a. Types of FESS. b.What surgeons look for. c. Impact of CT on surgeon's treatmentdecisions for chronic sinusitis. 5. Postop endoscopicsinus surgery.Sinus NeoplasmsC. Douglas Phillips, MDLEARNING OBJECTIVESUpon completion of this session, participants will be able to:1) Identify the more common sinus neoplasms seen in anactive clinical practice2) Assess reasonable imaging protocol to evaluate the patientwith known or suspected sinus neoplasia3) Discuss TNM tumor staging for sinus neoplasia, in lightof the imaging evaluation in patients with sinus neoplasiaPRESENTATION SUMMARYSinus neoplasia is a constant concern of the imaging physician,as the clinical signs and symptoms of benign andmalignant sinus disease are the same, and both may presenta similar appearance on an imaging study. A careful clinicalexam and judicious biopsies are often the best diagnosticmethod. The imaging evaluation of the patient with sinusneoplasia should be focused on depiction of the extent of disease;involvement of the sinus cavities in distinction fromobstructive sinus disease, invasion of contiguous structures,and perineural or lymphatic tumor spread. Squamous cellcarcinoma is the model for aggressive neoplasia of the sinuses,and causes irregular bone destruction and may invadeadjacent structures. Minor salivary gland neoplasia is a moreuncommon form of sinus malignancy, as are melanoma,lymphoma, and spindle cell tumors. Within the superiornasal cavity, the wider variety of cell types lead to otherunusual sinus neoplasms, such as esthesioneuroblastoma andsinonasal undifferentiated carcinoma. The imaging evaluationof these lesions typically will include both MR imagingand CT. Nodal metastases may occur later or with advanceddisease. Involvement of the orbit, cavernous sinuses, andintracranial compartment indicate advanced disease andhave poor prognoses. Benign neoplasms of the sinonasalcavities include a variety of polyps and papillomas, bony andfibrous lesions, and unusual tumors such as juvenile angiofibromas.These lesions also are accompanied by bonychange, and the presence of or absence of bone involvementcannot accurately categorize benign vs malignant disease. Arepresentative sample of both benign and malignant sinuslesions will be depicted and discussed and a proposed imagingprotocol for the complete evaluation of these patientswill be discussed. An approach to the differential diagnosesof these lesions also will be presented. The TNM tumor stagingfor sinus malignancy also will be discussed.75Developmental/Congenital LesionsAnton N. Hasso, MD, FACRLEARNING OBJECTIVESUpon completion of this session, participates will be able to:1) Recognize that imaging of midface congenital anomalieswill help in classifying and differentiating lesions2) Indicate frontonasal dysplasias are often associated withintracranial anomalies. Such lesions should be indentified onimaging studies3) Differentiate between developmental fibro-osseous lesionsof the misface and similar sinonasal neoplasmsPRESENTATION SUMMARYWhile various CT techniques (MD CT, 3D CT) are desirablein the evaluation of congenital and developmental anomaliesin infants and young children, there is an essential role forMR imaging whenever there are related intracranial anomalies.This presentation will focus on describing and classifyingthe known cranio-facial anomalies that are commonlymanifest in the sinonasal cavities and mid-face.Cephaloceles (encephaloceles, meningoencephaloceles)may be located in the mid-face and anterior cranial fossa.These are classified as sincipital, basal, or associated withcranioschisis. Cases with cranioschisis have associatedanomalies of the mid-face that together form the mediancleft face syndrome, typically with clefting of the nose, premaxilla,and hard palate. Midline nasal masses include nasaldermoid sinus or cysts, epidermoid tumors, or nasal gliomas.Three varieties of choanal atresia may be seen--pure bony,mixed bony-membranous, and pure membranous atresia.The congenital heart defects, choanal atresia, retardedgrowth and development, hypogenitalism, and aural anomalies(CHARGE) association should be suspected in infantspresenting at birth with choanal atresia. CT is the most usefultool for the diagnosis of choanal atresia. Hypoplasia ofthe maxillary sinuses may be seen in association with otherfacial anomalies, including the Treacher-Collins syndrome(mandibulofacial dysostosis), Golderhar syndrome (hemifacialmicrosomia) and the Pierre Robin syndrome.REFERENCES1. Suwanwela C, Suwanwla N. A Morphological Classificationof Sincipital Encephalomeningoceles. J Neurosurg1972;36:201-2112. DeMyer W. The Median Cleft Face Syndrome: DifferentialDiagnosis of Cranium Bifidum Occultum, Hypertelorism,and Median Cleft Nose, Lip and Palate. Neurology1967;17:961-9713. Sedano HO, Cohen MM Jr, Jirasek J, et al. FrontonasalDysplasia. J Pediatr 1970;76:906-9134. Castillo M. Congenital Abnormalities of the Nose: CT andMR Findings. AJR Am J Roentgenol 1994;162:1211-12175. Paller, AS, Pensler JM, Tadinori T. Nasal Midline Masses inInfants and Children: Dermoids, Encephaloceles andGliomas. Arch Derm 1991;127:362-3666. Kennard CD, Rasmussen JE. Congenital Midline NasalMasses: Diagnosis and Management. J Dermatol Surg Oncol1990;16:1025-10367. Zeitouni AG, Shapiro RS. Congenital Anomalies of the Noseand Anterior Skull Base. In: Tewfik TL, Der Kaloustian VM,eds. Congenital Anomalies of the Ear, Nose, and Throat. NewYork, NY:Oxford University Press;1997:189-2008.8. Hudgins P, Jacobs IN, Castillo M. Pediatric Airway Diseases.In: Som PM, Curtin HD, eds. Head and Neck Imaging. 3rd ed.St. Louis, MO: Mosby;1996:545-611.Tuesday
TuesdayTuesday Morning8:00 AM - 9:30 AMRoom 602 - 603(21) ELC Workshop A: PowerPoint forthe NoviceTuesday Morning8:00 AM - 12:00 PMRoom 302Tuesday Morning10:15 AM - 11:45 AMBallroom 6 B/C(23a) Adult Brain: Epilepsy(Scientific Papers 94 - 105)See also Parallel Sessions(23b) Head & Neck: General(23c) Pediatrics: General, Functional, and VascularImaging(23d) Pediatrics: General and LeukoencephalopathyModerators:Jacqueline A. Bello, MDWilliam P. Dillon, MD— David S. Martin, MD— John L. Go, MD(22) <strong>ASNR</strong> Grant Writing Seminar:Practical Tips on Getting Your GrantFunded - Part II— Janet S. Rasey, PhDSee Session 5 on Monday, June 7 for LearningObjectives and Presentation Summary.76Paper 94 Starting at 10:15 AM, Ending at 10:23 AMDiffusion Tensor Imaging and High Resolution BrainMR Imaging: A Comparison Study Lateralizing theSeizure Focus in Temporal Lobe EpilepsyFaro, S. H. 1 · Mohamed, F. 1 · Khaled, K. J. 1 · Williams, M. 1· Yazeji, M. S. 2 · Assaf, B. 21Drexel University, Philadelphia, PA, 2 University of Illinois,Peoria, ILPURPOSEDiffusion tensor imaging (DTI) is a noninvasive techniquethat can assess the microstructure of cerebral tissue.Increased diffusivity in the hippocampus (HC) during DTImeasurements has been demonstrated to correlate with theseizure focus in TLE. High resolution brain MR imaging isan established technique for detecting hippocampal atrophyor abnormality and lateralizing the seizure focus. However,the relative contribution of both techniques in lateralizing theepileptogenic temporal lobe is still unknown. The purpose ofthis study was to compare the relative value of DTI of thehippocampal formation and high resolution brain MR imagingin lateralizing the seizure focus in temporal lobe epilepsy(TLE).MATERIALS & METHODSWe performed DTI and high resolution brain MR imaging ona total of 23 TLE patients. We acquired DTI by collectingdiffusion-weighted images along six different directionswith a b value of 1000 sec/mm2 as well as an image acquiredwithout diffusion weighting (b = 0 sec/mm2). Seventeen3mm slice thickness, coronal slices covering the temporallobes were imaged using a 1.5 T scanner. The imagingparameters included: TR = 6000 ms, TE = 100 ms, FOV =240, 98 x 128, and 4 acquisitions. We obtained the diffusivity(trace D) and fractional anisotropy (FA) values from symmetricalvoxels sampling the head of the hippocampus bilaterally.High resolution structural T2-weighted inversionrecovery images were acquired also at the same locations.Imaging parameters include: TR = 5500 ms, TE = 90 ms,FOV = 240 mm, 260 x 512, T1 = 150 ms, and 1 acquisition.We determined abnormal DTI measurements by comparingHC diffusivity and FA values to those of normal subjects anddetermined abnormal high resolution brain MR imaging inthe entire group of patients. Subsequently, we correlated DTIand high resolution MR imaging with the epileptogenic temporallobe as determined by the clinical localization.RESULTSDiffusion tensor imaging was abnormal in 16 of 23 patients(sensitivity 70%) and accurately lateralized the epileptogenicregion in all 16 cases while high resolution brain MRimaging was abnormal in 17 of 23 patients (sensitivity 78%)and lateralized the epileptogenic temporal lobe in all 17patients. Three patients with negative high resolution brainMR imaging demonstrated abnormal DTI measurementswhile the three other patients demonstrated negative highresolution MR imaging and negative DTI studies.CONCLUSIONThere is a high concordance between high resolution brainMR imaging and DTI in detecting the epileptogenic temporallobe in TLE. Diffusion tensor imaging is a useful techniquethat may play an additive value to high resolution MR
imaging in presurgical evaluation of TLE. In addition, bothtechniques may play a complementary role in detecting theseizure focus in TLE.KEY WORDS: Diffusion tensor imaging, temporal lobeepilepsyPaper 95 Starting at 10:23 AM, Ending at 10:31 AMApparent Diffusion Coefficient of Hippocampus inMesial Temporal Lobe EpilepsyKanodia, A. K. · Gaikwad, S. B. · Mishra, N. K. · Garg, A.· Tripathi, M. · Padma, M. V. · Chandra, P. S. · Sharma, M.C. · Gupta, V.All India Institute of Medical SciencesNew Delhi, INDIAPURPOSETo evaluate apparent diffusion coefficient (ADC) values inhippocampus in MR imaging positive and negative patientsof mesial temporal lobe epilepsy.MATERIALS & METHODSApparent diffusion coefficient values were calculated in 8controls (22-50 years, mean 29.5 years, 3 males and 5females) and 30 patients of mesial temporal epilepsy.Apparent diffusion coefficient values were calculated using3 mm sections along the long axis of hippocampus using 3regions of interest from anterior, middle, and posterior parts.Patients were divided into 3 groups: Unilateral MR imagingpositive (Group 1) (15 patients including 12 males and 3females, 12-43 years, mean 20.6 years), bilateral MR imagingpositive (Group 2) (4 patients, all males, 14-23 years,mean 17 years) and MR imaging negative (Group 3) (11patients, 9 males and 2 females, 8-37 years, mean 24.5years). Normal range of ADC values was taken as mean ±2SD of the control group. Group and individual comparisonswere performed.RESULTSSignificantly high ADC values were obtained on ipsilateralside in Group 1 and 2 and on contralateral side in Group 2.Apparent diffusion coefficient values in MR imaging negativegroup were not increased significantly. In Group 1, ADCvalues were increased on ipsilateral side only in 9 patientsand on both sides in 5 patients (ipsilateral > contralateral). In1 patient, normal values were seen on both sides (contralateral> ipsilateral). In Group 2, increased ADC values wereseen on both sides in all patients (ipsilateral > contralateral).In Group 3, ADC values were increased on ipsilateral, contralateral,and both sides in 3, 2, and 2 patients, respectively.In patients with increased ADC values on both sides, contralateraland ipsilateral values were higher than other side in1 patient each. Normal ADC values were seen in 4 patientsin Group 3.CONCLUSIONApparent diffusion coefficient values are helpful in lateralizingthe side of seizure focus in unilateral and bilateral MRimaging positive patients of mesial temporal lobe epilepsy.In MR imaging negative patients, it may produce contradictoryresults and has low sensitivity.KEY WORDS: Diffusion, epilepsy, hippocampus77Paper 96 Starting at 10:31 AM, Ending at 10:39 AMQualitative Evaluation of Glx (Glutamate + Glutamine)Ratios with Other Metabolites in Evaluation of MesialTemporal SclerosisKanodia, A. K. · Gaikwad, S. B. · Mishra, N. K. · Garg, A.· Padma, M. V. · Tripathi, M. · Gupta, V. · Chandra, P. S. ·Sharma, M. C.All India Institute of Medical SciencesNew Delhi, INDIAPURPOSERatios of glx (glutamine + glutamate) with other metabolitesto lateralize seizure focus in mesial temporal lobe epilepsy.MATERIALS & METHODSWe performed qualitative MRS using single-voxel PRESS(point resolved spectroscopy) with short TE (TE = 30 ms) in33 patients of mesial temporal lobe epilepsy and 10 controlsusing 2 x 2 x 2 cm voxels. Patients were divided in 3 groups:Group 1 (Unilateral MR imaging Positive - 14 patients),Group 2 (Bilateral MR imaging positive - 5 patients) andGroup 3 (MR imaging negative - 10 patients). Patients suspectedto be having MTS-based on clinicalcriteria/VEEG/SPECT findings with localization towardsone side were included in the study. Group and individualcomparisons were performed. Normal values were taken asMean ± 2SD of the control group.RESULTSGlx/NAA ratio was significantly high in all the 3 groups onthe ipsilateral side with significantly high side-to-side differencebetween 2 sides in all the 3 groups. Glx/Cr ratio wasalso significantly high in all 3 groups on the ipsilateral sidebut the side-to-side difference was not significant. Theincrease in (Cho+Cr)/NAA ratio was not significant in any of3 groups. In Group 1, Glx/NAA, Glx/Cr and (Cho+Cr)/NAAratios were increased on ipsilateral side only in 7, 5, and 6patients, respectively. By combining the 3 ratios, 11 patientshad increase in 1 or more ratios on the ipsilateral side.Increased side-to-side difference in Glx/NAA, Glx/Cr and(Cho+Cr)/NAA ratios were seen in 13, 5, and 6 patients,respectively. In Group 2, 2 patients each had increasedGlx/NAA ratio on the ipsilateral side only and on both sides.Glx/Cr ratio was increased on ipsilateral and contralateralside in 3 and 1 patient, respectively. (Cho+Cr)/NAA ratiowas increased in ipsilateral, contralateral and both sides in 1patient each. Increased side-to-side difference in Glx/NAA,Glx/Cr, and (Cho+Cr)/NAA were seen in 5, 2, and 1 patients,respectively. In Group 3, Glx/NAA ratio was increased in 7,1, and 1 patients on ipsilateral, contralateral, and both sides,respectively. Glx/Cr ratio was increased in 4, 1, and 2patients on ipsilateral, contralateral, and both sides, respectively.Increased side-to-side difference in Glx/NAA,Glx/Cr, and (Cho+Cr)/NAA were seen in 9, 3, and 0 patients,respectively.CONCLUSIONGlx/NAA ratio and its side-to-side difference are the mostuseful parameters in lateralization of side of seizure in unilateralas well as bilateral MR imaging positive as well asMR imaging negative patients of mesial temporal sclerosis.KEY WORDS: Spectroscopy, epilepsy, glutamateTuesday
TuesdayPaper 97 Starting at 10:39 AM, Ending at 10:47 AMDiffusion-Weighted Imaging of a Focal Lesion in theSplenium of the Corpus Callosum: Is the Cause Seizuresor Medications?Moritani, T. · Hiwatashi, A. · Ketonen, L. · Wang, H. ·Ekholm, S. · Westesson, P.University of RochesterRochester, NYPURPOSETo evaluate diffusion-weighted imaging (DWI) findings offocal lesions in the splenium of the corpus callosum inepileptic patients and correlate with clinical, electroencephalogram(EEG), and other MR findings.MATERIALS & METHODSWe reviewed DWI findings of focal lesions in the spleniumof the corpus callosum in 7 patients (9 to 79 years old, mean33 years old, 3 male and 4 female). Two patients hadintractable epilepsy with multiple antiepileptic medications.Three patients had seizures or subclinical seizures associatedwith headache, confusion, weakness, or speech disturbancewith or without previous antiepileptic medications.One patient had a hemolytic uremic syndrome with generalizedtonic-clonic seizure. One patient had a tacrolimusinducedmyelinolysis after liver transplant.Electroencephalogram was performed in 5 patients.Diffusion-weighted imaging and apparent diffusion coefficient(ADC) maps (b = 0, 1000 sec/mm 2 , 3 orthogonal orientations)were obtained. MR imaging included T1, T2 andgadolinium-enhanced T1-weighted, and fluid attenuatedinversion recovery (FLAIR) images.RESULTSIn 5 patients, initial DWI at 1 to 3 days after onset showed ahyperintense round or oval lesion with decreased ADC in thesplenium of the corpus callosum. In 2 patients, the initialDWI at 9 days and 4 months, respectively, showed a hyperintenseround or oval lesion with increased ADC. On followupMR imaging at 3 months to 1 year, the areas of abnormalitieson initial DWI were resolved completely in 2patients and partially resolved in 1. Conventional MR imagingshowed a nonhemorrhagic hyperintense lesion on T2-weighted and FLAIR images that was slightly hypointenseon T1-weighted image. There was no enhancement afteradministration of IV gadolinium. Electroencephalogramshowed an epileptic focus in 2 patients, slow waves in 2patients, and was normal in 1 patient.CONCLUSIONRound or oval DWI hyperintense lesion with decreased ADCwere seen in the splenium of the corpus callosum. The causeof these focal lesions is thought to represent transient focalcytotoxic edema related to the transhemispheric connectionwith secondary generalized seizure activity, or toxic effect ofmedications or possibly other integrated mechanisms such asexcitotoxic brain injury.78REFERENCES1. Kim SS, Chang KH, Kim ST, et al. Focal Lesion in theSplenium of the Corpus Callosum in Epileptic Patients:Antiepileptic Drug Toxicity? AJNR Am J Neuroradiol1999;20:125-1292. Polster T, Hoppe M, Ebner A. Transient Lesion in theSplenium of the Corpus Callosum: Three Further Cases inEpileptic Patients and a Pathophysiological Hypothesis. JNeurol, Neurosurg, Psych 2001;70:459-463KEY WORDS: Diffusion-weighted, epilepsy, corpus callosumPaper 98 Starting at 10:47 AM, Ending at 10:52 AMTransient Increased T2 Signal in the Splenium of theCorpus Callosum on Postictal MR ImagingHeaney, C. J. · Witte, R. J. · Campeau, N. G. · Watson, R.E. · Cohen-Gadol, A. A. · Marsh, R. W. · Britton, J. W. ·Jack, C. R.Mayo ClinicRochester, MNPURPOSEReversible MR signal abnormalities in the splenium of thecorpus callosum have been reported rarely in the literature inpatients with epilepsy (1, 2) and in patients on antiepilepticmedications (3). We report a case of reversible increased T2signal in the corpus callosum postictally in a patient withrefractory epilepsy.MATERIALS & METHODSA 27-year-old right-handed male with a long history ofrefractory partial epilepsy presented for evaluation. His neurologicexamination was unremarkable. MR imaging wasperformed prior to evaluation. Medications included phenytoin(500 mg/day), valproic acid (2250 mg/day) and lamotrigine(400 mg/day). On admission the patient’s medicationswere withheld for video-electroencephalography monitoring.Ictal Neurolite (Technetium Tc99m Bicisate) and interictalFDG-PET study were performed. MR imaging was performed5 days following generalized tonic-clonic seizure.Follow-up MR exams were performed at 5 weeks and at 1year.RESULTSMR imaging performed 4 months prior to examination wasnegative. MR imaging performed 5 days postsecondary generalizedtonic-clonic seizure demonstrated a 1.4-cm unenhancingnonhemorrhagic ovoid lesion in the splenium of thecorpus callosum with increased T2 signal. Ictal-interictalNeurolite-PET subtraction study indicated a right temporalfocus for seizure activity. No perfusion abnormality wasappreciated in the corpus callosum on the Neurolite examination.There was normal FDG uptake in the corpus callosumon the interictal study. Follow-up MR imaging at 5weeks and 1 year demonstrated resolution of the signalabnormality in the corpus callosum.CONCLUSIONTransient focal increased T2 signal in the corpus callosumcan be seen in the setting of recent seizure activity. Suchcharacteristic appearing signal abnormality remains of
uncertain etiology, but should be considered benign.Recognition and prompt diagnosis of this phenomenon willpreclude unnecessary interventions.REFERENCES1. Henry TR, Drury I, Brunberg JA. Focal Magnetic ResonanceChanges Associated with Partial Status Epilepticus.Epilepsia 1994;35:35-412. Kramer RE, Luders H, Lesser RP. Transient FocalAbnormalities of Neuroimaging Studies during Focal StatusEpilepticus. Epilepsia 1987;28:528-5323. Maeda M, Shoroyama T, Tsukhara H, Shimono T, Aoki S,Takeda K. Transient Splenial Lesion of the Corpus CallosumAssociated with Antiepileptic Drugs: Evaluation byDiffusion-Weighted MR Imaging. Eur Radiol 2003;13:1902-1906KEY WORDS: Corpus callosum, splenium, postictalPaper 99 Starting at 10:52 AM, Ending at 11:00 AMHemispheric Involvement in Epileptic Patients: Value ofDiffusion-Weighted ImagingMoritani, T. · Hiwatashi, A. · Wang, H. · Ketonen, L. ·Ekholm, S. · Westesson, P.University of RochesterRochester, NYPURPOSETo evaluate diffusion-weighted imaging (DWI) findings ofhemispheric involvement of ictal and postictal encephalopathyas compared with clinical, electroencephalogram (EEG)and other MR findings.MATERIALS & METHODSWe reviewed DWI findings in 10 patients (1 day to 68 yearsold, mean 32 years old, 7 male and 3 female) with hemisphericinvolvement of ictal and postictal encephalopathy.Eight patients had status epilepticus and 2 had recurrent generalizedseizures. Electroencephalogram was performed inall patients. Diffusion-weighted imaging and ADC maps (b= 0, 1000 sec/mm 2 , 3 orthogonal orientations) were obtained.Besides DWI, the MR examination included T1, T2 and GdenhancedT1-weighted, and fluid-attenuated inversionrecovery images, as well as MR angiography. Initial DWIwas obtained 6 hours to 18 days after onset of seizures. In 6patients, follow-up MR images including DWI wereobtained at 1 week to 2 years after initial DWI.RESULTSOn MR imaging, including DWI, hemispheric involvementwas seen on the right side in 6 patients and on the left in 4patients. Entire hemispheric involvement was seen in 5patients. Tthe frontal area was spared partially in 5 patients.Ipsilateral involvement in the thalamus (6 patients), basalganglia (2 patients) and hippocampus (4 patients), and thecontralateral cerebellum (crossed cerebellar diaschisis) (1patient) also were seen. In 7 patients DWI at the acute toearly subacute phase showed these lesions as hyperintensewith decreased ADC, which represents cytotoxic edema.Diffusion-weighted imaging more clearly demonstrated thedistribution and extent of the lesions than conventional MRsequences in these patients. In the other 3 patients, DWI inthe late subacute phase showed these lesions as slightly79hyperintense with increased ADC, which was seen on conventionalMR imaging. Diffuse gyral enhancement was seenin these lesions in the subacute phase. MR angiographyshowed dilatation of arteries in the involved hemisphere in 2patients. Electroencephalogram showed patterns of hemisphericneuronal dysfunction and diffuse asymmetricencephalopathy in all patients. On follow-up MR imaging,the areas of abnormalities on initial DWI were partiallyreversible but various amounts of cortical laminar necrosis,gliosis, and hemispheric atrophy were seen.CONCLUSIONDiffusion-weighted imaging is useful for early detection ofdistribution and extent of involvement in patients with hemisphericictal and postictal encephalopathy. Diffusion-weightedimaging is thought to be useful in predicting patient outcome.The areas of DWI abnormalities were partiallyreversible with various amounts of cortical laminar necrosis,gliosis, and hemispheric atrophy.REFERENCES1. Soffer D, Melamed E, Assaf Y, et al. Hemispheric BrainDamage in Unilateral Status Epilepticus. Ann Neurol1986;20:737-740L2. Men S, Lee DH, Barron JR, et al. Selective Neuronal NecrosisAssociated with Status Epilepticus; MR Findings. AJNR AmJ Neuroradiol 2000;21:1837-18403. Salih MA, Kabiraj M, Al-Jarallah AS, El Desouki M, OthmanS, Palkar VA. Hemiconvulsion-Hemiplegia-EpilepsySyndrome. A Clinical, Electroencephalographic andNeuroradiological Study. Childs Nerv Syst 1997;13:257-2634. Freeman JL, Coleman LT, Smith LJ, Shield LK.Hemiconvulsion-Hemiplegia-Epilepsy Syndrome:Characteristic Early Magnetic Resonance ImagingFindings. J Child Neurol 2002;17:10-16KEY WORDS: Diffusion-weighted, epilepsy, cerebral hemispherePaper 100 Starting at 11:00 AM, Ending at 11:08 AMT2 Relaxometry in the Evaluation of Patients with MesialTemporal Lobe EpilepsyGaikwad, S. B. · Kanodia, A. K. · Mishra, N. K. · Garg, A.· Tripathi, M. · Padma, M. V. · Gupta, V. · Gupta, A. ·Sharma, M. C.All India Institute of Medical SciencesNew Delhi, INDIAPURPOSETo evaluate hippocampal T2 relaxation times in MR imagingpositive and MR imaging negative patients of mesial temporallobe epilepsy.MATERIALS & METHODSWe performed T2 relaxometry in 8 controls (22-37 years, 5males and 3 females), 23 patients of mesial temporal lobeepilepsy (age 8-43 years, 20 males and 3 females) with durationof epilepsy from 1-23 years (mean-9.6 years). Patients weredivided in 3 groups: Group1 (unilateral MR imaging positiveincluded 14 patients), Group 2 (Bilateral MR imaging positiveincluded 4 patients) and Group 3 (MR imaging negative included11 patients). We used 16 echo CPMG (Carr-Purcell -Meiboom -Gill) sequence with TE from 22 ms to 352 ms.Tuesday
TuesdayRESULTSIn control patients, mean T2 relaxation time of 109.7 ms wasseen (range 103-115 ms) with mean side-side variation of3.32 ms (SD 1.82 ms). In group comparisons, significantlyhigh T2 relaxation times were seen in ipsilateral side inGroup1 and 2 (head, body, and tail) and on contralateral sidein Group 1 (body and tail) and Group 2 (head, body, andtail). Increase on ipsilateral side was more than contralateralside (p < 0.01). Increase in T2 relaxation times in Group 3was not significant on either side. In Group 1, all patientshad increased T2 relaxation time on ipsilateral side, while 9patients also had increased T2 relaxation time on contralateralside. In Group 2, T2 relaxation times were increased onboth sides in all patients. In Group 3, 2 patients hadincreased T2 relaxation time on ipsilateral side and 2 patientshad raised T2 relaxation time on both sides (ipsilateral >contralateral). In 1 patient T2 relaxation time was increasedon contralateral side only.CONCLUSIONAbnormal T2 relaxation times can be demonstrated by T2relaxometry in the normal side in some of the unilateral MRimaging positive patients. In bilateral MR imaging positivepatients, it may be helpful in detecting the more abnormalside. In MR imaging negative cases, T2 relaxometry may behelpful in detecting and lateralizing hippocampal abnormalitiesin a few patients, although the sensitivity is low.KEY WORDS: Relaxometry, hippocampus, epilepsyPaper 101 Starting at 11:08 AM, Ending at 11:13 AMLate-Onset Neuroaxonal Leukodystrophy withSpheroids: Neuroimaging FindingsSuzuki, S. · Nael, K. · Salamon, N. · Vinters, H. V. ·Villablanca, P.University of California Los AngelesLos Angeles, CAPURPOSEOnly a handful of reports have presented the neuroimagingfindings of late-onset neuroaxonal leukodystrophy withspheroids (NALS). The purpose of this study is to describethe clinical and neuroimaging findings in a case of pathology-provensporadic late-onset NALS.MATERIALS & METHODSThe clinical observation, neuroimaging findings, and pathologiccharacteristics in a case of late-onset NALS are presentedand reviewed.RESULTSA 46-year-old female with a history of mild diabetes mellituspresented with slowly progressive cognitive decline, gaitdisturbance, and seizure. Neurologically, severe dementia,bilateral pyramidal tract signs and retropulsion wereobserved. No family history of neurologic disorder wasreported. On MR imaging, the T2 FSE, FLAIR and diffusion-weightedimaging, exhibited confluent regions ofhyperintensity in the bilateral cerebral white matter includingcorpus callosum. The white matter involvement was primarilydeep and subcortical. The ADC map showedhypointensity in the deep white matter regions. The subcorticallesions adjacent to the atria of the lateral ventriles were80hypointense on the T1-weighted images. The U-fibers, internalcapsules, brainstem, and cerebellum were spared. Therewere multiple small cystic lesions in the white matter. Noabnormal enhancement was seen. An extensive work-up wasnegative for metachromatic leukodystrophy, adrenoleukodystrophy,Krabbe’s disease, cerebral autosomal dominant arteriopathywith subcortical infarcts and leukoencephalopathy,multiple sclerosis, and postinfectious encephalomyelitis. Abrain biopsy was performed as a possibility of CNS vasculitiswas raised although the conventional cerebral angiogramwas normal. The histopathologic studies revealed severeabnormality in the subcortical white matter, which showedprominent cystic cavitation, reactive astrocytic gliosis, lossof myelin, and numerous small eosinophilic neuroaxonalspheroids. No evidence of vasculitis, taunopathy, or synucleinopathywas identified. Therefore, the diagnosis of sporadiclate-onset NALS was established. The late-onset NALS is arare neurologic disease of unknown etiology, which is characterizedby the neuropathologic findings of cerebral whitematter degeneration along with abundant spheroid formationin axonal regions, gliosis, and vacuolation. Typically, itaffects the second to fourth decade of life, and leads tosevere progressive cognitive deterioration and motor impairmentincluding loss of balance, gait disorder, and spasticity.Most of the cases have a family history with an autosomaldominant pattern of inheritance. Only several sporadic caseshave been reported, including this case. The brain MRappearance is nonspecific, demonstrating T2-weightedhypersignal intensity in the fronto/parietal white matter.High diffusion-weighted imaging and low ADC area may beseen in white matter disease, reflecting disintegration of themyelin with reduced mobility of water molecules. Without adefinite family history, the differential diagnosis is broad,including numerous white matter degenerative diseases.However, the small multiple cystic lesions along with thediffuse bilateral white matter signal abnormality could be aneuroimaging diagnostic feature.CONCLUSIONThis excerpta presents the neuroimaging findings of apathology-proven case of late-onset NALS. The MR appearanceis relatively nonspecific and includes frontal and fronto/parietalhigh T2-weighted signal changes with scatteredsmall cystic foci in the cerebral white matter. However,increased awareness of the MR findings of the late-onsetNALS is important to prompt the diagnosis of this rare neurologicdisease.KEY WORDS: Neuroaxonal leukodystrophy with spheroids,degenerative disease
Paper 102 Starting at 11:13 AM, Ending at 11:21 AMCerebral MR Imaging after 16 Hours of NormobaricHypoxia: Signs of Vasogenic and Cytotoxic EdemaKallenberg, K. 1 · Christ, S. 1 · Mohr, A. 1 · Roukens, R. 2 ·Menold, E. 2 · Steiner, T. 3 · Bailey, D. M. 4 · Bartsch, P. 2 ·Knauth, M. 11Georg-August University Medical Centre, Goettingen,GERMANY, 2 University of Heidelberg, Heidelberg,GERMANY, 3 University of Heidelberg, Goettingen,GERMANY, 4 University of Glamorgan, Glamorgan,UNITED KINGDOMPURPOSEAcute mountain sickness (AMS) is defined as a combinationof unspecific symptoms like headache, dizziness, nausea,sleep disturbances, weakness and anorexia occurring 4 - 8hours after arrival at an altitude over 2500 m above sea level.The symptoms indicate central nervous system disturbances.The exact pathophysiology is not known yet. Hypoxaemiaseems to play the most important role because there is highcorrelation between severity of symptoms and level ofhypoxaemia. There has been a report of changes in T2 signalintensity in the splenium of the corpus callosum (SCC) ofpatients with AMS. Two underlying mechanisms are discussed:1) increased permeability of the blood-brain barrier(BBB) with resulting vasogenic edema and 2) break-down ofsodium/potassium-ATPase with consecutive cellularswelling (cytotoxic edema). The aim of our study was toidentify cerebral changes and differentiate between vasogenicand cytotoxic edema.MATERIALS & METHODSTwenty-two healthy volunteers (age 21-29 years) wereexposed to an FIO2 of 0.12 [ambient pO2 equivalent to analtitude of 4500 m (14,850 ft)] in a normobaric hypoxiachamber. AMS was assessed by clinical examination andquestionnaire. After an exposure time of 16 hoursMRimaging was performed while maintaining hypoxia by aface mask. Dual echo, diffusion-weighted and T1-3Dsequences were performed identically before, under and 6hours after exposure to the hypoxic environment. The T2relaxation time (T2rt) and apparent diffusion coefficient(ADC) were calculated and measured in similar regions ofinterest (ROI). Volumetric data from T1-3D were obtained.RESULTSEleven of the 22 subjects developed acute mountain sickness.Volumetry: Under hypoxic exposure a significantincrease in total brain volume was observed (p < 0.001),which did not completely normalize to preexposure valuesafter 6 hours. No significant relation between the absolutebrain volume changes and severity of AMS was found. T2-relaxation time: Under hypoxic exposure a significant T2-prolongation was found in the SCC (p = 0.0005), which alsodid not normalize completely to preexposure values. ADCvalues: No increase in ADC values was observed underhypoxic exposure. However in posthypoxic MR imaging asignificant decrease in ADC in the SCC was found (p =0.005 ).81CONCLUSIONUnder hypoxia an increase in total brain volume was found.In the SCC changes of T2 relaxation values and water-diffusibilitywas measured. While the increase and the rapiddecrease of the T2 values may be caused by transient vasogenicedema, the decreased ADC values in the posterior partof the corpus callosum may reflect cytotoxic edema. It isunclear why the splenium of the corpus callosum seems to bea predilection site for these changes. However, the vulnerabilityof this structure in high-altitude cerebral edema hasbeen described before. It is not yet clear, how the describedchanges relate to the clinical symptoms of AMS.KEY WORDS: Hypoxia, MR imaging, acute mountain sicknessPaper 103 Starting at 11:21 AM, Ending at 11:28 AMConversion to Multiple Sclerosis after a ClinicallyIsolated Syndrome: Differences Depending on theTopographyRovira, A. · Tintoré, M. · Gispert, S. · Grivé, E. · Pericot, I.· Nos, C. · Sánchez, E. · Montalban, X.Hospital Vall d’HebronBarcelona, SPAINPURPOSEIn many cases, a clinically isolated syndrome (CIS) of thebrainstem, optic nerve, spinal cord, or several regions, is thepresenting attack of multiple sclerosis (MS). The conversionto MS (i.e., occurrence of a second attack) has been shown tobe related to the results of paraclinical tests such as brain MRimaging and CSF analysis. The aim of this study was to comparethe rates of conversion to clinically definite MS (CDMS)among the various topographical clinical syndromes at presentation,depending on the initial brain MR findings.MATERIALS & METHODSWe studied 380 consecutive patients presenting with a CIS:148 (39%) with optic neuritis, 99 (26%) with brainstem syndrome,99 (26%) with spinal cord syndrome, and 34 (9%)with a polyregional syndrome. Mean clinical follow-up was31 +/- 22 months. The rates of conversion to clinically definiteMS among the different clinical syndromes were compared.In a subgroup of patients, baseline (n = 280) and 1year (n = 229) brain MR scans were obtained and the criteriafor dissemination in space (at least 3 of the Barkhof criteria)and time (new T2 lesion on the follow-up MR exam)according to the McDonald criteria were assessed.RESULTSThe rate of conversion to clinically definite MS in patientswith optic neuritis was lower than that in polyregional syndromes(22% vs 40%; p = 0.031), brainstem syndromes(34%; p = 0.043) or spinal cord syndromes (34%; p = 0.042).Patients presenting with optic neuritis showed a lower rate ofdissemination in space as compared to brainstem syndromes(29% vs 51%; p = 0.003) and polyregional syndromes (50%;p = 0.042), and a lower rate of dissemination in time (31%)as compared to spinal cord syndromes (52%; p = 0.008),brainstem syndromes (55%; p = 0.004) or polyregional syndromes(60%; p = 0.015). These differences disappearedwhen analyzing only the patients with an abnormal baselineMR exam (presence of at least one subclinical T2 focal brainlesion of the type seen in MS).Tuesday
82TuesdayCONCLUSIONPatients presenting with optic neuritis showed a higher percentageof normal brain MR exams at presentation and alower rate of conversion to clinically definite MS as comparedto the other types of CIS. When the baseline MR examdemonstrated subclinical events, however, there were no significantdifferences among the various clinical groups withrespect to the rate of conversion to MS. These results supportthe prognostic value of baseline MR imaging in CIS patients.KEY WORDS: Multiple sclerosis, brain, MR imagingPaper 104 Starting at 11:28 AM, Ending at 11:36 AMIncreased Intracranial Volume Suggests “Idiopathic”Normal Pressure Hydrocephalus Starts as BenignExternal Hydrocephalus in InfancyBradley, W. G. · Safar, F.University of California San DiegoSan Diego, CAPURPOSENormal pressure hydrocephalus (NPH) was described initiallyas “idiopathic.” It is diagnosed on the basis of a clinicaltriad of gait disturbance, dementia, and incontinence inelderly patients presenting with the radiographic picture ofcommunicating hydrocephalus. Phase contrast CSF velocityimaging has been shown to be useful in selecting whichpatients will respond favorably to ventricular shunting.Specifically, the volume of CSF pulsating back and forththrough the aqueduct over the cardiac cycle [“aqueductalCSF stroke volume” (SV)] is increased. A few years ago, itwas suggested that NPH actually begins in infancy as“benign external hydrocephalus,” a condition in which theCSF resorptive capacity is decreased, supposedly due todelayed maturation of the arachnoid villi. Since these childrenare less than 1 year old, their sutures can still expand,thus CSF accumulates in the subarachnoid space over thefrontal convexities as well as within slightly enlarged ventricles,causing the children to present with increasing head circumference.If NPH patients truly did have benign externalhydrocephalus as infants, they should have greater intracranialvolumes than age- and sex-matched controls thereafter.Evaluation of that hypothesis was the purpose of this studyMATERIALS & METHODSAll patients with CSF velocity imaging studies for clinicallysuspected NPH over the prior 2 years were reviewed retrospectively. Only those with SVs 50% higher than normalwere included in this study. The intracranial volumes of NPHpatients and controls were measured from the T2-weightedimaging on a workstation. The mean SV for the NPH maleswas 149 uL; for NPH females it was 127 uL (compared to anormal literature value of 42 uL).RESULTSThe average intracranial volume for NPH men was 1690 ml(n = 18), compared to 1584 for male controls (n = 26). TheNPH volume averaged 100 cc (6.6%) larger than the controlvolume which was statistically significant (p = .03). Theaverage intracranial volume for NPH women (n = 25) was1495 ml, compared to 1407 for female controls (n = 56). TheNPH volumes averaged 88 ml (6.3%) larger than the controlvolume and this was again statistically significant (p = .003).CONCLUSIONThis study shows that NPH patients have intracranial volumes90-100 ml or 6% larger than age- and sex-matchedcontrols. The larger volume confirms that the initial insultoccurred before the sutures fuse at 1 year of age, as would bethe case with benign external hydrocephalus. This wouldimply that the CSF resorption always has been decreased,not just when it is discovered in old age. The patients somehowremain asymptomatic until their later years when deepwhite matter ischemia leads to a second insult which couldbe increased periventricular ischemia, decreased CSFresorption via the extracellular space, or softening of thebrain. The “second hit” leads to the symptoms of NPH.Radiologists probably see the CT and MR studies of “pre-NPH” patients routinely and dismiss the mild ventricularenlargement as “ventricles at the upper limits of normal.”These patients should be observed for early signs of a gaitdisturbance in their elderly years as NPH develops.KEY WORDS: Hydrocephalus, normal pressure hydrocephalus,dementiaPaper 105 Starting at 11:36 AM, Ending at 11:44 AMMeasurement of “Temporal Stem” for Diagnosis ofFrontotemporal Dementia: Simple Method at RoutineMR ImagingHayashida, Y. 1 · Korogi, Y. 2 · Hirai, T. 1 · Yamura, M. 1 ·Kitajima, M. 1 · Murata, Y. 1 · Yamashita, Y. 11Kumamoto University School of Medicine, Kumamoto,JAPAN, 2 University of Occupational and EnviromentalHealth, School of Medicine, Kitakyushu, JAPANPURPOSETo determine whether frontotemporal dementia (FTD) canbe differentiated from normal subjects and Alzheimer’s disease(AD) by measurement of thickness of several limbicstructures on routine MR examination.MATERIALS & METHODSForty-one patients with dementia (16 FTD and 25 AD)underwent MR studies at a 1.5 T MR imager. Study protocolincludes axial and sagittal T1-weighted images, and axialand oblique coronal (parallel to the clivus) T2-weightedimages. The diagnosis of dementia was established by twoexperienced psychiatrists using standard clinical criteria.Patients’ mean age was 72.4 years (age range of 52-86years). Fifteen age-matched controls also underwent MRexamination with the same protocol for comparison. Widthof the corpus callosum (anterior trunk), cingulate gyri, headof the hippocampi, and “temporal stem” of the anterior temporallobes were measured, and compared among FTD, AD,and normal subjects. The “temporal stem,” which includesthe uncinate fasciculus as the commissural fiber between thefrontal lobe and temporal pole, was defined as widthbetween the inferior Sylvian fissure and inferior horn of thelateral ventricle at the slice of the head of hippocampus onoblique coronal T2-weighted images.RESULTSThe width of the temporal stem of FTD (6.3 ± 1.3 mm) wassignificantly smaller than those of control subjects andpatients with AD (7.8 ± 1.1 mm, p = 0.0013), although therewere some overlaps between AD and FTD. All patients with
the temporal stem width of less than 5 mm were FTD. Thewidths of the corpus callosum, cingulate gyri, and hippocampiof AD and FTD were significantly smaller thanthose of control subjects, but there were no significant differencesbetween AD and FTD.CONCLUSIONThe width of the “temporal stem” was significantly smallerfor FTD than for control subjects and AD. This measurementis easy and simple, and may be useful for diagnosis of FTD.KEY WORDS: Dementia, MR imagingTuesday Morning10:15 AM - 11:45 AMBallroom 6 A(23b) Head & Neck General(Scientific Papers 106 - 117)See also Parallel Sessions(23a) Adult Brain: Epilepsy(23c) Pediatrics: General, Functional, and VascularImaging(23d) Pediatrics: General and LeukoencephalopathyModerators:Jane L. Weissman, MDR. Nick Bryan, MD, PhD83Paper 106 Starting at 10:15 AM, Ending at 10:23 AMHigh-Resolution MR Imaging of the Human EyeBert, R. J. 1 · Patz, S. 1,2 · Ossiani, M. 1 · Freddo, T .3,4,51Tufts-New England Medical Center, Boston, MA, 2 Brighamand Women’s Hospital, Boston, MA, 3 Boston MedicalCenter, Boston, MA, 4Boston University School ofMedicine, Boston, MA, 5 Boston University School ofOptometry, Boston, MAPURPOSETo develop a low-cost, consistent technique of imaging thesmall structures of the anterior chamber of the human eye forcommercial 1.5 T magnets, that minimizes motion and susceptibilityartifacts. Our intention was to image at 200-250micron in-plane resolution.MATERIALS & METHODSIRB approval for the study was obtained. After complete eyeexaminations, 8 normal male and 3 normal female volunteerswere imaged (ages 27-52 years) on 1.5 T systems bythree major suppliers (Philips, GE, and Siemens).Commercially available circular or near circular surfacereceiver coils (TMJ coils) were used for image acquisition.Patient preparation made use of conjugate-gaze of the eye,such that a single closed eye was imaged while the remainingopen eye fixated on a cross-hair target. The closed eyewas gently taped shut and covered with soaked 2 x 2 gauzepads. Several imaging sequences were explored for optimumvisualization of the fine structure of the anterior chamber:T1-weighted and T2-weighted conventional and turbo spinecho,T1-weighted gradient echo MR imaging with crushergradients, MPRAGE without an inversion pulse, T1 and T2FLAIR. Imaging time was typically 4-5 minutes.RESULTSAll three commercially available systems were capable ofimaging the small structures of the anterior chamber of theeye at 200-250 micron resolution. T1-weighted conventionalspin-echo images (e.g., TR/TE/FA/SA = 400/17/ 90/6, inplane-resolution250 micron x 250 micron pixel size; 3 mmslices, image time = 4.3 min.), gave consistent images withgood contrast-to-noise ratios on all systems. Long echo-timeT2-weighted images benefited by applying a first ordermotion compensation gradient pulse. TSE sequences were ofsimilar C/N, but were judged subjectively to be of slightlyless quality. Gradient-echo sequences, especially MPRAGE3D acquisition, provided the best overall C/N. Including avitamen E tablet at the corner of the conjunctiva appeared toimprove S/N of the fine structures for one particular coil.CONCLUSION1. Two hundred to 250 micron resolution images of the anteriorchamber of the eye are obtainable with 1.5 T commerciallyavailable systems. 2. The iris, ciliary bodies, anteriorchamber, posterior chamber, lens and lens capsule and retinaare imaged clearly using this technique. 3. This technique forimaging the anterior eye might be useful for glaucomaresearch and evaluation of other anterior ophthalamic diseasestates.KEY WORDS: High-resolution imaging, globe, fine structureTuesday
TuesdayPaper 107 Starting at 10:23 AM, Ending at 10:31 AMNerve Sheath Tumors of the Carotid Space: ImagingFindings in 15 CasesMarlow, T. J. · Wiggins, R. H. · Harnsberger, H. R.University of UtahSalt Lake City, UTPURPOSEThe radiographic characteristics of many carotid space massesallow a radiologic diagnosis to be made with appropriateimaging studies. We report the imaging findings of a relativelylarge series of nerve sheath tumors of the carotidspace, reviewing their clinical presentation as well as theircharacteristic radiologic appearance.MATERIALS & METHODSCT, MR imaging, and angiographic studies of 15 histologicallyproven carotid space nerve sheath tumors (neurofibromasand schwannomas) were reviewed retrospectivelyaccording to their demographics, imaging characteristics,and surgical pathologic results.RESULTSSurgery on the 15 carotid space masses confirmed the presenceof 7 schwannomas, 7 neurofibromas, and 1 malignantperipheral nerve sheath tumor. Ten patients had a contrastedCT performed prior to surgery, 6 had contrasted MR imaging,and 4 had an angiography study performed preoperatively.The neurofibromas cases demonstrated low densityand lack of enhancement by CT, with variable signal intensitybut gadolinium enhancement on contrasted MR imaging.The schwannoma cases demonstrated enhancement by bothCT and MR imaging, with heterogeneous density and signalintensity characteristics, and had variable angiographic patternsranging from peripheral to central opacification. Oneschwannoma case was found histopathologically to bemelanotic, and demonstrated central foci of increased T1signal intensity on MR imaging. An outlying lesion wasfound to be a malignant peripheral nerve sheath tumor, anddemonstrated low density on CT, with surrounding rimenhancement following contrast administration.CONCLUSIONWith attention to CT, MR imaging, and enhancement features,the histology of nerve sheath tumors of the carotidspace often can be predicted based solely on the imagingcharacteristics. This presentation will focus on the salientanatomy of the carotid space, imaging characteristics ofthese lesions, and relevant clinical issues.KEY WORDS: Carotid space, nerve sheath tumor84Paper 108 Starting at 10:31 AM, Ending at 10:39 AMRadiologic Features of Osteoradionecrosis of theMandibleStambuk, H. E. · Mosier, K. M. · Patel, S. G.Memorial Sloan Kettering Cancer CenterNew York, NYPURPOSETo illustrate the typical presentation, natural history, andsalient radiologic features of osteoradionecrosis of themandible (ORNM) in patients who undergo radiation therapyfor head and neck cancer.MATERIALS & METHODSFive patients with cancer of the oral cavity/oropharynx whodeveloped histopathologically proven ORNM followingradiation therapy. Available CT and MR scans werereviewed retrospectively. Clinical data, operative findings,and pathologic features were correlated with the evolution offindings over serial scans.RESULTSThe bony abnormalities involved the body of the mandible inall five cases. Five of five patients had ill-defined corticaldisruption/destruction. Five of five had internal architectural(trabecular) distortion of the medullary bone. Three of fivepatients had infiltrative changes in the surrounding soft tissueswhich were detected by MR imaging only early on andlater evident on CT as ORNM progressed. Three patients hada pathologic fracture of the mandible and one patient had aradiologically demonstrable orocutaneous fistula.CONCLUSIONRadiologic features of ORNM include ill-defined corticaldisruption, trabecular distortion of medullary bone with possibleprogression to pathologic fracture and/or adjacent softtissue changes. Soft tissue changes associated with ORNMare detected earlier on MR imaging than CT and do not necessarilyrepresent tumor recurrence when found in the contextof mandibular osseous abnormality. Therefore, the diagnosisof ORNM also should be considered in these patients.Knowing the evolution of radiographic findings of ORNMmay help in the diagnosis of clinically suspected ORNM.KEY WORDS: Osteoradionecrosis, mandible, imagingPaper 109 Starting at 10:39 AM, Ending at 10:47 AMCranial Nerve Palsy in Nasopharyngeal Carcinoma: MRImaging/Clinical CorrelationKan, W. · Lau, K. · Chan, J. · Sze, W. · Lee, A. · Yau, T. ·Yeung, R. · Lee, A.Pamela Youde Nethersole Eastern HospitalHong Kong, HONG KONG SPECIAL ADMINISTRATIVEREGION OF CHINAPURPOSETo evaluate the accuracy of detection of cranial nerveinvolvement by MR imaging in nasopharyngeal carcinoma(NPC) and correlate with their clinical presentation.
85MATERIALS & METHODSFrom 18.08.1998 to 7.11.2002, 96 patients with newly diagnosedNPC (histologically proven) were reviewed retrospectively.There were 72 males and 24 females, age ranged 17 -83 years (mean = 51.36 years). In all patients, axial T1-, T2-weighted images with fat saturation; coronal T1, T2 with fatsaturation and postgadolinium axial and coronal T1-weightedimages with fat saturation were obtained through thenasopharynx using 1.5 T MR system (Signa, GE MedicalSystems, Milwaukee, Wisconsin, USA or Symphony,Siemens Medical Systems, Erlangen, Germany). The MRevidence of cranial nerve involvement was noted by twoqualified radiologists. The MR evidence of cranial nerveinvolvement was suggested by tumor involvement of thecavernous sinus or basal foramina, or perineural gadoliniumenhancement. The number of cranial nerves with clinicalevidence of palsy was noted by two qualified clinical oncologists.The number of cranial nerves with and without clinicalevidence of cranial nerve palsy was correlated with thenumber of cranial nerves with MR evidence of cranial nerveinvolvement. None of these patients had history of neurologicsymptoms or cranial nerve palsy prior to the presentation.RESULTSAmong 16 cranial nerves with clinical evidence of palsy, 13showed MR evidence and 3 showed no MR evidence of cranialnerve involvement. Among 103 cranial nerves with MRevidence of cranial nerve involvement, 13 showed clinicalevidence and 90 showed no clinical evidence of cranialnerve palsy.CONCLUSIONIn view of the discrepancy of clinical and MR findings incranial nerve palsy in NPC, correlation between clinical andMR findings is mandatory for assessment of cranial nerveinvolvement, which is important for prognosis and staging.We hypothesize the discrepancy between clinical and MRdetection of cranial nerve palsy.KEY WORDS: Nasopharyngeal carcinoma, cranial nervepalsy, correlationPaper 110 Starting at 10:47 AM, Ending at 10:55 AMNasopharyngeal Carcinoma in Children: A RetrospectiveCase and Imaging ReviewKrishnan, A. R. · Hudgins, P. A. · Wise, S.Emory University School of MedicineAtlanta, GAPURPOSEThe purpose of this paper is to review a series of children,adolescents, and young adults with nasopharyngeal carcinoma,document the clinical presentations, and describe theimaging findings.MATERIALS & METHODSRetrospective reviewing of medical records and imagingfrom 9 cases. The following were documented: patient age atpresentation, gender, ethnicity, symptoms at presentation,delay in diagnosis, initial pretreatment imaging findings,pathology results, and EBV serology.RESULTSOf the 9 cases reviewed, the ages of presentation rangedfrom 6 years to 19 years. Five were male and 4 were female.Eight were African American and 1 was Caucasian.Symptoms at presentation included epistaxis, nasal obstruction,hearing loss, facial pain/numbness, and neck mass.Pretreatment imaging findings included nasopharyngealmasses with local soft tissue extension, skull base erosion,enhancement of involved cranial nerves, and cervicaladenopathy. Delay in diagnosis from the initial clinic visit todiagnosis by imaging or physical exam ranged from 5 weeksto 8 months. In all cases, pathology demonstrated poorly differentiatedor undifferentiated nasopharyngeal carcinoma.EBV serology was positive in 6 cases and unavailable in 3cases.CONCLUSIONNasopharyngeal carcinoma is an uncommon neoplasm inchildhood and adolescence, but does occur. Based on thiscase series in the native population in theUnited States, theseneoplasms occur more commonly in African males whooften present with symptoms related to eustacian tubeobstruction, nasal obstruction, or adenopathy. A delay indiagnosis is not uncommon due to the nonspecificity of thesymptoms and lack of objective findings on physical exam.Therefore, local extension of neoplasm with skull base erosionand/or adenopathy is found often on initial imaging.KEY WORDS: Nasopharyngeal, carcinoma, childrenPaper 111 Starting at 10:55 AM, Ending at 11:03 AMCervical Thymus: Imaging Features and ManagementImplicationsEmamian, S. · Vezina, G.Children’s National Medical CenterWashington, DCPURPOSEEctopic presence of thymus in neck is an unusual cause ofneck mass in children and may pose a diagnostic challenge.The purpose of this presentation is to discuss the diagnosticfeatures and clinical management of the cervical thymus.MATERIALS & METHODSFive cases of cervical thymus encountered over the past 8years at our institution.RESULTSAt the time of detection, one patient was 3 years old and theremaining four children were less than 1 year old. In 3patients, the referral clinical diagnosis was neck mass and inthe other 2 patients, the cervical thymus was an incidentalfinding. In all cases, the cervical thymus demonstrated featureson CT and/or MR imaging similar to mediastinal thymus.In two cases, the diagnosis of ectopic cervical thymuswas established by imaging by demonstrating the communicationbetween the cervical mass and the mediastinal thymus.In two cases, the diagnosis was confirmed surgically asno communication was demonstrated by imaging betweenthe cervical mass and the mediastinal thymus. In one casewith isolated cervical thymus, follow-up studies over thenext few years demonstrated spontaneous involution of themass. All lesions were located in parapharyngeal and/or sub-Tuesday
Tuesdaymandibular region and closely associated with the course ofcarotid artery. In two of the cases, tortuosity and displacementof the carotid artery adjacent to the ectopic thymuswere noted. Two of the patients had bilateral ectopic thymus.CONCLUSIONImaging features of cervical thymus per se may not allowconfident nonsurgical diagnosis in all cases in the absence ofcommunication between the cervical mass and the mediastinalthymus. The possibility of ectopic thymus should beincluded in the differential diagnosis of a parapharyngeal orsubmandibular mass in a child, if the mass demonstrates MRimaging signal intensity and/or CT density identical to mediastinalthymus. Theoretically, it also would be important toestablish presence of additional mediastinal thymus prior tosurgery for a cervical mass with diagnostic features suggestiveof cervical thymus if there is plan for complete surgicalresection of a suspicious neck mass in an infant.KEY WORDS: Cervical thymus, ectopic thymus, neck massPaper 112 Starting at 11:03 AM, Ending at 11:11 AMHigh-Resolution Three-Dimensional MR Imaging ofSudden Hearing Loss and Meniere SyndromePellicanò, G. 1 · Napolitano, L. 2 · Leprini, E. 2 · Villari, N. 11Radiodiagnostic Unit I, Florence, ITALY, 2 University ofFlorence, Florence, ITALYPURPOSETo evaluate the role of high-resolution MR imaging inpatients with sudden hearing loss and Meniere syndrome.MATERIALS & METHODSFrom January 2002 to December 2003 we studied 110 consecutivepatients: 90 with sudden hearing loss and 20 withMeniere syndrome. All patients had a complete clinical andinstrumental examination on both ears. In each case we performedhigh-resolution MR imaging with 1.5 T machineusing T2 3D reverse linear 0.5 mm and TSE T2 turbo drive0.5 mm thickness sequence in order to have the best contrastbetween inner ear structures and surrounding parenchyma.We performed also a complete examination of the brain andwe injected also Gd-DTPA to investigate further the innerear. We measure the distance between the posterior semicircularcanal and the posterior edge of temporal bone on bothsequences and on both sides. We acquire also the same distancein a control population (value = 3.00 mm +/-1.2 mm).All examinations were reviewed by two independents neuroradiologist.RESULTSThe distance was reducted in 11 cases of Meniere syndromeon the affected side (value 1.8 mm) and in 4 patients withsudden hearing loss (2.1 mm). Two of them developed acomplete Meniere syndrome 1 month later. The measurementswere exactly the same on both sequences used. Wealso found 11 acoustic neurinoma situated entirely inside theinternal acoustic canal on the affected side. In 3 cases wealso found enhancement of the nerves in the fundus of internalacoustica canal.86CONCLUSIONThe protocol we used in case of patients with sudden hearingloss was able to detect many causes of the symptoms.The two high-resolution sequences used showed the sameinformation despite the different times of acquisition (8’ forreverse linear and 4’ for turbo drive). The finding of reduceddistance in patients with sudden hearing loss may be a predictiverole for Meniere syndrome.KEY WORDS: High-resolution 3D MR, sudden hearing loss,Meniere syndromePaper 113 Starting at 11:11 AM, Ending at 11:19 AMFacial Nerve Schwannomas of the Internal AuditoryCanal: A Critical Acoustic Schwannoma MimicGupta, A. S. · Wiggins, R. H.Harnsberger, H. R. · Shelton, C.· Salzman, K. L. ·University of UtahSalt Lake City, UTPURPOSEWhen a facial nerve schwannoma (FNS) is centered in thecerebellopontine angle (CPA) or internal auditory canal(IAC), it often mimics the far more common acousticschwannoma (AS). It is critical to differentiate FNS from ASpreoperatively as there are important management and prognosticimplications. The principle focus of this study is toidentify differentiating clinical and imaging features of therare, but important IAC facial nerve schwannoma comparedto acoustic schwannoma.MATERIALS & METHODSTwenty-eight patients with facial nerve schwannoma evaluatedat our institution over a 15-year period were reviewedretrospectively. Fourteen of the 28 patients had significantIAC involvement of the FNS and were segregated. Clinicaldata was collected including age, gender, facial nerve neuropathy,hearing loss and tinnitus. MR imaging studies in allcases were evaluated for location of the mass and extensionalong the facial nerve. Each segment of the facial nerve wasevaluated for possible tumor involvement. CT images wereevaluated for enlargement of the facial nerve canal.Histopathologic results were confirmed on all operatedcases. Follow-up imaging was reviewed in the remainingcases.RESULTSFourteen patients with the diagnosis of FNS and significantIAC involvement were reviewed. The patients ranged in agefrom 10 to 68 years with a mean of 40.2 years. There were 7male and 7 female patients. Five patients had facial nervesymptoms while 8/14 patients presented with sensorineuralhearing loss. MR showed enhancement along thelabyrinthine segment in 13/14 patients. In the eleven cases inwhich a CT was performed, the facial nerve canal wasenlarged in ten patients. Surgical and histopathologic correlationwas available in 10/14 patients.CONCLUSIONFacial nerve schwannoma can be differentiated fromacoustic schwannoma by MR imaging if there is enhancementalong the course of the facial nerve. Specifically,enlargement of the facial nerve canal and an enhancing
“labyrinthine tail” are the important distinguishing imagingfeatures. Clinical symptoms were less useful in differentiatingFNS from AS. Surprisingly, sensorineural hearing loss isa more common presenting symptom in FNS than facial neuropathy.Symptoms referable to the facial nerve are seen in aminority of FNS patients.KEY WORDS: Facial nerve schwannoma, acoustic neuroma,IAC massPaper 114 Starting at 11:19 AM, Ending at 11:27 AMMR Imaging of Head and Neck PlexiformNeurofibromas in Neurofibromatosis Type 1: A Reviewof 67 PatientsZacharia, T. T. 1 · Poussaint, T. Y. 2 · Jaramillo, D. 1 · Korf, B.R. 31Massachusetts General Hospital, Boston, MA, 2 Children’sHospital, Boston, MA, 3University of Alabama,Birmingham, ALPURPOSETo define the most prevalent patterns of involvement andMR imaging findings in head and neck plexiform neurofibromasin neurofibromatosis type 1.MATERIALS & METHODSWe reviewed the MR appearance of head and neck lesions in67 patients [32 males, 35 females; ages 5-70 years, pediatric(n = 41), adult (n= 26)] with neurofibromatosis type 1. Thepatients were part of a multiinstitutional study of the naturalhistory of plexiform neurofibromas. All imaging includedcontiguous axial short tau inversion recovery images(TR/TE 6000/35; inversion time, 150 msec; echo-trainlength = 8), which were used for volumetric measurements.RESULTSThe plexiform volumes ranged from 0.5 cc to 1450 cc withinterobserver variability of ~10% (1). The most commonhead and neck involvement was the masticator space (n =25), parapharyngeal space (n = 24), carotid space (n = 22)and brachial plexus (n = 21). Parotid gland involvement wasnoted in 25 patients and the submandibular gland wasinvolved in 10 patients. In 13, the plexiform neurofibromasextended into the infratemporal fossa, and in 9 there waspterygopalatine fossa involvement. Scalp (n = 20), ear, andexternal auditory meatus (n = 10) and orbit (n = 7) involvementwere frequent. Lingual neurofibromas were noted in 8patients. Thyroid gland involvement was noted in 2 patients(involving one lobe in one and complete thyroid glandinvolvement in another). The lesions were hyperintense onT2 images and the target sign was present in more than halfof the patients (2).CONCLUSIONHead and neck plexiform neurofibromas in neurofibromatosistype 1 can affect multiple deep spaces of the neck. In ourseries the majority of patients were pediatric. Althoughlesions are most prevalent in the masticator space, parapharyngealspace, and brachial plexus, lingual and pterygopalatinefossa involvement may be seen. Salivary gland involvementwas noted in more than half of the patients. The targetsign was present in 50% of cases.87REFERENCES1. Poussaint TY, Jaramillo D, Chang Y, et al. InterobserverReproducibility of Volumetric MR Imaging Measurementsof Plexiform Neurofibromas. AJR Am J Roentgenol2003;180:419-4232. Iannicelli E, Rossi G, Almberger M, et al. Integrated Imagingin Peripheral Nerve Lesions in Type 1 Neurofibromatosis.Radiol Med (Torino) 2002;103:332-343KEY WORDS: Plexiform neurofibroma, NF-1, head and neckPaper 115 Starting at 11:27 AM, Ending at 11:32 AMTeflon Granulomas in the Posterior Pharynx: FalsePositive Findings on Positron Emission TomographyClarified with Fused Positron Emission Tomography/CTHarrigal, C. L. · Snyderman, C. H. · Maroon, J. C. ·Branstetter, B. F.University of Pittsburgh Medical CenterPittsburgh, PAPURPOSEPositron emission tomography (PET) has become a crucialimaging modality in the diagnosis and staging of head andneck tumors. However, the lack of precise anatomical localizationand the inability to characterize tissue anatomicallyincrease the potential for false positive results. Sources offalse positive PET include physiologic uptake and inflammatoryor granulomatous reactions. The purpose of thisreport is to highlight two patients with surgically correctedvelopharyngeal insufficiency (VPI) in whom focal PETuptake was interpreted incorrectly as squamous cell carcinoma(SCC). The findings were clarified with combinedPET/CT and MR imaging.MATERIALS & METHODSTwo different patients presented to us with clinical findingssuggesting SCC of the posterior pharynx. PET was performedto confirm the presence of tumor, evaluate extent ofdisease, and exclude metastases. Initial PET images weresuggestive of SCC, but further imaging (combined PET/CTin one patient and MR imaging in the other) were not consistentwith SCC. A careful review of the patients’ historiesrevealed pharyngeal Teflon injections for treatment of VPI.The diagnosis of Teflon-induced granuloma was made withoutthe need for surgical intervention, and both patients wereevaluated with close interval follow-up.RESULTSPositron emission tomography from patient #1 shows dramaticfocal FDG uptake in the posterior pharynx (Fig 1). CTshows amorphous increased density more consistent withinjected Teflon (Fig 2). Positron emission tomography frompatient #2 was similar, but MR imaging showed decreasedT2 signal, consistent with fibrosis rather than SCC. Bothpatients were followed radiographically for several months.The lesions remained stable in size and in imaging characteristics.Tuesday
88RESULTSFetal ultrasound demonstrated a mass of undetermined originbetween placenta and fetal head. The fetal MR imagingdemonstrated a mass with heterogeneous signal arising fromthe soft-tissues of the head and neck, and distinct from placenta.No associated intracranial abnormality or bony calvarialdefect was present. The postnatal MR imaging demonstrateda well circumscribed subcutaneous mass with multipleflow voids, and heterogeneous T2 signal, isointense T1signal, and intense gadolinium enhancement. No underlyingbony defect was seen on CT. Because of the vascular natureof the lesion preoperative embolization was performed onday 10. The vessels supplying the mass all arose from the leftECA. The arterial feeders were embolized utilizing 200 to300 micron PVA particles. At 11 days of age excision of themass was performed. Pathologic examination revealedtumor extending to the margin. The tumor recurred shortlyafterwards and was resected again at 3 months of age. After2 years of surveillance there was no further recurrence.TuesdayCONCLUSIONTeflon injections were used historically in many medicalfields to supplement diseased tissue and restore physiologicfunction. For example, VPI, a swallowing disorder, has beentreated with Teflon injections into the posterior pharynx toassist in the apposition of the pharynx with the palate andtongue. Unfortunately, Teflon injections in various tissueshave demonstrated significant granulomatous reaction, withinflammation and eventual fibrosis. Thus, most Teflon injectiontechniques have been abandoned. However, these historicalprocedures still provide a potential source of falsepositive PET interpretations because the granulomatous tissuehas marked FDG uptake. Fused PET/CT or MR imaging,in conjunction with a thorough patient history, can be used todecrease the risk of false positive PET interpretation and tocorrectly reach a diagnosis of Teflon granuloma withoutunnecessary medical intervention.KEY WORDS: Teflon granuloma, velopharyngeal insufficiency,PET false positivePaper 116 Starting at 11:32 AM, Ending at 11:37 AMFetal Rhabdomyoma Demonstrated by Prenatal MRImagingO’Callaghan, M. G. A. · House, M. · Bhadelia, R. A.Tufts-New England Medical CenterBoston, MAPURPOSEWe present a rare case of posterior triangle fetal rhabdomyomadetected by prenatal MR imaging. Postnatal evaluationand therapy are discussed.MATERIALS & METHODSPrenatal evaluation consisted of ultrasound and MR with T2weighted ultra fast imaging. Postnatal evaluation was performedwith contrast-enhanced MR imaging and CT followedby angiography and embolization. The patient wasfollowed for 2 years postsurgery.CONCLUSIONAlthough fetal rhabdomyoma is a rare head and neck tumor,it is important to consider this benign neoplasm in the differentialdiagnosis of head and neck masses on prenatal MRimaging.KEY WORDS: Fetal, MR imaging, rhabdomyomaPaper 117 Starting at 11:37 AM, Ending at 11:42 AMBarotrauma Presenting as Temporal Lobe InjurySecondary to Temporal Bone RuptureCortes, M. D. P. · Nugent, R. A. · Longridge, N. S.Vancouver General HospitalVancouver, BC, CANADAPURPOSEWe wish to report the unique neuroimaging findings resultingfrom an uncontrolled scuba diving ascent.MATERIALS & METHODSA 31-year-old male developed acute left ear pain whileascending from 30-ft scuba dive. He continued to havesevere otalgia while at the surface and also developed vertigoand decreased hearing. In emergency, he had no neurologicabnormality but his severe pain persisted despite analgesics,prompting a request for a CT scan.RESULTSThe head CT revealed parenchymal hemorrhage and gaswithin temporal lobe overlying the petrous bone, as well asepidural blood and gas in the left middle fossa. No abnormalitywas seen in the temporal bone but bone could not beidentified completely along the roof.
CONCLUSIONTo our knowledge, this is the first report of a case withintracerebral hemorrhage and presumed temporal bone ruptureresulting from barotrauma. A discussion of the mechanismand a brief review of intracranial complications ofbarotrauma will be provided.KEY WORDS: Barotrauma, intracerebral hemorrhage, temporalboneTuesday Morning10:15 AM - 11:56 AMRoom 606 - 609(23c) Pediatrics: General, Functional,and Vascular Imaging(Scientific Papers 118 - 129)89admission to the pediatric intensive care unit (PICU), dayshospitalized, presence of retinal hemorrhage and bone fractures.Measurement of outcome was determined using thePediatric Overall Performance Category Scale (POPCS; 1 =good performance; 6 = death).RESULTSFour children demonstrated elevated lactate and diminishedN-acetyl aspartate within several regions indicating globalischemic injury (lactate positive-global group). These fourchildren all had early seizures, abnormal initial neurologicexaminations and were admitted to the PICU. The meanPOPCS for this group was 3.25. Four children had lactatedetected within at least one region indicating a focalischemic injury (lactate positive-focal group); two of thesechildren had early seizures and two had an abnormal initialneurologic examination. The mean POPCS score was 1.5 forthis group. The remaining three children had no evidence oflactate upon MRS (lactate negative group). These childrendid not have early seizures, require admission to the PICU,or have initial abnormal neurologic examinations. The meanPOPCS score was 1.3 for this group.TuesdaySee also Parallel Sessions(23a) Adult Brain: Epilepsy(23b) Head & Neck: General(23d) Pediatrics: General and LeukoencephalopathyModerators:A. James Barkovich, MDJill V. Hunter, MDPaper 118 Starting at 10:15 AM, Ending at 10:23 AMElevated Lactate as an Early Marker of Brain Injury inInflicted Traumatic Brain InjuryCecil, K. M. · Makoroff, K. L. · Ball, W. S. · Care, M. M.Children’s Hospital Medical CenterCincinnati, OHPURPOSEThe metabolic and neurochemical abnormalities that underlietraumatic brain injury remain poorly understood. Thisstudy aimed to evaluate children with inflicted traumaticbrain injury using MR spectroscopy (MRS). We hypothesizedthat children with hypoxic-ischemic injury indicatedby elevated lactate in the acute phase of injury will haveworse short-term clinical outcomes than those without lactateupon MRS.MATERIALS & METHODSThis study employed proton MRS to sample bilaterally thefrontal lobes and the parasagittal cortex within the parietaland occipital lobes of patients (n = 11, 6 male) with inflictedtraumatic brain injury undergoing a clinical MR examination.Patients measured clinical course while hospitalizedincluded a neurologic evaluation with seizure activity noted,CONCLUSIONPatients with inflicted traumatic brain injury and evidence ofhypoxic-ischemic injury as indicated by elevated lactate onMRS tend to have worse early neurologic status and outcomes.Lactate levels as sampled by MRS may predict earlyclinical outcome in inflicted traumatic brain injury.KEY WORDS: Inflicted traumatic brain injury, MR spectroscopy,outcomesPaper 119 Starting at 10:23 AM, Ending at 10:31 AMMR Venography in Infants and Children: Age-RelatedChanges and Variations of NormalRollins, N. 1 · Ison, C. 1 · Booth, T. 1 · Chia, J. 21Children’s Medical Center, Dallas, TX, 2 Philips MedicalSystems, Dallas, TXPURPOSETo determine the normal appearance of posterior fossavenous sinuses and age-related differences in MR venographyand to compare conspicuity of venous structures on 2DTOF MRV vs timed bolus injected gadolinium-enhanced 3Dgradient-echo MRV (Gd 3D GE MRV) in infants and children.
TuesdayMATERIALS & METHODSOne hundred seven patients, (ages newborn-17 years, mean11.75 years) with seizures or developmental delay and normalMR findings or minimal congenital anomalies werestudied using 2D TOF MR venography (23/5.1/50,TR/TE/flip angle). Eleven children were studied using both2D TOF MRV and Gd 3D GE MRV [6.0/2.0/35, TR/TE/flipangle with over contiguous slices using segmented central k-space ordering (CENTRA)]. Maximum intensity projection(MIP) images were evaluated for transverse sinus dominanceand visibility and presence of an occipital sinus.Conspicuity of the internal jugular veins and intracranialvenous structures as seen by 2D TOF MRV were comparedto that seen on Gd-enhanced 3D GE. The relationshipbetween transverse sinus (TS) dominance and age was evaluatedwith Chi square contingency analysis and the relationshipbetween transverse sinus atresia and age and occipitalsinus involution with age using Chi square trend analysis.RESULTSIn patients < 25 months of age, codominant TS were seen in42%, right dominant TS in 37%, and left dominant TS in21%. Saturation effects limited visualization of the TS in52% of patients. Occipital sinuses were observed in 13% andTS atresia in 5%. Between 25 months-5 years, 35% hadcodominant TS, 35% right dominant TS, and 30% left dominant;18% had TS atresia and 12% had occipital sinuses.Among patients 6-17 years, 34% had codominant TS, 50%right dominant TS and 16% left dominant, 13% had an atreticTS and 2% had persistent occipital sinus. Conspicuity ofthe intracranial venous sinuses on the Gd 3D MRV wasjudged equal to or better than on the 2D TOF MRV in 11/11patients. Visualization of the IJV was better on the 3D MRVthan the 2D TOF MRV in 5 patients, comparable in 4patients, and of lesser quality on the 3 D MRV in 2 patients.CONCLUSIONAge-related changes in posterior fossa venous anatomyinclude increasing frequency of right transverse sinus dominancewith age (p = 0.026), involution of occipital sinuses (p= 0.038), and increasing frequency of transverse sinus atresia.Caution should be used before the diagnosis of posteriorfossa venous occlusive disease is made especially inneonates and young infants on the basis of signal loss whenusing 2D TOF MRV. Gadolinium-enhanced 3D MRV providessuperior delineation of venous structures and may beneeded to clarify posterior fossa and internal jugular venousanatomy in some patients.KEY WORDS: MR venography, pediatrics90Paper 120 Starting at 10:31 AM, Ending at 10:39 AMIntegration of MR Perfusion Abnormalities and CerebralVascular Reactivity Changes in Patients with MoyamoyaDiseaseKassner, A. 1 · Crawley, A. 1 · Rowan, S. 2 · Roberts, T. P. L. 3· Mikulis, D. 21University Health Network and University of Toronto,Toronto, ON, CANADA, 2 The Toronto Western Hospital,Toronto, ON, CANADA, 3 University of Toronto, Toronto,ON, CANADAPURPOSEThere are two primary methods currently used for assessingblood flow abnormalities in patients with moyamoya disease.These are resting perfusion techniques and vasoactivechallenge methods. This study integrates resting perfusionmeasurements using dynamic contrast-enhanced susceptibilityMR imaging with measurements of cerebral vascularreactivity with a CO 2 challenge using BOLD MR imaging toprovide a comprehensive characterization of the vasculardysfunction in moyamoya disease.MATERIALS & METHODSBOLD MR imaging and dynamic contrast-enhanced susceptibilityMR imaging (DSCI) were performed in 5 patientswith angiographically confirmed moyamoya disease (4 unilateral,1 bilateral case) on a 1.5 T clinical MR system (GEMedical Systems, Signa Echospeed). The BOLD sequencewas combined with a rebreathing challenge (TR = 2240 ms,TE = 40 ms, FOV = 200 mm, slice thickness = 4.5 mm, no.of slices = 28, matrix 64 x 64 with spiral readout). The CO 2challenge was applied and acquisition continued for 6 min (8cycles of high and low pCO 2 ). Dynamic contrast-enhancedsusceptibility imaging was performed using a single-shotGE-EPI sequence (TR = 1750 ms, TE = 30 ms, FOV = 220mm, slice thickness = 5 mm, no. of slices = 18, matrix=128*128, temporal resolution = 1.7 s). A bolus of Gd-DTPA (7cc/s) was administered immediately at the start ofthe dynamic EPI sequence. Data acquisition continued for 25dynamics. BOLD data was transferred to an independent WSfor further analysis. CVR maps were calculated as describedpreviously by Vesely, et al. Parametric maps of relative cerebralblood volume (rCBV) and mean time to enhance (MTE)were calculated on a clinical WS using Functool. Regions ofinterest were selected in areas of negative reactivity andcompared to the homologous ROIs in the contralateral hemisphere.Mean and standard error of the mean (SEM) wererecorded and tested for significance using a students t-test.RESULTSParametric perfusion and CVR maps of unilateral diseasedemonstrate abnormalities (delayed perfusion, negativeCVR ) compared to the contralateral hemisphere (MTE wasdelayed in all cases by 9.4% ± 3.3%, p < 0.05; mean CVR inabnormal hemisphere was -0.010 ± 0.019 compared to+0.039 ± 0.006 in contralateral hemisphere with p < 0.05).However, perfusion parameter maps became more difficultto threshold in bilateral disease since no reliably normallyperfused tissue was present. In contrast, the CVR maps outlinedareas of low or negative reactivity for unilateral andbilateral cases which are threshold independent becauseCVR methodology yields absolute quantitation and is independentof an input function (in contrast to the perfusion
methodology). Cerebral blood volume was not consistentlyabnormal (in all cases, p = 0.87) despite the evidence of significanttiming delays and negative reactivity.CONCLUSIONOur results suggest that CBV measurements are inadequateand that maps showing impaired circulatory delays (e.g.,MTE) and evidence of CVR impairment are much more usefulin assessing patients with moyamoya disease.Furthermore, CVR permits easy identification of low or negativereactivity - features which identify areas with severevascular compromise in both unilateral and bilateral diseasestates. Dynamic contrast-enhanced susceptibility imagingfails to provide reliable results in bilateral cases. In summary,CVR provides unambiguous quantitative determination ofdiseased tissue, allowing targeted assessment (ROI placement)of local perfusion. Integrating both approaches providesa more comprehensive assessment of vascular integrity.KEY WORDS: Moyamoya disease, perfusion, cerebral vascularreactivityPaper 121 Starting at 10:39 AM, Ending at 10:47 AMNeurovascular Anomalies in Posterior FossaMalformations, Facial Hemangiomas, IntracranialArterial, Cardiac, and Eye Syndrome: Findings onScreening MR Imaging and MR Angiography in FiveChildrenLowe, L. H. 1 · Church, D. G. 2,3 · Horii, K. A. 1 · Nopper, A.J. 11Children’s Mercy Hospital, Kansas City, MO, 2 University ofMissouri, Kansas City, MO, 3 St. Luke’s Hospital, KansasCity, MOPURPOSEThe purpose of this case series is to present the spectrum ofasymptomatic neurovascular and anatomical findings in fivechildren with posterior fossa malformations, facial hemangiomas,intracranial arterial, cardiac, and eye anomalies(PHACE) syndrome emphasizing early detection of theseanomalies using screening MR imaging and MR angiography.MATERIALS & METHODSA retrospective review of the medical records of 5 childrenwith PHACE syndrome was performed. Data collectedincluded demographics, congenital anomalies of all systems,and neuroimaging findings.RESULTSFour of five (80%) children had intracranial arterial anomaliesof the circle of Willis (vascular tortuosity and dilatation,focal aneurysms, hypoplasia) on screening MR angiography,and 3 of 5 (60%) had Dandy-Walker malformationson MR imaging. Less frequent anomalies included subglottichemangioma, absent septum pellucidum, cardiac defects,aortic anomalies, and ophthalmologic anomalies.91CONCLUSIONIn children with facial hemangiomas and possible PHACEsyndrome, screening MR imaging and MR angiography areuseful in the detection of various asymptomatic anomalies ofthe brain and intracranial arteries. Identification of theseanomalies may prove important by identifying childrenrequiring early intervention or close follow-up.KEY WORDS: PHACE syndrome, MR angiography, neurovascularPaper 122 Starting at 10:47 AM, Ending at 10:55 AMAngiographic Appearances of Primary ChildhoodCentral Nervous System Vasculitis and a Comparisonwith MR AngiographyAviv, R. I. 1,2 · Benseler, S. M. 2 · Tsang, L. M. 2 · Tyrrell, P.M. 2 · Silverman, E. D. 2 · DeVeber, G. 2 · Armstrong, D. 21Kings College Hospital, London, UNITED KINGDOM,2The Hospital for Sick Children, Toronto, ON, CANADAPURPOSEConventional angiography (CA) is considered to be the goldstandard in primary childhood appearances of the centralnervous system (cPACNS). Primary appearances of the centralnervous system (PACNS) is well described for adults,although no radiographic criteria have been determined sofar for cPACNS. The aim of this study was to identify theangiographic features of cPACNS using CA and to compareMR angiography (MRA) against this reference standard.MATERIALS & METHODSA retrospective single center cohort study of children (2months - 18 years old) diagnosed between January 1990 and31 December 2001 was performed. Neonates and childrenwith secondary vasculitis (Sickle cell disease, moyamoya,migraines, SLE) were excluded. Thirtytwo patients who hadpresentation MRA and angiography within a month wereanalyzed. Twenty-seven patients with 64 vasculitic CNSlesions were included. The median age at initial MRA andCA was 7.6 years (0.8-16.5 years).RESULTS84.4% (54/64) of cPACNS lesions were stenosis, 12% wereocclusions, and 3% were aneurysms. The mean stenosis was50.4% (Sdev 24.0%). Collateral supply was demonstrated in4/27 patients. Sevent-six percent had multifocal vesselinvolvement, 19% had five or more. Unifocal lesions wereseen in 23.8%. Unilateral involvement was more commonthan bilateral disease (90.5% vs 9.5%, P < 0.05). The distributionof lesions was proximal in 76% of lesions and distalin 9.5%. When comparing CA and MRA, 45 of 64 CAlesions were correctly identified by MRA (sensitivity 70.3%(95% CI 70.2-70.4%, specificity 97.5% (95% CI 93.6-100%). The positive and negative predictive values 71.4%, 97.4%.There was no significant difference between MRA and CAfor lesion detection (p = 0.87). Stenosis of 75-99% was correctlygraded in 77.8% of cases with MRA. Stenosis between50% and 75% had lesser agreement of 48%.Tuesday
92TuesdayCONCLUSIONThis is the largest series of cPACNS and the first to clarifyangiographic appearances in this condition. Angiographicfindings differ from adult PACNS. Multifocal stenoses arethe hallmark of cPACNS and occur predominantly unilaterallywithin the anterior circulation. The proximal vasculatureis affected most with lesser involvement of distal and posteriorcirculation. Although CA remains the gold standard incPACNS, there was no significant difference in the ability ofMR angiography to detect and characterize lesions comparedwith angiography (p = 0.87). Understanding the limitationsof MRA, there is a role for its use in the follow-up ofcPACNS patients.KEY WORDS: Childhood, PACNS, angiographyPaper 123 Starting at 10:55 AM, Ending at 11:03 PMPitfalls of Imaging Transcranial Doppler Used Alone in aSickle Cell Anemia Screening ProgramMoron, F. E. 1,2 · Munden, M. 1 · Cassady, C. 1 · Hunter, J. V. 11Baylor College of Medicine, Houston, TX, 2 Children’sHospital, Houston, TXPURPOSETo report the risk of misinterpreting a normal transcranialDoppler imaging (TCDI) in isolation from cross-sectionalimaging and complete clinical history in a screening populationof homozygous sickle cell anemia (SCA) patients.Stroke occurs at least in 10% of these children and the riskincreases as the cerebral blood flow velocities rise (1).Transfusion greatly reduces the risk of a first stroke in childrenwith SCA who have abnormal results on TCDI (2).Medicaid currently pays for TCDI screening of homozygousSCA and beta thalassemia children based on the STOP trials(1-2). There is no automatic payment for MR imaging-MRangiography (MRI-MRA) and this may lead to a suboptimaloutcome.MATERIALS & METHODSRetrospective review of homozygous SCA children recruitedto the imaging ultrasound screening program of a tertiaryreferral pediatric hospital (Texas Children’s Hospital) wasmade. Correlation with subsequent MRI-MRA and review ofthe medical record was performed.RESULTSSeveral children who did not meet the STOP criteria forabnormal TCD underwent subsequent MRI-MRA and werefound to have evidence of large vessel vasculopathy withestablished stroke despite peak mean velocities that were notin the abnormal range (i.e., less than 185 cm/sec) (3).CONCLUSIONIt should be recognized that a sufficient degree of narrowingat the level of the terminal ICA and/or proximal M1 segmentscan lead to falsely low/normal peak mean velocities inthe presence of basal occlusive disease.REFERENCES1. Adams RJ, Virgil CM, Don B, et al. Stroke Prevention Trial inSickle Cell Anemia. Control Clin Trials 1998;19(1):110-1292. Adams RJ, McKie VC, Hsu L, et al. Prevention of a FirstStroke by Transfusions in Children with Sickle Cell Anemiaand Abnormal Results on Transcranial DopplerUltrasonography. N Engl J Med 1998;339(1):5-113. Bulas DI, Jones A, Seibert JJ, et al. Transcranial Doppler(TCD) Screening for Stroke Prevention in Sickle CellAnemia: Pitfalls in Technique Variation. Pediatr Radiol2000;30(11):733-738KEY WORDS: Sickle cell anemia, transcranial Doppler, MRimagingPaper 124 Starting at 11:03 AM, Ending at 11:11 AMValue of 3D Volume Rendering and 2D MultiplanarReformatting in the Postprocessing of PediatricNeurovascular CT Angiographic DataPanigrahy, A. 1 · Salamon, N. 2 · Duckwiler, G. 2 · Vinuela, F. 1· Nelson, M. D. 1 · Villablanca, P. J. 21Children’s Hospital of Los Angeles, Los Angeles, CA,2University of California Los Angeles Medical Center, LosAngeles, CAPURPOSEThe purpose of this study was to determine the value of 3Dvolume rendering and 2D multiplanar reformatting vs rawmultidetector CT angiographic data in patients with pediatricneurovascular diseases.MATERIALS & METHODSMultidetector CT angiography was performed in 60 pediatricpatients with a spectrum of neurovascular diseases at twomajor children’s hospitals. The images were sent by digitalnetwork to both a PACS workstation (nonprocessed data set)and a Vitrea (Vital Images) workstation. The raw imageswere postprocessed using 2D gray scale multiplanar reformatting(MPR) (oblique, curved oblique, automatic curvedoblique) and 3D volume rendering. The postprocessedimages were compared to raw nonprocessed CTA data sets(source axial 2D images) with respect to (1) lesion detection;(2) lesion characterization; and (3) important image findingsnot detectable on the raw images. Statistical analysis wasperformed using a Fischer-Freeman-Halton test.RESULTSPostnatal ages ranged from 10 months to 18 years with themedian age, 10 years. Thirty-six of 60 studies were abnormal.Pathologic findings included: AVM (n = 4), aneurysm(n = 3), miscellaneous vasculopathy (n = 21), dissection (n =6), and venous anomalies (n = 2). Both the source axial 2Dand 3D images detected all lesions. Two-dimensional MPRand 3D processed image data clarified ambiguous findingson source images in 25% of cases. The 3D volume renderedimages were superior to the source images in characterizingthe spatial relationships of lesion components to normalregional anatomy. Lesion quantitation was superior by 2Dcurved oblique MPR techniques when performing measurementsof tortuous vascular pathology or oblique projectinganeurysms. The 2D MPR curve oblique reformatted imageswere superior to the source 2D images in the quantitativeanalysis of cervical dissection and in the visualization of inti-
mal flaps and intramural hematoma. In a subset of patientswith serial examination, 2D MPR techniques allowed forconsistent reproducible accurate measurements of luminalstenosis over multiple time points.CONCLUSIONThree-dimensional volume rendering and 2D MPR of multidetector3D CT angiography are useful adjunctive tools inthe characterization of pediatric neurovascular helical CTAsource image data when compared to source data alone.Lesion quantitation is superior by 2D MPR techniques whendealing with eccentric luminal stenosis, nonorthogonalmeasurements, and tortuous vascular pathology. Two-dimensionalMPR also provided accurate reproducible measurementsof luminal stenosis in the analysis of serial data.KEY WORDS: CT angiography, multiplanar reformatting,volume renderingPaper 125 Starting at 11:11 AM, Ending at 11:19 AMFunctional MR Imaging Study of Emotional StroopPerformance in Adolescents with Disruptive BehaviorDisorderWang, Y. · Mathews, V. · Kronenberger, W. · Li, T. · Dunn,D. · Kalnin, A. · Mosier, K.Indiana University School of MedicineIndianapolis, INPURPOSEWhile performing a modified Stroop task using emotionalwords, aggressive disruptive behavior disorders (DBD)patients and matched healthy subjects were studied usingfunctional MR imaging (fMRI) to evaluate brain activationelicited by emotional stimuli.MATERIALS & METHODSAll subjects were screened with DSM IV criteria. Fourteensubjects fulfilled the diagnostic criteria for DBD with at leastone of seven aggression criteria. A control group of 14 subjectswith no psychiatric diagnosis, matched on age, gender,and IQ with the DBD subjects, also was recruited. All subjectsand their parents rated the subjects’ violent media exposure(VME) in the past. The paradigm consisted of 9 alternatingcontrol (5) and activation (4) 30-second blocks. Eachsubject was requested to press different buttons according tothe ink color of the visually presented word after silentlypronouncing the word. During the activation period, wordsdescribing violent actions (e.g. hit, harm) were presented,while nonviolent action words (e.g., run) were shown forcontrol phase. All words were selected by an experiencedpsychologist, so that violent and nonviolent words were balancedfor general use frequency in the English language.Functional MR imaging data were acquired as follows: 3Ddual echo spiral sequence with TR/TE/TE2 = 3000//35/70ms; 32 3.8 mm contiguous axial slices for 100 repetitions (5minutes). Functional scan data were motion corrected usingAFNI. Cross correlation of single voxel MR imaging timeseries was performed using a gamma variate reference functionafter removal of linear baseline drifts to create individualactivation maps of percentage signal change of activationphase vs control phase. All single subject maps were transformedinto Talairach space and merged to different groupmaps (control and DBD x high and low VME).93RESULTSBehavioral performance data showed that the emotionalStroop task reliably produced interference effects onresponse latency and accuracy across subjects. However, statisticallysignificant differences were found only betweenDBD subjects with high and low MVE (p < 0.05). FunctionalMR imaging group maps showed significant signal changes(p < 0.01) in the anterior cingulate cortex (ACC),orbitofrontal cortex (OFC), left dorsolateral prefrontal cortex(DLPFC) in the DBD group, while activation was mainlyobserved in left DLPFC and amygdala in the control group.In both DBD and control groups, subjects with high MVEdemonstrated more activation in OFC than subjects with lowMVE.CONCLUSIONThis study using the Stroop paradigm with emotional contentextends our previous findings by demonstrating differentfMRI activations by DBD and control groups with low orhigh MVE. Differences in signal changes between the DBDand control group, as well as between groups with high andlow MVE, may suggest a greater tendency to activate brainregions associated with self-control and executive functioningwhen individuals with DBD and/or high MVE are presentedwith emotional stimuli. This may reflect greater reactivityto emotional stimuli than is seen in controls and inindividuals with low MVE.KEY WORDS: fMRI, disruptive behavior disordersPaper 126 Starting at 11:19 AM, Ending at 11:27 AMBOLD Contrast Functional MR Imaging in PresurgicalMapping of the Brain Cortex of Pediatric Patients withBrain Space Occupying LesionsCaulo, M. · Ferretti, A. · Cifaratti, A. · Gorgoglione, A. ·Tartaro, A. · Colosimo, C.University of ChietiChieti, ITALYPURPOSEBOLD contrast functional MR imaging (fMRI) has becomea well consolidated noninvasive procedure for presurgicalmapping of cortical functions in adult patients. We adoptedthe paradigms used for adults to the cognitive level of pediatricpatients and studied compliance in a group of childrenin whom cortical mapping was required for surgery.MATERIALS & METHODSEleven young patients (7 females, 4 males; age range 9-16years) with brain lesions were studied. Consciousness andsensory-motor functions were within normal limits in all butone patient. Functional MR imaging was performed accordingto a block paradigm alternating rest/control to task conditions.Motor functions were explored using the “finger tapping”task for the hand, toe flexion for the foot, and lip contractionfor the facial area. Hemispheric dominance for languagewas assessed using two tasks: (1) object-naming(patients were required to silently name objects representedin pictures projected on the screen) and (2) word generation.This latter task was obtained by asking the patients to generatewords beginning with a given letter; the letter was projectedtogether with a drawing of a cargo-ship which,metaphorically, is carrying a large amounts of words. ATuesday
Tuesdaytraining session of approximately 1 hour was conductedimmediately before the fMRI. Functional MR imagingacquisitions were performed with a 1.5 T MR unit usingBOLD technique with echo-planar imaging. Functional MRimaging data were analyzed with Brain Voyager 4.9 software.RESULTSComplete cooperation of all but one patient was obtained.The finger-tapping task yielded good somatotopical congruenceexcept in a patient with cortical displasia of the leftmotor cortex: in this patient right finger tapping activated aregion that was located more laterally and ventrally thanexpected. Lips contraction bilaterally activated the base ofthe precentral gyrus. The word generation task activated theinferior frontal gyrus and posterior superior temporal regionwith either a strong left (7 patients) or right (4 patients) lateralization(Figure 1). Seven patients were operated: vascularmalformation (3), tumors (5), and cortical dysplasia (2).Patients have to date undergone multiple follow-up visitsand none reported any new neurologic deficit after surgery.Fig. 1 Right parietal ganglioglioma in an11-year-old boy.Activation during the “word generation” task in the lefthemisphere (Brocà’s and Wernicke’s areas). Activation in theleft precentral gyrus which most likely represents the vocalizationcenter.CONCLUSIONFunctional MR imaging is a feasible technique for presurgicalmapping of the cerebral cortex in pediatric patients withbrain lesions. The use of very simple and not time-consumingtasks makes fMRI possible in young patients after anadequate training. Brain mapping allowed surgical saving offunctionally eloquent regions of the cortex and ensured agood clinical outcome.KEY WORDS: Brain tumor, fMRI, pediatric94Paper 127 Starting at 11:27 AM, Ending at 11:35 AMProton MR Spectroscopic Imaging in DifferentialDiagnosis of Pediatric Brain LesionsHourani, R. · Albayram, S. · Okoh, J. · Melhem, E. R. ·Cohen, K. · Weingart, J. · Carson, B. · Burger, P. · Barker,P. B.Johns Hopkins HospitalBaltimore, MDPURPOSENoninvasive diagnosis of brain lesions prior to surgery mayassist the treatment and reduce risks to patients. Our aim wasto investigate whether proton MR spectroscopic imaging(MRSI) can aid in differentiating between brain tumors andnononcologic pediatric lesions.MATERIALS & METHODSWe retrospectively examined 31 children with primary brainlesions (age = 10 ± 5 years, 20 boys). Twenty patients had abrain tumor, neuropathologically confirmed (high-gradegliomas (n = 8), low-grade glioma (n = 6), medulloblastoma,choroid plexus carcinoma, ganglioglioma, xanthoma, leptomeningealgliomatosis, germinoma (one each)). Elevenpatients had a benign stable lesion (acute demyelinatingencephalomyelitis (ADEM, n = 4), mesial temporal sclerosis,postsurgical gliosis, hamartoma, edema associated withhematoma (one each), nonpathologically confirmed lesions(n = 3)) and have been followed up for 2 years with no evidenceof lesion progression and clinical deterioration. MRimaging and multislice MRSI (1) were performed at 1.5 Tbefore any treatment. Three or four oblique axial slices weremeasured with slice thickness/gap = 15 mm/2.5 mm, TR/TE= 1700 (or 2300)/280 ms. In the spectra, which were evaluatedin the lesion and in the contralateral normal appearingparenchyma, signals of N-acetyl aspartate (NAA), creatine(Cr) and choline (Cho) were detected. Ratios NAA/Cho,NAA/Cr, and Cho/Cr were evaluated from areas under therespective signals.To compare metabolite ratios in lesions and normal tissue,the Wilcoxon paired signed rank test was applied. Statisticalsignificance was set to p < 0.05. Data are presented as means± standard deviations.RESULTSFigure 1 shows examples of spectra in a tumor (1a) and anononcologic lesion (1b). Compared to normal appearingtissue, average ratios NAA/Cho (0.67 ± 0.32) and NAA/Cr(1.24 ± 0.56) were lower by 60% and 41%, respectively, andaverage Cho/Cr (2.02 ± 0.83) was higher by 55% in malignanttumors (p = 0.0001, 0.0003 and 0.002, respectively). Instable lesions, NAA/Cho (1.05 ± 0.49) was lower by 44%and Cho/Cr (1.51 ± 0.4) higher by 24% (p = 0.003 and 0.05,respectively) than in control regions. No significant differencein NAA/Cr between nononcologic lesions and controltissue was identified. Average ratio NAA/Cho was by 36%lower and average Cho/Cr was by 34% higher in malignanttumors than in stable lesions (Figure 1c, both p = 0.05). Nosignificant difference in ratio NAA/Cr between malignanttumors and nononcologic lesions was detected.
95CONCLUSIONOur study demonstrates a promising role of proton MRSI fordistinguishing brain tumors from nononcologic lesions.Higher ratio Cho/Cr and lower ratio NAA/Cho presumablyreflects higher Cho levels in tumors, in agreement with previouslypublished data (2-5). Proton MRSI may thereforehave a valuable diagnostic importance, particularly in inoperableor inaccessible lesions.REFERENCES1. Duyn JH, et al. Radiology 1993;188:277-2822. Tzika AA, et al. J Neurosurg 2002;96:1023-10313. Hwang JH, et al. AJNR Am J Neuroradiol 1998;19:535-5404. Wang Z, et al. AJNR Am J Neuroradiol 1995;16:1821-18335. Lazareff JA, et al. Childs Nerv Syst 1996;12:130-135KEY WORDS: Pediatric brain tumors, proton MR spectroscopicimaging, cholinePaper 128 Starting at 11:35 AM, Ending at 11:43 AMMR Spectroscopy of Pediatric Brain Lesions withIndeterminate Conventional MR ImagingTate, K. R. 1 · Palasis, S. 2 · Hudgins, R. J. 2 · Reisner, A. 2 ·Jones, R. 2 · Grattan-Smith, D. 21Emory University School of Medicine, Atlanta, GA,2Children’s Healthcare of Atlanta at Scottish Rite, Atlanta,GAPURPOSEPrimary brain neoplastic and nonneoplastic mass lesions inpediatric patients often have similar nonspecific MR imagingcharacteristics. We present a retrospective review of 22patients with primary cerebral mass lesions evaluated byconventional MR imaging that demonstrate MR spectroscopy(MRS) patterns distinct from those observed withlow- or high-grade brain tumors.MATERIALS & METHODSTwenty-two children with primary brain lesions demonstratingstability on follow-up imaging or with a pathologicallyproven diagnosis of benign histology were reviewed. All childrenhad both conventional MR imaging and proton MRS.Short and long TE MRS was performed and compared withspectra from pathologically proven low-grade and high-gradebrain tumors with a similar conventional MR appearance.RESULTSPatients with benign histology or stable follow-up MR findingshad a distinct MRS pattern. The pattern observed wascharacterized by mild decrease in NAA, normal creatine, noremarkable elevation of choline, and normal to slightlyincreased myoinositol.CONCLUSIONMR spectroscopy can help differentiate nonneoplastic masslesions from brain neoplasms that demonstrate nonspecificconventional MR appearance. This is particularly effectivein pediatric populations which have a relatively high percentageof such lesions. MR spectroscopy can provide tissuespecificity greater than MR imaging. MR spectroscopypotentially can influence clinical management and couldobviate the need for future biopsy.KEY WORDS: MR spectroscopy, pediatric brain lesions, lowgradebrain neoplasmPaper 128A Starting at 11:43 AM, Ending at 11:51 AMNeuroimaging In 479 Term Infants Diagnosed WithHypoxic Ischemic Encephalopathy (HIE).Poskitt, K. J. · Hill, A. · Roland, E. · Sargent, M. A.B.C.’s Children’s HospitalVancouver, BC, CANADAPURPOSETo review the changing patterns of injury identified by neuroimagingin term infants who suffered HIE.MATERIALS &METHODSSince 1985 neonates clinically suspected to have sufferedfrom HIE and imaged in the first week of life have beenentered into a database. Four hundred seventy-nine terminfants underwent CT imaging at 72 hours according to ourprotocol(1). Follow up ranged from 18 months to 15 years.Since 1994, 79 (36%) patients were imaged with MR.Imaging reports were filed with the request form andbetween 2002-2003, all studies were reviewed by twoobservers for the degree and location of involved cortex,white matter, thalami and basal ganglia, brainstem, and cerebellum.30% of cases were double read.RESULTSThe 2002 classification agreed with the reports in 97% ofcases. Imaging was normal in 234, and increased from 33%before 1994 to 54% after. As reported (1), CT findings werepredictive of neurologic outcome with 85% positive predictivevalue (PPV) and 83% NPV. Seventy-nine MRIs wereobtained; 17 (22%) between days 1-4, 25 (32%) days 5-9, 30(38%) days 10-14 and only 6 between days 15-21. 31% ofMRIs were obtained in patients with acute profound asphyxia,15% in severe prolonged partial, 33% in CT normal and16% in equivocal studies. Since 1994, 49% of all patientswith acute profound asphyxia have had MRIs. 20% ofpatients with severe prolonged partial asphyxia identified byCT have been imaged. CT and MR agreed in 69/79 (87%) ofcases. CT missed 2 thalamic injuries seen on MR in patientswho developed choreoathetoid CP, while CT correctly recognized4 cases missed by MR imaging at 10 days of life.Selective white matter injury was missed twice on MR andtwo discordant cases were due to inadequate imaging. ThereTuesday
Tuesdaywas no difference in the ability of CT or MR to predict neurologicaloutcome. Imaging patterns of cerebral injurychanged markedly over time. Acute profound asphyxia representedonly 16% of abnormal cases before 1994 but 54%of cases after 1994. The imaging frequency of pure prolongedpartial injury and combined patterns of injurydropped by 50% since 1994. Fifty percent of all cases of pureprolonged partial injury or combined patterns of injury hadbeen collected by 1991 compared to 1996 for acute profoundasphyxia.CONCLUSIONWe have accumulated a database of infants believed to havesuffered from HIE who underwent neuroimaging and havelong-term clinical follow up. Based on 479 CTs and 79 MRsthere has been no significant difference in the ability of day3 CT and early MR studies to identify patterns of injury andpredict neurological outcome. There has been a significantchange in the patterns and severity of neonatal injury overthe past 16 years.REFERENCES1. K. Poskitt, R. Phillips, A. Hill, E. Roland. CT Imaging ofHypoxic Ischemic Encephalopathy <strong>ASNR</strong> Vancouver May 1993KEY WORDS: hypoxic ischemic encephalopathyPaper 129 Starting at 11:51 AM, Ending at 11:56 AMCombined Positron Emission Tomography/CT Imagingof Pediatric Head and Neck Oncologic DiseaseJackson, H. A. 1 · Panigrahy, A. 1 · Quon, A. 2 · Czernin, J. G. 21Childrens Hospital Los Angeles, Los Angeles, CA,2University of California Los Angeles Medical Center, LosAngeles, CAPURPOSERecently, combined CT/PET imaging has been introducedand recent studies have proven that combined CT/PET imagingmay improve the diagnostic accuracy of staging of adulthead and neck oncologic disease. However, the use of combinedCT/PET imaging has not been studied specificallywith respect to pediatric head and neck oncologic disease.The purpose of the study was to evaluate the added value ofusing combined PET/CT imaging compared to PET imagingalone in the characterization of PET lesions in pediatric headand neck oncology.MATERIALS & METHODSA total of 15 consecutive head and neck PET/CT examinationswere performed in a total of 10 pediatric patients.Following the iv injection of 18-fluoro-2-deoxyglucose(FDG) and a standard uptake period, each patient wasimaged on a CT whole body PET/CT (CTI Reveal) scanner.After a whole body CT image was acquired for photon attenuationcorrection, multiple 3-minute bed position acquisitionswere obtained along the length of the patient’s bodyfrom the midthighs to the base of the skull. Lesions were initiallyidentified and characterized on PET alone. The lesionsthen were compared in a retrospective manner between thePET alone and the combined PET/CT images. Tumor stagingwas confirmed histologically in a subset of patients.96RESULTSThe diagnoses included papillary thyroid carcinoma (n = 3),Hodgkin’s disease (n = 6), non-Hodgkin’s disease (n = 1).Specific examples of added value of the combined PET/CTimages which will be demonstrated included: (1) betteranatomical localization and differentiation of hypermetabolicfoci in the head and neck region which correlated withnormal anatomical structures demonstrating brown fat ornormal physiologic function; (2) better anatomical localizationof tumor recurrence; (3) better anatomical localizationof hypermetabolic foci in Hodgkin’s disease lymph nodesnot considered significant due to CT size criteria.CONCLUSIONThis study suggests that combined PET/CT imaging providesadded value regarding PET lesion characterization in asubset of pediatric head and neck oncologic cases whencompared to PET alone.REFERENCES1. Lardinois D, Weder W, Hany T, et al. Staging of Non-Small-Cell Lung Cancer with Integrated Positron EmissionTomography and Computed Tomography. N Engl J Med2003;348:2500-25072. Kluetz PG, Meltzer CC, Villemagne VL, et al. CombinedPET/CT Imaging in Oncology: Impact on PatientManagement. Clin Positron Imag 2000;3:223-2303. Hany TF, Steinhert HC, Goerres GW, Buck A, von SchulthessGK. PET Diagnostic Accuracy: Improvement with In LinePET-CT System: Initial Results. Radiology 2002;225:575-5814. Antoch G, Freudenberg LS, Stattaus J, Jentzen W, Mueller SP,Debatin JF, et al. Whole Body Positron EmissionTomography-CT: Optimized CT Using Oral and IVContrast Materials. AJR Am J Roentgenol 2002;179(6):1555-1560KEY WORDS: CT/PET imaging, lymphoma, brown fat
97Tuesday Morning10:15 AM - 11:50 AMRoom 611 - 612(23d) Pediatrics: General andLeukoencephalopathy(Scientific Papers 130 - 142)See also Parallel Sessions(23a) Adult Brain: Epilepsy(23b) Head & Neck: General(23c) Pediatrics: General, Functional, and VascularImagingModerators:P. Ellen Grant, MDSusan Palasis, MDPaper 130 Starting at 10:15 AM, Ending at 10:23 AMApparent Diffusion Coefficient and Cerebrospinal FluidFlow Measurements in Patients with HydrocephalyDemirci, A. · Anik, Y. · Arslan, A. · Anik, I. · Etus, V.Kocaeli University School of MedicineKocaeli, TURKEYPURPOSETo evaluate and correlate diffusion MR and CSF flow imagingin hydrocephaly before and after treatment.MATERIALS & METHODSEighteen patients (12 female, 6 male), 11 of which were inthe pediatric age group were included in the study. Of thepediatric age group 9 were under 1 year old. The pediatricage group consisted of 8 primary aquaductal stenosis, 2Dandy-Walker malformation with aquaductal stenosis and 1hydrocephaly following operation for myelochisis. In theadult patient group 6 had normal pressure hydrocephaly and1 had pineal gland tumor with mass effect on aquaductussylvii. As control group 21 healthy age-matched patientswere examined. Cerebrospinal fluid flows measurementswere obtained in the aquaduct in all patients and in the prepontinecistern in 16 patients with third ventriculostomy. Thechanges in ADC values from 8 ROIs were evaluated. Thechange in frontooccipital ratio (FOR) was calculated andperiventricular hyperintensity was assessed before and aftertreatment. Cerebrospinal fluid flow parameters, FOR, andperiventricular hyperintensity were correlated with ADCvalues. Additionally ADC values of the study group beforeand after treatment were compared with that of the controlgroup.RESULTSApparent diffusion coefficient values were significantlyhigher in the preoperative period than the postoperative period(p < 0.05). The preoperative ADC values were significantlyhigher than that of the age-matched control group (p< 0.05). The postoperative ADC values were similar to thecontrol group values. The decrease in ADC values showedlinear correlation with CSF flow measurements. There weresignificant correlations among the changes of FOR, ADCvalues, and CSF flow parameters.CONCLUSIONApparent diffusion coefficient measurement is found to beuseful in the evaluation of treatment and follow-up ofpatients with hydrocephaly.KEY WORDS: Diffusion MR, hydrocephaly, CSF flowPaper 131 Starting at 10:23 AM, Ending at 10:31 AMLeukoencephalopathy with Vanishing White Matter inFour Brazilian PatientsBrenner, C. 1 · Martins, C. E. S. 1 · Brum, J. M. 1 · Pronk, J. C. 2· van der Knaap, M. S. 21The SARAH Network of Hospitals for the LocomotorSystem, Brasília, BRAZIL, 2 Free University Medical Center,Amsterdam, NETHERLANDSPURPOSETo report the clinical and imaging findings of four patientswith leukoencephalopathy with vanishing white matter(VWM), recently defined as an autosomal recessive disorder(OMIM 603896).MATERIALS & METHODSThe patients, presenting with ataxia and delayed cognitivedevelopment, underwent neurophysiologic studies, metabolicinvestigation, and conventional MR imaging. One patient hadMR spectroscopy (MRS) and diffusion-weighted imagingperformed. Two patients were submitted to molecular studies.RESULTSAll patients developed ataxia during childhood. Cognitivedeficit was recorded. The course of the disease was chronicprogressive.Two patients had additional episodes of morerapid deterioration, provoked by head trauma and infection.Two female patients were siblings and had primary amenorrheadue to ovarian failure (1). No parents were consanguineous.Neurophysiologic studies were progressivelyabnormal, according to the stage of the disease. No inbornerrors of metabolism were detected. Two patients underwentmolecular studies: one of the sisters was compound heterozygousfor two mutation in the EIF2B2 gene (599G > Tand 638A > G), both leading to an amino acid substitution inthe protein. The other patient was homozygous for 338G > Ain the EIF2B5 gene, again leading to an amino acid substitution.MR features were stage-dependent. Extensive cerebralwhite matter changes were found on T2-weighted images.On fluid attenuated inversionrecovery (FLAIR) images, thecerebral white matter was atrophic and almost completelyhypointense on both sides of the brain in the oldest patient,and less hypointense in the youngest ones. Corpus callosumwas affected in all patients.Cerebellar atrophy was universal.Pontine central tegmental tracts had a hyperintense signal onTuesday
TuesdayT2-weighted imaging; another patient had hyperintensepyramidal tracts. A cavum septum pellucidum was present inone patient. MR spectroscopy showed decrease in allmetabolites in the affected areas and increased lactate peak.Lactate also was present in the subcortical areas (2), wherediffusion-weighted imaging displayed restricted diffusion.CONCLUSIONThe imaging findings by MR imaging and MR spectroscopyare characteristic and allow diagnosis. We emphasize theassociation of leukoencephalopathy with VWM and ovarianfailure, which should raise suspicion of this entity.REFERENCES1. Fogli A, Rodriguez D, Eymard-Pierre E, Bouhour F, Labauge P,Meaney BF, et al.Ovarian Failure Related to EukaryoticInitiation Factor 2B Mutations. Am J Hum Genet2003;72:1544-15502. van der Knaap MS, Barth PG, Gabreels FJM, Franzoni E,Begeer JH, Stroink H, et al. A New Leukoencephalopathywith Vanishing White Matter. Neurology 1997;48:845-855KEY WORDS: Leukoencephalopathy, diagnosis, geneticsPaper 132 Starting at 10:31 AM, Ending at 10:39 AMVacuoliting Megalencephalic Leukoencephalopathy withSubcortical Cysts in Seven Brazilian PatientsBrenner, C. 1 · Martins, C. E. S. 1 · Brum, J. M. 1 · Nakayama,M. 2 · Mello, W. D. 3 · Sousa, M. B. O. 3 · Pronk, J. C. 4 · vander Knaap, M. S. 41The SARAH Network of Hospitals for the LocomotorSystem, Brasília, BRAZIL, 2 The SARAH Network ofHospitals for the Locomotor System, Fortaleza, BRAZIL,3The SARAH Network of Hospitals for the LocomotorSystem, São - Luis, BRAZIL, 4 Free University MedicalCenter, Amsterdam, NETHERLANDSPURPOSETo report the clinical and imaging findings of seven patientswith vacuoliting megalencephalic leukoencephalopathy withsubcortical cysts (OMIM 604004).MATERIALS & METHODSThe patients, presenting macrocephaly and delayed motordevelopment, were submitted to neurophysiologic studies,metabolic investigation, and MR imaging. In four patientsmolecular studies were performed.RESULTSAll patients slowly developed ataxia and spasticity.Language development was very poor. Four had epilepsycontrolled with medication. Neurophysiologic studies resultswere variable. No inborn errors of metabolism were detected.Two patients were relatives, uncle and niece, belongingto a highly consanguineous family. They were homozygousfor the del594-597 mutation in the gene MLC1, leading to astop codon and a truncated protein. Another patient washomozygous for the 597delAIVS33bp mutation in MLC1,also leading to a stop codon and truncated protein. Thefourth patient presented no mutation in the gene. MR featureswere megalencephaly with swelling of the abnormalhemispheric white matter, subcortical cysts in the frontoparietalarea and/or temporal lobes tips and persistence of a98cavum of septi pellucidi and vergae. Central white matterstructures were relatively spared. Gray matter was preserved.One patient had an incidental pituitary macroadenoma.CONCLUSIONVacuoliting megalencephalic leukoencephalopathy with subcorticalcysts was first described in 1995 by van der Knaap,et al. (1). Autosomal recessive mode of inheritance was suggested.European countries, Japan, Turkey, and India havereported this entity. Only two cases have been reported inBrazil (2). We report seven new Brazilian patients.REFERENCES1. van der Knaap MS, Barth PG, Stroink H, van NieuwenhuizenO, Arts WFM, Hoogenraad F, et al. Leukoencephalopathywith Swelling and a Discrepantly Mild Course in EightChildren. Ann Neurol 1995;37(3):324-3342. Cavalcanti CE, Nogueira A. Sindrome de Van der Knaap.Megalencefalia com Leucodistrofia. A Respeito de DoisCasos na Mesma Familia. [Van Der Knaap Syndrome.Megalencephaly with Leukodystrophy. Report of 2 Cases inthe Same Family]. Arq Neuropsiquiatr 2000;58(1):157-161KEY WORDS: Leukoencephalopathy, diagnosis, geneticsPaper 133 Starting at 10:39 AM, Ending at 10:47 AMMR Imaging of the Brain in Patients with Isolated SulfiteOxidase DeficiencyFaibel, M. · Hoffmann, C. · Ben-Zeev, B. · Kushnir, T. ·Brand, N. · Anixter, Y. · Quint, J.Sheba Medical CenterRamat-Gan, ISRAELPURPOSESulfite oxidase deficiency is a rare devastating infantile neurometabolicdisease. Both the isolated form and the morefrequent molibdenium cofactor deficiency show similarpresentation: intractable infantile seizures, hypotoniareplaced by spasticity, feeding difficulties, and profounddevelopmental delay. We present 3 cases of isolated sulfiteoxidase deficiency. Two of them are siblings.MATERIALS & METHODSThree patients (2 of them siblings) with isolated sulfite oxidasedeficiency (SOD) presented in the neonatal period withlethargy, intractable seizures, dismorfism, and mixed tone.Metabolic workout was positive for urine sulfite, normalblood uric acid, and low cysteine. Two patients underwentMR study at the 1st month of life and the 3rd patient at theage of 5 months. The MR study included T1- and T2-weightedimages and MR spectroscopy.RESULTSThe early MR studies showed marked T2 and T1 prolongationat the central and the subcortical white matter. The basalganglia and thalami were small with short T1 values containingsmall foci of long T1 and T2 signal. The late MR study atthe age of 5 months was performed on the sibling of the 1stpatients and showed marked atrophy of both gray and whitematter, with no progress of myelination. The CSF spaces,including the ventricles, were enlarged. The MR spectroscopyin all patients demonstrated a very low NAA/Crratio with high ratio of Cho/Cr and high lactate peaks.
99CONCLUSIONWe present 3 cases of SOD with typical MR and MR spectroscopyfindings with good correlation with the severity ofthe clinical condition.KEY WORDS: Sulfite oxidase deficiency, MR imagingPaper 134 Starting at 10:47 AM, Ending at 10:55 AMHemimegalencephaly: MR Imaging in Twelve Childrenwith Pathologic CorrelationsSalamon, N. · Mathern, G. W. · Vinters, H.David Geffen School of Medicine at the University ofCalifornia Los AngelesLos Angeles, CAPURPOSEHemimegalencephaly is a rare malformation causingintractable seizures in early infancy with unilateral hypertrophyof the brain. MR imaging is useful to identify the extentof the disease. The reported anomaly includes abnormalgyral pattern and thickened cortex, over or under developmentof the white matter, and dysmorphic basal ganglia.Twelve cases of hemimegalencephaly were reviewed retrospectivelyand MR images were compared to the pathologicspecimens.MATERIALS & METHODSThe twelve patients including six males and six females werestudied retrospectively. The patient’s age is from 1.5 monthto 42 months at the time of imaging (mean 7 months). Allpatients were presented with severe seizures at birth andunderwent hemispherectomy within 2 months after the MRexam. MR study was performed using 1.5 T Signa with T1sagittal, T2 coronal, T2 axial, and SPGR coronal or axialimages. Pathology specimen was evaluated postsurgicallyand compared to the MR findings. Images were assessed forextent of gray matter anomaly, white matter signal abnormality,basal ganglia involvement, hippocampal involvement,and cerebellar anomaly.RESULTSImaging studies: All patients had multilobar gyral anomaly.The right hemisphere was involved in five patients and lefthemisphere in seven patients. White matter signal abnormalitywas noted in all 12 patients. Basal ganglia signal abnormalitywas seen in seven patients. The basal ganglia were illdefined in five patients. Asymmetry of the olfactory tractwas seen in five cases. Two of them showed tongue-likehypertrophy of the olfactory tract. Hippocampus was smallerin four cases and showed vertical orientation in threecases. No cerebellar anomaly was noted. Pathology: Allpatients showed loss of lamination of the gray matter andcytomegalic neurons in the affected gyri. Three patientsshowed significant micro calcifications in the white matter.MR signal of the white matter was heterogeneous in thesecases. One patient showed severe dysmorphic glioneuronalhamartomas in the basal ganglia. Scattered heterotopiasoften are seen in the subcortical white matter. This is oftendifficult to appreciate in MR imaging. Hippocampus is poorlydeveloped in four cases with no formation of normal graymatter.CONCLUSIONMR imaging identified the extension of anomaly of the grayand white matter. T2-weighted sequence was useful to evaluateextension of the gray matter abnormality in infants.Variety of degree of white matter and basal ganglia abnormalitywas seen in hemimegalencephaly. The hippocampuswas also abnormal. The extent of the anomaly may help surgicalplanning.REFERENCES1. Barkovitch AJ, Chuang SH. Unilateral Megalencephaly.AJNR Am J Neuroradiol 1990;11:523-5312. Kalifa GL, Chiron C, Sellier N, et al. Hemimegalencephaly:MR Imaging in Five Children. Radiology1987;165:29-333. Davis RL, Nelson E. Unilateral Ganglioglioma in a Tubero-Sclerotic Brain. J Neuropathol Exp Neurol 1951;21:571-581KEY WORDS: Pediatric brain, epilepsy, hemimegalencephalyPaper 135 Starting at 10:55 AM, Ending at 11:03 AMLongitudinal MR Imaging Changes and MRSpectroscopy of Neurocutaneous Melanosis withSubsequent Development of Malignant PeritonitisOrtiz, Y. · O’Callaghan, M. · Wang, C. · Bhadelia, R. · Bert,R. J.New England Medical CenterBoston, MAPURPOSETo demonstrate longitudinal MR imaging changes of neurocutaneousmelanosis. To describe baseline MR spectroscopy(MRS) in areas with positive findings of melanosis, as amethod of following the progression of the disease. Todescribe nonmalignant and malignant sequela of neurocutaneousmelanosis, such as syrinx formation, hydrocephalus,arachnoiditis, diffuse meningeal melanosis and malignanttransformation within, vs seeding of, the peritoneum afterplacement of a ventriculo-peritoneal shunt.MATERIALS & METHODSBrain imaging studies were obtained at birth, includingsagittal, axial, and coronal T1-weighted images, pre andpostgadolinium administration, axial and coronal T2-weightedimages, axial T2 FLAIR and T2 gradient-echo images.Spine images included sagittal pre and postgadolinium T1-weighted, T2-weighted, and T2 short tau inversion recovery(STIR) images. Follow-up examinations were obtained at 2month, 4 month, and 13 month intervals for the brain.Baseline single voxel STEAM MRS with short (30 msec)and long echo times (270 msec) was performed 4 monthsafter the initial study, for baseline assessment (no malignancywas evident at this time). Sagittal and axial, pre and postcontrastT1-weighted, axial T2 gradient echo, coronal T2-weighted, and axial T2 FLAIR images also were obtained atthis time. Follow-up spine studies were obtained 7 and 8months after the initial study.RESULTSOn initial studies, symmetric increased T1 signal wasobserved in the amygdala, on the surface of the pons, withinthe bilateral superior colliculus and on the surface of thecerebellar folia. Ventriculomegaly was present at birth andincreased slightly over the next few weeks. A ventriculoperi-Tuesday
Tuesdaytoneal shunt was placed at approximately 3 months of age (DOB 11/5/01 and shunt was placed after 1/23/02). At the ageof 7 months, the patient developed a cervical syrinx andarachnoiditis. At 7 months after the initial study, dural-basedplaque-like contrast enhancement was seen along the tentoriumand along surface of the spinal cord in the thoracic andlumbar regions. A baseline abdomen-pelvis CT scan wasobtained at the age of 10 months demonstrating peritonealcarcinomatosis (7 months after ventriculoperitoneal shuntplacement). MR spectroscopy demonstrated no evidence oflactate on the baseline study in the areas of imaging abnormality.The NAA:Choline ratio was decreased, but this wasattributed to volume averaging with cerebral spinal fluid inadjacent areas.CONCLUSIONNeurocutaneous melanosis is a rare and potentially malignantcondition that begins early in fetal development.Melanosis of the brain and meninges is seen most commonlyas abnormal bright signal on T1-weighted imaging in theregion of the amygdala and cerebellum. These imaging findingsmay evolve with time and become obscure after myelination.Some of the complications of neurocutaneousmelanosis are hydrocephalus, syrinx development,meningeal, spinal cord, and root melanosis with malignanttransformation within the CNS. Malignant transformation ofviscera typically does not occur. Peritoneal malignant transformationoccurred in our case, either spontaneously or byspread via a ventriculo-peritoneal shunt. Baseline MRS insites of initial melanosis was normal.100thereof was felt to contribute significantly to the diagnosis in44 cases. Out of these 44, only in 14 cases ( i.e., 2% of thetotal number of examinations performed) would the findingshave been missed on the noncontrast images. Ten of thesecases proved to be meningitis which was strongly suspectedclinically, with fever and/or lactic acidosis being present inall ten cases. One case was related to tumor recurrence postsurgeryand in one case contrast was helpful in formulatingthe diagnosis of astrocytoma in a child with tuberous sclerosis.The other two cases were diagnosed as developmentalvenous anomalies of doubtful clinical significance. No clinicallyrelevant findings were missed on the noncontrastimages in cases where seizures were the only presentingsymptom.CONCLUSIONGadolinium administration in MR examinations performedfor the work-up of seizures in children under the age of 2years added important diagnostic information in a very limitednumber of cases, especially when seizures were notaccompanied by other clinical findings. We would suggestthat contrast be reserved only for cases with additional signsand symptoms pointing to infection or neoplasia.KEY WORDS: Seizures, brain MR imaging, gadoliniumPaper 137 Starting at 11:11 AM, Ending at 11:19 AMReversible MR Signal Changes in the Splenium of theCorpus Callosum in Infectious EncephalopathyKEY WORDS: Neurocutaneous melanosis, malignant degeneration,syrinxPaper 136 Starting at 11:03 AM, Ending at 11:11 AMLimited Value of Gadolinium Administration for BrainMR Examinations in the Context of Seizure Evaluationin Children under Two Years of AgePetrou, M. · Sundgren, P. C. · Ksar, J. · Jennings, J. ·Smythe, J. · Eldevik, P. · Maly, P.University of MichiganAnn Arbor, MIPURPOSETo assess the added contribution of gadolinium to the MRwork-up of seizures in children under 2 years of age andreview radiologic findings and associated clinical symptomsin this group.MATERIALS & METHODSOver a 7.5 year period (1995-2002), 507 gadoliniumenhancedMR examinations of the brain were performed inchildren under the age of 2 years presenting with seizureseither as the primary/only clinical problem or as an integralpart of a more complex clinical scenario. We retrospectivelyreviewed the medical records, stated indications, and MRfindings on all of these patients.RESULTSOf the 507 examinations reviewed, 246 (49%) did not revealany significant abnormality. Most abnormalities encounteredwere identified easily and characterized without utilizationof gadolinium. Pathologic contrast enhancement or lackKawamura, Y. 1 · Watanabe, K. 2 · Tsukahara, H. 1 · Ito, H. 11University of Fukui, Fukui, JAPAN, 2 Okazaki City Hospital,Okazaki, JAPANPURPOSETo investigate the transient MR signal changes seen in thesplenium of the corpus callosum in six patients with viral orbacterial encephalopathy.MATERIALS & METHODSSix patients with infectious encephalopathy were examinedon serial brain MR imaging with 1.5 T magnet (GE, signa).The patient’s age, sex, main symptoms on admission to ourhospital and revealed pathogen are summarized in Table 1.All patients underwent the initial MR imaging within 3 daysafter the onset of symptoms.RESULTSThe hyperintensity lesion in the splenium of the corpus callosumwas shown in all patients, which was more conspicuouson diffusion-weighted images than T2-weighted andFLAIR images (Figure 1). Follow-up MR images obtainedfrom 4 to 10 days after the prior MR imaging, revealed thehyperintensity abnormalities resolved in all patients exceptpatient 6, whose MR images showed not only the lesion inthe corpus callosum but diffuse spread of high intensityabnormalities in the frontal and the occipital cortex bilaterally.The patient subsequently expired on 26 days after theonset of infection. The other patients recovered completelywith no abnormal findings on follow-up MR images. Thereason for the predilection for the splenium of the corpus callosumis not clear. We speculate that the splenium of the corpuscallosum is around a boundary zone of anterior cerebralartery and posterior cerebral artery and easy to suffer cellu-
lar energetic failure from pathogenic endotoxin directly or itsimmune reactions indirectly. Our findings do not exclude anelement of vasogenic edema but strongly suggest that cytotoxicedema was the major operant factor in the pathogenesisof infectious encephalopathy in our patients. ADC valuesof the splenium of the corpus callosum in patients 1, 2, and3 were markedly decreased compared to those in normalareas. Follow-up diffusion-weighted MR images of thesepatients showed a reversal of the ADC drop. This change isinteresting because if these lesions were areas of infarctions,decreased ADC would imply irreversibility of the lesions.Based on our cases and the reported cases with epilepsy,cytotoxic edema caused by mechanisms other than arterialischemia does not necessarily suggest irreversibility of thelesions.Patients DataPatient No. Age(y)/Sex Main Symptom Revealed Pathogen1 8 / female feverdiarrhea Salmonella Enteritidisdisorientation2 2/female fever Rotavirusconvulsion3 9/female fever Influenza Aconvulsiondisorientation4 5/male fever Influenza Aconvulsiondisorientation5 5/male fever Adenovirusdisorientation6 4/male fever Influenza AconvulsiondisorientationCONCLUSIONDiffusion-weighted MR imaging is a potentially usefulmethod for detecting early changes of infectiousencephalopathy, although the exact mechanism of therestricted diffusion remains to be clarified.101Paper 138 Starting at 11:19 AM, Ending at 11:27 AMImaging Characteristics of Giant JuvenileXanthogranulomaOzgen, B. 1 · Robson, C. D. 2 · Vargas, S. O. 21Brigham and Women’s Hospital, Boston, MA, 2 Children’sHospital, Boston, MAPURPOSEJuvenile xanthogranuloma (JXG) is a benign, non-Langerhans cell histiocytic proliferation most often occurringin the skin of children. The term “giant JXG” is used forlesions larger than 2 cm in diameter, which are usually characterizedby initial rapid growth followed by a benign courseand gradual involution. Juvenile xanthogranuloma mayoccur occasionally in extracutaneous sites, such as the calvariumand muscle tissue, but as radiologists are not familiarwith this entity, the correct diagnosis is rarely anticipatedpreoperatively. We evaluated the imaging features of threecases of giant JXG occurring along the neuraxis and comparedthem with other cases reported in the literature.MATERIALS & METHODSThe medical records and imaging studies of three patientswith the diagnosis of giant JXG were evaluated in a retrospectivemanner. One patient was imaged with CT and allthree patients were imaged with MR imaging. ContrastenhancedT1-weighted images also were obtained in all MRcases. Surgical resection with histologic examination wasperformed in all children.RESULTSThree patients (2 girls, 1 boy), aged between 5 fi months and12 years, were evaluated. One patient had a right subperiostealparietal bone mass that was imaged with CT, whichrevealed saucerization of the outer table of the calvarium,and mottled lytic destruction of bone. A stalk of tumorextending to dura was not appreciated preoperatively. Thesecond patient had an intracranial, extraaxial mass abuttingthe left anterior parietal lobe. The third patient had a rightparaspinal tumor. All tumors appeared similar on MR imaging:sharply circumscribed and homogeneous, slightlyhyperintense relative to muscle on nonenhanced T1-weightedimages and isointense or hypointense relative to gray matteron T2-weighted or FSEIR images. Following the administrationof contrast, moderately intense, homogeneousenhancement occurred. Histologic examination in all casesshowed aggregates of xanthomatous mononuclear cells characteristicof juvenile xanthogranuloma.TuesdayKEY WORDS: Brain MR, corpus callosum, viral infectionFigure (a) Axial CT reveals a subperiosteal mass withsaucerization of the outer table of the calvarium, and mottledlytic destruction of the subjacent skull. (b) Sagittal T1-weighted MR image reveals that the tumor is mildly hyperintensecompared with muscle.
TuesdayCONCLUSIONGiant JXG can present occasionally as an isolated intracranial,spinal, or paraspinal lesion. These three cases appearedremarkably similar on MR imaging and resemble other casesreported in the literature. The low signal intensity on the T2-weighted images may be attributable to dense cellularity orcollagenous matrix. Tumors that mimic the radiologic featuresof giant JXG include Langerhans cell histiocytosis,desmoid tumor, cellular schwannoma, and neuroblastoma.As this entity is exceptionally uncommon, the correct diagnosiswas not anticipated preoperatively in any case.Awareness of this entity may be important to prevent unnecessaryaggressive treatment.KEY WORDS: Giant juvenile xanthogranuloma, children,non-Langerhans histiocytosisPaper 139 Starting at 11:27 AM, Ending at 11:35 AMComparison of Gadobenate Dimeglumine withGadopentetate Dimeglumine for Enhanced MR Imagingof Brain and Spine Tumors in Pediatric SubjectsColosimo, C. 1 · Damaerel, P. 2 · Bourne, M. 3 · Hogstrom, B. 4· Pirovano, G. 4 · Kirchin, M. 51University of Chieti, Chieti, ITALY, 2 University of Leuven,Leuven, BELGIUM, 3 Cardiff Research Center, Cardiff,UNITED KINGDOM, 4 Bracco Diagnostics Inc, Princeton,NJ, 5 Bracco Imaging SpA, Milan, ITALYPURPOSEGadobenate dimeglumine (Gd-BOPTA, MultiHance ® ,Bracco Imaging SpA, Milan, Italy) is a paramagnetic contrastagent whose T1 relaxivity in vivo (r1 = 9.7 mmol•L -1 s -1) is approximately twice that of Gd-DTPA and other availablegadolinium agents due to a capacity for weak and transientinteraction with serum albumin. In adult subjects Gd-BOPTA provides significantly greater contrast enhancementof enhancing intraaxial brain tumors when compared to thatachieved with Gd-DTPA, Gd-DOTA, and Gd-DTPA-BMA.A prospective interindividual study in 174 pediatric subjectswith known or suspected CNS abnormalities previouslydemonstrated comparable safety and efficacy for Gd-BOPTA and Gd-DTPA. The present study qualitatively andquantitatively compares the enhancement achieved after Gd-BOPTA and Gd-DTPA in a subpopulation of 63 pediatricsubjects with confirmed brain or spine tumors.MATERIALS & METHODSSixty-three pediatric patients with confirmed tumors of thebrain or spine received an 0.1 mmol/kg BW dose of eitherGd-BOPTA (n = 29; 18 M/11 F, mean age 7.5 ± 4.8 years) orGd-DTPA (n = 34; 13 M/21 F, mean age 7.9 ± 4.7 years).MR images were acquired before (T1-weighted and T2-weighted SE sequences) and within 10 min (T1-weighted SEsequences only) of contrast injection. Blinded unpaired (preand postdose images evaluated separately) and paired (preand postdose images evaluated together) qualitative assessmentsof technically adequate images in which lesions werefound both pre and postcontrast (Gd-BOPTA: n = 24; Gd-DTPA: n = 31), were performed to compare pre to postdosechanges in border delineation, visualization of internal morphology,and contrast enhancement by means of 4-pointscales from 1 (poor) to 4 (excellent). Qualitative evaluationswere performed by patient and by lesion (25 and 39 lesions102for Gd-BOPTA and Gd-DTPA, respectively). Quantitativeevaluation of intraaxial brain tumors (22 lesions for Gd-BOPTA, 25 lesions for Gd-DTPA) compared changes inlesion-to-background ratio (L/B), contrast-to-noise ratio(C/N), and % enhancement (%En). Statistical comparisonbetween groups was performed using t-tests at p < 0.05.RESULTSUnpaired postdose scores for lesion border delineation, visualizationof internal morphology, and contrast enhancementwere 3.3 ± 0.6, 3.4 ± 0.6, and 3.4 ± 0.6 for Gd-BOPTA,respectively, and 3.1 ± 0.7, 3.4 ± 0.6, and 3.1 ± 0.7 for Gd-DTPA, respectively. The pre to postdose changes were significantlysuperior for Gd-BOPTA compared to Gd-DTPAfor border delineation (p = 0.018) and contrast enhancement(p = 0.006) and nonsignificantly superior for visualization ofinternal morphology (p = 0.126). Paired assessmentsrevealed nonsignificant superiority for Gd-BOPTA for borderdelineation and visualization of internal morphology andsignificant superiority for contrast enhancement (p = 0.04).Significantly better performance for Gd-BOPTA was notedalso for lesion-by-lesion assessments of border delineationand contrast enhancement (p < 0.01, all assessments). Meanpostdose values for L/B, C/N, and %En were all superior forGd-BOPTA compared to Gd-DTPA (0.5 ± 0.4 vs. 0.3 ± 0.4;9.1 ± 15.4 vs. 2.2 ± 9.9; 66.6 ± 47.4 vs. 42.8 ± 39.0, respectively).CONCLUSIONGd-BOPTA demonstrates significant superiority over Gd-DTPA for enhancement of brain and spine tumors in pediatricpatients. The superior contrast enhancement can beattributed to the two-fold greater T1 relaxivity in blood ofGd-BOPTA and my be clinically advantageous for the detectionand diagnosis of small or poorly enhancing tumors insubjects for whom other diagnostic imaging techniques maybe less desirable.KEY WORDS: Contrast agents, comparative studies, braintumorsThe authors of this work have indicated that they will be discussing/presentingan unapproved or investigative use ofMultiHance (gadobenate dimeglumine) made by Bracco SpAfor CNS imaging.The authors of this work have indicated the following affiliations/disclosures:1. Bracco Diagnostics Inc.: Employee; 2.Bracco Imaging SpA: Employee.Paper 140 Starting at 11:35 AM, Ending at 11:40 AMCombined Communicating Cephalhematoma andEpidural Hematoma: Treatment and ManagementImplicationsEmamian, S. · Vezina, G. · Keating, R.Children’s National Medical CenterWashington, DCCT of head in an infant following forceps delivery demonstrateda large cephalhematoma communicating via a diastaticfracture to a large epidural hematoma causing midlineshift and mass-effect. A smaller cephalhematoma was seenon the opposite side again communicating to a small epidur-
al hematoma without any significant mass effect. The neurosurgeryteam elected to treat the patient with percutaneousaspiration of the cephalhematoma, which resulted in decompressionof the epidural hematoma as well. The parents andthe personnel taking care of the patient were instructed toavoid applying pressure on the cephalhematomas. The residualhematomas underwent calcification on follow-up and thepatient did not require craniotomy. Lesson: Do not compressa cephalhematoma that is associated with a fracture.KEY WORDS: Cephalhematoma, epidural hematoma,cephalohematoma103to-and-fro, and rotatory acceleration, which produce tensileand shearing stresses, causing the brain to hit the skull onseveral occasions which favors tearing of the superficialbridging cerebral veins (know to arise in the substance of thebrain that cross the subarachnoid and subdural space neartheir termination to pierce the dura), and, therefore resultingin subdural hemorrhage.Paper 141 Starting at 11:40 AM, Ending at 11:45 AMSubdural Hematoma in the Pediatric Age Related toRoller-Coaster Ride: Case ReportRoldan-Valadez, E. · Facha, M. · Martinez-Lopez, M. ·Angulo-Suarez, M. · Vivas-Bonilla, I. · Herrera-Mora, P.Medica Sur Clinic & FoundationMexico, MEXICOTuesdayPURPOSEAmusement park injuries and mishaps have long been considerednewsworthy events, but these reports have becomemore common in the last several years. Since 1979 medicalliterature has published reports to that effect but they are few,quite varied, all related to roller-coaster rides and include:carotid and vertebral artery dissection, intracerebral hemorrhage,subdural hematoma, and spontaneous cerebrospinalfluid leaks. Most of the patients in these reports are adults.We present a case of subdural hematoma apparently due to aroller-coaster ride in the pediatric age with review of the literature.MATERIALS & METHODSA 15-year-old girl presented to the emergency room complainingof recent right-sided paresthesias accompanied by a2-week severe frontal headache following a roller-coasterride. Physical examination revealed weakness on the upperright extremity and bilateral lower limb hyperreflexia. MRimaging showed a large frontoparietal subdural hematomaon the left side. The signal intensity was slightly heterogeneousin all sequences suggesting blood at different stagesand possible active bleeding. Some degree of mass effectaffecting the sulci existed, without midline deviation.Significant widening of the subarachnoid space at the convexitywas noted on the right side, an abnormal findinggiven the patient’s age. The patient was not known to havesuffered from neonatal hypoxia nor any other risk factor toexplain this finding. Surgery was performed successfully.RESULTSThe new technologic advances and competition within theamusement industry has led to generation of dangerouslyhigh G forces that may be harmful. Unfortunately, few medicalresearchers have studied the specific physiopathologiceffects that roller-coaster rides can induce. In this particularcase we think that the widening of the subarachnoid spacefavored by some degree of dehydration given the summerseason or high temperature climate, lead to the hematomaformation, since under these circumstances the brain is moreprone to a certain amount of movement and internal trauma.In roller-coaster rides the brain is exposed to ups-and-downs,CONCLUSIONTo our knowledge the previously published papers about thistype of injury have not made an association betweenwidened subarachnoid spaces or some degree of cerebralvolume loss and a higher incidence of subdural hematoma.In any case everyone involved in this industry as well as thegeneral population should be aware that giant roller coasterscan cause subdural hematomas in normal or otherwisehealthy individuals.KEY WORDS: Roller-coaster ride, hematoma subdural, subarachnoidwideningPaper 142 Starting at 11:45 AM, Ending at 11:50 AMMedullomyoblastoma: A Rare Pediatric Posterior FossaTumorLall, A. 1 · Vaughan, K. G. 2 · McFadden, K. A. 1 · Jakacki, R.I. 2 · Fitz, C. R. 21University of Pittsburgh Medical Center, Pittsburgh, PA,2Children’s Hospital of Pittsburgh, Pittsburgh, PAPURPOSETo present a case of surgically resected medullomyoblastoma,a rare posterior fossa tumor, and to describe clinicopathologicand radiologic features along with treatmentoptions.MATERIALS & METHODSInformation was obtained from the patient’s medical recordand was supplemented by patient and physician contact. MRimages pre and postsurgery were reviewed and tumor wasexamined for immunohistochemical expression of synaptophysin,muscle-specific actin, and desmin.RESULTSThis three-year-old male child presented with a 3-month historyof progressive ataxia, lethargy, and slurred speech, andnew onset of vomiting. MR examination revealed a heterogeneouslyenhancing mass in the fourth ventricle causing
Tuesdayobstructive hydrocephalus (Figure). There were hypointenseareas within the tumor on T2 sequences. A suboccipital craniotomywas performed with near total resection of the tumor.At surgery, a purplish, fairly vascular tumor was seen, withsubstantial amount of invasion laterally along the cerebellarpeduncles. Rostrally, the tumor blended into the cerebellarvermis. Pathologic examination revealed the presence of twocomponents: medulloblastoma-like neuronal features, alongwith bundles of myoid cells. Immunohistochemical stainswere positive for synaptophysin, MMF 35 (muscle-specificactin), and desmin, which confirmed the diagnosis of medullomyoblastoma;banded, skeletal muscle-like structures wereseen on H&E; staining (Inset, asterisk). The patient had noevidence of tumor on spine MR imaging although both lumbarand ventricular CSF cytology were positive for tumorcells. Postoperative brain MR imaging showed postoperativechanges without definite evidence of residual tumor.Chemotherapy was instituted with two courses of cisplatinand cyclophosphamide given 3 weeks apart followed by a21-day course of oral etoposide. Because of the patient’syoung age, the chemotherapy is being used to either delaythe need for or allow dose reductions in the craniospinalradiation.104Tuesday Morning10:15 AM - 11:45 AMRoom 602 - 603(24) ELC Workshop C: ImageManipulation with PhotoshopTuesday Morning11:50 AM - 12:50 PMRoom 611 - 612— Richard M. Berger, MD(25) American Society of PediatricNeuroradiology (ASPNR) AnnualBusiness Meeting (Members Only)Tuesday Afternoon1:00 PM - 2:00 PMBallroom 6 ACONCLUSIONMedullomyoblastoma is a very aggressive, rare variant ofmedulloblastoma, which has neuronal differentiation andskeletal muscle component. The histogenesis remains uncertain,though immunohistochemistry suggests origin from amultipotent stem cell precursor.KEY WORDS: Medullomyoblastoma, pediatric, hydrocephalus(26) ELC Lecture E: Building aMultimedia Conference Room fromScratch— Venkata Nataranjan, PhD
Tuesday Afternoon1:00 PM - 2:30 PMRoom 606 - 609(27) ENT (ASPNR)(27a) Congenital Masses of the Head and Neck— Suresh K. Mukherji, MD(27b) MR Spectroscopy of the Head and Neck— Suresh K. Mukherji, MD(27c) Pediatric Head and Neck Soft Tissue Masses— Bernadette L. Koch, MD(27d) Pediatric Head and Neck Osseous Lesions— Bernadette L. Koch, MD(27e) DiscussionModerators:Caroline D. Robson, MB, ChBAvrum N. Pollock, MDCongenital Masses of the Head and NeckSuresh K. Mukherji, MDLEARNING OBJECTIVESUpon completion of this session, participants will be able to:1) Summarize the CT, MR imaging, and sonographic findingsfor a variety of pediatric neck masses2) Review the pediatric sedation guidelines used for CT andMR imaging at our institution and suggest an algorithm forthe evaluation of children that present with neck massesPRESENTATION SUMMARYBoth CT and MR imaging may be used to evaluate childrenwith disorders involving the extracranial head and neck. Thechoice of the modality is based on a combination of factorsthat include: 1. Clinical history, 2. Age of the patient, 3. Typeof sedation, and 4. Risks associated with the required sedationrequired. The short imaging time necessary to performspiral CT has made this technique the primary modality forevaluating children with indeterminate neck masses. Manyof these studies can be performed without sedation. MRimaging provides superior soft tissue characterization andmultiplanar capabilities. However the length of study usuallyrequires some form of sedation in children under the ageof 6 years of age. CT is the study of choice for children presentingwith suspected cervical infections or patients with105palpable neck mass. At our institutions, MR imaging usuallyis reserved for patients with a neoplasm that can be confirmedon clinical examination. Patients with neoplasmsinvolving the skull base usually undergo both CT and MRimaging prior to treatment. MR imaging also is performed tofurther characterize congential craniofacial vascular malformationto determine whether these are "high-flow" vs "lowflow"lesions. This finding may be helpful in planning treatmentwith percutaneous sclerotherapy. Ultrasound is becomingmore widely accepted modality for imaging pediatricneck masses. The noninvasiveness and short imaging timemake a sonography an ideal method for the initial evaluationof pediatric neck masses. As a result, sedation is not requiredfor initial diagnostic evaluation with ultrasonography.Specific indications for ultrasound include: 1. Identificationof a drainable collection within an enlarged cervical lymphnode (suppurative adenitis), 2. Confirm the presence of apalpable thyroglossal cyst and determine a normal thyroidgland prior to Sistrunk procedure, 3. Evaluation of 2ndbranchial cleft cysts, 4. Evaluation of flow characteristics ofcongenital vascular malformations, 5. Noninvasive evaluationof suspected fibromatosis coli.MR Spectroscopy of the Head and NeckSuresh K. Mukherji, MDLEARNING OBJECTIVESUpon completion of this session, participates will be able to:1) Summarize recent investigations that have been performedto evaluate the 1H-MRS in SCCA2) Examine on the potential clinical role of MRS in theextracranial head and neckPRESENTATION SUMMARYIn vitro and in vivo investigations have suggested that protonMR spectroscopy (1H-MRS) may be helpful in providingmetabolic information of abnormalities in the extracranialhead and neck. Several investigations have suggestedthat assessment of the relative levels of choline (Cho) andcreatine (Cr) can provide information that may help differentiateSCCA from nonneoplastic tissue and may provideinformation that helps assess response to nonsurgical organpreservation treatment protocols. Elevation of the Cho/Crratio appears to be a consistent finding for SCCA and hasbeen demonstrated in cell culture and from tissue samplesfrom the primary site and in metastatic lymph nodes. Thesein vitro findings also have been demonstrated in vivo. 1H-MRS analysis of SCCA performed at 1.5 T has demonstratedsignificant elevation of the Cho/Cr ratio in patients withtumors compared with normal tongue muscle. A completereview of 1H-MRS is outside the scope of this section andwe refer the readers to several references that cover thistopic.Tuesday
106TuesdayPediatric Head and Neck Soft Tissue MassesBernadette L. Koch, MDLEARNING OBJECTIVESUpon completion of this session, participants will be able to:1) Identify the preferred imaging modality based on the clinicalhistory and suspected diagnosis in a child with a solidneck mass2) Determine a reasonable differential diagnosis based on theimaging findings and clinical presentation of the child with asolid neck massPRESENTATION SUMMARYNeck masses are a common indication for imaging the pediatricpatient. The most common cause is cervical adenitis.Other causes of solid neck masses in children include fibromatosiscoli, hemangioma of infancy, neurofibroma, lymphoma,rhabdomyosarcoma, neuroblastoma and occasionallymetastatic adenopathy. Ultrasound is the preferred imagingmodality in infants with suspected fibromatosis coli,clearly demonstrating an enlarged sternocleidomastoid musclewithout associated adenopathy. In children, most cervicaladenopathy is secondary to inflammatory disease rather thanneoplasm and most do not require imaging. When imaging isneeded, cervical adenitis may be imaged with CT or US,depending on the question to be answered. To identify theentire extent of involvement of an inflammatory process ofthe neck, CT is preferred. If the question is simply to determineif a specific palpable node is suppurative, ultrasound isideal at answering this question. Lymphadenitis may be secondaryto viral disease (EBV, CMV, HSV, measles, HIV),bacterial disease (staphylococcus or streptococcus, catscratch disease), mycobacterial disease (atypical mycobacteriamore common than mycobacterium tuberculosis) orrarely fungal disease (cryptococcus, histoplasmosis, coccidiomycosis).Mycobacterial disease typically lacks associatedstrandy inflammation of the adjacent fat, may have centralnodal necrosis and/or calcifications. Cat scratch diseaseshould be considered if there is a history of exposure to cats,the scratch itself may have been 1-2 weeks prior to the developmentof adenopathy. If cervical adenopathy is associatedwith significant palatine tonsil and adenoid enlargement,especially in a teenager, EBV/mononucleosis should be considered.Hemangioma of infancy is thought to be a true neoplasmwith endothelial proliferation which results in a proliferativephase lasting months to years, followed by an involutionalphase with complete resolution in most cases by theage of 4-8 years. On CT there is a soft tissue mass thatintensely enhances, without associated osseous erosion. MRimaging is the preferred imaging modality in these children,better able to visualize the high flow intralesional vessels asserpiginous flow voids. However many of these children areimaged without sedation using CT at our institution.Children with lymphoma may have bulky unilateral or bilateraladenopathy and usually are imaged with CT, in conjunctionwith CT of the chest/abdomen and pelvis. Childrenwith rhabdomyosarcoma, particularly at the skull base mayrequire CT to best evaluate osseous erosion and MR imagingto assess for intracranial extension. Patients with cervicalneuroblastoma may have primary or metastatic disease andare imaged routinely with I-123 MIBG in addition to CT orMR imaging.Pediatric Head and Neck Osseous LesionsBernadette L. Koch, MDLEARNING OBJECTIVESUpon completion of this session, participants will be able to:1) Review and assess the common and uncommon osseouslesions that involve the pediatric head and neck, with particularattention to the face2) Distinguish a reasonable differential diagnosis of osseouslesions in the pediatric head and neck based on the imagingcharacteristicsPRESENTATION SUMMARYOsseous lesions involving the head and neck in childreninclude fibro-osseous lesions, odontogenic and nonodontogeniccysts, inflammatory disease with associated osseouserosion (paranasal sinus or dental origin), aneurysmal bonecyst, reparative granuloma/central giant cell granuloma,Langerhan cell histiocytosis and malignant lesions such asosteosarcoma, metastatic neuroblastoma, lymphoma, andEwing's sarcoma. The majority of these lesions are imagedinitially with CT, with MR imaging being a complementarymodality. The most common fibro-osseous lesion is fibrousdysplasia which may be radiolucent, have a typical groundglass appearance or be primarily sclerotic, depending on theproportion of fibrous and osseous components that replacenormal medullary bone. The most common odontogeniccysts are the periapical cyst, dentigerous cyst, and odontogenickeratocysts. Periapical cysts are usually incidentalfindings. Dentigerous cysts are epithelial lined cavities thatform in the follicular space of an unerupted tooth after crownformation is complete. When they occur in the maxilla, atooth will be identified within the cyst which is projectinginto the maxillary antra. A thin rim of bone should separatethe cyst from the sinus. Odontogenic keratocysts arebelieved to originate from rests of dental lamina and aremost commonly located in the mandible. Basal cell nevussyndrome (Gorlin-Goltz syndrome) is an autosomal dominantdisorder characterized by multiple odontogenic keratocysts,basal cell carcinomas, skeletal anomalies, ectopic softtissue calcifications, and extensive intracranial dural calcifications.Aneurysmal bone cysts are nonneoplastic in origin,composed of multiple blood-filled cysts with honeycombedfibro-osseous septations. The classic imaging appearance isthat of an expansile multiloculated lesion with fluid-fluidlevels. Central giant cell granuloma most commonly occursin the midline mandible however may also occur in the maxilla.The etiology is uncertain, may be related to abnormalhealing process rather than primary bone lesion. Langerhancell histiocytosis in the head and neck may occur in the orbit,temporal bone, mastoids, maxilla or mandible. On imaging,it typically is well defined with an enhancing soft tissuemass. The classic beveled edge appearance of skull lesions isnot always present. When it occurs in the maxilla ormandible there may be the typical "floating tooth" appearance.Osteosarcoma of the head and neck may be primary orsecondary to prior radiation exposure, imaging appearancein the head and neck similar to other locations with aggressiveosseous destruction and periosteal reaction. Metastaticneuroblastoma involving the osseous head and neck structuresis identified most commonly involving the skull base ororbits, but may be focal involving the mandible or maxilla.
DiscussionTuesday Afternoon1:00 PM - 2:30 PMBallroom 6 B/C(28) Advanced CT and MR Imaging ofthe Skull Base (ASHNR)(28a) Anterior Skull Base Lesions— Timothy L. Larson, MD(28b) Central and Posterior Skull Base Lesions— H. Ric Harnsberger, MD(28c) Craniovertebral Junction— Wendy R.K. Smoker, MD, FACRModerators:Anterior Skull Base LesionsTimothy L. Larson, MDJane L. Weissman, MDWendy R.K. Smoker, MD, FACRLEARNING OBJECTIVESUpon completion of this session, participants will be able to:1) Discuss specific head and neck/sinonasal lesions thatextend to involve the ACF2) Differentiate extension to the ACF from lesions that arisewithin the ACF3) Identify and review the workup of CSF rhinorrheaPRESENTATION SUMMARYThis talk will review the more common Head and Neck diseaseprocesses that can lead to involvement of the ACF.Disease processes originating from within the ACF will notbe discussed to any significant extent with the exception ofCSF rhinorrhea.A. Head and neck anatomy pertinent to the ACF.B. Nonneoplastic lesions with potential involvement of theACF: 1. Sinusitis - osteomyelitis, epidural/brain abscess,venous thrombosis; 2. Polyps/Polyposis; 3. Fungal Sinusitis[i. Mucocele; ii. Fibro-osseous Lesions (a. FibrousDysplasia; b. Ossifying Fibroma; c. Osteoma)].107C. Neoplastic Lesions: 1. Epithelial Sinonasal Malignancies;2. Meningioma; 3. Esthesioneuroblastoma; 4. SinonasalUndifferentiated Carcinoma; 5. Hemangiopericytoma; 6.Chondrosarcoma/Osteosarcoma; 7. Metastases; 8. OtherMiscellaneous Tumors.D. CSF Rhinorrhea.Central and Posterior Skull Base LesionsH. Ric Harnsberger, MDLEARNING OBJECTIVESUpon completion of this session, participants will be able to:1) Describe central and posterior skull base imaging anatomy2) Develop location-based differential diagnoses for centraland posterior skull base3) Recognize clinical-imaging feature of major lesions of theclivus, petro-occipital fissure, jugular foramen and petrousapexPRESENTATION SUMMARYIn this presentation we will review the radiologic issues surroundingthe central and posterior skull base. Imaging techniquesand goals will be covered first. A combination offocused, thin-section enhanced skull base MR imaging andunenhanced, bone-only CT creates a complete imaging perspectiveof most skull base lesions. CT and MR normalanatomy required for complete image interpretation of skullbase lesions is presented next. A careful look at the anatomyof the basi-sphenoid, basi-occiput, petrous apex, and jugularforamen is completed. Armed with this anatomical foundation,classic anatomy-based imaging differential diagnoseswill be covered. These include differential diagnoses of clival,petro-occipital fissure, jugular foramen, and petrousapex lesions. Principal lesions discussed in this talk includeclival chordoma, petro-occipital fissure chondrosarcoma. Inthe area of the jugular foramen, flow pseudolesions, jugularbulb venous variants and jugular foramen paraganglioma,schwannoma and meningioma will be highlighted. Finally,in the petrous apex trapped fluid, cephalocele, apical petrositis,cholesterol granuloma, Langerhans cell histiocytosis,and metastatic tumor will be presented.REFERENCES1. Moore KR, Fischbein NJ, Harnsberger HR, et al. Petrous ApexCephaloceles. AJNR Am J Neuroradiol 2001;22:1867-18712. Moore KR, Harnsberger HR, Shelton C, et al. "Leave MeAlone" Lesions of the Petrous Apex. AJNR Am J Neuroradiol1998;19:733-7383. Ginsberg LE. Neoplastic Diseases Affecting the Central SkullBase: CT and MR Imaging. AJR Am J Roentgenol1992;159:581-589Disclosure: The author of this presentation has indicated anaffiliation with Amirsys, Inc: Stock Options.Tuesday
108TuesdayCraniovertebral JunctionWendy R.K. Smoker, MD, FACRLEARNING OBJECTIVESUpon completion of this session, participants will be able to:1) Describe the normal anatomy of this region including normalCVJ relationships2) Summarize the gamut of symptoms associated with CVJpathology3) Define common CVJ developmental abnormalities4) Recognize systemic conditions that can affect the CVJPRESENTATION SUMMARYThe craniovertebral junction (CVJ) is a collective term thatrefers to the occiput, atlas, and the axis. It is important to recognizethat CVJ pathology may produce ENT symptoms(vertigo, tongue atrophy, hearing loss⁄) that may prompt thepatient to seek primary care from an otolaryngologist whomay not even be aware that CVJ pathology could producethese symptoms. Evaluation of this region requires identificationof only a few anatomical landmarks, knowledge ofosseous relationships, and some basic measurements.Important lines and angles used for CVJ craniometry arereviewed in this presentation including Chamberlain's line,Wackenheim's clivus baseline, Welcher's basal angle, and theatlanto-occipital joint axis angle. Pathology involving theCVJ may produce basilar invagination (congenital), basilarimpression (acquired), platybasia (anthropomorphic termassociated with invagination or impression, or cranial settling(associated with rheumatoid arthritis). The differencesamong these are explained and correct usage of these termsis presented.Tuesday Afternoon1:30 PM - 2:30 PMRoom 602 - 603(28A) National Library of Medicine:PUBMED Ò /MEDLINE Advanced Tipsand Tricks Hands-on Workshop— Linda MilgromTuesday Afternoon3:00 PM - 4:33 PMBallroom 6 B/C(29a) Adult Brain: Vascular Imaging(Scientific Papers 143 - 154)See also Parallel Sessions(29b) Adult Brain: Functional Imaging (fMRI, MSI,MRS, PET)(29c) Adult Brain: New Techniques,Postprocessing/Trauma(29d) Pediatrics: GeneralModerators:Raymond F. Carmody, MDJohn R. Hesselink, MDPaper 143 Starting at 3:00 PM, Ending at 3:08 PMIntracranial Contrast-Enhanced MR Angiography at3.0 TFutterer, S. · Carroll, T. · McCarthy, R. · Carr, J.Northwestern UniversityChicago, ILPURPOSEThe purpose of this study is to compare the signal-to-noiseratio (SNR) and vessel conspicuity of 1.5 T and 3.0 T contrast-enhancedMRA (CE MRA) exams of the intracranialvasculature.MATERIALS & METHODSSubjects: Five healthy subjects including three women andtwo men (mean age = 31.4 years, range = 22-42 years) werescanned at both 1.5 T and 3.0 T. Imaging sessions were separatedin time by 7 to 14 days. Image acquisition: Imageswere acquired on a 1.5 T Siemens Sonata and 3.0 T SiemensTrio within 14 days of each other. Images acquisition wascoordinated with the arrival of bolus of contrast using a standarddose-timing scan (axial, 2D FLASH, one image/sec, 2.0ml Gd-DTPA injected at 3.0 ml/sec) acquired at the level ofthe carotid bifurcation. The CE MRA images were acquiredwith the clinical intracranial MRA protocol used at our institution.Images were acquired in the coronal plane with a 3DFLASH, sequence (TR/TE/flip = 3.4 ms/1.3 ms/20 o ). Oneprecontrast and 2 postcontrast images were acquired with inlinemask-mode subtraction. In all exams, the field of view,imaging matrix, number of partitions, and partition thicknesswere held fixed (FOV = 169 mm x 300 mm) to yield a fixedvoxel size of 0.6 mm x 1.0 mm x 0.8 mm3. In all exams, 18ml of contrast were injected at a rate of 3.0 ml/s, independentof body weight. Image analysis: The images acquired at1.5 T and 3.0 T were evaluated independently by two boardcertifiedradiologists. The SNR of the CE MRA images was
evaluated by placing separate regions of interest over thecarotid siphon and proximal internal carotid artery. Signalto-noiseratio was calculated and the mean signal/standarddeviation of the noise. In addition, images were scored on afour-point scale for vessel conspicuity of the Sylvain fissurebranches and the more distal branches of the middle cerebralarteries.RESULTSRepresentative images comparing 1.5 T and 3.0 T CE MRAexams in the same subject appear in Figure 1. The anticipatedincrease in SNR at high field results in improved detectionof distal MCA branches. This has implications for detectionof vascular disease beyond the circle of Willis. Meanscores for SNR in the carotid siphon were 37.1 (69.0) for the1.5 T (3.0 T) images. For the proximal ICA, SNR was 31.7(50.5) for the 1.5 T (3.0 T) images. The scores for theSF/DCB/IQ were 2.8/1/6/2.8 for the 1.5 T exams and3.4/2.4/3.4 for the 3.0 T exams.109determine the prevalence of IA among 100 referral patientswith operated and unoperated CoA, we evaluated thesepatients using cranial MR angiography (MRA).MATERIALS & METHODSWith IRB approval, patients with a history of operated orunoperated CoA who were 18 years of age or older at thetime of screening were included. Patients with contraindicationsfor MRA screening and individuals who were not ablepersonally to give informed consent were not included.MRA exams were performed with a three-dimensional timeof flight sequence acquired with 3 axial slabs of 32 sectionsper slab, with 1.4 mm thick sections. The TR/TE was 36/6.9ms. A ramped RF pulse with a central flip angle of 25degrees was used. The field of view was 180 x 180 mm, andthe prescribed matrix was 256 x 224. The scan time was 11minutes and 28 seconds. Exams were reviewed by 2 independentblinded reviewers and discrepancies were adjustedwith a consensus interpretation.RESULTSTen patients (10%) were found to have IA (95% CI 5-18%),mean size 3.5 mm, (range 2-8). Intracranial aneurysmsoccurred in nine asymptomatic patients and one in a patientwith a history of ruptured intracranial aneurysm treated withsurgical clipping. Multiple IAs were detected in one patient.The frequency of IA was significantly higher than predictedin general population (10% vs 1-2% respectively, p < 0.001).One patient with an 8 mm diameter basilar tip aneurysm consideredto have a higher long-term rupture risk than conservativemanagement risk underwent conventional angiographyand surgical clipping. Nine patients are being followedmedically with risk factor control and repeat imaging in 6 to12 months.TuesdayCONCLUSIONPreliminary results suggest that MRA at 3 T producesimprovements compared to 1.5 T. However, direct comparisonof 1.5 T and 3.0 T images potentially could be a result ofimprovements in coil design.KEY WORDS: Intracranial, MR angiographyPaper 144 Starting at 3:08 PM, Ending at 3:16 PMIntracranial Aneurysms in Patients with Coarctation ofthe Aorta: A Prospective MR Angiography Study of OneHundred PatientsHuston, J. · Connolly, H. M. · Brown, R. D. · Warnes, C. A.· Ammash, N. M. · Tajik, A.Mayo ClinicRochester, MNPURPOSEWhile the association between coarctation of the aorta (CoA)and intracranial arterial aneurysm (IA) has been reported, theexact incidence of IA in association with CoA is unknownand has not been evaluated systematically. In an attempt toCONCLUSIONThere is at least a 5-fold increase in frequency of IA inpatients with coarctation of the aorta compared to generalpopulation. MR angiography screening detects IA in approximately10% of patients with CoA. Most IAs detected weresmall and are being followed but aneurysm treatment wasrecommended in one patient. These data suggest that cerebralMRA screening in patients with CoA should be consideredseriously.KEY WORDS: Aneurysm, MR angiography, coarctationPaper 145 Starting at 3:16 PM, Ending at 3:24 PMDoes Digital Subtraction Angiography Provide a Benefitto Patients with Subarachnoid Hemorrhage, anAneurysm Identified on CT Angiography, and aHemorrhage Pattern Compatible with the AneurysmLocation?Uhrbrock, D. H. · Pitt, A.Barrow Neurological InstitutePhoenix, AZPURPOSETo evaluate the benefits of angiography on patients with subarachnoidhemorrhage who have an aneurysm identified onCT angiography (CTA) and a hemorrhage pattern that iscompatible with the aneurysm location.
TuesdayMATERIALS & METHODSRetrospectively, reports of 167 patients who presented withunexplained subarachnoid hemorrhage were reviewed. Onehundred fifty-eight of the patients underwent CTA. Of the158 patients, 90 patients with an aneurysm found by CTA,compatible hemorrhage pattern, digital subtraction angiography(DSA) imaging and surgical confirmation were selectedfor analysis.RESULTSIn 90 patients with an aneurysm found by CTA, compatiblehemorrhage pattern, digital subtraction angiography imaging,and surgical confirmation, 85 (94.4%) showed no benefitfrom DSA. In five patients, additional small aneurysmswere found by DSA that were not identified by CTA. Theadditional discovered aneurysms were 3 mm or less in diameterand in three patients, were located in the cavernous portionsof the internal carotid arteries, a challenging diagnosticlocation for CTA. In one patient, DSA discovered a 1 mmophthalamic aneurysm which was not identified on CTA. Inanother patient, DSA discovered additional mycoticaneurysms that were not appreciated on CTA.CONCLUSIONWhen weighing the risks and benefits of DSA in patientswith CTA-proven aneurysm and a hemorrhage pattern consistentwith the aneurysm location, the risks of DSA are notjustified for the incremental gain in aneurysm detection.Digital subtraction angiography remains beneficial inpatients with CTA-negative SAH and in patients in whichthe hemorrhage pattern does not correlate with the locationof the aneurysm discovered by CTA.KEY WORDS: CT angiography, digital subtraction angiography,subarachnoid hemorrhagePaper 146 Starting at 3:24 PM, Ending at 3:32 PMArterial Blood Pressure Measurements in the FeedingArteries of Brain Arteriovenous Malformations:Correlation with Clinical Presentation andAngioarchitectureVilela, P. F. · Goulao, A.Garcia de Orta HospitalLisbon, PORTUGALPURPOSEThe authors correlate the brain arteriovenous malformations(AVMs) hemodynamics by measuring the blood pressure inpial arterial feeders, the clinical presentation and theangioarchitecture of the brain AVMs.MATERIALS & METHODSSeventy-one consecutive patients with AVMs were evaluatedprospectively. Twenty-seven (38%) AVMs had hemorrhagicand 44 (62%) nonhemorrhagic presentation. Feeders’arterial pressure (FAP) measurements were obtained by placinga microcatheter as close to the nidus as possible while themean arterial pressure (MAP) was being recorded simultaneously.A total of 308 AVM’s feeding arteries were evaluatedand 4 groups were defined in relation to the value bloodpressure differential given by the formula [F = (MAP-FAP)/MAP]: Group I: F < 0.3; Group II: 0.30 £ F £ 0.45;Group III: 0.45 < F £ 0.60; Group 4: F> 0.6. Univariable110analysis for dependency with Chi-square Pearson test and forassociation with linear/linear or likelihood ratio and multivariableanalysis with logistic regression for prediction ofhemorrhage/nonhemorrhage based on the feeder’s pressuredifferential and angioarchitecture were performed.RESULTSIn the univariable analysis there was as a statistically significant(p < 0.001) dependency/association between Grade Ifeeder’s and brain AVMs with hemorrhagic presentation,infratentorial location, size < 3 cm, venodural stenosis, deepvenous drainage, perinidal angiogenesis; and between GradeIV feeder’s and nonhemorrhagic presentation. In the multivariablelogistic regression model AVMs with feeders withhigher pressure and deep venous drainage had more frequentlyhemorrhagic presentation.CONCLUSIONBrain AVMs have a large individual heterogeneity regardingthe feeding arteries resistance and flow, but there is a significantassociation between the pressure (feeders) B-AVM systemand clinical presentation with higher risk for hemorrhagicpresentation in higher pressure systems.KEY WORDS: : Brain arteriovenous malformation, arterialpressure, hemorrhagePaper 147 Starting at 3:32 PM, Ending at 3:40 PMAn In Vitro Simulator for Measuring and VisualizingHemodynamics in Human VesselsIsoda, H. 1 · Nishino, K. 2 · Kosugi, T. 3 · Takeda, S. 4 ·Inagawa, S. 1 · Isogai, S. 1 · Sakahara, H. 11Hamamatsu University School of Medicine, Hamamatsu,JAPAN, 2Yokohama National University, Yokohama,JAPAN, 3Renaissance of Technology Corporation,Hamamatsu, JAPAN, 4 Nexus Inc., Tokyo, JAPANPURPOSEHemodynamics plays very important roles in the developmentand growth of intracranial aneurysms, abdominal aorticaneurysms, and carotid stenoses. However, there is nowell established in vivo or in vitro hemodynamics measuringsystem in human vessels at present. The purpose of our studywas to establish an in vitro simulator for measuring and visualizinghemodynamics in human vessels, characterized by arealistic hollow silicon vessel model based on a clinicalimaging data set and refraction index matching between thesilicon model and a flowing fluid.MATERIALS & METHODSMultiple 2-dimensional (2D) slices of arteries in each patientwere obtained with the use of clinical imaging such as mrangiography, CT angiography or rotational digital subtractionangiography. These DICOM data sets were processed toreconstruct the lumen of the vessels in three dimensions, andthen transferred to a 3-dimensional (3D) printer using powdersand adhesive to produce a master cast of the vascularlumen. Based on this master cast, a realistic silicon modelcontaining the lumen of the original vessels then was constructed.We completed refraction index matching betweenthe silicon model and an aqueous solution of glycerol. Thesilicon model was placed into a container containing theindex-matched fluid. We ran the index-matched fluid, in
which tiny nylon tracer particles with diameter of about 30microns were suspended, through the silicon vessel modelby a centrifugal pump. Images of flowing particles throughthe lumen of the silicon model were taken with a monocromaticNTSC camera and a double-pulsed Nd:YAG laser(wave length, 532 nm; power, 30m J/pulse; interval betweendouble pulses, 50 microseconds). These images clearlyshowed particles flowing along the vessel wall suggestingaccurate refraction index matching between the siliconmodel and the flowing fluid. Velocity maps were obtainedwith particle image velocimetry analysis.RESULTSWe established an in vitro simulator for measuring and visualizinghemodynamics in human vessels, characterized bythe following: 1) obtaining multiple 2D slices includinghuman vessels with the use of a clinical imaging scanner; 2)calculation of 3D vessel data sets by a computer based onclinical data sets; 3) production of a realistic hollow siliconvessel model using previous computer data sets and 3Dprinting using powders and adhesive; 4) completion ofrefraction index matching between the silicon model and anaqueous solution of glycerol; 5) whole field measurement ofhemodynamics in the model by using particle imagevelocimetry.CONCLUSIONThis simulator enabled us to obtain, as realistically as possible,tailor-made hemodynamics in patients’ pathologic vessels.KEY WORDS: Human vessels, hemodynamics, particleimage velocimetryThe authors of this work have indicated the following affiliations/disclosures:1. Renaissance of TechnologyCorporation: Employment; 2. Nexus, Inc.: Employment.Paper 148 Starting at 3:40 PM, Ending at 3:48 PMFollow-Up of Coiled Cerebral Aneurysms at 3 T:Comparison of Three-Dimensional Time-of-Flight MRAngiography at 3 T vs Three-Dimensional Time-of-FlightMR Angiography and Gadolinium-Enhanced MRAngiography at 1.5 TAnzalone, N. · Righi, C. · Politi, L. S. · Iadanza, A. ·Cadioli, M. · Scotti, G.Scientific Institute HSRaffaeleMilan, ITALYPURPOSETo verify feasibility of three-dimensional (3D) time-of-flight(TOF) MR angiography (MRA) of coiled aneurysms at 3 Tand to compare it with 3D TOF MRA and ultrafast gadoliniumMRA at 1.5 T.MATERIALS & METHODSTwelve patients treated with Guglielmi detachable coils(GDC) for cerebral aneurysms were studied at 3 T (Intera,Philips) and 1.5 T (Intera, Philips) within 24 hours from eachother. At 3 T 3D TOF MRA studies were performed with ahead T/R coil and an axial acquisition (TR 23, TE 3.2, FOV200, acquisition voxel size: 0.50 x 0.50 x 1 mm). At 1.5 T aSensitivity encoding (SENSE) head coil was used; a 3D TOF111axial acquisition was performed first (SENSE factor 2, TR23, TE 3.6, FOV 220, acquisition voxel size: 0.72 x 0.72 x 1mm), followed by an axial 3D ultrafast (24 sec) gradientechosequence (SENSE factor 2, TR 6.1, TE 2.1, FOV 220,acquisition voxel size: 0.72 x 0.72 x 0.80 mm) after a bolusof 0.2 ml/kg of gadolinium. All studies were evaluated withboth MIP and SSD reconstructions targeted on the vessel ofinterest. Source images were considered as well. Digital subtractionangiography examination was performed in presenceof suspected residual aneurysm patency on MRA.RESULTSTwelve aneurysms (7 anterior communicating artery, 3 internalcarotid artery, 2 basilar artery) were evaluated. Presenceof coil artifact was equally evident on both 3 T and 1.5 T 3DTOF acquisitions, whereas it was not appreciable ongadolinium MRA. The coil artifact did not affect in both 3 Tand 1.5 T the identification of aneurysm parent artery orresidual aneurysm patency. In 7 out of 12 cases the presenceof a remnant or recurrence was detected and successivelyconfirmed by DSA. In all these cases gadolinium MRA betterdemonstrated the residual patency of the treatedaneurysm; nevertheless 3 T 3D TOF MRA showed a highersignal and a sharp definition of the parent vessel and residualaneurysm patency in comparison with 1.5 T 3D TOFMRA.CONCLUSIONOur data though preliminary, demonstrate that MRA followupof coiled aneurysms is feasible at 3 T and is better than at1.5 T; nevertheless ultrafast targeted gadolinium MRA at 1.5T demonstrates the higher definition of the residual patency.KEY WORDS: Aneurysm cerebral, MR angiography, 3 TPaper 149 Starting at 3:48 PM, Ending at 3:56 PMIntraoperative Doppler Ultrasound as a Guide toSurgical Removal of Cerebral ArteriovenousMalformationPozniak, M. A. · Dempsey, R. J. · Mitchell, C. C.University of Wisconsin MadisonMadison, WIPURPOSEEvaluate the efficacy of intraoperative spectral and colorDoppler ultrasound to guide and confirm completeness ofablation of arteriovenous malformations (AVM).MATERIALS & METHODSTwenty patients (17-53 years old) (9 male-11 female) underwentsurgical expiation of cerebral AVM. Preoperativeassessment included functional MR imaging, CT, or angiography.Some patients had selective embolization of nidus andfeeders. At surgery MR-based stereotactic localization wasapplied for patient positioning and defining the craniotomyflap. Intraoperative Doppler was used to define the locationand extent of the lesions. Spectral Doppler flow resistancepatterns helped identify vessels that were essential only tothe AVM and confirm complete removal of the entire lesion.Tuesday
112RESULTSIntraoperative color Doppler ultrasound proved consistentlymore precise than stereotactic localization of the AVM due tobrain shift after craniotomy and retraction. Reexaminationduring the course of the procedure helped focus and limit thesurgical dissection. Examination after presumed exterpationrevealed residual nidus in two cases allowing timely completeremoval. Intraoperative angiography was performed onseveral cases but with increased confidence in the Dopplerexam we were able to forgo the intraoperative angiogram.Postoperative angiography confirmed excellent results withtotal removal in all patients.RESULTSIntracranial sinuses and vessels were depicted with high contrast-to-noiseratio and with high anatomical resolution in allpatients. Superpositions of arteries could be avoided completelyby subtraction. In all cases a definite decision aboutsinus thrombosis was possible. Moreover, venous bypasspathways were displayed, and dynamic analysis of bloodflow is demonstrated by subtraction between differentsequences. In meningiomas pathologic drainage was identifiedeasily (Figure). Occlusion or stenosis of adjacent sinusescould be verified in excellent conformity with DSA controls.TuesdayCONCLUSIONIntraoperative spectral and color Doppler ultrasound providesa more focused surgical approach to the intracranialAVM, accurately determines completeness of resection, andobviates the need for intraoperative angiography.KEY WORDS: Doppler ultrasound, AV malformation, intraoperativePaper 150 Starting at 3:56 PM, Ending at 4:04 PMContrast-Enhanced Angiography of Intracranial VenousVessels and Sinuses: An Application of MR ParallelAcquisition TechniqueGawehn, J. 1 · Tintera, J. 2 · Ringel, K. 1 · Stoeter, P. 11Institute of Neuroradiology, Mainz, GERMANY, 2 Institutefor Clinical and Experimental Medicine, Prague, CZECHREPUBLICPURPOSEMR angiography of the intracranial venous vessels usually iscomputed from data sets of 2D or 3D phase-contrast imagingor from contrast-enhanced time-of-flight data.Nevertheless, the acquisition of 3D data sets is time-consuming,and flow phenomena sometimes cause misinterpretations,especially in case of sinus thrombosis. Parallelacquisition technique in combination with an intravenousbolus application of a contrast agent allows direct depictionof the perfusion of venous vessels.MATERIALS & METHODSTwenty-six patients were examined to analyze their venousdrainage, among them 13 because of suspected sinus thrombosis,6 because of drainage in case of meningiomas, 1because of regional swelling after resection of a meningioma,1 because of intracranial manifestation of a plasmocytomaand suspicion of sinus occlusion. Data acquisitionwas performed by FLASH 3D coronal, 72 slices with 2 mmthickness, TR/TE/Flip 3.14 ms/1.35 ms/20°, FoV 230 mm,basic resolution 384, phase resolution 50%, slice resolution63%, parallel acquisition with GRAPPA, factor 3, referencelines 48. Each measurement consisted of 8 repetitions of asequence, total acquisition time 61s. Intravenous bolusapplication of 20 ml Magnevist with 4 ml/s. Postprocessingby subtraction of pairs of the sequences and 3D visualization.1.5 T Siemens Sonata, 8-channel array head coil. Allresults were referenced by phase-contrast imaging or invasivelyby digital subtraction angiography.Figure. Venous drainage of a hemangiopericytoma.CONCLUSIONVenous CE angiography with parallel acquisition techniqueis an excellent method to visualize intracranial venous vesselsand is especially recommended to evaluate sinus thrombosis.It is as well suited to display the venous drainage ofmeningiomas. Performance is quick and quality superior tophase contrast images.KEY WORDS: Contrast-enhanced angiography, sinus thrombosis,PATPaper 151 Starting at 4:04 PM, Ending at 4:12 PMAutonomic Dysfunction-Induced HypertensiveEncephalopathyGkogkas, C. · Klufas, R. A. · Henderson, G. V. · Feske, S.K. · Schwartz, R. B.Brigham and Women’s HospitalBoston, MAPURPOSEThe syndrome of hypertensive encephalopathy (HTE) ischaracterized by headache, seizures, and neurologic signs,usually in the setting of rapid elevation of blood pressure (1).CT and MR imaging typically show reversible edema, mostcommonly in the subcortical occipito-parietal white matter.Disturbances of autonomic function can result from spinalcord lesions above T6 (i.e., above the major splanchnic sympatheticoutflow), as well as with acute demyelination of the
sympathetic and parasympathetic fibers, and can lead toacute hypertension and subsequent development of HTE. Wepresent the radiologic and clinical data of two patients withGuillain-Barre syndrome and three patients with spinal cordlesions with autonomic dysfunction resulting in HTE.MATERIALS & METHODSThe clinical and radiologic data of 121 patients with HTEadmitted in our hospital between January 1990 and May2003 were reviewed. Three patients in this group had theclinical diagnosis of high thoracic or cervical myelopathy,resulting in autonomic dysreflexia, and two patients withacute Guillain-Barre syndrome developed dysautonomia.For each patient, the mean arterial blood pressure [MAP(max)] at the time of the neurologic event was recorded, aswas the MAP at a time remote from the neurologic eventwhen the patient was asymptomatic [MAP (bl)].RESULTSPatient 1: 24-year-old man with posttraumatic thoracic aortictransection and a T 4 myelopathy presented withheadaches and seizures. The MAP (bl) in mm Hg, was 107and MAP max was 167. Patient 2: 73-year-old woman withacute T 2 spinal cord compression from metastatic lung diseasehad headache, visual agnosia, and seizures. The MAP(bl) was 90 and the MAP (max) was 128. Patient 3: 37-yearoldman with chronic traumatic C 5 myelopathy developed aurinary tract infection and presented with headaches andseizures. The MAP (bl) was 77 and MAP (max) was 140.Patient 4: 66-year-old woman with Guillain-Barre syndromeand rapid development of somnolence. The MAP (bl) was106 and the MAP (max) was 130. Patient 5: 50-year-oldwoman with Guillain-Barre syndrome complicated by respiratoryfailure. The MAP (bl) was 107 and MAP (max) was167. On CT and MR imaging, subcortical white matteredema in the occipital lobes bilaterally was seen in allpatients; other involved regions included the parietal andposterior frontal lobes, cerebellum, and the splenium of thecorpus callosum.CONCLUSIONBased on consistent clinical features and neuroimaging studies,the symptoms of headaches, seizures, or encephalopathyencountered in autonomic dysreflexia and dysautonomia aremost likely secondary to hypertensive encephalopathy.Cognizance of this association should lead to rapid diagnosisand treatment of these patients.REFERENCES1. Schwartz RB. Hyperperfusion Encephalopathies:Hypertensive Encephalopathy and Related Conditions.Neurology 2002;8(1):22-34KEY WORDS: Hypertensive encephalopathy, spinal cordinjury, Guillain Barre syndrome113Paper 152 Starting at 4:12 PM, Ending at 4:20 PMCT Angiography vs Digital Subtraction Angiography inthe Assessment of Residual Aneurysm after OpenSurgical ClippingTzung, B. S. 1 · Walker, M. T. 1 · Tsai, J. 1 · Futterer, S. F. 1 ·Curtin, K. C. 1 · Shaibani, A. 1 · Bendok, B. 1 · Krupinski, E. 2· Krupinski, E. 2 · Russell, E. J. 11Northwestern Memorial Hospital, Chicago, IL, 2 Universityof Arizona, Tucson, AZPURPOSEDigital subtraction angiography (DSA) is the gold standardexamination to evaluate residual or recurrent aneurysm aftersurgical clipping. The role of CT angiography (CTA) in thissetting has not been defined in part due to the artifact producedby aneurysm clips in a CT scanner. The purpose ofthis study was to assess the clinical value of CTA in identifyingresidual aneurysms, and to evaluate whether CTAcould be effective as a stand-alone study for any particularsubset of patients.MATERIALS & METHODSThirty-nine consecutive patients with 50 aneurysms wereincluded in the study. Each patient underwent surgical clippingof at least one aneurysm followed by CTA and DSAexaminations to evaluate for recurrent or residual aneurysm.CT angiography was performed on a 4-slice scanner (GE,Lightspeed) acquired at 2.5 x 1.25 mm and reconstructed andreviewed at 1.25 x 0.625 mm in the axial, coronal, and sagittalplanes. The DSA exams were consensus read by two neuroradiologistsand one neurosurgeon that was trained inendovascular surgical neuroradiology. The DSA examinationswere considered the gold standard. The number ofaneurysm clips and the size of the remnant aneurysm wereidentified. Three board-certified, CAQ certified neuroradiologistsexperienced in CTA interpretation independently evaluatedeach CTA exam for residual aneurysm in a blindedfashion. Readers assessed each case based upon a 6-pointscale: 1 = remnant present: definite; 2 = remnant present:probable; 3 = remnant present: possible; 4 = remnant absent:possible; 5 = remnant absent: probable; 6 = remnant absent:definite. A 3-point scale was used to rate the reader’s perceptionof the amount of artifact produced by the aneurysmclips: 1 = mild artifact; 2 = moderate artifact; 3 = severe artifact.Sensitivity and specificity were calculated for eachreader and for all readers combined. Results were analyzedfurther by size and number of clips present. The Student’s t-test (unpaired, one tail) was used for statistical significance.RESULTSDigital subtraction angiography consensus readings identified16 remnants out of the 50 aneurysms clipped. Overall,sensitivity and specificity of CTA for remnant aneurysmwere 48 % (range, 44-56 %) and 93 % (range, 85-97%)respectively. Sensitivity decreased with increased number ofaneurysm clips (p = 0.045) and decreased remnant size (p =0.02). Also, sensitivity correlated with artifact (p = 0.002)and certainty scores (p = 0.006).Tuesday
TuesdayCONCLUSIONThe overall sensitivity of CT angiography to detect residualaneurysm after aneurysm clipping is low (48 %). Sensitivityimproves with fewer clips, larger remnant size, lower artifactscores and higher certainty scores. Average specificity wasrelatively high (93%) suggesting that when an aneurysmremnant is described on CTA, it is unlikely to be a false positive.In this context, it may be reasonable to screen patientsafter single aneurysm clipping with CTA to exclude significantresidual. If present and identifiable on CTA, it would bereasonable to follow the residual with CTA. Aneurysm clipmetallurgy also affects the degree of artifact created andrequires further investigation.KEY WORDS: CT angiography, aneurysm, postclip residualPaper 153 Starting at 4:20 PM, Ending at 4:28 PMArteriographic Demonstration of Slow AntegradeOpacification Distal to a CerebrovascularThromboembolic Occlusion Site as a FavorableIndicator for Intraarterial ThrombolysisChristoforidis, G. A. · Slivka, A. · Mohammad, Y. · Tejada,A. · Slone, H. W. · Bourekas, E. · Chakeres, D.The Ohio State UniversityColumbus, OHPURPOSETo determine whether slow antegrade contrast opacifactionof an occluded cerebral artery distal to thrombus (clot outlinesign) on cerebral arteriograms performed immediately priorto thrombolytic treatment is associated with higher recanalizationrates relative to patients without antegrade contrastopacification distal to the the occlusion site.MATERIALS & METHODSThis study retrospectively reviewed the records and availableimages from 74 consecutive arteriograms performedprior to thrombolysis in patients eligible for intraarterialthrombolysis where the microcatheter was able to reach theocclusion site. The arteriograms were reviewed to identifywhether contrast filled the occluded vessel distal to theocclusion site on the delayed images. Patients were notincluded if the arteriograms were not available for review.This was correlated then to the recanalization rate and TIMIscore using contingency analysis. Logistic regression analysisfor recanalization was performed which included presenceof outline sign, age, time to treatment, sex, and admittingglucose value.RESULTSSixty-eight of the original 74 arteriograms were available forreview. Eighteen patients were identified who displayed theclot outline sign. Thirteen (72%) went on to completelyrecanalize whereas four went on to partially recanalize, andonly one (5.6%) did not recanalize. Sixteen (32%) of 50patients without demonstration of contrast opacification distalto the occlusion site went on to recanalize, 19 (38%) wenton to partially recanalize, and 15 (30%) did not recanalize (p= 0.0068). Seventeen of 18 patients (94.4%) displaying theclot outline sign were associated with a TIMI score of 2 or 3whereas only 31 (62%) of those without the clot outline signwere associated with TIMI scores of 2 or greater (p =1140.0041). Logistic regression analysis for recanalization relativeto other predictors indicates that only the clot outlinesign could act as a predictor for recanalization (p = 0.0097).CONCLUSIONPrethrombolysis arteriograms demonstrating delayed antegradecontrast opacification distal to the occlusion site isassociated with higher recanalization rates.KEY WORDS: Thrombolysis, stroke, angiographyThe authors of this work have indicated that they will be discussing/presentingan unapproved or investigative use of anrecombinant tissue plasminogen activator made byGenentech for intraarterial thrombolysis.Paper 154 Starting at 4:28 PM, Ending at 4:33 PMCerebral and Spinal Cavernous Angiomatosis: A CaseReportErvine, S. L. M. · Wallace, E. W. · Kim, J. K.Oakwood HospitalDearborn, MIPURPOSEWhile cavernous angiomatosis has been well characterized,only a few cases have demonstrated innumerable lesionsthroughout the entire neural axis. We describe a remarkablecase of cerebral and spinal cavernous angiomatosis andreview the disease characteristics and imaging findings.MATERIALS & METHODSWhile camping in northern Michigan, a fifty-five-year-oldmale experienced slurred speech, confusion, dizziness, andbalance problems. He presented to our emergency room withgradual worsening of symptoms. CT of the head showedmultiple ill-defined hyperdense foci in the cerebrum andcerebellum. In this previously asymptomatic patient, possiblediagnoses included metastases, hemorrhagic emboli,infectious vasculitis, or hypertensive angiopathy.Subsequent MR imaging revealed innumerable foci of tinyhemorrhages in differing stages of evolution. Several hemorrhagicfoci appeared recent. While the diagnosis of cavernousangiomatosis was easily recognizable with routinespin echo (SE) sequences, gradient recalled echo (GRE)imaging showed a dramatic four-fold increase in lesion densitythroughout the brain and spine, totaling in the hundreds.To our knowledge, only one case of more than one hundredcavernous malformations involving the cerebrum, cerebellum,brain stem, and spinal cord has been reported (1).RESULTSCavernous malformations are common, occurring in 0.4-0.8% of the general population (1). Four types of cavernousmalformations have been described, based on MR imagingcharacteristics and pathologic correlations (see table) (2). Inthis case, hundreds of additional Type IV lesions weredetected with GRE imaging, and lesions identified with SEimaging were better characterized. Evaluation with GREimaging provided better characterization of this patient’s diseaseand estimation of his future risk, as risk of future hemorrhagehas been correlated with lesion number and location(2).
MR Classification for Cavernous Malformation(according to Zabramski et al)Lesion Type MR Signal Characteristics Pathologic CharacteristicsT1: hyperintense coreType I T2: hyper or hypointense Subacute hemorrhagecore with hypointense rimT1: heterogenous signalType II T2: heterogeneous signal Hemorrhage and thrombosiswith hypointense rimof varying ageT1: iso- or hypointenseType III T2: hypointense with Chronic hemorrhagehypointense rimT1: not seenType IV T2: not seen Tiny cavernous angiomasor telangiectasiasGRE: punctate hypointense lesions115Tuesday Afternoon3:00 PM - 4:30 PMBallroom 6 A(29b) Adult Brain: Functional Imaging(fMRI, MSI, MRS, PET)(Scientific Papers 155 - 166)See also Parallel Sessions(29a) Adult Brain: Vascular Imaging(29c) Adult Brain: New Techniques,Postprocessing/Trauma(29d) Pediatrics: GeneralTuesdayModerators:Brian C. Bowen, MD, PhDMichael H. Lev, MDPaper 155 Starting at 3:00 PM, Ending at 3:08 PMMolecular Imaging and NeuroradiologyDawid Schellingerhout, MDCONCLUSIONGRE imaging is necessary for accurate initial assessmentand subsequent follow-up of lesion number and location incavernous angiomatosis, and for screening of at-risk familymembers (2). Complete evaluation also must include imagingof the spine.REFERENCES1. Musunuru K, Hillard V, Murali R. Widespread CentralNervous System Cavernous Malformations Associated withCafé-au-Lait Skin Lesions. J Neurosurg 2003;99:412-4152. Zabramski J, Wascher T, Spetzler R, Johnson B, Golfinos J,Drayer B, et al. The Natural History of Familial CavernousMalformations: Results of an Ongoing Study. J Neurosurg1994;80:422-432PRESENTATION SUMMARYMolecular imaging is the study of molecular events in livingorganisms by means of imaging. The innovations in thisgrowing field has significant implications for the future practiceof neuroradiology. Basic molecular imaging contrastmechanisms will be discussed, with examples of each. Theemerging modalities of molecular imaging will be reviewed,together with examples of applications in biomedicalresearch. The role of molecular probes and contrast agentswill be discussed, including activatable agents. The currentlimitations and potential future developments in molecularimaging will be discussed, with emphasis on those developmentsof interest to neuroradiologists.This paper was selected to receive the Norman Leeds BestPaper Award by the Eastern Neuroradiological Society(ENRS) at its 15th Annual Meeting held in August, 2003.KEY WORDS: Cavernous malformations, cavernousangiomatosis, cerebral vascular malformations
Paper 156 Starting at 3:08 PM, Ending at 3:16 PMIntrasubject Reliability of Functional MR ImagingMapping of Frontal and Temporal Language AreasDavidson, K. · Moritz, C. · Rowley, H. · Haughton, V.University of WisconsinMadison, WI116CONCLUSIONThe LWG/AWG task pair has the highest concurrence ratioin the frontal language area and the AWG/TR task pair hasthe highest concurrence ratio in the temporal language area.Performance of multiple language tasks may facilitate mappingof anterior and posterior language regions.KEY WORDS: fMRI, language, mappingTuesdayPURPOSEFor preoperative functional MR imaging (fMRI) mapping,reproducibility of language tasks must be known. We testedthe hypotheses that reproducibility for language tasksdepends significantly on the area of language cortex and thechoice of task.MATERIALS & METHODSSeventeen patients who performed letter-word generation(LWG), antonym-word generation (AWG), and text reading(TR) tasks were analyzed. Within frontal and temporal languageregions activated voxels were counted and lateralityindices were calculated. Regional concurrence ratios (numberof activated voxels common to two tasks/mean of totalvoxel counts from both tasks) were calculated for each taskpair. Concurrence ratios were compared for tasks with componentsof language expression (LWG, AWG) and languagecomprehension (AWG, TR).RESULTSThe 3 tasks consistently produced activation in anterior andposterior language regions. Laterality indices correlated positivelyfor the LWG and AWG tasks in the anterior languageregion, and for the TR and AWG tasks posteriorly. In the leftanterior language region, the mean concurrence ratio was46% for the LWG/AWG task pair, and significantly (p
RESULTSThe prototype software built allows clinical users (neuroradiologists,neurosurgeons, radiation oncologists) to examinemultiple image data sets generated from the techniquesdescribed above, at the same time and on the same display(sample screenshot below). Each image data set can be displayedover anatomical images of the users choosing, separatelyor simultaneously. The display tool was judgedextremely useful by clinical end users and to be vastly superiorto existing imaging strategies.CONCLUSIONThe interactive physician imaging interface prototypedemonstrated its usefulness in displaying and integratingmultiple physiologic parameters. Physicians found the toolto be extremely useful and efficient in establishing spatialrelationships.KEY WORDS: Visualization, neoplasms, postprocessingPaper 158 Starting at 3:24 PM, Ending at 3:32 PMPatterns of Brain Activation during Encoding andRecognition of Verbal and Figural Information in OlderAdultsKraut, M. A. 1 · Beason-Held, L. 2 · Golski, S. 2 · Esposito, G. 3· Resnick, S. M. 21The Johns Hopkins Medical Institutions, Baltimore, MD,2Laboratory of Personality and Cognition, National Instituteon Aging, National Institutes of Health, Baltimore, MD,3Laboratory of Personality and Cognition, National Instituteon Aging, National Institutes of Health, Bethesda, MDPURPOSEIn the cognitive neurosciences, investigators have proposedseveral models to help predict patterns of brain activationduring memory encoding and retrieval. One of these, thehemispheric encoding/retrieval asymmetry (HERA) model,postulates that the prefrontal regions in the left hemisphereare more active during memory encoding, while the right ismore active during retrieval. The hemispheric asymmetryreduction in older adults (HAROLD) model suggests thatactivity in older brains tends to be less lateralized than that117in younger subjects. Our goal was to examine, in olderadults, patterns of brain activation during both encoding andretrieval phases of verbal and visuospatial memory tasks.MATERIALS & METHODSUsing H 215O PET to estimate regional changes in cerebralblood flow, we tested 11 normal right-handed adults ( 6F,mean age = 71.1 years) on tasks that involved both encodingand retrieval of words and figures. The words and figureswere chosen to reduce the likelihood of using visualizationstrategies to remember the words, or verbal strategies toremember the shapes. Modality-specific stimulus-matchingtasks (“are these simultaneously presented stimuli the sameor different?”) were used to control for simple visual perceptionand motor movement-related CBF changes.RESULTSCompared to the verbal matching task, verbal encoding wasassociated with increased rCBF in both frontal regions, leftmore extensive than right, the left anterior cingulate, andleft>right temporal lobes. Figural encoding was associatedwith increases in rCBF in both frontal and temporal lobes.During verbal retrieval, there were rCBF increases in the leftfrontal and right temporal regions. Figural recognitionresulted in bilateral increases in frontal rCBF. During encoding,there were common regions of rCBF increases acrosstasks, all in the left hemisphere, mostly frontal. Two regions(cuneus, bilaterally) showed more activity with verbal thanwith figural encoding. Several regions showed greater activitywith figural encoding than with verbal: right mesial temporal,occipitotemporal and cuneus, and left cuneus. Withretrieval, the insulae and middle temporal gyri were similarlyactivated across tasks, while greater left inferior frontalrCBF activity was evident during the verbal retrieval phasecompared to figural. With figural retrieval, there was morechange in rCBF in the right inferior temporal lobe than therewas during verbal retrieval. Evaluation of task-related rCBFasymmetries shows that verbal encoding, compared torecognition, results mostly in left hemisphere activation,while the converse comparison shows a greater representationof rCBF change in both hemispheres. With figuralencoding compared to retrieval, there is also a predominanceof left-sided activation, while with retrieval, rCBF increasesare more bilateral. Region-of-interest analyses in prefrontalregions showed no task-wise or phase-wise difference in BA10, but significant right>left differences for both tasks in BA46.CONCLUSIONOur data overall weakly support the HERA model, but notthe HAROLD model, given the relative preservation of lateralizationof task-related rCBF changes. The symmetricBA10 rCBF changes, and the right>left asymmetries inBA46, however, run counter to these generalizations, andmay reflect regionally specific functional reorganization,increased variability in regional activity, or a combination.KEY WORDS: Memory, aging, functional imagingTuesday
TuesdayPaper 159 Starting at 3:32 PM, Ending at 3:40 PMImagining a Tune: Discrimination of Lyrical andNonlyrical Musical Imagery with Functional MRImagingFlanders, A. E. A. · Tracy, J. I. · Enochs, W. S. · Lai, S. ·Goyal, N. · Laskas, J. · Madi, S. · Waldron, B.Thomas Jefferson University HospitalPhiladelphia, PAPURPOSEThe processing of musical stimuli is known to invoke activationof the superior temporal gyrus bilaterally as well asportions of the parietal lobe. The process of memorization orrecall of music (musical imagery) is less well understood.Visual imagery data suggest that the nondominant posteriorparietal cortex is crucial to such imaginal activity, thoughstudies also indicate that the striate cortex is recruited. Muchless is known about the substrates of auditory imagery. Thepurpose of this investigation is to identify the areas of thebrain that are activated specifically during the process ofimagining a tune and to demonstrate distinct differences incortical activity between recall of nonlyrical and lyricalmusic.MATERIALS & METHODSEighteen normal volunteers were scanned on a 1.5 T systemusing a standard head coil. A MR compatible sound systemwith stereophonic headphones was used. Imaging consistedof a single gradient-echo echo-planar acquisition (TR 4 sec,TE = 54, 1.9 x 1.9 x 5 mm, 128 x 128 matrix) of 26 axialimages for whole brain coverage. In a blocked design (randomized,counterbalanced), subjects were asked to imaginefamiliar lyrical or nonlyrical songs after being given a 3 secondcue (tape) of the actual song. Separate blocks weredevoted to listening to comparable lyrical and nonlyricalsongs. Control conditions were administered, with covertspeech serving as the chief control for the imagery conditions.A total of 142 time points were collected. Statisticalparametric maps (SPM ‘99) were produced comparing theimagery conditions (lyrical, nonlyrical) to covert speech andrest.RESULTSActivation data for lyrical and nonlyrical conditions areshown in Table 1. The comparison to covert speech revealedleft inferior frontal (Figure1a) and right insula/temporal(Figure 1b) regions of activation. A large region of anteriorcingulate activation characterized the activation associatedwith the nonlyrical songs.Activation Associated with Lyrical & Non-Lyrical ImageryExperimental Comparison Cluster- Cluster Maxima Talairach Brain BrodmannCondition Condition level (P level k E Z Coordinate Region Areacorrected{x,y,z}mmLyrical Rest .000 5810 3.08 -45, 30, 26 Left MiddleFrontal 46, 9Covert .000 1200 3.09 39, -15, 8 Right Insula,Speech Temporal n/aGyrus052 477 2.92 -24, 30, 8 Left InferiorFrontal 46Non-Lyrical Rest .000 1840 3.06 9, 24, 31 RightCingulate Gyrus 32Covert .000 1964 4.22 9, 0, 37 Right CingulateSpeech Gyrus 32, 24Listening .000 1016 3.71 4, 12, 36 Right CingulateGyrus 32.036 151 3.54 47, 20, -18 Right SuperiorTemporal Gyrus 38118CONCLUSIONDistinctly different areas of the brain are recruited forimagery of lyrical and nonlyrical passages; words providethe verbal scaffolding to access lyrical songs as reflected inthe left frontal actvation. Nonverbal aspects of the imagery(melody, rhythm) are accessed through right temporal structures.In contrast, the regions associated with the nonlyricalsongs (anterior cingulate) appear less reflective of these specificprocesses and are indicative of the increased demand onattentional resources that emerges when verbal cues are notavailable. This suggests that the nonlyrical songs were harderto imagine.REFERENCES1. Brain 1998;121:1853-1867KEY WORDS: Functional MR imaging, musical imagery,cognitionPaper 160 Starting at 3:40 PM, Ending at 3:48 PMFunctional MR Imaging Evaluation of Brain Activationduring Deep Brain Stimulation for Treatment ofParkinson’s DiseasePhillips, M. D. · Baker, K. B. · Lowe, M. J. · Tkach, J. A. ·Cooper, S. · Kopell, B. · Rezai, A. R.Cleveland Clinic FoundationCleveland, OHPURPOSETo study the pattern of activation produced by deep brainstimulation (DBS) electrode stimulation in the STN usingfunctional MR Imaging (fMRI).MATERIALS & METHODSFour patients with percutaneously extended bilateral DBSelectrodes in the STN for the treatment of Parkinson’s disease(PD) were studied using a 3 T Siemens Allegra MRI(Erlangen, Germany) on the first or second postoperativeday. The externalized lead system was extended through thewaveguide to an external pulse generator in the MR controlroom. Optimal stimulation for alleviation of symptoms wasdetermined by extensive testing prior to imaging. Scanningconsisted of: 1) three-dimensional anatomical data set withleads disconnected from the pulse generator and 2) gradientechoEPI BOLD fMRI with a single lead connected to thepulse generator. BOLD images were acquired using prospectivemotion correction. Functional MR imaging examinationswere performed with a block style paradigm consistingof 5 stimulator off and 4 stimulator on 32 second epochswith 10 seconds placed between the stimulator off and stimulatoron conditions in order to gradually ramp the stimula-
tor to the optimal stimulation level. Gradual ramping wasemployed for patient comfort and to decrease patient motion.Images acquired during the ramping process were discardedprior to image analysis. All data were filtered spatiallywith aHamming filter that increased BOLD contrast to noise. TheMR imaging time series at each pixel was fit using leastsquares to a boxcar reference function plus a slope and intercept.119REFERENCES1. Jech R, Urgosik D, Tintera J, et al. Functional MagneticResonance Imaging During Deep Brain Stimulation: A PilotStudy in Four Patient with Parkinson’s Disease. Mov Disord2001;16(4):1126-11KEY WORDS: Functional MR imaging, deep brain stimulation,Parkinson’s diseaseRESULTSAll four subjects completed the study with activation demonstratedfrom 6 of the 7 electrodes stimulated. In all cases activationwas demonstrated in the anterior thalamus and posteriorportions of the globus pallidus and putamen. Four of theelectrode stimulations demonstrated additional activation inthe subthalmic nucleus/substantia nigra (SN) region adjacentto the electrode tip. For two electrode stimulations activationwas seen in the contralateral superior cerebellum. Typicalactivation results are displayed in Figure 1. Activation wasidentified consistently in the ipsilateral posterior globus pallidus,posterior putamen, and thalamus. Jech et al. demonstratedthis pattern at 1.5 T in two out of four of their subjects(1). Additionally, activation was seen in the ipsilateralSTN/SN region and contraleral cerebellum. Areas of activationnoted by Jech et al. in the dorsal lateral prefrontal cortex,superior colliculus, and contralateral caudate nucleuswere not seen (1). Importantly, the present study demonstratesactivation only ipsilateral to stimulating electrodesuggesting that artifact secondary susceptibility effects isunlikely to explain the activation results.CONCLUSIONStimulation of therapeutically effective contacts of a DBSelectrode in the STN produces a consistent pattern of ipsilateralactivation deep brain motor structures.The authors of this work have indicated that they will be discussing/presentingan unapproved or investigative use ofDBS leads (Model 3387-40), extensions (Model 7495-51),and IPGs (Model 7426) made by Medtronic, Inc. for 3 Tfunctional MR imaging.Paper 161 Starting at 3:48 PM, Ending at 3:56 PMFunctional MR Imaging Using a Gadolinium-BasedLong Intravenous Half-Life Contrast Agent at 1.5 TMorton, D. W. · Keogh, B. P. · Lim, K. · Maravilla, K. R.University of WashingtonSeattle, WAPURPOSEFunctional MR imaging (fMRI) has gained widespread usein neuroscience research and clinical medicine. Mandevilleet al. demonstrated a cerebral blood volume (CBV) weightedfMRI technique using an intravenous iron-based bloodpool contrast agent, MION, with a T2*-weighted imagingsequence (1). We sought to determine the feasability ofdeveloping a similar fMRI technique using a gadoliniumbasedblood pool contrast agent (MS-325, EPIX Medical)(2).MATERIALS & METHODSWe used a well characterized rat fMRI preparation (3).Anesthetized, adult, male Sprague-Dawley Rats were maintainedon a ventilator with careful monitoring and regulationof vital signs and blood gases. Sensory cortex was imagedusing a custom-built head coil on a 1.5 T scanner. Duringforepaw electrical stimulation, gadolinium-based functionalMR imaging measurements were performed using a T1-weighted 3D GRE sequence (TE = 2.1s, NEX = 1, FLIP =25, FOV = 12 x 12 cm, matrix = 128 x 128, 1.1 mm slicethickness, 8 slice locations with 31 volume acquisitions perfMRI measurement) in 14 different animals (10 test animalsand 4 controls). In each animal, a BOLD fMRI measurementwas performed first. Then, either 0.1 mMol/kg of MS-325(test animals) or an equivalent volume of normal saline (controlanimals) was administered intravenously and a T1 fMRImeasurement was performed. Activations were identifiedwith a standard correlation analysis using MEDx (SensorSystems, Sterling, VA).RESULTSIn all 10 test animals, both the BOLD and T1 fMRI measurementsdemonstrated a cluster of activated voxels in theexpected location of the forepaw sensory cortex contralateralto the stimulated forepaw. The location of the most significantlyactive voxel in the BOLD and T1 functional measurementswere not significantly different. The control animals(i.e., IV saline instead of MS-325) showed robustBOLD activations, but no T1 functional activations. Theattached image shows BOLD and T1 functional MR activa-Tuesday
tion maps from the same animal. The arrows indicate themost significantly active voxel in each measurement. Highsignal in the superior sagital sinus is related to circulatinggadolinium contrast enhancement and does not representfunctional activation.120MATERIALS & METHODSForty patients and 10 volunteers underwent brain MR perfusiongradient- echo sequences using a 1.5 T MR scanner withgadolinium-chelate injection. Perfusion data were processedquantitatively using indicator dilution and factor analysisalgorithms to create maps of cerebral blood volume (CBV)and cerebral blood flow (CBF), of which regions of interestwere computed in gray and white matter areas. Results wereevaluated using correlation coefficients and a specificmethod called “No Gold Standard evaluation method.”TuesdayCONCLUSIONWe have demonstrated a functional MR imaging techniquebased on a long intravenous half-life gadolinium contrastagent (MS-325) using a T1-weighted pulse sequence. Thistechnique has the potential for allowing functional imagingwhile minimizing the susceptibility-related artifacts associatedwith BOLD functional MR techniques.REFERENCES1. Mandeville JB, Marota JJ, Kosofsky BE, et al. DynamicFunctional Imaging of Relative Cerebral Blood Volumeduring Rat Forepaw Stimulation. Magn Res Med1998;39:615-6242. Lauffer RB, Parmelee DJ, Dunham SU, et al. MS-325:Albumin-Targeted Contrast Agent for MR Angiography.Radiology 1998;207:529-5383. Morton DW, Maravilla KR, Meno JR, Winn HR. ClinicallyRelevant Rat Model for Testing BOLD Functional MRImaging Techniques Using Single-Shot Echo-PlanarImaging at 1.5T. Radiology 2001;218:598-601KEY WORDS: Functional imaging, rat sensory cortex, EPIX(MS-325)The authors of this work have indicated that they will be discussing/presentingan unapproved or investigative use ofMS-325 made by EPIX Medical for Functional MR Imaging.The authors of this work have indicated the following affiliations/disclosures:EPIX Medical: Previous research grant.Paper 162 Starting at 3:56 PM, Ending at 4:04 PMPerfusion MR Imaging of Brain ArteriovenousMalformation Using Factor AnalysisDucreux, D. F. 1 · Buvat, I. 2 · Mikulis, D. 3 · ter Brugge, K. 3 ·Bittoun, J. 1 · Lasjaunias, P. 11CHU de Bicetre, Le Kremlin-Bicetre, FRANCE, 2 U 4 9 4 ,Paris, FRANCE, 3 Toronto Western Hospital, Toronto, ON,CANADAPURPOSETo evaluate MR perfusion disturbances induced by brainarteriovenous malformations using both indicator dilutiontheory and factor analysis.RESULTSOn the 40 patients, all had hemodynamic disturbancesaround the AVM nidus such as hyperperfused areas (CBF =300 +- 150 ml/min/100 g in gray matter), hypoperfused areas(CBF = 30 +- 15 ml/min/100 g in gray matter) and venouscongestion areas (CBF = 60 +-20 ml/min/100 g and CBV =8 +- 2 ml/100 g in gray matter), but only 7 had remote disturbancesof venous congestion and hypoperfused areas inboth white and gray matter. These areas were revealed usingthe Factor Analysis method and not seen using the regularindicator dilution theory method.CONCLUSIONFactor Analysis is a usefull method to reveal areas of abnormalbrain perfusion which were not seen using regular dilutionindicator theory.KEY WORDS: Brain AVM, perfusion MR imaging, factoranalysisPaper 163 Starting at 4:04 PM, Ending at 4:12 PMHigh-Resolution Diffusion Imaging in Areas of MagneticSusceptibility Difference: Parallel Imaging and PRO-PELLERRoberts, T. P. L. 1 · Sussman, M. 1 · Keller, A. 21University Of Toronto, Toronto, ON, CANADA,2University Health Network, Toronto, ON, CANADAPURPOSEDiffusion-weighted imaging (DWI) represents a criticaladvance in the neuroimaging of acute stroke and otherpathologies. On the other hand, sensitivity to water microscopicmotion brings with it extreme sensitivity to bulkpatient motion. Consequently, most implementations of diffusion-weightedimaging rely on single-shot echo-planarimaging acquisitions, typically characterized by low spatialresolution, geometric distortion, and magnetic susceptibilityartifact associated with the long echo time, TE. This studyevaluates the role of parallel imaging (to reduce echo train
length and TE) as well as multishot radial fast spin-echo diffusion-weightedimaging (PROPELLER) for diffusionweightedimaging in regions of magnetic susceptibility difference,namely the base of the brain.MATERIALS & METHODSTen healthy volunteers and 16 neurologic patients wereexamined with diffusion-weighted EPI (TE = 69 ms), diffusion-weightedEPI (with parallel imaging, ASSET) (TE = 59ms), high-resolution (256 matrix) diffusion- weighted EPIwith ASSET (TE = 65 ms) and PROPELLER diffusionweightedimaging. All scans were performed using Excitehigh speed receivers (up to 250kHz bandwidth) using an 8-element head coil (MRI Devices Corp.) on a 1.5 TTwinSpeed magnet (General Electric Medical Systems) withdiffusion sensitivity “b-values” of 0 and 1000 s/mm 2 .RESULTSIn all healthy volunteers, use of ASSET improved imagesharpness (gray/white contrast) and reduced susceptibilityartifact near tissue:air and bone:air interfaces (see Figure).Increasing matrix resolution from 128 to 256 incurred only a5 ms TE penalty yet yielded single shot T2 and diffusionweightedecho planar images of submillimeter resolution.Use of PROPELLER FSE diffusion-weighted imagingimproved visualization of anatomical structures near susceptibilitydifferences, but at the expense of scan time. In 3/16neurologic patients, PROPELLER scans were of subdiagnosticquality attributable to patient motion; on the otherhand, in one postsurgical patient with a metal staple in thescalp, diffusion-weighted EPI was nondiagnostic, whereasPROPELLER imaging allowed tissue resolution.Figure. (left) Diffusion-weighted EPI incurs significant magneticsusceptibility-related signal mismapping and voiding;use of ASSET (right) reduces this effect, while improvingoverall image sharpness.CONCLUSIONThe combination of parallel imaging with high resolution EPIscanning allows submillimeter resolution in a single shot,markedly improving the conspicuity of embolic lesions. PRO-PELLER scanning is almost entirely insensitive to magneticsusceptibility artifact but remains at least somewhat sensitiveto motion. High-resolution single-shot EPI is an attractiveoption for T2 screening of an uncooperative patient and forhigh anatomical resolution diffusion-weighted imaging in thesetting of multiple embolic lesions. PROPELLER is indicatedin studies associated with limiting magnetic susceptibility artifactas commonly encountered after prior surgery.The authors of this work have indicated the following affiliations/disclosures:General Electric Medical Systems:Research support.KEY WORDS: Diffusion, susceptibility121Paper 164 Starting at 4:12 PM, Ending at 4:20 PMMR Spectroscopy in the Differentiation of RecurrentNeoplasm from Tumor Necrosis in RecurrentIntracranial Contrast Enhancing LesionsWeybright, P. N. · Maly, P. V. · Gomez-Hassan, D. · Nan, B.· Sundgren, P. C.University of Michigan Medical CenterAnn Arbor, MIPURPOSERecurrent contrast-enhancing lesions in previously identifiedintracranial neoplasms that have undergone treatmentwith chemotherapy and/or radiation therapy can pose a diagnosticdilemma. They may represent recurrent tumor ornecrosis/inflammation from radiation and chemotherapy.Imaging characteristics alone do not often enable discriminationof these two entities and intracranial biopsy carriessignificant morbidity. Symptomatology and clinical courseare often left to determine if a neoplasm has recurred. Earlieridentification of recurrent intracranial neoplasms wouldafford the opportunity to begin adjunctive therapy as soon asan imaging abnormality is detected.MATERIALS & METHODSMR spectroscopy (MRS) was performed on 27 patients(aged 4-61 years, mean 35 years) with newly found contrastenhancinglesions at the site of a previously diagnosed brainneoplasm subsequently treated with radiation andchemotherapy. Seven lesions were located in the posteriorfossa or brainstem, a region in which two-dimensionalchemical shift imaging (2D CSI) has traditionally provenchallenging. In addition to conventional MR imaging, multivoxel(2D CSI) (PRESS, TE/TR 144/1000 msec, FOV 16 x16, thickness 10-20 mm) spectroscopy was performed in 25patients, including 6 patients with posterior fossa or brainstemlesions. Single voxel spectroscopy (SVS) was necessaryin 2 patients (PRESS, TE/TR 144/1500 msec, FOV 24,thickness 20 mm). Patients were followed from 8-28 monthsand had subsequent imaging; in several cases brain biopsy,and clinical follow-up. Follow-up data and outcomes wereused as surrogates of a lesion’s original identity as tumorrecurrence or not.RESULTSCholine (Cho), creatine (Cr), lactate, and N-acetylaspartate(NAA) peaks were resolved easily and readily quantifiable on2D CSI. Fourteen patients had lesions identified as recurrentneoplasm based on clinical and imaging follow-up and in severalcases biopsy. Thirteen patients had lesions identified astumor necrosis/inflammatory treatment-related change, alsobased on follow-up data. Average and mean Cho/Cr, NAA/Cr,and Cho/NAA ratios were calculated for each group. All ratioswere statistically significantly different comparing treatmentrelatedchange from normal adjacent white matter (p < 0.0001,p = 0.002, and p < 0.0001, respectively). All ratios were alsostatistically significantly different comparing tumor recurrencefrom radiation change (p < 0.0001, p = 0.003, and p
TuesdayCONCLUSIONMR spectroscopy and in most cases 2D CSI, with quantifiablemetabolite peaks can be obtained in the evaluation ofrecurrent contrast-enhancing lesions at the site of a treatedintracranial neoplasm, including posterior fossa and brainstemlesions. While overlap in both Cho/Cr and Cho/NAAratios does exist between the recurrent tumor and treatmentrelatedchange populations, metabolite ratios for thesegroups are statistically significantly different. Overlap mayrelated to histologic heterogeneity or volume averaging ofnormal and abnormal tissues. MR spectroscopic differencesin conjunction with conventional imaging may enable discriminationof recurrent neoplasm from treatment-relatedchange when a recurrent contrast-enhancing lesion is identifiedinitially.KEY WORDS: MR spectroscopy, neoplasm, tumor necrosisPaper 165 Starting at 4:20 PM, Ending at 4:25 PMMR Imaging and MR Spectroscopic Appearance of anUnusual Case of Unilateral Multifocal CerebralLymphocytic VasculitisNiku, S. · Imbesi, S. G.University of California San Diego Medical CenterSan Diego, CAPURPOSETo describe the MR imaging and spectroscopic findings ofan unusual case of multifocal cerebral lymphocytic vasculitisand to demonstrate the utility of MR spectroscopy in theevaluation of tumefactive lesions of the CNS.MATERIALS & METHODSA 25-year-old woman presented with seizures, frontalheadaches, and left arm and leg weakness. Physical examinationand laboratory evaluation were otherwise unremarkable.Using a 1.5 T Siemens Symphony superconductingmagnet, brain MR imaging and MR spectroscopy using aPRESS protocol with short (30 msec) and long (144 msec)TE were performed. As definitive diagnostic evidence wasrequired prior to institution of appropriate therapy, a stereotacticbiopsy was obtained.RESULTSMR imaging demonstrated multiple enhancing lesionsthroughout the entire right cerebral hemisphere with extensiveassociated vasogenic edema. These lesions were locatedpredominantly in a peripheral distribution with someinvolvement of the right basal ganglia structures. The leftcerebral hemisphere, cerebellum, and brainstem werespared. MR spectroscopy of the two largest lesions demonstratedmarked elevation of the glutamate and glutaminepeaks (2.2-2.4 ppm), marked elevation of the lipid peak (0.9-1.2 ppm), mild elevation of the lactate peak (1.3 ppm), milddecrease in the NAA peak (2.0 ppm), and no significant elevationof the choline peak (3.2 ppm). Histologic evaluationrevealed extensive evidence of chronic inflammation, lymphocyticvasculitis, necrosis, and infarction without evidenceof organisms or malignancy.122CONCLUSIONMR spectroscopy can be very beneficial in the evaluation oftumefactive lesions of the CNS. In the case presented above,MR findings initially were felt to be most compatible withmultifocal glioma, especially given the predominant unilateraldistribution of disease. However, MR spectroscopy didnot reveal elevation of the choline peak which one wouldtypically expect to see with aggressive neoplastic processes.The most striking abnormality noted was the marked elevationof the glutamate and glutamine peaks. This appears to bea finding associated with inflammatory processes of the CNSand typically is not seen with neoplasms. Thus, elevation ofthe glutamate and glutamine peaks present in tumefactivelesions of the CNS may indicate an etiology other than neoplasmand, in the future, may obviate the need for brain biopsy.KEY WORDS: MR spectroscopy, lymphocytic vasculitisPaper 166 Starting at 4:25 PM, Ending at 4:30 PMSymptomatic Tethered Brain Syndrome in an AdultUlmer, J. L. · Hacein-Bey, L. · Wagner, M. L. · Prost, R. W.· Krouwer, H. G. J. · Meyer, G. A.Medical College of WisconsinMilwaukee, WIPURPOSEWe present the case of a 58-year-old male with an 18-monthhistory of progressive right hand and fourth and fifth digitspastic paresis. The patient had a long-standing bony protuberancearising from the right parietal cranium. He wasrecreationally active, frequently barefoot water skiing. Theimaging and surgical findings supported the diagnosis of asymptomatic tethered brain syndrome.MATERIALS & METHODSCT and MR imaging of the brain and cranium were acquired,focused on the right parietal cranium and adjacent brain convexities.Diffusion tensor imaging (DTI) color-coded directionalanisotropy and BOLD fMRI maps were acquired.Functional MR imaging tasks included bilateral tongue andface movement, left and right finger tapping, and left elbow,shoulder, hip and ankle movements. Also, superselectiveangiography and sodium amytal (WADA) testing of arteriesaround the motor cortex was performed.RESULTSCT revealed a defect of the right parietal cranial inner tablewith a focal mass causing diploic space expansion and outertable remodeling. Under-hanging edges of the internal tablesurrounded the defect and diploic space mass, which wascontiguous with adjacent brain. MR imaging revealed asmall right parietal encephalocele adherent to the underhanginginternal table edges, and contiguous with adjacentabnormal appearing right precentral gyrus. The precentralgyrus was thickened and the central sulcus posterior-superior-mediallyto the encephalocele was unusually shallow.Functional MR imaging of tongue and lower face movementsrevealed typical activation within the right lateral precentralgyrus below the encephalocele. Left finger tappingcaused right precentral gyrus activation immediately belowthe encephalocele, and lesser activity superior-posteriormediallyto the encephalocele and in ipsilateral homologous
M1 cortex. Left elbow, shoulder, hip and ankle movementcaused right precentral gyrus activation superior-posteriormediallyto the encephalocele, but exhibited an unusualoverlap of somatotopic cortical fields. No activity was seenwithin the diploic space tissue. Diffusion tensor imagingrevealed a large abnormal appearing white matter bundleextending from the encephalocele through the posterioraspect of the right superior longitudinal fasciculus. Diffusionweighted imaging and ADC maps indicated restricted diffusionwithin the diploic space tissue compared to that of normalbrain. Superselective angiography revealed vascular disorganizationsupplying the diploic space mass and sodiumamytal testing confirmed the lack of functional neuronal elementsin this region. At surgery, the craniotomy flap and surroundingdura were shown to be adherent to the right precentralgyrus encephalocele, requiring careful dissection toremove the flap. A biopsy revealed glial elements and dysplasia,without evidence for neoplasm. After surgery, thepatient showed immediate significant improvement in motorfunction and was seizure-free.CONCLUSIONImaging and surgical findings were consistent with a smallright parietal encephalocele, containing trapped disorganizedglial elements. Functional MR imaging and DTI suggestedmotor cortical and white matter reorganization, respectively.The recent (18 month) history of progressive left hand weaknessand spasticity seemed, at first glance, contradictory tothe presence of a congenital lesion. Based on the imagingfindings and the surgical results, it is suggested that tetheringof the encephalocele combined with age-related parenchymalinvolution and a highly active recreational life-stylecaused symptomatic traction on right precentral gyrus.KEY WORDS: FMRI, DTI, tethered brainTuesday Afternoon123Paper 167 Starting at 3:00 PM, Ending at 3:08 PMVascular Imaging with Phase-Contrast VastlyUndersampled Isotropic Projection Imaging: AnUltrafast Phase-Contrast MR Angiographic TechniqueTurk, A. S. · Gu, T. · Mistretta, C. A. · Rowley, H. A. ·Turski, P. A. · Haughton, V. M.University of Wisconsin MadisonMadison, WIPURPOSEBy means of undersampling and projection reconstruction,speed increases of a factor of 10 - 30 over conventionalCartesian MR imaging may be achieved. With the increasedspeed, images of the cerebral and cervical vasculature can beobtained with phase contrast in less time than TOF images.Simultaneous acquisition of anatomical detail and velocitymeasurement is possible with the technique. However, theunder sampling hypothetically results in a type of Nyquistartifact. The purpose of this study was to compare the imagequality and artifacts in images of the cranial and cervical circulationobtained with the conventional 3D time-of-flight(TOF) techniques and with phase-contrast - vastly undersampledisotropic projection (PC-VIPR) imaging.MATERIALS & METHODSPatients referred for imaging with contrast-enhanced MRimaging/MR angiography (MRA) were asked to undergo aPC-VIPR sequence. The sequence is implemented on a 1.5 Tscanner (GE Medical Systems, Milwaukee, WI) with a single-receiverhead coil so that each VIPR projection wasexcited 4 times, once with no flow encoding gradient andonce with encoding in the x, y, and z directions. The referenceand the three flow direction excitation data were reconstructedfor the three flow directions. Parameters for the PC-VIPR were 0.63 mm x 0.63 mm x0.63 mm voxel size comparedto 0.86 mm x 0.74 mm x 1.4 mm, TE of 7.5 ms for PC-VIPR vs 2.4 for 3D TOF. The scan time for a 3 slab 3D TOFwas 8:30 and for the PC-VIPR was 5:00 minutes. Informedconsent from each patient and IRB approval was obtained.Tuesday3:00 PM - 4:30 PMRoom 606 - 609(29c) Adult Brain: New Techniques,Postprocessing/Trauma(Scientific Papers 167 - 177A)See also Parallel Sessions(29a) Adult Brain: Vascular Imaging(29b) Adult Brain: Functional Imaging (fMRI, MSI,MRS, PET)(29d) Pediatrics: GeneralRESULTSIn this study (12 patients enrolled to date), we found theanatomical depiction of the intracranial and extracranial vesselsto be similar in VIPR and in the conventional TOFimages. Flow signal intensity was equivalent for both techniquesin regions of laminar flow. In a few instances focalsignal loss due to pathologic stenosis or complex vesselgeometry was more pronounced on the PC-VIPR images,but the overall degree of vascular stenosis was demonstratedequally well in each sequence. The geometrical complexartifacts resulting from severely undersampling in projectionacquisition did not detract significantly from image qualityor interpretation.Moderators:Steven G. Imbesi, MDAquilla S. Turk, DO
TuesdayThe image on left is a standard 3D TOF and on right is thecontrast-enhanced PC-VIPR sequence applied to the sameperson.CONCLUSIONThe extremely fast PC-VIPR MRA produces images similarin quality as compared to standard 3D TOF images. Furtherevaluation is warranted to determine the clinical value of theanatomical and physiologic data obtainable by this method.KEY WORDS: MRA, cerebral vasculature, phase contrastPaper 168 Starting at 3:08 PM, Ending at 3:16 PMMR Statistical Mapping of Manganese TransportDisruption and Recovery Following Lesion of the RatOlfactory TractCross, D. J. 1 · Anzai, Y. 1 · Maravilla, K. R. 1 · Morrow, T. J. 2· Flexman, J. A. 1 · Miyoshi, S. 1 · Minoshima, S. 11University of Washington, Seattle, WA, 2Veteran’sAdministration Hospital, Ann Arbor, MIPURPOSENormal functional connections of the rat olfactory systemwere mapped statistically in vivo using MR imaging and manganese(Mn) as a transport-mediated transsynaptic tracer. Thisbrain mapping technique was applied to investigate initial disruptionand recovery of Mn transport following radiofrequency(RF) lesion of the lateral olfactory tract (LOT).MATERIALS & METHODSSix rats were scanned with 1.5 T MR imaging and a rat brainvolume coil. 3D SPGR (TE = 6.8 ms; TR = 15 ms; flip angle45 degrees; 4 NEX) imaging was performed at pre, and 6, 12,24, 36, and 48, 72 hours (6 rats) and 5.5, 7.5, 10.5, and 13.5days (3 rats) postadministration of 10 microliter manganesechloride to the right nasal epithelium. Image sets from each ratwere coregistered to the same orientation and then registeredto the stereotactic atlas (1) (Neurostatsoftware). Global intensityand drift across scans was normalized. Pre and postadministrationscans were subtracted in a pair-wise manner andcompared statistically across subjects. T statistics were convertedto Z maps and superimposed on a template anatomicalimage. Z score threshold of 4.0 (p < 0.05 adjusted for multiplecomparisons) was estimated to indicate pixels with significantMn transport. Region of interest (ROI) analysis used regionsidentified as statistical peaks. To investigate brain injury andrepair, 5 new rats were RF lesioned in the LOT and underwent3 separate scanning sessions. The first session (scans at pre,and 24, 48, 72 hours post Mn administration) was prior tolesioning. Two other series of scans were obtained at 1 weekand 4 weeks postsurgery. Administration, imaging parameters,and analysis were identical to first study.124RESULTSMost significant changes in cortical intensity were confinedto the LOT (70% Z = 15.4) at early time points. At 24 hourspostadministration, other structures accumulated enough Mnto show consistent percent change in enhancement acrosssubjects, resulting in cortical peaks outside the LOT and inposterior regions (tubercle 36% Z = 10.1; anterior commissure30% Z = 6.4; ventral pallidum 26% Z = 5.0; piriformcortex 28% Z = 6.1; amygdaloid piriform transition 15% Z =5.0). In the lesion study, ipsilateral transport at 1 weekpostlesion LOT anterior to lesion showed no change (prelesion60 ± 22%; 1 week postlesion 56 ± 18%), however posteriorLOT had significant reduction in transport (pre 41 ±20%; 1 week 22 ± 10%, p < 0.05). After 4 weeks postlesion,recovery of Mn transport in ipsilateral LOT posterior tolesion was seen (pre 41 ± 20%; 4 weeks 36 ± 21%).Additional significant increase in contralateral LOT wasseen at 4 weeks (pre 6 ± 9%; 4 weeks 25 ± 15%, p < 0.01)associated with greater transport through the anterior commissure.CONCLUSIONUsing statistical brain mapping, Mn transport through the ratolfactory system can be quantified consistently.Radiofrequency lesioning interrupted transport in LOT at 1week postsurgery. However, recovery of transport posteriorto lesion as well as significant contralateral transport indicatingpossible plasticity to the alternative pathway throughcommissural fibers were demonstrated at 4 weeks postsurgery.Findings suggest two differential modes of neuronalconnectivity reorganization after damage.REFERENCES1. Paxinos G, Watson C. The Rat Brain in StereotaxicCoordinates. N Y Acad Press 1998KEY WORDS: Rat brain, manganese, statistical brain mappingPaper 169 Starting at 3:16 PM, Ending at 3:24 PMDosage Optimization of Ultrasmall Particle Iron OxideUsing a Gradient-Recall Echo Sequence on UltrahighMR Field for the Visualization of Rodent BrainMicrovasculatureYang, M. · Christoforidis, G. A. · Figueredo, T. · Abduljalil,A. · Heverhagen, J. · Schmalbrock, P. · Knopp, M.The Ohio State UniversityColumbus, OHPURPOSETo determine whether ultrasmall particle iron oxide (USPIO)intravascular contrast agent can enhance the conspicuity ofnormal microvasculature in the rodent brain using ultrahighfield high resolution MR imaging and optimize dosage forsuch imaging.MATERIALS & METHODSA total of twelve Wistar rats were divided into 3 groups andanesthetized. The femoral veins were cannulated. Eachrodent was imaged before and after intravenous injection ofUSPIO. Group 1 receive 1 mg/kg, group 2 received 2 mg/kgand group 3 received 3 mg/kg. They were imaged at 8 T ona Bruker AVANCE (Bruker, Billerica, MA) interfaced with
Techron (Crown International, Elkhart, IN) gradient amplifiersand Manex gradients (Magnex Scientific, Abingdon,England) using a custom-built radio frequency front end. Acustom made 4 cm diameter birdcage coil was tuned to thehead of the rat at 340 MHz while the rat was in the proneposition. Imaging sequences included a gradient-recalledecho (GRE) sequence (TR/TE 700/16 msec, flip angle 45 o ,NEX = 2, 512 x 512 matrix and 78 m m in-plane resolution).All rats recovered from anesthesia after scan. The number ofcortical penetrating vessels and the number of deep graynuclei perforators that could be identified before and aftercontrast enhancement were counted by two separate reviewerson a section through the level of the caudate nucleus todetermine the conspicuity of microvessels. The signal intensity(SI) and signal-to-noise ratio (SNR) on both sides alsowere measured by a semiautomated method at the samelevel. Interobserver reliability between two observers onvessel number counts was determined by using student t-testto confirm reproducibility. The change in SI and SNR in allregions of interest (ROIs) were compared before and aftercontrast administration. Statistical significance was determinedusing student t-test.RESULTSDifferences in the number of vessels identified before vsafter USPIO administration were statistically significant inall three groups (see Table). The difference between the vesselcount at 1 mg/kg and 2 mg/kg was statistically significant(p = 0.0080) whereas the difference between 2 mg/kg and 3mg/kg was not (p = 0.76). Reliability for vessel count wasconfirmed. The SI dropped following USPIO administrationby 20.5% in the 3 mg Fe/kg group. This SI drop was lowerin the other dosage groups (4.4% in 1 mg Fe/kg and 6.2% in2 mg Fe/kg), there was no significant difference in SNRbefore and after contrast administration in each of the threegroups.Table 1: Number of perforating vessels identified at differentdosesMean number of vessel identified(standard error) at varying doses1mg/kg 2mg/kg 3mg/kgWith USPIO 18.25 (1.66) 31.25 (3.02) 30.00 (2.1)Without USPIO 9.5 (1.66) 6.75 (3.02) 6.75 (2.1)P value 0.0107 0.0012 0.0002CONCLUSIONPostcontrast imaging by intravascular contrast agent USPIOimproved the visualization of microvascularity. A dose of 2mg Fe/kg USPIO appeared to be optimal because it improvesvisualization of microvascularity at 8 T without sacrificingthe SI.KEY WORDS: Iron oxide, high field MR imaging, microvasculature125Paper 170 Starting at 3:24 PM, Ending at 3:32 PMImaging of Microvascularity within the F98 GliomaModel Using Intravascular Contrast Agent on HighResolution Ultrahigh Field MR Imaging withHistopathologic CorrelationChristoforidis, G. A. · Yang, M. · Yang, W. · Barth, R. F. ·Chaudhury, A. · Chakeres, D.Schmalbrock, P. · Knopp, M.· Heverhagen, J. ·The Ohio State UniversityColumbus, OHPURPOSETo assess the ability to visualize microvascularity within theF98 rodent glioma model using ultrahigh field high resolutionMR imaging aided by the administration of intravascularcontrast agent and compare this to histopathology.MATERIALS & METHODSHigh resolution, ultrahigh field (UHF) 8 T MR imaging andultrasmall particle iron oxide (USPIO) intravascular contrastagent, (SHU555C, Supravist, Schering AG, Berlin) dosagewere optimized to define microvascularity in 12 normal maleWistar rats. Tumor cells derived from the F98 undifferentiatedglioma cell line were implanted into the right caudatenucleus in 8 Fischer rats. The tumor cells were allowed togrow in vivo until the animal displayed premorbid signs(weight loss, ataxia, and periorbital hemorrhage). At thistime the animals were anesthetized and ventilated. They thenwere imaged at 8 T on a Bruker AVANCE (Bruker, Billerica,MA) interfaced with Techron (Crown International, Elkhart,IN) gradient amplifiers and Manex gradients (magnexScientific, Abingdon, England) using a custom-built radiofrequency front end. A custom made 4 cm diameter birdcagecoil was tuned to the head of the rat at 340 MHz while therat was in the prone position. Imaging included a gradientrecalledecho (GRE) sequence (TR/TE 700/16 msec, flipangle 45 o , NEX = 2, 512 x 512 matrix and 78 m m in-planeresolution) before and after USPIO (2 mg Fe/kg) administrationvia the femoral vein. Animals were sacrificed immediatelyafter imaging and the brains were removed fixed andsectioned at 1 mm intervals and stained with hematoxilin andeosin and reticulin. The total volume within the tumor whichdisplayed abnormal microvasculature was calculated beforeand after USPIO administration. Signal loss within the tumorbed also was calculated and compared to the normal hemisphere.Two-tailedstudent t-test was used to test significantdifferences. Pathologic specimens were compared to MRimages for degree of microvascular density and size ofmicrovessels using semiquantitative methods and comparedwith contingency analysis.RESULTSThe volume of visualized abnormal microvascularityincreased by an average of 72.2% (std err mean 0.168, p =0.0036) following contrast administration. Comparing preand postcontrast images the signal intensity within the tumorbearing region dropped by 25.1% (standard error = 3.29%; p= 0.0001). Signal loss in the normal side before and afterUSPIO administration was 7.4% (standard error = 1.22%; p= 0.0005). Comparing signal drop within the tumor bearingregion to the signal drop in the normal hemisphere, the signalintensity within the tumor bearing region dropped by anaverage of 9.09% (std err mean = 1.68%; p = 0.0011) moreTuesday
Tuesdaythan the signal drop in the normal hemisphere followingUSPIO administration. Comparing histopathologic specimentsto 8 T MR images contingency analysis indicatedgood correlation for microvascular density (p = 0.05) andmicrovascular size (p = 0.03).CONCLUSIONUltrasmall particle iron oxide administration significantlyenhances the extent of visualization of tumoral microvascularityat 8 T MR imaging with histopathologic confirmation.Signal loss within the tumor bed following administration ofintravascular contrast agent also can help quantify abnormalmicrovascularity. Since the contrast agent used was intravascularthis signal loss may act as an indicator of microvasculardensity.KEY WORDS: Glioma model, high field MR imaging,microvascularityPaper 171 Starting at 3:32 PM, Ending at 3:40 PMComplex Digital Subtraction as a Problem-Solving Toolin Enhanced MR ImagingSheikh, S. · Safriel, Y. · Sze, G.Yale University School of MedicineNew Haven, CTPURPOSEEnhanced T1- weighted MR imaging of the brain has beenused successfully to demonstrate numerous lesions in thebrain. Complex subtraction, where the raw data fromenhanced images is subtracted from that of unenhancedimages, has been shown to be robust with improved imagesin phantoms and no loss of information on human subjects(1). We propose to illustrate how complex digital subtractioncan be used as a problem-solving tool in daily clinical practice.MATERIALS & METHODSOver the course of a 6-month period, complex digital subtractionwas used in routine clinical cases where enhancementwas masked potentially by other findings.Postprocessing was done offline at the MR console (GeneralElectric, Milwaukee, WI) by the technologist. All sequenceswere reviewed by three neuroradiologists, as part of routinepractice.RESULTSIn all, 24 cases were reviewed with subtracted images. Caseswhere complex subtraction was used included areas of hemorrhage,postoperative change, sequelae of infection, duralbased inflammatory lesions, and calvarial lesions. The utilityof subtracted images was most evident where the underlyinglesion was masked by hemorrhage. Of equal clinical utilitywas the demonstration of the absence of a suspectedlesion, which was obscured initally by hemorrhage.Enhancement of toxoplasmosis was clarified further. Finallylesions within the skull were more conspicuous. Cases wheresubtraction was not helpful occurred when motion betweenthe pre and postcontrast images resulted in misregistration.126CONCLUSIONOur study confirms that digital subtraction improves the conspicuityof enhancing brain lesions (2). Furthermore, wehave demonstrated that the standard practice of reviewingenhanced images alone may not be sufficient in the clinicalsetting when hemorrhage is present. Subtle disease may bemissed easily when there is initial T1 shortening on unenhancedimages. Obtaining and reviewing subtracted imagesdoes not add significant time. In using this technique it isvital to check for misregistration artifact, which, if notaccounted for, may lead to false interpretation.REFERENCES1. Naganawa S, Ito T, Iwayama E, Fukatsu H, et al. MagnitudeSubtraction vs. Complex Subtraction in Dynamic Contrast-Enhanced 3D-MR Angiography: Basic Experiments andClinical Evaluation. JMRI 1999;10:813-8202. Melham ER, Mehta NR. Dynamic T1-Weighted Spin-EchoMR Imaging: The Role of Digital Subtraction in theDemonstration of Enhancing Brain Lesions. JMRI1999;9:503-508KEY WORDS: Digital subtraction, MR imagingPaper 172 Starting at 3:40 PM, Ending at 3:48 PMMultidetector CT, CT Angiography, and PerfusionImaging in Acute Cerebral Ischemia and HyperperfusionSyndromesBrant-Zawadzki, M. N.Hoag Memorial HospitalNewport Beach, CAPURPOSEThe purpose of this study was to evaluate the impact of multidetectorCT (MD CT) in a community hospital’s setting forprompt management of patients with symptoms suggestiveof cerebral ischemia.MATERIALS & METHODSRoutine as well as angiographic and perfusion computedtomography (CT/CTA/pCT) was performed in 60 patientswith suspected acute ischemic symptoms, and their studiesand medical records were reviewed retrospectively. Thebrain CT anatomical images, the calculated mean transittime (MTT), cerebral blood flow (CBF), and cerebral bloodvolume (CBV) perfusion images were evaluated visually.The initial studies and their interpretations were compared tosubsequent brain CT and/or MR scans, and the CTA imageswere compared to conventional angiograms and MRangiograms, when available.RESULTSForty-two patients demonstrated clinically relevant abnormalfindings, while 18 patients had negative exams. Beingthe initial imaging studies, the MD CT studies directlyimpacted patient management decisions in every case. Acuteendovascular or surgical intervention was enabled or contraindicatedbased on the results of the study in 10 patients.Matched perfusion, transit time, and blood volume defectspresaged infarction in 10. Mismatched defects demonstratedreversible or salvageable ischemic penumbra in 9.Arteriosclerotic “flow significant” plaque (23 patients) andother vascular pathology was depicted, including occluded
vessels (10 patients), emboli (5 patients), spasm or vasculitis(2 patients), and dissection (1 patient). Hyperperfusion syndromesin recently revascularized patients were demonstrated.1272. The hypothesis that the AD group is not significantly differentfrom the normal group can be tested by combining thesingle probabilities from each subject to obtain a single valuefor each group.CONCLUSIONMultidetector CT/CTA/pCT can play a major role in promptmanagement of patients with clinical signs of cerebrovascularischemia, identifying major blood vessel vasculopathyand brain anatomy and flow physiology. Matched blood volume,transit time, and perfusion defects indicate permanentinfarction, whereas normal blood volume but decreasedregional perfusion suggests ischemic insult which is eitherreversible or potentially salvageable, though evolution tofrank infarction can occur. Posttherapeutic hyperperfusion,which mimics ischemia, can be identified clinically.KEY WORDS: Acute stroke syndromes, brain circulation andmetabolism, CTPaper 173 Starting at 3:48 PM, Ending at 3:56 PMA Vascular Territory Model for Separating Normal andAlzheimer’s Disease Groups Based upon Net CerebralBlood FlowJackson, A. · Scott, M. · Thacker, N.University of ManchesterManchester, UNITED KINGDOMPURPOSETo estimate regional cerebral blood flow using a novelmethod in combination with a vascular territories model innormal and Alzheimer’s disease (AD) patients.MATERIALS & METHODSThe study was approved by the Local Reseach EthicalCommittee and all subjects gave informed consent. Sixtynormal (mean age 73.1 years, range 61-87 years, 20 male)and 9 AD subjects (mean age 61.6 years, range 51-72 years,2 male) underwent MR scanning (1.5 T, Philips ACS PT6000 NT, Philips Medical Systems). A bolus of contrastagent (0.1 mM/kg body mass; Gd-DTPA-BMA, NycomedUK, Ltd.) is imaged through 25 contiguous slices of thebrain over 40 time points at a temporal resolution of 1.9 secondusing a 3D volume acquisition with echo shifting andsegmented EPI data collection (PRESTO; TR = 20 ms, TE =28 ms, FA = 10 degrees, EPI = 9, matrix = 64 x 64, voxel size= 1.80 x 1.80 x 3.0 mm for all normals and one AD subjectand 1.80 x 1.80 x 3.5 for the rest of the AD subjects). For allsubjects, net cerebral blood flow (NCBF) across each voxelis estimated (1) and a logarithmic transform applied to makethe distribution Gaussian. A vascular territories model comprising10 hemispherically symmetric regions (covering theanterior/middle/posterior arterial territories and the intermediatewatershed regions) is fitted to a slice at the level of theupper border of the third ventricle. The mean and standarderror of the log(NCBF) in each of the ten regions is calculated.The normalized mean data undergoes principle componentsanalysis, giving the 10 modes of variation of thelog(NCBF) in the normal group. All data are transformedinto this normal eigenvector space. The probability that therotated data has been drawn from a Gaussian distribution iscalculated for each of the 10 dimensions. The 10 probabilitiesfor each subject are combined as described in referenceRESULTSThe normal group p-value is 0.54. This is consistent with thedistribution of probabilities from each normal being flat,data less flat than this would be generated 54% of the time.The AD group p-value is 7.4 x 10 -5 ; it is highly unlikely thatthis group is drawn from the same distribution as the normalgroup.CONCLUSIONThe novel technique for NCBF measurement demonstratesthe known differences between AD and normal groups. Thecombination of this technique with the vascular territoriesmodel may have diagnostic value and offers the possibilityof decision support tools for clinical diagnosis. The statisticalmodel presented is novel and provides a powerful tool forthe detection of magnitude and distribution abnormalities inperfusion studies. The extension of this technique from a singleslice to whole brain volumes can be expected to drasticallyimprove statistical power.REFERENCES1. Thacker NA, Scott MLJ, Jackson A. Can DynamicSusceptibility Contrast Magnetic Resonance ImagingPerfusion Data Be Analyzed Using a Model Based onDirectional Flow? J Magn Reson Imag 2003;17:241-2552. Bromiley PA,Thacker NA, Scott MLJ, Pokric M, Lacey AJ,Cootes TF. Bayesian and Non-Bayesian Probabilistic Modelsfor Image Analysis. Image Vision Comput 2003;21:851-864KEY WORDS: Vascular territories, Alzheimer’s disease,probability reflatteningPaper 174 Starting at 3:56 PM, Ending at 4:04 PMVoxel-Based Morphometry in Patients Affected by MildForm of Alzheimer’s DiseaseRomano, A. · Bozzao, A. · Fasoli, F. · Finocchi, V. ·Fantozzi, L. M.S.Andrea Hospital University “La Sapienza”Rome, ITALYPURPOSEVoxel-based morphometry (VBM) is a new technique fordetection of brain atrophy allowing the comparison of localgray matter concentration at every voxel in an imagebetween two groups of subjects. We applied VBM to findgray matter changes in patients affected by mild AD.MATERIALS & METHODSTwenty patients with typical clinical presentation fulfillingNINCDS-ADRDA criteria for probable AD of mild severityas well as 15 healthy controls (with normal memory performanceand without vascular lesions at MR imaging) werestudied. The two groups were matched for age and gender.T1-weighted, volumetric MPRAGE MR scans were performedon a 1.5 T magnet yielding 150 contiguous 0.80 mmaxial slices. Analysis was performed by using SPM99 runningin MATLAB 5.0. Those images were analyzed withTuesday
optimized method by Good, et al.(2000). Cerebral fractionalvolumes [brain parenchymal (BP), gray matter (GM), whitematter (WM), and CSF fraction] were calculated also.128MATERIALS & METHODSSprague-Dawley rats were subjected to left optic nerve crushusing standard techniques. Briefly, anaesthetized adultfemale rats were fixed in a stereotaxic frame and an incisionmade behind the left eye. The intraorbital portion of the leftoptic nerve was exposed and then crushed 2 mm behind theglobe for 10 seconds with No. 5 jeweler’s forceps. Nerveinjury was verified by the appearance of a clearing at thecrush site. After MR imaging, the rats were sacrificed by anoverdose of anesthesia, and the optic nerve was isolatedimmediately and fixed in paraformaldehyde. The nerveswere stained immunohistochemically for myelin, paranodes,and sodium and potassium channels. MR imaging was performed6 months after injury. Diffusion imaging was performedat 4.7 T and transverse sections were obtained. Twob values ranging from 10 - 1000 sec/mm 2 were employed attwo orthogonal directions, parallel and perpendicular directionsto the optic nerve orientation. On those images, transverse(t-ADC) and longitudinal (l-ADC) diffusion coefficientswere calculated in regions of interest encompassingthe crushed optic nerve and the contralateral side as a control.Anisotropy was defined simply as l-ADC/t-ADC.TuesdayRESULTSVolumetric analysis showed significant difference betweenpatients affected by mild AD and control subjects (BPF: p =0.01; GMF: p = 0.009; CSFF: p = 0.01). Only white matterfraction was not significant. We found areas of gray matterloss especially located in temporal lobe mostly in theparahippocampal cortex, middle temporal gyrus, and middlefrontal gyrus bilaterally.CONCLUSIONPrevious morphometric studies demonstrated that patientsaffected by mild AD present diffuse cerebral atrophic areas,confirmed by our study by VBM. Voxel-based morphologyis a very sensible technique to find local and global graymatter concentration loss.KEY WORDS: Cerebral atrophy, voxel-based morphometryPaper 175 Starting at 4:04 PM, Ending at 4:12 PMDiffusional Anisotropy Loss after Optic Nerve CrushInjuryTakahashi, M. · Sunmonu, A. N. · Kiryu, S. · Vartanian, T.K. · Hackney, D. B.Harvard Medical School/Beth Israel Deaconess MedicalCenterBoston, MAPURPOSEThe purpose of this study was to assess the potential ofapparent diffusion coefficient (ADC) measurements to elucidatethe processes of axonal degeneration in an optic nerveafter traumatic injury. It has been shown that MR determinationof ADC can indicate the orientation of axons and characterizeinjury of white matter in species with myelinatedsystems such as rats, cats, and humans. If ADC values successfullyidentify axonal injury, then they may be used tomonitor response to treatments intended to ameliorate axonaldegeneration.RESULTSThe crushed nerves were shrunken and the cross-sectionaldiameter was smaller than that in the controls (approximately0.5 mm vs 0.75 mm). In the crushed optic nerves, the t-ADCwas increased compared with that of controls and l-ADC valueswere not changed significantly. Because of this increase inthe t-ADC, there was a marked decrease in anisotropy (0.82 ininjured nerves vs 2.72 in uninjured). Diffusion results wererelated to myelin basic protein staining.CONCLUSIONOptic nerve crush results in reproducible loss of anisotropydue to increases in t-ADC. Posttraumatic degeneration of thenerve may be evaluated with MR imaging. This method isappropriate for evaluating response to therapy intended to beprotective for posttraumatic degeneration.KEY WORDS: Diffusion-weighted MR imaging, rat opticnerve, traumatic injuryPaper 176 Starting at 4:12 PM, Ending at 4:20 PMIntrathecal Gadolinium-Enhanced MR Cisternographyin the Evaluation of Clinically Suspected CerebrospinalFluid Rhinorrhea: Initial ExperienceSelcuk, H. · Albayram, S. · Yilmaz, H. · Barutca, H. ·Gulsen, F. · Rafee, B. · Islak, C. · Kocer, N.Cerrahpasa Medical SchoolIstanbul, TURKEYPURPOSEIn this prospective study, we evaluated the utility of MR cisternographyafter intrathecal administration of gadolinium inpatients with clinically suspected of having cerebrospinalfluid rhinorrhea.MATERIALS & METHODSFourteen patients (eleven male and three female patientsaged 6-43 years) clinically suspected of CSF rhinorrheaand/or recurrent meningitis was included in this study.
Twelve patients experienced cranial trauma and two patientshad previous anterior skull base surgery 4 months-1 yearbefore the MR examination. Fat saturated T1-weightedimaging was performed in three orthogonal planes by usinga 1.5 T MR (Siemens Symphony). By means of a lumbarpuncture, 3-5 mL of CSF was withdrawn, 0.5 ml gadopentetatedimeglumine (Magnevist; Schering, Berlin, Germany)mixed with a 4.5 ml saline. This solution then was injectedinto the subarachnoid space, and needle was removed. Thepatients were positioned prone in the 30-40º Trendelenburgposition for 30-40 minutes after withdrawal of the needle tomaximize the potential for contrast agent accumulation inthe intracranial basal subarachnoid cisterns.RESULTSNo patients manifested gross behavioral changes, neurologicimpairment, alteration in mental clarity, vital sign deviationfrom baseline, anaphylactic or other allergic reaction orseizure activity at any time during the initial 24-hour observationperiod following MR cisternography. In all patients,the gadopentetate dimeglumine entered the subarachnoidspaces at the base cranial cavity. Six patients showed leakageof gadolinium-enhanced fluid through the cribriform plateinto the region of the ethmoid air cells and frontal sinus. Onepatient had leakage into right mastoid cells. No leakage wasobserved in seven patients; five following cranial trauma andone with meningioma that had been operated previously.CONCLUSIONIn conclusion, intrathecal gadolinium-enhanced MR cisternographyis a promising technique that may permit direct,sensitive visualization of the site of spontaneous, posttraumaticor postsurgical CSF leakage.129noncollinear directions with b = 1000 s/mm 2 , as well as anadditional image at b = 0 s/mm 2 . Tensor calculation and 3Dtractography were generated using in-house software (1),with the fiber tracking performed according to the FACTalgorithm (2).RESULTSConventional MR images showed findings of diffuse axonalinjury, with small hemorrhages at the gray-white matter junctionsof the right frontal lobe on T2*-weighted imaging.Additionally, a lesion with T2 prolongation was present nearthe midline of the splenium of the corpus callosum, also consistentwith axonal shearing injury. Diffusion tensor imagingshowed that the splenial lesion had markedly reduced apparentdiffusion coefficient (ADC) and markedly reduced fractionalanisotropy (FA). The reduced ADC and FA were due almostentirely to a large decline in the major eigenvalue of the diffusiontensor, reflecting a large decrease in the magnitude of diffusionparallel to the white matter fiber orientation within thesplenial lesion. Three-dimensional tractography of the spleniumrevealed an interruption of the white matter fibers in theposteroinferior aspect of the splenium (Figure). The patientwas found to have left hemialexia on later neuropsychologicaltesting. This functional deficit, known as posterior callosal syndrome,corresponds to disconnection of the right visual cortexfrom the language centers of the dominant left hemisphere, dueto the interrupted transcallosal visual pathway within the spleniumvisualized on DTI tractography (3).TuesdayKEY WORDS: CSF leakage, gadolinium, MR cisternographyPaper 177 Starting at 4:20 PM, Ending at 4:28 PMDiffusion Tensor Imaging with Three-Dimensional FiberTractography of Traumatic Axonal Shearing InjuryResulting in Posterior Callosal “Disconnection”SyndromeMukherjee, P. · Le, T. H. · Henry, R. G. · Berman, J. I. ·Ware, M. · Manley, G. T.University of California San FranciscoSan Francisco, CAPURPOSEAxonal shearing injury is a primary mechanism for the cognitiveand neurologic deficits resulting from head trauma.We show that diffusion tensor imaging (DTI) with 3D fibertractography can visualize traumatic white matter disruptionin the splenium of the corpus callosum causing left hemialexiadue to interruption of transcallosal visual pathwayfibers.MATERIALS & METHODSA 22-year-old man underwent MR imaging 3 days followinga fall, with a Glasgow Coma Scale of 6 on presentation to theemergency department. The 1.5 T MR sequences includedT1-weighted spin-echo, T2*-weighted gradient-echo, fluidattenuatedinversion recovery (FLAIR), and whole brainDTI performed with a single-shot, spin-echo, echoplanarsequence. The diffusion gradients were applied along sixCONCLUSIONDiffusion tensor imaging with 3D fiber tractography canvisualize white matter tract shearing injury in acute headtrauma, which may have prognostic value for the cognitiveand neurologic sequelae of traumatic brain injury.REFERENCES1. Glenn OA, Henry RG, Berman JI, et al. DTI-Based Three-Dimensional Tractography Detects Differences in thePyramidal Tracts of Infants and Children with CongenitalHemiparesis. J Magn Reson Imag 2003;18:641-6482. Mori S, Crain BJ, Chacko VP, et al. Three-DimensionalTracking of Axonal Projections in the Brain by MagneticResonance Imaging. Ann Neurol 1999;45:265-2693. Molko N, Cohen L, Mangin JF, et al. Visualizing the NeuralBases of a Disconnection Syndrome with Diffusion TensorImaging. J Cogn Neurosci 2002;14:629-636KEY WORDS: Diffusion, trauma, tensor
Paper 177A Starting at 4:28 PM, Ending at 4:36 PM3D Volume Evaluation of Brain Tumor Changes beforeand after TreatmentYu, L.State University of New York Upstate Medical UniversitySyracuse, NY130CONCLUSIONThe conventional finite element method has been used forestimating the volume for any 3D object. However, the resultof this estimation is not very precise because the elementswe choose from are in fixed shapes (e.g., triangles and rectangles).Often the subtle volume will be discarded by usingfinite element method, thus the estimation error is inevitable.Here, we use our new method, a balloon element that can bedeformed and scaled in any direction to calculate the tumorvolume. This flexibility enables the “balloon” be “filled”into any subtle space, so that a more precise estimation of thetumor volume can be achieved. By adapting the concept ofballoon element, a 3D reconstruction and visualization softwareis created to study the volume/shape changes of thebrain tumor in 3D space. The software is aiming to improvethe accuracy and efficiency of diagnosis, and to achieve bettertumor treatment evaluation and possible surgical planning.KEY WORDS: Brain tumor, balloon element, 3D reconstructionTuesdayPURPOSEThe assessment of the brain tumor size before and after thetreatment is critical to evaluate the treatment efficacy. Thevolume and shape changes of the brain tumor provide importantinformation for evaluating the tumor status, and furtherfor improving the diagnosis. Tumor growth or shrinkageoften presents in unpredictable ways. It can be difficult forradiologists to assess the precise change of the brain tumorvia the traditional 2D images in CT/MR imaging, where criticalarea may be missed when the slice images are captured.Thus the precise evaluation of the treatment is not likely tobe achieved. Computer-assisted 3D techniques have becomeincreasingly utilized in radiologic diagnosis. The generationof accurate anatomical 3D models from 2D medical imagedata provides precise information about spatial relationshipsbetween critical anatomical structures (e.g., brain tumor andeloquent cortical areas), pathology, and the shape/volume ofthe tumor. We develop a new 3D reconstruction technique toimprove the tumor localization, volume assessment anddetermination of the margins of the tumors with respect tothe adjacent critical brain structures.MATERIALS & METHODSVariable objects with known volumes and shapes were utilizedfor CT/MR imaging. The precisions of their volumecalculation are compared between using the balloon elementmethod and the conventional finite element method. We thenperform CT/MR imaging in different types of brainlesion/tumor before and after treatment; then use automaticsegmentation and 3D direct rendering to display the 3Dreconstruction of tumor images. The data of volume andshape is obtained automatically by using our proposed algorithm:”Balloon Element” method.RESULTSThe volume estimation of variable controlled objects ismuch more precise for balloon element method (0.27% deviation)than the conventional finite element method (2.7-5.4% deviation). Upon review by two neuroradiologists, theirregular margins and shape of different brain tumors appearto be better defined with the balloon element method softwarecalculation.Tuesday Afternoon3:00 PM - 4:30 PMRoom 611 - 612(29d) Pediatrics: General(Scientific Papers 178 - 189)See also Parallel Sessions(29a) Adult Brain: Vascular Imaging(29b) Adult Brain: Functional Imaging (fMRI, MSI,MRS, PET)(29c) Adult Brain: New Techniques,Postprocessing/TraumaModerators:Patrick D. Barnes, MDCharles R. Fitz, MDPaper 178 Starting at 3:00 PM, Ending at 3:08 PMDiffusion MR Imaging of Normal-Appearing WhiteMatter in Patients with Tuberous Sclerosis ComplexGaraci, F. G. 1 · Bozzao, A. 2 · Manenti, G. 1 · Ferone, E. 1 ·Floris, R. 1 · Simonetti, G. 11University of Rome Tor Vergata, Rome, ITALY, 2 Universityof Rome La Sapienza, Rome, ITALYPURPOSETo evaluate the water diffusivity of the normal-appearingwhite matter (NAWM) in patients with tuberous sclerosiscomplex (TSC), compared with control subjects.MATERIALS & METHODSDiffusion and conventional MR imaging were performed in18 patients with clinically established TSC and 18 agematchedcontrol subjects. Apparent diffusion coefficients(ADCs) were generated and small elliptic regions of interest(ROIs) were placed manually both in perilesional NAWMand in six anatomical locations of NAWM. Perilesional ADCvalues were compared with those contralateral, sameanatomical site. Apparent diffusion coefficient values fromthe predetermined sites were compared with those of controlgroup.
RESULTSSupratentorial ADC values were higher in TSC patients thanin control subjects. Statistically significant differences wereobserved in all supratentorial NAWM locations. Significantincreases also were seen in the perilesional NAWM comparedwith contralateral, same anatomical locations.Infratentorial ADC values were normal.CONCLUSIONSignificant ADC changes were measured in the supratentorialNAWM. Elevation in NAWM ADC suggests that CNSmanifestations of TSC may be more diffuse than expected.KEY WORDS: MR imaging, diffusion, TSCPaper 179 Starting at 3:08 PM, Ending at 3:16 PMMR Perfusion Characteristics of Cortical TubersWidjaja, E. 1 · Griffiths, P. D. 21Royal Hallamshire Hospital, Sheffield, UNITED KINGDOM,2University of Sheffield, Sheffield, UNITED KINGDOMPURPOSECortical tubers are thought to be the cause of seizures inpatients with tuberous sclerosis complex. In this paper, weinvestigate the MR perfusion characteristics of corticaltubers in tuberous sclerosis complex.MATERIALS & METHODSForty-four cortical tubers were assessed in ten patients withtuberous sclerosis complex. We also have studied ninepatients with developmental delay but with normal structuralMR imaging as controls. Perfusion-weighted imaging wasperformed with echo-planar imaging using a dynamic susceptibilitycontrast bolus MR perfusion technique. The ratioof the relative cerebral blood volume (rCBV) of tubers relativeto the normal cortex and subjacent white matter in thecontralateral hemisphere was assessed. The difference in firstmoment mean transit time (TTfm) between the tuber and contralateralhemisphere was determined. The asymmetry ofrCBV and the TTfm of the right to left hemispheres wasassessed in those with developmental delay. The ratio ofrCBV and difference of TTfm of tubers were compared tocontrols using the Student’s t-test. Correlation was performedalso between the size of the tubers and the ratio of rCBV ofcortical tubers to that of the contralateral hemisphere.RESULTSThe ratio of rCBV of cortical tubers to contralateral hemispherewas reduced significantly when compared with the interhemisphericasymmetry in controls (p < 0.01). The difference inTTfm of cortical tuber to contralateral hemisphere was not significantlydifferent from the interhemispheric asymmetry of thecontrols (p = 0.09) although there was a tendency towardsincreased transit time. There was no correlation between tubersize and relative cerebral blood volume (p = 0.77).CONCLUSIONThis preliminary work indicates that cortical tubers showreduced rCBV in cortical tubers but no major change inTTfm. We believe that this represents reduced relative cerebralblood flow in cortical tubers.131Paper 180 Starting at 3:16 PM, Ending at 3:24 PMPerfusion and Metabolite Abnormalities in Patients withSturge-Weber SyndromeLin, D. · Barker, P. · Hatfield, L. · Comi, A.The Johns Hopkins UniversityBaltimore, MDPURPOSESturge-Weber syndrome (SWS) is a rare congenital diseasecharacterized by aberrant and ineffective cortical venousdrainage (leptomeningeal angiomatosis) and cutaneous capillaryangiomata. Neurologic manifestations include seizure,headache, stroke-like episodes, developmental delay, andmental retardation. The full range of manifestations is estimatedto occur in only 10% of cases and there are a numberof variant expressions of SWS. The purpose of this study isto investigate cerebral perfusion and metabolism in consecutivecases of SWS using advanced MR techniques.MATERIALS & METHODSSix consecutive patients (4 male, 2 female; age ranges from9 months to 21 years) with a clinical diagnosis of SWSunderwent MR imaging using a 1.5 T scanner. Spin-echoproton MR spectroscopic imaging (MRSI) and gadoliniumbolus MR perfusion scan (PWI) were acquired in addition toroutine brain MR sequences. Each patient was evaluated bya pediatric neurologist within 1 month of MR scan. MRspectroscopic imaging (TE 280 msec) consisted of three 15mm axial slices covering from the midbrain to the centrumsemiovale. The concentrations of NAA and choline weremeasured from the affected brain regions. Gradient-echoecho-planar PWI was acquired dynamically following theintravenous bolus injection of 0.1 mmol/kg gadoliniumDTPA. The area of perfusion deficit (defined as prolongedMTT by at least 2.5 sec compared to the normally perfusedbrain region) was compared to the site and area of leptomeningealangiomatosis.RESULTSOne patient had bilateral disease evident from clinical manifestationof port-wine stain, ocular abnormalities (congenitalglaucomas), and radiologic findings of leptomeningealangiomatosis. One patient had initial presentation of unilateralcutaneous and cerebral involvement, but on subsequentimaging with postcontrast FLAIR sequence demonstratedcontralateral disease as well. Perfusion abnormalities (5 of 6patients) corresponded to the site of leptomeningealangiomatosis, but were in general equivalent or smaller comparedto the area affected by angiomatosis. One patient hadno perfusion deficit. These patients also demonstrated differentmetabolite profile. Decreased NAA level was evident inonly 2 of 6 patients, corresponding to area of cerebral atrophyand leptomeningeal angiomatosis. In one patient whowas evaluated at his early presentation of disease within 2years of age, there was slight elevation of choline level in theaffected brain region but NAA was within normal limits. Inthree other patients, no metabolite abnormality was present.TuesdayKEY WORDS: Cortical tubers, perfusion imaging, MR imaging
CONCLUSIONMR perfusion and spectroscopy complement conventionalMR imaging by providing hemodynamic and metabolicinformation in patients with SWS. In a series of 6 patients wefind a wide range of clinical as well as radiologic expressionsof this disorder. Correlating these imaging findingswith clinical status in a larger patient cohort over a period oftime may yield information on the natural history of this disorder.KEY WORDS: Sturge-Weber syndrome, perfusion, spectroscopy132coil. Significant (p < 0.05) differences in diffusion parameterswere noted between regions and with increasing age.Serial changes are shown in the figure demonstrating thatDav decreased significantly with age in BG (p < 0.0001),CST (p < 0.0001), or (p = 0.0002), PWM (p = 0.003), andThal (p < 0.0001) and that FA increased significantly in CST(p < 0.0001). No significant differences were found betweenright and left sides.TuesdayPaper 181 Starting at 3:24 PM, Ending at 3:32 PMImproved Diffusion MR Imaging of PrematureNewborns Using an MR Compatible Incubator and aSpecialized Neonate MR CoilVeeraraghavan, S. · Mukherjee, P. · Miller, S. P. · Charlton,N. · Partridge, S. C. · Xu, D. · Henry, R. G. · Barkovich, A.· Vigneron, D. B.University of California San FranciscoSan Francisco, CAPURPOSEMR diffusion tensor imaging (DTI) is a powerful techniquefor assessing tissue microstructure. Although primarily usedin adult studies, DTI may be especially valuable for thestudy of brain development and injury in premature newborns.Technical challenges for neonatal DTI include: theability to perform MR exams on young, unstable prematurebabies; the small size of the neonatal head for which theadult head coil is suboptimal; and potential motion artifactsin unsedated babies. These problems were addressed in thisserial DTI study of premature brain development by using anMR compatible incubator incorporating a specialized neonatalhead coil (1).MATERIALS & METHODSA total of 28 DTI MR exams were acquired from 18 prematurenewborns with no evidence of white matter injury onconventional MR imaging. The subjects were born at estimatedgestational ages of 24-34 weeks and were imaged initiallybetween 28-35 (median 33) weeks and were followedup between 35-43 (median 37) weeks using an MR imagingcompatibleincubator with a specialized high-sensitivityneonate head coil (1). The whole-brain axial interleaved DTIimages were acquired in 4.8 minutes at a 1.4 x 1.4 x 3.0 mmspatial resolution using a single-shot EPI sequence with 6gradient directions, b = 0 and 600 s/mm2, TE = 99.5 ms, TR= 7s, and 3 repetitions. Region of interest analyses were performedfor the directionally averaged apparent diffusioncoefficient (Dav), each eigenvalue (l1, l2, l3), fractionalanisotropy (FA), and relative anisotropy (RA) localized to:basal ganglia (BG), thalamus (Thal), corticospinal tracts(CST), optic radiations (OR), parietal white matter (PWM),and frontal WM (FWM). Image signal-to-noise ratio (SNR)measurements were compared to prior serial DTI studies ofpreterm newborns acquired using a standard head coil (2).RESULTSThe MR compatible incubator improved the ease and safetyfor MR serial studies of young, unsedated preterm neonateswith a 40-50% increase in SNR compared to a standard headCONCLUSIONThe MR-compatible incubator with its high sensitivityneonatal head coil improved MR exams of preterm infantsby providing a warm, quiet, well monitored environment anda significant increase in image SNR. Serial DTI studies ofpremature neonates demonstrated significant regional andmaturational differences in diffusion parameters in subjectswith normal imaging findings. Correlations with outcome inabnormal infants are pending upon subsequent neurologicfollow-up.REFERENCES1. Dumoulin CL, et al. Concepts in Magnetic Resonance. MagnReson Engrg 2002;15:117-1282. Miller SP, et al. JMRI 2002;16:621-632KEY WORDS: Neonate, MR incubator, diffusionPaper 182 Starting at 3:32 PM, Ending at 3:40 PMMedullary Venous Pathology in NeonatesFeygin, T. · Simon, E. M. · Bilaniuk, L. T. · Pollock, A. N.· Zimmerman, R. A.Children’s Hospital of PhiladelphiaPhiladelphia, PAPURPOSEReview of imaging findings of pathology of the medullaryveins in neonates.MATERIALS & METHODSRetrospective review of MR imaging (T1-, T2-weighted,FLAIR, 2D FLASH gradient-echo sequences) of 11 neonateswith medullary vein thrombosis or marked medullary veinengorgement was carried out. Six neonates were premature(range: 29 to 36 weeks) and five were full term. Patients presentedfor imaging at an average of 32.8 days of life (premature),24.4 days of life (term infants).
RESULTSImaging features of thrombosis and/or engorgment of themedullary veins included marked susceptibility effect ongradient-echo sequences and linear radiating T2 hypointensevessels in the deep white matter. Frontal lobe involvementpredominated. Occasionally, the vessels demonstrated intrinsicT1 shortening, dependent on the stage of clot formation.In four cases, deoxyhemoglobin on gradient-echo sequenceswithin the abnormal medullary veins was the only imagingfinding. Predisposing factors included congenital heart disease(n = 3) and perinatal infection (n = 3), and dehydration(n = 1).CONCLUSIONThrombosis and/or engorgement of cerebral medullary veinsis uncommon, but may be encountered in premature and fullterm neonates, particularly in the setting of congenital heartdisease or perinatal infection. This entity should be consideredas an etiologic factor when atypical patterns of periventricularleukomalacia and/or prior hemorrhage are encounteredon MR studies in older children. T2* gradient-echoimaging may be crucial for diagnosis during the acute presentation.KEY WORDS: Medullary veins, thrombosis, neonatesPaper 183 Starting at 3:40 PM, Ending at 3:48 PMCentral Nervous System Imaging in ChildhoodLeukemiaPorto, L.Uni-Klinikum FrankfurtFrankfurt, GERMANYPURPOSETo document the imaging abnormalities seen in the centralnervous system (CNS) of childhood leukemia or as complicationsof its treatment.MATERIALS & METHODSMR images and CT scans were reviewed retrospectively in22 children and adolescents with neurologic manifestations/complicationsof leukemia or its treatment.RESULTSWithdrawnAmong the 22 patients, nine had two or more different CNSabnormalities. The imaging abnormalities seen in 15 patientsbefore or during treatment included sinus thrombosis, corticalvein thrombosis, cerebral hemorrhage, meningealleukemia, infections, skull leukemic infiltration, and treatment-relatedneurotoxicity. After therapy, seven patients hadCNS abnormalities, including secondary brain tumors, skulltumor, mineralizing microangiopathy, leukoencephalopathy,transient white matter abnormalities, spinal intraduralhematoma, chronic subdural hematoma, radiation necrosis,meningeal leukemia, and leukemic infiltration at the vertebralbody.CONCLUSIONCentral nervous system complications are related to theinherent risk of leukemia itself, to the treatment method, andto the duration of survival.KEY WORDS: Children, leukemia, nervous system133Paper 184 Starting at 3:48 PM, Ending at 3:56 PMIsotropic Diffusivity Changes of Centrum Semiovale inChildren with and without Developmental Delay:Diffusion MR Imaging with Segmentation-BasedMeasurementBun, K. · Ito, R. · Kitahara, S. · Murata, K.Shiga University of Medical ScienceOtsu, JAPANPURPOSETo characterize maturational changes of isotropic apparentdiffusion coefficient (ADC) in centrum semiovale segmentedfrom supraventricular slab in children without developmentaldelay and abnormalities on conventional MR imaging.Using the obtained trends, to assess the isotropic ADCvalues of children with developmental delay.MATERIALS & METHODSIn this study, brain MR examinations of 39 subjects (19 girlsand 20 boys, age: 3 months-16 years, mean: 44.4 months)were performed for various reasons (e.g., low birth weightinfant, febrile seizure, headache) and described no abnormalitieson conventional MR images. We retrospectivelyreviewed their medical records and divided the children intotwo groups, children without (n = 30) and with (n = 9) developmentaldelay. Permission for usage of these data forresearch purposes was obtained from guardians and thisreporting was approved by the institutional review board.MR imaging was performed on a 1.5 T clinical MR system.Diffusion-weighted images [echo-planar pulse sequence;3000-4500/103-110 msec (TR/TE); field of view 22 cm; 5mm thick with a gap of 0.5-1.5 mm; scan matrix 96 x 96] of15 or 19 transverse locations were obtained. Diffusion sensitizationgradients were applied in three orthogonal axes withb-value of 1000 sec/mm 2 . We generated pixel-by-pixelisotropic ADC maps from the diffusion-weighted images andimages without diffusion sensitization. Spin-echo T1-weighted images corresponding to the location of diffusionweightedimages were obtained and white matter was segmentedautomatically using brain image analysis tools, FSL(the Image Analysis Group, FMRIB, Oxford, UK). Asupraventricular slab that included continuous imaging locationsstarting inferiorly from the top of the lateral ventricleswas determined. We obtained a mean of isotropic ADC valueswithin the area corresponding to the segmented whitematter in the slab for each subject. Nonlinear regressionanalysis was used for evaluating the relationship between themean of isotropic ADC values and subject age in childrenwithout developmental delay. The resulting graph was fitwith exponential regression model. Then, we plotted the dataof the children with developmental delay on the graph andassessed whether those were within the 95% confidenceinterval of mean ADC value at each age in children withoutdevelopmental delay or not.RESULTSThe graph of mean isotropic ADC value vs subject age isshown in Figure. The data of children without developmentaldelay (diamond shape) are fit to a monoexponentialmodel (solid line) with determination coefficient 0.909. Thedashed lines denote the upper and lower limits of the 95%confidence interval. The points with a shape of x show thedata of children with developmental delay.Tuesday
134reports were analyzed further into significant (which wouldimpact clinical management) and not significant (whichwould not change management) by an independent observer.TuesdayCONCLUSIONIn the children without developmental delay, the graph of themean isotropic ADC value of centrum semiovale segmentedfrom supraventricular slab vs age is fit with monoexponentialmodel. Most data of children with developmental delayare within the 95% confidence interval of the graph.KEY WORDS: Diffusion MR imaging, developmental delay,isotropic diffusivityPaper 185 Starting at 3:56 PM, Ending at 4:04 PMInterobserver Variability in Radiographic Evaluation ofSuspected Cerebrospinal Fluid Shunt ObstructionShroff, M. M. · Mater, A. · Drake, J. · Goldman, R.Hospital for Sick ChildrenToronto, ON, CANADAPURPOSETo measure interobserver variability of plain radiographs(shunt series) and CT scans in a group of children undergoingevaluation for suspected shunt obstruction.MATERIALS & METHODSThis is a retrospective study with approval from the institutionalresearch ethics board. Shunt series and CT brainsobtained in 98 consecutive patients over a 10-month periodwere reread independent of clinical input and previous interpretations.Comparisons with the last recent shunt series andCT brains were available in all and also were documented.Findings of the shunt series were classified into: 1) normal,2) disconnection and site of disconnection, 3) tip retractionout of the abdomen, 4) kink in shunt tubing, 5) no tip movementfrom prior examination (loculation), and 6) other findings.For CT of the brain, findings were classified into: 1)normal, 2) hydrocephalus, no change from previous CT, 3)hydrocephalus, increase from previous CT, 4) hydrocephalus,decrease from previous CT, 5) other new abnormality.Comparisons were made with previous transcribedreports and discrepancies were documented. DiscrepantRESULTSThere were 7 discrepancies in the interpretation of shuntseries. These when viewed alone theoretically could be consideredsignificant. However, in all these patients furthermanagement was based on review of clinical findings andmore importantly correlation with CT findings. There were 8significant discrepancies in CT reports, which related tochanges in ventricular size. Four out of these 8 patientsunderwent shunt revisions. More than half of the CT discrepancieswere due to complex loculated hydrocephaluswith multiple ventricular catheters.CONCLUSIONInterobserver variability occurred in up to 7.14% of patientsin evaluation of shunt series and 8.16% of CT brains whenevaluating for suspected shunt obstruction. Ventricular sizeparticularly on CT often merits objective measurementscompared to previous studies particularly when changes insize are subtle or when there is complex loculated hydrocephaluswith multiple shunts.KEY WORDS: Shunt obstruction, hydrocephalus, CTPaper 186 Starting at 4:04 PM, Ending at 4:12 PMCerebral Spinal Fluid Flow Velocity in the ForamenMagnum of Normal Subjects in Relation to AgeQuigley, M. · Iskandar, B. · Haughton, V. M.University of Wisconsin Hospitals and ClinicsMadison, WIPURPOSEWe have observed higher CSF velocities in pediatric patientsthan in adult patients with a Chiari I malformation. We thenundertook a study of CSF flow as a function of age in subjectswith apparently normal posterior fossae.MATERIALS & METHODSChildren who were undergoing MR imaging for conditionsnot anticipated to affect CSF flow and normal adult volunteershad a conventional flow sensitive PC MR image tomeasure CSF flow throughout the cardiac cycle. Thesequence included flow sensitized images at 14 timesthroughout the cardiac cycle. The spatially and temporallyresolved peak velocities were recorded. The peak cephaladand caudad velocities in the cycle were tabulated and wereplotted as a function of age. The data were fitted to a secondorder polynomial curve. The study was approved by the IRBand conforms to HIPAA requirements.RESULTSTen adults ranging in age from 22 to 61 years and 2 pediatricpatients have been enrolled to date. Peak CSF caudad andcephalad velocities were greater in the children than in theadults (Figure). Peak velocities appeared not to change significantlywith age after the second decade of life.Figure: Peak caudad (positive values) and cephalad (negativevalues) CSF velocity (mm/sec) during the cardiac cyclein normal subjects. Note that velocities appear to diminish
during the first decade of life but remain relatively constantafter the second decade (only preliminary data has beenincluded in the table).135reports were reviewed retrospectively with specific attentionto the presence of extradural hemorrhage (EDH), subduralhemorrhage (SDH), parenchymal hemorrhage (PH), cerebralischemic changes (CIC), and RH. Presence of RH was correlatedwith the severity of cerebral injury. A maximum cerebralinjury scale of 3 included the presence of SDH or EDH(1 point), PH (1 point), and CIC (1 point).CONCLUSIONCerebral spinal fluid velocities are greater in children than inadults. In studies of CSF flow in pathologic conditions,approximate age matching is required between subjects andcontrols.KEY WORDS: Chiari I malformation, CSF flow, MR imagingPaper 187 Starting at 4:12 PM, Ending at 4:20 PMContribution of Cranial MR Imaging in Combinationwith CT in the Initial Evaluation of Infants and Childrenwith Nonaccidental Cerebral Injury: Correlation withPresence of Retinal HemorrhageKilpadikar, A. A. 1 · Worthington, T. 2 · Jones, J. G. 2,1 · Glasier,C. M. 2,11University of Arkansas for Medical Sciences, Little Rock,AR, 2 Arkansas Children’s Hospital, Little Rock, ARPURPOSETo study a large group of infants and children admitted to achildren’s hospital with documented nonaccidental cerebralinjury (NACI) who had cranial CT, MR imaging, and ophthalmologicexamination as part of an initial evaluation inorder to determine the added utility of cranial MR imagingin this setting and the significance of the presence of retinalhemorrhage (RH) for the prediction of severity of cerebralinjury.MATERIALS & METHODSNinety-five consecutive infants and children age newborn to4 years were admitted from 1999-2003 with documentedNACI. Forty children in this group who underwent concurrentCT and MR imaging near the time of admission wereincluded in this study. CT examinations were performed onthe day of admission without contrast or sedation. MR examinationswere performed within an average of 51 hours of theadmission CT (range 0-12 days). MR imaging was performedwith a 1.5 T magnet. Sequences included sagittal T1,axial proton density or FLAIR, T2-weighted and gradientechoimages in all cases. Twenty-seven of 40 (68 %) had diffusion-weightedimaging. Patient records, CT and MRRESULTSThree of 40 (8%) patients had EDH, 30/40 (75%) patientshad SDH, 9/40 (23%) patients had PH, and 15/40 (38%)patients had CIC. In all cases, EDH, SDH, and PH weredetected by both CT and MR imaging. In 7/15 (47%) ofpatients with CIC, ischemic changes were seen on CT but inall 15/15 (100%) patients with CIC, MR imaging was positive.This difference is statistically significant (p < .05). The18 patients with RH had a higher cerebral injury score (1.72)than the 22 patients without RH (0.85). This difference wasstatistically significant (p < .05).CONCLUSIONIn this study, although CT and MR imaging each detected allcases of EDH, SDH, and PH, MR imaging detected overtwice as many cases of CIC compared to CT, a statisticallysignificant finding indicating added value for the MR examination.The presence of RH was associated with a statisticallysignificant increased cerebral injury score in this groupof infants and children with NACI.KEY WORDS: Nonaccidental cerebral injury, retinal hemorrhage,MR imagingPaper 188 Starting at 4:20 PM, Ending at 4:25 PMPrimitive Neuroectodermal Tumor of the Optic Chiasmin a Pediatric PatientStrange, M. G. 1 · Palasis, S. 2 · Brat, D. J. 11Emory University School of Medicine, Atlanta, GA,2Children’s Healthcare of Atlanta at Scottish Rite, Atlanta,GAPURPOSETo illustrate a rare case of a PNET of the optic chiasm whichdemonstrated imaging and spectroscopy findings characteristicof an optic glioma.MATERIALS & METHODSMR imaging and MR spectroscopy obtained using a 1.5 TSiemens MR scanner. Imaging protocol of multiplanar T1,T2 and FLAIR sequences, both pre and postcontrast.Multivoxel spectroscopy technique consisted of short andlong TE sequences.RESULTSThe patient was a 9-month-old Caucasian girl who presentedwith rotatory and lateral nystagmus along with intermittentleft cranial nerve VI palsy. An MR image of the brainrevealed an intensely enhancing mass originating in the opticchiasm and hypothalamus with involvement of the cisternalportions of the optic nerves, optic tracts nearly to the level ofthe geniculate ganglion as well as the left optic nerve at theorbital apex. The lesion was isointense on T1-weightedimaging and of isointensity to slightly hyperintense on T2-weighted imaging. MR spectroscopy revealed an abnormal-Tuesday
ly low n-acetylaspartate (NAA) peak, elevation of cholineand myoinositol peaks, and a decrease in the creatine peak.MR and MR spectroscopy findings were most consistentwith an optic glioma. A subsequent biopsy yielded a diagnosisof PNET. The specimen was sent out also to other wellknown neuropathologists who all confirmed this diagnosis.CONCLUSIONThis case illustrates a rare example of a pediatric patient witha PNET of the optic chiasm despite imaging and spectroscopyfindings which were characteristic of an optic glioma.KEY WORDS: PNET, optic, glioma136MATERIALS & METHODSAn 18-month-old female presented since birth with progressiveleft eye proptosis and vascular conjunctival congestion.Doppler ultrasound examination revealed an intraconal highlyvasculated lesion that, after intravenous (iv) administrationof an echo-enhancing agent (galactose/palmitic acid)showed a dilated vascular structure with “corkscrew”appearance and flow turbulence; this finding lead to thediagnostic possibility of an orbital fissure. CT scanningshowed a heterogeneous extra and intraconal lesion adjacentto the internal rectus muscle causing globe displacement andosseous expansion; enhanced CT scan revealed a prominentvascular, tortuous structure, at this point the possibility of anorbital fissure could not be ruled out yet. Arterial angiographyshowed irrigation by branches from both the internal(ophthalmic and orbitofrontal) and external (infraorbital)carotid arteries to the orbit lesion. No fistula was evident.Surgery was performed and the pathology report read capillaryhemangioma.RESULTSDiagnosis of orbital fissure is extremely rare. In this case, theinitial Doppler ultrasound evaluation, and with iv administrationof an echo-enhancing agent, made an orbital fissure astrong consideration, which could not be ruled out on the CTexamination. The evaluation with arterial angiography eliminatedthe orbital fissure possibility.TuesdayPaper 189 Starting at 4:25 PM, Ending at 4:30 PMInitial Evaluation of Intra and Extraconal CapillaryHemangioma with Doppler Ultrasound Could Mimic anArteriovenous Fistula: A Pediatric Case ReportRoldan-Valadez, E. 1 · Solorzano-Morales, S. 2,1 · Facha, M. 1 ·Corona-Cedillo, R. 1,11Medica Sur Clinic & Foundation, Mexico, MEXICO,2National Institute of Pediatrics, Mexico, MEXICOPURPOSEAlthough most pediatric orbital tumors are benign, a timelydiagnosis and treatment is important to prevent bony disfigurement,amblyopia, optic nerve damage, or progression of apotentially curable malignancy. The most common benignorbital masses that spare the optic nerve and globe are ofvascular origin. They are associated with relative intact visualfunction in comparison to lesion size but may be disablingbecause of ptosis, proptosis, pain, extraocular muscle dysfunction,extension, or intralesional hemorrhage. Capillaryhemangioma presents primarily during the first year of life.They occur most often in the superior nasal quadrant or theintraconal space with increase in size during 6 to 10 monthsand then gradually involute, although they may enlarge at adisturbing rate in early childhood. These tumors may have agreater orbital involvement than that suspected from clinicalexamination, and may even extend intracranially through thesuperior orbital fissure, optical canal, and orbital roof. Theuse of Doppler ultrasound in the evaluation of the vascularpathology of the orbit is an initial nonexpensive choice indeveloping countries. Capillary hemangioma in and aroundthe orbit may have an arterial supply from either or both theexternal or internal carotid arteries that could mislead theDoppler ultrasound diagnosis from capillary hemangioma toan orbital fistula.CONCLUSIONArterial angiography is mandatory for precise vascular definitionunder the suspicion of an orbital fissure (venographyusually is not helpful when orbital fissure is suspected sincethe supply is arterial). When encountered with a capillaryhemangioma the Doppler ultrasound evaluation could bemisleading; therefore, CT and arterial angiography examinationare mandatory to rule out the differential diagnosis of anorbital fissure if suspected.KEY WORDS: Hemangioma, Doppler, fistulaTuesday Afternoon3:00 PM - 4:30 PMRoom 602 - 603(30) ELC Workshop B: PowerPoint forAdvanced Users— H. Christian Davidson, MD— Richard H. Wiggins, III, MD
137Tuesday Afternoon4:40 PM - 5:40 PMRoom 606 - 609(31) ELC Lecture F: Overview ofDigital Cameras and CamcordersTuesday Afternoon4:40 PM - 6:10 PMRoom 611 - 612— Richard M. Berger, MD— Richard H. Wiggins, III, MDCongenital Malformations of the EarH. Christian Davidson, MDH. Christian Davidson is Associate Professor and ExecutiveVice Chairman of Radiology at the University of Utah. Dr.Davidson received his MD from the University of Utah,received a MS in Medical Informatics at Stanford University,completed Fellowship in Neuroradiology at the University ofUtah.LEARNING OBJECTIVESUpon completion of this session, participants will be able to:1) Describe embroyology and anatomy of the ear2) Review common congenital malformations of externaland middle ear3) Review common congenital malformations of the innerearPRESENTATION SUMMARYDuring the lecture, basic embryology and anatomy of the earwill be reviewed, drawing distinctions between the developmentof the inner ear versus the middle external ear complex.Common congenital lesions of the ear and the correspondingimaging manifestations will be presented in detail.Tuesday(32) Interesting Pediatric Case Session(ASPNR)Moderators:Charles M. Glasier, MDGary L. Hedlund, DOTuesday Afternoon4:40 PM - 6:10 PMBallroom 6 A(33) Developmental Lesions in theHead and Neck (ASHNR)(33a) Congenital Malformations of the Ear— H. Christian Davidson, MD(33b) Approach to Imaging of the Globe and Orbit— Clifford J. Belden, MD(33c) Developmental Anomalies of the Neck— Robert W. Dalley, MDApproach to Imaging of the Globe and OrbitClifford J. Belden, MDPRESENTATION SUMMARYThe role of imaging in the evaluation of a variety of congenitaland developmental abnormalities of globe and orbit willbe presented. The normal development of the orbit and globewill be discussed briefly. The presentation will center on thetypical clinical scenario these patients are encountering andthe role imaging plays in diagnosis and treatment planning.The role of CT and MR imaging of patients with microphthalmiaand macrophthalmia, both unilateral and bilateral,will be discussed. Congenital/developmental orbital masses,including dermoids, epidermoids, teratomas, and encephaloceleswill be presented. Finally, the evaluation of infantswith leukocoria will be discussed.REFERENCES1. Onwochei BC, Simon JW, Bateman JB, et al. OcularColobomata. Surv Ophthalmol 2000;45:175-1892. Smirniotopoulos JG, Bargallo N, Maffee MF. DifferentialDiagnosis of Leukocoria: Radiologic-PathologicCorrelation. Radiographics 1994;14:1059-10793. Howard GM, Ellsworth RM. Differential Diagnosis ofRetinoblastoma: A Statistical Survey of 500 Children. Am JOphthalmol 1965;60:610-6184. Maffee MF. Eye and Orbit. In: Som PM, Curtin HD, eds. Headand Neck Imaging 3rd ed. St. Louis, Mo: Mosby 1996;1009-1128Moderators:Suresh K. Mukherji, MDAnton N. Hasso, MD, FACR
Developmental Anomalies of the NeckRobert W. Dalley, MDLEARNING OBJECTIVESUpon completion of this session, participants will be able to:1) Define the common branchial arch and cleft anomalies ofthe neck2) Review thyroglossal duct anomalies3) Identify vascular and lymphatic anomalies of the neck4) Describe dermoid cysts in the neck1387. Mulliken JB, Fishman SJ, Burrows PE. Vascular Anomalies.Curr Probl Surg 2000;37:517-5848. Mulliken JB, Glowacki J. Hemangiomas and VascularMalformations in Infants and Children: A ClassificationBased on Endothelial Characteristics. Plast Reconstr Surg1982;69:412-4229. Josephson GD, Spencer WR, Josephson JS. Thyroglossal DuctCyst: The New York Eye and Ear Infirmary Experience anda Literature Review. Ear Nose Throat J 1998;77:642-644,646-647, 651TuesdayPRESENTATION SUMMARYBranchial anomalies are classified by the pouch or cleft oforigin as either a first, second, third, or fourth branchial cleftanomaly. These may be in the form of a cyst, tract, or fistula.Each of these lesions appear in characteristic locations inthe neck, which allows accurate classification. The mostcommon are the second branchial cleft cyst located in theanterior cervical space near the carotid bifurcation and thefirst branchial cleft cyst at the tail of the parotid gland. Somebranchial cleft cysts may develop secondary carcinoma withinthe cyst. The thyroglossal duct is a primitive tract ofdescent of the thyroid gland from its origin in the foramencecum in the posterior tongue as it descends anterior to thehyoid bone and between the thyroid cartilage and the thyroidstrap muscles and comes to rest below the cricoid cartilage.Lesion may be in the form of ectopic thyroid tissue or cystsanywhere along this tract. Thyroglossal duct cyst may rarelydevelop a secondary carcinoma. Vascular lesions includecapillary and cavernous hemangioma, capillary malformations(port wine stain), venous malformations, and arteriovenousmalformation and arteriovenous fistula. Capillaryhemangioma often develops rapidly in the neonatal periodand then spontaneously involutes. Cavernous hemangiomaoften contains characteristic phleboliths. Many of these capillary,arterial and venous anomalies are multispatial, traversingtwo or more fascial spaces. Lymphatic anomalies areusually in the form of a lymphangioma (cystic hygroma)commonly found in the submandibular and posterior cervicalspaces. They may be unilocular or multilocular in a singlespace or they can also be transspatial. Dermoid cysts inthe neck may contain fluid, fat, calcium, bone and/or teeth.The central tongue and the orbit are the most common locations.REFERENCES1. Agaton-Bonilla FC, Gay-Escoda C. Diagnosis and Treatmentof Branchial Cleft Cysts and Fistulae. A Retrospective Studyof 183 Patients. Int J Oral Maxillofac Surg 1996;25:449-4522. Branstetter BF, Weissman JL, Kennedy TL, Whitaker M. TheCT Appearance of Thyroglossal Duct Carcinoma. AJNR AmJ Neuroradiol 2000;21:1547-15503. Som PM, Sacher M, Lanzieri CF, et al. Parenchymal Cysts ofthe Lower Neck. Radiology 1985;157:399-4064. Reede DL, Bergeron RT, Som PM. CT of Thyroglossal DuctCysts. Radiology 1985;157:121-1255. Harnsberger HR, Mancuso AA, Muraki AS, et al. BranchialCleft Anomalies and their Mimics: Computed TomographicEvaluation. Radiology 1984;152:739-7486. Burton EM, Mercado-Deane MG, Howell CG, et al. CervicalThymic Cysts: CT Appearance of Two Cases Including aPersistent Thymopharyngeal Duct Cyst. Pediatr Radiol1995;25:363-365.Tuesday Afternoon4:40 PM - 6:10 PMBallroom 6 B/C(34) Advanced Imaging Seminar -Perfusion, Permeability, and Beyond(34a) An Overview of Perfusion Parameters(34b) MR Imaging vs CT Techniques(34c) Permeability ImagingAn Overview of Perfusion ParametersHoward A. Rowley, MD— HowardA. Rowley, MD— Michael H. Lev, MD— James M. Provenzale, MD(34d) Reactivity and Oxygen Extraction FractionModerators:— David J. Mikulis, MDTimothy P.L. Roberts, PhDHoward A. Rowley, MDLEARNING OBJECTIVESUpon completion of this session, participants will be able to:1) Define three (3) major types of perfusion parameter mapsused in CT and MR2) Assess and discuss the techniques and pitfalls in parametermap processingPRESENTATION SUMMARYPerfusion is a complex physiologic process that is characterizedbest with the aid of parameter maps. Traditional olderperfusion methods such as PET, XeCT, and SPECT yield a
global measure of overall blood delivery, cerebral bloodflow (CBF), measured either in absolute terms or expressedas a ratio to normal tissue. There is now increasingly rapidclinical adoption of new perfusion techniques based on IVcontrast bolus methods, captured with either CT or MRdynamic first-pass imaging. These large CT or MR data setscan be processed quickly to produce a variety of parametermaps to aid in diagnosis. Three major families of CT/MRperfusion parameter maps are prepared, each reflecting a differentfacet of blood delivery: 1) temporal dynamic maps,describing arrival times, delay, and dispersion (e.g., meantransit time, MTT; time to peak, TTP, bolus arrival time,BAT); 2) cerebral blood volume (CBV) maps, reflecting asnapshot of capillary level autoregulation; and 3) cerebralblood flow (CBF) maps, depicting net delivery of blood atthe capillary level. Since CBF (ml/100 g/min) = CBV(ml/100g)/MTT (sec), all 3 parameters ideally should beknown to fully describe the perfusion process and understandthe state of autoregulation. The richer dynamic data setoffered by CT and MR imaging provides an advantage oversome of the traditional perfusion techniques and helps tocounterbalance any shortfall in absolute CBF quantification.Several groups have shown that quantification of CT andMR perfusion data requires picking an appropriate arterialinput function (AIF) to deconvolve the data set prior to mappreparation. Penumbra, reperfusion, luxury perfusion, miseryperfusion, and other important clinical blood flow issuescan be identified using the powerful combination of theseparameters. Perfusion parameter maps now are used commonlyto triage acute stroke patients and follow effects oftreatment, both in trials and in routine clinical application.REFERENCES1. Keston P, Murray AD, et al. Cerebral Perfusion ImagingUsing Contrast-Enhanced MRI. Clin Radiol 2003;58(7):505-5132. Lev MH. CT/MR Perfusion Imaging and Alphabet Soup: AnAppeal for Standardized Nomenclature. AJNR Am JNeuroradiol 2002;23(5):746-7473. Petrella JR, Provenzale JM. MR Perfusion Imaging of theBrain: Techniques and Applications. AJR Am J Roentgenol2000;175(1):207-2194. Schlaug G, Benfield A, et al. The Ischemic Penumbra:Operationally Defined by Diffusion and Perfusion MRI.Neurology 1999;53(7):1528-15375. Sorensen AG. Cerebral MR Perfusion Imaging: Principles andCurrent Applications. Stuttgart, Thieme;20006. Wu O, Ostergaard L, et al. Effects of Tracer Arrival Time onFlow Estimates in MR Perfusion-Weighted Imaging. MagnReson Med 2003;50(4):856-864Disclosure: The author of this presentation has indicated anaffiliation with GE Medical Systems, Amersham Health,Genentech, Paion Corp: Consulting Fees.139MR Imaging vs CT TechniquesMichael H. Lev, MDLEARNING OBJECTIVESUpon completion of this session, participants will be able to:1) Describe the clinical indications for, relative merits of,and technical assumptions underlying, the two most commonCT methods of measuring cerebral blood volume(CBV): quantitative, single slab, "first pass" cine CT perfusionvs whole brain "perfused blood volume" imaging usingCT angiography (CTA) source images (CTA SI)2) Explain the analogy between, as well as the clinical significanceof MR diffusion, perfusion vs CT blood volume,blood flow "mismatch," in the triage of acute stroke patientsto thrombolytic therapy3) Distinguish the advantages and pitfalls of using MR or CTperfusion imaging to grade brain tumors, select targets forstereotactic biopsy, or distinguish radiation necrosis fromrecurrent tumor, compared to both conventional, contrastenhancedimaging techniques, as well as to other "functional"techniques including MR spectroscopyPRESENTATION SUMMARYPerfusion imaging is being advocated increasingly as a clinicallyrelevant imaging modality for the diagnosis and triageof patients with acute stroke, brain tumors, and other neurovasculardisorders, such as vasospasm following aneurysmalsubarachnoid hemorrhage. This lecture will survey theclinical indications, essential technical details, and thestrengths and weaknesses - as well as the pearls and pitfalls- of available perfusion methods, with special attention to acomparison between MR and CT techniques.Disclosure: The author of the presentation has indicated thathe will be discussing/presenting an unapproved/investigativeuse of IA Thrombolysis. The IA Thrombolysis is made by GEMedical Systems and Amersham Health.Permeability ImagingJames M. Provenzale, MDLEARNING OBJECTIVESUpon completion of this session, participants will be able to:1) Discribe and assess the importance of the role of permeabilityin assessing tumor therapeutic response2) Describe various techniques for imaging permeability3) Show examples of tumor vessel permeability to antiangiogenesistherapyPRESENTATION SUMMARYThe concept of permeability plays an important role in manyCNS disease states. Leakiness of the blood-brain barrierallows extravasation of contrast material and is the basis forcontrast enhancement of CNS lesions. It stands to reason thatmeasurement of permeability, including rates of contrastmaterial leakage, will reveal significant information about anumber of disease states. The most important role for permeabilityimaging is likely brain tumor imaging. In this presentation,a number of methods for measuring rate of contrastmaterial leakage as well as permeability rates will be discussedin the context of tumor imaging. The roles of perme-Tuesday
Tuesdayability imaging in assessing new tumor therapies also will beexplained. Finally, because the size and nature of contrastmaterial agents plays an important role in the rates of leakage,the use of novel contrast agents in permeability imagingwill be discussed.Disclosure: The author of this presentation has indicated anaffiliation with Philips Medical Systems: Research grant.The author of the presentation has indicated that he will bediscussing/presenting an unapproved/investigative use ofMagnanist using 0.2 mmo/kg dose. The Magnanist is madeby Berlex Imaging.Reactivity and Oxygen Extraction FractionDavid J. Mikulis, MD, Adrian Crawley, MD, AndreaKassner, MDLEARNING OBJECTIVESUpon completion of this session, participants will be able to:1) Identify and examine the ability of MR imaging to probetwo fundamental physiologic features of the brain microcirculation:cerebrovascular reactivity and delivery of oxygento the tissues2) Analyze the role these methods have in assessing patientswith vascular abnormalities3) Contrast and discuss the issues concerning clinical implementationof these methods140measurements can be obtained through acquisition andthresholding of absolute T2 measurements (3). The ability tomeasure OEF may become useful in the setting of acuteischemic stroke or in determining the direct effect of proximalvascular stenosis on the tissue itself. We envision thepotential to triage morphologically significant stenoses intotwo categories: those with normal OEF vs those withincreased OEF, the latter indicating greater physiologic compromiseof the tissue a condition with higher clinicalurgency. This becomes even more useful in assessingpatients with multivessel stenoses. We are now exploring thefeasibility of clinically implementing CMRO2 measurementsobtained from OEF and arterial spin labeled CBFimages. The derivation of these parameters and clinicalimplementation of the relevant MR imaging techniques willbe discussed, clinical examples will be shown, and commentwill be made on their expected clinical impact.REFERENCES1. Vesely A, Sasano H, Volgyesi G, Somogyi R, Tesler J, FedorkoL, et al. MRI Mapping of Cerebrovascular Reactivity UsingSquare Wave Changes in End Tidal PCO2. Magn Reson Med2001;45:1011-10132. Davis TL, Kwong KK, Weisskoff RM, Rosen BR. CalibratedFunctional MRI: Mapping the Dynamics of OxidativeMetabolism. Proc Natl Acad Sci USA 1998;95:1834-18393. Oja JME, Gillen JS, Kauppinen RA, Kraut M, van Zijl PCM.Determination of Oxygen Extraction Ratios by MagneticResonance Imaging. J Cereb Blood Flow Metab1999;19(12):1289-1295PRESENTATION SUMMARYThe recent merger of high field MR imaging technologywith parallel acquisition strategies promises to revolutionizemorphologic and functional MR imaging. As these technologiesmature, the clinical impact, especially for functionalstudies, will likely be similar to, or even greater than, thatseen when echo-planar imaging legitimized MR imaging asa serious functional imaging technology in the early nineties.It is coming at a time when practicing neuroradiologists areseeing an increase in clinical demand for information concerningbrain function and physiology especially in the managementof acute ischemic stroke. The focus of this presentationis to discuss two emerging functional techniques thatprobe fundamental physiologic features of the brain: cerebrovascularreactivity (CVR) and oxygen utilization representedby oxygen extraction fraction (OEF) and cerebralmetabolic rate of oxygen (CMRO2). Although positronemission tomography (PET) has been used traditionally toacquire this information, noninvasive MR methods are availablenow (1, 2). Acquisition of CVR data using MR imagingrequires control of brain blood flow that can be achieved, forexample, through manipulation of inhaled CO2 - a techniquewe have implemented clinically by using a rebreathing circuitto control CO2 (a potent vasodilator) during blood oxygenlevel dependent (BOLD) imaging (1). We have foundthe resulting CVR maps useful in assessing the regionalimpact of vascular narrowing in patients with moyamoyadisease. We also have observed focal CVR abnormalities intissues adjacent to arteriovenous malformations, a findingthat raises questions about the validity of functional MRimaging (fMRI) maps obtained in these patients. These mapsassume intact CVR if not false negative activation of eloquentcortex may be reported. Oxygen extraction fractionTuesday Afternoon5:40 PM - 6:10 PMRoom 606 - 609(35) ELC Roundtable: Q & A withToday’s Speakers— Richard M. Berger, MD— H. Christian Davidson, MD— John L. Go, MD— David S. Martin, MD— Venkata Nataranjan, PhD— Richard H. Wiggins, III, MD
Notes:Tuesday
TuesdayNotes:
143NOTE ABOUT SCANNED IMAGES: Scanned images are included in theproceedings book. Some submitted images were reduced during the printing process, therebydecreasing clarity. The images as originally submitted can be viewed within the abstract on the<strong>ASNR</strong> website at www.asnr.org/<strong>2004</strong>.Wednesday Morning8:00 AM - 9:30 AMBallroom 6 A(36) Perspectives on Submission ofGrant Applicationsdid not communicate effectively this information to thereviewers. The ability to write a good grant application is aspecialized skill that investigators learn and develop overtime. This skill in packaging has been called grantsmanship.This talk will focus on the key aspects of grant composition.First, we will discuss targeting the application for specificfunding mechanisms - NIH RO1, R21, for example. Then wewill use the current National Institutes of Health PHS 398application form as a template and go through it page bypage, emphasizing key points and common pitfalls. Caseexamples from successful and unsuccessful grant applicationswill be used to illustrate these points and pitfalls.(36a) Grantsmanship: The Art of Writing a Grant⎯ Colin P. Derdeyn, MD(36b) The National Institutes of Health ReviewProcess⎯ R. Nick Bryan, MD, PhD(36c) Research Funding Opportunities forNeuroradiologists⎯ James M. Provenzale, MDModerator:James M. Provenzale, MDGrantsmanship: The Art of Writing a GrantColin P. Derdeyn, MDLEARNING OBJECTIVESUpon completion of this session, participants will be able to:1) Explain and review the format and structure of grantapplications2) Define key points of emphasis in writing a grant3) Discuss common critical mistakes made in preparinggrant applicationsPRESENTATION SUMMARYObtaining funding for research is a competitive process. Thebasic foundation for a competitive grant application wasreviewed by previous speakers: the development of atestable hypothesis, the design of an experiment to adequatelytest the hypothesis, and the results of preliminarydata indicating feasibility. No grant application lacking thesefundamental items will be successful. Once you have assembledthese items, your next two steps are to select a fundingsource and write a grant application. It is an unfortunate factthat many grant applications with great ideas, good design,and strong preliminary data fail simply because their authorsThe National Institutes of Health Review ProcessR. Nick Bryan, MD, PhDLEARNING OBJECTIVESUpon completion of this session, participants will be able to:1) Define and discuss the National Institutes of Health (NIH)structure2) Review the Center for Scientific Review process3) Describe a R01 Grant "Case Presentation" experiencePRESENTATION SUMMARYThe NIH utilizes a highly structured peer-review process forevaluating, funding, and monitoring its extramural grants. Itis important to understand the system and follow its proceduresclosely as deviations from protocol can result in rejectionof an application. While the system is stringent, it can bevery helpful and it is fair. All NIH policies and practices areavailable on the WEB and the peer review process is welldocumented at: http://www.csr.nih.gov/review/peerrev.htm.A typical grant (R01/R21) is initially received by the Centerfor Scientific Review (CSR) and, using written guidelines, isassigned by a Referral Officer to an Integrated ReviewGroup (IRG). IRGs are clusters of Study Sections thatreview similar science. The grant is then assigned to a specificStudy Section and specific Institutes are identified thatmight be suitable for funding such a grant. Referral Officersdo take into account written requests for specific IRG andStudy Section assignments. A Study Section has approximately20 members who are active researchers in the particulararea of research covered by the Section. The PrincipleInvestigator is notified of the assignment and further communicationis between the PI and the Scientific ReviewAdministrator (SRA) of that Study Section. The SRAreviews the grant for content, completion, etc and assigns itto 2 or 3 members of the Study Section for written reviewand 1 or 2 additional members for discussion. Submission ofSupplementary Material to the original grant may bearranged between the SRA and PI. Each assigned reviewerprovides the SRA a detailed written evaluation of the grantand a score based on a 100 to 500 point system (100 beingbest possible). Approximately a week before the StudySection meets, the SRA compiles all scores and those grantsWednesday
that score in the lower half are "streamlined." These grantsare not scored or discussed at the meeting and will not befunded; however the PI is given the written critiques andsubsequently may revise and resubmit the grant. A StudySection meeting lasts 2 days, during which the members sitaround a large table and review in detail all those grants not"streamlined." After active discussion of a grant, every memberof the Study Section privately marks his/her PriorityScore on a form provided by the SRA. After the meeting, acomputer-generated average Priority Score and percentile iscalculated and this, along with the written critique, is sent tothe PI. These scores are also sent to the individual Institutesthat select, on the basis of these scores and institutional prioritiesand resources, those grants to fund. At this point theapplicant's link to the NIH changes from the SRA and CSRto an official of the particular Institute to which the grant hasbeen assigned. For institutional funding, grants are usuallywell within the top quartile. Unfunded grants can be resubmitted.In fact this might be considered the norm for firsttime submissions, as many grants are initially rejected forfunding. Hence it is very important to not be discouraged byan initial rejection; however resubmissions should carefullyaddress concerns raised in the written critiques from theoriginal Study Section.144and 75% effort by the young investigator. In addition, theR21 funding mechanism, which is for a maximum of 2 yearsand provide direct costs for the 2-year period not to exceed$275,000, will be discussed. This funding mechanism is onethat allows for investigation of exploratory hypotheses withlittle preliminary data. As such, it may provide young investigatorswith a means of obtaining funding that will allowthem to obtain preliminary data needed for submission ofgrant applications, such as the R01 grant, that provide fundingfor a longer period.Disclosure: The author of this presentation has indicated anaffiliation with Philips Medical Systems: Research grant.Wednesday Morning8:00 AM - 9:30 AMBallroom 6 B/CWednesdayResearch Funding Opportunities for NeuroradiologistsJames M. Provenzale, MDLEARNING OBJECTIVESUpon completion of this session, participants will be able to:1) Demonstrate to radiologists the categories of fundingavailable through NIH2) Explain the various types of government and private fundingmechanisms available for research projectsPRESENTATION SUMMARYAdvances in diagnostic and therapeutic neuroradiology haveled to greater stature of neuroradiologists in the medicalcommunity. Clinicians and researchers in other disciplinesrely heavily on the expertise and imaging tools available toneuroradiologists. However, with increasing clinicaldemands, less time is available for neuroradiologists themselvesto perform research studies. This lecture is a first stepin an attempt to reverse this trend. Extramural funding is onemeans of insuring protected research time. Levels of availablefunding are reported to be at their highest level ever.The purpose of this lecture is to familiarize neuroradiologistswith (1) a few of the tools needed to write successfulresearch protocols and (2) some funding mechanisms thatcould provide funded research time needed for writing grantapplications. A wide variety of funding mechanisms areavailable to radiologists. These mechanisms include federallyfunded resources, private foundations (e.g., NERFoundation and RSNA Research and Education Fund) andfor-profit agencies such as industry. This lecture will focuson federally funded mechanisms that might be of interest toyoung investigators. In particular, The NIH K-series awardswill be discussed in detail. This series of awards providefunding for 3-5 years for young researchers with potential tobecome independent investigators. They require mentorshipby a more senior researcher in the young investigator's fieldor other scientific fields and generally require between 50%(37) Special Session: Can the PresentPractice of Neuroradiology Survive?Meeting the Challenges ofMarginalization and Change(37a) IntroductionIntroductionVictor M. Haughton, MD⎯ Victor M. Haughton, MD(37b) The End of One Time Certification⎯ Patricia A. Hudgins, MD(37c) The R word?⎯ Robert I. Grossman, MD(37d) Reimbursement Rates for NeuroradiologyProcedures⎯ J. Arliss Pollock, MD(37e) The Role of the Society in the Facilitation ofthe Neuroradiology Practice⎯ A. James Barkovich, MDModerator:Victor M. Haughton, MD
145The End of One Time CertificationPatricia A. Hudgins, MDWhat Procedures Will Be Reimbursed?Robert I. Grossman, MDReimbursement Rates for Neuroradiology ProceduresJ. Arliss Pollock, MDThe Role of the Society in the Facilitation of theNeuroradiology PracticeA. James Barkovich, MDWednesday Morning8:00 AM - 9:30 AMRoom 602 - 603(38) ELC Workshop D: WebsiteCreation for the NoviceWednesday Morning10:00 AM - 10:15 AMBallroom 6 B/C⎯ Richard H. Wiggins, III, MD(39) <strong>ASNR</strong> Presidential Address⎯ Charles M. Strother, MD, <strong>ASNR</strong> PresidentWednesday Morning10:15 AM - 11:10 AMBallroom 6 B/C(40) <strong>ASNR</strong> Awards Presentation(40a) Presentation of Gold Medal AwardsModerators: Charles M. Strother, MD,<strong>ASNR</strong> PresidentVictor M. Haughton,MD, Chair,Gold Medal Awards Committee(40b) Announcement of <strong>2004</strong> <strong>ASNR</strong> HonoraryMemberModerator:Norman E. Leeds, MD, Chair,Honorary Member Committee(40c) Presentation of <strong>2004</strong> Cornelius G. DykeMemorial AwardModerators:Charles M. Strother, MD,<strong>ASNR</strong> PresidentVictor M. Haughton, MD,<strong>ASNR</strong> President-Elect/Program Chair(40d) Announcement of 2003 OutstandingPresentation AwardsModerator:Laurie A. Loevner, MD, ChairEducation Committee(40e) Announcement of Neuroradiology Educationand Research (NER) Foundation Award forOutstanding Contributions in ResearchModerator:A. James Barkovich, MD, ChairNeuroradiology Education andResearch FoundationAnnouncement of <strong>2004</strong> NeuroradiologyEducation and Research (NER) FoundationScholar Award in Neuroradiology ResearchAnnouncement of <strong>2004</strong> NeuroradiologyEducation and Research (NER)Foundation/Boston Scientific Fellowship inCerebrovascular Disease ResearchAnnouncement of <strong>2004</strong>Berlex/Neuroradiology Education andResearch Foundation (NER) Fellowship inBasic Science Research AwardsWednesdayModerator:James M. Provenzale, MD, ChairResearch Committee
146Wednesday Morning11:10 AM - 11:15 AMBallroom 6 B/CWednesday Afternoon1:00 PM - 2:30 PMBallroom 6 B/CWednesday(41) Announcement of SymposiumNeuroradiologicum (SNR) XVIII,Scientific Meeting of the WorldFederation of NeuroradiologicalSocieties (WFNRS)⎯ Michael S. Huckman, MD, WFNRS PresidentWednesday Morning11:15 AM - 11:45 AMBallroom 6 B/C(42) American Society ofNeuroradiology (<strong>ASNR</strong>) AnnualBusiness Meeting (Members Only)(43) New Imaging Techniques in Spine(ASSR)(43a) New Imaging Techniques in ConventionalMR Imaging⎯ Lawrence N. Tanenbaum, MD(43b) Diffusion Imaging in the Spine⎯ Gordon K. Sze, MD(43c) Functional MR Imaging in the Spine⎯ Patrick W. Stroman, PhD(43d) Magnetization Transfer in the Spine⎯ Massimo Filippi, MD(43e) American Society of Spine Radiology (ASSR)<strong>2004</strong> Mentor Award: Prospective Analysis ofClinical Outcomes After PercutaneousVertebroplasty for Painful OsteoporoticVertebral Body Fractures⎯ Huy M. Do, MDModerators:Gordon K. Sze, MDBrian C. Bowen, MD, PhDNew Imaging Techniques in Conventional MR ImagingLawrence N. Tanenbaum, MDDiffusion Imaging of the SpineGordon K. Sze, MDLEARNING OBJECTIVESUpon completion of this session, participants will be able to:1) Discuss the different methods of diffusion-weighted imagingthat can be used in the spine2) Delineate potential uses of diffusion-weighted imaging todifferent spine pathologies and to suggest the utility of differentdiffusion techniques to the evaluation of specific entities
147PRESENTATION SUMMARYAlthough still a technique undergoing a great deal of evolution,diffusion imaging has become increasingly applicableto the spine. At this point, diffusion-weighted imaging can beaccomplished by several methods. These include single-shotecho-planar diffusion-weighted imaging which is the mostwidely available, single-shot fast spin-echo, navigator echopulses, which generally are combined with the previousmethods and line scan diffusion-eighted imaging. Singleshotecho-planar imaging, such as is used in the brain, canbe, with some minor alterations of the sequences, applied tothe spine. Reduction of the strength of the diffusion gradientsis useful. In adults, the most common types of diffusionweightedimaging suffer from excessive magnetic susceptibilityartifact in the spine. In young pediatric patients, thereis less magnetic susceptibility in the bony spine but susceptibilityartifacts are still a problem due to the hematopoieticmarrow. However, if evaluation of the cord is sought, thistechnique is still useful and widely available. Navigator echopulses produce phase shift information due to bulk motion.They are used often with multishot spin-echo echo-planarimaging. When compared to single-shot techniques, betterspatial resolution and less off-resonance effects are seen.There are also nonecho planar techniques, such as steadystate free procession or single-shot fast spin-echo techniques,which can be combined with diffusion images.Single-shot fast spin-echo sequences use a 180º refocusingpulse and thus are less sensitive to magnetic susceptibilityartifacts. Because of this, they are most useful in the evaluationof vertebral, rather than cord, lesions. These techniqueshave the advantage of minimizing susceptibility artifacts,and are more successful in examining the bony spine. Theyhave been used primarily for looking at the possibility of differentiatingnonosteoporotic compression fractures fromtumor metastases. These techniques also can be combinedwith navigator echoes, which use an extra spin-echosequence with no spatial phase encoding to provide phaseshift information due to bulk motion. Finally, line scan diffusionimaging is a particularly useful technique which canbe applied to the spine. This is a spin-echo-based techniquethat acquires data from individually excited columns orlines. Because no phase encoding gradients are used, artifactsdue to motion are minimized. Magnetic susceptibilityartifact also is reduced. The signal-to-noise ratio, however,can be decreased since data are received from one line ratherthan an entire slice. Multiple applications of diffusion imagingexist. Diffusion-weighted imaging has been most useful,and perhaps most controversial, in differentiating the osteoporoticcompression fracture from malignant metatastic fracture.While further investigations should be performed usingdifferent diffusion techniques, it does seem to have somerole in this clinical situation. Other specific lesions can becharacterized better with diffusion. Epidermoids and dermoidscan occur in the spinal canal. As in the brain, diffusionimaging is superb at differentiating these lesions from arachnoidcysts, loculations of cerebrospinal fluid caused by adhesions,or other lesions, such as cystic schwannomas, thatmay appear similar on conventional imaging. Similarly, diffusionimaging can be useful in cord lesions. These includecord infarction and myelitis. The MR appearance of theselesions can be nonspecific with conventional imaging; diffusioncan help to delineate the underlying etiology.Functional MR Imaging in the SpinePatrick W. Stroman, PhDDr. Patrick Stroman is originally from British Columbia,Canada, and completed his B.Sc. (Honors) in Physics at theUniversity of Victoria. Under the supervision of Drs. PeterAllen and Paul Man he obtained his Ph.D. in AppliedSciences in Medicine from the University of Alberta inEdmonton. His thesis topic was the measurement of lungfluid clearance by means of MR imaging and relaxometry.Dr. Stroman then worked as a postdoctoral fellow for 4 yearsin Quebec City, at the Quebec Biomaterials Institute andLaval University, using MR to investigate the interactionsbetween tissues and implanted biomaterials. In 1997 hemoved on to Winnipeg, Manitoba and joined the NationalResearch Council of Canada at the Institute forBiodiagnostics, and began working on functional magneticresonance imaging (fMRI), with a focus on spinal fMRI. InMarch <strong>2004</strong>, Dr. Stroman will move to Queen's University inKingston, Ontario where he will take a position as anAssociate Professor in the Department of DiagnosticRadiology, with an Adjunct appointment in the Departmentof Physics, and will be the Director of the new fMRI Facilityin the Center for Neuroscience Studies.LEARNING OBJECTIVESUpon completion of this session, participants will be able to:1) List basic spinal fMRI methods2) Assess results obtained with spinal fMRI3) Examine the practical applications of spinal fMRIPRESENTATION SUMMARYThe methods and application of functional MR imaging(fMRI) for detecting neuronal activity in the spinal cord, willbe presented. The development of spinal fMRI as an adaptationfrom conventional fMRI of the brain, and the verificationthat spinal fMRI demonstrates neuronal activity in thespinal cord, will be addressed briefly. The method has beendeveloped over the past 6 years and has been verified, buthas not been used yet as a clinical tool (1-4). Importantaspects of how neuronal activity is detected with spinalfMRI, and how it differs from that in the brain, will be presentedfor the purposes of accurate interpretation of spinalfMRI results. New developments in the spinal fMRI methodfor obtaining large volume coverage, high resolution in threedimensions, and results displayed in any slice orientationalso will be demonstrated. Examples of results from researchsubjects with complete and incomplete injuries, and withmultiple sclerosis, will be presented to demonstrate the clinicaland research potential of this tool. Finally, the practicalaspects will be described of how spinal fMRI can be implementedon most clinical MR systems, without the need foradaptation or special equipment. Data analysis methods andinterpretation of the results also will be described, with aview to how spinal fMRI can be implemented as a clinicaltool.Wednesday
WednesdayREFERENCES1. Stroman PW, et al. Non-invasive Assessment of the InjuredHuman Spinal Cord by means of Functional MagneticResonance Imaging. Spinal Cord <strong>2004</strong>;42:59-662. Stroman PW, Krause V, Malisza KL, Frankenstein UN, TomanekB. Functional Magnetic Resonance Imaging of the HumanCervical Spinal Cord with Stimulation of Different SensoryDermatomes. Magn Reson Imag 2002;20:1-63. Stroman PW, Krause V, Malisza KL, Frankenstein UN, TomanekB. Extravascular Proton-Density Changes as a Non-BOLDComponent of Contrast in fMRI of the Human Spinal Cord.Magn Reson Med 2002;48:122-1274. Stroman PW, Tomanek B, Krause V, Frankenstein UN, MaliszaKL. Mapping of Neuronal Function in the Healthy andInjured Human Spinal Cord with Spinal FMRI. NeuroImage2002;17:1854-1860Magnetization Transfer in the SpineMassimo Filippi, MDMassimo Filippi was born in 1961, and graduated inMedicine in 1986 and received his Post-graduate degree inNeurology in 1990. His research activity has always beenfocused on the use of MR-based technology to improve ourunderstanding of how neurologic diseases determine progressiveaccumulation of irreversible physical disability andcognitive impairment. Dr. Filippi is a member of various scientificsocieties and, in some of them, he has covered or iscurrently covering institutional roles. He has coordinatedthe MR acquisition and analysis of several large-scale internationaltrials of MS. He is currently a member of theEditorial Boards of the AJNR, the JNNP, MagneticResonance Imaging and Multiple Sclerosis and also acts asa reviewer on a regular basis for several international scientificjournals in the fields of neurology and neuroradiology.Dr. Filippi is author or co-author of more than 350papers on peer-reviewed and indexed journals. Dr. Filippirecently was awarded the “Rita Levi Montalcini” Prize forhis outstanding contributions to the application of MR techniquesto the study of MS. Dr. Filippi is currently Head of theNeuroimaging Research Unit, Department of Neuroscience,Scientific Institute and University Ospedale San Raffaele,Milan, Italy.LEARNING OBJECTIVESUpon completion of session, participants will be able to:1) Define the role of cervical cord MT imaging in the assessmentof various neurological conditions2) Define the role of cervical cord damage in the developmentof disability in multiple sclerosisPRESENTATION SUMMARYThe cord is a clinically eloquent region, whose damage hasthe potential to influence significantly the functional outcomeof many neurologic conditions. As a consequence, theapplication of MT MR imaging to the assessment of tissuedamage in the cervical cord (CC) is likely to increase ourunderstanding of the mechanisms leading to the developmentof neurologic irreversible disability. In multiple sclerosis(MS), CC damage has been studied recently in a group of96 patients with different MS phenotypes, using MT ratio(MTR) histogram analysis (1). Multiple sclerosis patients148had significantly lower average MTR of the overall CC tissuethan control subjects. Patients with relapsing-remitting(RR) MS had normal CC MTR histogram-derived metrics,whereas those with with primary progressive (PP) MS hadsignificantly lower average MTR and peak height. Patientswith secondary progressive (SP) MS had lower MTR histogrampeak height than those with RRMS. MTR histogramderivedmetrics were independent predictors of locomotordisability. Another large study, where CC MTR histogramsof 91 PPMS patients were compared to those of 36 SPMSpatients, found no significant difference between these twogroups (2). In PPMS, a model including CC area and MTRhistogram peak height was significantly, albeit modestly,associated with the level of disability. In MS, only a moderatecorrelation has been found between average brain MTRand CC MTR (3), suggesting that CC damage in MS is not amere reflection of brain pathology. Interestingly, the extentof CC damage (measured using MT MR imaging) has beenfound to be strictly associated with the extent of movementassociatedcortical activations (measured using fMRI) inpatients with cord demyelination (4). CC MTR was found tobe normal in patients with migraine (5) and CADASIL (6)whereas significant CC MTR histogram changes have beenfound in patients with Devic's neuromyelitis optica (DNO)(7).Quantifying CC pathology using MTR is likely toincrease the magnitude of clinical/MR correlations in neurologicconditions. However, due to the complexity of some ofthese conditions (e.g., MS), a multiparametric assessment ofCC damage might be more informative. A recent diffusiontensor MR study of the brain and CC of 45 patients with MSindeed has shown a strong correlation between disability anda composite MR score based on average fractionalanisotropy of the CC and average mean diffusivity of thebrain.REFERENCES1. Filippi M, Bozzali M, Horsfield MA, et al. A Conventional andMagnetization Transfer MRI Study of the Cervical Cord inPatients with Multiple Sclerosis. Neurology 2000;54:207-2132. Rovaris M, Bozzali M, Santuccio G, et al. In vivo Assessmentof the Brain and Cervical Cord Pathology of Patients withPrimary Progressive Multiple Sclerosis. Brain 2001;124:2540-254.3. Rovaris M, Bozzali M, Santuccio G, et al. RelativeContributions of Brain and Cervical Cord Pathology to MSDisability: A Study with MTR Histogram Analysis. J NeurolNeurosurg Psychiatry 2000;69:723-7274. Filippi M, Rocca MA. Disturbed Function and Plasticity inMS as Gleaned through Functional MRI. Curr Opin Neurol2003;16:275-2825. Rovaris M, Bozzali M, Rocca MA, Colombo B, Filippi M. AnMR Study of Tissue Damage in the Cervical Cord of Patientswith Migraine. J Neurol Sci 2001;183:43-466. Rocca MA, Filippi M, Herzog J, Sormani MP, Dichgans M,Yousry TA. A Magnetic Resonance Imaging Study of theCervical Cord of Patients with CADASIL. Neurology2001;56:1392-13947. Filippi M, Rocca MA, Moiola L, et al. MRI and MTI Changesin the Brain and Cervical Cord from Patients with Devic'sNeuromyelitis Optica. Neurology 1999;53:1705-1710
149Prospective Analysis of Clinical Outcomes AfterPercutaneous Vertebroplasty for Painful OsteoporoticVertebral Body FracturesHuy M. Do, MDPURPOSEPrevious studies have retrospectively evaluated the beneficialeffects of percutaneous vertebroplasty. The purpose ofour study is to prospectively evaluate the beneficial effectsof percutaneous vertebroplasty on mobility, analgesic useand pain scale for patients with painful osteoporotic vertebralcompression fractures that are refractory to medicaltherapy. Our study also aims to evaluate the short and longtermhealth benefits of percutaneous vertebroplasty using theSF-36 survey health scales.MATERIALS AND METHODSWe prospectively followed 167 patients treated with 210 vertebroplastiesbetween August 1999 and January 2003. Theaverage age of patients was 74.6 years with a standard deviationof 12.2 years and 75% of the patients were women.Pre-procedural measurements of pain, mobility and analgesicuse were compared with post-procedural measurementsof these same scales one month after the procedure.Pre-procedural measurements of SF-36 health survey scaleswere also compared with post-procedural measurements onemonth and six months to three years after the procedure.RESULTSPre-treatment pain score average was 8.71 with SE of 0.1,while post-treatment pain score average was 2.77 with SE of0.18 (p
Paper 190 Starting at 3:00 PM, Ending at 3:08 PMPerfusion CT of Brain Tumors Including Blood-BrainBarrier Imaging150Paper 191 Starting at 3:08 PM, Ending at 3:16 PMMetabolic Assessment of Extent of Disease in GliomasUtilizing High Resolution 3 T MR SpectroscopyWednesdaySchramm, P. 1 · Klotz, E. 2 · Tronnier, V. 1 · Sartor, K. 1 ·Hartmann, M. 11University of Heidelberg, Heidelberg, GERMANY, 2 SiemensMedical Solutions CTC AP, Forchheim, GERMANYPURPOSEDeciding on the optimal therapeutic strategy for patients withintraaxial brain tumors depends largely on the histopathologicfindings of stereotactic brain biopsy. The determination of thetarget point is often based on lesion contrast-media enhancementin stereotactic CT. We included perfusion CT withblood-brain barrier (BBB) imaging into the prebiopsy planningprocess. The aim of our study was to investigate to whichextent this method can be used for the differential diagnosis ofbrain tumors and if it has potential to provide better targetinginformation than simple lesion enhancement.MATERIALS & METHODSThirty-eight patients evaluated or planned for a stereotacticbiopsy because of intraaxial brain tumors or tumor-like lesionswere examined with a standard 40 second perfusion CT scanafter the injection of 50 ml of iodinated contrast media (300mg Iodine/ml). Two 10 mm sections were acquired simultaneouslyon a multislice CT-scanner (SOMATOM Volume Zoom,Siemens, Germany). In 27 examinations the patient wasscanned with the stereotactic ring. Data were analyzed usingperfusion CT software which in addition to CBF and CBVmaps allowed to calculate permeability maps depicting BBBdisturbances. These maps were calculated using a modifiedPatlak approach. CBV and permeability maps were analyzedvisually and compared with the final histopathologic findings.RESULTSOf the 38 patients examined 19 had glioblastoma (WHO IV) oranaplastic glioma (WHO III). In all of them we found significantBBB disturbances with hypervascularization. In glioblastomathe BBB disturbance was usually rim-like. Six patientshad intracerebral lymphoma with substantial focal high BBBdisturbance but normal CBV or only moderate hypervascularization.Seven patients had low-grade astrocytoma (WHO II)without BBB disturbance or even hypervascularization. Fourpatients had intracerebral metastasis, 1 patient had encephalitis,1 had PML. Evaluation time per case was less than 5 minutes.CONCLUSIONPerfusion CT including BBB imaging allows reliable discriminationof different brain tumor types based on theirrespective pattern of CBV and permeability, which agreevery well with the histopathologic diagnosis. The method isfast and possible under stereotactic conditions. It can be usedfor differential diagnosis and may help to improve the targetpoint selection in stereotactic biopsy with the potential toreduce the number of nonspecific biopsy findings.KEY WORDS: Brain tumors, perfusion CT, blood-brain barrierimagingThe authors of this work have indicated the following affiliations/disclosures:Siemens Medical Solutions CTC AP; Employee.Appignani, B. · Wong, E. T. · Wu, J. · Lenkinski, R.Beth Israel Deaconess Medical CenterBoston, MAPURPOSETo determine whether metabolic data from high resolution 3T MR single and multivoxel two-dimensional (2D) MRspectroscopy (MRS) provides diagnostic information aboutthe viability and extent of gliomas. Currently, evaluation ofprimary brain tumors is based primarily on assessment ofabnormalities observed on T2- and gadolinium-enhancedT1-weighted MR imaging.MATERIALS & METHODSTwenty-eight patients with gliomas were studied on a GE 3T MR scanner, both prior to and during treatment. Therewere four grade I, 16 intermediate (grade II-III), and 8glioblastoma multiforme (grade IV) gliomas. 3 T examinationsincluded 3 mm dual-echo T2-weighted scans, FLAIR,GRE, T1-weighted images volumetrically acquired beforeand following injection of 20 ml gadopentetate dimeglumine.A PRESS sequence with TR = 2000/TE = 35 msec,FOV = 24 cm, 1cm slice thickness and 16 x 16 phase encodingsteps was utilized for spectroscopic imaging. Evaluationwas based on the relative amounts of choline (Cho), creatine(Cr), N-acetylaspartate (NAA), lipid/lactate, and myoinisotol(MI) in the spectra and on measurements of choline-tocreatine(Cho/Cr) ratios. An array of 4 pixel spectral sampleswas obtained in and around tumors and tumorresection/treatment sites (overlaid on T2 and gadoliniumenhancedimages), with a sample in the 2D region of interestincluding “normal appearing” brain. Though single-voxelMRS was utilized to evaluate smaller or distant componentsof some tumors, 2D MRS enabled us to scan throughouttumor and surrounding tissue, which is the critical applicationof this technique.RESULTSAll tumors exhibited metabolic abnormalities that extendedbeyond their anatomically visible borders. Spectral abnormalitiesof enhancing tumors did not conform to the enhancingregion or treatment site “margins” and were detectable inareas without signal or morphologic abnormality in tumortreatment regions. Nonenhancing tumors or nonenhancingregions of tumors also displayed spectral abnormalities. Ingrade I and II gliomas, increases in choline and decreases inNAA were observed, along with elevations in MI peaks. Notumors of the lowest grade exhibited Cho/Cr ratios > 2, butelevation of the Cho/Cr ratio correlated with tumor grade.Intermediate and high-grade tumors that showed signs ofgrowth also demonstrated progressively larger areas of spectralabnormality over time. Areas of T2 signal abnormality,which could be mistaken for vasogenic edema, occasionallydisplayed unusually high elevations in choline. In grade IVgliomas there were greater deviations from the normal spectralpattern and often marked elevations in lipid/lactate peaksboth in necrotic-appearing treated regions of the tumor andin other locations of solid-appearing tumor.
151CONCLUSIONIt is clear that anatomical margins of tumors typically usedto measure tumor extent or progression fall short of definingthe actual disease identifiable based on metabolic measurements.Metabolic alterations in and around brain tumorsidentify larger areas of abnormal brain than do standardmeasures of tumor extent (1). This may have implications forthe approaches taken to tumor treatment (2). Moreover,recognition of disease progression may first be appreciatedby metabolic, not anatomical alterations in the brainparenchyma.REFERENCES1. McKnight TR, et al. J Neurosurg 2002;97(4):794-8022. Nelson SJ, et al. J Magn Reson Imag 2002;16(4):464-476KEY WORDS: Spectroscopy, brain tumors, 3 TPaper 192 Starting at 3:16 PM, Ending at 3:24 PMImage Registration and Subtraction in the Detection ofMarginal Changes in Tumor VolumeGunny, R. · O’Gorman, R. L. · Hampton, T. J. · Connor, S.E. J.Kings College HospitalLondon, UNITED KINGDOMPURPOSEThe major cause of mortality in patients with low-gradegliomas is their transformation to higher grade tumors. Lowgradegliomas generally are slow growing. There is evidencethat an increase in the growth rate predicts subsequent transformationto a higher grade (1). The purpose of this studywas to compare the ability of image registration and subtractiontechniques to improve the detection of small changes inlow-grade glioma volume when applied to standard T2 andFLAIR imaging protocols.MATERIALS & METHODSTumor size was assessed on the basis of increased signal onT2-weighted and fluid attenuated inversion recovery(FLAIR) sequences. Thirteen patients were selected retrospectivelywith minimal or no change in tumor size reportedafter serial imaging. Forty-two pairs of imaging sequencesacquired with standard clinical protocols were compared (27pairs of T2-weighted sequences: TR = 3.2 s, TE = 72 ms,FOV = 22 m, matrix = 256 2 , slice thickness = 5 mm, spacing= 2 mm; 15 pairs of FLAIR sequences: TR = 9 s, TE = 160ms, TI = 2.2 s, matrix = 256 2 , slice thickness = 5 mm, spacing= 2 mm). Imaging was performed with 1.5 T GE SignaHorizon and LX scanners (GE Medical Systems,Milwaukee, WI). For each patient, the earliest T2 andFLAIR imaging studies available were used as baselinescans. Subsequent studies were registered to the baselinescan using a maximization of correlation technique (2, 3).Subtraction images were generated for each comparison andthe images were assessed independently by three neuroradiologistsusing a nonparametric rating scale (-2: definitedecrease in tumor size, -1: possible decrease, 0: no change,1: possible increase, 2: definite increase) and analyzed bySPSS. An average rating for each comparison was obtainedand interrater variability also was evaluated.RESULTSIn 22 of the 42 comparisons the average tumor rating wasupgraded after registration; in one it was downgraded, and inthe remaining 19 the rating remained unchanged. There werestatistically significant differences in the mean ratingsbetween all registered vs unregistered images (p = 0.001,Wilcoxon signed ranks test), T2 and FLAIR registered/subtractedvs unregistered images (p < 0.001, Wilcoxon signedranks test). For upgraded tumors the addition of subtractionincreased the mean rating compared to registered images onFLAIR images. The reproducibility and kappa values wereincreased by registration and registration/subtraction imageson FLAIR images but reduced on T2 images.CONCLUSIONRegistration and subtraction techniques can be applied successfullyto images acquired with standard clinical protocols.Registration increases the detection of small changes intumor volume. Subtraction techniques may provide additionalbenefit when reviewing FLAIR images. Both registrationand subtraction techniques are most sensitive and reproduciblewhen FLAIR sequences are used.REFERENCES1. Rees JH. Low Grade Gliomas in Adults. Curr Opin Neurol2002;15:657-6612. Jenkinson M, Smith S. A Global Optimisation Method forRobust Affine Registration of Brain Images. Med Image Anal2001;5:143-1563. Jenkinson M, Bannister P, Brady M, Smith S. ImprovedOptimisation for the Robust and Accurate LinearRegistration and Motion Correction of Brain Images.Neuroimage 2002;13:825-841KEY WORDS: Low-grade glioma, MR imaging, registration,subtractionPaper 193 Starting at 3:24 PM, Ending at 3:32 PMComparison of Lesional and Perilesional Cerebral BloodVolume and Vascular Permeability Measurements inDifferentiating between Radiation Necrosis andRecurrent GliomaLaw, M. · Wang, E. · Hamburger, M. · Knopp, E. · Zagzag,D. · Johnson, G.New York University Medical CenterNew York, NYPURPOSETo compare relative cerebral blood volume (rCBV) and vascularpermeability (K trans ) measurements in the lesional andperilesional regions of radiation necrosis and recurrent highgradegliomas. We hypothesize that the lesional and perilesionalrCBV measurements are higher in recurrent gliomascompared with radiation necrosis, and that the lesional K transshould be similar as both entities demonstrate blood-brainbarrier disruption. We also postulate that the perilesionalK trans should be higher surrounding recurrent gliomas giventhe infiltrative nature of these high-grade lesions.MATERIALS & METHODSTwenty patients with previously documented intracranialtumors receiving radiotherapy underwent conventional MRimaging, and DSC MR imaging. Maximal rCBV measure-Wednesday
Wednesdayments were obtained from regions of contrast enhancementand maximal perfusion abnormality as determined fromcolor overlay maps. Vascular permeability measurementsderived simultaneously from a pharmacokinetic modelingalgorithm also were obtained in all lesions. Measurements ofrCBV and K trans then were obtained in areas of T2 signalabnormality within the adjacent perilesional region withoutassociated contrast enhancement. The data from thesemethodologies subsequently was compared to histopathologyas determined from volumetric resection.RESULTSNine patients were determined to have pathology compatiblewith radiation necrosis, while 11 patients studied were determinedto have recurrent gliomas. Within the radiation necrosisgroup, rCBV was found to average 0.47 ± 0.42, as comparedto 7.20 ± 2.76 in the recurrent glioma group (P L, while TCDshowed greater impairment in the left MCA. In the seconddiscordant case, with left carotid dissection and occlusion,impaired vascular reserve shown with SPECT and TCD wasnot reflected in the CO2-CTP.CONCLUSIONCO2 challenge CTP is a promising method of quantifyingCVR in patients with chronic cerebrovascular disease. Ourpreliminary results suggest CO2-CTP is comparable toSPECT with acetzolamide and CO2 challenge TCD. The discordancebetween CO2-CTP and SPECT may reflect the differencebetween acetzolamide and CO2 as vasodilatoryagents. The TCD and CO2-CTP discordance may occurbecause TCD measures vascular velocity rather than CBF.REFERENCES1. Yamauchi H, Fukuyama H, Nagahama Y, et al. Evidence ofMisery Perfusion and Risk for Recurrent Stroke in MajorCerebral Arterial Occlusive Disease from PET. J Neurol,Neurosurg, Psych 1996;61:18-252. Grubb RL Jr, Derdeyn CP, Fritsch SM, Carpenter DA, Yundt KD,Videen TO, et al. Importance of Hemodynamic Factors in thePrognosis of Symptomatic Carotid Occlusion. JAMA1998;280:1055-10603. Valvilala MS, Lee LA, Lam AM. Cerebral Blood Flow andVascular Physiology. Anes Clin of N Am 2002;20:247-264KEY WORDS: CT perfusion, carotid occlusionMATERIALS & METHODSWe retrospectively reviewed CO2-CTP studies from 6patients with symptomatic chronic cerebrovascular occlusion.Patients ranged in age from 31-65 years. Two had left
Paper 195 Starting at 3:40 PM, Ending at 3:48 PMA CT Angiography-Based, Multivariable, “Benefit ofRecanalization” Model for Acute Stroke Triage: CoreInfarct Size on CT Angiography Source ImagesIndependently Predicts Outcome153group, time-to-scan was replaced by admission NIHSS scorein outcome prediction, reflecting infarct growth into nonreperfusedischemic tissue. The NIHSS reflects the “territoryat risk” (i.e., “penumbra”) responsible for the presentingclinical syndrome.Lev, M. H. 1 · Roccatagliata, L. 1 · Murphy, E. K. 1 · Coutts, S.B. 2 · Schaefer, P. W. 1 · Koroshetz, W. J. 1 · Demchuk, A. M. 2 ·Gonzalez, R. G. 1 · Schwamm, L. H. 11Massachusetts General Hospital, Boston, MA, 2 Universityof Calgary, Calgary, AB, CANADAPURPOSECT angiographic source images (CTA SI), like diffusionweightedMR images (DWI), have been shown to predictfinal infarct volume (1). We sought to develop a multivariable,linear, CTA/CTA SI-based model for predicting finalclinical outcome, in a population of acute stroke patients forwhom definitive recanalization data were available.MATERIALS & METHODSForty stroke patients were studied acutely using unenhancedCT followed by CTA with CTA SI. Of these, 19 had early,complete vascular recanalization (13 IA thrombolysis, 2 IVthrombolysis, 2 IV + IA, and 2 untreated), and 21 did not (16IA thrombolysis, 1 IV thrombolysis, 2 IV + IA, and 2untreated). Two senior raters graded all scans on a five-pointscale for each of the following findings: (1) vessel occlusionscore on CTA, (2) collateral circulation score on CTA, (3)ASPECTS score on unenhanced CT, (4) ASPECTS score onCTA SI, (5) motor strip lesion presence on CTA SI, and (6)CTA SI lesion volume (normal, >, or < 100 ml). These data,as well as admission NIH stroke scale (NIHSS) score andtime-to-scan, were correlated with follow-up modifiedRankin score (mRS) using a linear, multivariable model withstepwise regression.RESULTSThe complete and incomplete recanalization groups, whencompared, had similar mean admission NIHSS scores (18.4vs 18.4) and time-to-scans (2.3 vs 2.0 hours), but differentfinal mRS (1.9 vs 3.7). For the complete recanalizationgroup, the only independent predictors of outcome wereadmission CTA SI lesion volume (p = 0.001, R-square 0.30)and time-to-scan (p = 0.004, R-square 0.39), for a model R-square of 0.69 (total model R-square 0.89). For the incompleterecanalization group, the only independent predictorsof outcome were admission CTA SI lesion volume (p =0.0002, R-square 0.47) and NIHSS score (p = 0.018, R-square 0.13), for a model R-square of 0.60 (total model R-square 0.85).CONCLUSIONA relatively simple “stroke scale score,” based on admission(1) CTA SI lesion volume, (2) NIHSS score, and (3) time-toscan,strongly predicts clinical outcome in acute strokepatients. Such a score may be of value for triage to therapyor clinical trials, by comparing the mRS to be expected forpatients with, vs those without, early complete recanalization.For the complete recanalization group, CTA SI lesionvolume and time-to-scan predicted outcome, because irreversible“core” infarct volume is a function of the durationand depth of ischemia. For the incomplete recanalizationREFERENCES1. Lev MH, Segal AZ, Farkas J, Hossain ST, Putman C, Hunter GJ,et al. Utility of Perfusion Weighted CT Imaging in AcuteMCA Stroke Treated with Intra-arterial Thrombolysis:Prediction of Final Infarct Volume and Clinical Outcome.Stroke 2001:32;2021-2028KEY WORDS: Acute stroke, CTAPaper 196 Starting at 3:48 PM, Ending at 3:56 PMAssessment of the Dense Vessel Sign on NoncontrastHead CT Imaging: Evaluation of the Hyperdense MiddleCerebral Artery Sign by CT AngiographyMullins, M. E. · Schwamm, L. · Maqsood, M. · Abdullah, A.· Gonzalez, R. · Koroshetz, W. · Lev, M.Massachusetts General HospitalBoston, MAPURPOSETo determine the meaning of the noncontrast head CT hyperdensemiddle cerebral artery sign (HMCAS) as defined byCT angiography.MATERIALS & METHODSForty-five consecutive emergency department patients wereenrolled prospectively with symptoms of acute stroke forless than 6 hours’ duration, receiving noncontrast head CTfollowed immediately by CT angiography. Source and 3Dreformatted images were interpreted. Patients did not receiveanticoagulation or thrombolysis therapy until after imaging.Clinical results were obtained prospectively. The imageswere reviewed retrospectively and consensus on results wasobtained with only the stated history provided. Density wasevaluated subjectively on a five point system. Comparison toCTA was performed via an eight point system comparinglocation and/or overlap of clot, if any, to the location of thedense vessel.RESULTSTwenty-six patients (26/45, 58%) had no perceived densitywithin the M1 segment of the MCA on initial imaging,whereas 19 patients (19/45, 42%) did; including 6 equivocal(6/19, 32%), 5 probable (5/19, 26%), 6 definite (6/19, 32%)and 2 robust/very dense (2/19, 11%). When equivocal caseswere excluded, 13 patients (13/45, 29%) had definiteHMCAS; 5 patients (5/13, 38%) had one-to-one correspondenceof clot to dense vessel but 8 patients (8/13, 62%) didnot, including 3 (3/13, 23%) with partial overlap and densevessel proximal to clot and 5 (5/13, 38%) with completeoverlap with dense vessel smaller than clot (associated withICA thrombosis and T-lesions).Wednesday
WednesdayCONCLUSIONWhen HCMAS was definite in this patient cohort, all 13patients had arterial clot; however, in more than half of thesecases, the dense vessel did not correspond in a one-to-onefashion to both clot location and size. Three groups emerged:(1) one-to-one correspondence in size and location of densevessel to arterial clot, (2) complete overlap of dense vesselwith arterial clot larger and extending proximally, and (3)partial overlap of dense vessel with arterial clot extendingdistally. These findings suggest that density noted on CTwithin the M1 segment is not universally a direct manifestationof intrinsic clot density; thus, HCMAS is likely due toone or a combination of pathophysiologic entities in additionto or instead of intrinsic density, including slow/stagnantflow and extrusion of plasma.KEY WORDS: Stroke, dense MCA sign, CT angiographyPaper 197 Starting at 3:56 PM, Ending at 4:04 PMIron and Gadolinium as Imaging Agents in PCNSL andOther Central Nervous System “Inflammatory” LesionsManninger, S. · Muldoon, L. · Nixon, R. · Nesbit, G. ·Murillo, T. · Whitham, R. · Lovera, J. · Bourdette, D. ·Neuwelt, E. A.Oregon Health & Science UniversityPortland, ORPURPOSESuperparamagnetic, lymphotrophic ultra small iron oxidesparticles (USPIO) are used in MR imaging as contrast agentsdue to shortening of T1 and T2 relaxation time.Ferumoxatran-10 (Combidex®, Advanced Magnetics Inc.,Cambridge, MA), a dextran-coated viral-sized iron particlehas a long plasma life of 24-30 hours, resulting in prolongedand progressive accumulation in human intracranial lesions.The enhancement caused by iron-oxide accumulation wascompared to standard gadolinium-enhanced baseline MRimages, to assess the potential role of ferumoxatran-10 indifferent types of CNS lesions including lymphoma(PCNSL), multiple sclerosis (MS), and stroke.MATERIALS & METHODSFifteen patients ( 9 female, 6 male, age between 24-77 years,average 48 years) were investigated with different types ofintracranial hematopoetic tumor and/or “inflammatory”lesions. All of the patients had standard brain MR (1.5 T)imaging with and without gadolinium varying 1-29 days(average 10) before the iron scan. The dose of ferumoxatran-10 was 2.6 mg/kg, infused intravenously for half an hour.The ferumoxatran-10 MR study was made 24 hours afteriron infusion and included SET1, FST2, and proton density(PD), GRET2*, and DWI.RESULTSIn fifteen patients, eight different types of lesions wereexamined (7 MS, 3 stroke, 2 PCNSL, 1 acute disseminatedencephalomyelitis, 1 myofibroblastic tumor, 1 inflammatorylesion, 1 meningioma, and 1 cavernoma). In five cases ferumoxatran-10scan showed higher signal intensity and/orlarger area of enhancement and/or new enhancing area(s)compared to gadolinium. Two MS, one stroke, and onePCNSL case did not show any enhancement with eithergadolinium nor with ferumoxatran-10. Three MS patients154showed faint enhancement with gadolinium and no enhancementwith ferumoxatran-10. The remaining five casesshowed less enhancement with ferumoxatran-10 thangadolinium. Two patients were biopsied after ferumoxatran-10 infusion, and their tissue currently is being stained foriron for comparison with imaging studies. No toxicity due toferumoxatran-10 was seen.CONCLUSIONFerumoxatran-10 vs gadolinium shows different size andlocation of lesions in PCNSL and other different type ofCNS “inflammatory” lesions. In some cases ferumoxatran-10 and in other cases gadolinium showed better or moreenhancement. It seems that in MS ferumoxatran-10 does notenhance as well as it does in other inflammatory lesions ortumors, which may mean a difference in blood-brain barrierleak size and/or intracellular trapping. Most MS lesions didnot enhance with ferumoxatran-10 while most lymphomasand strokes did enhance which could help in differentialdiagnosis. Further study should be done to find out the utilityof the new iron-oxide-based contrast agent.KEY WORDS: Brain imaging, MR imaging, iron-oxide contrastPaper 198 Starting at 4:04 PM, Ending at 4:12 PMDiffusion-Weighted MR Imaging in the Follow-UpAssessment of Cerebral Abscesses Undergoing TherapyCartes-Zumelzu, F. W. 1 · Stavrou, I. 1 · Castillo, M. 2 ·Eisenhuber, E. 1 · Matula, C. 1 · Knosp, E. 1 · Thurnher, M. M. 11University Clinic Vienna, Vienna, AUSTRIA, 2 University ofNorth Carolina at Chapel Hill, Chapel Hill, NCPURPOSEIntracerebral abscess accounts for 2.5-5.0% of all intracranialmass lesions and their mortality ranges from 8% to ashigh as 89%. Data from recent studies suggest that diffusionweightedimaging (DWI) is more sensitive in distinguishingbetween brain abscess and cystic tumors than conventionalMR imaging. Pus in brain abscesses is strongly hyperintenseon trace DWI and has reduced apparent diffusion coefficient(ADC); whereas most necrotic or cystic brain tumors haveintermediate DWI signal and elevated ADC values.Surgically or conservatively treated brain abscesses mayresolve or experience reaccumulation of pus requiring furtherintervention or treatment change. Our purpose was toevaluate the utility of DWI in the posttreatment follow-up ofabscesses and to identify imaging features related to successor failure of therapy.MATERIALS & METHODSConventional MR imaging including contrast-enhanced T1-,T2-imaging, and DWI were performed in 7 patients withproven pyogenic brain abscesses. Qualitative and quantitativeanalysis of the center of the abscess on DWI was performedon the initial studies and in all follow-up studies inall patients. ADC values were recorded from the baselinepretherapy studies and in all follow-up studies obtained duringthe treatment. We then correlated the signal intensity ontrace DWI and the ADCs with the clinical and laboratoryevaluations in particular with respect to treatment failure andreoperation. The findings in DWI and ADC maps were correlatedalso with those of MR imaging.
RESULTSPatients age ranged from 30-69 years. Surgical drainage wasperformed in 6 patients, 1 patient was treated solely withantibiotics. All abscess cavities initially had high DWI signal(restricted diffusion) with a mean ADC value of 0.53 x 10 -3mm 2 /sec. Low DWI signal with high ADC were seen on follow-upscans in the patient who was on medication, and in 4patients in whom the abscesses were drained and correlatedwith a good therapeutic response. Two patients underwentdrainage and the first follow-up studies showed areas of highDWI signal and low ADC values suggesting reaccumulationof pus. In one of them, a second follow-up MR image showedmild increase in size and decrease ADC in multiple abscesses.Increase in inflammatory laboratory parameters correlatedwell with DWI findings. Reaccumulation of pus showed nospecific or distinct features on conventional MR sequencesexcept for mild enlargement of the cavities in one patient.CONCLUSIONOur preliminary experience indicates that trace DWI andADC maps are useful in the posttreatment follow-up of brainabscesses. A decreased signal intensity on trace DWI andincreasing ADC values in the abscess cavity correlate with asuccessful treatment. Conversely, persistent or reappearanceof high signal intensity within the abscess cavity on traceDWI and low ADC values indicating restricted diffusion areseen on treatment failure and correlate with pus reaccumulation.Findings between successfully and unsuccessfullytreated brain abscess on conventional MR imaging were similarand did not allow for differentiation between these twogroups, thus we believe that DWI may play an important rolein the evaluation of the treated brain abscess.KEY WORDS: Brain abscess, diffusion-weighted MR imaging,follow-upPaper 199 Starting at 4:12 PM, Ending at 4:20 PMEvaluation of Cerebral Blood Flow Dynamics with MRPerfusion-Weighted Imaging in High Flow Extracranial-Intracranial Saphenous Graft Bypass155Regional cerebral blood volume (rCBV), mean transit time(MTT) and regional cerebral blood flow (rCBF) were evaluatedin all patients at the level of basal ganglia (BG), centrumsemiovale (CS) and cortex (C) in both hemispheres.RESULTSStatistically significant differences (p < .005) were observed atthe level of the BG and in the C indicating increased rCBV andMTT in the BG and decreased rCBF in the C of the hemispherevascularized by the graft with respect to the contralateral.CONCLUSIONPatients with occlusion of the ICA and high flow EC-ICbypass do have altered vascular hemodynamic statusbetween the hemispheres. Our data seem to indicate that theincreased MTT of the hemisphere supplied by the EC-IC iscompensated by an increased rCBV (indicating vasodilatation)in the BG thus enabling normal rCBF in this region. Onthe other hand rCBF seems to be impaired in the surgicalhemisphere at the level of the C. Even though it has beenreported that high flow EC-IC bypass increases the vascularcollateral reserve improving morbidity in patients undergoingtherapeutic occlusion of the ICA, our data show thatthere still is some hemodynamic impairment in the surgicalhemisphere. These patients should be followed up to rule outchronic ischemia.KEY WORDS: EC-IC bypass, perfusion-weighted imaging,ICAPaper 200 Starting at 4:20 PM, Ending at 4:28 PMBasal Ganglion Neurodegeneration in Multiple SclerosisMeasured by Dynamic Susceptibility Contrast MRImagingLaw, M. · Ge, Y. · Johnson, G. · Mannon, L. · Herbert, J. ·Grossman, R. I.New York University Medical CenterNew York, NYWednesdayFasoli, F. · Finocchi, V. · Bozzao, A. · Bonamini, M. ·Ferrante, M. · Fantozzi, L.S. Andrea HospitalRome, ITALYPURPOSEThe aim of this study was to assess the cerebral vascularhemodynamic in patients with high flow extracranialintracranial(EC-IC) saphenous graft bypass performed fortherapeutic occlusion of the internal carotid artery (ICA).MATERIALS & METHODSSixteen patients with ICA occlusion and EC-IC bypass (15for unclippable/uncoilable aneurysms and 1 for meningiomainvolving the ICA) with a time interval from surgery rangingfrom 6 months to 6 years, underwent MR examination.Standard SE sequences as well as perfusion-weightedsequences were performed (T2*-weighted echo-planarsequence, TR = 620 ms, TE = 30 ms, FA = 40°, matrix = 128x 64, 40 dynamic series, n. of signals acquired 1, imagingtime 1 min 22 sec, nine slices with a thickness of 7 mm, singledose 0.2 mmol/kg of gadolinium at the rate of 4 ml/sec).PURPOSEThe cerebral hemodynamics in multiple sclerosis (MS) havebeen poorly studied. In this study, we studied the microcirculationin the basal ganglionic gray matter in patients withrelapsing remitting (RR) MS using dynamic susceptibilitycontrast MR (DSC MR) imaging, knowing that primarydemyelination affects both gray and white matter. The purposeof this study was to determine if there is hemodynamicimpairment in the basal ganglionic gray matter that is animportant factor in neurodegeneration of MS patients.MATERIALS & METHODSSeventeen patients with clinical relapsing remitting MS wererecruited for this study. Imaging was performed on a 1.5 TMR imager. Twelve controls also were selected for comparison.Absolute perfusion parameters for cerebral blood volume(CBV), cerebral blood flow (CBF), and mean transittime (MTT) were computed using an automated method forcalculation of artery input function (AIF). Measurementswere made in 2 subregions of putamen and thalamus in eachhemisphere in patients and controls. The mean values foreach perfusion parameter in each region were obtained forthe analysis.
WednesdayRESULTSDynamic susceptibility contrast MR imaging perfusionparameters of CBV, CBF, and MTT expressed as mean andstandard deviation (SD) for putamen and thalamic gray matterin patient and control groups are summarized and comparedin Table 1. All perfusion parameters (CBF, CBV, andMTT) in both putamen and thalamus showed a significantdecrease in perfusion (p ≤ 0.01) between patient and controlgroups, indicating there is a significant hypoperfusion in thegray matter of patients with MS.Table 1: Measured parameters in thalamus and putamen forpatients versus controlsSubjects Thalamus PutamenCBF CBV MTT CBF CBV MTTMS 25.6±11.7 1.98±0.57 3.38±0.81 36.1±17.0 1.86±0.65 3.20±0.83Control 65.9±14.8 3.80±1.01 2.90±0.55 87.9±15.4 4.24±0.74 2.68±0.45P values < 0.0001 < 0.0001 < 0.01 < 0.0001 < 0.0001 < 0.004Note: CBF: (ml/100 g tissue/min); CBV (ml/100 g tissue); MTT: (seconds)CONCLUSIONThese results suggest that there is hemodynamic impairmentin basal ganglionic gray matter in patients with MS and thatmeasurements of cerebral perfusion using DSC MR imagingmay be useful as an indicator of brain neurodegeneration inMS. Because cerebral blood flow is critical in maintainingthe brain function and metabolism, further study will determineif hemodynamic impairment in the deep gray matter isa primary (i.e., ischemic pathogenesis from vascular inflammation/lymphocyticinfiltration) or secondary event (i.e.,reduced metabolic demand due to widespread parenchymalinjury/reactive astrogliosis) in the disease.KEY WORDS: Multiple sclerosis, perfusion, basal ganglionWednesday Afternoon3:00 PM - 4:30 PMBallroom 6 A(44b) Spine: SpinalInjections/Vertebroplasty(Scientific Papers 201- 211)See also Parallel Sessions(44a) Adult Brain: Vascular Imaging in Tumor andIschemia(44c) Adult Brain: Functional Imaging (fMRI, MSI,MRS, PET)(44d) Spine: Trauma and Intervention156Paper 201 Starting at 3:00 PM, Ending at 3:08 PMComplications in Cervical Percutaneous Vertebroplastyfor Spine NeoplasmBarragán-Campos, H. M. · Vallee, J. · Lo, D. ·Mont’Alverne, F. · Cormier, E. · Jean, B. · Rose, M. · Chiras,J.Groupe Hospitalier Pitié-SalpêtrièreParis, FRANCEPURPOSETo evaluate the complication’s rate of cervical percutaneousvertebroplasty (CPV) performed with polymethylmethacrylatecement (PMMA) for treatment of cervical spine neoplasm(CSN).MATERIALS & METHODSRetrospective evaluation of 33 CPV performed in 21patients, during a 2-year period (2001-2002). Informationwas recovered from the clinical record and included a postprocedurefollow-up of 30 days; radiologic data includedpostprocedure standard X-ray, and CT images. The etiologiesof CSN were classified as benign (hemangioma) andmalignant neoplasm (mestastasis or non-Hodgkin lymphoma),while complications were reported as local:hematoma, abscess, radiculopathy (RDC), vertebral diskleakage (VDL) and persistent pain; or systemic: pulmonaryembolism (PE), septicemia, airway obstruction, respiratoryfailure, or shock.RESULTSAmong the 33 sessions of CPV, local symptomatic complicationswere found in 1/33 (3.0%) procedures. This complicationwas a hematoma related to punction site, 1/33 procedures(3.0%), no other complications were identified in oursample. Even when venous leakage (paraspinal plexus 2/33,6.0%; epidural plexus 3/33, 9.0%), paraspinal soft tissueleakage 6/33 (18.2%), punction traject leakage 5/33, (15.2%)and VDL 1/33, (3.0%) were identified all of them wereasymptomatic, so they were considered as technical incidents.No systemic complication was detected in our series.CONCLUSIONCPV using PMMA, alone or associated with other therapies,has been proved as an efficient treatment for pain managementin CSN. Symptomatic complication’s rate in CPV islow (3.0%). In the postoperative period the only local complicationswas resolved spontaneously. At 1-month evolution,no local symptom was related to VDL. No systemiccomplication was detected in our series; however the neuroradiologistshould be cautious and remember that a cervicalcompressive hematoma is still the most dangerous complicationin this type of procedure.KEY WORDS: Vertebroplasty, cervical spine neoplasm, complicationsModerators : Wade H.M. Wong, DOAlyssa T. Watanabe, MD
Paper 202 Starting at 3:08 PM, Ending at 3:16 PMCorrelation of Pretreatment MR Imaging and ClinicalOutcomes in Patients with Osteoporotic Vertebral BodyCompression Fractures Treated with PercutaneousVertebroplastyDo, H. M. · Arakawa, H. · Curtis, L. · Jayaraman, M. ·Marks, M.Stanford UniversityStanford, CAPURPOSETo assess the accuracy of MR imaging signal changes in predictingthe clinical outcomes of patients with vertebral compressionfractures (VCFs) who were treated with percutaneousvertebroplasty (PV).MATERIALS & METHODSThirty-four patients with 37 painful osteoporotic VCFs werereviewed. All patients had pretreatment MR imaging consistingof T1-weighted, T2-weighted, and STIR sequences.MR signal intensities within the target vertebra were comparedwith adjacent normal appearing vertebrae. Pain reliefwas assessed by comparing the pretreatment and 30 dayposttreatment pain scores using the visual analog scale(VAS) and correlated with MR signal changes. The sensitivities,specificities, positive and negative predictive values foreach MR sequence were calculated using Fisher’s exact test.Our hypothesis is that patients with VCFs exhibiting MRgnal changes consistent with vertebral bone marrow edema(T1 hypointensity, T2, and STIR hyperintensity) are mostlikely to experience pain relief with PV treatment.RESULTSThirty of 37 treatments (81%) resulted in either full (24/37,65%) or partial (6/37, 16%) pain relief; full pain relief meansa VAS of zero and partial pain relief means a lower VAS aftertreatment than before treatment. Seven treatments (7/37,19%) did not result in pain relief. No patients experiencedworsening pain after treatment and there were no treatmentrelatedcomplications. We found no statistically significantvalue of MR imaging in predicting clinical pain relief. Whenassessing each sequence individually, 87.5% of patients withT1 hypointensity improved with PV compared with 75% ofpatients with T1 iso/hyperintensity. Seventy-five percent ofpatients with T2 hyperintensity improved with PV comparedwith 85% of patients with T2 iso/hypointensity. Patients(82.4%) with STIR hyperintensity improved with PV comparedwith 100% of patients with STIR isointensity. The sensitivitiesand specificities of T1 hypointensity, T2 hyperintensity,and STIR hyperintensity for any clinical improvementare 70%/50%, 41/4%/42.9%, and 77.8%/0%, respectively.There was no improvement in these values when theMR sequences were assessed in combination.157CONCLUSIONProper patient selection is an important factor to achieve betterclinical outcome for patients evaluated for possible PVtreatment. This evaluation usually consists of detailed history,physical examination, and review of imaging studies (Xrays,MR images, CTs, and bone scans). However this studydoes not support the notion that MR findings of bone marrowedema would be predictive of clinical improvement forpatients with symptomatic VCFs treated with PV.KEY WORDS: Vertebroplasty, MR imaging, clinical outcomesPaper 203 Starting at 3:16 PM, Ending at 3:24 PMBiopsy Results in Percutaneous Vertebroplasty:Correlation with MR FindingsKobayashi, N. · Matsusako, M. · Oka, M. · Numaguchi, Y. ·Uemura, A. · Kato, R. · Suzuki, K.St. Luke’s International HospitalTokyo, JAPANPURPOSEThe significance of contrast enhancement on MR imaging incompressed vertebral body fractures is not well documentedin the literature. The purpose of this study is to evaluate thehistologic findings in intraprocedural biopsy during percutaneousvertebroplasty (PVP) and to correlate with the MRfindings.MATERIALS & METHODSPercutaneous vertebroplasty was performed for 39 vertebralbodies in 34 consecutive patients. Preprocedural MR imaging(1.5 T) was obtained in all patients. The MR sequenceincluded T1-, T2-weighted sagittal images and contrastenhancedstudy with fat suppressed technique. Twenty-eightpatients had osteoporotic compression fractures and 47 biopsieswere performed in 31 vertebral bodies prior to PVP. Sixpatients had metastatic tumors clinically and radiologically,and 13 biopsies were performed among 24 vertebral bodies.All biopsies were performed using 18 gauge biopsy needleswith a spring-loaded gun coaxially through 11 or 13 gaugeneedles which were used for PVP. Biopsy needles wereplaced in the areas with contrast enhancement on MR imagingbut in 7 cases, the needles had to be placed in unenhancedareas for optimal cement injection.RESULTS1. Osteoporotic compression fractures: Among 47 vertebralbiopsy sites, diffuse homogeneous contrast enhancementswere noted in 12. The pathologic findings of these 12revealed granulation in 7, fibrosis in 3, and edema in 2.There were 28 biopsy sites in which MR imaging showedheterogeneous or patchy contrast enhancement. Their pathologicfindings showed fibrosis in 11, normal bone marrow in11, granulation in 2, necrosis in 2, degeneration in one, andundetermined in one. Seven biopsy sites from the area withno contrast enhancement showed necrosis in 3, degenerationin 3 and nondiagnostic in one. 2. Metastatic tumors: Thirteenbiopsy specimens were obtained and 8 showed positive histologicconfirmation. The other 5 showed normal bone marrowor nondiagnostic.Wednesday
WednesdayCONCLUSIONThe areas of contrast enhancement on MR imaging in osteoporoticcompression fracture may represent granulation tissueand/or fibrosis. The unenhanced areas probably representnecrosis or degeneration. The positive biopsy result canbe expected in approximately 60 % of cases with metastatictumors.KEY WORDS: Vertebroplasty, biopsy, MR imagingPaper 204 Starting at 3:24 PM, Ending at 3:32 PMMinimal Vertebral Body Height Increases afterVertebroplasty Treatment of Osteoporotic VertebralCompression FracturesMyers, M. E. · Madison, M. T. · Myers, T. V.St. Paul RadiologySt. Paul, MNPURPOSERecent reports indicate vertebral body height changes aftervertebroplasty, which entails stabilizing painful vertebralcompression fractures (VCF) by injecting bone cement intothe vertebral body. Two groups (1, 2) describe using posturalreduction to increase vertebral height, primarily in VCFscharacterized with intravertebral clefts. Another group (3)observed modest increases in height without spinal manipulation.The goal is to examine potential radiographic outcomesof vertebroplasty on osteoporotic VCFs from patientstreated at a private practice in the United States.MATERIALS & METHODSIn this retrospective, consecutive case series, 43 VCFs from43 patients with primary osteoporosis were treated by vertebroplasty.This study contained 79% (34/43) women and21% (9/43) men. Mean patient age was 74.5 years (range 59-92 years). Mean fracture age was 18.4 days (range 5-45 days,median 16 days). Preoperative MR imaging was used toidentify intravertebral clefts. Spinal manipulation was notattempted before or during the procedure. Absolute vertebralbody heights (anterior, midline, and posterior) were measuredin millimeters from lateral radiographs preoperativelyand postoperatively. Variation in radiographic magnificationwas accounted for using X-Caliper (Eisenlohr Technologies,Inc., Davis, CA). Extravertebral cement extravasation wasmonitored during the procedure and on postoperative radiographs.We will continue to analyze a consecutive cohortthat includes 250 treated levels.158the sample size was small, when analyzing absolute changesin vertebral height categorically (i.e., < 1 mm, ≥ 1 mm), fractureswith clefts were more likely to experience postoperativeincreases in height ≥ 1 mm (anterior, p = .0004; midline,p = .004). Asymptomatic extravertebral cement leakage wasdetected in 16% (7/43) of levels. While mean postoperativevertebral height increase was statistically significant (anteriorand midline, p < .001; posterior, p = .001) for fracturesthat did not have cement leaks, there was no significant postoperativeincrease in mean vertebral height for fracturesassociated with cement leaks.CONCLUSIONThe vertebroplasty patients in this case series experiencedminimal but statistically significant changes in vertebralbody height. Mean increases were at least 4 times smaller(approximately 0.4 mm) than that reported in recent publications(2.1 to 8.4 mm). Additional research is needed to determinehow identification of intravertebral clefts may affecttreatment regimens for VCFs and how vertebral anatomyrestoration may affect patients’ lives and health.REFERENCES1. McKiernan F, Jensen R, Faciszewski T. The Dynamic Mobilityof Vertebral Compression Fractures. J Bone Miner Res2003;18:24-292. Teng MM, Wei CJ, Wei LC, et al. Kyphosis Correction andHeight Restoration Effects of Percutaneous Vertebroplasty.AJNR Am J Neuroradiol 2003;24:1893-19003. Hiwatashi A, Moritani T, Numaguchi Y, Westesson PL. Increasein Vertebral Body Height after Vertebroplasty. AJNR Am JNeuroradiol 2003;24:185-189The authors of this work have indicated that they will be discussing/presentingan unapproved or investigative use ofSimplex P (PMMA) made by Stryker Howmedica Osteonicsfor injection into vertebral body.KEY WORDS: Vertebroplasty, vertebral body height, spinePaper 205 Starting at 3:32 PM, Ending at 3:40 PMMR Imaging of Successfully Treated Vertebrae afterVertebroplastyDansie, D. M. · Luetmer, P. H. · Kallmes, D. F. · Lane, J. I. ·Thielen, K. R. · Wald, J. T.Mayo ClinicRochester, MNRESULTSTreated levels were between T4-L5 [65% (28/43) thoracic(T4-T12), 35% (15/43) lumbar (L1-L5), and 33% (14/43)thoracolumbar (T11-L2)]. Small but statistically significant(p < .001) increases in absolute vertebral body heightoccurred in anterior (mean ± SD, preoperative = 14.7 ± 5.4,postoperative = 15.1 ± 5.4), midline (mean ± SD, preoperative= 13.2 ± 4.4, postoperative = 13.6 ± 4.4), and posterior(mean ± SD, preoperative = 21.3 ± 2.2, postoperative = 21.4± 2.1) measurements. When comparing fractures withintravertebral clefts (n = 9) to fractures with no clefts (n =34), there was no statistical difference between groupsregarding patient age, fracture age, or preoperative and postoperativeheights (anterior, midline, and posterior). AlthoughPURPOSEWhether because of recurrent compression fracture or otherpathology, not all patients experience complete and lastingrelief of back pain following vertebroplasty. There are fewpublished descriptions of the expected MR findings in successfullytreated vertebrae after vertebroplasty.MATERIALS & METHODSWe identified a cohort of 31 patients who returned after vertebroplastyfor evaluation of back pain, and whose back painon follow-up was not felt to originate from the treated vertebra.This cohort was isolated by a review of each patient’smedical record and imaging studies by three physicians, whomade a consensus clinical determination of the pain sourceat follow-up. Evidence for inclusion included a positive
esponse to the initial procedure, physical exam, and/orimaging evidence of pathology away from the treated levelat follow-up, and positive response to new treatment. Threeneuroradiologists reviewed the sagittal T1 and T2 FSEimages of the spine MR imaging performed during thesepatients’ follow-up visits for back pain. The prevertebroplastyMR imaging, when available, and the postvertebroplastyplain films also were reviewed. By consensus opinion, theinvestigators graded imaging parameters before and aftertreatment including loss of height, new fractures, volume ofmarrow edema, and volume of marrow cemented.RESULTSOur cohort of 31 patients had 52 vertebrae successfully treatedprior to the initial follow-up MR imaging. When thesetreated vertebrae were analyzed, 9 of 52 (17%) demonstratedloss of height between the vertebroplasty plain film andthe follow-up MR imaging. Nine of 52 treated vertebrae(17%) had new regions of marrow edema over the imaginginterval. In all but one case, the vertebrae with new edemawere not the same as those with interval compression. Therewas an overall trend toward decreased marrow edema on follow-up,with 94% of preoperative vs 73% of follow-up vertebraehaving marrow edema. However, many successfullytreated vertebrae had significant marrow edema at followup,with 34% of vertebrae having at least 1/3 marrow volumeedema. Several patients had additional vertebroplastyand/or additional follow-up MR imaging. When all followupscans were considered according to the interval betweenthe vertebroplasty and the follow-up MR imaging, 24 of 24vertebrae (100%) had marrow edema at 0-6 weeks, 20 of 22(91%) had edema at 6 weeks-3 months, 11 of 13 (85%) at 3-6 months, and 12 of 23 (52%) at > 6 months. The extent ofedema per treated vertebra declined over time, but at > 6months, 26% of treated vertebrae had at least 1/3 marrowvolume edema.CONCLUSIONThe spectrum of MR findings in vertebrae clinically successfullytreated with vertebroplasty includes persistentedema, which can persist for 6 months or more after the procedure,and new fractures consisting of interval loss ofheight. We are aware of no other published reports describingthese findings.KEY WORDS: Vertebroplasty, MR imaging159MATERIALS & METHODSOver a 26-month period, 1036 sequential epidural injectionsusing CT fluoroscopic guidance were performed. Needleplacement success, complications and patient satisfactionwere recorded prospectively.RESULTSCT fluoroscopy allowed successful epidural needle placementin 1033 cases (99.7%). There were three (0.3%) inadvertentintrathecal needle placements, but no other procedurerelated complications. Patient satisfaction was high amongpatients who previously had had a blind or fluoroscopicguidedESI (n = 56), with 49 (87.5%) reporting less discomfortduring the CT fluoroscopic-guided procedure.CONCLUSIONThe use of CT fluoroscopy to guide epidural needle placementis safe and accurate, allowing correct placement in over99% of patients, with minimal discomfort and side effects.KEY WORDS: Epidural, CT fluoroscopy, spinePaper 207 Starting at 3:48 PM, Ending at 3:56 PMCervical Diskography Performed with a “ProngDeflector” for Improved Access to the Cervical DiskSpacesWednesdayPaper 206 Starting at 3:40 PM, Ending at 3:48 PMCT Fluoroscopic-Guided Epidural Injections: Techniqueand ResultsWagner, A. L. 1,21Rockingham Memorial Hospital, Harrisonburg, VA,2University of Virginia College of Medicine, Charlottesville,VAPURPOSETo describe the technique, pitfalls, and results using CT fluoroscopyduring epidural steroid injections (ESI).Bartynski, W. S. · Grahovac, S. Z. · Rothfus, W. E.University of Pittsburgh, Presbyterian University HospitalPittsburgh, PAPURPOSECervical diskography is a challenging procedure due to closeproximity of vital neck anatomy (carotid, esophagus, pharynx)and overlap of disk spaces by the larynx (1). Wedescribe a modification of a recently popularized techniqueusing a “prong deflector” to improve access to the disk andstabilize neck structures for safer more rapid disk approach(2).MATERIALS & METHODSCervical diskography was performed in 24 consecutivepatients (60 levels) with fluoroscopic approach and 25-gauge needle disk space access. In the last 9 studies (26 lev-
Wednesdayels) a technique modification was employed using a “prongdeflector” that allowed controlled displacement of the laryngealcartilages, trachea, pharynx, and carotid artery whileallowing the operator’s hand to remain out of the fluoroscopicbeam. Factors that influence technique were evaluatedto include: frequency thyroid cartilage overlapped diskspaces, successful displacement of thyroid cartilage, proceduretime, and required sedation.RESULTSConsidering all available levels, thyroid cartilage completelyor partially covered the approach to a disk space at 50 levelsin the 24 patients to include: C23-1/24, C34-10/24, C45-22/24, C56-18/24, and C67-4/24. In one patient, thyroid cartilagewas not visible on the diskogram images. In the 9patients where the “prong deflector” was employed, thyroidcartilage overlapped a disk space at 22 levels to include:C34-4/9, C45-9/9, C56-8/9, and C67-1/9. Cartilage completelycovered the disk space in 14 of these 22 levels andpartially covered disk access in 8/22. Use of the deflectorcaused visible disk access in the 14/22 completely coveredlevels and improved disk exposure in the remaining 8/22partially covered levels. At the 60 total levels where cervicaldiskography was performed (C23-1, C34-10, C45-22, C56-18, C67-4) thyroid cartilage overlapped or obscured theaccess approach in 38 /60 levels to include: C34-5, C45-15,C56-14, C67-3. In the 9 patients where cervical diskographywas assisted by the “prong deflector,” thyroid cartilage overlappedor obscured access to the targeted disk in 19 of 26levels to include: C34-3/4, C45-7/7, C56-7/8, and C67-2/7.Use of the prong deflector resulted in exposure of the diskspace in 13 covered levels with improved disk exposure anduncovering in 6 partially covered levels. In all 26 levels, thedeflector allowed excellent control of neck structures withmarked reduction in swallowing motion and more rapidentry to the disk space. Neck discomfort with swallowingafter the procedure was no longer reported by the patient.Time to enter each disk space, complete the procedure, andrequired sedation per level examined were reduced.160Paper 208 Starting at 3:56 PM, Ending at 4:04 PMCombined Coblation Technology and PercutaneousCement Injection in Treatment of Malignant VertebralLesionsGeorgy, B. A. 1 , 2 · James, B. D. 11Valley Radiology Consultants, Escondido, CA, 2 Universityof California San Diego, San Diego, CAPURPOSETo investigate the role of using coblation technology (lowenergyradiofrequency wave that removes tissue from thetreatment area via a molecular dissociation process that convertsthe tissue into gases which exit the treatment site) tocreate a tissue void cavity before performing vertebroplastyin treatment of vertebral malignant compression fractures.MATERIALS & METHODSSix vertebral bodies in 6 patients (4 males and 2 females) withmean age of 56 years and different metastatic lesions wereincluded in the study after obtaining the appropriate consents.Cases included lesions with destruction of the posterior vertebralwall (two cases) vertebral and paraspinal extension (2cases) and epidural tumor extension (two cases). Eleven Gneedles were used first to access the malignant lesions using atranspedicular approach under fluoroscopy guidance. A specialcoblation device (Arthrocare, Sunnyvale, CA) was introducedthrough the needle and tissue coblation was performedto create a cavity by tissue destruction. The needle then wasrepositioned and bone cement was injected under fluoroscopy.RESULTSAdequate amount of cement was injected in every case.Postprocedure imaging showed no evidence of extravasationof cement outside the presumed vertebral boundaries. Allpatients experienced marked pain relief. Coblation does notrely on heat energy to remove tissue, so thermal damage andtissue necrosis was avoided.CONCLUSION“Prong deflector” for cervical diskography allows improvedaccess to the disk space with reduced swallowing motion andgreater control of neck vital structures such as the carotidartery. Procedure time and required sedation were reduced.REFERENCES1. Schellhas KP, Garvey TA, Johnson BA, et al. CervicalDiscography: Analysis of Provoked Responses at C2-C3, C3-C4 and C4-C5. AJNR Am J Neuroradiol 2000; 21:269-2752. Kapoor V, Rothfus WE, Grahovac SZ. Simplified Approach toCervical Discography: Two Triangles and a Box. Appl RadiolSupp. 2003;Jan: 23-27KEY WORDS: Cervical diskography, technique, disk spaceCONCLUSIONThe concept of creating a cavity by tissue destruction beforeinjecting bone cement into a malignant vertebral lesion mayhelp to reduce complication rate, in particular extravasationof cement into the spinal canal. Further experience is neededto confirm this finding.KEY WORDS: Vertebroplasty, coblation, spinePaper 209 Starting at 4:04 PM, Ending at 4:12 PMEvaluation of the Risk of Cerebral Fat Embolism duringVertebroplasty: An Experiment Using a Canine ModelPotter, J. M. · Morris, P. P. · Moody, D. M. · Baker, M. D. ·Thore, C. R. · Stump, D. A. · Brown, W. R. · Challa, V. R.Wake Forest University School of MedicineWinston-Salem, NCPURPOSECerebral fat embolism is a complication of many invasive proceduresinvolving the manipulation of bone, such as hip replacementsurgery (1). Vertebroplasty is an increasingly popular treatmentfor vertebral body compression fractures where poly-
methylmethacrylate cement is injected percutaneously into thevertebral body. Because of the displacement of marrow by thecement, this procedure also has the theoretical risk of significantfat embolism. Clinically significant fat embolism has beenreported in other procedures involving cement injection into thespine, such as cement augmentation of vertebral body pediclescrews (2). In sheep models, cardiovascular changes with vertebroplasyhave been attributed to fat emboli (3). However, the significanceof cerebral fat emboli associated with vertebroplastycurrently is not known. This experiment investigates possible fatembolism during vertebroplasty using a canine model.MATERIALS & METHODSFour mongrel dogs were used in the experiment (averageweight 32.4 kg). The dogs were anesthetized using thiopentalinduction and fentanyl/midazolam maintenance. Two dogsunderwent four lumbar level vertebroplasty using standardtrocar technique. In order to potentiate fat embolism, cementinjection was continued until filling of the perivertebral veinswas shown, ensuring maximal marrow displacement. Twocontrol dogs were included also in the experiment. The firstunderwent a sham intervention where a trocar was used toinject saline into the paraspinal musculature to simulatecement injection. The second underwent bilateral surgical dissectionof the common carotid arteries for direct injection ofmicrospheres [100 µm (n ≈ 1000) and 50 µm (n ≈ 1000 -2000) in the right and left common carotid arteries, respectively].After treatment, all of the dogs underwent MR examinationto evaluate for cerebral emboli. Afterwards, the animalswere sacrificed and their brains, lungs, hearts, and vertebralcolumns harvested for radiologic, pathologic, and histologicexamination. The hearts were examined for probe patent septaldefects. To detect fat emboli, lung and myocardial sectionswere stained with Oil red O and osmium and brain sectionswere stained with alkaline phosphatase and osmium.RESULTSOn histologic examination, the vertebroplasty-treated dogsdid not show evidence of embolic fat in their brains or lungs.This is despite the presence of cement emboli within thelungs of both animals. No significant emboli were identifiedin the sham-treated dog. The microsphere-treated dog hadthe expected pathologic findings of embolism.CONCLUSIONNo significant findings of cerebral fat embolism could beidentified in dogs treated with vertebroplasty, despite multipletreatment levels and maximal cement injection. This suggeststhe risk of cerebral fat embolism is low under normaltreatment parameters.REFERENCES1. Colonna DM, Kilgus D, Brown W, et al. Acute Brain FatEmbolization Occurring after Total Hip Arthroplasty in theAbsence of a Patent Foramen Ovale. Anesthesiology2002;96:1027-10292. Temple JD, Ludwig, SC, Ross WK, et al. Catastrophic FatEmbolism Following Augmentation of Pedicle Screws withBone Cement: A Case Report. J Bone Joint Surg Am2002;84:639-6423. Aebli N, Krebs J, Davis G, et al. Fat Embolism and AcuteHypotension during Vertebroplasty: An Experimental Studyin Sheep. Spine 2002; 27:460-466KEY WORDS: Vertebroplasty, spine, embolism161Paper 210 Starting at 4:12 PM, Ending at 4:20 PMPercutaneous Bone Cement Injection for SacralFractures (Sacroplasty)Georgy, B. A. 1,2 · Watanabe, A. 3 · Wong, W. 21Valley Radiology Consultants, Escondido, CA, 2 Universityof California San Diego, San Diego, CA, 3 Long BeachMemorial Hospital, Long Beach, CAPURPOSEDescribe our experience, techniques, and outcome in treatmentof sacral fractures and lesions by percutaneous bonecement injection.MATERIALS & METHODSSeven cases was performed by either CT guidance only (1cases), flouroscopy guidance only (1 case), or both includingCT flouroscopy (5 cases). In three cases two needles wereplaced in both sides. Three cases had undergone vertebroplastybefore or with the sacroplasty on the lumber spine.One case had a benign cyst (next to the fracture) that wasfilled with cement during the procedure.RESULTSAll patients but one, experienced marked pain releif. Theremay be a tendency of association between lumbar compressionfractures and sacral fractures. Sacral pain may be asssociatedwith lesions other than stree fractures. Cases mayneed more than single needle injection for each side. Fillingof all fracture lines is not required for pain relief.CONCLUSIONSacroplasty can be performed with high success rate.Technically it may be more challenging than vertebroplasty.More experience is needed to define the adequate amountand exact location of cement injection needed for pain relief.KEY WORDS: Sacroplasty, sacrum, stress fracturePaper 211 Starting at 4:20 PM, Ending at 4:28 PMPercutaneous Radiofrequency Facet Rhizotomy forChronic Neck Pain: Preliminary ExperienceNguyen, T. B. · Goyal, M. · Lum, C. · Swamy, G. · Belanger,E.University of OttawaOttawa, ON, CANADAPURPOSEReport the preliminary experience of the University ofOttawa with biplanar fluoroscopy-guided percutaneousradiofrequency facet rhizotomy in patients with chronic neckpain.MATERIALS & METHODSFrom May 2002 to January 2003, 16 patients with chronicneck pain who failed conservative treatment were investigatedwith diagnostic facet blocks. Their charts were reviewedretrospectively: pre and postprocedure visual analog scale(VAS) pain scores were compared and adverse events postprocedurewere recorded. The diagnostic facet block wasperformed by injecting 0.5 cc of Marcaine 0.5% in the cen-Wednesday
Wednesdayter of each lateral articular mass at the expected location ofthe median branch. Patients who had a temporary relief ofsymptoms following the diagnostic block were candidatesfor radiofrequency facet rhizotomy.RESULTSTen out of 16 patients had temporary relief of their symptomsfollowing the diagnostic block. Eight out of those tenpatients underwent radiofrequency facet rhizotomy. Six outof those eight patients had a successful relief of their pain at1 month followup. The mean pre and postprocedure VASscores were 7.3 and 3.3. Two patients reported no change intheir pain level. One of those two patients underwent a repeatdenervation with subsequent relief of her pain. There was nomajor complication (stroke, vertebral artery dissection,motor weakness). One patient complained of new intermittentleft arm pain following the procedure, while anothercomplained of occipital hyperesthesia.CONCLUSIONRadiofrequency facet rhizotomy can be used safely to treatchronic cervical pain in patients who have had a positiveresponse to a diagnostic facet block.KEY WORDS: Rhizotomy, radiofrequency ablation, neckpainWednesday Afternoon3:00 PM - 4:30 PMRoom 606 - 609(44c) Adult Brain: Functional Imaging(fMRI, MSI, MRS, PET)(Scientific Papers 212 - 223)162Paper 212 Starting at 3:00 PM, Ending at 3:08 PMDynamic Whole Brain Spectroscopic Imaging andFunctional MR Imaging of Ethanol Uptake in the BrainDydak, U. 1 · Roberts, T. P. L. 2,3 · Tyszka, J. M. 4 · Boesiger, P. 1· Rowley, H. A. 51University and ETH Zurich, Zurich, SWITZERLAND,2University of Toronto, Toronto, ON, CANADA, 3 TorontoWestern Research Institute, Toronto, ON, CANADA,4California Institute of Technology, Pasadena, CA,5University of Wisconsin, Madison, WIPURPOSEThis study dynamically assessed regional changes indetectable ethanol and BOLD motor response during acutealcohol intoxication. In contrast to previous single-slicestudies, we combine a fast multislice multiecho MRS imagingmethodology (TSI) with BOLD fMRI to provide a morecomprehensive spatiotemporal picture of acute alcoholintoxication.MATERIALS & METHODSA fast multislice multiecho spectroscopic imaging technique(TSI) was optimized allowing the acquisition of high-resolutiondata from 6 brain slices within only 11 minutes.Functional MR imaging and MRS data were acquired inthree healthy subjects using a 3 T Philips Intera whole bodysystem. Following initial baseline data acquisition, subjectsdrank a 1 ml/kg dose of ethanol. Blood alcohol content wasmonitored between data acquisitions using a breath analyzer.TSI data (6 slices, 20 x 20 voxels each, echo spacing = 144ms, echo train length = 6) were acquired using a T/R headcoil approximately every half hour up to 2.5 hours afterintake. Functional MR imaging measurements were interleavedwith the dynamic MRS acquisitions to assess motorcoordination and performance as a function of intoxication:fMRI was acquired during a visually-guided right hand coordinationtask to assess changes in BOLD responses in thecerebellum and motor cortex. Spectra were analyzed usingpeak integration and a four-resonance model with an adaptivebaseline. Functional MR imaging analysis involvedmotion correction and box-car correlation with task performance.See also Parallel Sessions(44a) Adult Brain: Vascular Imaging in Tumor andIschemia(44b) Spine: Spinal Injections/Vertebroplasty(44d) Spine: Trauma and InterventionModerators:Thomas A. Kim, MDJeffrey L. Sunshine, MD, PhDRESULTSSubjects demonstrated a rapid rise in blood alcohol concentrationover 40 minutes to a maximum of 0.74‰ ± 0.07‰(Figure). Dynamic TSI reveals differential accumulation ofvisible ethanol (methyl triplet at 1.2 ppm) in the cerebellum(Figure), cerebral cortex and CSF. The rise of detectableethanol within CSF is particularly pronounced. Regional differencesin ethanol uptake kinetics between the cerebellumand cerebrum were noted with greater levels achieved incerebellum, but were not observed in all subjects. FunctionalMR imaging showed total loss of BOLD response in ipsilateralcerebellum and severe reduction in contralateral primarymotor cortex at peak intoxication. The total amount of activationwas reduced to 3.9% ± 3% of the baseline activationand showed negative correlation with blood alcohol concentration(r = -0.95) (Figure).
163CONCLUSIONMultislice, multiecho TSI has sufficient spatiotemporal resolutionto map uptake kinetics of ethanol across a significantfraction of the brain and can be interleaved with other functionalexperiments to provide a more comprehensive, multimodalanalysis of intoxication. The question of ethanol visibilityin these images is important, since differences indetected ethanol between the CSF spaces and parenchymaare striking. Further experiments designed to quantify MRSIvisible alcohol will be required. Functional MR imagingresults are consistent with previous reports of reducedBOLD response in visual and auditory cortex during intoxicationand suggest an alcohol-mediated reduction in neuronalactivity in cerebellum and motor cortex during a complexmotor task.KEY WORDS: ethanol, MRS, fMRIThe authors of this work have indicated the following affiliations/disclosures:1. GyroTools: Employment; 2. PhilipsMedical Systems: Consultant fees; 3. General ElectricMedical Systems: Research support; 4. Toronto ImageProcessing Systems: Ownership.Paper 213 Starting at 3:08 PM, Ending at 3:16 PMEffect of Age on Visuomotor Functional MR ImagingTekes, A. 1 · Mohamed, M. A. 1 · Mikhelashvili-Browner, N. 2· Calhoun, V. D. 3 · Yousem, D. M. 11Johns Hopkins Hospital, Baltimore, MD, 2 ClevelandClinics, Cleveland, OH, 3 Yale University, New Haven, CTPURPOSEThe effect of age has not been addressed adequately withvisuomotor functional MR imaging (fMRI) studies. Wesought to determine the effect of age on functional MRimaging experiments performed with visuomotor stimulation.We hypothesized that the functional MR imaging correlatewould be a diminution in the amplitude of activationwith increasing subjects’ ages due to influence of restrictedvascular reserve in the elderly.MATERIALS & METHODSWe used fixed effects models to study the influence of age onfMRI patterns of the amplitude of brain activation during ablock design visuomotor reaction time task in three differentage groups: old (mean: 75 years, standard deviation: 6years), middle-aged (mean: 52 years, standard deviation: 9years) and young (mean: 29 years, standard deviation: 5years). Each group included 7 subjects, 4 right-handedfemales and 3 right-handed males. Regions of interest (ROI)were defined by templates of Brodmann areas for the left primarymotor area (LM1), supplementary motor area (SMA),and right and left occipital (RO, LO) visual areas. Individualsubject’s and group statistical parametric maps (SPMs) weregenerated for each ROI, and then the mean amplitude of activationwas compared between age groups in each ROI usingthe group analysis and t test. A linear regression analysis wasperformed between age and activation amplitudes of eachsubject within each ROI.RESULTSIn the group analysis the young age group showed higheramplitude of activation than middle and old age groups in allROI (P < 0.01 uncorrected). Unpaired two tailed t test resultsbetween the groups showed significant differences betweenmiddle and young, and old and young age groups in all ROIs(P < 0.05), with the exception of old and young age groupsin RO region (P = 0.11). The regression analysis of age vsamplitude of activation showed correlation r-values between0.49 and 0.62, in all ROIs.CONCLUSIONGiven a block design visuomotor paradigm, regressionanalysis shows a negative correlation between age and meanamplitude of activation in all ROIs. The group analysis, andunpaired t test results reveal higher amplitude of activationin the young vs the old and middle aged groups.KEY WORDS: Amplitude, age, visuomotor taskPaper 214 Starting at 3:16 PM, Ending at 3:24 PMEffect of Age in Volume of Activation in Block Design andSingle-Event Paradigms Using Visuomotor FunctionalMR ImagingTekes, A. 1 · Calhoun, V. D. 2 · Mohamed, M. A. 1 · Yagmurlu,B. 3 · Mikhelashvili-Browner, N. 4 · Yousem, D. M. 11Johns Hopkins Hospital, Baltimore, MD, 2 Yale University,New Haven, CT, 3 Ankara University, Ankara, TURKEY,4Cleveland Clinics, Cleveland, OHPURPOSETo determine the effect of age on visuomotor task functionalMR imaging (fMRI). We hypothesized that functional MRimaging analyses would show a diminution in the volume ofactivation in subjects in older and younger age groups,whereas the activation would be the highest in middle agegroup due to vascular “efficiency” (for the young) and“reserve” (for the old) issues.MATERIALS & METHODSWe used fixed effects models to study the influence of age onfMRI patterns of brain activation during both block and singleevent design visuomotor reaction time task in three dif-Wednesday
Wednesdayferent age groups; old (mean: 75 years, standard deviation: 6years), middle (mean: 52 years, standard deviation: 9 years)and young (mean: 29 years, standard deviation: 5 years).Each group included 4 right-handed females and 3 righthandedmales. Regions of interest (ROI) were defined as leftprimary motor area (LM1), supplementary motor area(SMA), right and left occipital (RO, LO) visual areas.Individual subject’s and group statistical parametric maps(SPMs) were generated for each ROI at an uncorrected Pvalue 0.01. The volumes of activation were comparedbetween age groups in each ROI using single tailed unpairedt test.RESULTSWe performed fixed effects groups analysis both in blockand single event design for each age group. In both designsthe middle age group showed more activated voxels than theold and young age groups (P < 0.01 uncorrected) in allregions of interest (ROI), with the exception of SMA in thesingle-event paradigm (Tables 1 and 2). In the block designparadigm, unpaired single tailed t test results between thegroups showed statistically significant difference betweenmiddle and young age groups in SMA and LO (P < 0.05),and a trend towards significance in LM1 and RO (P = 0.06).There was no statistically significant difference between oldand young, and old and middle age groups. In single eventdesign there was a statistically significant differencebetween old and young age groups in all ROI, and in LOregion old and middle age groups also showed a difference(P < 0.05).Table 1: Activated voxels in each age group using block andsingle-event paradigms p< 0.01LM1 SMA RO LOblock-single block-single block-single block-singleOLD 1358-635 650-21 944-998 552-529MIDDLE 1398-1922 1012-992 947-1356 609-880YOUNG 16-1765 61-1209 18-1269 1-761Table 2: Unpaired t test results for volume of activationbetween the age groups in all ROIpvaluesingle event blockLM1 upper lowerold-middle 0.06 0.71old-young 0.02* 0.14middle-young 0.23 0.06*SMAold-middle 0.10 0.78old-young 0.04* 0.05middle-young 0.31 0.02*ROold-middle 0.09 0.66old-young 0.003* 0.10middle-young 0.20 0.06*LOold-middle 0.03* 0.74old-young 0.02* 0.22middle-young 0.30 0.03*LM1: Left sensorimotor area, SMA: Supplemantary motor areaLO: Left occipital visual cortex, RO: Right occipital visual cortex* : statistically significant value164CONCLUSIONThe middle aged subject group showed a greater volume ofactivation than the old and young groups in all regions ofinterest using a visuomotor task fMRI experiment withgroup analysis in both single event and block design paradigms.KEY WORDS: Volume of activation, age, fMRIPaper 215 Starting at 3:24 PM, Ending at 3:32 PMEvaluation of a Signal Intensity Mask in theInterpretation of Functional MR Imaging ActivationMapsStrigel, R. M. · Haughton, V. M. · Moritz, C. · Field, A. S. ·Badie, B. · Wood, D. A. · Hartman, M. · Rowley, H. A.University of Wisconsin MadisonMadison, WIPURPOSEThe purpose of this study was to determine the incidence ofsusceptibility artifacts in functional MR imaging (fMRI)studies and their effect on fMRI readings. We hypothesizedthat the availability of the signal intensity maps wouldchange the interpretation of fMRI studies in which susceptibilityartifacts affected eloquent brain regions.MATERIALS & METHODSAll fMRI studies performed with a signal intensity map(SIM) were reviewed. The SIM consisted of the initial echoplanarimages (EPI) in each slice thresholded to eliminatesignal from outside the brain and then overlaid on anatomicalimages. The cause of the artifact then was determined byexamination of the images. Cases with a susceptibility artifactin eloquent brain were included in a blinded study readby four readers, first without and then with the SIM. Foreach reader, the number of times the interpretation changedupon viewing the SIM was counted.RESULTSOf 152 patients, 45% had signal loss involving the cerebralparenchyma, including 18% involving an eloquent brainregion. Causes of the artifacts were: surgical site artifact,blood products, dental devices, calcium, basal ganglia calcifications,ICP monitors, glue, and air. Reading with the SIM,readers changed interpretations in 8% to 38% of patientcases, depending on reader experience and size and locationof susceptibility artifact.
165MATERIALS & METHODSThe grafted patient is a 22-year-old man who suffered a traumaticcircular-saw amputation of the right forearm. Thepatient had a myo-electric prosthesis during 20 months, untilsurgery was performed. Surgery included procurement of theupper extremity from a multiorgan 27-year-old cadaverdonor. Ten days after transplantation the patient notified sensationslocalized at the level of the right thumb. Over weeks,his sensations progressively increased. The Tinel test waspositive as early as 10 days after grafting but the somatosensory-evokedpotentials analyses were negative and remainednegative during 1 year. The patient had successive fMRIexaminations (at 10 days and 2, 4, and 8 months) with passivetactile stimulation of the grafted hand by brushing witha rough sponge at the frequency of 3 Hz. Separate activationof his thumb and palm also were performed as the patientexperienced more sensations on his thumb than on his palm.His normal left hand and a normal population including 8healthy subjects were studied for comparison. A patient withcomplete brachial plexus palsy also was studied to assess thelack of fMRI signal in somatosensory areas in case of totalaxonal disconnection. Functional MR imaging was performedusing a standard GE EPI sequence implemented on a1.5 T unit (Philips, Intera).Figure. Example of the signal intensity map in a patient withan arteriovenous malformation and previous bleed. The mapshows loss of signal due to susceptibility artifact in theregion of the malformation.CONCLUSIONPatients with focal cerebral lesions have a high incidence ofsusceptibility artifacts, whose presence and size can bedetermined by inspection of the SIM but not anatomicalimages. The availability of the SIM may affect interpretationof the fMRI.KEY WORDS: fMRI, artifact, postprocessingPaper 216 Starting at 3:32 PM, Ending at 3:40 PMFunctional MR Imaging Activation of SomatosensoryCortex in a Hand-Grafted Patient with Early ClinicalSensory RecoveryNeugroschl, C. S. · Denolin, V. · Schuind, F. · Van Holder, C.· Voordecker, P. · David, P. · Metens, T. · Balériaux, D.Hospital Erasme, Universite Libre de BruxellesBrussels, BELGIUMPURPOSETo investigate the correlation between early clinical sensitiverecovery in a hand-grafted patient and a cortical activity insomatosensory areas detected with functional MR imaging(fMRI).RESULTSStimulating the grafted hand revealed significant activationin the controlateral somatosensory cortical areas in all fMRIexaminations. The activation already was seen 10 days aftersurgery and was similar in location and intensity with theresponse of his normal left hand and with activation inhealthy subjects. In each session, a significant difference inintensity and volume area was found between activation ofthe right thumb alone (where the patient had the most sensations),and palm alone; palm activation alone was alwaysinferior to thumb activation. No activation was found in thepatient with complete left brachial plexus palsy suggestingthat activation with passive stimulation is dependent on sensoryfeedback and unlikely to be due to imagination alone.Another reason to exclude a mental activation is that alighter tactile stimulation gave no cortical answer neither incontrols nor in the grafted patient.CONCLUSIONFunctional MR imaging could detect very early activation insomatosensory areas in a hand-grafted patient that correlatedwell with clinical sensation recovery. These results couldsuggest that somatosensory cortical areas were not alteredfrom trauma and that new peripheral inputs allowed functionalcortical reactivation. Fundamental studies should bedone to assess that such an early activity is due tosomatosensory circuit. Still, other cases are necessary tocomfort this hypothesis.KEY WORDS: fMRI, somatosensory cortex, hand transplantationWednesday
Paper 217 Starting at 3:40 PM, Ending at 3:48 PMFunctional MR Imaging of Postsurgical LanguagePlasticity Following Brain Tumor ResectionPillai, J. J. · Allison, J. D. · Fick, J. R. · Lavin, T. B. · Balan, A.Medical College of GeorgiaAugusta, GA166CONCLUSIONOur study demonstrates increased right frontal BOLD activationon serial scans following left hemispheric tumorresection. These changes consistent with adaptive contralesionalreorganization were noted in the early postoperativeperiod in one patient and beyond 6 months in the other.BOLD fMRI is a useful technique to study postoperativeneural plasticity.WednesdayPURPOSETo determine the feasibility of studying brain plasticity withfunctional MR imaging (fMRI) following tumor resection.MATERIALS & METHODSTwo patients underwent echo-planar fMRI on a 1.5 T system.Patient 1, a 33-year-old male, underwent left parietal anaplasticastrocytoma resection; scans were obtained 2 weeks preoperativelyand 5.5 and 15.5 months postoperatively. He madea near complete recovery from initial postoperative Broca’saphasia and severe anomia over 3 months with rehabilitation.Patient 2, a 48-year-old male, underwent left frontotemporalanaplastic astrocytoma resection; scans were obtained 2weeks preoperatively, and 5.5 and 31 months postoperatively.Immediately postoperatively, he exhibited mild speech apraxia,but regained fluent speech within 2 months. The patientsperformed noun-verb association and rhyming tasks.Functional datasets analyzed using SPM99 ( p < 0.001; 10voxel clustering) were overlaid on postcontrast T1-weightedanatomical images. Supratentorial (entire frontal and anteriortemporal lobe) hemispheric rectangular volume regions ofinterest (ROIs) (75 mm,75 mm,130 mm) were used to computeactivated voxel laterality indices (LI) : LI = [(left ROI) -(right ROI)]/[(left ROI) + (right ROI)]. Group-averaged normalizedfunctional datasets (p < 0.001; 10 voxel clustering)for a control group of 5 normal volunteers performing the NVtask were analyzed also using identical ROIs.RESULTSPatient 1: For the phonological (P) task, a 44.75% decreasein LI from the first ( S1) to the second scan (S2), 97.27%decrease from S2 to the third scan (S3), and 98.49% decreasefrom S1 to S3 were noted. For the noun-verb (NV) task, an82.4% decrease in LI from S1 to S2 and 72.92% decreasefrom S1 to S3 were observed. Greater right middle frontalgyrus activation was seen in S2 and maintained in S3.Patient 2: For the NV task, a 2.65% increase from S1 to S2,127.42% decrease from S2 to S3 and 128.12% decrease fromS1 to S3 were noted. LI values (0.761 for S1, 0.782 for S2,and -0.214 for S3) demonstrated increasing right frontal activation.The P task displayed 28.96% increase in LI from S1to S2, 562.35% decrease from S2 to S3 and 696.23%decrease from S1 to S3. LIs were 0.098 for S1, 0.126 for S2(mildly left lateralized), and -0.583 (strongly right lateralized)for S3. More extensive and robust right inferior andmiddle frontal gyral activation was seen in S3 than on S1 orS2. The control group LIs during both S1 and S2 were 1.000,with no change in left lateralization noted.KEY WORDS: fMRI, brain tumor, language plasticityThe authors of this work have indicated the following affiliations/disclosures:Radiological Society of North America:Work funded in part by a 2000 RSNA Seed Grant.Paper 218 Starting at 3:48 PM, Ending at 3:56 PMFunctional MR Imaging Evaluation of PostsurgicalMotor PlasticityPillai, J. J. · Allison, J. D. · Fick, J. R. · King, D. W. · Smith,J. R. · Lee, M. R.Medical College of GeorgiaAugusta, GAPURPOSETo determine whether BOLD functional MR imaging(fMRI) can evaluate motor cortical functional reorganizationoccurring as an adaptive response to surgical resection ofdiseased but partially functional neoplastic or epileptogenicbrain tissue.MATERIALS & METHODSThree patients were studied with BOLD functional MRimaging at 1.5 T using identical paradigms, analysis techniques,and statistical thresholding, both preoperatively andapproximately 3-6 months postoperatively. One epilepsypatient (A) underwent inferior left frontal lobe resection,while another (B) underwent right parietal partial resectionand the third (C) underwent left parietal lobe tumor (anaplasticastrocytoma) resection. All patients performed bilateralhand motor (alternating finger tapping) tasks. Followingoverlay of SPM-99 functional datasets on MPRAGEanatomical images, activated voxels (p < 0.001) were countedwithin supratentorial hemispheric regions of interest(ROIs) comprising the frontal, parietal, and temporal lobes.Regions of interest were selected in the ipsilateral (i.e., to thehand used) and contralateral cerebral hemispheres. Lateralityindex (LI) computations then were made based on voxelcounts within each ROI, according to the following formula:LI = [(left ROI) - (right ROI)]/[(left ROI) + (right ROI)].Percent changes in LI were computed. Group-averaged datawas obtained for a control group of 5 normal volunteers whowere scanned twice (S1 and S2) at variable interscan intervals(4 weeks to 12 months). An activation threshold of p
ight hand motor task. For patient B, and 81.95% increase inLI was noted during the left hand motor task, also indicatinggreater ipsilateral primary sensorimotor activation. Forpatient C, the changes in LI for both right and left handmotor tasks reflect greater ipsilateral primary sensorimotorcortical activation; the percentage changes in LI were -98.99% and +114.43%, respectively. None of the patientshad undergone resection of primary sensorimotor cortex orsupplementary motor cortex. The control group datarevealed increased contralateral, but not ipsilateral sensorimotorcortical activation on S2 compared to S1 ( 70.83%increase in LI with the right hand task and 50.45% decreasein LI with the left hand task).CONCLUSIONCompensatory spatial increases in extent of nondominant(i.e., ipsilateral and contralesional) sensorimotor corticalactivation may occur following damage to the respectivedominant (i.e., contralateral hemispheric) regions. Loss ofthe resected diseased but partially functional tissue mayresult in functional reorganization in the contralesional cortex,possibly with activation of previously dormant neuralnetworks. These preliminary results suggest that fMRI maybe useful for studying postsurgical plasticity in the adultbrain.KEY WORDS: Plasticity, fMRI, postsurgicalThe authors of this work have indicated the following affiliations/disclosures:Radiological Society of North America:Work funded in part by a 2000 RSNA Seed Grant.Paper 219 Starting at 3:56 PM, Ending at 4:04 PMDiffusion Tensor Imaging of the Corpus Callosum in“Drug Naïve” Schizophrenic PatientsGasparotti, R. · Liserre, R. · Mardighian, D. · Colleoni, M.L. · Regini, C. · Sacchetti, E.University of BresciaBrescia, ITALYPURPOSEPost-mortem and morphologic and functional MR studiessupport the hypothesis that schizophrenia is a disorder ofcortical connectivity. Diffusion tensor imaging (DTI), a techniquecapable of examining water diffusion in the brain and167the organization of white matter tracts, can reveal structuraldisconnectivity in schizophrenia. Diffusion tensor imagingwas used to analyze in vivo the neuropathology of the corpuscallosum, the greatest cerebral commissural structure, infirst episode schizophrenic patients with no history of exposureto neuroleptic medication (“drug naïve”).MATERIALS & METHODSTen drug naïve patients (5 men, 5 women, mean age 27.7years), fulfilling the DSM IV diagnosis of schizophrenia,and 10 healthy age-matched controls were investigated withDTI MR imaging on a 1.5 T scanner (Siemens, Germany).Diffusion tensor examinations consisted of a set of axial diffusion-weightedsingle shot echo-planar images (b = 0, b =500, b = 1000), with diffusion gradients applied sequentiallyalong six noncollinear directions. Subjects with a history ofneurologic or systemic illness, head injury, and drug or alcoholmisuse were excluded from the study. All subjects wereright handed. Color maps of fractional anisotropy (FA), themost sensitive index of axonal integrity, were obtained on avoxel-by-voxel basis. Regions of interest (ROIs) were independentlyoutlined on the FA maps by two operators in genuand splenium of the corpus callosum on the two axial sectionswhich better displayed the structure at its full extension.Adjacent sections were checked to ensure that partialvolume effects from CSF were minimized. Statistical analysiswas performed with independent t-tests and F-tests tocompare group differences in the FA values. A multivariateanalysis was performed in order to investigate the relationshipsamong FA and clinical scores.RESULTSFractional anisotropy was reduced significantly in the spleniumof the corpus callosum in the schizophrenic groupcompared with controls (t-test, p = 0.03). Fractionalanisotropy in the genu did not differ significantly in the twogroups. A greater dispersion of FA values was found alsoonly in the splenium of schizophrenic subjects (F test, p =0.02). There were no significant sex differences in the DTImeasures for either the schizophrenic or control group. Noassociation was found in schizophrenic patients between FAvalues and clinical variables such as age, duration of illness,and scores of the psychopathologic symptoms scales.CONCLUSIONThis is the first study, to our knowledge, that has examined agroup of first-episode, drug naïve schizophrenic patientswith DTI. The observed reduced FA values in the spleniumof the corpus callosum confirm previous findings obtained inchronic schizophrenic patients and support the hypothesis ofa focal disruption of commissural connectivity in schizophrenianot related to neuroleptic medication. However, ithas to be determined, using other methods of analysis likevoxel-based morphometry (VBM), if similar anomalies existin other white matter tracts. According to our preliminaryresults DTI can become an important tool for the in vivoanalysis of white matter tracts in psychiatric patients with apossible role in monitoring the efficacy of the pharmacologictreatment in future longitudinal studies.KEY WORDS: Diffusion tensor imaging, schizophrenia, corpuscallosumWednesday
WednesdayPaper 220 Starting at 4:04 PM, Ending at 4:12 PMDynamic Statistical Spatiotemporal Map EnhancesEquivalent Current Dipole Analysis ofMagnetoencephalography Language Mapping inEpilepsy PatientsStufflebeam, S. M. · Knacke, S. · Foxed, D. · Halgren, E.Massachusetts General Hospital, NMR CenterCharlestown, MAPURPOSEMagnetoencephalography (MEG) provides a noninvasivemethod for determinating hemispheric language dominance(1). Healthy right-handed subjects are typically left hemispheredominant for language in 94% of the time, but a higherdegree of atypical language representation has beenshown in patients with epilepsy. We prospectively investigatedhemispheric index (LI) with MEG using two sourceanalysis methods in 17 right-handed patients with medicallyintractable focal epilepsies: (1) single dipole (ECD); and (2)distributed method (dSPM).MATERIALS & METHODSA prospective analysis was performed on 17 consecutiveepilepsy patients aged 14-45 years who were referred for aclinical epilepsy MEG examination. A 306-channel wholeheadbiomagnetometer (VectorView, Neuromag/Elekta) wasused to measure the evoked magnetic fields, with simultaneous64-electrode EEG. A visually presented reading task consistingof 240 English words was used. Equivalent currentdipoles (ECD) based on a boundary element model were fittedfor each hemisphere using a sequential single equivalentcurrent dipole fit with a time range of 150 ms - 600 ms, in 1ms steps. Only dipoles with a goodness of fit (GOF) of over70% were considered for analysis, as proposed previously(1). The LI was calculated for each patient using the formula:LI = (Lt- Rt)/(Lt + Rt), where Lt and Rt represent thenumber of dipoles with a GOF > 70% in each hemisphere(Rt = right; Lt = left). The noise normalized spatiotemporalmap was calculated as detailed elsewhere (2), which producesa dynamic statistical parametric map (dSPM) “movie”of activated cortex. The dSPM LI was calculated by computingthe area of activated cortex during the time window150-600 ms on an inflated cortex.RESULTSThirteen of 18 patients (76%) showed left hemispheric languagedominance, two patients showed right LI (12%), and2 demonstrated bilateral activation (12%), concordant withboth the ECD and dSPM methods. Ten of the 13 left LIpatients were diagnosed with left hemisphere epilepsy (HE).One of the patients with bilateral LI previously showed abilateral Wada test result. The dSPM showed diffuse areas ofactivation not demonstrated with the ECD method (seeFigure).168CONCLUSIONBoth the traditional ECD mapping and the dSPM providecomparable LI, but dSPM provides valuable informationabout timing and extent of activation during language activationtasks.REFERENCES1. Papanicolaou AC, et al. Magnetoencephalographic Mappingof the Language-Specific Cortex. J Neurosurg 1999;90(1):85-932. Dale AM, et al. Dynamic Statistical Parametric Mapping:Combining fMRI and MEG for High-Resolution Imaging ofCortical Activity. Neuron 2000;26(1):55-67KEY WORDS: Magnetoencephalography, language, fMRIThe authors of this work have indicated the following affiliations/disclosures:MIND Institute: Funding.Paper 221 Starting at 4:12 PM, Ending at 4:20 PMIn Vivo Single-Voxel Proton MR Spectral Patterns in theDiagnosis of Pyogenic Brain Abscess at 1.5 TLai, P. 1 · Pan, H. 1 · Hsu, S. 1 · Li, K. 2 · Ding, S. 21Veterans General Hospital, Kaohsiung, TAIWAN REPUB-LIC OF CHINA, 2 National Sun Yat-Sen University,Kaohsiung, TAIWAN REPUBLIC OF CHINAPURPOSERecent reports have shown the biochemicals present in pyogenicbrain abscesses, as detected with in vivo proton MRspectroscopy ( 1 H-MRS), to be characteristic and differentfrom those of brain necrotic neoplasms. Our objective was toassess whether the resonance lines from lactate, lipids,acetate, succinate, and amino acids in the in vivo spectra providea specific and sensitive signature for brain abscesses, toexplore the multiplicity (diversity; variety) of spectral patternson different metabolites and to discuss the causes of thevarious spectral patterns.MATERIALS & METHODSSeventeen patients (pyogenic brain abscesses) who underwentin vivo 1.5 T 1 H-MRS and had findings of ring-shapedenhancement after contrast agent administration wereenrolled in this study. Single voxel 1 H MRS was applied
using the method of point-resolved spectroscopy (PRESS).The parameters used were a repetition time (TR) of 1600 msand echo time (TE) of both 270 and 135 ms respectively. Sixpatients had in vitro 11.7-T 1 H-MR spectra obtained from theaspirated pus.RESULTSThe MR spectra of all patients were of acceptable quality.There are three different in vivo 1 H MR spectral patterns: (A)presence of lactate at 1.3 ppm, leucine, isoleucine, and valine(referred to as cytosolic amino acids) at 0.9 ppm, alanine at1.50 ppm, and acetate at 1.92 ppm, along with the presenceor absence of succinate at 2.4 ppm and lipids (0.8-1.3 ppm);(B) presence of lactate at 1.3 ppm, cytosolic amino acids at0.9 ppm, along with the presence or absence of lipids (0.8-1.3 ppm); (C) presence of lactate at 1.3 ppm, along with thepresence or absence of lipid (0.8-1.3 ppm).CONCLUSIONThere are three different spectral patterns in pyogenic brainabscesses. The glycolytic and fermentation products of bacterialmetabolism, including lactate, acetate, and succinate,vary depending on the different species of infecting microorganisms.The detection of amino acid resonances at 0.9 ppm,inverted at 1 H MR spectroscopy with a TE of 135 ms, permitsthe definite diagnosis of the intracranial bacterialabscesses except very small size abscesses and treatedabscesses.REFERENCES1. Rémy C, Grand S, Lai ES, et al. 1 H MRS of Human BrainAbscess In Vivo and In Vitro. Magn Reson Med 1995;34:508-5142. Poptani H, Gupta RK, Jain VK, Roy R, Pandey R. CysticIntracranial Mass Lesions: Possible Role of In Vivo MRSpectroscopy in Its Differential Diagnosis. Magn Reson Imag1995;13:1019-10293. Kim SH, Chang KH, Song IC, et al. Brain Abscess and BrainTumor: Discrimination with In Vivo H-1 MR Spectroscopy.Radiology 1997;204:239-2454. Grand S, Passaro G, Ziegler A, et al. Necrotic Tumor VersusBrain Abscess: Importance of Amino Acids Detected at 1 HMR Spectroscopy — Initial Results. Radiology 1999;213:785-7935. Burtscher IM, Holtas S. In Vivo Proton MR Spectroscopy ofUntreated and Treated Brain Abscesses. AJNR Am JNeuroradiol 1999;20:1049-10536. Lai PH, Ho JT, Chen WL, et al. Brain Abscess and NecroticBrain Tumor: Discrimination with Proton MR Spectroscopyand Diffusion-Weighted Imaging. AJNR Am J Neuroradiol2002;23:1369-1377KEY WORDS: Brain pyogenic abscess, MR imaging, MRspectroscopy169Paper 222 Starting at 4:20 PM, Ending at 4:25 PMGliomatosis Cerebri: An Unusual MR SpectroscopicAppearance of Normal Choline but Elevated MyoinositolMetabolite LevelsImbesi, S. G.University of California San Diego Medical CenterSan Diego, CAPURPOSEMR spectroscopy can noninvasively provide useful informationto estimate type and grade of brain tumors, as well as todifferentiate them from conditions such as infarct, demyelinatingdiseases, and inflammatory processes. In general,increase in the choline peak has been emphasized as a markerfor brain tumors. Alternatively, increase in the myoinositolpeak has been considered nonspecific. We describe apatient with histologically proven gliomatosis cerebri thatpresented with an abnormally elevated myoinositol level buta normal choline level.MATERIALS & METHODSA 73-year-old man presented with onset of confusion anddisorientation. Physical examination was unremarkable. Thepatient had no other significant past medical history. BrainMR imaging and MR spectroscopy were performed on a 1.5T MR unit (Symphony, Siemens, Erlangen, Germany). Asdefinitive diagnostic evidence was required prior to the institutionof therapy, a stereotactic biopsy was obtained.RESULTSMR imaging demonstrated abnormal low signal intensity onT1-weighted images and high signal intensity on long TRimages in almost the entire left hemisphere with extension tothe right hemisphere through the splenium of the corpus callosum.Minimal mass effect was identified for the size of theabnormality. Furthermore, no focal areas of enhancementwere observed. MR spectroscopy demonstrated marked elevationof Myoinositol/Cr ratio (1.1), normal ratio of Cho/Cr(1.1), and decreased NAA/Cr ratio (1.3). Histologic evaluationrevealed cellularity of just short of twice normal withmostly uniform round nuclei while few others showed minimalpleomorphism. The increased cellularity tracked alongmyelinated fiber bundles. A few mitoses were seen but nocalcification, vascular proliferation, or necrosis was noted.Findings were compatible with gliomatosis cerebri.CONCLUSIONMR spectroscopy has been introduced recently as part of thearmamentarium for the investigation of neoplasm. The MRspectrum of gliomatosis cerebri, however, showed normalcholine and an unexpected marked elevation of myoinositol.Increase in the myoinositol peak has been associated withgliosis, hyperosmolar states, renal failure, diabetes mellitus,and Alzheimer’s disease. Castillo et al. established a trendtoward elevated myoinositol levels in low-grade astrocytomas(1). They assume that the myoinositol elevation wasassociated with glial activation and the mildly elevatedcholine with a low tumor density. While gliomatosis cerebriis a more aggressive neoplasm, review of the histologic findingssupports this hypothesis. Unlike the classical MR spectrumof neoplasm characterized by elevation of choline,knowledge of an increased myoinositol level may provide anindication for the correct diagnosis of neoplasm as illustrat-Wednesday
ed by this patient. Of particular note, occasionally only longTE spectra (specifically for choline level determination) areobtained in the diagnostic work-up of neoplasm.Myoinositol, a metabolite with a short T2, however, will notbe observed on the long TE spectra. A short TE spectra mustbe acquired also to obtain this potentially critical informationand therefore, given these findings, a short TE spectra shouldbe considered also in the routine spectroscopic evaluationwhen neoplasm is a diagnostic possibility.170WednesdayREFERENCES1. M, Smith JK, Kwock L. Correlation of Myoinositol Levelsand Grading of Cerebral Astrocytomas. AJNR Am JNeuroradiol 2000;21:1645-1649KEY WORDS: Gliomatosis cerebri, MR spectroscopy,myoinositolPaper 223 Starting at 4:25 PM, Ending at 4:30 PMSerial FDG-PET and MR Imaging of Transient Corticaland Cerebellar Lesions Due to Status EpilepticusLiebeskind, D. S. · Ances, B. M. · Newberg, A. B. · Moonis,G. · Melhem, E. R. · Alavi, A.University of PennsylvaniaPhiladelphia, PAPURPOSEStatus epilepticus may cause transient neuroimaging findings.Transient cortical abnormalities have been demonstratedon serial MR imaging, yet crossed cerebellar findings arerare. Increased demand on the inhibitory function of thecerebellum may accompany prolonged seizure activity. Wedescribe a case of status epilepticus chronicled with serialFDG-PET and MR imaging of transient cortical and crossedcerebellar findings.MATERIALS & METHODSA 37-year-old man with a chronic seizure disorder presentedin epilepsia partialis continua. Diagnostic evaluation includedlaboratory investigations, lumbar puncture, and neuroradiologicstudies including CT, MR imaging, and FDG-PET.RESULTSMR imaging obtained 3 days after admission showed T2-hyperintensity involving the left cerebral hemisphere andright cerebellar hemisphere as well as the left thalamus withoutrestricted diffusion. Coronal postgadolinium T1-weightedsequences revealed enhancement of the right cerebellum(Figure 1A). Subsequent PET images 5 days after admissionconfirmed patchy areas of intense increased FDG uptake inthe left cerebral hemisphere, right cerebellum, and left thalamuscorresponding to seizure activity (Figure1B).Aggressive antiepileptic therapy culminated in resolution ofseizure activity after 10 days. Repeat MR imaging and FDG-PET demonstrated interval resolution of the previous corticaland cerebellar findings.CONCLUSIONTransient cortical and crossed cerebellar enhancement maybe observed in prolonged status epilepticus. FDG-PET mayconfirm hypermetabolic activity consistent with seizures.REFERENCES1. Calistri V, Caramia F, Bianco F, Fattapposta F, Pauri F, BozzaoL. Visualization of Evolving Status Epilepticus withDiffusion and Perfusion MR Imaging. AJNR Am JNeuroradiol 2003;24:671-673KEY WORDS: Status epilepticus, PET, cerebellumWednesday Afternoon3:00 PM - 4:30 PMRoom 611 - 612(44d) Spine: Trauma and Intervention(Scientific Papers 224 - 235)See also Parallel Sessions(44a) Adult Brain: Vascular Imaging in Tumor andIschemia(44b) Spine: Spinal Injections/Vertebroplasty(44c) Adult Brain: Functional Imaging (fMRI, MSI,MRS, PET)Moderators:Anil Khosla, MDRobert M. Quencer, MD
Paper 224 Starting at 3:00 PM, Ending at 3:08 PMApparent Diffusion Coefficients within Spinal CordTransplants and Surrounding White Matter Correlatewith Degree of Axonal Dieback Following InjurySchwartz, E. D. 1 · Chin, C. 1 · Shumsky, J. S. 2 · Brown, K. 2 ·Jawad, A. F. 1 · Wehrli, S. 3 · Tessler, A. 2 · Murray, M. 2 ·Hackney, D. B. 41University of Pennsylvania, Philadelphia, PA, 2 DrexelUniversity College of Medicine, Philadelphia, PA,3Children’s Hospital of Philadelphia, Philadelphia, PA, 4 BethIsrael Deaconess Medical Center, Boston, MA171Paper 225 Starting at 3:08 PM, Ending at 3:16 PMDiffusion Tensor Imaging and Fiber Tracking in SpineInjuryDucreux, D. F. 1 · Facon, D. 1 · Fillard, P. 2 · Lasjaunias, P. 11CHU de Bicetre, Le Kremlin-Bicetre, FRANCE,2University of North Carolina at Chapel Hill, Chapel Hill,NCPURPOSETo study the diffusion tensor imaging parameters variationsin spinal trauma, and to visualize injured spinal fibers.PURPOSEWe have shown previously that abnormal apparent diffusioncoefficient values in injured spinal cord white matter andfibroblast transplants correspond with qualitative histologicfindings of axon loss or regeneration. We propose that apparentdiffusion coefficient (ADC) values will correlate withquantitative axon tracing in the transected rubrospinal tract(RST).MATERIALS & METHODSEleven rats received right-sided lateral funiculus lesions atC3-4 (disrupting the RST) and transplantation of fibroblaststhat were unmodified (Fb-UM) or modified to secrete brainderivedneurotrophic factor (Fb-BDNF). Behavioral testsmeasured hindlimb function for 12 weeks. The anterogradeaxon tracer BDA then was injected stereotactically into thered nucleus to label the injured RST axons. Diffusion imagingof fixed spinal cord specimens was obtained in 9.4 Tmagnet.RESULTSIn white matter surrounding transplants, ADC values transverseto axons were elevated and ADC values longitudinal toaxons were decreased. These ADC values were more abnormalcloser to the transplant and this correlated with decreasesin numbers of labeled RST axons. ADC values within Fb-BDNF transplants were significantly lower than Fb-UMtransplants, and these lower values correlated with decreasedaxonal dieback. Behaviorally, all animals showed partialrecovery but animals with Fb-BDNF transplants hadimproved hindlimb function as compared to those with Fb-UM.CONCLUSIONApparent diffusion coefficient values can evaluate graftfunction following spinal cord injury by demonstrating thedegree of axon dieback and preservation. These findings willbe critical in the clinical setting when histologic data is notavailable, and behavioral recovery may be prolonged.KEY WORDS: Diffusion-weighted imaging, spinal cordinjury, transplantationMATERIALS & METHODSTen patients with spinal trauma and five healthy volunteersunderwent MR examination with regular sagittal SE T2-weighted and sagittal diffusion tensor imaging. Diffusiontensors were acquired using a customized parallel imaging 6-gradients directions sequence and were processed to createfractional anisotropy (FA) maps. Patients FA values inabnormal SE T2-weighted spinal areas were correlated withnormal healthy volunteers FA values of same spinal locationusing cross-correlations and a new validation method called“No Gold Standard” method. Generated spinal FA mapswere used to track the spinal fibers and to reconstruct in 3Dthe spinal tracts using a dedicated software.RESULTSIn all healthy volunteers, the 3D reconstructions of spinaltract appeared continuous without broken-line aspect. In allpatients, the 3D reconstructed spinal tract appeared brokenin areas of spinal injury. Fractional anisotropy values inareas of abnormal SE T2-weighted signal were all decreased(0.4 +/- 0.17) when compared to FA in healthy volunteers(0.6 +/- 0.08) suggesting a local increased isotropy of theinjured spine due to local edema.CONCLUSIONThree-dimensional fiber-tracking method based on the FA ofthe spinal track is a useful method to visualize in “one look”abnormal areas in case of spinal injury.KEY WORDS: Spine, diffusion tensor imaging, fiber trackingPaper 226 Starting at 3:16 PM, Ending at 3:24 PMDiffusion Tensor Imaging of the Human Spinal Cord at3 TSummers, P. 1 · Kwiecinski, S. 1 · Staempfli, P. 1,2 · Jaermann,T. 1,2 · Kollias, S. S. 11University Hospital Zürich, Zürich, SWITZERLAND,2Institute for Biomedical Engineering, ETH, Zurich,SWITZERLANDPURPOSEMR imaging of the spinal cord is subject to strong susceptibilityartifacts, respiratory and CSF motion, that severelylimit efforts to study its microstructure using MR diffusiontensor imaging (DTI). Preliminary studies using spin-echoecho-planar (SE EPI), turbo-spin echo (TSE) DTI and linescan(LS) DTI MR techniques have been used for spinal cordDTI with promising results. The combination of dedicatedWednesday
Wednesdayreceiver coils, and high performance gradients allows theminimization of image degradation and optimal signal detectionof benefit to all the techniques. In this study we compareSE EPI and TSE based DTI at a 3 T MR system for high resolutionimaging of the white matter tract organization in thehuman spinal cord.MATERIALS & METHODSFour volunteers have been investigated so far on a 3 T wholebody MR scanner (80 mT/m, 100 mT/m/ms gradients), usinga dedicated 12 element, phased-array spine coil. Diffusiontensor imaging with the acquisition of six diffusion-weighteddirections and a single, reference image were obtainedusing SE EPI and TSE pulse sequences (TR/TE/NEX: 2heartbeats/69-89 ms/2, FOV/SLT/AcQ Matrix/ReconMatrix: 90 mm/5 mm/90 2 /128 2 ), with b-values of 400 s/mm 2and 750 s/mm 2 in the sagittal (1 slice) and axial (8 slices)planes. Fractional anisotropy (FA) and apparent diffusioncoefficient (ADC) maps were calculated. Eddy-currentimage warping was removed from the DTI data with a 3Dregistration algorithm and the diffusion tensor was derivedby singular value decomposition. Multiseed-forward-integrationwas applied for the fiber-tracking using a custommadesoftware.RESULTSThe sagittal TSE DTI images showed excellent anatomicaldetail with fewer distortions than the SE EPI scans.However, ghosting artifacts were more severe for TSE DTIresulting in an inhomogeneous appearance of the spinal cordon the T2-weighted reference image, which corrupted subsequentcalculations of ADC and FA, but did not affect theaveraged diffusion-weighted scan. In the axial orientation,the SE EPI sequence produced images of significantly higherSNR than the TSE DTI scans. The b-value = 750 s/mm 2images had very low SNR and more severe distortion resultingin very noisy estimates of fractional anisotropy andeigenvector determination as compared to b = 400 s/mm 2images. Fiber tracking started in seed areas placed in the lateralfuniculi at the expected anatomical location of the lateralcorticospial tracts, generated 3D depictions of rostrocaudalyoriented, uncrossed fiber trajectories corresponding tothe known anatomical arrangement of this white matter fibersystem.CONCLUSIONSagittal TSE DTI should be well suited to generating diffusion-weightedimages in the clinical setting. Further optimizationis required to reduce the effects of cord and CSFmotion before tensor-related parameters can be extractedfrom TSE DTI data. Spin-echo echo-planar studies appearsuperior to TSE DTI for axial imaging of the spinal cord.Higher b-values may be required to better resolve the diffusiontensor components. Greater image resolution is alsodesirable to improve the anatomical accuracy of the reconstructedfiber tracts. These improvements can be achieved atthe expense of increased scanning time, decreasing theappeal of the technique for routine clinical applications.Nonetheless, the multislice SE EPI with appropriate adaptationto avoid the effects of CSF and cord motion is a promisingapproach to achieve fiber-tracking in the spinal cord.KEY WORDS: Spinal cord, diffusion tensor, white matter172Paper 227 Starting at 3:24 PM, Ending at 3:32 PMFunctional MR Imaging of the Human Cervical SpinalCordKollias, S. S. · Kwiecinski, S. · Summers, P.University Hospital ZürichZürich, SWITZERLANDPURPOSENoninvasive investigation of spinal cord function usingfunctional MR imaging (fMRI) would improve greatly theneurologic assessment of patients with spinal cord pathology.Our aims were to determine whether spinal cord fMRIcan be performed at an 1.5 T MR system, and investigatewhether the fMRI signal is localized spatially to specificanatomical areas according to the functional organization ofthe spinal cord gray matter.MATERIALS & METHODSActivation conditions were selected to activate specific neuroanatomicalareas (i.e., motor, sensory, or combined sensory-motorpathways) of the cervical spinal cord. Consisted ofupper extremity motor tasks (flexion-extension) in 16 righthandedvolunteers, thermal stimulation of the hand (ice bagcontact) in 4, and electrical stimulation of the median nerve(3-9 mA, 8 Hz) in another 4 subjects. Imaging was performedin the transverse plane (1 mm in-plane, 7.5 mmthick) covering C5-C8 cervical cord segments. Flow-compensationand anterior saturation were used to suppress CSFflow, breathing and swallowing motion artifacts. A turbospin-echo (5000 ms/40 ms/90 o ) sequence was used for thefunctional experiments performed in a block design (30son/30s off). Parametric maps of significant (P < 0.05) activationwere generated on an anatomical subregion containingthe spinal cord to avoid changes in the tone or positionof the surrounding muscles. Analysis was performed in thetime domain on a pixel by pixel basis by computing thecross-correlation with the exercise paradigm.RESULTSAverage fMRI signal intensity increases 3-5% time-lockedto the timing of the activation conditions were observed inall experiments. The activated areas were predominantlyipsilateral to the hand involved in the exercise and locatedbetween the C5-C8 spinal cord segments. Motor tasks, elicitedsignal in the intermediate zone of the gray matter(interneurons in Rexed’s lamina VII) with a ventrolateralextension (motor neurons in Rexed’s lamina IX). Foci ofactivation in the dorsal horn and in the contralateral graymatter were found less consistently probably representingclosely related areas, involved in the regulation of motorcontrol. Tasks involving different myotomes were spatiallylocalized to particular anatomical segments according to thecraniocaudal segmental organization of the spinal cord andbrachial plexus (hand and wrist more caudally at C7-C8,whereas elbow more cranially at C5-C6). Thermal stimulation,activated the ipsilateral dorsal horn (Rexed’s laminae Ito VI), corresponding to sensory input. Prominent activitywas observed also in the intermediate lamina VII, whichcontains propriospinal neurons. Electrical repetitive stimulationof the median nerve inducing twitching of the thumbelicited activity of both dorsal and ventral areas suggestingactivation of both sensory and motor fibers in the mediannerve.
173CONCLUSIONOur results support the findings of other investigators thatintensity changes related to neuronal activation can bedetected in the human cervical spinal cord using fMRI. Thefact that we observe similar intensity signal changes (3-5%)with both sensory and motor stimuli and the tendency to belocalized in the expected areas of neuronal involvementenhances our believe that we are observing physiologicchanges related to neuronal activity in the spinal cord andnot motion or artifact-related changes.KEY WORDS: Spinal cord, fMRI, sensorimotorPaper 228 Starting at 3:32 PM, Ending at 3:40 PMSubarachnoid Hemorrhage Due to Isolated SpinalArtery Aneurysm Rupture in Four PatientsMassand, M. G. · Wallace, R. C.Barrow Neurological InstitutePhoenix, AZPURPOSEExcluding trauma as an etiology, the most common cause ofsubarachnoid hemorrhage is cerebral aneurysm rupture.Spinal artery aneurysms are found usually in associationwith arteriovenous malformations or other entities that resultin increased hemodynamic stress, such as aortic coarctationor bilateral vertebral occlusion with resultant use of thespinal arterial circulation in the collateral pathway (1, 2).Isolated spinal artery aneurysms are rare (3, 4), however,since spinal arteries are in direct communication with thesubarachnoid space, one etiology that should be consideredin cases of spinal subarachnoid hemorrhage is rupturedspinal aneurysm.MATERIALS & METHODSA series of four patients presented with acute onset low backpain. Work-up included MR imaging, conventional spinalangiography, and subsequent surgery, which resulted in adiagnosis of subarachnoid hemorrhage due to spinalaneurysms in all four cases.RESULTSFor four cases presenting to our instution with acute onsetlow back pain and lower extremity pain/weakness, subsequentMR imaging revealed spinal subarachnoid hemorrhage.Conventional spinal angiography was performed inall four cases. In one case (Figure), angiography revealedtwo aneurysms involving a posterior spinal artery branch ofthe left L1 segmental artery. In another case, angiographydemonstrated a dissecting aneurysm of the artery ofAdamkiewicz. In the third case, a small focal lesion was evidenton MR imaging adjacent to the conus, but conventionalangiography was negative. On operative exploration, athrombosed aneurysm of the spinal artery was discovered. Inthe fourth case, angiography revealed an aneurysm involvinga posterior spinal branch of the left T6 segmental artery.Operative treatment, including aneurysm excision in two ofthe four cases and reconstruction with muslin wrapping inthe other two cases, was successful.CONCLUSIONWe conclude that spinal aneurysms may be an often overlookedcause of subarachnoid hemorrhage, and in the appropriateclinical setting, this should be considered as a possibleetiology when diagnostic work-up is performed.REFERENCES1. Kawamura S, Yoshida T, Nonoyama Y, Yamada M, Suzuki A,Yasui N. Ruptured Anterior Spinal Artery Aneurysm: A CaseReport. Surg Neurol 1999;51(6):608-6122. Chen CC, Bellon RJ, Ogilvy CS, Putman CM. Aneurysms ofthe Lateral Spinal Artery: Report of Two Cases.Neurosurgery 2001;48(4):949-953; discussion 953-9543. Vincent FM. Anterior Spinal Artery Aneurysm Presenting asSubarachnoid Hemorrhage. Stroke 1981;12(2):230-2324. Rengachary SS, Duke DA, Tsai FY, Kragel PJ. Spinal ArterialAneurysm: Case Report. Neurosurgery 1993;33(1):125-129;discussion 129-130KEY WORDS: Aneurysm, spinal, hemorrhagePaper 229 Starting at 3:40 PM, Ending at 3:48 PMMR Neurography Findings of the Bipartite PiriformisMuscle in the Evaluation of SciaticaTsuruda, J. S. · Filler, A. G.Neurografix, Neurography InstituteSanta Monica, CAPURPOSEThe piriformis syndrome often is not recognized as a cause ofsciatica of nonlumbar origin (1). This muscle can irritate orcompress the proximal sciatic nerve due to spams, contracture,or entrapment. Developmental variants resulting in splittingof the sciatic nerve by a bipartite muscle has been notedin 6% of anatomical specimens (2). To our knowledge, thisfinding has not been well documented with MR imaging.MATERIALS & METHODSOver a period of 5 months, 72 adult subjects presenting withsciatica of nonlumbar origin were evaluated with MR neurography(MRN) of the pelvis at 1.5 T with a torso phasedarraycoil, centered ipsilateral to the symptomatic side. TheMRN consisted of: standard spatial resolution (fov 26 cm)coronal STIR, axial T1 SE, and high resolution (fov 16 cm)oblique axial STIR and T1 SE perpendicular to the long axisof the sacral plexus and proximal sciatic nerve to the level ofthe ischial tuberosity. Multiplanar reformations, to trace thesciatic nerve along its longitudinal course, were performed.Wednesday
WednesdayRESULTSSix patients (4 F, 2 M) demonstrated a bipartite variant consistingof a horizontal cleft along the inferior margin with twodistinct muscle groups separated by a well defined fatty fascialplane. Splitting of the sciatic nerve, such that a commonsheath is not present, with entrapment of the peroneal portionwas identified. Distally, the sciatic nerve reconstituted into acommon sheath in all subjects. Fascicular edema at the pointof division and extending distally was noted to be: moderate(1 case), mild (2) or borderline-negative (3). In one patient, aportion of the muscle was hypointense, indicating fibrosis. Inall cases, the oblique axial T1 identified this variant; whereas,this variant was overlooked easily on the direct coronaland axial sections. Another variant form was a partially splitmuscle, without splitting of the sciatic nerve. Careful reviewwas important to detect any fascicular entrapment.CONCLUSIONRecognition of the bipartite piriformis muscle is importantfor identifying a potential cause of entrapment sciatica aswell as directing therapeutic management such as surgicalrelease (3), since nonrecognition of this entity may lead tosurgical failures (4). In one patient who underwent MRimaging-guided injection of this muscle, we have incorporatedknowledge of this anatomical variant in order to directthe needle and injectate (anesthetic and steroid) towards thesite of entrapment.REFERENCES1. Durrani Z, AP W. Piriformis Muscle Syndrome: AnUnderdiagnosed Cause of Sciatica. J Pain Symptom Manage1991;6:374-3792. Pecina M. Contribution to the Etiological Explanation of thePiriformis Syndrome. Acta Anat (Basel) 1979;105:181-1873. Chen W. Bipartite Piriformis Muscle: An Unusual Cause ofSciatic Nerve Entrapment. Pain 1994;58:269-2724. Spinner R, Thomas N, Kline D. Failure of SurgicalDecompression for a Presumed Case of PiriformisSyndrome. Case Report. J Neurosurg 2001;94:652-654KEY WORDS: Piriformis muscle, MR neurography, sciaticaPaper 230 Starting at 3:48 PM, Ending at 3:56 PMCan Real Time Video Fluoroscopy of the Cervical SpineDifferentiate the Normal from the Abnormal Spine?Rothman, S. L. G. · Go, J. L. · Kim, P. E. · Zee, C. S.University of Southern CaliforniaLos Angeles, CAPURPOSEIn recent years video fluoroscopy of the cervical spine hasbeen adopted by chiropractors as a way of determining subtlejoint, ligament, and disk injury. They learn the techniquefrom manuals prepared by the equipment manufacturers.They posit diagnoses that have not been proven pathologicallyand have created a subspecialty of video fluoroscopists.The purpose of this work is to objectively review a series ofnormal and purportedly abnormal video fluoroscopic examinationsof the cervical spine to see if any objective abnormalitiescan be seen on the studies. If abnormal findingswere found an attempt was made to see if there was any usefulcorrelation with the existence of neck pain.174MATERIALS & METHODSTen video fluoroscopic studies that were interpreted asshowing at least one diagnosable capsular injury were digitizedand written to CD. Intermingled in a random fashionwere 8 similar exams performed on normal volunteers withno neck pain or history of injury. Four senior spine radiologistsreviewed the CDs to determine if the studies showedany abnormalities. The cases then were categorized into twogroups, normal motion and abnormal motion. Special notationwas made of any patient where it was felt that the studysuggested the there was a greater than 50% likelihood thatthe patient was in pain. The data on normal and abnormalpatients then were reviewed by a 5th radiologist with thecode to the CD to see what diagnoses could be made.RESULTSMild to moderate degenerative change was demonstrableboth on the patient group and on the normal volunteer group.There was no significant difference in the cervical motionwhen comparing the two groups. The most common abnormalityof motion was slight limitation of motion at degenerativesegments. No objective diagnoses of capsular ligamentoustears could be made by any of the panel members. Noneof the supposedly abnormal studies were diagnosed as showingcapsular injury.CONCLUSIONThe criteria used by the community of chiropractic video fluoroscopistsare not considered scientifically sound. The capsularinjuries that were diagnosed did not appear to be diagnosableusing this method. Most of the supposed abnormalitieswere actually normal findings.KEY WORDS: Real time fluoroscopyPaper 231 Starting at 3:56 PM, Ending at 4:04 PMPreprocedural MR Imaging for PercutaneousVertebroplasty: Special Interest on ContrastEnhancement and Presence of Intravertebral CleftUemura, A. · Matsusako, M. · Numaguchi, Y. · Oka, M. ·Kobayashi, N. · Kato, R.St. Luke’s International HospitalTokyo, JAPANPURPOSEPercutaneous vertebroplasty (PVP) has been used for thetreatment of osteoporotic fractures and metastatic tumors ofthe vertebral bodies (1-3). However, little has been mentionedin the literature as to MR imaging for the indicationof PVP. The purpose of this study is to evaluate the role ofMR imaging for the indications of PVP.MATERIALS & METHODSThis study included 40 PVP sessions at our institution for 70vertebral bodies in 38 consecutive patients (32 patients withosteoporotic fractures and 6 with metastatic tumors).Patients’ age ranged from 46-93 years (mean 75 years).There were 14 males and 24 females. Thirty-one sessionswere multilevel procedures and 19 sessions were singlelevel.Pre and postprocedural numerical 10-point pain scalefrom 0 (no pain) to 10 (the worst pain of life) was used toevaluate the clinical outcome. Preprocedural MR imaging
was available in all sessions. We retrospectively reviewedpreprocedural MR findings (1.5 T) and evaluated the extentof contrast enhancement (CE) of the treated vertebral bodieson postcontrast T1-weighted imaging (T1WI) and the presenceof any intravertebral cleft among treated levels onT1WI and T2-weighted imaging (T2WI). Contrast enhancementwas revealed in all treated vertebral bodies except acase in which postcontrast T1WI was not obtained. Based onthe extent of CE on preprocedural MR imaging, all sessionswere classified into type 1 (more than 50% enhancing areaof the vertebral body) and type 2 (less than 50% enhancingarea of the vertebral body). In multilevel PVP sessions, themost enhancing level was evaluated. Intravertebral cleft wasdefined as nonenhancing linear or ellipsoid area which wasisointense to cerebrospinal fluid on both T1WI and T2WI.The extent of CE and the presence of intravertebral cleftwere correlated with pre and postprocedural pain score.RESULTSAs to the extent of CE, 28 sessions were classified into type1 and 11 sessions were type 2. Intravertebral cleft was foundin 10 vertebral bodies. Pain relief was noted in 33 (82.5%)among 40 sessions when pain relief was defined as a 4-pointor greater improvement in pain score. There was a trendtoward better pain relief in more extensive enhancing area (p= .057) and the presence of intravertebral cleft (p = .098),although the difference was not statistically significant.175Paper 232 Starting at 4:04 PM, Ending at 4:12 PMSacroplasty: An Extended Single Center ExperienceReedy, M. L. · Morris, P. · Baker, M.Wake Forest University School of MedicineWinston-Salem, NCPURPOSESacroplasty, a variant of vertebroplasty, has been describedrecently as a treatment for sacral insufficiency fractures. Assacral insufficiency fractures are frequently more debilitatingthan the vertebral equivalent and have no alternativeform of treatment, sacroplasty represents a potentiallyimportant therapeutic procedure in our aging population.The goal of this study is to identify the efficacy and safety ofsacroplasty and the various technical challenges yet to beovercome.MATERIALS & METHODSTen consecutive patients referred for sacroplasty were evaluatedin clinic between April 2002 and November 2003. Oneof the 10 patients presented with spontaneous resolution ofsymptoms. Another is undergoing continued evaluation.Eight of the 10 patients (mean age: 68 years) presented withsymptoms averaging 8.7 months in duration. Preproceduralradiologic evaluation included bone scintigraphy in 7patients, pelvic CT in 4, and pelvic MR imaging in 6. Afterinformed written consent for this novel procedure wasobtained, the patients were treated by fluoroscopic placementof either 13 or 11 gauge needles into the sacral ala andsubsequent injection of orthopedic polymethylmethacrylatecement mixed with antibiotic powder. Needle placement wastargeted to minimize the risk of cement encroachment onadjacent neural foramina. Radiologic evaluation of cementdistribution was performed with fluoroscopy in all patients.Additionally, postprocedural CT was obtained in 5 patients.Each patient was seen in clinic 1 month after the procedureand evaluated for changes in self-reported pain pattern, selfreported(and/or family-reported) activities of daily living(ADL), pattern of pain medication use, and pattern of supportdevice use (walker, cane, etc.)WednesdayCONCLUSIONExtensive CE and intravertebral cleft on preprocedural MRimaging seem good indicators for PVP.REFERENCES1. Kallmes DF, Jensen ME. Percutaneous Vertebroplasty.Radiology 2003;229:27-362. Evans AJ, Jensen ME, Kip KE, et al. Vertebral CompressionFractures: Pain Reduction and Improvement in FunctionalMobility after Percutaneous PolymethylmethacrylateVertebroplasty-Retrospective Report of 245 Cases. Radiology2003;226:366-3723. Weill A, Chiras J, Simon JM, et al. Spinal Metastases:Indications for and Results of Percutaneous Injection ofAcrylic Surgical Cement. Radiology 1996;199:241-247KEY WORDS: Vertebroplasty, contrast enhancement,intravertebral cleftRESULTSAll injections were technically successful. The sacral neuralforamina were patent without cement encroachment on allpostprocedural fluoroscopy and cross-sectional imaging.None of the patients demonstrated clinical evidence of neurologicinjury. All 8 patients exhibited significant improvementin their subjective pain profile immediately followingthe procedure and at 1-month follow-up. Responses rangedfrom 60% diminution to complete elimination of the characteristicpain. Each was able to resume many or all of theADL previously limited by pain (returned to their full timejob, resumed self-care activities). Seven of the 8 patientsdemonstrated significantly decreased dependence on, or totalelimination of, support devices. The same proportion ofpatients significantly decreased or eliminated pain medicationintake.
176WednesdayCONCLUSIONIn a series of 8 of 10 consecutive patients referred forsacroplasty, all procedures were technically successful withoutradiologic or neurologic evidence of complication. Allpatients demonstrated significant improvement in theirreported pain pattern and a majority (88-100%) exhibitedsubstantial improvement in the remaining categories of evaluation.This small consecutive series suggests that sacroplastymay be performed safely with significant clinical efficacy.KEY WORDS: Sacroplasty, vertebroplastyPaper 233 Starting at 4:12 PM, Ending at 4:20 PMSacroplasty: Pain Relief for Osteoporotic SacralInsufficiency Fractures Performed with CT GuidanceChan, R. 1 · Mathis, J. M. 21Harvard Brigham and Women’s Hospital, Boston, MA,2Lewis-Gale Medical Center, Salem, VAPURPOSEDescribe an image-guided injection therapy for sacral insufficiencyfractures related to osteoporosis. We discuss thetherapeutic method, results, and its risks in five patients. Thistherapy quickly releaves the pain associated with these fracturesin a fashion analogous to vertebroplasty.MATERIALS & METHODSInformed consent was obtained prior to the procedure. Allfive patients were positioned prone in a multislice CT scanner.Sterile procedure and moderate sedation were employed.After placing 13 gauge needles into the fracture region, polymethylmethacrylatewas injected in small aliquots whilecement distribution was monitored with CT imaging. Thisallowed even tiny leaks to be detected immediately. Clinicaloutcomes were measured by comparison VAS pain analysisbefore and after the procedure.RESULTSThe procedure was technically successful in all patients. CTscan allowed accurate needle positioning and fine detailanalysis of bone cement distribution. There were no clinicalcomplications and all patients demonstrated a substantialimprovement in their reported pain following the procedure.CONCLUSIONThe injection of polymethylmethacrylate into sacral insufficiencyfractures can result in rapid pain relief. It has beensafe in this small patient sample. CT guidance allowed needlepositioning and cement injection monitoring that seemssuperior to fluoroscopy.KEY WORDS: Sacroplasty, osteoporosis, vertebroplastyThe authors of this work have indicated that they will be discussing/presentingan unapproved or investigative use ofSecore Bone Cement made by Parallax Medical Corp. forSacroplasty.The authors of this work have indicated the following affiliations/disclosures:Stryker Medical Instruments: Medicalconsultant.Paper 234 Starting at 4:20 PM, Ending at 4:25 PMCT-Guided Percutaneous Sacroplasty for a HemorrhagicMetastatic TumorUemura, A. · Matsusako, M. · Numaguchi, Y. · Oka, M. ·Niinami, C.St. Luke’s International HospitalTokyo, JAPANPURPOSEPercutaneous vertebroplasty has been used for the treatmentof osteoporotic fractures and metastatic tumors of the vertebralbodies (1-3). Percutaneous sacroplasty for insufficiencyfractures by applying the vertebroplasty technique wasreported recently (4). The purpose of this presentation is toreport a new clinical application of CT-guided percutaneoussacroplasty with polymethylmethacrylate (PMMA) and n-BCA (n-butyl cyanoacrylate) injection for a hemorrhagicmetastasis of the sacrum.MATERIALS & METHODSA 76-year-old male with hepatocellular carcinoma presentedwith unbearable left low back pain. Preoperative MR imagingrevealed a large osteolytic tumor in the left sacrum,although a small osteolytic lesion was noted also in the rightsacrum. Percutaneous sacroplasty was requested because offailure of narcotics, radiotherapy, transcatheter arterialembolization, and local n-BCA injection.RESULTSNeedle placement in the sacrum was performed by using CTguidance. During the procedure a large amount of bleedingwas noted through the needle and n-BCA was injected tocontrol the bleeding. Then we injected 7 ml of the PMMAcement and barium powder mixture. Postoperative CT confirmedcement distribution within the left sacral tumor. Nocomplication occurred. Pain relief was apparent by day 4after the procedure and the pain had completely gone by day10. His general activities ofdaily living much improved, andpain relief had been sustained. However, 3 months after theprocedure he complained of severe right low back painwhich was different from the previous pain. Follow-up MRimaging showed decrease in size of the left sacral metastasis,but the growth of the right sacral metastasis was noted. CTguidedsacroplasty to right sacral metastasis was requested
again. The subsequent sacroplasty using 3 ml of PMMA wasperformed without n-BCA injection because of little amountof bleeding. Again, the pain had diminished greatly by day 3after the procedure, and he became ambulatory with a walkerat day 48. MR imaging showed slight interval decrease intumor size bilaterally.177MATERIALS & METHODSWe reviewed serial contrast-enhanced CT studies of thechest and abdomen as well as MR imaging of the thoracicspine in a trauma patient and correlated the findings with theclinical progress of the patient.RESULTSIn this case there was a direct correlation between the onsetof lower extremity paralysis, extensive edema involving thoracicspinal cord, and engorgement of the hemiazygos(arrow in Figure), and, consequently, perimedullary veins.High grade obstruction of the left brachiocephalic vein in theupper mediastinum (arrowhead in Figure) that led to the retrogradevenous hypertension was caused by a traumatichematoma. Gradual normalization of venous flow also correlatedwell with neurologic recovery of the patient.CONCLUSIONPercutaneous sacroplasty with PMMA was thought to have arole to control tumor growth and relieve pain. Local n-BCAinjection controlled bleeding effectively during the procedureand seems to have an additional role to control thegrowth of highly vascular metastatic tumors.REFERENCES1. Kallmes DF, Jensen ME. Percutaneous Vertebroplasty.Radiology 2003;229:27-362. Evans AJ, Jensen ME, Kip KE, et al. Vertebral CompressionFractures: Pain Reduction and Improvement in FunctionalMobility after Percutaneous PolymethylmethacrylateVertebroplasty—Retrospective Report of 245 Cases.Radiology 2003;226:366-3723. Weill A, Chiras J, Simon JM, et al. Spinal Metastases:Indications for and Results of Percutaneous Injection ofAcrylic Surgical Cement. Radiology 1996;199:241-2474. Pommersheim W, Huang-Hellinger F, Baker M, Morris P.Sacroplasty: A Treatment for Sacral Insufficiency Fractures.AJNR Am J Neuroradiol 2003;24:1003-1007KEY WORDS: Sacroplasty, CT guidance, metastasisPaper 235 Starting at 4:25 PM, Ending at 4:30 PMTransient Traumatic Spinal Venous HypertensionAuler, M. · Al-Okaili, R. · Rumboldt, Z.Medical University of South CarolinaCharleston, SCPURPOSEThe cause of a potentially reversible myelopathy in patientswith spinal dural arteriovenous fistulae is considered to beperimedullary venous congestion and hypertension. Theobjective of this report is to demonstrate that a reversiblemyelopathy may be secondary to venous hypertension as aresult of a traumatic downstream obstruction.Figure is a coronal reconstruction of a CT angiogram of thechest and abdomen.CONCLUSIONThis case demonstrates how venous obstruction can lead tospinal venous hypertension, which than causes neurologicdeficits. Furthermore, relief of the obstruction correlatesdirectly with the resolution of the myelopathy. The recognitionof this entity and strategies to mitigate venous hypertensionshould be considered in trauma patients with neurologicdeficits. This case confirms the role of venous hypertensionin development of myelopathy.KEY WORDS: Venous hypertension, myelopathy, traumaWednesday
178Wednesday Afternoon3:00 PM - 4:30 PMRoom 602 - 603Wednesday Afternoon4:40 PM - 6:10 PMBallroom 6 AWednesday(45) ELC Workshop C: ImageManipulation with PhotoshopWednesday Afternoon4:40 PM - 5:10 PMRoom 606 - 609⎯ Richard M. Berger, MD(46) ELC Lecture G: Capturing andUsing Image Files⎯ Richard H. Wiggins, III, MD(47) Spinal Vascular Imaging (ASSR)(47a) Overview of Vascular Neuroanatomy of theSpine⎯ F. Reed Murtagh, MD(47b) Contrast-Enhanced MR Angiography ofSpinal Vessels and Vascular Disease⎯ Spyros Kollias, MD(47c) Elliptic-Centric MR Angiography of SpinalVascular Lesions⎯ Richard I. Farb, MD, FRCPC(47d) 3D Digital Subtraction Angiography and theEndovascular Approach to Spinal VascularDisease⎯ Ajay K. Wakhloo, MD, PhD(47e) DiscussionModerators:Brian C. Bowen, MD, PhDGregg H Zoarski, MDOverview of Vascular Neuroanatomy of the SpineF. Reed Murtagh, MDPRESENTATION SUMMARYThe blood supply of each spinal cord segment includes theanterior spinal artery and two posterior spinal arteries, all ofwhich run the full length of the cord. The anterior spinalartery features branches that penetrate the gray matter via theanterior ventral median fissure and supply most of the anterior2/3 of the cross-sectional area of the cord segments.Paired posterior spinal arteries bilaterally run near the dorsalroot entry zones and supply the dorsal white matter and dorsalhorns through various small sulci. Major features of thevasculature of the spinal cord are extensive anastamosis atall levels, forming the pail plexus. The anterior and posteriorvertebral arteries are themselves formed by branches ofthe vertebral arteries originating near the level of the foramenmagnum. Two anterior spinal arteries ventrally arisefrom the vertebrals and then fuse into a single anterior spinalartery as they course caudally along the anterior surface ofthe cord. This longitudinal vessel runs the entire length of thecord down to the conus medularis with contributions and
anastamoses along the way via branches from the thoracicand abdominal aorta called radicular arteries. One of theseradicular arteries is nearly always dominant, relatively constant,arising usually on the left side at about the T12 vertebralbody level, features a hairpin turn cephalad, and is designatedthe Artery of Adamkiwitz. It alone may supply up toas much as the caudal 2/3 of the cord. Each vertebral artery,or the posterior-inferior cerebellar artery, also gives rise dorsallyto paired posterior spinal arteries which run caudad thelength of the cord, freqently anastamosing, as previouslydescribed.179REFERENCES1. Binkert CA, Kollias SS, Valavanis A. Spinal Cord VascularDisease: Characterization with Fast Three-DimensionalContrast-Enhanced MR Angiography. AJNR Am JNeuroradiol 1999;20:1785-1793. Editorial by Bowen BC, in thesame issue:1773-17742. Bowen BC, Pattany PM. MR Angiography of the Spine. MagnReson Clin North Am 1998;165-1783. Mascalchi M, Cossotini M, Ferrito G, et al. Contrast-EnhancedTime-Resolved MR Angiography of Spinal VascularMalformations. J Comput Assist Tomogr 1999;23:341-3454. Berenstein A, Lasjaunias P. Spine and Spinal Cord VascularLesions. In: Surgical Neuroangiography New York: Springer; 1992Contrast-Enhanced MR Angiography of Spinal Vesselsand Vascular DiseaseSpyros Kollias, MDLEARNING OBJECTIVESUpon completion of this session, participants will be able to:1) Asses the role and limitations of spinal MR angiographyfor guiding clinical management in patients with suspectedvascular pathology of the spinal cord. 2) Distinguishingangioarchitectural features of spinal dural arteriovenous fistulasand spinal cord arteriovenous malformations.3) Reviw and summarize the data acquisition technique andpostprocessing algorithms of contrast-enhanced spinal MRangiography.PRESENTATION SUMMARYNoninvasive characterization of spinal vascular lesions isessential for guiding clinical management. The feasibility ofMR Angiography (MRA) for depiction of normal spinal vesselsand its role in the evaluation of patients with spinal vascularpathology will be addressed. Emphasis will be on theuse of a fast three-dimensional contrast-enhanced MRAsequence for the characterization of spinal vascular lesionsand for identification and accurate localization of arterialfeeders and venous drainage. The technique, imaging protocol,and postprocessing algorithm of MRA data will bereviewed briefly. The added value of MRA in differentiatingbetween spinal cord arteriovenous malformations(SCAVMs) and spinal dural arteriovenous fistulas (SDAVFs)will be emphasized. Application to the properative evaluationof spinal vascular tumors (hemangioblastomas and vascularteratomas) also will be covered. The accuracy and limitationsof the method for detection of the millimeter-sizedintradural vessels (in particular of the artery ofAdamkiewicz) and for differentiating abnormal from normalvessels in comparison with that of digital subtraction angiography(DSA) will be discussed. Contrast-enhanced spinalMRA provides diagnostic information in patients with suspectedspinal vascular pathology. It presently is used routinelyas a screening method for suspected vascular malformations,for planning of endovascular treatment, and as anoninvasive method for follow-up evaluation after treatment.Further improvements in spatial and temporal resolutionof the technique promise increased diagnostic yield.Elliptic-Centric MR Angiography of Spinal VascularLesionsRichard I. Farb, MD, FRCPCLEARNING OBJECTIVESUpon completion of this session, participants will be able to:1) Discuss the principles of gadolinium enhanced Elliptic-Centric MRA of the spine2) Define the limitations of gad MRA today and where it willlikely improve in the futurePRESENTATION SUMMARYThe ability to image spinal vascular pathology has improvedsubstantially over the last several years owing to improvedtechniques of CT and MR angiography. The advent of "firstpass" gadolinium-enhanced MR angiography has enhancedour ability to confirm the diagnosis and identify the feedingarteries of spinal arteriovenous malformations. Nowhere hasthis ability proved more useful than in the arena of spinaldural arteriovenous fistula (AVF). Our experience using thetechnique of autotriggered elliptic centric ordered threedimensionalgadolinium-enhanced MR angiography(ATECO MRA) for the evaluation of SDAVF as well asother spinal vascular lesions will be reviewed. The advantagesas well as limitations of this technique will be emphasized.In particular, the most common causes for SDAVFlocalization failure at MRA will be addressed. Recent refinementsof our spinal MRA technique include improved targetingof the region of interest allowing for an MRA acquisitionwith a smaller field of view. The potential for improvementsin coil technology as well as the application of 3 Timaging to improve spinal MRA will be reviewed.REFERENCES1. Farb RI, Kim J, Willinsky RA, et al. Spinal DuralArteriovenous Fistula Localization with a Technique ofFirst-Pass Gadolinium-Enhanced MR Angiography: InitialExperience. Radiology 2002;222:843-8502. Takase K, Sawamura Y, Igarashi K, et al. Demonstration of theArtery of Adamkiewicz at Multi-Detector Row Helical CT.Radiology 2002;223:39-453. Binkert CA, Kollias SS, Valavanis A. Spinal Cord VascularDisease: Characterization with Fast Three-DimensionalContrast-Enhanced MR Angiography. AJNR Am JNeuroradiol 1999;20:1785-17934. Saraf-Lavi E, Bowen BC, Quencer RM, et al. Detection ofSpinal Dural Arteriovenous Fistulae with MR Imaging andContrast-Enhanced MR Angiography: Sensitivity,Specificity, and Prediction of Vertebral Level. AJNR Am JNeuroradiol 2002;23:858-867Wednesday
Wednesday3D Digital Subtraction Angiography and theEndovascular Approach to Spinal Vascular DiseaseAjay K. Wakhloo, MD, PhDLEARNING OBJECTIVESUpon completion of this session, participants will be able to:1) Assess the value and limitations of 3D angiography forspinal vascular disease2) Classify spinal vascular disease3) Illustrate therapeutic approach to spinal vascular diseasePRESENTATION SUMMARYThree-dimensional (3D) angiography is highly effective indifferentiating various types of spinal arteriovenous malformations(SAVMs) (e.g., intramedullary lesions from perimedullarymalformations). Various 3D angiography displaysare currently available: 2D cross-sections (MIP), 3Dstereoscopic view, shaded surface display (SSD), fly through(virtual endoscopy), and transparent (glass) view, all ofwhich may detect substructures of the malformation such asarterial or venous aneurysms and their relationship to theentire lesion. We can use 3D angiography to delineate theorigin of AVM feeding vessels, the artery of interest from themain artery (e.g., the vertebral artery, intercostal or lumbararteries), and vessel tortuosity to clarify anatomical ambiguity.This helps to find the appropriate angiographic views(angle) for the endovascular approach and reduce the fluoroscopytime, the amount of contrast material, the procedurelength, and finally the risk of endovascular complications. Ifsurgery is planned, 3D angiography helps to determine therelationship between the malformation and its surroundingsoft tissue structures. In our experience, 3D angiographydoes not lead to complications, but on conscious patients,pain sensation may be experienced due to the increasedamount of contrast material used. Unlike in aneurysms of thecerebrovascular system, the use of 3D angiography in spinalvascular malformations is limited by the spatial resolutionand the lack of temporal information. However, 3D angiographyobtained via superselective contrast injection of AVMfeeding arteries may overcome some of the limitations.Potential pitfalls include incomplete filling of vascular structures,inhomogeneous contrast distribution, local flow irregularities,and motion artifacts, which may mimic vessel wallirregularities and pathology.Discussion180Wednesday Afternoon4:40 PM - 6:10 PMBallroom 6 B/C(48) Advanced Imaging Seminar -Advanced MR and MR Spectroscopy(48a) An Overview of High vs Low Field Imaging⎯ Timothy P.L. Roberts, PhD(48b) Basics MR Spectroscopy and ClinicalApplications⎯ Jill V. Hunter, MD(48c) Parallel Imaging in Neuroradiology⎯ Christiane K. Kuhl, PhD(48d) Advanced MR Spectroscopic ImagingTechniques⎯ Ulrike Dydak, PhDModerator:Timothy P.L. Roberts, PhDHoward A. Rowley, MDAn Overview of High vs Low Field ImagingTimothy P.L. Roberts, PhDLEARNING OBJECTIVESUpon completion of this session, participants will be able to:1) Interpret the basic SNR motivation for high field2) Evaluate the increase in T1 at high field3) Evaluate the shortening of T2* at high field4) Interpret the increasing spectral separation at high field5) Examine applications that BENEFIT from combinationsof the above- e.g. arterial spin labeling, bolus tracking perfusionand 3D MRSI6) Analyze the limitations of additional RF power depositionat high field7) Examine the synergistic role of parallel imaging (SENSE,ASSET, iPAT) at higher field strengthsPRESENTATION SUMMARYWe are witnessing a major trend in MR imaging - namely,the clinical realization of high field (3 T) systems as additionsto, or replacements for, existing 1.5 T installations.There are a number of features of higher field imaging thatare worth consideration in attempting to achieve the hopedforbenefits associated with increasing field strength.Furthermore, there are several situations, where a combina-
tion of high field features offers "super-additive" advantage.On the other hand, there exist a number of potential drawbacks,that must be recognized and avoided in order not tolose the advantages high field imaging offers.Fundamentally, the appeal of higher field MR imaging isdriven by basic spin physics (Boltzmann statistics) whichpredicts that the "signal" contribution to the collected dataincreases approximately as the square of the field strength,while the "noise" increases approximately linearly - in a nutshell,(potential) signal-to-noise ratio increases approximatelylinearly with field strength - doubling from 1.5 T to 3 T.However, a number of other issues are affected by increasingfield strength - including the general lengthening (and convergence)of tissue T1s, the shortening of T2*, increasedspectral separation, and increased RF power deposition. Thismeans that protocols must be reevaluated on making thetransition from 1.5 T to 3 T. Given the potential increase inSNR offered by higher field MR imaging, a few housekeepingdecisions remain: what to do with the extra potentialSNR? Four conceptual options are offered: Keep it - betterSNR. Spend it - spatial or temporal resolution (or patientcomfort). Invest it - combine with T1 lengthening, etc. tofind "super-additive" benefits. Waste it - ignore T2* shortening,SAR limits, etc. These will be discussed in the contextof improving image quality, reducing scan times to belowphysiologically critical times, increasing tag persistence inarterial spin labeling, reducing contrast agent dose in Gdperfusionstudies, reducing TE (reducing magnetic susceptibility"artifact") in Gd-perfusion studies, additional resolvedresonances in magnetic resonance spectroscopy (MRS) andSAR-based limitations to fast spin-echo, true FISP (FIESTA,bFFE) and multislice extent. Finally the natural partner tohigher field imaging - parallel imaging with multiple RFcoils, using the principles of sensitivity encoding - will bediscussed in its synergistic capacity offering possible solutionsto some of the drawbacks of high field (e.g., by reducingthe number of RF pulses needed, ameliorating the SARconcern), while itself benefiting from the increased SNR(compensating for one of the main limitations of parallelimaging).Disclosure: The author of this presentation has indicated anaffiliation with GE Medical Systems: Research grant.Basics MR Spectroscopy and Clinical ApplicationsJill V. Hunter, MD181(B0). It should be noted that shimming changes peak heightand width but not the peak area. The peak area under thecurve of the resulting spectra is a measurement of the numberof spins. The spectrum that is seen is a frequency distributionof the nuclei in the sample and 1H MRS can be considereda histogram of the protons within different metaboliteswith different precession frequencies. Different acquisitionand localization strategies at 1.5 T, chemical shift, andJ-coupling will be discussed as well as quantification inaddition to brief mention of other nuclei. The six mostimportant metabolites demonstrable in the brain using 1HMRS, reading from right to left (Figure), are: Lactate/lipid(Lac) 1.33-1.5 ppm (low levels in normal brains); N-acetylaspartate (NAA) 2.02 ppm; Glutamine/glutamate (Glu/Gln)2.2-2.4 ppm; Creatine/phosphocreatine (Cr/PCr) 3.02 ppm;Choline (Cho) 3.22 ppm; Myo-inositol (mI) 3.56 ppm. 1HMRS acquired at TE = 31 ms from the basal ganglia of achild with Canavan disease (upper), and an age-matchedcontrol (lower). NAA is a marker of neuronal and axonalintegrity. Choline is a marker of cell membrane turnover.Creatine acts as a marker for high-energy products. Lactateis an indicator of anaerobic metabolism and normally may bepresent transiently at birth. Myo-inositol is considered to bea glial marker and is an osmolyte. Clinical applications to beconsidered and illustrated will include diagnosis and treatmentof posterior fossa and supratentorial tumors, epilepsyand seizure activity, metabolic disorders, traumatic braininjury - early and late, stroke to include hypoxic-ischemicinjury, and the investigation of developmental delay. Therewill be discussion of the value added of 1H MRS in the clinicalsetting and its use in terms of predicting outcomes.Parallel Imaging in NeuroradiologyChristiane K. Kuhl, PhDDr. Kuhl, Associate Professor of Radiology andNeuroradiology and Head of the MRI Division at theUniversity of Bonn, completed her training at the Universityof Bonn beginning with her residency in Radiology in 1996.In 1997, she completed a residency in neurosurgery and in1998 a fellowship in Breast Imaging. She achieved herBoard certifiction as a neuroradiologist in 2002. Dr. Kuhl isa member of numerous professional societies and serves asa reviewer for seven international radiology journals. She ison the Editorial Board of European Radiology, RoFo, and isAssociate Editor of Radiology.WednesdayLEARNING OBJECTIVESUpon completion of this session, participants will be able to:1) Review basic acquisition techniques of 1H MRS2) Recognize the six most important metabolites in the brain3) Define the clinical applications and correct interpretationof 1H MRS in both children and adultsPRESENTATION SUMMARYProton MR spectroscopy, (1H MRS), can extract informationabout the chemical environment of hydrogen nuclei in aqualitative and a quantitative fashion. Data analysis in MRspectroscopy is performed by converting time-domain datato frequency domain spectra using Fourier transform. Thechemical shift of a peak in a spectrum in parts per million(ppm), is independent of the strength of the magnetic fieldLEARNING OBJECTIVESUpon completion of this session, participants will be able to:1) Define how parallel imaging can be used in practice2) Assess how parallel imaging can help reduce acquisitiontime3) Describe how parallel imaging can help reduce susceptibilityeffects4) Identify pitfalls or technical disadvantages of parallelimagingPRESENTATION SUMMARYFor optimum detection and classification of disease states,virtually all clinical MR imaging applications in the field ofneuroscience require both short acquisition times and a highspatial resolution. Up to now, increasing gradient strength
Wednesdayhas been the only strategy to meet the increasing demands ofadvanced diagnostic imaging applications. Yet, this strategyis limited by physical, economical, and medical considerations:Increasing gradient strength is technically difficult, itis associated with significant hardware costs, and goes alongwith the risk to induce unwanted side effects such as peripheralneuro-stimulation. With the advent of parallel imagingtechniques like SENSE, this dilemma can be overcome. Inparallel imaging, phase encoding steps are replaced byexploiting the spatial information that is inherent to the spatiallyvariable sensitivity of an array of surface coils. Severaldifferent techniques for parallel imaging have been proposedby different MR system vendors (ASSET, IPAT, SENSE);they currently allow a reduction of phase encoding steps bya reduction factor of 2 to 6 (and recently even higher). TheSENSE-mediated reduction of acquisition time can be tradedfor improved temporal or spatial resolution of any givenpulse sequence, without change of image contrast. In additionto the mere increase of image acquisition speed, thereduction of phase-encoding steps brings about two furtheradvantages that are particularly, but not only, important forhigh field MR imaging: First, in single-shot EPI applicationsthat usually are used for diffusion imaging, diffusion tensorimaging or for functional BOLD-contrast MR studies,SENSE helps to shorten the echo train length in proportionto the reduction factor. The considerably shorter echo trainreduces the accumulation of phase errors during the EPIreadout and, accordingly, reduces susceptibility effects likeimage distortions and blurring. In addition, the shorter echotrain translates into a significantly higher SNR compared tosequentially phase encoding. Second, SENSE helps reduceRF deposition (regular phase encoding requires an RF pulsfor every step) - this proves extremely helpful for high fieldimaging, where, due to the higher specific absorption rate(SAR), most pulse sequences need to be "slowed down" toavoid excessive heating of the patient. Only with parallelimaging like SENSE, the actual high-field SNR advantagecan be exploited fully. Using SENSE is associated with a30% SNR penalty - at 1.5 T, its use therefore is confined toapplications or pulse sequences with high inherent SNR, likeMRA studies. For high field MR imaging, the SNR loss dueto SENSE is not important; in fact, higher reduction factorsbecome clinically feasible, thus contributing to an even higheracquisition speed. For both contrast-enhanced and inflowMR angiography, SENSE helps improve spatial resolutionand anatomical coverage at a given acquisition time.Advanced MR Spectroscopic Imaging TechniquesUlrike Dydak, PhDDr. Ulrike Dydak is project leader for spectroscopy at theInstitute for Biomedical Engineering at the University andSwiss Federal Institute of Technology in Zurich, Switzerland.She received her diploma in physics and mathematics at theUniversity of Vienna, Austria, in 1996. Her Ph.D. workfocused on fast MR spectroscopic imaging of the brain byusing parallel imaging techniques. She was involved in severalclinical studies, investigating metabolic changes in neurologicdisorders such as McLeod syndrome, mitochondrialencephalopathy, acute mountain sickness, or migraine. Shereceived a postgraduate degree in Medical Physics in 2000and her Ph.D. in MRS techniques at the Institute for182Biomedical Engineering, Swiss Federal Institute ofTechnology, Zurich, Switzerland in 2002. In her currentresearch she investigates new MRS techniques that allow thedynamic study of metabolic responses to sensory stimuli orthe possibility of ultra-high resolution whole brain MRSI.She has been teaching on international MR spectroscopycourses for several years, and gives practically orientedspectroscopy training for Philips Medical Systems at clinicalsites. She is a member of several scientific societies (ISMRM,Organization for Human Brain Mapping, Swiss Society forBiomedical Engineering).LEARNING OBJECTIVESUpon completion of this session, participants will be able to:1) Identify advantages of high field strength for MRS inHigher SNR and describe Higher chemical shift differences=> higher spectral separation2) Utilize these advantages for multi spin-echo spectroscopicimaging to trade the higher chemical shift for higher SNRand trade the higher chemical shift for faster acquisitiontimes3) Describe parallel spectroscopic imaging and its capabilitiesand limitations 4) Distinguish the combination of paralleltechniques with the advantages of higher field strengthand multi spin-echo MRSI can achieve ultra-fast MRSI aswell as fast whole brain MRSIPRESENTATION SUMMARYMR spectroscopic imaging (MRSI) can benefit from bothhigh field strength and parallel imaging techniques. Thispresentation will discuss the advantages of these two aspectsand how a combination of parallel imaging with high fieldstrength may even allow for sub-minute high-resolutionspectroscopic imaging or 3D MRSI in a clinically reasonablescan time. Spectroscopy gains in multiple ways fromincreased field strength: Besides a crucial increase in SNR,the chemical shift difference between different metabolitesincreases with the field strength, allowing for better separationand identification of metabolites. Importantly, thisincreased chemical shift difference may be used to obtainhigher SNR or additional speed in advanced techniques suchas multi spin-echo spectroscopic imaging (TSI) (similar toRARE, FSE, or TSE in imaging). This is because in TSI theecho spacing determines the achievable spectral resolutionas well as the maximum tolerable number of echoes in theecho train. A field strength of 3 T enables twofold shorterecho spacings and thus longer echo trains while maintainingthe same spectral separation between metabolites (in ppm) asat 1.5 T. By using up to six spin-echoes in the echo train,acquisition times for MRSI are reduced significantly.Examples for high resolution single slice MRSI data (32 x 32voxels) acquired in 5 minutes, as well as for whole brainacquisitions (20 x 20 voxels x 6 slices) in 11 minutes will bediscussed. Another new approach to achieve high anatomicalcoverage with high spatial and spectral resolution in MRSIwithin sensible scan times is to use the parallel imaging techniqueof SENSE. Two-dimensional MRSI may profit from aSENSE reduction factor in two dimensions and thus easilyachieve scan time reductions of a factor of four. It will beshown how important high spatial resolution in all three spatialdimensions may be in clinical MRSI cases and how such3D SENSE-MRSI acquisitions (24 x 24 x 8 slices) may beobtained within 14 minutes. The flexibility of parallel imagingtechniques allows the combination of the two methods,enabling sub-minute scan times for single slice or 3 minute
scan times for 6 slice MRSI scans with high spatial resolution.This in return allows consideration of dynamic or functionalMRSI experiments with good temporal resolution, orthe imaging of dynamic metabolic processes covering thewhole brain in the future.REFERENCES1. Hetherington HP, Pan JW, Chu WJ, et al. Biological andClinical MRS at Ultra-High Field. NMR Biomed 1997;10:360-3712. Duyn JH, Moonen CT. Fast Proton Spectroscopic Imaging ofHuman Brain Using Multiple Spin-Echoes. Magn Reson Med1993;30:409-4143. Dydak U, Weiger M, Pruessmann KP, et al. Sensitivity-Encoded Spectroscopic Imaging. Magn Reson Med2001;46:713-722Disclosure: The author of this presentation has indicated thefollowing affiliations/disclosures: 1. Gyrotools Ltd.:Ownership or partnership; 2. Philips Medical Systems:Consulting fees.183Wednesday Afternoon5:10 PM - 5:40 PMRoom 606 - 609(49) ELC Lecture H: Synopsis ofScanners: Film, Flatbed, and SlidesWednesday⎯ Gary M. Miller, MD⎯ Hervey D. Segall, MDWednesday Afternoon5:40 PM - 6:10 PMRoom 606 - 609(50) ELC Roundtable: Q & A withToday’s Speakers⎯ Richard M. Berger, MD⎯ Gary M. Miller, MD⎯ Hervey D. Segall, MD⎯ Richard H. Wiggins, III, MD
WednesdayNotes:
185NOTE ABOUT SCANNED IMAGES: Scanned images are included in theproceedings book. Some submitted images were reduced during the printing process, therebydecreasing clarity. The images as originally submitted can be viewed within the abstract on the<strong>ASNR</strong> website at www.asnr.org/<strong>2004</strong>.Thursday Morning8:00 AM - 9:30 AMBallroom 6 A(51) Multidetector CT for SpineImaging (ASSR)(51a) Postprocessing and 3D Rendering for Trauma— Diego B. Nunez, Jr., MD, MPH(51b) CT Screening for Cervical Spine Trauma— C. Craig Blackmore, MD, MHS(51c) Degenerative Spine Disease Applications— Jeffrey A. Stone, MD(51d) Multislice Physics and Radiation Safety(51e) Question & Answer SessionModerators:— James M. Kofler, Jr., PhDJeffrey A. Stone, MDDeepak Takhtani, MDPostprocessing and 3D Rendering for TraumaDiego B. Nunez, Jr., MD, MPHLEARNING OBJECTIVESUpon completion of this session, participants will be able to:1) Review the principles and benefits of multidetector CTdata management for implementation of routine multiplanarreformations and interactive 3D volume rendering2) Discuss the clinical advantages of 3D spine imaging andspecific spine injuries that are best assessed using multiplanardisplayPRESENTATION SUMMARYThe role of diagnostic imaging in the evaluation of patientswith suspected spine trauma has undergone significantchanges and has been a topic of continuous revision over thelast decade. CT currently is used as a primary screeningmodality and the introduction of multidetector-row configurationhas allowed for high quality multiplanar reformations(MPR) and 3D image display. New ways of comprehensivereal time evaluation of the spine in trauma patients is nowpossible. The benefits of multidetector CT acquisitionparameters and the advantages of 3D volume rendering (VR)display will be discussed. The implementation of VR and theprocess of moving data from the scanner to the postprocessingworkstation will be summarized. Specific spine injurieswell suited for 2D and 3D imaging display include C1/C2fractures, injuries resulting in translation or rotation, axiallyoriented fractures, articular pillar fractures, and injuriesresulting from axial loading. The unusual fracture patternsfound in elderly patients or in patients with preexisting conditionsalso are optimally assessed using MPR and VR.Interactive rotational review of volume data is performed inall positive cases of spine trauma, and MPR are obtainedroutinely in all cases. This approach allows for accurate andrapid patient assessment, improves surgical planning andenhances our understanding of the mechanism and effects ofinjury.REFERENCES1. Calhoun P, Kuszyc B, Heath D, et al. 3D Volume Rendering ofSpiral CT Data. Radiographics 1999;19:745-7642. Wintermark M, Mouhsine E, Theumann N, et al.Thoracolumbar Spine Fractures in Patients Who HaveSustained Severe Trauma. Radiology 2003;227:681-6893. Pretorius ES, Fishman E. Volume-Rendered 3D Spiral CT.Radiographics 1999;19:1143-1160CT Screening for Cervical Spine TraumaC. Craig Blackmore, MD, MHSC. Craig Blackmore, M.D., M.P.H., Associate Professor ofRadiology at University of Washington is also Codirector,Radiology Health Services Research Section, Core FacultyHarborview Injury Prevention and Research Center. Dr.Blackmore's clinical subspecialty is Emergency and TraumaRadiology and his research interests are as follows. Myresearch goal is to apply the tools of clinical epidemiologyand outcomes research to determine the optimal imaging ofemergency and trauma patients. To date, my research effortshave focused on the early radiologic care of the traumapatient, particularly of the cervical spine and of the pelvis.For each of these issues, I have followed a general approachconsisting of determining the clinical probability that aninjury is present in a given patient, investigating the diagnosticcharacteristics (sensitivity, specificity, and accuracy)of the available diagnostic tests, and then using cost-effectivenessanalysis to determine the optimum imaging strategyfor patients at different probabilities of injury.Thursday
ThursdayLEARNING OBJECTIVESUpon completion of this session, participants will be able to:1) Define an evidence-based imaging approach to the cervicalspine in trauma patients2) Assess the appropriate use of CT for trauma imaging ofthe cervical spine3) Define interpretation pitfalls and pearls in trauma cervicalspine CTPRESENTATION SUMMARYCT scan has supplanted traditional radiography for the initialevaluation of the cervical spine in patients with major trauma.This discussion will focus on the evidence supportingCT of the cervical spine as a primary imaging study.Included will be a discussion of accuracy of imaging, costeffectiveness analysis, and use of clinical prediction rules toidentify appropriate high-risk subjects. There is abundantdata on the accuracy of CT and radiography for excludingfracture in trauma patients. CT demonstrates higher sensitivityand higher specificity, particularly in poly-trauma subjectsat greatest probability of fracture. However, the shorttermresource costs and radiation dosage of CT are higherthan radiography. Therefore determination of appropriateimaging involves use of cost-effectiveness analysis. In balance,cost-effectiveness analysis demonstrates that in appropriatehigh-risk subjects, CT is optimal. The advantage ofCT is based on higher sensitivity resulting in improved outcomefrom fewer missed fractures, and higher specificity,resulting in requirement for fewer additional imaging studies,and less downstream cost. Research also suggests thatprimary use of CT may decrease the time required for emergencyevaluation of the trauma patient. A clinical predictionrule based on mechanism of injury, presence of head injury,and presence of neurologic deficit can be used to identifyappropriate high-risk subjects. There are several importantquestions regarding use of cervical spine CT in traumapatients for which there is still insufficient data to draw firmconclusions. The role of multidetector CT in children is notdefined well. Children carry higher radiosensitivity thanadults and are of substantially lower risk of fractures thanadults from the same mechanism. Therefore, a pediatric subgroup of sufficiently high risk to make CT screening appropriatecannot be identified reliably. Accordingly, we do notuse CT as a primary imaging modality in children. In addition,the elderly remain a diagnostically challenging group.Although the clinical predictors of cervical spine fracture arethe same in the elderly as in other adult patients, the overallrisk of fracture is greater and the ability to predict injuryfrom clinical factors is decreased. Finally, although data arelacking, it is questionable as to whether fractures are detectedas easily on radiography in the elderly as in youngerpatients. Accordingly, CT may have a greater role in elderlypatients. This has not been investigated well. In summary, inselected adult trauma patients of high probability of injury,CT scan is the preferred primary imaging modality for thecervical spine.186Degenerative Spine Disease ApplicationsJeffrey A. Stone, MDLEARNING OBJECTIVESUpon completion of this session, participants will be able to:1) Describe the basic physics and techniques of multidetectorCT and its application to spine imaging2) Identify the unique ways multidetector CT can aid in theevaluation of degenerative spine diseasePRESENTATION SUMMARYChronic neck pain, back pain, and radicular symptoms arefrequent indications for spinal imaging. MR imaging is oftenthe initial cross-sectional imaging modality used to evaluatefor degenerative changes of the spine and neural elementcompression. Often this modality alone is sufficient for diagnosis.CT also is utilized in a subset of patients to evaluatedegenerative bony change and further delineate neural elementcompression particularly after administration ofintrathecal contrast. This presentation will address theadvantages and disadvantages of multidetector CT imagingfor degenerative spine disease as well as imaging parametersbest used for the spinal region. The techniques and addedbenefits of postprocessing reconstruction and 3D renderingusing multidetector CT technology will be discussed; particularlythe benefits of fast scan times and better resolution inthe z-axis. The application of this technology for surgicalplanning, particularly in regards to alignment, instability,and better evaluation of the neural foramen will beaddressed.REFERENCES1. Rydberg J, Buckwalter KA, Caldenmeyer KS, et al.Multisection CT: Scanning Techniques and ClinicalApplications. Radiographics 2000;20:1787-18062. Philipp MO, Funovics MA, Mann FA, et al. Four-ChannelMultidetector CT in Facial Fractures: Do We Need 2 x 0.5Collimation? AJR Am J Roentgenol 2003;180:1707-17133. Buckwalter KA, Rydberg J, Kopecky KK, Crow K, Yang EL.Musculoskeletal Imaging with Multislice CT. AJR Am JRoentgenol 2001;176:979-9864. Hu H, He HD, Foley WD, Fox SH. Four Multidetector-RowHelical CT: Image Quality and Volume Coverage Speed.Radiology 2000;215:55-62
187Multislice Physics and Radiation SafetyJames M. Kofler, Jr., PhDDr. James Kofler received a B.S. degree from the Universityof Wisconsin Madison in nuclear engineering and physics in1987, an M.S. degree in medical physics in 1989, and aPh.D. in medical physics in 2000. He has been employed atthe Mayo Clinic in Rochester, Minnesota since 1989, wherehis areas of responsibility have included radiographic andfluoroscopic imaging, diagnostic ultrasound, CT, and radiationdosimetry. He served as a faculty member of the MayoSchool of Health-Related Sciences from 1993-2000 andbecame an Assistant Professor in Radiological Physics atMayo Medical School in 1998. He also was named anAssociate in the Department of Diagnostic Radiology in1998. Dr. Kofler has several licensed technologies and onepatent.PRESENTATION SUMMARYMultislice CT scanners present the radiologist with a largenumber of possible scan configuration choices, each withimplications for image quality and patient dose. A basicunderstanding of the underlying physics principles and conceptsis essential to determine optimal scan parameters whilemaintaining the diagnostic integrity of the image data.Radiologic risk also should be of primary consideration inprescribing CT examinations. This implies a careful balancingof task-specific image quality requirements (spatial andtemporal resolution, image noise) and radiation dose, both ofwhich are unique to the characteristics of the CT scanner(scanner features, model, and vendor). The first portion ofthis presentation addresses multislice CT technology concepts,with emphasis on the relationship of detector configurationto reconstructed image slice thickness. Advantagesand potential issues of concern regarding multislice CT scannersalso will be discussed. The second portion of this presentationdiscusses quantification of radiation dose in CT aswell as the implications of scanner settings for image qualityand dose. Several dose reduction strategies will be presented.Question & Answer SessionThursday Morning8:00 AM - 9:30 AMBallroom 6 B/C(52) Spinal Vascular Interventions(ASITN)(52a) Imaging(52b) Pathophysiology(52c) TreatmentModerators:ImagingKieran P. J. Murphy, MD— Kieran P. J. Murphy, MD— Jacques E. Dion, MD— Christopher F. Dowd, MDJacques E. Dion, MDPhilip M. Meyers, MDLEARNING OBJECTIVESUpon completion of this session, participants will be able to:1) Define proper spinal vascular imaging techniques2) Identify spinal angiography methodPRESENTATION SUMMARYSpinal vascular malformations are rare and represent approximatelyfour percent of all intraspinal masses. Eighty percentoccur between the ages of 220 to 60. There are fundamentallythree types: spinal dural malformations, intraduralextramedullary, most common in adults, arterial venous malformations/arterialvenous fistula and intramedullary AVMs.Eighty-five percent present with progressive neurologicdeficits and may have a history of back pain associated withprogressive sensory loss or leg weakness. Ten to twenty percentpresent with onset of sudden myelopathy secondary tohemorrhage causing subarachnoid hemorrhage, hematomyeliaor epidural hematoma or spinal watershed infarct. Asignificant number present with foyx alajouanine. Thisoccurs secondary to decompensated venous hypertension.These patients present with a flaccid paralysis with ascendingsensory symptoms. These are usually patients with precedingintramedullary cord signal abnormality who sustainsome insult which further impairs their venous drainage andtips them from compensated venous hypertension to a stateof profound venous stasis and venous hypertension. Spinalangiography should be meticulous and organized. It is criticalto keep a rigorous track of every level studied. The inter-Thursday
Thursdaycostals and lumbar vessels originate in two parallel lines andare symmetrically spaced like a marching troop column. Wevigorously track the gradual shift from left to right of thevessel origins from superior to inferior as they descend downthe aorta. It is important to identify adjacent bony landmarks,as at the adjacent level the vessel origin will again have somerelationship to the preceding bony landmarks. (We do notpass the catheter from side to side at the same level. ) Ourmethod is to study one side and then the other. If we happento obtain imaging from the other side, we will of course takeit at that time. We watch the tip of the catheter, its movement,and its sudden stability when it obtains purchase in the originof a lumbar or intercostals vessel. Only then do we injectsome contrast to identify its position. We do not constantlyflush contrast into the aorta to identify our target. We movethe catheter based on anatomy. It is usually possible to identifybilateral intercostals arteries from T5 to L4. Above T4and below L4, it can be a challenge. It is important to studyrigorously all bronchial vessels, the branches of the subclavianincluding the vertebrals and the pelic vasculature. Wedo not use general anesthesia. We do not, however, allow thecatheter to occlude a segmental vessel with static contrast, asthis causes extreme radicular pain at that level. The vastmajority of abnormal vessels seen on spinal angiography areveins. These to me resemble the appearance of a tangled telephonecord. Rigorous method and control of the data isessential. Review of the images on the consol and pixel shiftingis critical to identify the cords blood supply and venousdrainage. A copy of our spinal angio worksheet on which werecord our runs during the procedure can be downloadedfrom our web site www.brainavm.net.Disclosure: The author of this presentation has indicated anaffiliation with Toshiba Medical Imaging: Research grant.PathophysiologyJacques E. Dion, MD188vein and a corresponding dorsal spinal vein which is thelarger of the two; these subsequently form the coronalvenous plexus, situated on the surface of the cord; theseveins eventually drain through the dura via radicular veins tothe epidural spinal plexus. These veins lack valves, althoughnarrowing at the dural penetration is thought to prevent retrogradevenous flow from the epidural plexus into theintradural compartment. There are several well known theoriesfor symptom development in spinal arteriovenous malformations.The specific spinal AVM types and their hemodynamicsare to be considered when applying these proposedfive mechanisms: 1/ venous hypertension and thrombosis; 2/vascular steal; 3/ subarachnoid and intraparenchymal hemorrhage;4/ arachnoiditis; and 5/ anatomical compression.Venous hypertension has been shown to be an important factorin spinal cord ischemia in both dural AVMs and intraduralAVMs. Vascular steal may cause spinal cord ischemiawhen high flow and low pressure within the AVM shuntblood away from the adjacent normal vasculature. IntraduralAVMs can cause symptoms by this mechanism.Subarachnoid hemorrhage and intramedullary hemorrhageare responsible for the acute onset of symptoms, especiallyin intradural AVMs, because high flow rates and associatedshear stress lead to microscopic endothelial changes ofendothelial hyperplasia in the vessel wall, and the formationof arterial and nidus aneurysms and varices. Hemorrhage canarise from AVM-associated aneurysms and varices, whichcan occur in high flow lesions. Repeated small hemorrhagescan result in arachnoiditis. Finally, anatomical compressionmay result from engorged veins on the spinal cord surface.Spinal cord blood flow is subject to the same autoregulatorymechanisms as those of the brain and spinal AVMs disruptnormal blood flow in many of the same ways that cerebralAVMs do. Dural AVMs are slow flow lesions in which theprimary mechanism is venous hypertension.Intraparenchymal AVMs are high flow lesions and causesymptoms by hemorrhage, arterial steal, and venous hypertension.LEARNING OBJECTIVESUpon completion of this session, participants will be able to:1) Examine the arterial supply to the spinal cord2) Examine the venous drainage of the spinal cord3) List the theories for development of symptoms in spinalAVMs4) Differenciate spinal cord AVMs and spinal dural AVMsPRESENTATION SUMMARYProper understanding of spinal vascular pathophysiologybegins with knowledge of the spinal cord's arterial vascularsupply and its venous drainage. Arterial supply to the spinalcord occurs in most part from the anterior spinal axis/arterythrough penetrating sulcommissural arteries that supply theanterior two thirds to four fifths of the spinal cord, includingthe anterior horn cells, anterior and lateral corticospinaltracts, and anterior and lateral spinothalamic tracts. Thesepenetrating branches supply the majority of the anterior graycolumns and ventral portions of the dorsal gray columns ofneurons. The paired posterior spinal arteries supply the posteriorcolumns and portions of the lateral columns of thespinal cord. Venous drainage of the spinal cord occurs viatwo radially arranged networks. Intraspinal veins travel radiallyinto two drainage pathways: the anterior median spinalTreatmentChristopher F. Dowd, MDLEARNING OBJECTIVESUpon completion of this session, participants will be able to:1) Identify and review the classification, pathophysiology,and imaging findings of vascular lesions of the spinal cord2) Define the role of endovascular therapy in the treatmentof vascular lesions of the spinal cordPRESENTATION SUMMARYSpinal vascular lesions can be divided into two broad categories:vascular shunts (malformations or fistulas) andtumors. The imaging and pathophysiology of these entitieswill be discussed in the preceding lectures. Endovascularapproaches play an important definitive, adjunctive, or palliativetherapeutic role in the treatment of these entities. Thevascular shunt group can be categorized further as spinalarteriovenous malformations (SAVMs), perimedullary arteriovenousfistulas (PAVFs), dural arteriovenous fistulas(SDAVFs), and extradural (epidural or paraspinous) shunts.The endovascular treatment goals for SAVMs and PAVFs aresafe microcatheterization of the feeding spinal artery, elimi-
nation or reduction of the artery-to-vein shunt (using liquidadhesive agents and occasionally particulate agents in thepreoperative setting) and elimination of associatedaneurysms. Dural arteriovenous fistulas usually are eliminatedfully with proper liquid adhesive embolization targetingthe site of the shunt along with the proximal draining veinand distal feeding artery. Extradural shunts may be targetedwith a variety of embolic materials depending on theangioarchitecture of the lesion. The tumor group representsa broad category of lesions. The more vascular tumors (suchas renal cell metastases or hemangioblastomas) are targetedfor preoperative embolization (usually using particulateagents) to reduce intraoperative blood loss, or rarely as primarypalliative procedures without surgery. One must identifyand avoid inadvertent embolization of spinal arteries.Thursday Morning8:00 AM - 9:30 AMRoom 602 - 603(53) ELC Workshop D: WebsiteCreation for the NoviceThursday Morning10:15 AM - 11:45 AMBallroom 6 B/C(54a) Spine: Degenerative DiskDisease and Biomechanics(Scientific Papers 236 - 248)See also Parallel Sessions(54b) Interventional: New Devices(54c) Adult Brain: Neoplasms(54d) Spine: General, Spinal CordModerators:— Richard H. Wiggins, III, MDAlan L. Williams, MD, FACR, MBAJohan W. M. Van Goethem, MD, PhD189Paper 236 Starting at 10:15 AM, Ending at 10:23 AMDiffusion Imaging in Spinal Diskitis and OsteomyelitisSehizadeh, M. · Shimony, J. S.Mallinckrodt Institute of RadiologySt. Louis, MOPURPOSEDiffusion imaging has demonstrated great clinical utility inthe evaluation of the brain; however applications in the spineare in an earlier phase of development. The purpose of thisstudy was to evaluate the use of diffusion imaging in patientswith spinal infection.MATERIALS & METHODSFive patients with spinal diskitis/osteomyelitis were evaluatedwith diffusion-weighted imaging as part of a routine MRexamination of the lower thoracic and lumbar spine. Thegroup included 4 women and 1 man with an age range of 33to 67 years. Three of the infections were at the level of L4/5and the remaining were at T11/12 and L2/3. The examinationswere performed on 1.5 T Siemens Symphony andVision scanners (Erlangen, Germany). In 4 of the 5 patientsthe diagnosis was confirmed by biopsy. In the fifth the biopsyshowed chronic fibrosis; however, osteomyelitis was presumedbased on the clinical evaluation and the imaging findings.In addition to the routine MR examination diffusionweightedspin-echo EPI sequence routinely used in brainimaging was adapted and performed in the sagittal plane inthe spine. The sequence parameters were TR/TE 3400/94; b= 0, 500 s/mm2; field of view 25 cm; matrix 128 x 128; slicethickness 5 mm. The diffusion measurements were performedin three orthogonal planes and the apparent diffusioncoefficient (ADC) was calculated using manufacturer-suppliedsoftware. Region of interest (ROI) analysis was performedin the following structures: the infected disks, inadjacent normal disk levels, adjacent areas of infected vertebralbody, and in the cerebral spinal fluid. Regions of interestalso were measured in healthy controls.RESULTSAbsolute ADC values were not meaningful due to significantdifferences in measurements between the two types of scanners.To obtain meaningful measurements ADC values withineach patient were divided by the ADC of cerebral spinalfluid. Areas consistent with abscess formation were seen in 4of the 5 patients based on standard imaging criteria. Theaverage fractional ADC values in all of these areas weregreater than 0.60. No areas of decreased or restricted ADCwere seen. The fractional anisotropy in normal disk materialwas less than 0.52, and this difference was larger in desiccateddisks. All five patients had adjacent vertebral bodyedema consistent with osteomyelitis based on decrease in theT1-signal and an increase in the T2-signal. Only 3 of the 5had measurable increased fractional ADC changes in thebone marrow with an average value of 0.47.Thursday
Thursday190CONCLUSIONAreas of abscess formation in diskitis/osteomyelitis of thespine demonstrate increased diffusion values compared tonormal disk space. This difference is more pronounced incomparison with desiccated disks. Although the presence ofsmall areas of restricted diffusion cannot be excluded, thisfeature was not seen in the current exam. Some adjacentareas of osteomyelitis demonstrated increase in ADC values,but this was not a consistent feature. The quantitative measurementsprovided by diffusion could be a useful adjunctmeasure to standard MR imaging of the infected spine.KEY WORDS: Diskitis, diffusion, spinePaper 237 Starting at 10:23 AM, Ending at 10:31 AMDiffusion Tensor Imaging of the Intervertebral DiskVan Goethem, J. W. M. · Parizel, P. M. · Özsarlak, Ö. · Maes, M.University Hospital AntwerpAntwerp (Edegem), BELGIUMPURPOSETo determine the feasibility and the value of diffusion tensorMR imaging of the human intervertebral disk in vivo.MATERIALS & METHODSFifteen patients with low back pain planned for MR imagingof the lumbar spine were examined. In addition to the standardlumbar examination a coronal SE EPI T2-weighted sequenceof the thoracolumbar spine with diffusion sensitivity in 6 differentdirections was acquired. On a separate workstation diffusiontensors were calculated for each voxel in the imagedvolume. Fiber tracking software was optimized to representthese diffusion tensors as more contiguous tubes representingthe preferred water diffusion direction (General HospitalCorporation, USA). Color coding depended on direction ofthe diffusion tensors. The pattern on these color maps was correlatedwith the appearance of the intervertebral disk on theT2-weighted sequence, especially disk signal intensity and thepresence or absence of disk hyperintensity zones (HIZ).RESULTSIn healthy intervertebral disks with normal height and highsignal intensity on T2-weighted images, diffusion in theannulus fibrosus is anisotropic. The modified fiber trackingimages showed a circular pattern, especially at the outer portionof the annulus fibrosus. In degenerated intervertebraldisks this finding was less consistent and in these disks a regularpattern was less often found or even absent.CONCLUSIONDiffusion tensor imaging of the human intervertebral disk ispossible in vivo, using a multidirectional diffusion-sensitiveSE EPI sequence on a conventional MR scanner. In healthydisks the pattern generated out of the calculated diffusiontensors in the intervertebral disks with a modified fibertracking software shows a layered morphology that agreeswith the expected structure of the annulus fibrosus asdemonstrated on light micrographs and diffusion tensionmicroscopy of the normal annulus fibrosus in other studies.In degenerated disks this pattern is disturbed possibly due torestricted diffusion in between the different layers and/or diffusionperpendicular trough defects in these layers disturbingthe normal regular concentric anisotropic pattern.REFERENCES1. Nguyen-minh C, Riley L, Ho KC, Xu R, An H, Haughton VM.Effect of Degeneration of the Intervertebral Disk on theProcess of Diffusion. AJNR Am J Neuroradiol 1997;18(3):435-4422. Hsu EW, Setton LA. Diffusion Tensor Microscopy of theIntervertebral Disc Annulus Fibrosus. Magn Reson Med1999;41(5):992-999KEY WORDS: MR imaging, intervertebral disk, diffusiontensorPaper 238 Starting at 10:31 AM, Ending at 10:39 AMEvaluating Lower Back Pain: Initial Comparison of theClinician’s Impression vs Direct AnatomicalMeasurements on Lumbosacral MR ImagingChoksi, V. R. · Quint, D. · Carlos, R. · Yamakawa, K. · Haig,A.University of Michigan Health SystemAnn Arbor, MIPURPOSETo determine if there is a correlation between clinician’simpression of degree of involvement of different nerve rootsand MR imaging-derived lumbosacral spinal measurementsat the same level.MATERIALS & METHODSOne hundred fourteen volunteers prospectively participatedin the EMG and Back Pain study from August 2001 to April2003. Mean age was 65.6 ± 7.5 years and 41.24% were male.The study group included asymptomatic volunteers, patientswith mechanical back pain, and patients with varying degreeof spinal stenosis. The clinician examined the patients andrated the degree of severity of involvement of different nerveroot levels, using a 5-point ordinal scale from 1 = no diseaseto 5 = very severe disease. After clinician evaluation, eachparticipant underwent noncontrast lumbosacral spine MRimaging which included T1-weighted and T2-weightedimaging in the sagittal and axial planes. A neuroradiologistblinded to the clinical evaluation measured the followingMR parameters at each intervertebral disk level: a) midlineanteroposterior diameter of the spinal canal (CAD), b) crosssectionalarea of the spinal canal (CAA), c) midline anteroposteriordiameter of the thecal sac (TSD), d) cross-sectionalarea of the thecal sac (TSA), e) interfacet distance betweenthe medial osseous margins of each facet joint (IFB), and f)
interfacet distance between the medial joint capsular marginsof each facet joint (IFL). Relationships between the clinician’simpression of degree of involvement at each of thenerve root levels and anatomical MR measurements at thecorresponding level were analyzed using Spearman’s rhocorrelation for ordinal variables. The study was approved bythe institutional review board and informed consent wasobtained.RESULTSNo significant correlation was found between the clinician’simpression of degree of spinal stenosis at L1 and S1 and anyof the MR measurements at the corresponding levels. At L2-3, as the CAD decreased, the clinician’s impression ofdegree of stenosis significantly increased (p < 0.05).No othersignificant relationships were demonstrated at this level. AtL4-5, as IFB and IFL decreased, the clinician’s impression ofdegree of stenosis increased (p < 0.05). A similar inverserelationship was found at L5-S1 for IFB. Different statisticallysignificant parameters and clinician’s impression ofdegree of stenosis are summarized in Table 1.Table 1:Correlation between clinician’s impression of degree of involvementof different nerve rootsL2 L3 L4 L5MRI imaging parameter rho (p- - - -value)Canal AP diameter (CAD) L2/3 -0.189 (0.49) -0.219 (0.02) - -Canal Area (CAA) L4/5 - - - -0.202(0.031)Interfacet distance from the - - -0.227(0.015) -0.234(0.012)bony margin ( IFB) L4/5Interfacet distance from the - - -0.242(0.01) -0.229(0.14)inner ligamentous margin (1FL) L4/5Interfacet distance from the - - - -0.217(0.02)bony margin ( IFB ) L5/S1191MATERIALS & METHODSTen normal volunteers were imaged using high spatial resolutionMR imaging pulse sequences and a phased-array surfacecoil at 1.5 T. High spatial resolution stacked axial T1fast spin-echo (FSE), fat saturated T2 FSE, and (in four volunteers)axial FSEIR sequences were performed from C5through T1. Dorsal root ganglion (DRG), proximal ventralprimary ramus (VPR), and ipsilateral longus colli muscle(LCM) signal intensity was measured bilaterally at all fivecervical levels, and a nerve/muscle signal intensity ratio(N/M) was calculated. The data subsequently were assessedby a statistician.RESULTST1-weighted imaging technique qualitatively demonstratedthe nerve roots within the osseous foramina and adjacentmuscles well, but statistical analysis demonstrated significantdifferences between sides (left vs right), nerve rootlevel, and DRG vs VPR. Conversely, both fat saturated T2-weighted imaging and FSEIR consistently distinguishedVPR and DRG from bone and foraminal fat well, and wedetected no significant difference between right and leftnerve/muscle signal intensity ratios at each nerve root level.We did detect a statistically significant effect between theVPR and DRG at the same nerve root level and betweeneither the DRG or VPR at different vertebral levels.CONCLUSIONAlthough significant relationships have been describedbetween some MR parameters and clinician’s impression ofdegree of stenosis, there is no single parameter that is consistentlypredictive of the clinician’s impression of degree ofstenosis across all levels.KEY WORDS: Back pain, measurementsThe authors of this work have indicated the following affiliations/disclosures:National Institutes of Health: Grant #5R01 NS41855-02; Coinvestigators, Pl.ThursdayPaper 239 Starting at 10:39 AM, Ending at 10:47 AMHigh Spatial Resolution MR Imaging of Normal CervicalNerve RootsMoore, K. R. 1 · Dailey, A. T. 2 · Buswell, H. 1 · Christofferson,J. 1 · Thiede, S. G. 11University of Utah, Salt Lake City, UT, 2 University ofWashington, Seattle, WAPURPOSE1) Validate a high spatial resolution cervical nerve root MRneurography technique using commercially available MRprotocols and a phased-array surface coil. 2) Develop a normativehigh spatial resolution cervical nerve root imagingdatabase.CONCLUSIONHigh spatial resolution T1-weighted imaging, fat saturatedT2-weighted imaging, and FSEIR techniques produce highquality images that qualitatively demonstrate the cervicalnerve root dorsal root ganglia and ventral primary rami withsubmillimeter in-plane resolution. Fat saturated T2-weightedimaging and FSEIR techniques are most reliable for quantitativeevaluation of the DRG and VPR at the five clinicallydemonstrable cervical levels. These techniques may beapplicable for evaluation of clinically symptomatic cervicalradiculopathy patients, which should be further evaluated infuture prospective studies.KEY WORDS: MR imaging, cervical, neurography
ThursdayPaper 240 Starting at 10:47 AM, Ending at 10:55 AMPreliminary Investigation of High Spatial MR Imaging inSymptomatic Cervical Nerve RootsThiede, S. G. 1 · Dailey, A. T. 2 · Buswell, H. 1 · Moore, K. R. 11University of Utah, Salt Lake City, UT, 2 University ofWashington, Seattle, WAPURPOSECervical radiculopathy is debilitating and a significant causeof missed work or disability. It is frequently difficult to clinicallydiscern which patients would benefit from surgery andwhich from conservative management. Conventional MRimaging is the standard imaging modality used to evaluateradiculopathy, and up to 20% of asymptomatic patients showMR imaging evidence for cervical disk disease (1).Unfortunately, conventional MR imaging may show multilevelcervical spine degenerative disk disease in patientswith single level radiculopathy symptoms, while otherpatients may have radiculopathy symptoms without conventionalMR imaging abnormality. We investigate whetherhigh spatial resolution cervical MR neurography (MRN)using commercially available protocols and surface coil candistinguish symptomatic nerve roots from asymptomaticroots.MATERIALS & METHODSTen symptomatic subjects with clinical single level cervicalradiculopathy were studied prospectively under IRBapproval. Stacked axial T1 fast spin-echo (FSE), fat saturatedT2 FSE weighted imaging (T2WI), and axial FSEIRsequences were performed from C5 to T1, using high spatialresolution MR imaging pulse sequences and a multipurposephased array surface coil on a 1.5 Tesla magnet. Dorsal rootganglion (DRG), proximal ventral ramus (VPR), and ipsilaterallongus colli muscle (LCM) signal intensities were measuredbilaterally at all five cervical levels. A nerve/musclesignal intensity ratio (N/M) and symptomatic nerve toasymptomatic nerve signal intensity ratios (NS/NA) werecalculated.RESULTSWe chose a conservative NS/NA of > 1.5 as abnormal. Usingthis criterion, no abnormal NS/NA was identified at thesymptomatic DRG side/level using either T2 or FSEIRsequences. In the VPR, 4 of 10 patients had increasedNS/NA at the symptomatic side/level (T2WI and FSEIR). Ifan NS/NA of > 1.3 or greater was selected, abnormal NS/NAwere observed in one (FSEIR) and two DRGs (T2WI) and 5(FSEIR) and 4 (T2WI) VPRs, respectively. T-test analysis ofthe NS/NA for patients divided into subgroups of motor, sensory,or deep tendon reflex (DTR) neurologic exam findingsrevealed no statistically significant difference, possibly dueto the small sample size.192CONCLUSIONPreliminary results of high spatial resolution cervical MRimaging using T2 and FSEIR sequences shows qualitativenerve signal abnormalities in patients with single level cervicalspine radiculopathy that correlates with clinical symptoms.Further evaluation with a larger numbers of prospectivelyenrolled subjects is merited.REFERENCES1. Boden SD, McCowin PR, Davis DO, Dina TS, Mark AS, WeiselS. Abnormal Magnetic Resonance Scans of the CervicalSpine in Asymptomatic Subjects. J Bone Joint Surg Am1990;72:1178-1184KEY WORDS: Cervical spine MR neurography, cervicalradiculopathy, MR imagingPaper 241 Starting at 10:55 AM, Ending at 11:03 AMMR Imaging of Lumbar Spinal Stenosis inAsymptomatic Volunteers: Comparison of Radiologist’sImpression vs Direct Measurement of AnatomicalStructuresChoksi, V. R. · Quint, D. · Yamakawa, K. · Haig, A. J.University of Michigan Health SystemAnn Arbor, MIPURPOSETo determine if there is a correlation between MR imagingderivedlumbosacral spinal measurements and radiologist’simpression of degree of spinal stenosis in asymptomaticindividuals.MATERIALS & METHODSOne hundred fourteen volunteers prospectively participatedin the EMG and Back Pain study from August 2001 to April2003. Thirty-two (age 65.6 ± 7.9 years, 42.4% male) wereasymptomatic based on clinical evaluation and make up thegroup evaluated in this study. Each participant underwentnoncontrast lumbosacral spinal MR imaging including sagittaland axial T1-weighted and T2-weighted scans. A neuroradiologistblinded to the clinical evaluation reviewed the
193MR images and rendered an impression as to the degree ofof spinal stenosis at each level from L1-2 through L5-S1 (0= normal, 1 = mild, 2 = moderate, and 3 = severe).Additional anatomical MR measurements also were made ateach lumbosacral intervertebral disk level: a) midline anteroposteriordiameter of the spinal canal (CAD), b) cross-sectionalarea of the spinal canal (CAA), c) midline anteroposteriordiameter of the thecal sac (TSD), d) cross-sectionalarea of the thecal sac (TSA), e) interfacet distance betweenthe medial osseous margins of each facet joint (IFB), and f)interfacet distance between the medial joint capsular marginsof each facet joint (IFL). Relationships between the radiologist’simpression of degree of stenosis at each lumbosacrallevel and anatomical MR measurements at the correspondinglevel were analyzed using Spearman’s rho correlationfor ordinal variables. The study was approved by the institutionalreview board and informed consent was obtained.RESULTSIn general, the radiologists’ impression of the degree ofstenosis significantly correlated with all anatomical measurementswith the exception of IFL (p < 0.05). In particular,the degree of stenosis was correlated most closely with TSD(mean r = -0.742 , p < 0.05) and TSA (mean r = -0.758, p
Thursday194Paper 243 Starting at 11:11 AM, Ending at 11:19 AM Paper 244 Starting at 11:19 AM, Ending at 11:24 AMAssessing the Normal Cervical Spine Utilizing Real-Time Vertebral Artery Loop Formation Resulting inFluoroscopy: A Pilot StudyCervicobrachial PainRothman, S. L. G. · Go, J. L. · Kim, P. E. · Zee, C. S.University of Southern CaliforniaLos Angeles, CAPURPOSEIt is important occasionally to evaluate the spine’s ability tomove. For the most part, radiologists have been satisfiedwith viewing static images in flexion and extension to see ifthe extremes of motion are normal. It has been demonstratedthat dynamic MR scanning with flexion and extension alsomay be useful. Fluoroscopic analysis of cervical motion wasproposed as a useful modality in 1956 and has seen limiteduse since then. Recently, Hino, et al. have described an elegantbut complex technique for evaluating cervical motionfluoroscopically and have reawakened interest in cervicaldynamics. In recent years video fluoroscopy of the cervicalspine has been adopted by chiropractors as a way of determiningsubtle joint, ligament, and disk injury. In order toevaluate cervical motion it is important to understand what isnormal. It is the purpose of this presentation to demonstratenormal cervical motion on video fluoroscopy and to pointout some of the anatomical variations that are seen fluoroscopicallywhich are misinterpreted as being abnormal. Onecan not define the limits of normal in such a small series butthe basic normal pattern can be identified.MATERIALS & METHODSEight volunteers who had neither a history of trauma or wereexperiencing neck pain were evaluated by videofluoroscopyperformed on a variety of machines. The examination wasperformed in various positions and evaluated motion in severalplanes including: 1) Lateral view - flexion - extension ofthe entire cervical spine; 2) oblique views of both articularprocesses in flexion and extension; 3) frontal view with lateralbending of the lower cervical spine; 4) open mouthviews of the dens with rotation and tilting. Eight satisfactoryexaminations were reviewed by two senior neuroradiologiststo confirm that cervical dynamics were normal.RESULTSFlexion and extension flow in an orderly manner from rostralto caudal. The cranio-cervical junction moves first followedin order by the descending motion segments asdescribed by Hino, et al. As one vertebra moves forward inflexion the anterior and posterior disk margins deform. Theamount of motion of one vertebra on another depends onpatient flexibility and body habitus. On frontal views, the lateralborders of the disk narrow on the concave side of thetilted neck and widen on the convex side. The facet jointsglide upon one another and are seen best in the obliqueviews. The relationship between C1 and C2 is complex. Inthe frontal view any rotation of C1 on C2 may cause anapparent subluxation when none is present.CONCLUSIONIn order to understand the limits of normal motion of the cervicalspine one must study the normal population and understandthe complex anatomical relationships that exist.KEY WORDS: Real-time fluoroscopy, biomechanicsLewandowski, R. J. · Wang, A.William Beaumont HospitalRoyal Oak, MIPURPOSEThe purpose of this presentation is to illustrate the imagingfindings of vertebral artery loop formation as a cause of cervicobrachialpain.MATERIALS & METHODSThis is a review of the imaging studies of two patients diagnosedwith vertebral artery loop formation as the cause oftheir cervical pain and radiculopathy. Radiographs,CT/angiography, and MR imaging/angiography wereobtained and evaluated.RESULTSIn each case, an aberrant course of the vertebral arterythrough an enlarged neural foramina was found. The effectednerve root correlated with the patients’ clinical symptoms.CONCLUSIONThe differential diagnosis for patients presenting with cervicobrachialpain is broad. In patients without diskopathy, anaberrant course of the vertebral artery through the neuralforamina should be suspected. Although nonspecific, radiographsmay reveal enlargement of the effected neuralforamina and CT scans or MR images may demonstrate softtissue fullness at that level. The diagnosis of vertebral arteryloop formation can be confirmed with either CT or MRangiography.KEY WORDS: Vertebral artery loop formation, cervicalradiculopathy, MR angiographyPaper 245 Starting at 11:24 AM, Ending at 11:29 AMAn Unusual Case of Lumbar Epidural Cryptococcomasin a Patient with SarcoidosisWottrich, S. · Bhatia, R. G. · Donovan-Post, J. · Shebert, R.T.University of MiamiMiami, FLPURPOSEPresentation of an unusual case of a patient with systemicsarcoidosis and concomitant Cryptococcus neoformansmeningitis who developed left lower extremity radiculopathysecondary to epidural Cryptococcomas of the lumbarspine.MATERIALS & METHODSThirty-six-year-old HIV negative Caucasian patient withdepressed T-Helper cells with a CD4 cell count of 109/mm3with progressive left lower extremity radiculopathy. A transbronchialbiopsy (TBBX) of right lung apex and a lymphnode biopsy of right femoral node were performed as well asa lumbar puncture with CSF analysis. Patient received con-
trast-enhanced MR imaging of the brain and lumbar spine.Excisional biopsy of the soft tissue lesion at L3/4 was performed.RESULTSRight femoral lymph node and TBBX showed noncaseatinggranulomas consistent with sarcoidosis. CSF Cryptococcalantigen titers (1:512) were positive for Cryptococcus neoformansinfection. MR imaging of the brain demonstratednonenhancing dilated Virchow-robin spaces bilaterally in thebasal ganglia compatible with Cryptococcus inflammation.MR imaging of the lumbar spine demonstrated duralenhancement of the thecal sac as well as leptomeningealenhancement of the nerve roots which appeared clumped.Circumferentially around the thecal sac within the epiduralspace and extending out the bilateral neural foramina fromL1/2 to L4/5 were multilevel enhancing soft tissue lesionswhich were isointense on T1 and T2 . There was no evidenceof osteomyelitis. Excisional biopsy of the neuroforaminallesion at L3/4 showed Cryptococcus infection with extensivefibrosis.195Paper 246 Starting at 11:29 AM, Ending at 11:34 AMCatheter-Induced Granulomas during IntrathecalMorphine AdministrationKaragianis, A. 1 · Walker, M. T. 1 · Futterer, S. F. 1 · Klufas, R. 21Feinberg School of Medicine of Northwestern University,Chicago, IL, 2 Brigham and Women’s Hospital, Boston, MAPURPOSETo describe the imaging characteristics of granulomas thatform at the tip of intrathecal catheters which are used toadminister morphine for pain relief.MATERIALS & METHODSThree patients with intrathecal catheters for morphineadministration developed small masses at the catheter tip.Three patients underwent MR imaging with and withoutcontrast whereas one patient underwent a noncontrast MRimage of the spine. Images were obtained at 1.5 T with T1-and T2-weighted images as well as postcontrast T1-weightedimages in the sagittal and axial planes. The clinical historiesand pathology were reviewed and the imaging characteristicswere tabulated.CONCLUSIONCryptococcus neoformans is a fungus which is ubiquitous innature that usually affects those patients with altered hostdefense mechanisms. Cryptococcus is the most commonfungus to involve the central nervous system in AIDSpatients; however, infection also is associated with othercauses of immunosuppression as well as chronic debilitatingdiseases. The association of sarcoidosis and Cryptococcalinfection has been described well in the literature and is mostlikely the result of a decrease in T-cell-mediated immunity.Specifically, patients with sarcoidosis may have decreasedCD4/CD8 ratios likely due to sequestration of CD4 cellswithin sarcoid granulomas thus predisposing the patient toCryptococcal infection (1). The most common complicationsof Cryptococcal infection in sarcoidosis patients are meningitis,osteomyelitis, and soft tissue abscesses (2). Epiduraland neuroforaminal soft tissue Cryptococcomas of the spineare a rare and unusual manifestation of Cryptococcal infection,especially in the absence of concomitent vertebralosteomyelitis as in this case. It is important to recognize thisassociation between sarcoidosis and Cryptococcus becausethe imaging features of CNS involvement of these two entitiescan overlap leading to the erroneous conclusion of neurosarcoidosis.KEY WORDS: Cryptococcosis, sarcoidosisRESULTSIn three patients, four granulomas formed at the intrathecalcatheter tip during morphine administration. Three of thelesions were intrathecal and rounded in appearance whileone of the lesions was elliptical in shape and inexplicably inthe dorsal epidural space. All lesions were iso- to hyperintenseon T1- and hypointense on T2-weighted sequences.After contrast administration, the predominant pattern wasperipheral enhancement. All four lesions formed at the tip ofthe catheters and some resulted in cord compression andcord signal abnormality. Patient symptomatology includedleg weakness, paresthesias, as well as bowel and bladderdysfunction. At surgery, the granulomas were markedly firmto the touch and some had a bluish-gray coating. The size ofthe lesions varied from 1.0 cm to 2.5 cm. Some of the granulomaswere very adherent to the adjacent nerve roots, makingtotal resection impossible without sacrificing some of thenerve roots. At pathology, the lesions were described asfibrous tissue with granulation tissue and cellular debris. Nomicroorganisms were identified. AFB and fungal cultureswere negative. The etiology of the granulomas is unknownalthough review of the literature suggests that the most likelycause is an inflammatory reaction to the administration ofhigh dose intrathecal morphine. The silastic composition ofthe catheters is not felt to be responsible because this samecatheter is used for intrathecal baclofen administration andno reports of granulomas have been described with theadministration of this agent. However, the endhole morphologyof the catheter may be a contributing factor, possiblyresulting in a high local concentration of morphine.Thursday
Thursday196CONCLUSIONGranulomas may form at the tip of intrathecal catheters usedfor morphine administration. These granulomas can act asspace-occupying lesions that result in cord or cauda equinacompression and cord signal abnormality. If not recognized,a viscious cycle of increasing neurologic symptoms followedby increasing morphine concentrations may ensue. Apatient may complain of more pain only to be treated with amedication that is potentiating the problem. Althoughuncommon, early recognition of this entity is important andwill result in improved patient care.KEY WORDS: Granuloma, catheter, morphinePaper 247 Starting at 11:34 AM, Ending at 11:39 AMPostural Migration of Thickened Redundant NerveRoots through a High-Grade Spinal Stenosis with HipFlexion and Extension: A CT MyelographicDemonstrationRadaideh, M. M. · Walker, M. T. · Russell, E. J.Northwestern Memorial HospitalChicago, ILPURPOSEPatients with high-grade lumbar spinal stenosis occasionallyare observed to have thickened redundant nerve roots(TRNRs) superior to the level of stenosis. The theory behindthis response is vascular compromise and friction neuritisthat leads to swelling and inflammation of the nerve roots. Itfollows that with relief of the stenosis, the nerve roots willdecrease in size. Rarely has the migration of TRNRs beendemonstrated radiographically. The purpose of this report isto illustrate a case of migratory TRNRs on CT myelography(CTM) with hip flexion and extension and correlate thisfinding with the symptomatic relief these patients can getwith postural changes.MATERIALS & METHODSA 56-year-old man presented with neurogenic claudicationincluding low back pain, leg pain and progressive bilaterallower extremity weakness. His symptoms would becomeexcruciating in the upright position and were partiallyrelieved in the recumbent position with the hips flexed.Initial MR imaging demonstrated a high-grade spinal stenosisat L2-3 secondary to a disk bulge, ligamentous thickening,and facet hypertrophic degenerative changes.Immediately superior to the stenosis, a tangle of curvilinearstructures were identified that represented TRNRs. To furtherdefine the stenosis, a CTM was performed. The injectionwas performed in the prone position below the level ofthe stenosis. Midway through the injection the patient experiencedsudden exacerbation of his pain that required intravenousanalgesics. At the conclusion of the injection, thepatient immediately turned to the supine position and flexedhis hips which helped alleviate some of his pain. CTM withthe hips flexed showed the TRNRs below the stenosis. CTMwith the hips extended, showed the TRNRs above the stenosis.A diagnosis of severe spinal stenosis with migratoryTRNRs was made. The patient underwent a decompressivelaminectomy and has made a remarkable recovery.RESULTSFirst described by Verbiest in 1953, TRNRs are the result ofhigh-grade lumbar stenosis. Compression and motion of thenerve roots through the tight stenosis results in edema andinflammation of the leptomeningeal surface which produceselongated, swollen, serpigenous nerve roots. Symptoms are feltto be related to direct compression of the nerve roots, vascularcompromise, and friction neuritis. MR imaging and CTM typicallydemonstrate TRNRs above the level of the stenosis. Inour case, migration of the TRNRs was identified with hip flexionand extension. The patient’s symptoms improved in therecumbent flexed position suggesting that the nerve roots wereless compromised below the level of the stenosis.CONCLUSIONTransient migration of TRNRs through a high-grade lumbarstenosis can occur with postural changes. Patients with neurogenicclaudication secondary to severe lumbar stenosisoften get at least partial symptomatic relief with hip flexionincluding sitting, squatting, and in the recumbent positionwith knees toward the chest. Symptomatic relief may berelated in part to transient decompression of the spinal canaland positioning of the nerve roots below the stenosis.KEY WORDS: Spinal stenosis, cauda equina redundant nerverootsPaper 248 Starting at 11:39 AM, Ending at 11:44 AMRare Complication of Cervical Myelopathy Resulting fromCalcium Pyrophosphate Dihydrate Deposition DiseaseSrinivasan, A. · Belanger, E. · Goyal, M.The Ottawa HospitalOttawa, ON, CANADAPURPOSEWe wish to highlight the rare complication of cervicalmyelopathy resulting from calcium pyrophosphate dihydrate(CPPD) deposition in the cervical spine.
197MATERIALS & METHODSA 86-year-old female patient presented with a 6-month historyof bilateral hand and foot numbness and diffuse weakness.Clinical examination revealed intact cranial nerves anddecreased power in all muscle groups (Grade 3-4) with exaggeratedtendon reflexes. There was also glove and stockingpattern of loss of truncal position, sense, and vibration. CT ofthe cervical spine revealed a large, slightly hyperdense massshowing multiple small calcifications in the anterior epiduralspace from the level of clivus superiorly to the lower third ofC2 vertebra inferiorly. There was erosion of the dorsal portionof the dens with marked compression of the cord at C2level. A subsequent MR image revealed the lesion to be isointenseto muscle on T1- and T2-weighted images. In additionto compression of the cord there were changes of myelomalacia.Posterior decompression was performed and a biopsyof the epidural mass was obtained. The specimen showedrobust calcium pyrophosphate crystal deposition with no evidenceof neoplasm or inflammation.RESULTSCPPD deposition disease isan inflammatory arthropathy thatis defined by the depositionof CPPD crystals in articular andperiarticular structures which leads to characteristic chondrocalcinosis.It can occur independently or in associationwith any of a number of inflammatory or endocrine disorders.This formof crystal-induced arthritis tends to affect theperipheral joints, particularly the knees, ankles, shoulders,wrists, and second and third metacarpophalangeal joints, butinvolvement of the lumbar spine is not uncommon. Cervicalspine disease due to CPPD deposition is, however, rare.There are only a few reported cases in the literature of cervicalmyelopathy resulting from CPPD deposition (1).CONCLUSIONSince the diagnosis can be established preoperatively usingdistinctive imaging features and it is amenable to early surgicalintervention, CPPD deposition disease should be consideredin the differential diagnosis of masses of the craniocervicaljunction (2).REFERENCES1. Fye KH, Weinstein PR, Donald F. Compressive CervicalMyelopathy Due to Calcium Pyrophosphate DihydrateDeposition Disease. Report of a Case and Review of theLiterature. Arch Intern Med 1999;159:189-1932. Zunkeler B, Schelper R, Menezes AH. Periodontoid CalciumPyrophosphate Dihydrate Deposition Disease: “Pseudogout”Mass Lesions of the Craniocervical Junction. J Neurosurg1996;85:803-809KEY WORDS: CPPD, cervical, myelopathyThursday Morning10:15 AM - 11:55 AMBallroom 6 A(54b) Interventional: New Devices(Scientific Papers 249 - 260B)See also Parallel Sessions(54a) Spine: Degenerative Disk Disease andBiomechanics(54c) Adult Brain: Neoplasms(54d) Spine: General, Spinal CordModerators:Joseph M. Eskridge, MDGary R. Duckwiler, MDPaper 249 Starting at 10:15 AM, Ending at 10:23 AMExpandable Hydrogel-Platinum Coils: Indications,Technical Problems, and Complications in the Treatmentof Cerebral AneurysmsFanning, N. F. · Brennan, P. · Thornton, J.Beaumont HospitalDublin, IRELANDPURPOSETo present the initial experience of the use of the hybridhydrogel-platinum coils (HydroCoil, MicroVention, Inc.) inthe treatment of cerebral aneurysms in a single center. Theindications, technical problems, and complications encounteredare defined.MATERIALS & METHODSProspective analysis of 40 patients with 40 cerebralaneurysms treated with 66 HydroCoil devices since they werefirst deployed in June 2003. Cases were evaluated at the timeof coiling as to the indication for HydroCoil insertion, technicalproblems encountered and complications ensued.RESULTSHydroCoil devices were used in a total of 40 of 115 (35%)endovascularly treated cerebral aneurysms. Of note, our last10 deployments were performed in the last 12 patients. Meanage at treatment was 55 years (range 32-76 years) with afemale to male ratio of 28:12. Clinical presentation of thiscohort included, subarachnoid hemorrhage (n = 25), masseffect (n = 3), regrowth of an aneurysm neck following previouscoiling (n = 3), and incidentally found aneurysms (n =9). Indications for deployment can be divided into threemain groups based on aneurysm size: 1) to aid packing oflarge aneurysms (> 10 mm) in combination with detachableplatinum coils (n = 16), 2) to complete coiling of small andmedium sized aneurysms (3-10 mm) after formation of abasket with native platinum coils (n = 21), and 3) as the soleThursday
Thursdaytreatment coil in small aneurysms (2-3 mm) (n = 3).HydroCoil devices led to increased percentage filling of theaneurysm compared to bare platinum coils. HydroCoildevices also facilitated using fewer coils to achieve goodaneurysm occlusion in situations where there was catheterinstability, vasospasm, or the need to preserve a vessel at theneck. Positioning the HydroCoil at the neck of the aneurysmdid not seem to be associated with increased risk of parentvessel compromise. We encountered technical problems in 6HydroCoil deployments (9%). In 3 patients we failed to satisfactorilyposition the HydroCoil in the aneurysm within therecommended 5 minute repositioning time limit. We encounteredthis problem in our first 10 patients and it was overcomeby pretreating the HydroCoil with steam to soften thecoil. Since this procedural modification we have notobserved this difficulty, and it is now a standard part of theprocedure. Other technical problems included, failure totrack the coil through the microcatheter (n = 2), and prematuredetachment of a coil on attempted retrieval (n = 1). Bothof these problems appear to relate to a certain fragility of thecoil due to the unique construction method used. The prematuredetachment of the HydroCoil resulted in herniationof a trail of coil into the middle cerebral artery and a consequentdense hemiparesis in the patient. There were no otherclinical complications.CONCLUSIONWhile HydroCoil devices appear a very promising adjuvantto platinum coils in treatment of cerebral aneurysms, a numberof technical difficulties still need to be overcome in itsdevelopment. The precise role for this coil, whether usedalone or in combination with standard coils, is evolving.Longer follow-up and further development is required.KEY WORDS: Hydrocoil, aneurysmPaper 250 Starting at 10:23 AM, Ending at 10:31 AMFirst Year Single Center Experience with a New NitinolSelf-Expanding Microstent (Neuroform 1 and 2) forCerebrovascular Applications: Technical and Short-Term Outcomes in 72 Stent PlacementsUgurel, M. S. · Beck, M. R. · Chaloupka, J. C. · Lee, S. ·Tejada, J. G. · Hsu, S.University of IowaIowa City, IAPURPOSEWe review our single institutional experience with the newnitinol self-expanding Neuroform (NF) microstent, in anattempt to evaluate the technical and short-term clinical efficacyof this device.198MATERIALS & METHODSOver a 12-month period, N = 72 NF-1 or 2 microstents wereused in N = 63 consecutive cases. Sixty patients were selectedfor treatment with a NF for the following indications: 1.stent-assisted remodeling (SAR) in N = 58 wide neckaneurysms, 2. stent-reconstruction of N = 2 fusiformaneurysms, 3. SAR of N = 1 iatrogenic carotid-cavernousfistula, and iv. SAR of N = 2 pseudoaneurysms/dissectinganeurysms. Several types of coaxial microcatheter techniqueswere utilized for bridging the targeted arterial segment(e.g., conventional and modified exchange, primarycatheterization), and to deploy the stents (e.g., stabilizer, coilpusher, microguidewire).RESULTSWith increasing experience there was substantial improvementin technical efficacy. During our first 31 cases, 61% ofNF deployments were without any technical/clinical complications,whereas in the following 32 cases, the success rateincreased to 94% (overall rate = 87.5%). Only 2 NFs couldnot be deployed owing to tortuous anatomy or inability ofthe catheter/stent to conform to the anatomy. Three NF misdeploymentsnecessitated endovascular snaring to removethe stent from the targeted vasculature; 2/3 snared stentswere retrieved successfully. In another 3 NF misdeployments,successful aneurysm neck bridging was attained bytelescoping a second NF2. A wide range of anatomical sitesof NF placement was possible, including the entire length ofthe internal carotid and basilar artery, anterior communicatingcomplex, M1 and M2 segements of the MCA, and the A3segment of the ACA. Technically adequate packing of coilswas possible in 56/58 (96%) aneurysms after placement ofthe NF. Only one patient (1.7%) developed a serious clinicalcomplication attributable to placement of the stent (delayedsylvian fissure hemorrhage from a presumed exchange guidewire perforation). Six-month follow-up angiographic resultsof this patient population will be provided.CONCLUSIONOur experience with the NF1 and 2 microstents has beenvery favorable overall, although significant technical andclinical difficulties had been encountered initially duringtheir initial use. Clearly, increasing cumulative experience,and recent technological and technical improvements haveresulted in substantially improved technical outcomes thatlikely will translate into improving utility and effectivenessof this device.KEY WORDS: Intracranial aneurysm, self-expanding stent,nitinolThe authors of this work have indicated that they will be discussing/presentingan unapproved or investigative use of: 1.Neuroform stent made by Boston Scientific Co. for cerebrovasculardissection and carotid-cavernous fistula.The authors of this work have indicated the following affiliations/disclosures:1. Boston Scientific Co.: Consultant,Research grant; 2. Cordis-Neurovascular: Consultant,Research grant; 3. Micrus: Consultant, Research grant.
199Paper 251 Starting at 10:31 AM, Ending at 10:39 AM Paper 252 Starting at 10:39 AM, Ending at 10:47 AMInitial In Vivo Experience with a New Electrolytically Angioscopy-Guided Interventions: Initial In Vitro and InDetachable Endovascular Stent System for Small and Vivo EvaluationsTortuous Vessel AnatomyMiskolczi, L. · Wakhloo, A. K.Doerfler, A. R. 1 · Becker, W. 1 · Wanke, I. 1 · Goericke, S. 1 ·Monstadt, H. 2 · Forsting, M. 11University of Essen, Essen, GERMANY, 2 Dendron-MTIBochum, Bochum, GERMANYPURPOSETo assess in vivo the mode of delivery, retrievability, shorttermpatency, and cellular response to a new flexibleendovascular stent system in the rabbit. The stent is designedfor delivery through a microcatheter and is fully retrievablewith electrolytical detachment from a delivery wire.MATERIALS & METHODSWe successfully deployed nine electrolytically detachablestents (range of sizes: 2.5-4 mm diameter, 15-35 mm length)in six straight (carotid) and three angled (subclavian) arteriesof six Chinchilla Bastard rabbits. Serial imaging was performedusing intravenous DSA (IV DSA), contrast-enhancedMRA (CE MRA), time of flight (TOF) MRA, and CTangiography (CTA) 3 days and 4 weeks after stent deployment,respectively. Subjects were sacrificed after 4 weeks (n= 5) and stents were removed for histologic analysis.RESULTSStent deployment was technically feasible in all cases. Afterinitial deployment all stents could be retrieved fully withinthe microcatheter. The detachment zone and the distal stentmarker were visible easily under flouroscopy; final detachmentoccurred reliably in all stents. We observed no proceduralcomplications. Follow-up at 3 days and 4 weeksdemonstrated all arteries patent and not narrowed, confirmedby histology. Noninvasive imaging using IV DSA, MRA,and CTA is feasible in this stent system, demonstrating CTAsuperior to MRA.CONCLUSIONOur results demonstrate that this electrolytically detachablestent is promising as a stent for intracranial arteries since itcan be delivered through microcatheters small enough forintracranial navigation. The stent is fully retrievable, thusproviding greater control than currently available stents. CTangiography was superior to MRA in noninvasive imagingof the stent system and may be useful for follow-up. Furtherangiographic and histologic long-term data are necessary.University of MiamiMiami, FLPURPOSEDuring in vivo imaging sessions with our first angioscopeseveral years ago, we realized the capabilities of directendovascular visualization. After we improved visualizationtimes from a few seconds to several minutes per session, itbecame possible to perform minor interventions whilesimultaneously observing with angioscopy. Our first systemwas not designed for guiding interventions, but our newestand improved angioscope was equipped with a 0.020” centralchannel for this purpose. With the new scope one of ourgoals was to evaluate how angioscopy can guide certainendovascular procedures, even if the technique does notpromise to revolutionize interventional neuroradiology anytime soon.MATERIALS & METHODSOur initial tests were carried out using a 3-French angioscopevia an 8-French balloon-tipped guide catheter, whichallowed a microcatheter to advance on the side of the scopewithin the guide. Our new scope is equipped with a centerchannel through which a microcatheter or other smalldevices can be advanced. In vitro tests were carried out in aplastic aneurysm model. The task was to visualize theaneurysm neck and manipulate the catheter tip and coil loopswhile coiling the aneurysm. In vivo, several tasks were performedwith both the old and the new scopes. A small clotadherent to a freshly deployed stent was removed usingendovascular forceps (Cook). The true lumen of a surgicallydissected common carotid artery was accessed with a microguidewirein order to repair with angioplasty. In vivoaneurysm coiling also was performed using surgically createdcarotid artery sidewall aneurysms in dogs. After successfuldetachment, external manual compression to the neckwas used to change the position of the coil mass to achievepartial protrusion towards the parent vessel. A microguidewirethen was used under visual guidance to manipulatethe coil mass back into the aneurysm by simply applyingforce with the wire tip in the desired direction.Angioscopy-guided stenting of a sidewall aneurysm wasalso attempted using a balloon-expandable device (INX,Medtronic-AVE).ThursdayKEY WORDS: Stent, aneurysm, retrievableRESULTSManipulation is easier and more accurate when performedvia the center channel of the angioscope as opposed to aside-by-side configuration. All tasks except stenting wereperformed successfully. Angioscopy is not well suited forimage-guided stent deployment in the configuration weused, as it makes positioning more complicated. Angioscopyincreased the complexity of coiling procedures only minimally,but it provided valuable feedback on coil position. Wefound that angioscopy improved coil placement at the neckof the aneurysm when compared with fluoroscopy guidance.
Thursday200CONCLUSIONAngioscopy is an excellent tool that provides a unique viewof endovascular procedures, showing details that fluoroscopicguidance misses. Its direct visual feedback may result inbetter outcomes of certain procedures.KEY WORDS: Angioscope, interventionPaper 253 Starting at 10:47 AM, Ending at 10:55 AMEndovascular Retrieval of Errant Platinum Coils duringTreatment of Cerebral Aneurysms Using a Foreign BodyRetrieval DeviceTong, F. C. · Cawley, C. M. · Abruzzo, T. A. · Dion, J. E.Emory University School of MedicineAtlanta, GAPURPOSEDamaged or suboptimally placed embolization coils cancause parent vessel compromise during endovascularaneurysm therapy. Common management strategies includepermanent implantation of the coil, endovascular placementof a stent to pin the coil against the vessel wall, surgicalretrieval, and endovascular retrieval of the coil using a snare.We describe three cases where a new endovascular retrievaldevice (Concentric Medical Retriever) was utilized toretrieve damaged or errant coils in aneurysm embolizationprocedures.MATERIALS & METHODSThree patients undergoing endovascular aneurysmembolization between December 2002 and August 2003required coil retrieval. Patient #1 was a 47-year-old femalewith known occlusion of the right internal carotid artery andsubarachnoid hemorrhage who underwent endovascularembolization of two right posterior cerebral arteryaneurysms of the P1 and P2 segments. The distal aneurysmwas embolized uneventfully. During embolization of theproximal aneurysm, one of the coils unraveled and detachedinto the parent vessel. Further manipulation of the microcathetercaused prolapse of the damaged coil into the rightposterior communicating artery with flow limitation of theright anterior and middle cerebral arteries. An X4 Retrieverwas successfully utilized to remove the damaged coil.Patient #2 was a 59-year-old female undergoing coilembolization of an unruptured left ophthalmic arteryaneurysm. A Boston Scientific Neuroform stent initially wasplaced across the aneurysm neck in the left internal carotidartery. A Microvention Hydrocoil became entangled duringrepositioning and unraveled and fractured as it was beingwithdrawn. An X5 Retriever was deployed and the coil wasremoved. Patient #3 had undergone successful coilembolization of an unruptured right ophthalmic arteryaneurysm and developed a new left pronator drift and mildleft upper extremity weakness during overnight observation.Follow-up angiography demonstrated delayed ejection of aHydrocoil into the left middle cerebral artery with endolumenalthrombus at the bifurcation. An X5 Retriever wasdeployed adjacent to the coil and the coil was removed successfully.RESULTSThe damaged or errant coils were removed entirely in allthree patients. Follow-up angiography demonstratedvasospasm in Patient #2 which subsequently resolved. Therewas no angiographic evidence of subsequent vessel damagein any of the patients. All of the patients remained at theirneurologic baseline immediately following coil retrieval.CONCLUSIONParent vessel compromise from damaged or errant coils canoccur during endovascular aneurysm therapy. TheConcentric Retriever successfully removed coils in all threepatients in which retrieval was attempted. There were nocomplications associated with the retrieval procedures.KEY WORDS: Coil retrieval, aneurysmThe authors of this work have indicated the following affiliations/disclosures:Concentric Medical Corp.: Scientificadvisory board.Paper 254 Starting at 10:55 AM, Ending at 11:03 AMIdiopathic Intracranial Hypertension: PreliminaryExperience of Two Cases Treated by Venous SinusStentingGarg, A. · Gaikwad, S. B. · Mishra, N. K. · Gupta, V.All India Institute of Medical SciencesNew Delhi, INDIAPURPOSEIdiopathic intracranial hypertension (IIH) is a conditioncharacterized by raised intracranial pressure in the absenceof intracranial pathologic findings. The high pressures documentedin the intracranialvenous sinuses in IIH could be theresult of focal stenotic lesions in the lateral sinuses obstructingcranial venous outflow. We report our preliminary experienceof 2 cases of endoluminal venous stent placement as atreatment for IIH.MATERIALS & METHODSWe report 2 patients with IIH who were evaluated for venoussinus disease and treated with endoluminal stent placement inthe stenotic sinus. Case 1: A 35-year-old female presentedwith holocranial, nonthrobbing headache for last 5 yearswhich has aggravated in last 15 days. She also had symptomsof transient visual obscuration and 6 episodes of facial deviationfor last 5 months. On examination, she had advancedbilateral papilledema and left ptosis. Her visual acuity was6/6 in both eyes. The CSF pressure was 250 mm of CSF onlumbar puncture with normal composition. MR examinationshowed empty sella. Postgadolinium MRV showed bilateraltransverse sinuses stenosis. IADSA confirmed bilateral transversesinus stenosis, the right being dominant (Figure 1A).The pressure gradient was 15 mm of Hg (25/10) across thestenosis. Under general anesthesia, an 8-29 mm monorailwallstent was placed across the right transverse sinus stenosis(Figure 1B). The pressure gradient was reduced to 4 mm ofHg (14/10) poststent placement. Repeat CSF showed thepressure of 75 mm of CSF. The patient currently is asymptomaticafter 6-month follow-up. Case 2: A 46-year-old femaleadmitted with 1-year history of right hemicranial headacheswhich had exacerbated since last 1 month. She had visualblurring of left eye for last 4 months. She was diagnosed to
have hypothyroidism 3 years earlier, which was well controlledon drugs. Examination showed bilateral papilledemaand enlarged blind spot in left eye. Her visual acuity was normal.Her thyroid functions were normal. MR images revealedan empty sella. IADSA showed bilateral transverse sinusstenosis, the right being dominant. A 6-17 mm express SDstent placed across the stenosis. Present pressure gradient was21 mm of Hg (30-9), which reduced to 3 mm (16-13) followingstent placement. Postprocedure, the patient’s headachewas reduced markedly.RESULTSIntrasinus pressures were reduced by stenting. Both patientswere rendered asymptomatic.201MATERIALS & METHODSTwenty-eight sidewall aneurysms were created in the carotidarteries of 13 dogs. Using a custom-built fiberoptic device,angioscopic observations were conducted with proximalflow protection and slow saline infusion. Three types of platinumdetachable coils and 2 types of intracranial stents wereevaluated. A total of 33 angioscopic procedures were performedto visualize the following: 11 coiled aneurysms, 16coiled and stented aneurysms, 1 untreated aneurysm; 5aneurysms were observed twice, at 3 and at 6 months. Eightof the angioscopic procedures were done immediately afterdevice implant, the rest at 1-, 3- or 6-month follow-up. Wecompared our findings to histology in nonsurvival cases. Ourangioscope has 8000 imaging fibers, 200 illumination fibers,2-way steering at the tip, a 6-French outer diameter and a0.020” center channel.CONCLUSIONThe importance of venous sinus disease in the etiologyof IIHis probably underestimated. Lateral sinus stenting showspromise as an alternative treatment to neurosurgical intervention.KEY WORDS: Idiopathic intracranial hypertension, venoussinus, stentingPaper 255 Starting at 11:03 AM, Ending at 11:11 AMIn Vivo Evaluation of Endovascular Devices: A NewApplication of AngioscopyMiskolczi, L. · Gounis, M. J. · Onizuka, M. · Perlow, A. ·Cesar, L. · Lieber, B. B. · Wakhloo, A. K.University of MiamiMiami, FLPURPOSEAs implantable devices get smaller, it becomes more difficultto get reliable information of their behavior in vivo. Thegold standard method is histology, which requires a terminalprocedure. After positive initial experiences with angioscopy- a minimally invasive technique, reported at the WFITNmeeting in Recife, Brazil - we decided to further pursue thisapproach. Our goal is to have angioscopy accepted as a standardmethod for in vivo testing of endovascular devices.RESULTSAll 33 angioscopic procedures were successful, although wehad initial difficulties with proximal flow control in 8 cases.In 2 of the 11 aneurysms, angioscopy revealed a smallaneurysm remnant missed by digital subtraction angiography(DSA) but confirmed later with histology. In 9 of the 16stent-and-coil cases, angioscopy showed minor irregularitiesof stent struts. Seven of these were missed completely byDSA. In the remaining 2 cases an irregularity was suggestedby angiography but details could not be obtained with ourSiemens Angiostar DSA. The image quality of the angioscopeallowed us to visualize a 0.009” red clot attached to aspecific spot of the detachment zone of a recently detachedcoil, and we could spot an approximately 0.012” gapbetween a filament of a recently deployed balloon-expandablestent and the wall of the parent vessel. After calibratingtissue coverage on metal structures to matching histologycross-sections, we now are capable of estimating neointimalthickness in the 0 to 200 micron range.CONCLUSIONOur technique is unique in providing direct, high-resolution,extended duration, color endovascular visualization of thetarget objects. The fact that angioscopy detects device irregularitieswhere DSA (or really any other imaging method)does not, can be frustrating. On the other hand, engineers canbenefit from early detection of such problems. Our methodis especially suitable for the evaluation of clot formation orneointimal growth on stent struts, which - considering therecently revealed clotting issues with coated coronary stents- could be of great interest.KEY WORDS: Angioscopy, stent, coilThe authors of this work have indicated the following affiliations/disclosures:1. Micrus Corporation: Research grant;2. Cordis/Johnson and Johnson: Business relationship, consulting,research grant; 3. Micro Therapeutics, Inc.:Business relations, consulting; 4. Boston ScientificCorporation: stock options, research grant.Thursday
Thursday202Paper 256 Starting at 11:11 AM, Ending at 11:19 AMUseful on Partial Aortic Obstruction of SymptomaticPaper 257 Starting at 11:19 AM, Ending at 11:27 AMThree-Dimensional Digital Angiography and FusionVasospasm: NeuroFlo CatheterDigital Subtraction Angiography: Two NewReconstruction Algorithms for Simultaneous Three-Miranda, C. 1,2 · Vila, J. 1 · Ferrario, A. 1 · Doroszuk, G. 1 · Dimensional Rendering of Osseous and VascularBarbut, D. 1 · Lylyk, P. 1Information Obtained during Rotational Angiography. I.1ENERI, Buenos Aires, ARGENTINA, 2 FLENI, Buenos Technical AspectAires, ARGENTINAOishi, S. 1 · Murphy, K. P. J. 2 · Gailloud, P. 2PURPOSEThe aortic obstruction increases cerebral blood flow (CBF)and reduces infarct volume in animals. We also have reportedon flow augmentation in patients with stroke orvasospasm using a novel endovascular dual balloon device(NeuroFlo, CoAxia, Maple Grove, MN). We now reportour results of a safety study of controlled aortic obstructionwith the same device in patients with symptomaticvasospasm following aneurysmal subarachnoid hemorrhagein a single center.MATERIALS & METHODSThe NeuroFlo catheter was placed transfemorally in thedescending aorta with one balloon positioned below and oneabove the renal arteries. The balloons were inflated sequentiallyto a predetermined obstruction level as dictated by theprotocol in 20 patients with symptomatic vasospasm.Aneurysms were secure prior to the procedure. Regional perfusionwas assessed angiographically and proceduralresponse and outcome were assessed at 1 month using theNIHSS and Modified Ranking Scale.RESULTSThirteen females and 7 males were enrolled. Mean age 41years. Perfusion deficits improved during the procedure in18 patients. Sixty percent of the patients had clinically significantimprovement (NIHSS > 2 points in 24 hours afterthe procedure). Furthermore, procedural response was highlypredictive of outcome at 1 month. NIHSS did not increasein any patient during the procedure and the functional independencewere obtained in 55% of cases. There were no procedure-relatedcomplications. Mortality related to the procedurewas 0% and global mortality was 15%.CONCLUSIONPartial aortic obstruction like a new treatment for symptomaticvasospasm, showed to be safe and and effective toimprove cerebral perfusion with a secondary clinical benefitin this group of patients.KEY WORDS: Vasospasm, SAH, cerebral blood flow1Toshiba Medical Systems Research and DevelopmentCenter, Tochigi, JAPAN, 2 The Johns Hopkins MedicalInstitutions, Baltimore, MDPURPOSETo describe two reconstruction algorithms that providesimultaneous three-dimensional imaging of bone and bloodvessels.MATERIALS & METHODSTwo algorithms that can build three-dimensional vascularand osseous data sets from standard catheter rotationalangiograms are described: (1) Three-dimensional digitalangiography (3D-DA) reconstructs a nonsubtractedangiogram in a single three-dimensional representation ofthe blood vessels and surrounding bony structures; (2)Three-dimensional fusion digital angiography (3D-FDSA) isbased on separate reconstructions of the mask and contrastsequences of the rotational acquisition. The two independentthree-dimensional data sets (3D-bone and 3D-DSA) then arefused in a single three-dimensional representation. Bothalgorithms use a modification of the Feldkamp method thatcompensate for the signal inhomogeneity inherent to thereconstruction of nonsubtracted rotational acquisitions. Thethree-dimensional data set is postprocessed using a commerciallyavailable computer workstation.RESULTSBoth algorithms successfully build three-dimensional datasets that combine vascular and osseous information. Threedimensionaldigital angiography allows evaluating the topographicrelationships between the blood vessels and theirbony surroundings (Figure). However, since 3D-DA is basedon the reconstruction of a single nonsubtracted rotational dataset, it cannot avoid an artifactual loss of image quality whenosseous and vascular structures are immediately adjacent,such as at the skull base. Three-dimensional fusion digitalangiography separately reconstructs the osseous and vascularinformation obtained from the rotational angiogram, keepingoptimal angiographic resolution and offering precise topographicanalysis even when vessels are in contact with bone.
CONCLUSIONWe report two reconstruction algorithms that offer simultaneousthree-dimensional display of the osseous and vascularinformation obtained by rotational catheter angiography.KEY WORDS: Cerebrovascular imaging technique, technicaldevelopment, three-dimensional angiographyThe authors of this work have indicated the following affiliations/disclosures:Toshiba Medical Systems: full-timeemployment.Paper 258 Starting at 11:27 AM, Ending at 11:35 AMEndovascular Treatment of Recanalized CerebralAneurysms Using Matrix CoilsBiondi, A. · Bonneville, F. · Jean, B. · Sourour, N. · Boch, A.L. · Chiras, J.Pitié-Salpêtrière Hospital - University Paris VIParis, FRANCEPURPOSEAneurysm recanalization is still a major limitation of currentbare coil therapy. It preferentially occurs in case of large orgiant aneurysms with wide neck or with incomplete initialocclusion. The Matrix coils are covered with a bioabsorbablepolymeric material which increases the amount of matureintraaneurysmal connective tissue and the neck tissue thickness.This system might prevent aneurysmal recanalizationafter endovascular treatment. The purpose of this study wasto evaluate the midterm efficacy of Matrix coils in recanalizedcerebral aneurysms which were treated previously withregular bare coils.MATERIALS & METHODSA retrospective study was carried out on 12 patients (5woman, 7 men, mean age: 45 years) treated with Matrix coilsfor a cerebral aneurysm which was embolized previouslywith regular bare coils. Six aneurysms were small (10 mm); ten lesions had a wide neck (> 4mm); nine bled and three were unruptured. Occlusion wasconsidered initially as total or subtotal (> 95%) in all casesexcept one. All patients subsequently have been treated withMatrix coils of their recanalized cerebral aneurysm afterinformed consent. Clinical and angiographic follow-up (at 3or 6 months) was available in all cases.RESULTSComplete occlusion was achieved in 11 aneurysms andsubtotal (> 95%) in one. No complication occurred duringthe procedure. At angiographic follow-up, no aneurysmrecanalization or stenosis/occlusion of the parent artery wasobserved. Patients presented no clinical complication in thefollow-up period.CONCLUSIONPreliminary results show that Matrix coils can be used efficientlyin the occlusion of recanalized cerebral aneurysms.Further follow-up studies are needed in order to evaluate thelong-term stability of the aneurysm occlusion.KEY WORDS: Aneurysm, matrix coils, recanalization203Paper 259 Starting at 11:35 AM, Ending at 11:40 AMEmergency Repair of an Iatrogenic MCA DissectingAneurysm after Angioplasty Using the Neuroform Self-Expanding MicrostentTejada, J. G. · Chaloupka, J. C. · Lee, S. K. · Ugurel, M. S. ·Hsu, S. W.University of IowaIowa City, IAPURPOSEEmergency repair of an iatrogenic MCA dissectinganeurysm after angioplasty using the Neuroform selfexpandingmicrostent.MATERIALS & METHODSCase report: A 51-year-old man presented with new righthemispheric transient ischemic attacks (left-sided hypesthesiaand weakness), despite double oral antiplatelet therapy. AnMR angiography (MRA) showed a severe stenosis of the M1segment of the MCA, which was confirmed on catheterangiography. Percutaneous transluminal angioplasty (PTA)was performed using a 2 x 9 mm coronary microballooncatheter, which was technically successful and clinicallyuncomplicated. The patient was continued on doubleantiplatelet therapy and did well with cessation of TIAs, until1 week later when he developed severe bifrontal headaches.Emergency angiography showed a large intimal flap with aninferior saccular false channel of the previously angioplastiedright M1 segment, consistent with a delayed iatrogenic dissectionand associated pseudoaneurysm formation. Owing tothe very small diameter of the normal M1 segment (approximately2 mm) and the presence of a pseudoaneurysm resultingin severe headaches, we were reluctant to try using thesmallest available coronary balloon expandable stent (2.5 mmin diameter) to repair the dissection. We instead elected to usethe recently available self-expanding microstent [Neuroform(NF) 1], which was transferred via back-loading into aRenegade Hi-Flo microcatheter. The stent was positioned easilyand deployed across the dissected segment, resulting inimmediate tacking down of the intimal flap and markedlyreduced filling of the inferior pseudoaneurysm. A 6-week follow-upangiogram showed complete healing of the dissection/pseudoaneurysm.RESULTSEndovascular approaches to intracranial revascularizationusing PTA or stent-assisted PTA (SAPTA) is becomingincreasingly utilized at many centers, owing to significantimprovements in technique, technology, and peri-operativeadjunctive management. However, major complications,such as dissections with or without pseudoaneurysm formationstill occur. Conventional management options includeconservative/supportive treatment vs SAPTA. However, thelatter approach may be technically difficult/impossibleowing to various anatomical constraints (e.g., size of the targetartery, tortuousity of vasculature), and also carriesincreased risk of rupture with catastrophic hemorrhage whenusing a balloon-expandable coronary stent. Recently, thenew self-expandable NF has become available by HDEapproval for the adjunctive treatment of wide-neck intracranialaneurysms. Owing to the use of ultrafine nitinol filamentsconfigured in an open cell design, the NF is highlyflexible and readily deliverable through a conventionalThursday
Thursdaybraided microcatheter, permitting easier distal IC access.However, the NF intrinsically has a relatively modest radialforce, which may not be ideal for use in revascularizationapproaches. Therefore its efficacy for such applications upuntil this time has not been evaluated.CONCLUSIONTo our knowledge our case represents the first successfulrepair of an iatrogenic IC artery dissection after PTA usingthe new NF micro-stent. Despite the relatively low radialforce produced by the NF, our case illustrates the feasibilityof using this stent for the treatment of IC arterial dissections.20438 was advanced until the origin of feeding radicular artery.Through Tracker 38, microcatheters were navigated. Thissystem ensured stability of guiding catheter with goodpushability of the microcatheter. Description of the CatheterSystem: Tracker-38 (Target Therapeutics, Fremont, CA) wasa single hole infusion catheter with outer diameter of5.3F/5F and the inner diameter of 1.02 mm (0.040 in). Thecatheter accepted a 0.038” guidewire. There were twocatheter lengths - 105 cm and 120 cm. Renal guidingcatheter- Mach 1 (FR 3.5) (Boston Scientific Scimed, Inc.Maple Groove, MN), internal diameter - 0.070”, length 60cm. Microcatheter - Ultraflow, Prowler (165 cm).REFERENCES1. Broadbent LP, Moran CJ, Nehra A, Cross Dewitt T, Derdeyn CP.Transfer of a Self-Expanding Stent to a BraidedMicrocatheter with the Aid of Transcatheter Illumination:Technical Report and Illustrative Case. AJNR Am JNeuroradiol 2003;24:1517-1519KEY WORDS: Angioplasty, complications, stentsThe authors of this work have indicated that they will be discussing/presentingan unapproved or investigative use of aNeuroform stent made by Boston Scientific. for MCA dissectiontreatment.The authors of this work have indicated the following affiliations/disclosures:1. Boston Scientific: Consultant; 2.Cordis Neurovascular: Stents; 3. Micro Therapeutics, Inc.:Consultant.Paper 260 Starting at 11:40 AM, Ending at 11:45 AMA Triaxial Catheter System for Spinal VascularInterventions: Technical NoteGarg, A. · Gupta, V. · Mishra, N. K. · Gaikwad, S. B.All India Institute of Medical SciencesNew Delhi, INDIAPURPOSEEndovascular treatment is mainstay in the treatment of spinalcord vascular malformations (SCVMs). However, in somecases the feeding artery may have long and tortuous course,making navigation of microcatheters difficult. As a rule, thelonger, the smaller in diameter, and the more tortuous thesegment to be traversed by the microcatheter is, the moresites there are for friction betweenthe microcatheter and vesselwall. We describe a “triaxial” catheter technique in thetreatment of SCVMs, which proved to be very helpful incatheter navigation.MATERIALS & METHODSUnder general anesthesia, spinal angiograms were performedin five patients (age: 21-35 years, M:F- 4:1). TheSCVMs were localized in lower dorsal or lumbar regions.The feeding arteries were arising either from intercostalartery (2) or lumbar arteries (3). The intercostal/lumbarartery supplying the spinal vascular malformation wascatheterizd with with RC1/ RC2/cobra catheter, which wasexchanged with Tracker 38 (105 cm) placed inside a singlecurve renal guiding catheter. The renal guiding catheter wasplaced at the origin of intercostal/lumbar artery and TrackerRESULTSWe were able to navigate the microcatheter in all cases withoutmuch difficulty. No evidence of thrombo-embolism orspasm was seen.CONCLUSIONTriaxial technique is very helpful for the catheterization ofspinal vascular malformations in appropriate cases.KEY WORDS: Spinal cord vascular malformations, triaxialtechnique, embolizationPaper 260A Starting at 11:45 AM, Ending at 11:50 AMMandible Arteriovenous MalformationsYakes, W. F.Vascular Malformation CenterEnglewood, COPURPOSETo determine optimal management strategies for the treatmentof mandibular AVM.MATERIALS & METHODSSix patients (all females), age 9 -14 years; mean age 12,underwent endovascular therapy to treat their mandibularAVMs. Five patients had distinct intraosseous AVM and onepatient had periosteal mandibular AVM. Three patients hadprior PVA and gel foam embolization, one patient had a lipgraft, one had prior mandible surgery, all that had failed.RESULTSAll six patients have demonstrated MR and angiographiccure of their AVM. The follow-up is 11-35 months, with amean follow-up of 18 months. No complications were noted.CONCLUSIONEndovascular approaches to manage mandibular AVM arecurative. The intraosseous variety is largely a fistula betweenartery and vein within the bone. All respond well to endovascularethanol therapy alone. Surgery was not required in anypatient.KEY WORDS: AV malformation, mandible, ethanolThe author of this work has indicated the following affiliations/disclosures:Micrus Corporation: Board member.
Paper 260B Starting at 11:50 AM, Ending at 11:55 AMEthanol and Coil Embolization of Complex DuralArteriovenous MalformationYakes, W. F.Vascular Malformation CenterEnglewood, COPURPOSETo evaluate the efficacy of ethanol as well as ethanol andcoils in the management of complex dural AVF.MATERIALS & METHODSThirteen patients (mean age 39 years; 8 females, 5 males).All patients presented with dural AVF involving the transversesinus, sigmoid sinus and cavernous sinus. One patientsuffered from high output cardiac state due to the massivesize of her combined dural fistula and scalp AVM. Allpatients underwent MR and cerebral arteriogram evaluations.Patients underwent ethanol embolization, coilembolization, or ethanol and coil embolization in combination.These acquired AVF were nontraumatic.RESULTSTwelve of thirteen patients were endovascularly cured oftheir disease at a mean follow-up of 5 months. One patient’stherapy is on-going. In those patients who had thrombosedsigmoid sinuses and partially thrombosed transverse sinuseswith venous drainage being cortical because of the occludedsinuses, novel approaches were utilized to reach the point offistualization and treated with coils and ethanol. Sacrifice ofthe diseased transverse and sigmoid sinus was utilized alsoto treat the large dural AVF involving these segments. In thecavernous sinus only coil embolization was utilized. In thosepatients presenting the pulsatile tinnitus, it was absent at follow-up.Headaches also resolved. Except for one patientwith a transient homonymous hemianopsia, no other complicationoccurred. One patient’s therapy is on-going.CONCLUSIONComplex acquired dural AVF can be treated by endovascularmeans. Complications can be avoided with meticulous technique.KEY WORDS: Dural AVF, ethanol, coilsThe author of this work has indicated the following affiliations/disclosures:Micrus Corporation: Board member.205Thursday Morning10:15 AM - 11:45 AMRoom 606 - 609(54c) Adult Brain: Neoplasms(Scientific Papers 261 - 271)See also Parallel Sessions(54a) Spine: Degenerative Disk Disease andBiomechanics(54b) Interventional: New Devices(54d) Spine: General, Spinal CordModerators:Danielle Baleriaux, MDBruce A. Wasserman, MDPaper 261 Starting at 10:15 AM, Ending at 10:23 AMClinical and Imaging Spectrum in a Large Series ofAnaplastic OligodendrogliomasLitzau, D. W. 1 · Litzau, D. W. 1 · Salzman, K. L. 1 · Osborn, A.G. 1 · Blumenthal, D. 1 · Koeller, K. 21University of Utah, Salt Lake City, UT, 2 Armed ForcesInstitute of Pathology, Washington, DCPURPOSEThe World Health Organization (WHO) classification ofbrain tumors recognizes two types of oligodendroglialtumors: oligodendroglioma (WHO Grade 2) and anaplasticoligodendroglioma (AO) (WHO Grade 3). These tumors differgenetically and in treatment response from diffuse astrocytomas.The imaging findings of oligodendroglioma arewell characterized. However, only a few scattered casereports and small series have reported imaging findings ofAOs. We examined the imaging features and clinical presentationin patients with documented AOs in an attempt tocharacterize patterns that might define accurate preoperativediagnosis.MATERIALS & METHODSThirty-three patients with pathologically proven AOs fromtwo institutions were reviewed retrospectively. MR studieswere evaluated for tumor location, margins, signal characteristics,cystic and/or hemorrhagic components as well aspattern, intensity, and location of contrast enhancement. CTstudies were evaluated for calcification, hemorrhage, bonechanges, density, and enhancement characteristics. Clinicalinformation reviewed included age at presentation, gender,and presenting symptoms. Pathologic correlation wasreviewed in all cases.Thursday
ThursdayRESULTSThere were 20 female and 13 male patients. The age at presentationranged from 8 years to 73 years with mean age atinitial diagnosis of 38.5 years. The most common presentingfeatures were headache (54%) and focal neurologic deficit(35%). AOs are predominantly infiltrating tumors (31/33)and show hypointense T1 and hyperintense T2 signal in allMR imaging cases (27/33). Of the enhancing tumors (21/27),the most common contrast enhancement pattern was punctate/patchy(47%). Enhancement intensity was typicallyminimal (63%) and central (52%). Six cases (22%) showedno enhancement. The most common tumor location was thefrontal lobe (67%) with unilateral frontal lobe involvementseen in 42%. CT revealed calcification in 10 tumors and calvarialerosion in 3 patients. Hemorrhage was seen in 7tumors.CONCLUSIONThe imaging spectrum of AOs is much broader than expected.Although a characteristic imaging appearance is seen inthe majority of cases, 22% showed no enhancement, similarto low grade gliomas. Sixteen percent had a necrotic-appearingcenter with intense rim enhancement, indistinguishablefrom classic primary glioblastoma multiforme. We concludethat while there are no specific imaging criteria that identifyAOs preoperatively, an infiltrating mass in the frontal lobethat demonstrates minimal patchy/punctate central enhancementstrongly suggests the diagnosis.KEY WORDS: Oligodendroglioma, MR imagingPaper 262 Starting at 10:23 AM, Ending at 10:31 AMLactate-Edited MR Spectroscopy Imaging: IncreasedLactate in High Grade Gliomas Prior to RadiotherapyCorrelates with Treatment FailureHoxworth, J. M. · Cha, S. · Sadarangani, P. · Li, X. ·Butowski, N. · Vigneron, D. B. · Nelson, S. J.University of California San FranciscoSan Francisco, CAPURPOSEAlthough advances have been made in the diagnosis andtreatment of high grade gliomas, the prognosis remains dismal.Treatment must attempt to balance prolonged survivalwith quality of life. As such, identifying factors predictive ofearly treatment failure could aid in patient counseling andpotentially warrant more aggressive measures. Proton MRspectroscopic imaging (MRSI) is used commonly for characterizationof gliomas, and an increased tumor lactate/ -acetylaspartate ratio has been reported to correlate withshorter survival (1). We hypothesized that lactate also mayserve as a predictor of tumor progression during treatmentand undertook evaluation with serial lactate-edited MRSI.206postradiotherapy, and patients were grouped as treatmentresponders (stable or decreased tumor) or treatment failures(increased tumor). The MRSI protocol included 3D J-differencelactate-edited MRSI using point resolved spectralselection (PRESS) volume selection that incorporated a twocycleband selective inversion with gradient dephasing(BASING) pulse (2). Lactate was quantified as previouslydescribed (3), and lactate content of the resection cavity wasexcluded. Comparison of lactate on the basis of treatmentresponse was undertaken with the Mann-Whitney U test.RESULTSAll patients underwent attempted gross total tumor resection.The intervals (mean ± standard deviation) between preoperativeand preradiotherapy imaging and between pre andpostradiotherapy imaging were 31 ± 15 days and 62 ± 12days respectively. Five patients were treatment responders (3stable, 2 decreased residual tumor), and six patients representedtreatment failures. Preoperatively, the maximum lactate(median) ranged from 4.73 to 19.37 (10.82) in treatmentfailures and 6.22 to 51.54 (13.59) in responders (p = 0.273).Prior to radiotherapy, the maximum lactate ranged from 4.55to 13.01 (6.68) in treatment failures and 1.49 to 5.70 (4.97)in responders (p = 0.045).CONCLUSIONLactate-edited MRSI is feasible for the serial study of highgrade gliomas. Patients with disease progression duringtreatment demonstrated increased tumor lactate immediatelyprior to radiation therapy. In contrast, treatment responsewas independent of preoperative lactate levels. These preliminaryresults warrant further study in larger populationswith inclusion of additional measures of clinical outcome.REFERENCES1. Tarnawski R, Sokol M, Pieniazek P, et al. 1H-MRS In VivoPredicts the Early Treatment Outcome of PostoperativeRadiotherapy for Malignant Gliomas. Int J RadiationOncology Biol Phys 2002;5:1271-12762. Star-Lack J, Spielman D, Adalsteinsson E, et al. In Vivo LactateEditing with Simultaneous Detection of Choline, Creatine,NAA, and Lipid Singlets at 1.5 T Using PRESS Excitationwith Applications to the Study of Brain and Head andNeck Tumors. J Magn Reson 1998;133:243-2543. Nelson SJ. Analysis of Volume MRI and MR SpectroscopicImaging Data for the Evaluation of Patients with BrainTumors. Magn Reson Med 2001;46(2):228-239KEY WORDS: Glioma, lactate, MR spectroscopyMATERIALS & METHODSEleven patients without prior treatment or biopsy were diagnosedwith gliomas (n = 2, Grade III; n = 9, Grade IV) andwere included. In addition to preoperative imaging, thepatients were evaluated immediately prior to and followingpostoperative radiotherapy. Specifically, these assessmentseach consisted of conventional MR imaging and MRSI. Theamount of residual enhancing tumor was determined pre and
Paper 263 Starting at 10:31 AM, Ending at 10:39 AMGrading Brain Tumors Using Combined DynamicSusceptibility Contrast MR Imaging PerfusionParameters and Nearest Neighbor AnalysisQuarles, C. C. · Ward, B. D. · Rand, S. D. · Krouwer, H. G.· Wagner, M. L. · Schmainda, K. M.Medical College of WisconsinMilwaukee, WIPURPOSEThe purpose of this study was to use combined dynamic susceptibilitycontrast (DSC) MR imaging perfusion parametersand nearest neighbor analysis to grade brain tumors.MATERIALS & METHODSOver 200 DSC perfusion studies have been performed todate, with informed written consent, under guidelinesapproved by the Institutional Review Board at our institution.We have completed the perfusion analysis on 28 ofthese patients, which consisted of 16 confirmed high grades(WHO grade IV) and 12 low grades (WHO grades II andIII). Gradient-echo (GE) and spin-echo (SE) cerebral bloodflow (CBF), volume (CBV), mean transit time (MTT) andthe ratio (DR2*/DR2), which is a measure of mean vesseldiameter, were measured using a simultaneous GE/SE EPIperfusion scan on a 1.5 T scanner (1, 2). Data was extractedfrom ROIs of the whole tumor (avoiding areas of necrosis)and contralateral brain. All results are normalized to contralateralbrain. Brain tumor perfusion is known to be highlyheterogeneous and doesn’t exhibit unidirectional (i.e..always higher than contralateral tissue) shifts that wouldlend itself to typical thresholding techniques such as ROCanalysis. The nearest neighbor analysis only assumes that theperfusion parameters of tumors of the same grade will beclustered together in parameter space. The nearest neighborapproach assigns the tumor grade based on the grades of theparameters nearest to the subject of interest. For this studythe assignment was based on the three nearest subjects.Nearest neighbor analysis was used to determine which combinationof these 7 parameters gave the most reliable predictionof tumor grade.RESULTSThe individual GE CBF, CBV, and MTT were more predicativeof tumor grade than SE CBF, CBV, and MTT values.The ratio values alone correctly assigned the tumor grades of71% of the 28 patients. The combination of the ratio valuesand the GE CBV gave the most reliable prediction (75% correct).The addition of the CBF and MTT parameters alwaysreduced the reliability of the test.CONCLUSIONEven with the small training data set of 28 subjects the nearestneighbor analysis of combined DSC MR imaging perfusionparameters indicated its potential to determine tumorgrade correctly predicting the tumor grade with 75% precision.It is expected that the predication reliability willimprove as the number of subjects included in the studyincreases. Since CBF and MTT are very heterogeneous bothwithin and across tumors it is expected that the size of thetraining data set must be substantially larger to establishtumor grade clusters of these parameters. To establish the207clinical relevancy of this analysis future studies include sensitivityand specificity tests and a comparison with thresholdingtechniques.REFERENCES1. Ostergaard L, et al. MRM 1996;36:715-7252. Schmainda K, et al. MRM 2000;43:845-853KEY WORDS: Brain tumors, dynamic susceptibility contrast,tumor classificationThe authors of this work have indicated the following affiliations/disclosures:National Institutes of Health/NationalCancer Institute: CA082500.Paper 264 Starting at 10:39 AM, Ending at 10:47 AMComparison of Endothelial Permeability Surface AreaProduct, ktrans, Derived by Steady-State T1 and First-Pass T2* Methods for Brain TumorsYang, L. 1 · Cha, S. 1 · Johnson, G. 2 · Lai, A. 1 · Mendland, M.F. 1 · Dillon, W. P. 11University of California San Francisco, San Francisco, CA,2New York University Medical Center, New York, NYPURPOSEEndothelial permeability of vessels within brain tumors providesimportant information about the nature of neovascularizationand blood-brain barrier integrity. The conventionalsteady-state contrast-enhanced T1-weighted method ofdetermining endothelial permeability surface area product,ktrans, is limited by long scanning times, complex postprocessingalgorithms, and over or underestimation of ktrans (1,2). The aim of this study was to correlate ktrans derived bysteady-state T1- with first-pass T2*-weighted methods inbrain tumors.MATERIALS & METHODSTwenty-seven patients with treatment-naive gliomas ormeningiomas were studied prior to surgery. ktrans wasderived from both dynamic contrast-enhanced steady-stateT1-weighted spoiled gradient-recalled (SPGR) and dynamicfirst-pass T2*-weighted sequences performed 30 minutesafter the first injection of gadolinium. Uniform 5 mm diameterregions of interest within each tumor were drawn andsaved on the postcontrast 3D SPGR image. Two investigatorsindependently measured ktrans from the steady-state T1acquisitions using an algorithm based on the unidirectionalmodel and from the first-pass T2* acquisitions using analgorithm which assumes that contrast agent exists in twointerchanging compartments (plasma and extravascularextracellular space) (3). ktrans was derived by estimatingvascular contrast agent concentration from normal whitematter and fitting it to the expression for the tissue concentration.RESULTSAll meningiomas (n = 7) and grade IV gliomas (n = 10)enhanced on postcontrast 3D SPGR images; only 3 of 10grade I-III gliomas enhanced. There was good linear correlationbetween ktrans for gliomas (R 2 = 0.91; Figure-top), butnot for meningiomas (Figure-bottom), calculated using thesteady-state T1 and the first-pass T2* techniques.Thursday
Thursday208Paper 265 Starting at 10:47 AM, Ending at 10:55 AMDiffusion Tensor Imaging and 1H Spectroscopy inCharacterization of Primary Brain TumorsVucurevic, G. V. · Tropine, A. · Gawehn, J. · Boor, S. ·Dellani, P. R. · Stoeter, P.Institute of NeuroradiologyMainz, GERMANYCONCLUSIONThe goals of our study were to measure and assess correlationbetween ktrans derived using steady-state T1 anddynamic susceptibility first-pass T2* methods in braintumors. Our study suggests that ktrans derived by the steadystateT1 and the first-pass T2* methods are correlated linearlyfor gliomas but not for meningiomas. Although oursample size and range are limited, the good correlation wehave found for gliomas suggests that the first pass T2*method may prove to be a valuable technique for estimatingcapillary permeability in gliomas as it may be more usefulfrom a standpoint of image acquisition and computationalspeed. Further investigations to directly correlate imagingwith histologic standards may strengthen the validity of T2*derived ktrans as a noninvasive imaging marker of microvascularpermeability.REFERENCES1. Tofts, Kermode A. Measurement of the Blood-Brain BarrierPermeability and Leakage Space Using Dynamic MRImaging. 1. Fundamental Concepts. Mag Res Med1991;17:357-3672. Buckley DL. Uncertainty in the Analysis of Tracer KineticsUsing Dynamic Contrast-Enhanced T1-Weighted MRI. MagRes Med 2002;47:601-6063. Yang S, et al. Dynamic Contrast-Enhanced Perfusion MRImaging Measurements of Endothelial Permeability:Differentiation Between Atypical and Typical Meningiomas.AJNR Am J Neuroradiol 2003;24:1554-1559KEY WORDS: Brain tumor, perfusion MR imaging, permeabilityPURPOSEDiffusion tensor imaging (DTI) is widely used to map whitematter tracts in normal brain. Two parameter maps obtainedwith DTI: mean diffusivity (MD) and fractional anisotropy(FA) give additional information concerning tissuemicrostructure. 1H spectroscopy reveals tissue physiologyand metabolism. Both methods are useful in oncological surgeryplanning giving information of tumor malignancy(spectroscopy), degree of tissue edema, displacement ofwhite matter (WM) tracts and infiltration (DTI). Goal of thisstudy was to determine usefulness of different parameters indetermining tumor malignancy.MATERIALS & METHODS1H single voxel spectroscopy using PRESS sequence withTE = 135 ms was used, together with diffusion tensor imagingsequence (b = 900 s/mm 2 , matrix 128 x 128, FOV = 210mm, 19 slices, thickness 5 mm ) in 7 low grade tumors, onecase of gliomatosis cerebri and 8 high grade gliomas on 1.5T scanner. External reference was used for absolute spectralquantification. Fractional anisotropy and mean diffusivitymaps were calculated off-line.RESULTSHighest statistical significance in comparison of low to highgrade gliomas was found measuring mean diffusivity (higherin low grade gliomas, p < 0.005 - two-tailed t-test). Nextparameter was creatine content, which was found to be higherin low grade astrocytomas (p < 0.015). Fractionalanisotropy was significantly higher in high grade astrocytomas(p < 0.048), whereas total choline content have notreached statistically significant difference between these twogroups. In malignant gliomas: 1) mean diffusivity mapsshowed mixed pattern in necrotic core of the lesion, meandiffusivity was decreased at the viable tumor parts, 2) fractionalanisotropy was decreased compared to normal whitematter, 3) creatine levels were 3-4 times lower compared tonormal tissue and choline was found to be increased slightly.Low grade gliomas are presented in general with: 1)decreased fractional anisotropy, 2) increased mean diffusivity,3) mildly decreased creatine content. N-acetylaspartatewas variably present in low grade astrocytomas and wasabsent in high grade astrocytomas. In the case of gliomatosiscerebri important finding is that fractional anisotropy significantlyless decreased compared to low grade astrocytomas,whereas mean diffusivity was intermediately increased.CONCLUSIONMain information given by spectroscopy is contained in abilityto recognize degree of malignancy, while diffusion tensorimaging is useful to determine integrity of white mattertracts. Additionally, mean diffusivity correlates with cellularityof the tissue, and fractional anisotropy correlates withthe higher level structures. In more malignant tumors, hypercellulartumors, fractional anisotropy expresses structural
properties which are more connected to the tumor vascularity.In particular cases DTI was more successful in delineatinggliomatosis cerebri from low grade glioma, and spectroscopywas superior in discriminating low grade tumorsfrom those that are becoming more malignant.KEY WORDS: Tumor, diffusion, spectroscopyPaper 266 Starting at 10:55 AM, Ending at 11:03 AMMultispectral Analysis of Physiologic MR Imaging forTissue-Specific Clustering: Application to GliomasPostradiation TherapyZhang, Z. 1,2 · Kassner, A. 1 · Lee, J. 1 · Sitartchouk, I. 1 ·McCurdy, J. 1 · Keller, A. 3 · Roberts, T. P. L. 1,3,41University of Toronto, Toronto, ON, CANADA, 2 1 stAffiliated Hospital of Sun Yat-sen University, Guangzhou,CHINA, 3 University Health Network, Toronto, ON,CANADA, 4 Toronto Western Research Institute, Toronto,ON, CANADA209RESULTSA 2-dimensional plane summarizing results is shown in thefigure. Apparent diffusion coefficient alone was able toresolve necrosis from other tissue with a cut-off value of1800 um 2 /s. Apparent diffusion coefficient < 900 um 2 /sresolved normal tissue from abnormal tissue. Specificity was100%. fBV was able to resolve tumor from nontumor tissuewith a cut-off value > 0.025. Specificity was 88%. K was nota good discriminator (63% specificity for tumor vs nontumortissue).PURPOSEIdentification of early indicators for tumor recurrence areimportant in tumor patients postradiotherapy. PhysiologicMR imaging methods including diffusion (to assess celluarity)and dynamic contrast-enhanced MR imaging (to assessblood volume and microvascular permeability) might help toidentify recurrence. This study investigated whether theseadvanced MR methods could be used to differentiate tissuetypes in these patients, using a multispectral clusteringapproach in multidimensional “physiology-space.”MATERIALS & METHODSTwelve patients with varying grades of glioma were imagedon a 1.5 T clinical MR system (GE Medical Systems, SignaEchospeed). Imaging included conventional anatomical aswell as diffusion and dynamic contrast-enhanced MR imaging.For diffusion imaging a single-shot EPI sequence wasused and parameters were as follows: (TR = 11250 ms, TE =94 ms, FOV = 300 mm, slice thickness = 5 mm, no. of slices= 31, b = 0, 1000). For dynamic contrast-enhanced MRimaging a 3D GE sequence was used with the followingparameters: (TR = 5.1, TE = 1.5, FOV = 220 mm, slice thickness= 10 mm, no. of slices = 10, NSA = 0.5). Temporal resolutionper volume was 3.3 s and data acquisition continuedfor 36 dynamics. Gd-DTPA (Omniscan, Amersham Health)was administered after dynamic number 2. Apparent diffusioncoefficient maps were calculated on a clinical workstation(GE Medical Systems) using Functool 2. Dynamic contrast-enhanceddata were transferred to an independentworkstation and evaluated using a 2-compartment model aspreviously described. Regions of interest were chosen onconventional images (mainly post-gad T1) by an experiencedradiologist and mean and standard deviations of ADC,KPS, and fBV were recorded in tumor, edema, necrosis andnormal white matter. Three-dimensional scatter plots withaxes of ADC, fBV, and Kps were created to identify clustersof “physiologic similarity.” Clustered results were comparedstatistically using a one-way ANOVA.Figure: 2-dimensional view of multidimensional scatter plot,indicating tissue specific clustering.Apparent diffusion coefficient > 1800 necrosis vs other tissue(specificity 100%); ADC > 900 nonnormal vs white matter(WM); ADC < 900 normal WM; BV > 0.025 tumor(specificity 88%); BV < 0.025 nontumor.CONCLUSIONOur results show a single method is not able to separate alltissue types. However, clustering in multiparametric spaceallows separation with distinct cut-off values. Extensions ofthis methodology to include more physiologic (or spatial)dimensions promise the segregation of more tissue types (ormore pathophysiologic specificity) as well as identifyingredundant or obsolete imaging strategies.KEY WORDS: Diffusion, permeability, multispectralThe authors of this work have indicated the following affiliations/disclosures:1. General Electric Medical Systems:Research grant; 2. Toronto Image Processing Systems:Ownership.Thursday
ThursdayPaper 267 Starting at 11:03 AM, Ending at 11:11 AMCan Tumor Contrast Enhancement Be Used as aCriterion of Grading System of Oligodendrogliomas?White, M. L. · Zhang, Y. · Kirby, P. A. · Smoker, W. R. K.University of Iowa College of MedicineIowa City, IAPURPOSEOligodendrogliomas are divided into low-grade (WHO II)and high-grade or anaplastic (WHO III) groups. The associationof high-grade oligodendrogliomas with tumor contrastenhancement on MR imaging has been reported.Furthermore, some studies even use contrast enhancement asa criterion to differentiate two these grades: absence ofendothelial hyperplasia and of contrast enhancement are lowgrade, and the presence of endothelial hyperplasia and/or ofcontrast enhancement are high grade. However, in our practice,MR imaging frequently shows both low-grade andhigh-grade oligodendrogliomas to be enhancing or nonenhancing.We therefore conducted retrospectively a review tocorrelate the tumor contrast enhancement with tumor histologicgrade.210CONCLUSIONWe correlated the tumor contrast enhancement with histologicgrade in oligodendrogliomas. Our results showed thatthe average CERs in the both tumor groups were not significantlydifferent. We believe that the presence/absence oftumor contrast enhancement is not a specific finding for simplydescriminating low-grade from anaplastic oligodendrogliomas.Histologic confirmation is necessary even intumors without contrast enhancement.KEY WORDS: Oligodendroglioma, histologic grade, MRimagingPaper 268 Starting at 11:11 AM, Ending at 11:19 AMDynamic Susceptibility Contrast Perfusion MR Imagingof Low-Grade Gliomas: A Follow-Up Study of Lesionswith Low vs High Relative Cerebral Blood VolumeLaw, M. · Wang, E. Y. · Oh, S. · Babb, J. · Zagzag, D. ·Johnson, G.New York University Medical CenterNew York, NYMATERIALS & METHODSThe study included 24 oligodendrogliomas in 23 consecutivepatients (12 M and 11 F; age, 15-72 years) who had pretreatmentMR imaging. All 24 tumors were confirmed pathologicallyby either resection (n = 19) or biopsy (n = 5).Sixteen oligodendrogliomas were low grade and 8 wereanaplastic according to the WHO classification system. MRimages were evaluated qualitatively regarding the presence/absenceand the pattern of tumor contrast enhancement.The contrast enhancement ratios (CERs), the quantitativecriteria, were calculated to evaluate the difference of theenhancement degree between the low-grade and the anaplastictumors.RESULTSContrast enhancement was noted in 9 of 16 (56%) low-gradetumors and in 5 of 8 (62.5%) anaplastic tumors. The CERswere 2.12 ~ 40.88 (mean, 20.08) in low-grade tumors andwere 3.20 ~ 62.52 (mean, 28.73) in anaplastic tumors (P >0.05). A characteristic enhancement pattern, nodular-likeenhancement was found in 4 of 9 enhanced low-gradetumors and 4 of 5 enhanced anaplastic tumors. Histologicexamination showed nodular-like areas to have the highercell density and relatively increased neovascularity.Figure. An anaplastic oligodendroglioma.(a) T2-weighted image shows a high signal intensity massthat mainly involves the right frontal lobe and insula. (b)Contrast-enhanced T1-weighted image does not show obvioustumor contrast enhancement. The CER is 5.82.PURPOSELow-grade gliomas can behave as true low-grade gliomas,may undergo malignant transformation, or in fact haveunderlying high-grade features not detected by initial histologybecause of inadequate sampling. The purpose of thisstudy is to determine if initial and follow-up cerebral bloodvolume (CBV) and vascular permeability measurements(K trans ) can help predict tumor behavior in low-grade gliomas(LGGs).MATERIALS & METHODSThirty-five patients with histologically diagnosed LGGscomprising of low-grade astrocytomas (n = 21), low-gradeoligodendrogliomas (n = 13), and low-grade mixed oligoastrocytoma(n = 1) were studied with conventional MRimaging, and DSC MR imaging. Maximal rCBV measurementswere obtained from regions of maximal perfusionabnormality as determined from rCBV color overlay maps.Vascular permeability measurements were derived simultaneouslyfrom a pharmacokinetic modeling algorithm.Patients then were divided into two groups (A and B) basedon a threshold value of 1.75 (which was derived from previouslogistic regression analysis of 120 high-grade gliomasand 40 low-grade gliomas at our institution to give the mostoptimal sensitivity and specificity for differentiating LGGsfrom HGGs). Perfusion parameters then were measuredagain at 6, 12, 18, and > 18 month follow-up studies.RESULTSGroup A gliomas demonstrated rCBV and K trans measurementsof 1.20 ± 0.39 and 0.00014 ± 0.0002 (mean ± SD).The follow-up rCBV and K trans measurements were 1.29 ±0.48 and 0.00018 ± 0.0002. P value for comparing the initialand follow-up rCBV and K trans were 0.56 and 0.61 respectively.Group B gliomas demonstrated rCBV and K trans measurementsof 3.42 ± 1.45 and 0.0033 ± 0.013 (mean ± SD). Thefollow-up rCBV and K trans measurements were 5.06 ± 2.96and 0.0036 ± 0.011. P value for comparing the initial and follow-uprCBV and K trans were < 0.05 and 0.95, respectively.
CONCLUSIONThe results suggest that DSC MR imaging can further differentiateLGGs into two groups, which appear to have differentbehavior on follow-up studies. LGGs with low initialperfusion tend to have low rCBV on follow-up whereasLGGs with high initial perfusion tend to have progressivelyincreasing rCBV on follow-up. This indicates either a discordancebetween initial rCBV measurements and histologicassessment or that there is a subset of LGGs withincreased rCBV, that may behave differently.KEY WORDS: Low-grade gliomas, perfusion, cerebral bloodvolume211with CST atrophy on DTI and showed only equivocalimprovement in motor strength. The figure shows an exampleof a laterally displaced posterior limb of internal capsulewith normalization of tract position after tumor resection.This patient’s motor strength increased from a preoperative3.5 to a postoperative 5 (normal).Paper 269 Starting at 11:19 AM, Ending at 11:27 AMCorticospinal Tract Involvement Depicted by DiffusionTensor Imaging before and after Brain Tumor ResectionCorrelates with Clinical Motor FindingsLaundre, B. J. · Jellison, B. J. · Field, A. S. · Badie, B. ·Alexander, A. L.University of WisconsinMadison, WIPURPOSETo assess the relationship between pre and postoperative diffusiontensor imaging (DTI) and clinical motor deficits inpatients with space-occupying lesions involving the corticospinaltract (CST).MATERIALS & METHODSWe retrospectively reviewed the pre and postoperative DTIpatterns of 9 patients with masses potentially involving theCST (in close proximity to cerebral peduncle, posterior limbof internal capsule, or corona radiata). Masses also involvingthe motor cortex were discarded, leaving 4 patients (3 neoplasms,1 cavernoma). Diffusion tensor imaging was performedat 1.5 T using a birdcage head coil, SS-EPI, TR/TE4500/71.8 msec, NEX 4, FOV 240 mm, slice 3 mm, voxelsize interpolated to 0.94 mm isotropic, and diffusion encodingin 23 directions with b = 0, 1000 sec/mm 2 .Postprocessing included image registration, 3 x 3 in-planespatial median filter, tensor decoding and diagonalization(1). A neuroradiologist, blinded to the results of physicalexamination, determined CST involvement from colorcodedmaps of major eigenvector direction, on which colorbrightness was modulated by fractional anisotropy. The CSTwas considered to be involved if it was either displaced(abnormal position) or edematous/infiltrated (decreasedanisotropy) (2). CST appearance pre and postoperativelywas compared with contralateral motor strength using theMedical Research Council’s 0-5 rating.RESULTSOf the 4 patients with potential CST involvement preoperatively,DTI confirmed CST involvement in 3 patients, all ofwhom had preoperative motor deficits. The patient withoutCST involvement on DTI had no motor deficit.Postoperatively, DTI showed CST preservation and normalizationof position and/or anisotropy in 2 of the 3 patientswith preoperative deficits, and both of those patients showedimprovement in their motor strength. The other patient withpreoperative deficits had evidence of Wallerian degenerationCONCLUSIONIn this small cohort of patients with masses potentiallyinvolving the CST, the appearance of the CST on pre andpostoperative DTI correlated well with the clinical motorexamination. Further study is warranted to define the role ofDTI in planning tumor resections and predicting postoperativemotor function.REFERENCES1. Hasan KM, Basser PJ, Parker DL, Alexander AL. AnalyticalComputation of the Eigenvalues and Eigenvectors in DT-MRI. J Magn Reson 2001;152(1):41-472. Jellison BJ, Field AS, Medow J, et al. Diffusion-TensorImaging of Cerebral White Matter: A Pictorial Review ofPhysics, Fiber Tract Anatomy and Tumor Imaging Patterns.AJNR Am J Neuroradiol (in press)KEY WORDS: Diffusion tensor imaging, brain tumors, surgicalplanningThe authors of this work have indicated the following affiliations/disclosures:National Institutes of Health: Grant#R01 EB002012.Paper 270 Starting at 11:27 AM, Ending at 11:35 AMComparison of Tumor Perfusion Measured by SpinLabeling Method and Gadolinium-Injected DynamicPerfusion Study Using MR ImagingHarada, M. · Kubo, H. · Nishitani, H.University of TokushimaTokushima City, JAPANPURPOSEIn our previous reports, it was shown that the image contraston the flow-sensitive alternating inversion recovery (FAIR)technique in ischemic cerebral disease was well correlatedwith that of the paramater maps by postcontrast dynamicperfusion MR imaging (1). However, it is known that theThursday
Thursdayhemodynamic change on the brain tumor is variable andinfluential under the change of vascular permeability and theexistence of angiogenesis and necrosis. In this study, weapplied the FAIR technique and the various paramater mapsby postcontrast dynamic perfusion MR imaging on the samepatients with brain tumor for the comparison of the perfusioncontrast. The further analysis for postcontrast dynamic perfusiondata was conducted using independent componentanalysis (ICA).MATERIALS & METHODSThe subjects were 15 patients with the primary brain tumor(4 cases: glioblastoma, 4 cases: low grade glioma, 4 cases:malignant lymphoma, 2 cases: meningioma, 1 case:gliomatosis cerebri). The instrument of MR imaging was aclinical 1.5 T apparatus (Signa Horizon, GE, Milwaukee,WI) with a standard headcoil. The sequences of FAIR techniqueand postcontrast dynamic method were prepared basedon the gradient-echo type EPI, and the measurement conditionsof each technique were TI = 1600 ms, TR = 20000 ms,TE = 20 ms, Matrix = 128 x 128 (FAIR), and TR = 2000 ms,TE = 55 ms, Matrix = 128 x 128, 55 phases (dynamic),respectively. The paramater maps of MTT, rCBF, rCBV andstatic CBV were generated by the deconvolution analysisusing MEDx Ver 3.42 (Sensor system,USA) and time seriesdata was evaluated by ICA. The image contrast was evaluatedby visual estimation of two radiologists, and semi-quantitativecomparison by signal intensity ratio (tumor/oppositenormal tissue) also was conducted.RESULTSThe high flow tumor such as meningioma and the low vasculartumor such as most of the glioblastoma showed thesame tendency of image contrast between FAIR techniqueand rCBF map. However, three cases of malignant lymphomashowed discrepancy of image contrast between twomethods. The signal ratios (tumor/opposite normal tissue)between FAIR technique and each parameter map showed inTable1, and it was found that the correlation between FAIRand MTT was relatively low (r = -0.19) as opposed to ourresult of the ischemic disease. The correlation between FAIRand rCBF was not as good as the result of the ischemic disease.Independent component analysis showed different timecurve shape of signal changes in the tumor that might causemiscalculation of perfusion parameter.Correlation Coefficients between FAIR and Parameter MapsFAIR CBF CBV MTTFAIR 1.00 0.49 0.66 -0.19CBF 0.49 1.00 0.88 -0.43CBV 0.66 0.88 1.00 -0.38MTT -0.19 -0.43 -0.38 1.00CONCLUSIONThe perfusion contrast in tumor cases may be differentdepending on various perfusion MR technique and the miscalculationmight be occurred to generate parameters formthe time series data by contrast dynamic study.REFERENCES1. Yoneda K, Harada M, et al. Magn Reson Imag 2003;21:701-705KEY WORDS: Perfusion, brain tumor, MR imaging212Paper 271 Starting at 11:35 AM, Ending at 11:43 AMMicrovascularity within Human Gliomas Identified at 8T High Resolution MR Imaging and HistopathologyChristoforidis, G. A. · Yang, M. · Figueredo, T. · Chakeres,D. W. · Abduljalil, A. · Chaudhury, A. · McGregor, J. · John,C. · Newton, H.The Ohio State UniversityColumbus, OHPURPOSETo determine whether microvascularity identified withingliomas using ultrahigh resolution MR gradient-echo imagingat 8 T correlates with tumor grade.MATERIALS & METHODSGradient-echo images were acquired from 24 patients withgliomas using a TEM resonator operating in quadrature andtuned to 340 MHz (8 T). A prototype whole body 8 T imagingsystem was used. All patients signed consents and theexams were done under an IRB approved protocol. Typicalacquisition parameters were as follows: matrix = 1024 x1024, flip angle = 20-45 o , TR = 750 m msec, TE = 17 ms,FOV = 20 cm, slice thickness = 2 mm. This resulted in an inplaneresolution of about 200 microns. Images were analyzedand areas of altered signal intensity and disturbedmicrovasculature were identified within the brain tumors.The number of foci with areas of abnormal vasculature, awell as the size and density of the abnormal microvascularstructures relative to gray matter and white matter weredetermined semiquantitatively. These then were compared totumor grades according to the WHO classification of primarybrain tumors. Tumor extent also was compared to thatidentified on 1.5 T MR images.RESULTSThe 8 T images demonstrated high signal regions similar indistribution to the 1.5 T images outlining the margins of themasses in all patients. None of the intraparenchymal vesselswere visible at 1.5 T. Many small intraparenchymal vessels,hundreds, primarily veins deep within the brain were visualizedat 8 T. These vessels typically were detected as linearsignal voids. There was distortion of the vasculature includingdisplacement, enlargement, increased number, andabnormal tortuosity. Distorted vessels within the tumor bedwere suspicious for neovascularity. Contingency table analysisindicated that there was a statistically significant correlationbetween number of foci of microvascularity within thetumor bed (p < 0.0011) and size of abnormal vessels withinthe tumor bed relative to normal brain (p < 0.01).CONCLUSIONHigh resolution 8 T imaging provides a unique detailed viewof distorted cerebral microvasculature in brain tumors invivo on cross-sectional imaging. This vascular prevalencemay show promise as a marker for tumoral microvascularity.Furthermore, high resolution 8 T MR imaging potentiallycould allow differentiation of high from low grade astrocytomas.KEY WORDS: Glioma, microvascularity, high field MRimaging
Thursday Morning10:15 AM - 11:45 AMRoom 611 - 612(54d) Spine: General, Spinal Cord(Scientific Papers 272 - 284)See also Parallel Sessions(54a) Spine: Degenerative Disk Disease andBiomechanics(54b) Interventional: New Devices(54c) Adult Brain: NeoplasmsModerators:Wendy A. Cohen, MDM. Judith Donovan Post, MDPaper 272 Starting at 10:15 AM, Ending at 10:23 AMCross-Sectional Gray/White Matter Differentiation ofthe Human Spinal Cord In Vivo at 3 T Using a DedicatedSpinal CoilKollias, S. S. · Kwiecinski, S. · Summers, P.University Hospital ZürichZürich, SWITZERLANDPURPOSEThe spinal cord is a highly structured tissue consisting ofgray matter (GM) containing primarily cell bodies andassuming a butterfly-shaped central position in cross-section,and white matter (WM) containing densely packed, rostro-caudallyoriented axons in the periphery. Despite the sensitivityof T2-weighted MR imaging for evaluating tissuedamage associated with spinal cord pathology, the grossanatomical differentiation between gray and white matterhas not been possible on routine scans due to limitations inSNR and spatial resolution. In this study, we demonstrate thefeasibility of obtaining high-quality MR images of thehuman spinal cord in vivo, in clinically acceptable scantimes at a 3 T MR system, using an imaging protocol optimizedfor contrast between gray and white matter and cerebrospinalfluid (CSF).MATERIALS & METHODSExperiments were performed at a 3 T MR system (80 mT/m,100 mT/m/ms gradient coils), using a 12-element, phasedarray,dedicated spine coil. Five healthy adult volunteerswere scanned in 15 5mm thick axial sections (0.5 mm gap,in-plane resolution = 0.59 x 0.73 mm) in three acquisitions:C2-C6 (cervical), Th1 -Th5 (thoracic), and Th9-L1 (lumbar)vertebral segments. A target imaging time of 6 min wasenforced, with the number of signal averages (NSA) beingmaximized under this constraint. Flow-compensation gradi-213ents and anterior spatial saturation bands were applied tosuppress motion artifacts from breathing, swallowing, andCSF flow. A 2D FFE T2-weighted sequence was optimizedfor image contrast and SNR at the cervical segment of thevolunteers by varying systematically the TR (260-2000 ms),the TE (8.2-10.3 ms) and the flip angle (FA) (10 o -50 o ). Theoptimization process consisted of visual inspection and signalintensity measurements of GM, WM, CSF, and standarddeviation of the background noise.RESULTSOur measurements showed that the level of CNR is quiterobust across a large range of TRs. For a given TR there isalso a range of near optimal FAs, provided adequate SNR isachieved. There is a small improvement achieved by acquiringsignal during the in-phase condition for water and fat(TE: 9.2 ms). Excellent tissue contrast and visualization ofthe internal anatomy of the spinal cord was achieved with thefollowing parameters: TR/TE/FA/NSA = 523 ms/9 ms/30 o /3for an acquisition time of 4 min 50 sec. With this protocol,high quality images of the cervical and lumbar regionsallowing differentiation of the ventral and dorsal horns andthe commissure of the gray matter, the ventral median sulcus,and the ventral, lateral, and dorsal funiculi of the whitematter were obtained in all subjects. Images of the thoracicspine allowed gray/white matter differentiation, but weremore prone to motion related signal artifacts.CONCLUSIONDelineation of the gross cross-sectional anatomy of thehuman spinal cord in vivo can be achieved in clinicallyacceptable scanning time using an optimized 2D FFE, T2-weighted sequence on a 3 T MR system with a dedicatedspine coil. This progress in resolution and tissue differentiationis expected to lead to improved evaluation of the locationand extend of tissue damage associated with disorders ofthe spinal cord. Preliminary applications to patients withmultiple sclerosis corroborate this expectation.KEY WORDS: Spinal cord, anatomy, high resolution MRimagingPaper 273 Starting at 10:23 AM, Ending at 10:31 AMQuantitation of the Intramyelinic Water Compartmentin Demyelinating Lesions of the Cervical Spinal Cord:Feasibility and Comparison with Magnetization Transferand Diffusion Tensor ImagingField, A. S. · Wu, Y. · Alexander, A. L. · Fleming, J. O. ·Duncan, I. D.University of WisconsinMadison, WIPURPOSETo test the feasibility of myelin water quantitation in the cervicalcord and compare these measurements in multiple sclerosis(MS) to other myelin-related parameters, specifically,magnetization transfer ratio (MTR) and fractional anisotropy(FA) of water diffusion.Thursday
ThursdayMATERIALS & METHODSSix healthy volunteers and four MS patients with visiblecord lesions underwent an inversion-prepared, multiple spinechopulse sequence that obtained 32 echoes from a singleslice at increasing TEs (1.5 T GE Signa, body coil transmit,single-element cervical spine coil receive, TI 1500 ms, TR3000 ms, echo spacing 7.2 ms, slice thickness 4 mm [sagittal]or 5 mm [axial], matrix 128 x 128, FOV 18 cm, NEX 2).Three of the volunteers were scanned twice, on separatedays, for reproducibility testing. T2 distributions were calculatedfor each voxel by nonnegative least-squares fitting ofthe decay curves (1). Myelin water fraction (MWF) wasdefined as the ratio Ss/(Ss+Sm), where Ss and Sm are thesignal amplitudes with short (10-50 ms) and medium (50-150 ms) T2 times, respectively. An interleaved 3D MTsequence (2) was used to minimize motion effects in obtainingMTR data. An FSE-based sequence (PROPELLER) (3)with 6 diffusion encoding directions was used to obtain diffusiontensor data, from which FA was calculated. Regionsof interest limited to cord parenchyma were obtained with asemi-automatic segmentation procedure using iterativethresholding to minimize partial volume effects.RESULTSMyelin water fractions in MS lesions were (mean ± SD) 20%± 3% compared to 25% ± 2% in controls (p < 0.05, two-samplet-test). Day-to-day coefficients of variation ranged from3-10%. There were no significant differences between sagittal-and axial-plane MWF measurements. Myelin water fractionand MTR were correlated over all subjects (R = 0.64)but not within groups (although within-group variance waslimited). Myelin water fraction and FA were highly correlatedover all subjects (R = 0.88) and remained correlated withingroups (R = 0.98 in MS lesions).CONCLUSIONThese preliminary results suggest that quantitation of theintramyelinic water compartment in cervical spinal cord isfeasible, reproducible, and sensitive to pathology in MSlesions. The MWF shows expected correlations with othermyelin-sensitive parameters but further study with morepathologically heterogeneous subjects is needed to elucidatethe extent to which MWF provides redundant or complementaryinformation.REFERENCES1. MacKay A, Whittall K, Adler J, Li D, Paty D, Graeb D. In VivoVisualization of Myelin Water in Brain by MagneticResonance. Magn Reson Med 1994;31(6):673-6772. Barker GJ, Tofts PS, Gass A. An Interleaved Sequence forAccurate and Reproducible Clinical Measurement ofMagnetization Transfer Ratio. Magn Reson Imag1996;14(4):403-4113. Pipe JG, Farthing VG, Forbes KP. Multishot Diffusion-Weighted FSE Using PROPELLER MRI. Magn Reson Med2002;47(1):42-52KEY WORDS: Myelin water, diffusion tensor, magnetizationtransferThe authors of this work have indicated the following affiliations/disclosures:General Electric Medical Systems: Useof proprietary, noncommercial software under researchagreement.214Paper 274 Starting at 10:31 AM, Ending at 10:39 AMSpinal Cord Atrophy Occurs Early in the NaturalHistory of Diabetic NeuropathySelvarajah, D. 1 · Wilkinson, I. D. 1 · Emery, C. J. 1 · Tesfaye,S. 2 · Shaw, P. J. 1 · Griffiths, P. D. 11University of Sheffield, Sheffield, UNITED KINGDOM,2Royal Hallamshire Hospital, Sheffield, UNITED KINGDOMPURPOSEDiabetes is among the most common diseases to affect thenervous system. Distal symmetrical polyneuropathy (DSP)is its most frequent consequence, affecting 40% of diabeticpatients. Once considered a disease of the peripheral nervoussystem, manifestations of DSP within the central nervoussystem are being increasingly recognized. Spinal cord atrophyhas been reported previously by our unit, in establishedDSP but the relevance of this to its pathogenesis depends ifspinal cord involvement occurs early in the natural history(1).MATERIALS & METHODSTo date, 77 type 1 male diabetic patients and 15 healthy volunteers(HV) have been studied. Following a detailed neurologicevaluation, diabetic patients were divided into threegroups. Group 1, 27 had no DSP (No-DSP), group 2, 20 hadsubclinical or early DSP (Sub-DSP) and group 3, 30 hadestablished DSP (Est-DSP). All patients and HV underwentMR imaging of their cervical spine using a standard spinalphased-array receive-only RF coil on a system operating at1.5 T (Eclipse, Philips Medical Systems). T2*-weightedimaging was performed axially from C1-T2 using a gradientechotechnique (TE = 17.9 ms, TR = 800 ms; a = 40 o ; slicethickness = 4 mm; in-plane resolution = 0.78 mm x 0.96mm). Images were postprocessed on a Sun Workstation andcross-sectional cord area was calculated, at disk spaceC2/C3, using the image display program Dispimage (2).Calculated CSA then were corrected for errors in slice positioningand as this is a cross-sectional study, corrections forshrinkage over time were also made. Inter and intraobservervariations were determined.RESULTSGroup means were compared first using one-way Anova (p< 0.0001) and then independently with t-tests. Mean cordCSA was significantly lower in both Est-DSP and Sub-DSPcompared to either HV or No-DSP (p < 0.0001). There wereno significant differences in cord CSA between the two DSPgroups (Sub-DSP vs Est-DSP, p = 0.81) or between Sub-DSPand HV (p = 0.71). In addition 15% of Sub-DSP and a comparable16% of Est-DSP had spinal cord atrophy (2SD belowmean CSA of HV). Further morphometric analysis showedan early reduction in the mediolateral cord diameter beforereduction in the anteroposterior diameter (p = 0.025).CONCLUSIONThis study shows that spinal cord involvement occurs earlyin the natural history of DSP, suggesting concomitant spinalcord and peripheral nerve involvement. Furthermore thecord shape changes quantified as an early reduction in themediolateral cord diameter suggests preferential involvementof the spinothalamic tracts in DSP. Finally this rapid,noninvasive test may serve as an early marker for DSP.
REFERENCES1. Eaton SM, Harris ND, Rajbhandari S, Greenwood P, WilkinsonID, Ward JD, et al. Spinal Cord Involvement in DiabeticPeripheral Neuropathy. Lancet 2000;35-362. Losseff NA, Webb SL, O’Riordan JI, Page R, Wang L, BarkerGJ, et al. Spinal Cord Atrophy and Disability in MultipleSclerosis. A New Reproducible and Sensitive MRI Methodwith Potential to Monitor Disease Progression. Brain1996;119:701-708KEY WORDS: Distal symmetrical polyneuropathy, diabetesmellitus, spinal cordPaper 275 Starting at 10:39 AM, Ending at 10:44 AMGlioblastoma Multiforme of the Conus Medullaris in aChild: Description of a Case and Literature ReviewStecco, A. 1 · Dietrich, R. B. 2 · Boldorini, R. 1 · Quirico, C. 1 ·Giampietro, A. 1 · Carriero, A. 11Università Piemonte Orientale-Novara, Novara, ITALY,2University of California San Diego Medical Center, SanDiego, CAPURPOSEIntramedullary neoplasms are rare (5%) (1). In children, thequotient of intramedullary tumors is higher, rising up to 35%of all spinal neoplasms(2), and mostly low-grade gliomas(89%). We describe the MR and pathologic features in a caseof glioblastoma multiforme of the conus medullaris, thatoccurred in a child.MATERIALS & METHODSC.O., male 14 years old, came to our attention for slowlyprogressive motor weakness of the legs, exacerbated 15 daysbefore after a minor accidental trauma. He showed an importantparaparesis, abnormal gait, right foot flexion failure,right scyatalgia, urinary function alteration, perineal hypoaesthesia.Achillear reflexes were absent. Brain and spineMR scans were performed, and then a surgical bioptical andexcisional procedure. Patient came back at follow-up examinationafter 12 months.RESULTSMR scan showed at T12 level, an intramedullary signal alterationextending to the L1 level. The finding, sized 3.5 x 2cm, with ovoid morphology, showed homogeneous hyperintensesignal in T2-weighted images, hypointense signal inT1-weighted images, was well demarcated, with a circumferentialcord expansion. After gadolinium, there was a slightand faint enhancement localized in two nodules in the uppercranial portion of the conus, better shown in the coronalplane. The finding was consistent with a spinal cord lowgradeastrocytoma. The patient has been treated surgicallywith ablation of the mass, resulting in a postoperative coursewith a moderate progressive improvement of leg strength,but also with a neurologic impairment of bladder function.Eight months after the surgical treatment, the patient showeda local recurrence with leptomeningeal endocanalar spreadall along the spinal canal and the posterior fossa. PathologicFindings: On H&E, the tumor was composed of moderatelypleomorphic cells, with iperchromatic nuclei and prominentnucleoli, that focally stained by anti-GFAP antibody.Occasionally, mucoid degeneration, microcysts, and215microvascular proliferation were found. No necrotic areaswere identified. Mitotic index was low (2 x 10HPF), butgrowth fraction, as determined by anti-Ki67 antibody indicatehigh proliferative tumor-cell activity (25%). p53 washighly expressed (65%). The final pathologic response wasconsistent with a glial intramedullary neoplasm compatiblewith glioblastoma multiforme (GBM).CONCLUSIONAstrocytomas are the more frequent intramedullary neoplasmin children. The single isolated conus medullarisinvolvement is reported in few cases in the literature (3). Intwo large pediatric intramedullary neoplasm case series,high-grade astrocytoma (III and IV) accounted for 5% and11% of the cases. In rare cases, there can be a metastaticlocalization in the conus from a brain primitive GBM localizationelsewhere. Spinal astrocytomas in the pediatric agemust be differentiated from gangliogliomas, ependymomas,and epydermoid/dermoid tumors. This case appears unusualboth for the hysto-type and the non-specific MR features.REFERENCES1. Baleriaux DLF. Spinal Cord Tumors. Eur Radiol 1999;9:1252-12582. Costantini S, Houten J, Miller D, et al. Intramedullary SpinalCord Tumors in Children under the Age of 3 Years. JNeurosurg 1996;85:1036-10433. Hida K, Iwasaki Y, Cho K, et al. Gliomas of the ConusMedullaris. Paraplegia 1994;32(1):52-58KEY WORDS: Intramedullary, neoplasm, glioblastomaPaper 276 Starting at 10:44 AM, Ending at 10:52 AMClinical and MR Imaging Features of CavernousMalformations of the Spinal CordColosimo, C. 1 · Tartaro, A. 1 · Cerase, A. 2 · Di Lella, G. M. 3 ·Meglio, M. 3 · Maira, G. 31University of Chieti, Chieti, ITALY, 2 Azienda OspedalieraUniversitaria Senese, Siena, ITALY, 3 UCSC, Policlinico,Rome, ITALYPURPOSESpinal cord cavernous malformations (SCCMs) are by farless common and less known than brain cavernous malformations,but may induce severe neurologic deficits, eventuallyrequiring surgical treatment. The purpose of this presentationis to describe clinical and MR imaging features ofSCCMs, in order to define incidence of clinically significanthemorrhages, and report MR imaging diagnosis, as well ason neurologic outcome, and follow-up after surgery.MATERIALS & METHODSClinical and MR imaging data of 15 patients (9 males and 6females, age range 10-61 years) with a definite diagnosis of16 SCCMs are reported. Ten patients have been examined at1.5 T, 1 at 1 T, and 4 at 0.5 T units. GRE T2*-weightedimages were obtained in all the patients, and postgadolinium-enhancedT1-weighted images in 13. Selective digitalsubtraction angiography was performed in 3 patients. Twelvepatients have been operated: follow-up duration range is 2-15 years.Thursday
ThursdayRESULTSTypical strong hypointensity on GRE T2*-weighted imageswas found in all the 16 SCCMs. A central hyper-intense corewas seen on T2-weighted images in 9 patients and on T1-weighted images in 7 patients. Faint to moderate contrastenhancementoccurred in 4 SCCMs. Adjacent dilatedenhancing veins were shown in 3 patients. Macroscopic“extra-capsular“ hemorrhage was found in 4 SCCMs atsymptoms onset, and occurred during follow-up in 2SCCMs. In 11 out of the 12 operated patients, SCCMs werecompletely microsurgically removed. Six months after surgery,7 patients did not changed in their neurologic status,four improved, and one worsened. In 9 out of the 11 completelyremoved SCCMs, there was a persistent stronghypointensity on GRE T2*-weighted images, due to residualhemosiderosis of adjacent spinal cord.CONCLUSIONMR features of SCCMs are exactly the same as brain cavernousmalformations. Macroscopic hemorrhages seem tooccur more frequently. Postsurgical outcome is better than inother intramedullary spinal cord tumors, thus aggressive surgicalapproach is to be considered justified.KEY WORDS: Spinal cord cavernous malformations, MRimaging, follow-up216inflation of the balloon. The wire is removed and the animaltransported to the MR suite, where PC MR imaging isrepeated.RESULTSPC MR flow studies in the dog show two nodes withincreased velocities in the anterior subarachnoid space, as inhumans (Figure 2). With the inflation of the balloon in theforamen magnum, CSF velocities and CSF pressure fluctuationsincrease.Paper 277 Starting at 10:52 AM, Ending at 11:00 AMEffect of Relative Obstruction at the Foramen Magnumon Cerebral Spinal Fluid Velocities and Pressuresthrough the Cardiac Cycle: Studies in an ExperimentalModelTurk, Q. · Quigley, M. · Iskandar, B. · Haughton, V. M.University of Wisconsin Hospitals and ClinicsMadison, WIFigure 1.* Fluoroscopic image shows position of the Radiwire in the subarachnoid space and of the balloon catheter atC2 in the foramen magnum. The balloon is inflated with contrastmedium.PURPOSEThe purpose of the study is to test the hypothesis that elevationsin cerebral spinal fluid (CSF) velocity in the foramenmagnum during the cardiac cycle predict increased CSFpressure fluctuations at the foramen magnum.MATERIALS & METHODSMR images transversely through the foramen magnum areacquired with phase contrast velocity encoding techniques inmongrel dogs under ketamine anesthesia. Cerebral spinalfluid flow is calculated from the dogs as in human studies.For the CSF pressure measurements, the dog is placed on thefluoroscopic table in the animal laboratory. The lumbar subarachnoidspace is cannulated and a Radi 0.014 “ guide wiremounted pressure sensor (17 mm length) is passed throughthe cannula and into the subarachnoid space and into theinferior posterior fossa. Cerebral spinal fluid pressures arerecorded with an Accuphase monitor. The catheter is withdrawnto the upper cervical spinal canal and pressure measurementsrepeated. To simulate obstruction, a ballooncatheter (Commodore 3.5 x 10 mm, 0.015 ID) is insertedpercutaneously through the cannula and manipulated underfluoroscopic monitoring to the foramen magnum (Figure 1).After placement of the balloon catheter, pressures are measuredabove and below the balloon catheter before and afterFigure 2. Surface contour display of the CSF velocity data inan axial image at the foramen magnum in a dog. Highervelocities are evident in the anterior subarachnoid space (furtherfrom viewer) and reduced flow in the posterior subarachnoidspace (closer to viewer). Velocities are greatestanterolateral to the cord, as in normal human subjects.CONCLUSIONChanges in CSF velocity increases in the foramen magnumduring the cardiac cycle correlate with changes in CSF pressurefluctuations. The increase in pressure correlates positivelywith an increase in peak systolic and peak diastolicvelocity.KEY WORDS: Chiari I malformation, syringomyelia, CSFflow
Paper 278 Starting at 11:00 AM, Ending at 11:08 AMMotion of the Spinal Cord during the Cardiac Cycle inAdult Patients with a Chiari I Malformation and AdultVolunteers217CONCLUSIONSpinal cord velocities are not increased significantly inpatients with a Chiari I malformation. The motion of thespinal cord may be secondary to the acceleration of CSFflow.Quigley, M. 1 · Haughton, V. M. 1 · Nicosia, M. 2 · Iskandar, B. 11University of Wisconsin Hospitals and Clinics, Madison,WI, 2 University of Minnesota, Minneapolis, MNPURPOSESpinal cord and tonsils have been reported to move at greatervelocities in patients with a Chiari I malformation than innormal subjects. Whether spinal cord movement is primaryor secondary to CSF flow is not known. Therefore, we measuredcord velocities and compared them to CSF velocities innormal subjects, patients with a Chairi I malformation, andpatients who underwent cranio-occipital decompression fora Chiari I malformation.MATERIALS & METHODSWe acquired cardiac gated PC MR imaging in axial plane atthe foramen magnum in groups of Chiari I patients prior tocranio-occipital decompression, in the same group afterdecompression, and in 10 normal volunteers. Cerebral spinalfluid velocity averaged over the foramen magnum was calculatedby conventional methods at 14 points during the cardiaccycle. Movement of the spinal cord was calculated bymeasuring the velocity of voxels superimposed on the spinalcord at the same 14 time points. The CSF and spinal cordvelocities in the same subject were compared. Averages forCSF velocity and spinal cord velocity at each point in thecardiac cycle were computed for the normal subjects andpatients pre and postoperatively.RESULTSSpinal cord velocities are small compared to CSF velocitiesin all three groups. Little difference is noted in the threegroups. All three groups show a small low velocity caudaddisplacement at the 3rd time point in the cardiac cycle and alow velocity displacement of the cord in a cephalad directionat the 12th point. These displacements coincide with themaximal acceleration of CSF flow in the same direction.Figure 1: CSF (black line) and spinal cord velocities (blackline with error calculation) over the cardiac cycle at the foramenmagnum in a patient with a Chiari I malformation. Notethat CSF velocities exceed the cord velocities. Maximal cordvelocities coincide with the maximal change in velocity ofthe CSF at the 3rd and 12th time point in the cardiac cycle.KEY WORDS: Chiari I malformation, CSF flow, MR imagingPaper 279 Starting at 11:08 AM, Ending at 11:16 AMSpiraling Crescent Sign of Cervicocephalic ArterialDissectionLiebeskind, D. S. · Cross, B. J. · Weigele, J. B. · Hurst, R. W.University of PennsylvaniaPhiladelphia, PAPURPOSECervicocephalic arterial dissection results from trauma or aninherent structural defect in the vessel wall. Although microscopicexamination may reveal disruption of normal vesselwall architecture caused by intramural hematoma, grosspathologic evaluation yields minimal insight on the specificpathophysiologic events associated with dissection. We characterizedthe morphology of cervicocephalic arterial dissectionand investigated the spiraling configuration of the intramuralhematoma on MR imaging acquired at initial diagnosis.MATERIALS & METHODSRetrospective review of axial fat-saturated T1-weighted MRimaging acquired at the time of initial diagnosis of cervicocephalicarterial dissection was conducted in 43 cases (medianage 47 years, range 20-70 years; 25:18 M:F). Detailedmorphologic analysis of 49 dissections included measurementof dissection length, degree of luminal stenosis, shapeof the intramural hematoma, presence of spiraling, and rateof spiraling along the vertical axis.RESULTSMorphologic analyses included 28 left internal carotid, 21right carotid, 13 left vertebral, and 8 right vertebral arterydissections. Dissection length averaged 18.9 mm (range 5-48mm). Intramural hematoma resulted in elongated luminalstenoses (mean 35.4%, SD ± 10.4%), with vessel occlusionin 3/49 (6%) dissections. A crescentic intramural hematomawas observed in 38/49 (78%). Spiraling of the intramuralhematoma and corresponding vessel lumen was noted in34/46 (74%) of dissections that were observed on more thanone axial slice. An overall clockwise orientation was readilyapparent in 18/34 (53%) spiraling dissections, with a counter-clockwiseorientation in 16/34 (47%). The overall orientationof spiraling was not dependent on vessel type or laterality.Detailed measurement revealed that the dissections spiraledan average of 9.14 degrees per mm of dissectionlength. Spiraling was less apparent in short or segmental dissectionsand lesions situated at the transverse portion of thevertebral artery. The orientation of spiraling noted ondetailed measurement changed direction in 23/34 of spiralingdissections, typically occurring only after the proximalsegment of the dissection.Thursday
ThursdayCONCLUSIONA spiraling, crescentic intramural hematoma or a helicalflow void may be characteristic findings of cervicocephalicarterial dissection. The spiraling crescent sign of dissectionmay have clinical applications in the diagnosis of dissectionor identification of dissecting aneurysms. Spiraling may beinapparent in short, segmental dissections or isolated vertebraldissections. The pattern of spiraling in cervicocephalicarterial dissections suggests that the spiral configuration mayresult from a combination of hemodynamic forces that aremaximal at the proximal end of the dissection interactingwith influences of vessel wall architecture that increasealong a longitudinal gradient.218head at midline. There was no change in right vertebralartery flow when the head was turned to the right. Pinchingof the vertebral arteries was observed at C2 where the vertebralarteries course anteriorly.CONCLUSIONRotational vertebral artery occlusion is a rare cause of transientvertebrobasilar insufficiency and syncope. This casedemonstrates the effectiveness of dynamic angiography inestablishing this diagnosis.KEY WORDS: Rotational vertebral artery occlusion, BowHunter’s stroke, dynamic angiographyKEY WORDS: Dissection, vascular, strokePaper 280 Starting at 11:16 AM, Ending at 11:21 AMDynamic Angiography in the Diagnosis of RotationalVertebral Artery OcclusionKoenigsberg, R. · Vakil, N. · Schwartz, L.Drexel University College of Medicine (formerly MCPHahnemann)Philadelphia, PAPURPOSERotational vertebral artery occlusion is a condition whereblood flow through the vertebral artery is compromised duringhead movement. It also is known as “Bow Hunter’sstroke.” We describe the use of dynamic angiography in theevaluation of a rare case of bilateral rotational vertebralartery occlusion.MATERIALS & METHODSA 17-year-old female presented to the neurosurgery outpatientclinic with a history of headaches and syncope. Pastmedical history was remarkable for frequent joint dislocation,T1/T2 degenerative disk disease, asthma, and familyhistory of connective tissue disease. Following a geneticconsultation, patient was diagnosed with Nail-Patella syndrome,a rare genetic disorder affecting bone and connectivetissue with variable symptomatology. Dynamic angiographyestablished rotational vertebral artery occlusion. A C1-C2fusion was performed to limit rotation and arterial compression.RESULTSMR angiography demonstrated no cerebral vascular abnormalitiesexcept for tortuosity of the distal left vertebralartery. Conventional angiography demonstrated no evidenceof occlusion or stenosis in the anterior cerebral circulation;there was no evidence of vertebral artery occlusion and therewas an intact posterior communicating artery. However,when the patient was asked to turn her head to the right, leftvertebral angiography demonstrated complete occlusion ofthe left vertebral artery; flow was progressively restored asthe patient shifted her head towards midline with completerestoration of vertebral artery flow with the head at midline.Similarly, right vertebral angiography demonstrated completeocclusion of the right vertebral artery when thepatient’s head turned to the left; flow was progressivelyrestored as the patient shifted her head towards midline withcomplete restoration of right vertebral artery flow with thePaper 281 Starting at 11:21 AM, Ending at 11:26 AMLymphoma of a Lumbar Nerve Root: Confirmation with18 Fluorodeoxyglucose Positron Emission TomographyChao, C. P. · Kotsenas, A. L. · Weindling, S. M. · Broderick,D. F.Mayo ClinicJacksonville, FLPURPOSELymphoma uncommonly involves extradural nerve rootsand can be difficult to distinguish from benign nerve sheathtumors on MR imaging (1). This case illustrates the utility of18fluorodeoxyglucose positron emission tomography ( 18 FDG-PET) imaging in the discrimination of malignant and benignnerve root lesions through an unusual case of a large B-celllymphoma involving the second lumbar (L2) nerve root.MATERIALS & METHODSA 69-year-old male presented with progressive left hip,thigh, and knee pain, left leg weakness, and a 30-poundweight loss over 4 months. MR imaging of the lumbar spinewas performed without and with gadolinium followed bywhole body 18 FDG-PET.RESULTSMR imaging of the spine revealed contrast enhancement andenlargement of the intrathecal and extradural intraforaminalportion of the left L2 nerve root with widening of the foramen.The intrathecal involvement resembled leptomeningealcarcinomatosis; however, the intraforaminal nerve rootinvolvement raised the possibility of a concurrent benignnerve sheath tumor. A PET scan demonstrated abnormalhypermetabolic activity within the lumbar thecal sac andextending into the left L2 neural foramen corresponding tothe enhancement on MR imaging. Malignancy was confirmedby cerebral spinal fluid cytology consistent with alarge B cell lymphoma.
CONCLUSIONSeveral reports have described the utility of PET in differentiatingmalignant from benign schwannomas (2, 3).Lymphomatous involvement of the central nervous systemsometimes exhibits similar MR findings as benign tumorssuch as schwannomas and neurofibromas. In this case,18FDG-PET imaging noninvasively established the spinalnerve root lesion as a malignancy distinct from other benigntumors.REFERENCES1. Viswanathan R, Swamy NK, Vago J, Dunsker SB. Lymphomaof the Lumbar Nerve Root: A Case Report. Neurosurg1997;41(2):479-4822. Ferner RE, Lucas JD, O’Doherty MJ, et al. Evaluation of18Fluorodeoxyglucose Positron Emission Tomography( 18 FDG PET) in the Detection of Malignant Peripheral NerveSheath Tumours Arising from within PlexiformNeurofibromas in Neurofibromatosis 1. J Neurol NeurosurgPsychiatry 2000;68(3):353-3573. Ahmed AR, Watanabe H, Aoki J, Shinozaki T, Takagishi K.Schwannoma of the Extremities: The Role of PET inPreoperative Planning. Eur J Nucl Med 2001;28(10):1541-1551KEY WORDS: Lymphoma, FDG-PET, nerve root219adjacent spinal cord. These findings confirmed the extradurallocation of the lesion. In case 2, a CT myelogram was performedin conjunction with an MR image of the thoracicspine to help elucidate the location of the lesion. The CTmyelogram demonstrated a purely extradural mass extrudingthrough a widened right neural foramen without bonydestruction. The spinal cord was deviated to the left withalmost complete obliteration of the intraduralextramedullary space on the left side. MR imaging furthercharacterized the hypervascularity of the mass and demonstratedassociated surrounding flow voids. The lesions wereconfirmed to be hemangioblastomas by pathology. Thesetwo patients were screened and found not to have Von HippelLindau disease.Paper 282 Starting at 11:26 AM, Ending at 11:31 AMSporadic Extradural Spinal Hemangioblastoma: Reportof Two CasesZimmerman, D. L. · Lefton, D. R. · Pinto, R. S.Beth Israel Medical CenterNew York, NYPURPOSESpinal hemangioblastoma is an uncommon, but well-recognizedbenign hypervascular tumor, typically intramedullaryand less often, intradural extramedullary in location.Extradural spinal hemangioblastomas are quite rare.Delineating certain imaging characteristics of this lesion isimportant in establishing a differential diagnosis. We reporttwo sporadic cases of extradural spinal hemangioblastoma.MATERIALS & METHODSThe imaging findings were reviewed in two cases ofextradural spinal hemangioblastoma. In case 1, a 51-year-oldmale presented with worsening radicular back pain. MRimaging with gadolinium was performed with subsequentpreoperative angiographic embolization for tumor devascularization.In case 2, a 62-year-old female presented withprogressive midback pain. An initial CT demonstrated aright-sided spinal/paraspinal mass. A CT myelogram andMR imaging of the spine also were performed.RESULTSIn case 1, the MR image of the spine demonstrated anintensely enhancing lesion that compressed the adjacentspinal cord and widened the right neural foramen.Associated flow voids were identified also. On T2 axialimages, the right-sided mass was capped posteriorly withhyperintense epidural fat (white arrow) and caused displacementof the hypointense dura medially to the left against theCONCLUSIONExtradural spinal hemangioblastoma is a rare hypervasculartumor, which is sometimes difficult to distinguish from alesion located in the intradural extramedullary space. MRimaging has become a standard imaging modality for evaluatingspinal lesions. The fat-cap sign and displacement of thedura are MR imaging characteristics, which help to delineatethe extradural location of a lesion. When these findings arepresent in conjunction with flow voids, an extradural spinalhemangioblastoma should be considered.REFERENCES1. Horner NB, Pinto RS. The Fat-Cap Sign: An Aid to MREvaluation of Extradural Spinal Tumors. AJNR Am JNeuroradiol 1989;10(5 Suppl):S93KEY WORDS: Hemangioblastoma, extraduralPaper 283 Starting at 11:31 AM, Ending at 11:36 AMMR Imaging of Brachial Plexopathy in a Patient withCharcot-Marie-ToothJones, J. O. · Kirsch, C. · Elrington, G.Bart’s & The London NHS TrustLondon, UNITED KINGDOMPURPOSECharcot-Marie-Tooth (CMT) disease is the most commoninherited degenerative peripheral nerve disorder; however,there are scant references of the imaging manifestations.This case presents the MR appearance of a brachial plexopathyfrom CMT1A with a review of the current imaging literature.Thursday
Thursday220MATERIALS & METHODSA 41 year-old female presented to her neurologist notingincreasing difficulty walking over a few years and controllingthe little finger of her right hand during a manicure. Shehad difficulty opening jars and deterioration of her handwriting.On exam a pes cavus, an areflexic right arm andmarked wasting of the right hand intrinsic muscles wasnoted.RESULTSBlood work revealed a chromosome 17p11.2 duplicationconsistent with a diagnosis of CMT1A. A brachial plexusMR image revealed impressive thickening and enhancementof the roots, trunks, and divisions of the brachial plexusbilaterally. Patient underwent subsequent right ulnar nerveroot decompression with marked improvement of symptoms.MATERIALS & METHODSA 47-year-old previously healthy white male presented withpain in the left arm followed by progressive left arm weakness.History was significant for playing 72 holes of golf ina golf marathon the previous day. The weakness progressedto the left leg and right arm. On exam, there was flaccidparalysis of bilateral upper extremities and left lowerextremity and 2/5 power in the distal right lower extremity.Vibration sense was absent on the right. There was absenceof all reflexes except Babinski which was present bilaterally.The patient also complained subsequently of difficulty inspeaking and shortness of breath for which he was intubated.RESULTSCT scan of the neck at admission showed acute hemorrhagein the cervical spinal cord. MR imaging of the cervical spineincluding GRE sequences showed extensive hyperacute andacute hemorrhage within the cord extending from mid C2 tomid C5 levels associated with significant surrounding edemaextending to the cervicomedullary junction. There was nohistory of coagulopathy and coagulation tests were normal.He was treated with high dose methylprednisolone (solumedrol),with dramatic improvement in paralysis in the next 48hours at which time he was extubated. Residual neurologicimpairment after 6 days consisted of mild weakness in theleft upper extremity and impaired pinprick in the thoracicdermatomes. Subsequent scans showed evolution of thehemorrhage to near total resolution. There was no evidenceof a discrete mass or enhancement to suggest tumor, abnormalvessels also were not noted.CONCLUSIONAlthough much is written of the genetics and clinical manifestationsof CMT, very little information is available aboutimaging features. Thickening of peripheral nerves is a clinicalfeature of CMT and occurring in up to 25% of cases.Diagnosis of CMT is made clinically with confirmatory electrophysiologicstudies, nerve biopsy, and genetic testing.However, radiologists should be aware of the imaging manifestationsas an important adjuvant to the diagnosis andmanagement.KEY WORDS: Brachial plexus, Charcot-Marie-Tooth,PlexopathyPaper 284 Starting at 11:36 AM, Ending at 11:41 AMWatch Your Swing: Unusual Cause of Cord HemorrhageIfthikharuddin, S. F. · Monajati, A.Rochester General HospitalRochester, NYPURPOSESpinal cord hemorrhage is not seen infrequently in cervicalspine trauma and in association with fracture and cord contusion.Spontaneous progressive hemorrhage followingrounds of golf albeit several with near complete clinical andradiologic resolution has not been reported before.CONCLUSIONThis case illustrates two important points: Massive hemorrhagewithin the cord even when associated with substantialedema does not necessarily indicate poor prognosis.Significant hemorrhage can occur without high impact traumaor fracture.REFERENCES1. Flanders AE, Spettell CM, Friedman DP, Marino RJ, HerbisonGJ. The Relationship between the Functional Abilities ofPatients with Cervical Spinal Cord Injury and the Severityof Damage Revealed by MR Imaging. AJNR Am J Neuroradiol1999; 20:926-934KEY WORDS: Spinal cord, hemorrhage
221Thursday Morning10:15 AM - 11:45 AMRoom 602 - 603Thursday Afternoon1:00 PM - 2:30 PMBallroom 6 A(55) ELC Workshop E: WebsiteCreation for Advanced Users(57) Dynamic and UprightMRI/Sciences (ASSR)Thursday Morning11:50 AM - 12:50 PMRoom 611 - 612— Dale A. Charletta, MD(56) American Society of SpineRadiology (ASSR) Annual BusinessMeeting (Members Only)(57a) Spinal Instability— Luigi Manfrè, MD(57b) Dynamic Imaging of the Posterior Elements— J. Randy Jinkins, MD, FACR, FEC(57c) Normal and Abnormal Disks— Jeffrey Silber, MD(57d) Dynamic Disk Pressure Measurements— Kurt P. Schellhas, MD(57e) Dynamic Vertebral Body Mechanics— Stephen M. Belkoff, MDModerators:Michael I. Rothman, MDBruce A. Wasserman, MDSpinal InstabilityLuigi Manfrè, MDLEARNING OBJECTIVESUpon completion of this session, participants will be able to:1) Describe indirect sign of micro-instability of the lumbarspine on CT scan and MR imaging2) Evaluate the physiologic and pathologic CT and MR findingsusing an axial-loader device3) Summarize the role of ligaments and muscles in determiningspinal instabilityThursdayPRESENTATION SUMMARYThe evolution of new deals in the treatment of spinalmicroinstability has overcome the old fashion conservativemanagement in recent years. Enthusiastic results of minimalinvasive surgery vs conservative management in case ofspondylolisthesis are summarized by the fact that surgicalimmobilization restoring load sharing to the anterior columneliminate the pain coming from the disk and articular jointsin 89% of patients. Nevertheless, neuroimaging of spinalinstability remained, for a long time, unable to demonstratemore than simple macroscopic changes in spine morphology,and the diagnosis of spinal instability remained a "unproved
Thursdaylabel for back pain patients," according to Nachemson. Themain problem we have to face is definitely the real source ofback pain in spinal instability. In 1989, Kuslich and coworkersdemonstrated the endplates, the spinal processes, thearticular facets to be involved, similar to diskal outer nerves,in the mechanism of lumbalgia. X-ray film criteria for spinalinstability, like an angle between spinal processes more than11° when compared to adjacent segments, or antero-posteriortranslation of vertebral bodies more than 3.5 mm, orwidening of articular facet joint space and/or facet rotationon a lateral view, or lateral tilting of the vertebral body onantero-posterior view, should not be considered the onlyradiologically proven pictures for the diagnosis of spinalinstability. We will split our evaluation of modern neuroimagingof spinal instability into two parts: first, we willanalyze "conventional" CT and MR signs, that can bedemonstrated in a patient lying in the supine position whenthe study is performed, and then we will talk about "in vivo"dynamic CT-MR changes demonstrated by the use of anaxial-loader while the neuroimaging is performed.According to Jinkins and Kaech work (see "SpinalRestabilization Procedures," DL Kaech and JR Jinkins, Eds.,Elsevier 2002), in backward listhesis, 2 phases can berevealed on neuroimaging: o Phase 1, or "coarse stippling"phase, with joints effusion, with widening of intraarticularspace and narrowing of spinal foramina. o Phase 2, with contactbetween superior articular process and the isthmus of thesuperior vertebral body, with bone erosion-sclerosis. In thesepatients, bone changes can be detected equally by CT andMR scans: however, MR imaging demonstrates bone marrowsignal changes suggestive of local instability and localgranulomatous tissue responsible for back pain. In theanterolisthesis, first a remodelling process of articular jointsoccurs ("bending"), with destruction of articular cartilageand bone marrow edema (i.e., low signal intensity on T1-weighted images and long signal intensity on very long TEscans, preferably on STIR sequences). Second, fatty degenerationof the inflamed bone marrow leads to high signalintensity of the pedicle on T1-scans, and finally severe sclerosisof the pedicle-articular processes occurs, with darkeningof the signal intensity in all the sequences. However,conventional MR scans should be focused not only on vertebralevaluation, but on articular-ligaments-muscles complextoo, as spinal instability can be related to local inflammatoryor atrophic changes (i.e., muscle trauma, or miositis).Nevertheless, conventional CT and MR imaging of the spinesuffer from the original sin that is to evaluate the spine on aload-free position (the supine position), in a patient that generallysuffers from pain when the upright position isassumed: for this reason we prefer to analyze patients beforeand during spine compression using a special device, called"axial-loader." The axial loader device is CT and MR imagingcompatible, and mimic the head-trunk load on the spine,the way we can demonstrate morphologic changes in apatient when the lumbar or cervical spine is compressed (i.e.,widening or narrowing of articular spaces and foramina,movement of vertebral bodies, diskal changes, functionalsynovial cists, spinal root compression). Finally, new minimallyinvasive treatments of local pain related to spinalinstability will be discussed.222Dynamic Imaging of the Posterior ElementsJ. Randy Jinkins, MD, FACR, FECLEARNING OBJECTIVESUpon completion of this session, participants will be able to:1) Differentiate the concepts of positional, kinetic andrecumbent imaging2) Define the clinical indications for recumbent, positionaland kinetic imaging3) Summarize the significance of upright, weight-bearing,dynamic-kinetic imaging of the spinePRESENTATION SUMMARYIntroduction: MR imaging using commercial systems untilthe present has been limited to acquiring scans with patientsin the recumbent position. It is a logical observation that thehuman condition is subject to the effects of gravity in positionsother than that of recumbency. In addition, it is clearthat patients experience signs and symptoms in positionsother than the recumbent one. For this reason, a new fullyopen MR imaging unit was configured to allow upright,angled-intermediate, as well as recumbent imaging. TheStand-Up MRI System: Examinations were performed onan open full-body MR imaging system (Stand-UpTM MRI,Fonar Corporation, Melville, NY). The system operates at0.6 T field strength using an electromagnet with a horizontalfield, transverse to the axis of the patient's body. In additionto traditional recumbent neutral MRI (rMRI), the Stand-Up MRI system enabled upright neutral positional MRI(pMRI), and dynamic-kinetic MRI (kMRI). Discussion:Nondynamic upright weight-bearing MR imaging, orupright-neutral pMRI, showed a phenomenon here termedspinal column "telescoping" whereby the levels of generalizedintersegmental spinal degeneration showed a collapseof the spine into itself. Consequent redundancy of the posteriordiskal and ligamentous tissues of the spine as well ascraniocaudal shortening of the spine associated with telescopingcaused increased degrees of neural foramen stenosison pMRI over that of rMRI. Upright extension kMRI tendedto show greater degrees of neural foramen stenosis, whileflexion kMRI revealed a lessening or complete resolution ofthis same neural foramen narrowing. These phenomena wereobserved only at levels of intervertebral disk degeneration(i.e., both disk desiccation and disk space narrowing).Spatial alterations also were observed in cases of sagittalplane hypermobile intersegmental spinal instability.Utilizing kMRI, it was possible to judge even minor degreesof translational hypermobile spinal instability (e.g., mobileantero- or retrolisthesis) grossly as well as by using directregion of interest measurements. These changes wereaccompanied by a relative worsening of the isolevel narrowingof the neural foramina. Furthermore, comparitive rMRIand kMRI imaging revealed instances of posterior columnintersegmental hypermobility both due to posterior spinalligament rupture as well as to fractures of the posterior spinalelements. The fractures were observed both in the presenceand absence of underlying bony abnormality. These dynamicalterations were occult on the rMRI examinations, andtherefore diagnostically overlooked. Conclusions: To conclude,the potential relative beneficial aspects of upright,weight-bearing (pMRI), dynamic-kinetic (kMRI) spinalimaging on this system over that of recumbent MR imaging(rMRI) include: revelation of occult degenerative spinal diseasedependent on true axial loading (i.e., weight-bearing),
unmasking of kinetic-dependent degenerative spinal disease(i.e., flexion-extension), and the potential ability to scan thepatient in the position of clinically relevant signs and symptoms.Overall, it was found that rMRI underestimated themaximum degree of degenerative spinal pathology andmissed altogether its dynamic nature, factors that arerevealed optimallywith p/kMRI.BIBLIOGRAPHY1. Jinkins JR, Dworkin JS, Green CA, Greenhalgh JF, Gianni M,Gelbein M, et al. Upright, Weight-Bearing, Dynamic-KineticMagnetic Resonance Imaging of the Spine - Review of theFirst Clinical Results. J Hong Kong Coll Radiol 2003;6:55-742. Jinkins JR, Dworkin J. Upright, Weight-Bearing, Dynamic-Kinetic MRI of the Spine: pMRI/kMRI. In: Spinal RestabilizationProcedures: Diagnostic and Therapeutic Aspects ofIntervertebral Fusion Cages, Artificial Discs and MobileImplants. Kaech DL, Jinkins JR (Eds.). Amsterdam: Elsevier;2002:73-823. Jinkins JR, Dworkin JS, Green CA, Greenhalgh JF, Gianni M,Gelbein M, et al. Upright, Weight-Bearing, Dynamic-KineticMRI of the Spine: pMRI/kMRI. Riv di Neuroradiol2002;15:333-3564. Jinkins JR, Dworkin J. Upright, Weight-Bearing, Dynamic-Kinetic MRI of the Spine: pMRI/kMRI. Asian Oceanian JRadiol 2002;7:135-1525. Jinkins JR, Dworkin J. Upright, Weight-Bearing, Dynamic-Kinetic MRI of the Spine: pMRI/kMRI. Rachis: Revue dePathologie Vertebrale;13(5/6):322-327Disclosure: The author of this presentation has indicated anaffiliation with Fonar Corporation: Stock options, Researchgrant, Speakers' bureau.Normal and Abnormal DisksJeffrey Silber, MDJeff Silber is presently an assistant professor in the departmentof orthopedic surgery at North Shore-Long IslandJewish Health System affiliated with the Albert EinsteinSchool of Medicine. He is chief of orthopedic spinal surgeryat Long Island Jewish Medical Center located in New HydePark, Long Island, NY. He is Board Certified in OrthopaedicSurgery. Dr. Silber graduated number one from New YorkMedical College in 1995 and completed an orthopedic residencyat The University of Pennsylvania in 2000. He thencompleted a combined orthopedic and neurosurgical spinefellowship at Thomas Jefferson University in 2001. Prior toattending medical school he also achieved a doctorate inchiropractic. He has over 30 peer-reviewed maunuscriptsand has coauthored many chapters dealing with spinal-relatedconditions. He has presented nationally including theAmerican Academy of Orthopedic Surgery, and NorthAmerican Spine Society and has received research awardsincluding the Cervical Spine Research Society award.223LEARNING OBJECTIVESUpon completion of this session, participants will be able to:1) Differentiate the normal and abnormal functions of theintervertebral disk2) Define the basic pathophysiology of intervertebral diskdegeneration3) Discuss the design and function of an intervertebral diskreplacement4) Measure outcomes and challenges, and recognize thefuture of intervertebral disk replacementsPRESENTATION SUMMARYIntervertebral disk degeneration is a ubiquitous problem producingpain and disability affecting almost every individualthroughout their lifetime. This has resulted in an enormousloss of workdays and an expenditure of billions of dollarsannually. Recent advances in the study of the intervertebraldisk has led to a better understanding of normal and abnormaldisk biology, and biomechanics. Furthermore, theseadvances have increased our understanding of the pathophysiologyof disk degeneration, leading to increased interestin early diagnosis, prevention, and management of thiscondition including intervertebral disk replacements. Diskreplacements are being performed with increasing frequencyboth in Europe and more recently in the United States. Thechallenges of these devices, which are still not completelydefined, include the composition compatibility in humanspertaining to long-term particulate debris and failure, biomechanicalsimilarities to the normal human intervertebral disk,and adjacent level intervertebral disk degeneration.Objectives to be covered include lumbar intervertebral diskanatomy, biology, biomechanics, and motion in the normaland degenerated (abnormal) disk, the process of disk degeneration,and the current surgical management with anemphasis on intervertebral disk replacement composition,design biomechanics, function, outcomes, complications,and future challenges and considerations.Disclosure: The author of the presentation has indicated thathe will be discussing/presenting an unapproved/investigativeuse of Intervertral disc replacementDynamic Disk Pressure MeasurementsKurt P. Schellhas, MDLEARNING OBJECTIVESUpon completion of this session, participants will be able to:1) Describe normal thoracic disk biomechanics2) Describe technique of thoracic disk puncture and introductionof diagnostic and potentially therapeutic devicesPRESENTATION SUMMARYThis study was undertaken to measure thoracic intervertebraldisk pressure (IDP) in healthy disks within asymptomaticvolunteers during various physical maneuvers. Six healthyasymptomatic volunteers (4 male, 2 female: age 19-47 years)underwent high field magnetic resonance (MR) imaging ofthe thoracic spine, followed by intradiskal pressure (IDP)measurement in either one or two thoracic disks from themid (T6-7 or T7-8) and/or lower (T9-10 or T10-11) thoracicregions. IDP measurement was accomplished using a custom-designedneedle-mounted thin film metal diaphragmThursday
Thursdaypressure transducer (Gaeltec, Isle of Skye, Scotland). Thepressure monitoring device was introduced into each thoracicdisk by a procedural neuroradiologist thoroughly experiencedin thoracic diskography (1-3). IDP was measuredwith the patient lying prone in lateral decubitous, sitting,standing, forward bending, side bending, in valsalva andholding hand weights. There was remarkable uniformity inIDP measurements between individual disks and subjects.The highest pressures were recorded from lower thoracicdisks with the subjects holding 20 kg weights in each handwith the arms flexed. The lowest pressures were recorded inlower thoracic disks with the subjects prone. Thoracic IDPmeasurements vary predictably with certain maneuvers.Lifting with the upper extremities particularly raises thoracicIDP. The clinical ramifications of this data will be discussed.224structure and function of spinal ligaments will be presented.The concept of viscoelasticity (how loading rate affects themechanical behavior of tissue) will be reviewed and the naturaldamage prevention mechanism that viscoelasticity affordsligaments and other soft tissue will be explained. Normalspine kinematics and range of motion also will be reviewed.Thursday Afternoon1:00 PM - 2:30 PMBallroom 6 B/CREFERENCES1. Schellhas KP, Pollei SR, Dorwart RH. Thoracic Discography:A Safe and Reliable Technique. Spine 1994;19:2103-21092. Wood KB, Schellhas KP, Garvey TA, Aeppli D. ThoracicDiscography in Healthy Individuals: A ControlledProspective Study of Magnetic Resonance Imaging andDiscography in Asymptomatic and SymptomaticIndividuals. Spine 1999;24:1548-15553. Polga DG, Beaubien BP, Kallemeier PM, Schellhas KP, LewWD, Buttermann GR, et al. In Vivo Characterization ofIntradiscal Pressure in Healthy Thoracic IntervertebralDiscs. Spine <strong>2004</strong> (in press)Dynamic Vertebral Body MechanicsStephen M. Belkoff, MDDr. Belkoff received his Ph.D. in applied mechanics fromMichigan State University. He is an associate professor inthe Department of Orthopaedic Surgery and has an adjunctappointment in the Department of Mechanical Engineeringat The Johns Hopkins University. Dr. Belkoff has conductedresearch and published in the areas hard and soft tissuemechanics, as well as trauma biomechanics and fracture fixation.Dr. Belkoff also has been active in conducting basicresearch on vertebroplasty.LEARNING OBJECTIVESUpon completion of this session, participants will be able to:1) Explain the structural support the spine provides the humanbody2) Indentify the relative contribution that the cortex and cancellousinterior provide the vertebral body and how the relativecontribution changes with age3) Explain the structure/function of spinal ligaments4) Describe the concept of coupled motionPRESENTATION SUMMARYThe purpose of the presentation is to review basic biomechanicsof the spine. We will discuss how the spine is able to bearthe load of the torso while allowing for flexibility to conductthe activities of daily living. The relative load-bearing rolesplayed by vertebral body cancellous and cortical bone will bepresented. How their roles change with age will be discussed,especially in relation to osteoporosis. The mechanical/structuralimplications of osteoporosis will be explained. The effectof normal vs degenerated intervertebral disk on endplatemechanics and axial load transmission will be discussed. The(58) Atherosclerosis (ASITN)(58a) Patient SelectionPatient SelectionColin P. Derdeyn, MD— Colin P. Derdeyn, MD(58b) Intracranial Angioplasty/Stenting— Joan C. Wojak, MD(58c) Cervical Carotid Disease— John J. Connors, III, MDModerators:Gary M. Nesbit, MDKieran P. J. Murphy, MDLEARNING OBJECTIVESUpon completion of this session, participants will be able to:1) Recognize the importance of ischemic symptoms as a predictorof stroke risk in patients with atherosclerotic disease2) Describe the role of cerebral hemodynamics as predictorsof stroke riskPRESENTATION SUMMARYTwo critical factors are important in determining whether apatient with atherosclerotic cerebrovascular occlusive diseaseis a candidate for endovascular or surgical intervention: thepresence of ischemic symptoms referable to the lesion and thedegree of stenosis. The status of the collateral circulation - thepresence or absence of hemodynamic impairment - is a thirdimportant factor that likely will come to play a role in patientselection, particularly for patients with complete carotidocclusion and possibly for patients with asymptomaticstenoses. In this talk, we will first review the mechanisms bywhich these lesions cause or predipose for ischemic stroke.Both embolic and hemodynamic factors are involved. We thenwill review the natural history of symptomatic and asymptomaticcervical and cerebral occlusive disease. Following thiswe will review the results of surgical and endovascular clini-
cal trials for these different lesions as they pertain to patientselection for endovascular revascularization.Disclosure: The author of the presentation has indicated thathe will be discussing/presenting an unapproved/investigativeuse of O-15 PET studies, XeCT, Carotid Stent.Intracranial Angioplasty/StentingJoan C. Wojak, MDLEARNING OBJECTIVESUpon completion of this session, participants will be able to:1) Assess the natural history of symptomatic intracranial atherosclerosisand the unsatisfactory impact of medical therapyand surgical revascularization2) Describe the potential short- and long-term benefits ofintracranial angioplasty with or without stenting3) Discuss the limitations of this procedure4) Identify those patients that might benefit from this procedurePRESENTATION SUMMARYThe incidence of hemodynamically significant atheroscleroticintracranial vascular disease is underappreciated clinically anddiagnostically. Between 5% and 10% of strokes are thought tobe caused directly by intracranial large vessel atheroscleroticdisease. The estimated risk of stroke in the setting of intracranialstenosis varies from approximately 7% to 40% per year;many patients do not experience warning transient ischemicattacks. Medical therapy does not result in a satisfactorydecrease in the stroke risk. Extracranial-intracranial bypass surgeryalso has been shown to be ineffective, and in some casesdetrimental. The evolution of intracranial angioplasty andstenting for the treatment of intracranial atherosclerosis will bediscussed. A single-center experience will be presented. Aseries of 99 patients underwent intracranial angioplasty and/orstenting (19 lesions were stented) for the treatment or preventionof stroke at a single institution, with up to 7-year followup(mean 1.1 months). The technical success rate was 93%; 5lesions could not be reached and there were two periproceduralvessel ruptures or perforations accounting for the only twodeaths in the series. There was one additional wire perforationwith good outcome, 2 periprocedural ischemic strokes and onesmall intraparenchymal hematoma; all with eventual good outcome.The incidence of subsequent stroke in the distribution ofthe target lesion was 4%, and the restenosis rate was 26% (7/24symptomatic, 15 retreated). All restenoses occurred within 16months (mean 5.3 months). These results will be discussed ingreater detail. The presented data demonstrate that, with currenttechnique and equipment, intracranial angioplasty/stentingcan be performed safely and this may be an efficacious therapyfor intracranial atherosclerosis.Disclosure: The author of the presentation has indicated thatshe will be discussing/presenting an unapproved/investigativeuse of Angioplasty/stents in the intracranial. The stentsare made by Boston Scientific, Cordis Neurovascular,Gundant.225John J. Connors, III, MDThursday Afternoon1:00 PM - 2:00 PMRoom 606 - 609(59) ELC Lecture J: AdvancedImaging Processing in MR ImagingThursday Afternoon2:00 PM - 2:30 PMRoom 611 - 612(59A) National Library of Medicine(NLM): PUBMED Ò /MEDLINE ShortDemonstrationThursday Afternoon3:00 PM - 4:30 PMBallroom 6 B/C(60a) Adult Brain: General(Scientific Papers 285 - 296)See also Parallel Sessions(60b) Interventional: Aneurysms(60c) Adult Brain: General and Diffusion Imaging(60d) Adult Brain: General and 3.0 TModerators:— Todd B. Parrish, PhDDennis K. Shibata, MDErin M. Simon, MD, OTR— Linda MilgromThursdayCervical Carotid Disease
ThursdayPaper 285 Starting at 3:00 PM, Ending at 3:08 PMAcute Infarct Detection in a Large EmergencyDepartment Series during the Year 2000: Accuracy ofPerfusion-Weighted ImagingMullins, M. E. 1 · Cullen, S. 2 · Lev, M. 1 · Schaefer, P. W. 1 · He,J. 1 · Gonzalez, R. 11Massachusetts General Hospital, Boston, MA, 2 Universityof California San Francisco, San Francisco, CAPURPOSETo assess the sensitivity, specificity, and accuracy of perfusion-weightedimaging (PWI) in the detection of acuteinfarct.MATERIALS & METHODSThe medical records of 479 consecutive patients with admittingdiagnoses of acute stroke were reviewed retrospectivelyfor (1) diagnostic imaging results and (2) final dischargediagnosis. All imaging was performed within 48 hours ofstroke onset. Sensitivity, specificity, positive predictivevalue (PPV), negative predictive value (NPV), and accuracyof infarct detection were calculated. Twenty-two patientswith final discharge diagnosis of transient ischemic attackwere excluded. All MR examinations were performed withdiffusion-weighted imaging (DWI).RESULTSThirty-one patients were identified who received PWI atadmission. Ictal onset time was known for 20 patients with amean time of presentation to the emergency department of 2hours and 31 minutes postictus. In patients with known ictalonset time, PWI was performed with a mean time of 5 hoursand 5 minutes postictus. For PWI, 0 cases were equivocal.The sensitivity of PWI for the detection of acute infarct was96%, specificity 100%, PPV 100%, NPV 75%, and accuracywas 97%.226describe T2*-weighted prominence of the Basal Vein ofRosenthal in acute and chronic MCA ischemia and hypothesizedthat this finding reflects the presence of a proximalarterial occlusion.MATERIALS & METHODSRetrospective review of MR imaging/MR angiographyacquired in 83 cases (median age 65 years, range 18-89years; 46:37 M:F) of MCA stroke and 24 cases (median age35 years, range 19-67 years; 8:16 M:F) of moyamoya syndrome.The presence of hypointensity in the Basal Vein ofRosenthal was noted on gradient-echo T2*-weightedsequences. The presence of proximal arterial occlusion wasnoted on MR angiography. Multivariate logistic regressionanalysis explored predictors for hypointensity of the BasalVein of Rosenthal.RESULTSProminent hypointensity in the Basal Vein of Rosenthal wasnoted in 27/83 (33%) cases of MCA stroke imaged with amedian delay of 2 days (range 0-17 days) from stroke onset.This finding was observed on the side of the ischemic hemispherein 14/14 (100%) left MCA strokes and 13/13 (100%)right MCA strokes. Independent predictors for this findingincluded decreasing delay of imaging from stroke onset (p =0.03) and the presence of proximal MCA occlusion (p =0.04). In the setting of chronic ischemia associated withmoyamoya syndrome, the Basal Vein of Rosenthal was frequentlyapparent as a large, hypointense structure on T2*-weighted sequences (Figure).CONCLUSIONPerfusion-weighted imaging in a large patient populationoffers improved accuracy and negative predictive valuecompared to statistics previously reported for head CT, CTangiography, conventional MR imaging and diffusionweightedimaging alone for the detection of acute infarct.KEY WORDS: Stroke, perfusion-weighted imaging, diffusion-weightedimagingPaper 286 Starting at 3:08 PM, Ending at 3:16 PMGradient-Echo T2*-Weighted Prominence of the BasalVein of Rosenthal in MCA IschemiaLiebeskind, D. S. · Ances, B. M. · Weigele, J. B. · Hurst, R.W. · Melhem, E. R.University of PennsylvaniaPhiladelphia, PAPURPOSESusceptibility-weighted MR sequences may demonstratesignal loss associated with deoxyhemoglobin in acuteischemia. Such T2*-weighted hypointensity may be maximalin venous structures draining ischemic regions. WePhase-mismapping suggestive of increased venous bloodflow also was associated frequently with this finding. T2*-weighted hypointensity of the Basal Vein of Rosenthal wasnoted to be unilateral in 12/24 (50%) cases, bilateral in 9/24(38%), and absent in 3/24 (12%). Bilateral hypointensity ofthis venous structure was always associated with bilateralarterial stenoses. Unilateral hypointensity of this vein correspondedto the symptomatic hemisphere in 4 cases withbilateral moyamoya and the side of arterial stenosis in casesof unilateral moyamoya.
CONCLUSIONT2*-weighted hypointensity of the Basal Vein of Rosenthalmay reflect increased venous return of deoxygenated bloodassociated with acute or chronic MCA ischemia and the presenceof a proximal arterial occlusion.REFERENCES1. Hermier M, Nighoghossian N, Derex L, et al. HypointenseTranscerebral Veins at T2*-Weighted MRI: A Marker ofHemorrhagic Transformation Risk in Patients Treated withIntravenous Tissue Plasminogen Activator. J Cereb BloodFlow Metab 2003;23:1362-1370KEY WORDS: Ischemia, deoxygenation, susceptibilityweightedPaper 287 Starting at 3:16 PM, Ending at 3:24 PMStrokeCheck <strong>2004</strong>: <strong>2004</strong> Update to the StrokeCheckStroke Awareness and Educational ProgramAgran, S. D.Sun City ImagingScottsdale, AZStrokeCheck is an <strong>ASNR</strong> and ASA sponsored and SIRendorsed stroke awareness and educational program, createdto help educate the public regarding stroke warningsigns, stroke risk and risk factor modification, and emphasizingthat stroke is an emergency requiring 911 action.StrokeCheck was modelled after the highly successful Legsfor Life program, and is in its fourth year. It previously hasbeen performed successfully in Phoenix, Denver,Albuquerque and various other sites. The <strong>2004</strong> expansionwill be discussed, with the results from the recent May<strong>2004</strong> StrokeCheck program announcedKEY WORDS: StrokeCheck, education, strokePaper 288 Starting at 3:24 PM, Ending at 3:32 PMProcessing and Interpretation Times of CT Angiogramand CT Perfusion Studies in Acute StrokeSrinivasan, A. · Goyal, M. · Prasad, J. · Lum, C. · Nguyen,T. · Miller, W.The Ottawa HospitalOttawa, ON, CANADAPURPOSEThe purpose of this study was to determine the mean time forobtaining, processing, and interpreting CT perfusion (CTP)and CT angiogram (CTA) images in patients presenting withacute stroke. We also compared the processing and interpretationtimes of CTA and CTP studies among three groupsnamely radiology residents, neuroradiology fellows, andconsultant neuroradiologists with at least 5 years of experience.MATERIALS & METHODSTen patients presenting with acute stroke within 6 hours ofonset from May 2003 to November 2003 formed the studymaterial. CTA was performed from the aortic arch to the circleof Willis using 100-120 ml Iohexol injected at 3ml/secand a delay of 20 seconds. CTP was performed covering a 2227cm thick area at the level of the basal ganglia. The mean timeof acquisition of CTA and CTP studies after performing theinitial plain head CT scan in all patients was calculated. Tworesidents (PGY3, PGY4), two neuroradiology fellows, andfour consultant neuroradiologists each were presented with ashort clinical history and then 10 CTA and CTP studies forprocessing and interpretation. Prior to their entry into thestudy, both the residents were trained to process and interpretCTA and CTP studies with 10 different cases. All readers hadto process the images, interpret the images (for the presenceor absence of any intracranial clot and penumbra), and savethem. All processing was done on the GE AdvantageWindows workstation.RESULTSThe mean time for acquisition of CTA and CTP studies in theten patients was 14.6 + 5.9 minutes. The time taken for CTAprocessing and interpretation for residents, fellows, and consultantneuroradiologists was 2.3 + 1.3 min, 1.6 + 0.4 min,and 1.5 + 0.7 min, respectively. The time required for CTPprocessing and interpretation by the same groups was 5.2 +1.7 min, 4.5 + 1.5 min, and 4.1 + 1.1 min, respectively. Therewas no difference in interpretation between all readers.There was a statistically significant difference of meansbetween the resident group and the consultant neuroradiologistsin the CTA and CTP processing and interpretation times(p = 0.01, p = 0.01, respectively) but no statistical differencebetween means of the fellow and consultant groups (p =0.21, p = 0.39, respectively).CONCLUSIONThe mean time for acquisition of CTA and CTP studies inacute stroke patients is approximately 15 minutes. The timetaken for CTA and CTP processing and interpretation isunder 10 minutes for all groups namely residents, fellows,and consultant neuroradiologists. Thus CTA and CTP studiescan be performed, processed, and interpreted quickly in anacute stroke setting and provide necessary information forplanning therapeutic strategy.KEY WORDS: CT perfusion, stroke, timingPaper 289 Starting at 3:32 PM, Ending at 3:40 PMDetection of Blood-Brain Barrier Leakage in EarlyAcute Stroke Using Dynamic Contrast-Enhanced MRImagingKassner, A. 1,2 · Roberts, T. P. L. 1,2 · Taylor, K. 3,2 · Silver, F. 3,2 ·Mikulis, D. J. 3,21University Health Network, Toronto, ON, CANADA, 2 TheUniversity of Toronto, Toronto, ON, CANADA, 3 TheToronto Western Hospital, Toronto, ON, CANADAPURPOSEThe major risk of thrombolysis in the acute ischemic strokesetting is hemorrhage. Little is known about the specificmechanisms that lead to extravasation of blood into the tissue.However, we believe that the loss of blood-brain barrier(BBB) integrity is important and may lead to hemorrhagictransformation. Therefore the ability to detect defects in thisbarrier may provide a sensible indicator to judge this risk. Thepurpose of this study was to determine evidence of BBB leakageusing dynamic contrast-enhanced MR imaging (DCI).Thursday
ThursdayMATERIALS & METHODSSeven patients (3 female, 4 male, age range 38-80 years) withacute ischemic stroke were examined within 24 hours ofsymptom onset using an acute stroke protocol consisting ofanatomical, diffusion and perfusion imaging, and contrastenhancedMR angiography (MRA). In addition, a 3D GEDCI exam was performed to assess permeability/BBB leakage.All imaging was performed on a 1.5 T GE Signa MR systemequipped with echospeed gradients and a standard neurovascularhead coil. Imaging parameters for the 3D GEacquisition were as follows: FOV 240 mm, 128 x 128 matrix,FA = 20 deg, slice thickness 7 mm, TR = 5.9 ms, TE = 1.5 ms.Total acquisition time was 4:48 min for a collection of 31 volumes.Contrast media (total volume of 15 cc Gd DTPA) wasinjected as a bolus after volume 2 of the 3D acquisitions. Datawas transferred to an independent workstation for analysis.Parametric maps of fractional blood volume (fBV) and permeability(kPS) were calculated as described previously byRoberts et al (1). Two ROIs were selected; one placed on thediffusion abnormality (ADC) and the second placed on thesame location in the contralateral normal hemisphere. Meanand STD were recorded and examined for statistical significanceusing a 2 tailed paired Student’s t-test.RESULTSResults are displayed in Figure 1 and show a significantincrease in microvascular permeability (Kps) for the lesion(0.0032 ml/100 g/min +/- 0.0027 compared to -0.00088mls/100 g/min +/- 0.00243). Fractional blood volume (fBV)was not significantly different for both ROIs (0.0701 +/-0.751 for the lesion compared to 0.0448 +/- 0.038 for thecontrol ROI), although showed a tendency towards elevationin the lesion consistent with vasodilation. One case showedenhancement in the acute phase and then went on to hemorrhage.228Paper 290 Starting at 3:40 PM, Ending at 3:48 PMDifferences in Brain Structure in the Deaf on MRImaging Studied with Voxel-Based MorphometryShibata, D. K.University of WashingtonSeattle, WAPURPOSEThe loss of a major sensory input at an early age has beenshown in animal models to result in alterations in neuronalconnectivity and cortical structure. The purpose of this studywas compare structural brain MR scans of the deaf vs hearingusing an automated image-processing technique, voxelbasedmorphometry (VBM).MATERIALS & METHODSFifty-three right-handed prelingually deaf students from adeaf college (34 male, 19 female, average age 21) were comparedwith 51 hearing right-handed subjects (31 male, 20female, average age 25). On a 1.5 T MR scanner, 3D SPGRimaging was performed with 1.5 mm contiguous axial T1-weighted images. An optimized protocol for VBM analysiswas performed using SPM2 (1). Initial gray matter, whitematter, and fluid segmentations were spatially normalizedand then these deformation parameters were applied to theoriginal images which then were segmented again. Theimages then were modulated for volume changes and subjectto smoothing using a 12 mm kernel. A t-test statistic then wasapplied between the two groups.RESULTSWhite matter analysis revealed a focus in the left superiortemporal gyrus with 3 cluster, 2 of which (-61, -20, 5 and 50,-12, 2) were of statistical significance (P < .036, .039) whenusing the family-wise correction for multiple comparisons.These foci correspond to white matter underlying Brodmanareas 22, 42, and 41 and are inferior to Heschl’s gyrus. Graymatter analysis revealed only one focus which was at theborder of statistical significance (P < .059) in the left superiorfrontal gyrus (-13, 13, 74) in Brodman area 6, correspondingto premotor cortex.CONCLUSIONThese findings suggest that BBB deficiency can be assessedin acute stroke using quantitative dynamic contrastenhancedMR imaging. Blood-brain barrier defects werefound in all cases indicating hemorrhagic potential. The relationshipbetween these defects and subsequent risk may bepossible using this technique but additional work is requiredto establish this relationship.REFERENCES1. Roberts HC, et al. AJNR Am J Neuroradiol 2000; 21(5):891-899CONCLUSIONThese results support the hypothesis that there are grossalterations in brain anatomy as an adaptation to early deafness.The WM alteration in the posterior aspect of the leftsuperior temporal gyrus may represent decreased volume ofauditory tracts although the precise localization appearedcentered inferior to primary auditory cortex and the left lateralizationmay be related to speech. The GM finding of adifference in the left premotor cortex may be an adaptationto hand-motor processing in sign language. These anatomicaldifferences although subtle likely reflect deeper functionalalterations which may be important clinically in preoperativeplanning and more generally in understandingplasticity in brain development. In comparison to a recentreport on anatomical MR imaging on 12 deaf subjects (2),the present larger group analysis reveals a difference in thetemporal lobe not seen in the smaller study.KEY WORDS: Ischemic stroke, dynamic contrast-enhancedMR imaging, permeability
229REFERENCES1. Good CD, Johnsrude IS, Ashburner J, et al. A Voxel-BasedMorphometric Study of Ageing in 465 Adult Human Brains.Neuroimage 2001;14:21-362. Penhune VB , Cismaru R, Dorsaint-Pierre R, Petitto LA, et al.The Morphometry of Auditory Cortex in Congenitally DeafMeasured Using MRI. Neuroimage 2003;20:1215-1225RESULTSGray matter lesions largely confined to the cortex were identifiedon mean images [e.g., lesion in motor strip, Figure1(arrow)]. Overall, 23 cortical GM lesions were identified in8 (61%) patients. In addition, 2 lesions were detected in thethalamus and 2 lesions were found in the hypothalamus.KEY WORDS: Brain, anatomy, deafnessACKNOWLEDGMENTSThe National Technical Institute of the Deaf at the RochesterInstitute of Technology, Rochester, NY provided assistancewith subjects.Rachel Yotter, Electrical Engineering, University ofWashington, assisted with data analysis.Paper 291 Starting at 3:48 PM, Ending at 3:56 PMDetection of Cortical Multiple Sclerosis Lesions In Vivoby Averaging Serial 3D T1 MR ImagingButman, J. A. 1 · Bagnato, F. 2 · Richert, N. D. 1 · Stone, R. D. 1· Gupta, S. 1 · Ohayon, J. M. 1 · Frank, J. A. 1 · McFarland, H.F. 21Warren G. Magnuson Clinical Center, National Institutes ofHealth, Bethesda, MD, 2 Neuroimmunology Branch, NationalInstitute of Neurological Disorders and Stroke, NationalInstitutes of Health, Bethesda, MDPURPOSEThe supposition that multiple sclerosis (MS) is pure whitematter (WM) disease has been questioned, as recent studiesshow pathology in gray matter (GM) as well as WM.Although postmortem studies demonstrate cortical lesionsby MR imaging, demonstration of these lesions by in vivoMR imaging remains challenging. By averaging high-resolution3D T1 spoiled-gradient SPGR datasets, we attemptedto detect cortical lesions in a group of 13 MS patients withrelapsing remitting multiple sclerosis.MATERIALS & METHODSThirteen patients (6 male, 7 females, age 37.1 ± 9.4 years)with a 7.1 ± 8.3 year history of relapsing-remitting MS withExpanded Disability Status Scores 2.4 ± 0.9 were imagedmonthly over 6 to 19 months (11.3 ± 3.9). Comprehensivebrain MR images were performed at 1.5 T using a quadraturehead coil (GE Medical Systems, Milwaukee, WI) including3D T1 SPGR sequences. Contrast parameters were:TR/TE/flip angle 9/2/20° and geometric parameters were:256 x 256 matrix, 24 cm field of view, 1.3-1.4 mm slicethickness with a single 128-slice acquisition of 5 minutes. Awithin-subject rigid body 6 parameter coregistration of thesedatasets was performed with FLIRT (FMRIB, Oxford) usinga cross-correlation cost function. These coregistered datasetswere averaged over 6-19 MR volumes obtained in eachpatient in order to generate single mean image in eachpatient. For the purpose of this study, we counted lesionswhich appeared to be centered in GM as cortical lesions,allowing for some extention into juxtacortical white matter.CONCLUSIONBy averaging from 6 to 19 3D T1 SPGR datasets, we showevidence of lesions largely confined to GM of the cerebralcortex not clearly apparent on data obtained from a singleMR scan. Coregistration was successful due to the nearlyisotropic voxel size. Thus, the mean images were equivalentto performing MR imaging with 6-19 excitations, with commensurateimprovements in signal-to-noise ratios. Althoughlesion to background contrast is not high on T1-weightedsequences relative to long TR sequences, the reduction innoise from averaging made both GM and WM lesions isapparent. Because data were obtained monthly for nearly 2years in some cases, it is clear that some lesions changedover the averaged datasets and the average image may notdescribe these lesions appropriately. However, for lesionsthat remained stable over this time, a marked improvementin lesion contrast to noise was seen. Further study to optimizeMR sequences and postprocessing to demonstrate thesecortical lesions is warranted.KEY WORDS: Cortex, thalamus, image processingPaper 292 Starting at 3:56 PM, Ending at 4:04 PMVolumetric Measurement and Spatial Distribution ofCerebrospinal Fluid in Dementing Disorders: ADifferential Diagnosis Method?Romano, A. · Bozzao, A. · Bonamini, M. · Ferrante, M. ·Fantozzi, L. M.S.Andrea Hospital University “La Sapienza”Rome, ITALYPURPOSETo find a standardized imaging method to distinguish amongthree dementing disorders - Alzheimer’s disease, fronto-temporaldementia, normal pressure hydrocephalus - on thebasis of CSF volume and spatial distribution by means of avoxel-based morphometry technique.MATERIALS & METHODSWe studied three groups of patients: 12 patients affected byAlzheimer’s disease (AD) according to NINCDS-ADRDAcriteria (MMSE: mean ± sd = 21.51 ± 6.6; range = 8-27); 6Thursday
Thursdaypatients affected by fronto-temporal dementia (FTD),according to LUND and MANCHESTER criteria (MMSE:mean ± sd = 25.33 ± 3.8; range = 22-30); 7 patients with suspectednormal-pressure hydrocephalus (NPH) (MMSE:mean ± sd = 22.1 ± 5.5; range = 11-29), who presented theclinical triad of dementia, gait disturbance, and urinaryincontinence. Eight healthy controls (with normal memoryperformance and without vascular lesions at MR imaging)were studied. T1-weighted, volumetric MPRAGE MR scanswere performed on a 1.5 T magnet yielding 150 contiguous0.80 mm axial slices. Analysis was performed by usingSPM99 running in MATLAB 5.0. The images were analyzedwith optimized method by Good et al.(2000). Cerebrospinalfluid fractional volumes were calculated; images indicatingthe mean distribution of CSF were analyzed visually as well.RESULTSMean CSF images suggested that CSF spatial distribution isspecific for each dementing disorder. Alzheimer’s diseaseshowed a diffuse dilatation in SSA spaces, FTD a frontotemporalSSA spaces dilatation whereas NPH showedenlarged ventricular system without envelopment of SSAspaces. These results were confirmed by CSF fractional volumes( AD CSF: 0.251, ventricles: 0.0342, SSA: 0.207; FTDCSF: 0.233, ventricles: 0.0331, SSA: 0.2; NPH CSF: 0.266,ventricles: 0.0671, SSA: 0.205; Controls CSF: 0.201, ventricles:0.0189, SSA: 0.181).230Paper 293 Starting at 4:04 PM, Ending at 4:12 PMCerebral Blood Volume Maps Generated T1-WeightedImages Are Superior to T2*-Based Maps for SurgicalPlanning ApplicationsPatankar, T. A. F. · Haroon, H. A. · Zhu, X. · Li, K. · Jackson,A.Imaging Science and Biomedical EngineeringManchester, UNITED KINGDOMPURPOSEThere is close relationship in glioma between regional histologicgrade and cerebral blood volume (CBV) as measuredon MR imaging. This makes CBV maps desirable for therapeuticplanning and surgical guidance. Classically, CBVmaps are obtained from T2*-weighted data (T2*-CBV). Werecently described a novel method to calculate CBV mapsfrom dynamic contrast-enhanced T1-weighted data (T1-CBV) using decomposition technique to separate changes inintravascular and extravascular contrast concentration andproduces parametric maps of both the volume transfer constantK trans and CBV. Our technique has higher through planespatial resolution, reduced spatial distortion, and simultaneousprovision of Ktrans. If the technique is to form a sustainablealternative to T2*-CBV mapping then it should providecomparable biological information. This study tests thehypothesis that T1-CBV and T2*-CBV maps in cerebraltumors provide equivalent values of CBV in terms of magnitudeand distribution.CONCLUSIONVoxel-based morphology is a very sensible technique to findCSF spatial distribution in dementing disorders. Automatedmethods to describe the severity and distribution of cerebralatrophy can provide diagnostic information in the classificationof degenerative and nondegenerative diseases leading todementia. This approch confirmed that this kind of analysiscan be complementary to clinical information and useful inthe differential diagnosis among dementing diseases.KEY WORDS: Cerebrospinal fluid, cerebral atrophy, voxelbasedmorphometryMATERIALS & METHODSTen patients with histologic confirmation of cerebral neoplasms(9 gliomas, 1 metastasis) were studied. Imaging wasperformed at 1.5 T and T1-CBV maps were calculated froma 3D T1-weighted-FFE sequence (128 ˘ 128 matrix, 25slices, 230 mm field of view, 3 mm slice thickness, TR = 4.2ms, TE = 1.2 ms) with 3 precontrast data sets acquired at flipangles of 2°, 10°, and 35°; followed by a dynamic contrastenhancedacquisition at 35° with a temporal resolution of 5s. Contrast (0.1 mmol/kg of Gd-DTPA-BMA) was injectedinto an antecubital vein at a rate of 4 mls/s using a powerinjector. T2*-CBV maps were calculated from a 2D T2*-weighted field echo sequence with segmented EPI acquisition(128 ˘ 128 matrix, 9 slices, 230 mm field of view, 6 mmslice thickness, TR = 440 ms, TE = 30 ms) with a temporalresolution of 1.8 s. T2* acquisitions were performed 5-10minutes after T1 acquisitions to provide preenhancement andreduction of relaxivity effects. Direct coregistration of T1-and T2*-weighted maps was not possible due to susceptibilitybased spatial distortions in T2*-CBV maps; howeverpixel-by-pixel comparison was performed using a nonlinearoptimized matching technique. Regions of interest weredrawn manually on visually matching slice positions and orientations.RESULTSMedian T1 and T2* CBV measurements in enhancing tumorregion of interest showed good correlation (R = 0.65, P
CONCLUSIONMeasured values from T1-CBV maps correlate well withT2*-CBV maps, both in terms of median measurementsfrom tumor tissue and on pixel-by-pixel comparison. Spatialdistortion in regions of large blood vessels seen in susceptibilitybased contrast techniques is eliminated and makes T1-CBV maps preferable for surgical planning applications.This supports our hypothesis that T1-CBV and T2*-CBVmaps provide biological information in terms of both magnitudeand distribution of CBV with the advantages of reducedimage distortion and simultaneous measurement of Ktrans.KEY WORDS: Gliomas, MR perfusion, cerebral blood volume231RESULTSThe ON and OC were visualized clearly in the FSE imagesacquired. The use of a high sensitivity four-channel coil and3 T field allows obtaining high-resolution anatomicalimages, with the in-plane resolution as low as 352 x 469microns. This resolution enables clear and detailed demonstrationof ON and OC in a relatively short scan time of 5min (sagittal images) to 6 min (axial images). MT contrastimages were calculated by subtracting the MT presaturatedimage from the reference image. MT images were obtainedwith a slice thickness of 1.5 mm and in-plane resolution of938 x 938 microns in 10 min.CONCLUSIONWe have acquired high resolution anatomical and MTimages at 3 T with slice thicknesses as low as 1.5 mm andsubmillimeter in-plane resolution. High spatial resolutionMT experiments were performed at 3 T within SAR guidelines.These techniques will be applicable to MR imaging ofON and OC damage in MS.Paper 294 Starting at 4:12 PM, Ending at 4:20 PMHigh Resolution Anatomical and Physiologic Imaging ofthe Optic Nerve and Optic Chiasm at 3 TVinogradov, E. · Hackney, D. B. · Smith, D. R. · Marquis, R.· Lenkinski, R. E.Beth Israel Deaconess Medical Center, Harvard MedicalSchoolBoston, MAPURPOSEOptic neuritis is often the first symptoms of multiple sclerosis(MS). To better characterize neural injury of MS we haveimplemented high resolution imaging of the optic nerve(ON) and the optic chiasm (OC) at 3 T. Our approachinvolves obtaining high resolution anatomical MR images aswell as physiologic images of these structures. Previousstudies of MS conducted at 1.5 T (1-6) have demonstratedthe potential diagnostic and prognostic values of MR imagingof ON at MS. In this work we have obtained high resolutionanatomical and MT images of the ON and OC.MATERIALS & METHODSImaging was performed on the 3 T scanner (Signa LX,General Electric, Waukesha, WI). First, high resolutionanatomical images were obtained employing a customdesignedhead coil. This coil consists of a coil array (25 cmdiameter) and contains four 30 ˘ 30 cm squared coils.Oblique axial and oblique sagittal fast-spin echo (FSE)images were acquired with 1.5 mm slice thickness and FOV18 ˘ 18cm. Other imaging parameters were TR/TE =5400/102.2, NEX = 4, 512 ˘ 256 matrix size, and TR/TE =5417/96.5, NEX = 3, 512 ˘ 384 matrix size for axial andsagittal images, respectively. MT imaging was performedwith 3D TOF GRE and using 1.5 mm slice thickness, FOV24 ˘ 18 cm, 256 ˘ 256 matrix size, TR/TE = 200/2.5 ms, flipangle 20 degrees, NEX = 1, FOV 24 ˘ 18 cm, 128 ˘ 128matrix size, 3 mm slice thickness. The MT pulse was optimizedto achieve a maximal MT contrast at RF offset of1200 Hz and was equal to 10 msec. The magnetization transferratios (MTR) were measured at the regions of interest bymanual calculation.REFERENCES1. Gass A, et al. J Neurol, Neurosurg, Psych 1995;58:5622. Hickman SJ, et al. Neuroradiology 2001;43:1233. Kupersmith MJ, et al. Brain 2002;125:8124. Inglese M, et al. Arch Neurol 2002;59:2505. Horsfield MA, et al. J Magn Reson Imag 2003;17:3896. Iwasawa T, et al. Magn Reson Med 1997;38:484KEY WORDS: High resolution, optic nerve, magnetizationtransferPaper 295 Starting at 4:20 PM, Ending at 4:25 PMDiffusion-Weighted Imaging of Delayed PostanoxicLeukoencephalopathy with Pathologic CorrelationMoritani, T. · Germin, B. · Hiwatashi, A. · Ketonen, L. ·Wang, H. · Ekholm, S. · Westesson, P.University of RochesterRochester, NYPURPOSETo report a case delayed postanoxic leukoencephalopathy ondiffusion-weighted imaging, with pathologic correlation.MATERIALS & METHODSA 53-year-old man was found unresponsive after progressivemental status changes for 3-4 days. Twelve days prior to thispresentation he was diagnosed with a narcotic overdose forwhich he was maintained in the intensive care unit for respiratoryand acute renal failure. He had been prescribedFentanyl for chronic pain due to metastatic papillary thyroidcancer. He denies alcohol and drug use. He has a history ofhypothyroidism, coronary artery disease, and bipolar disorder.He has no significant family history.RESULTSMR imaging was performed 10 days after onset of mentalstatus changes. T2-weighted images showed no abnormalsignal intensity in the brain. Diffusion-weighted imagerevealed mild hyperintensity in the periventricular and deepwhite matter associated with decreased ADC. Follow-up MRimaging was performed 14 days after the onset. T2 andFLAIR images showed high signal intensity throughout thewhite matter bilaterally consistent with a global leukoencephalopathy.Diffusion-weighted images revealed diffusehyperintensity of these lesions associated with decreasedADC. The patient had increasing tremor and irregularmyoclonus. He continued to deteriorate and died about 20Thursday
Thursdaydays later. Autopsy was performed and the diagnosis wasconfirmed. It showed varying degrees of myelin loss withsome spongy change, probably reflecting intramyelinicedema in the deep white matter with relatively spared U-fibers.CONCLUSIONDiffusion-weighted image showed diffuse hyperintensitywith decreased ADC in the deep white matter in delayedpostanoxic leukoencephalopathy. Pathologic specimenrevealed varying degrees of myelin loss with some spongychange, probably reflecting intramyelinic edema, whichcauses decreased ADC. We discuss the pathophysiology ofthis disease.REFERENCES1. Mizutani T, Shinozawa R, Takemori S, et al. Delayed Post-Anoxic Encephalopathy without Relation to CarbonMonoxide Poisoning. Intern Med 1993;32:430-4332. Kim HY, Kin BJ, Moon SY, et al. Serial Diffusion-WeightedMR Imaging in Delayed Postanoxic Encephalopathy. A CaseStudy. J Neuroradiol 2002;29:211-215KEY WORDS: Diffusion-weighted imaging, postanoxicleukoencephalopathy, pathologyPaper 296 Starting at 4:25 PM, Ending at 4:30 PMPrimary Hyperoxaluria and Calcium OxalateDeposition: An Unusual Variant of Small Vessel IschemiaLiebeskind, D. S. · Ances, B. M.University of PennsylvaniaPhiladelphia, PAPURPOSEPrimary hyperoxaluria is a rare autosomal recessive disordercharacterized by excessive synthesis of oxalic acid. Systemiccalcium oxalate deposition, or oxalosis, may affect numerousorgans, although calcium oxalate deposition in the brainis exceedingly unusual. We describe a case of primary hyperoxaluriaand calcium oxalate deposition in the brain presentingas an unusual form of small vessel stroke.MATERIALS & METHODSA 58-year-old man with primary hyperoxaluria presentedwith transient right-sided hemiparesis and hemisensory loss.Diagnostic evaluation included laboratory investigations,echocardiography, and neuroradiologic studies including CTand MR imaging/MR angiography (MRA).RESULTSThe initial CT revealed extensive hyperdensity scatteredthroughout the basal ganglia, thalami, perivascular spaces,corona radiata, dentate nuclei, and occipital cortices (Figure1A). A similar distribution of lesions was evident as hyperintenseregions on T1-weighted sequences (Figure 1B).Gradient-echo T2*-weighted sequences revealed correspondinghypointensity. Oxalosis was apparent on imaging studiesof the lumbar spine and peripheral vasculature.Echocardiography was unrevealing and MRA demonstratedno evidence of large vessel disease. Antiplatelet therapy wasinstituted, yet secondary stroke prevention efforts focused onamelioration of progressive calcium oxalate deposition.232CONCLUSIONOxalosis due to primary hyperoxaluria may lead to crystaldeposition in the brain. Calcium oxalate deposition in theperivascular spaces may lead to small vessel ischemia, yetconventional stroke prevention strategies may be of limitedefficacy.REFERENCES1. Haqqani MT. Crystals in Brain and Meninges in PrimaryHyperoxaluria and Oxalosis. J Clin Pathol 1977;30:16-182. Lammie GA, Wardlaw J, Dennis M. Thromboembolic Stroke,Moyamoya Phenomenon and Primary Oxalosis. CerebrovascDis 1998;8:45-503. Di Pasquale G, Ribani M, Andreoli A, Zampa GA, Pinelli G.Cardioembolic Stroke in Primary Oxalosis with CardiacInvolvement. Stroke 1989;20:1403-1406KEY WORDS: Oxalosis, strokeThursday Afternoon3:00 PM - 4:30 PMBallroom 6 A(60b) Interventional: Aneurysms(Scientific Papers 297 - 307)See also Parallel Sessions(60a) Adult Brain: General(60c) Adult Brain: General and Diffusion Imaging(60d) Adult Brain: General and 3.0 TModerators:John J. Connors, III, MDJohn C. Chaloupka, MD
Paper 297 Starting at 3:00 PM, Ending at 3:08 PMOrigin and Effects of Hemodynamic Stresses on theMorphology of Intracranial AneurysmsMetcalfe, R. 1 · Mantha, A. 1 · Karmonik, C. 2 · Benndorf, G. 2 ·Akpek, S. 2 · Klucznik, R. 3 · Mawad, M. 2,3 · Strother, C. M. 2,31University of Houston, Houston, TX, 2 Baylor College ofMedicine, Houston, TX, 3 The Methodist Hospital, Houston,TXPURPOSETo assess the influence of hemodynamic stresses in determiningthe morphology of cerebral aneurysms using computationalfluid dynamics techniques.MATERIALS & METHODSThree paraophthalmic internal carotid artery aneurysmswere chosen for analysis. One extended along the axis of theparent artery opposite to the direction of flow (aneurysm A)another extended along this axis in the direction of flow(aneurysm B), and the third was symmetrical in relationshipto the long axis of the parent artery (aneurysm C). Geometricdata derived from 3D DSA studies of the aneurysms wereconverted to sterolithography (stl) files for transfer to thecomputational fluid dynamics software code Gambit (Fluent,Inc.). Simulations were performed using Fluent softwaresubject to both steady and unsteady pressure gradient forcing.The Ku pulsatile flow model for the carotid bifurcationwas used for unsteady flow; steady flow had the same meanflow rate as the unsteady case. A Newtonian, incompressibleflow model was used to represent the blood flow. The arterialwalls were assumed to be rigid.RESULTSIn each instance, the course of the internal carotid arteryupstream from the aneurysms was quite different. Inaneurysm A this geometry induced significant secondaryflows that resulted in very complex fluid motion within theaneurysm throughout the unsteady pulsatile flow cycle. Inthis aneurysm there was a small pressure gradient on thedownstream wall during diastole and this was accompaniedby moderate aneurysmal flow. Also, at the time of peak pressure,just before maximum diastolic flow, a strong, reversepressure gradient developed within the aneurysm. Flow inaneurysm B was much more stable throughout the cardiaccycle with only very small pressure gradients developingwithin the aneurysm. In both of these aneurysms, wall shearstresses were very small within the aneurysm as compared tothose observed near vascular bends and bifurcations.CONCLUSIONOur simulations showed quite different hemodynamic forcesin three paraophthalmic aneurysms of similar size and locationbut different orientations. As these hemodynamic effectswere at least, in part, induced by differences in the geometryof the parent artery upstream from the aneurysms this anatomymay, along with the shape and size of the aneurysm neck,play an important role not only in aneurysm morphology butalso in their growth and rupture. The combination of accuratepatient specific data regarding aneurysm and parentartery morphology combined with currently available computationalfluid dynamic techniques provides a means for233investigating the origin, growth, and possible rupture ofintracranial aneurysms that has not been available previously.KEY WORDS: Aneurysms, fluid dynamics, morphologyPaper 298 Starting at 3:08 PM, Ending at 3:16 PMHemodynamic Studies of Coiling in Cerebral Aneurysmby Using Particle Image Velocimetry MethodOhta, M. 1 · Garitey, V. 2 · Levrier, O. 3 · Rieu, R. 2 · Cassot, F. 4· Ruefenachat, D. A. 11Geneva University Hospital, Geneva, SWITZERLAND,2Ecole Généraliste d’Ingénieurs de Marseille, Marseille,FRANCE, 3 Service de Neuroradiologie-CHU Timone,Marseille, FRANCE, 4 Service de Neurologie CHU Purpan,Toulouse, FRANCEPURPOSEOne of the most popular techniques in endovascular treatmentsfor aneurysms consists of filling the aneurysm withcoils. The coils seem to induce the formation of intraaneurysmalthrombosis. Although this technique has shownhighly good results for aneurysm treatments, it needs a betterunderstanding of the relevant hemodynamics effects onthe thrombosis formation. It is of interest to investigate therelationship of aneurysmal blood flow to thrombosis formationin an experimental set-up. An experimental technique ofparticle image velocimetry (PIV) for detecting flow patternin a cerebral aneurysm model was carried out.MATERIALS & METHODSThe investigations were done using a set of transparent siliconeaneurysm models by means of flow visualization. Theaneurysm dimensions were respectively 5 mm for the neckdiameter and 10 mm for the dome diameter. The parentartery was 3.5 mm in diameter. The fluid properties, composedof water and glycerin were 4 cp for its viscosity and1g/cm 3 for its density. The investigation was carried on atrealistic pressures with a minimum of 90 mm Hg for thediastole phase and a maximum of 140 mm Hg for the systolephase. The pulsatile flow, with an average velocity of 220ml/min was maintained at 37 °C. The flow visualizationtechniques consisted of reflecting glass particles, an Argonlaser, and a CCD camera (25 frames per second) set at thelateral angle view mode. The 3D coils from MicrusCorporation used were the MicroCoil system models madeof platinum. In this experiment, a total of 4 3D coils wereimplemented in the aneurysm. The first two coils were 10mm in curvature height and 20.3 cm in length. The third andfourth 3D coils were 9 mm in curvature height with a lengthof 18.4 cm and 8 mm in curvature height with 16.1 cm,respectively.RESULTSThe flow pattern in the aneurysm was composed of an inflowzone at the distal neck and of an outflow zone at the proximalneck. A rotating vortex was formed at the distal zone ofthe aneurysm at each systole phase. The vortex circulatedalong the aneurysm wall rotating on itself. As the vortextraveled, it grew in diameter losing its cohesion. The fluid inthe aneurysm was pushed out at the diastole phase and at thebeginning of the following systole phase. The vortices weredisturbed and diffused as the first coil was induced into theThursday
Thursdayaneurysm. The incoming flow into the aneurysm and thereforethe inside flow were diminished continually with theincreasing number of filling coils induced into the aneurysm.CONCLUSIONThe coils covering the neck and the aneurysm wall induce adiffusion in the flow pattern at the aneurysm neck and intothe aneurysm. The diffusion and the disappearing flow at thewall may induce the thrombosis. The number of coils seemsto be correlated to the effect on reducing the flow patterns.The PIV was useful for analyzing flow pattern in cerebralaneurysm.KEY WORDS: Coil, PIV, hemodynamicsThe authors of this work have indicated the following affiliations/disclosures:Cook-WCE: Research support.Paper 299 Starting at 3:16 PM, Ending at 3:24 PMHydroCoil Embolization Results in ProgressiveAneurysm Occlusion and a Trend to PostembolizationAneurysm Shrinkage in Large and Giant CanineBifurcation AneurysmsAagaard-Kienitz, B. · Niemann, D. · Rappe, A. · Consigny,D.University of Wisconsin MadisonMadison, WIPURPOSEPrevious experiments showed that occlusive stableaneurysm embolization using HydroCoils was achievablewith good neointima formation at 3 and 6 months inaneurysms up to14 mm in size. This current project showsthe relationship between packing with HydroCoils and stabilityof occlusion in large and giant canine bifurcationaneurysms.MATERIALS & METHODSFifteen canines were coiled to maximum occlusion with baremetal framing and HydroCoils. Follow-up angiogram andhistologic analysis was performed at 3 or 6 months.Aneurysms were 18-25 mm with dome to neck ratios of
Paper 301 Starting at 3:32 PM, Ending at 3:40 PMIn Vivo Evaluation of the CereStent Intracranial StentMiskolczi, L. · Perlow, A. · Onizuka, M. · Cesar, L. · Gounis,M. J. · Lieber, B. B. · Wakhloo, A. K.University of MiamiMiami, FLPURPOSEThere is an increasing need for a more flexible intracranialstent than the ones currently available for clinical use. Anideal stent would conform to vascular curvatures yet maintainradial force and provide strut density sufficient for aneck protection role in aneurysm coiling cases. The stent weevaluated (CereStent from the Micrus Corporation) promisesto achieve these goals. Our intention was to evaluate theproduct for efficacy in two animal models, the canine veinpouch model and the rabbit elastase model.235CONCLUSIONInitial studies indicate a highly flexible device with excellentconformability. The stent additionally demonstrated sufficientradial force and coverage to allow tight packing of coilsat the aneurysm neck. Angioscopic observations in thecanine revealed a high level of stent stability and frequenteradication of the aneurysm neck. Three- and 6-month follow-upstudies in both the dog and the rabbit groups areforthcoming.KEY WORDS: Stent, intracranial, aneurysmThe authors of this work have indicated the following affiliations/disclosures:Micrus Corporation: Research support.Paper 302 Starting at 3:40 PM, Ending at 3:48 PMInterventional Aneurysm Therapy of the PericallosalArteryMATERIALS & METHODSIn the canine study 16 aneurysms were created in eight animalsusing the surgical venous pouch method of sidewallcarotid aneurysms. All aneurysms had a dome-to-neck ratiobelow 1.5. Dense packing of these aneurysms is consideredto be very difficult to unachievable without neck protection.All aneurysms were stented with a 30 mm length CereStentand then coiled. One aneurysm was embolized with Micrusplatinum coils, the contralateral with competitive coils ineach dog. Side selection was randomized prior to coiling.Follow-up angiograms were performed immediately aftertreatment and 1 month after treatment. Angioscopy was performedin each animal at 1 month. Three- and 6-month dataare forthcoming. In a separate study six aneurysms were createdin six rabbits using the elastase induction method at theorigin of the right carotid artery. The aneurysms were stentedand coiled. Angiographic follow-up was performed at 1month by injecting the central artery of the left ear, obtainingangiogram retrograde fashion. Three- and 6-month dataare forthcoming.RESULTSAll aneurysms were stented and coiled successfully. One dogdied several hours after recovery due to rebleeding from thegroin. This animal was excluded from the study. In anothercase, coil migration during implant was observed due toimproper oversizing. The stent was retrieved successfullyfollowed by retreatment. Coil protrusion was minimal in 5cases and nonexistent in 9 cases indicating effectiveness ofthe stent. Acceptable coil protrusion was observed from theimmediate postimplant angiogram in 5 cases. Follow-updemonstrated stent stability. All but one aneurysm demonstrated100% occlusion with protective intimal coverage atthe neck. Extensive neointimal hyperplasia either proximalor distal to the aneurysm neck was observed in three parentarteries, which are in process of further evaluation. In therabbit study, all stents were deployed successfully and theaneurysms coiled. At 1 month all parent vessels wereobserved to be patent. Excellent conformance of the stents tothe tortuous vessel was observed in all instances. Twoaneurysms had neck remnant. There was no sign of intimalhyperplasia or stent migration.Goericke, S. L. · Doerfler, A. · Wanke, I. · Regel, J. · Stolke,D. · Forsting, M.University of Essen Medical SchoolEssen, GERMANYPURPOSETo analyze technical feasibility and efficacy of endovascularocclusion of aneurysms at the pericallosal artery.MATERIALS & METHODSEighteen patients harboring 20 pericallosal aneurysms wereconsidered for endovascular therapy using electrolyticallydetachable coils (GDC, Boston Scientific; EDC, Dendron-MTI). Aneurysm size was: < 4 mm (n = 12), 4-6 mm (n = 7),> 6 mm (n = 1). Seventeen patients had a SAH, 13 bled froma ruptured pericallosal artery aneurysm, four patients due toan additional aneurysm (MCA n = 3, Pcom n = 1). Patientswith SAH were classified as H&H Grade I (n = 5), II (n = 4),III (n = 4), IV (n = 3), and V (n = 1). At the time of treatmentfour patients had severe vasospasm. Occlusion rate wasdivided into total (100%), subtotal (95-99%) and incomplete(< 95%) occlusion. Up to the present follow-up angiography,MR angiography and clinical evaluation based on Glasgowoutcome scale (GOS) was performed in 17 patients at 6months.RESULTSEmbolization with total occlusion was performed in 16/20aneurysms. Two patients with severe vasospasm could beembolized following administration of papaverine. In 4/20aneurysms coil embolization was not feasable because of anunfavorable broad-based aneurysm anatomy (n = 2) andsevere vasospasm (n = 2). Three of these patients were treatedsurgically, one (H&H V) died prior surgery. Proceduralcomplication included aneurysm perforation without neurologicdeterioration (n = 1). There was no procedure-relateddeath. One day after angiography one patient suffered froma hemiparesis by thromboembolic MCA occlusion, whichwas thrombolyzed successfully. CT demonstrated remainingMCA infarction. Ischemic infarction also was visible in twoother patients on routine CT. During follow-up two patientswith initially total aneurysm occlusion showed subtotal (n =1) and incomplete (n = 1) aneurysm occlusion, probably dueThursday
Thursdayto recanalization of a partially thrombosed aneurysm compartment.During 6 month follow-up no patient rebled. GOSwas: GR (n = 6), MD (n = 4), SD (n = 5), V (n = 1).CONCLUSIONEndovascular coil embolization of ruptured and unrupturedpericallosal aneurysms can be performed effectively andmay be a less invasive therapeutic alternative to surgery,especially during the vulnerable vasospasm period.However, comparable to surgery an unfavorable aneurysmanatomy or severe vasospasm may limit endovascular treatmentpossibilities in this location.236allowed a detailed imaging of liquid embolic distributionwithin the aneurysm as well as of neo-intima formation.Histologic evaluation confirmed MR findings and revealedonly mild foreign-body reaction in 2 embolized aneurysms.CONCLUSIONLiquid embolization of experimental wide-necked aneurymswith PVAP technically is feasible while handling is facilitatedcompared to Onyx. The liquid embolic agent is well visibleunder fluoroscopy due to its high iodine content andenables artifact-free evaluation of treated aneurysms withCT and MR angiography.KEY WORDS: Aneurysms, pericallosal artery, embolizationPaper 303 Starting at 3:48 PM, Ending at 3:56 PMLiquid Embolization of Experimental Wide-NeckedAneurysms with Polyvinyl Alcohol Polymer: A New,Nonadhesive, Iodine-Containing Liquid Embolic AgentDudeck, O. 1 · Jordan, O. 2 · Hoffmann, K. T. 1 · Podrabsky, P. 1· Heise, M. 3 · Meyer, R. 4 · Rüfenacht, D. 5 · Doelker, E. 2 ·Felix, R. 11Diagnostic Radiology, Berlin, GERMANY, 2 Laboratoire dePharmacie Galenique et de Biopharmacie, Geneva,SWITZERLAND, 3 Klinik für Allgemein-, Viszeral- undTransplantationschirurgie, Berlin, GERMANY, 4 Abteilungfür Herz- und Gefäßpathologie, Deutsches HerzzentrumBerlin, Berlin, GERMANY, 5 Hôpitaux Universitaires deGenève, Geneva, SWITZERLANDPURPOSEThe evaluation of polyvinyl alcohol polymer (PVAP), a new,nonadhesive, iodine-containing liquid embolic agent synthesizedby the authors for endovascular liquid embolization ofexperimental wide-necked aneurysms in swine.MATERIALS & METHODSTen broad-based carotid side-wall aneurysms were constructedsurgically in 5 pigs. PVAP (40%) in dimethyl sulfoxide(DMSO) was injected over a microcatheter placedinside the aneurysm under temporary balloon occlusion ofthe parent artery across the neck of the aneurysm. Controlangiography was performed immediately after embolizationas well as after 4 weeks. Before reangiography multidetectorrow CT angiography (CTA) was performed and harvestedaneurysms were investigated by high-field MR imaging at3.0 T.RESULTSPolyvinyl alcohol polymer can be used at room temperaturewithout prior preparation. Seven aneurysms primarily couldbe occluded completely (70%), whereas in 2 cases a minimalprotrusion of polymerized PVAP into the carotid arterylumen was observed. One aneurysm was embolized almostcompletely (90%), another aneurym was partially embolized(~80%) as further embolization was aborted due to a thrombusat the tip of the balloon. During one embolization a leakageof liquid embolic agent from a DMSO-incompatiblemicrocatheter resulted in carotid artery occlusion with noclinical sequelae. Aneuryms embolized with PVAP couldwell be discriminated from the parent artery in CTA withoutany beam hardening artifacts. High-field MR imagingKEY WORDS: Wide-necked aneurysms, liquid embolicagent, endovascularPaper 304 Starting at 3:56 PM, Ending at 4:04 PMMorphologic Assessment of Middle Cerebral ArteryAneurysms for Endovascular TreatmentJayaraman, M. V. · Marks, M. P. · Do, H. M. · Versnick, E.J. · Steinberg, G. K.Stanford UniversityStanford, CAPURPOSELarge series of endovascular therapy for aneurysms suggestthat middle cerebral artery (MCA) aneurysms in the bifurcationregion are not as well suited to endovascular therapy asother circle of Willis aneurysms (1, 2). The purpose of ourstudy was to evaluate the incidence of specific morphologicfeatures of middle cerebral artery bifurcation aneurysmswhich determine suitability for endovascular treatment.MATERIALS & METHODSFifty-eight bifurcation or trifurcation middle cerebral artery(MCA) aneurysms studied angiographically over a 4-yearperiod at our institution were included. Fusiform M1 segmentaneurysms, aneurysms involving lenticulostriatebranches, or distal M2 segments were excluded.Angiographic images of each aneurysm were reviewed for:size of aneurysm, including maximum, dome diameter, andneck size as well as dome to neck ratio. Angiograms alsowere analyzed for: branch vessels originating from theaneurysm sac, straightening of the aneurysm wall to suggestintramural thrombus, calcification in the region of theaneurysm, stenosis of the parent vessel, and presence ofdaughter sacs. Aneurysms then were evaluated subjectivelywith respect to suitability for endovascular therapy. All posttreatmentangiograms that were done were reviewed andclassified into four categories: completely occluded, residualfilling of sac with > 90% occlusion, and residual filling with< 90% occlusion.RESULTSFifty-eight MCA aneurysms were evaluated in 53 patients.Forty (60%) had not ruptured previously and eighteen (31%)had ruptured. Surgical clipping was performed for 36/58aneurysms (63%), no treatment as of the time of chart reviewfor 17/58 (30%), endovascular treatment for 3/58 (5%), andsurgical wrapping for 1/58 (2%). Fifty-five of 58 patients(95%) were alive at time of discharge. Fifty-one of 58aneurysms (88%) had a dome to neck ratio less than 2:1.
Mean maximal size was 7.5 mm (range 1.0 to 40.0 mm),mean dome size was 5.7 mm (range 1.0 to 35.0 mm), andmean neck size was 4.9 mm (range 1.0 to 35 mm). Branchvessel incorporation in the aneurysm sac was seen in 23/58(40%), straightening suggestive of thrombus in 14/58 (24%),calcification in 2/58 (3%), parent vessel stenosis in 1/58(2%), and daughter sacs in 4/58 (7%). Nine of 58 (16%)aneurysms were judged suitable for endovascular treatment.Twenty-two of 28 treated aneurysms with posttreatmentangiograms (78%) had complete occlusion, 2 of 28 (7%) hadresidual filling of 10% residualfilling.CONCLUSIONThe majority of MCA aneurysms have morphologic featuressuch as a dome to neck ratio less than 2:1 or branch vesselincorporation which may make them unsuitable for endovasculartreatment using conventional intraaneurysmal coiling.REFERENCES1. Molyneux A, Kerr R, Stratton I, Sandercock P, Clarke M,Shrimpton J, et al. International Subarachnoid AneurysmTrial (ISAT) Collaborative Group. InternationalSubarachnoid Aneurysm Trial (ISAT) of NeurosurgicalClipping versus Endovascular Coiling in 2143 Patients withRuptured Intracranial Aneurysms: A Randomised Trial.Lancet 2002;36:360(9342):1267-12742. Regli L, Uske A, de Tribolet N. Endovascular Coil PlacementCompared with Surgical Clipping for the Treatment ofUnruptured Middle Cerebral Artery Aneurysms: AConsecutive Series. J Neurosurg 1999;90(6):1025-1030KEY WORDS: Aneurysm, endovascular therapyPaper 305 Starting at 4:04 PM, Ending at 4:12 PMNeuroform Stent-Assisted Coiling of Wide NeckAneurysms: A Single Center ExperienceAkpek, S. 1,2 · Benndorf, G. 1 · Arat, A. 3 · Klucznik, R. 1 ·Mawad, M. E. 1 · Strother, C. M. 11Baylor College of Medicine, Houston, TX, 2 Gazi University,Ankara, TURKEY, 3Hacettepe University, Ankara,TURKEYPURPOSETo evaluate the angiographic results and clinical outcome ofpatients treated with stent-assisted coiling using theNeuroform stent.MATERIALS & METHODSA retrospective review of patients treated with Neuroformassistedcoiling during the interval between September 2002and December 2003 was done. Thirty-five aneurysms in 32patients were treated using this technique. Technical successof the procedure, procedure-related complications, immediateangiographic results and neurologic outcome wererecorded. Angiographic results were recorded as occlusion(without neck remnant), subtotal but satisfactory occlusion(> 90% with small neck remnant), residual aneurysm, andfailure.237RESULTSIn 34 of the 35 aneurysms stent deployment across the neckof the aneurysm was successful. Proper deployment of thestent could not be achieved in only one aneurysm. Coilembolization was attempted in 31 out of 34 aneurysmswhere the stent was deployed successfully. Of these, 27 werecoiled with preservation of parent artery. Coiling could notbe achieved in 4 aneurysms because of vessel rupture in onecase and protrusion of coils into the parent artery in remainingthree cases. In 10 aneurysms immediate posttreatmentangiography showed residual filling; in the remaining 17there was either total or satisfactory occlusion. Procedurerelated mortality was 0%. Adverse events occurred in fivepatients (15%); vessel rupture (n = 2), parent artery occlusion(n = 1), late intraparenchymal hemorrhage (n = 1) and adelayed ischemic stroke in the stented vascular territory (n =1). Follow-up angiography was available in eight out of 27treated aneurysms. Aneurysmal regrowth occurred in onepatient at 2 months follow-up. No bleeding was recordedduring the follow-up period of 2-8 months.CONCLUSIONAvailability of a flexible intravascular stent suitable for usein the intracranial circulation may facilitate endovasculartreatment of wide necked intracranial aneurysms. The fullvalue of this technique remains to be determined.KEY WORDS: Cerebral aneurysm, embolization, stentThe authors of this work have indicated the followingaffiliations/disclosures: Boston Scientific: Researchsupport/consultant.Paper 306 Starting at 4:12 PM, Ending at 4:20 PMPosterior Communicating Artery Aneurysms: Outcomesin Patients Treated with Endovascular Coiling andSurgical Clipping: A Single Center ExperienceShownkeen, H. · Hall, M. · Craig, E. · Anderson, D. ·Origitano, T.Loyola University Medical CenterMaywood, ILPURPOSEEndovascular therapy for intracranial aneurysms has beenavailable now for over 10 years. Prior studies including theInternational Subarachnoid Aneurysm Trial (ISAT) publishedin Lancet have evaluated endovascular treatment ofintracranial aneurysms in the setting of subarachnoid hemorrhageand have shown it to be a competitive alternative tosurgical therapy. Studies by Johnson et al. have supplied datato suggest that endovascular therapy for unrupturedaneurysms results in decreased adverse outcomes relative tosurgical intervention. To our knowledge no one yet has comparedthese different treatment modalities specificallyinvolving aneurysms of the posterior communicating artery(Pcom). This investigation was of particular interest to us assurgical outcomes in this patient population are generallybetter than intracranial aneurysms in other regions. Ourobjective was to analyze both ruptured and unruptured Pcomaneurysms with regards to new permanent and temporarypostprocedure neurologic deficit, procedural related nonneu-Thursday
Thursdayrologic complications, inpatient mortality, length of inpatienthospital stay, residual aneurysm postintervention, andaneurysm regrowth.MATERIALS & METHODSSeventy-three patients with 73 posterior communicatingartery aneurysms from Loyola University Medical Centerundergoing surgical or endovascular treatment during theyears 1997-2003 were analyzed retrospectively. Availableinpatient and outpatient medical records, imaging studies,imaging reports, and morbidity/mortality annals werereviewed. Only primary Pcom aneurysm interventions wereincluded.RESULTSTwenty-three patients were included in the surgical groupand 50 patients were included in the endovascular group.Three patients in the surgical group (12%) and seven patientsin the endovascular group (14%) demonstrated residualaneurysm on subsequent angiography. Aneurysm regrowthwas only encountered in the endovascular group (8 patients,16%). No patient with regrowth demonstrated new symptomsor subsequent subarachnoid hemorrhage. Regrowthwas treated successfully with surgery in three patients andwith repeat coiling in three patients (there were no repeatsurgical or endovascular interventions in the remaining twopatients with stable regrowth). In the surgical group therewere a total of 4 (17%) new postprocedural neurologic complications,none were reported in the endovascular group.One nonneurologic complication was reported in the surgicalgroup (4%, CSF leak) compared to 3 (groin arterialaccess site) complications in the endovascular group (6%).For patients presenting with unruptured aneurysms, averageinpatient hospital stay in the endovascular group was 1.6days compared to 6.0 days for the surgical group. In theendovascular group there were two in-hospital deaths (4%)due to medical complications, none were reported in the surgicalgroup.CONCLUSIONOur results indicate that for Pcom aneurysms endovascularcoiling is an appropriate alternative to surgical clipping.Endovascular patients experienced fewer new postproceduralneurologic complications, and patients within this grouppresenting with unruptured aneurysms had a decreased postprocedureinpatient hospital stay. Although the percentage ofpatients with residual aneurysm postintervention was similarbetween the two groups, patients treated with coiling demonstrateda greater frequency of aneurysm regrowth.KEY WORDS: Endovascular, aneurysm, Pcom238Paper 307 Starting at 4:20 PM, Ending at 4:28 PMProspective Evaluation of CT Angiography to Render aVolume Embolization Ratio in Endovascular Treatmentof Intracranial AneurysmsBoulos, A. S. · Bagla, S. · Deshaies, E. M. · Belden, C.Albany Medical CenterAlbany, NYPURPOSEThe degree of volume fill with platinum coil embolizationlikely plays an important role in recanalization. In an effortto reduce the rate of recanalization, maximal embolization ofthe aneurysm is performed at times beyond angiographicobliteration of the aneurysm. The hydrocoil is an embolicagent that swells with contact of blood. This results in highervolume embolization ratios and, therefore, may reducerecanalization rates.MATERIALS & METHODSTen consecutive patients underwent multislice CT angiographyprior to interventional treatment. Using a 3D workstation,hand-drawn regions of interest on 0.625 mm axial sliceswere used to render a total aneurysm volume. The volumeembolization ratio was calculated as a ratio of embolic materialvolume to total aneurysm volume. Follow-up digital subtractionangiography is performed at 3, 6, and 12 months.RESULTSThe total volume of aneurysms varied from 0.05 to 4.8 cc.Embolization ratios varied from 23% to 80% (mean 52%).The embolization ratios were significantly different thanthose calculated using height-width-depth measurementsfrom two-dimensional angiography.CONCLUSIONThe novel use of CTA to determine volume allowed for moreprecise determination of volume embolization ratios regardinga new embolic material. These ratios may well providemeaningful data regarding recanalization. As the meanembolic ratio was significantly higher than 32% in all butone case, this may portend well for the ability to preventrecanalization using this embolic material. Indeed in allcases that the volume embolization ratio was greater than40%, stable follow-up digital subtraction angiography isbeing depicted.KEY WORDS: Volume embolization ratio, CT angiography,hydrocoil
Thursday Afternoon3:00 PM - 4:30 PMRoom 606 - 609(60c) Adult Brain: General andDiffusion Imaging(Scientific Papers 308 - 319)See also Parallel Sessions(60a) Adult Brain: General(60b) Interventional: Aneurysms(60d) Adult Brain: General and 3.0 TModerators: Danial Hallam, MDWilliam G. Bradley, Jr., MD, PhD, FACRPaper 308 Starting at 3:00 PM, Ending at 3:08 PMAdvance Detection of Alzheimer’s Disease UsingHippocampal VolumetryBobinski, M. · De Santi, S. · Li, J. · de Leon, M.New York University Medical CenterNew York, NYPURPOSETo determine in a 3-time point longitudinal study whetherthe extent and/or rate of hippocampal atrophy during theperiod of mild cognitive impairment (MCI) predicts futuretransition from MCI to early-stage Alzheimer’s disease(AD).MATERIALS & METHODSFrom an on-going bi-annual longitudinal MR imaging study,we selected normal elderly and MCI subjects that completed3 examinations and who remained stable over the first twotime points. At baseline, 8 normal controls had GlobalDeterioration Scale (GDS) scores of 1 or 2. The MCIpatients (GDS = 3) showed mild memory deficits in theabsence of dementia. At the third time point, 8 MCI patientsremained unchanged (GDS = 3, nondeclining MCI) and 9MCI patients progressed to mild AD (GDS = 4, decliningMCI). At baseline and both follow-ups, all subjects receivedfull diagnostic work-up including medical, neurologic, psychiatric,neuropsychologic evaluations and MR imaging ofthe brain. In addition to standard diagnostic sequences,research sequence was obtained (1.2 mm thick sagittal T1-weighted sections). The scans from baseline, follow-up 1,and follow-up 2 were coregistered and reformatted to a standardcoronal plane with a 1.5 mm slice thickness. For eachsubject volumes of the left hippocampus and supratentorialcompartment (estimate of the head size) were measured by239using previously described and validated methods. Statisticalanalyses were performed using ANCOVA and logisticregression models controlling for head size.RESULTSAt all 3 time points, the hippocampal volume differed (p
Thursday240pocampus in HIV-positive patients, (2) if there is a correlationbetween the DTI abnormalities and severity of the dis-Paper 310 Starting at 3:16 PM, Ending at 3:24 PMease.Circulatory Changes in Cerebral Perfusion Resultingfrom HIV-Associated DementiaMATERIALS & METHODSMR imaging, and DTI were performed in 60 HIV-positivepatients and 30 control subjects on a 1.5 T clinical scanner.Fractional anisotropy (FA) and apparent diffusion coefficient(ADC) maps were generated from the DTI data set andcoregistered with T2-weighted MR images. Uniform regionsof interest (ROIs) were positioned on the images in followingregions of the brain: 1) splenium of the corpus callosum;2) genu of the corpus callosum, 3) frontal white matter, and4) hippocampus. HIV-positive patients were subdivided into2 groups according to the CD4 count; a) under 250cells/mm 3 , and b) higher than 250 cells/mm 3 . According tothe viral load level in plasma, three gropus of patients weremade; a) < 50 copies/mL, b) 50-100000 copies/mL, and c) >100000 copies/mL. The clinical, immunologic, and virologiccharacteristics were determined, and compared with neuroradiologicfindings.RESULTSFractional anisotropy was reduced in genu of the corpus callosum,frontal white matter, and hippocampus in HIV-positivepatients compared to the controls but did not reach thestatistical significance. Apparent diffusion coefficient wasincreased significantly in genu of the corpus callosum comparedto the controls, and increased in other locations withoutstatistical significance. Higher ADC values in frontalwhite matter and splenium of the corpus callosum correlatedwell with increase of viral load; patients with viral load higherthan 100000 copies/mL had the highest ADC values. Nostatistical significance was found in FA and ADC values inall measured brain regions between patients and controlsrelated to the CD4 count. No correlation was found betweentherapy naive and patients who were on HAART and DTImeasurements.CONCLUSIONThe results of our study suggest that DTI may be much moresensitive to the disintegration of neuronal structure in HIVrelatedbrain disease than conventional MR imaging.According to the results from the neuropathologic studieswhere vulnerability of hippocampal neurons and myelins inthe frontal region in HIVE was found, reduced anisotropy inthose brain regions was expected. However statistical significantthreshold was not found. Knowing the fact that CD4count and viral load levels are not anymore reliable markersfor HIV infection, new markers are necessary, especially forfollowing these patients during the antiretroviral therapy,DTI has a potential to develop into a powerful technique forthe study of brain structure in HIV-positive patients.Cool, D. W. · Smith, J. K. · Hall, C. · Robertson, K. · Wilber,K. · Aylward, S. R. · Lin, W.University of North Carolina at Chapel HillChapel Hill, NCPURPOSETo explore the role of circulatory pathology in HIV-associateddementia, using an atlas-based statistical comparison ofhemodynamic changes across HIV subjects with advancinglevels of cognitive dysfunction.MATERIALS & METHODSMR perfusion images were gathered from 25 HIV subjectswho were clinically stratified into one of three cognitiveclassifications: normal cognitive function, minor cognitivemotor disorder (MCMD), or HIV-associated dementia(HAD). Perfusion images were obtained at 3 T using a gradient-echoecho-planar sequence with TR of 2.0 sec, TE of54 msec, with FA of 60 degrees, 128 x 128 matrix and 230mm FOV repeated 40 times. A single dose of Gd-DTPA contrastagent was injected rapidly intravenously at the end ofthe 5th scan and flushed with saline. Data was processed offlinein the manner described by Ostergaard and Weisskoff tocreate images of cerebral blood flow (CBF) and cerebralblood volume (CBV). All scans within each cognitive groupwere summed to form an atlas with expected mean and variancefor both CBF and CBV measures. Mean scans ofMCMD and HAD groups were compared to those of theHIV normal cognitive group using an image-based z-scoreanalysis technique to identify regions of significant deviation.Regional analysis then was completed to quantify theaverage circulatory changes between the groups with regionsselected in the central white matter of the left hemisphere,and the deep gray matter nuclei.RESULTSUsing atlas-based comparison, contrary to prior reports (1),we found areas of increased CBF and CBV in the white matterof the MCMD and HAD groups as compared to the HIVgroup of normal cognition. There was no significant changein gray matter of the cortex or deep nuclei except for a smallarea of increased CBV in the left caudate. Group comparisonof the white matter of the centrum semiovale confirms anaverage increase in CBF and CBV of the white matter inMCMD and HAD subjects. The region of interest analysis ofthe deep gray matter nuclei showed no significant differencesbetween groups.KEY WORDS: Human immunodeficiency virus (HIV), diffusiontensor imaging, MR imaging
CONCLUSIONOur results indicated localized circulatory changes in thewhite matter with increased CBF and CBV in patients withMCMD and HAD. There were no statistically significantchanges in gray matter. The atlas-based comparison identifieda general trend in cerebral perfusion showing elevationin CBF and CBV measurements for individuals of increasingcognitive dysfunction. Progressive increases in CBVthrough the entire white matter region of the centrum semiovale,imply an association between advanced white matterdisease (atrophy and/or demyelination) and circulatory alterations.REFERENCES1. Berger JR, Nath A, Greenberg RN, et al. CerebrovascularChanges in the Basal Ganglia with HIV Dementia. Neurology2000;54:921-926KEY WORDS: Dementia, HIV, cerebral blood flowPaper 311 Starting at 3:24 PM, Ending at 3:32 PMAnalysis of the Utility of Diffusion-Weighted MRImaging in Distinguishing Central Nervous SystemToxoplasmosis from LymphomaSchroeder, P. 1 · Post, M. J. D. 1 · Thurnher, M. 2 · Oschatz, E. 2· Bruce, J. 11University of Miami/Jackson Memorial Hospital, Miami,FL, 2 University Hospital Vienna, Vienna, AUSTRIAPURPOSEToxoplasmosis and lymphoma are common lesions of thecentral nervous system in patients with acquired immunedeficiency syndrome (AIDS). It is often difficult to distinguishbetween these lesions clinically and radiographically.Because the treatment of these lesions differs significantly, itis an important distinction to make, as the implementation ofincorrect therapeutic measures may result in substantial morbidityand mortality. Previous research has demonstratedrestricted diffusion within lymphomatous lesions and bacterialabscesses in the brain (1). However, little work has beendone to evaluate the diffusion characteristics of toxoplasmosis.In a study of 21 patients performed by Camacho, et al. in241April 2003 (2), no toxoplasma lesion was found to have anADC ratio below 1.0, and no lymphoma lesion was found tohave an ADC ratio above 1.6, indicating that ADC ratiosmay be helpful in making the distinction. However, preliminarywork at our institutions has revealed that there may bea wider and less characteristic spectrum of ADC values intoxoplasmosis lesions than previously thought, so this studywas designed to explore further the utility of diffusionweightedimaging and ADC maps/values in making the distinctionbetween toxoplasmosis and lymphoma.MATERIALS & METHODSThe MR studies of 21 AIDS patients with untreated CNStoxoplasmosis at 2 institutions were reviewed retrospectively.A total of 39 lesions were included. The signal characteristicsof these lesions on diffusion-weighted images andADC maps were evaluated. The ADC ratios of the lesionswere calculated (defined as the ratio of an ADC valueobtained within the lesion to the ADC value of a region ofinterest (ROI) in the contralateral normal white matter.) Todate, 5 lesions in 2 patients with lymphoma also have beenanalyzed.RESULTSMultiple patterns of diffusion were demonstrated in toxoplasmalesions: restricted diffusion, increased diffusibility,normal diffusion, T2 shine-through, and mixed and indeterminatepatterns. The ADC ratios calculated are listed inTable 1. The 17 toxoplasma lesions with values > 1.6 werefound in 7 patients, 3 of whom had additional toxoplasmalesions with lower ADC ratios in the 1.0-1.6 range.Table 1: ResultsADC ratio Number of toxoplasma lesions Number of lymphoma lesions1.6 17 0Total number of lesions: 39 Total number of lesions: 5(Range of ADC ratios 0.8-2.8) (Range of ADC ratios 1.0-1.5)CONCLUSIONToxoplasmosis exhibits a wide spectrum of diffusion characteristicswith ADC values ranging from 0.8 to 2.8, whichhave significant overlap with those of lymphoma. Therefore,in the majority of cases, diffusion properties cannot be reliablyused to distinguish between toxoplasmosis and lymphoma.REFERENCES1. Desprechins B, Stadnik T, Koerts G, Shabana W, Breucq C,Osteaux M. Use of Diffusion-Weighted MR Imaging inDifferential Diagnosis Between Intracerebral NecroticTumors and Cerebral Abscesses. AJNR Am J Neuroradiol1999;20:1252-12572. Camacho DL, Smith JK, Castillo M. Differentiation ofToxoplasmosis and Lymphoma in AIDS Patients by UsingApparent Diffusion Coefficients. AJNR Am J Neuroradiol2003;24:633-637KEY WORDS: Diffusion, toxoplasmosis, lymphomaThursday
Thursday242Paper 312 Starting at 3:32 PM, Ending at 3:40 PM Paper 313 Starting at 3:40 PM, Ending at 3:48 PMUtility of Diffusion-Weighted Imaging over Conventional Doppler vs MR Flowmetry in Atherosclerotic CarotidMR Imaging in Complicated Course of Bacterial Artery DiseaseMeningitisÖzsarlak, Ö. · Geniets, C. · Van Goethem, J. W. · Maes, M.· Parizel, P. M.Garcia-Morales, F. 1 · Moritani, T. 2 · Hiwatashi, A. 2 · Ekholm,S. 2 · Ketonen, L. 2 · Westesson, P. 21Veteran’s Administration Medical Center Dallas, Dallas,TX, 2 University of Rochester Medical Center, Rochester, NYPURPOSEThe purpose of this study was to evaluate the utility of diffusion-weightedimaging (DWI) in comparison to conventionalMR imaging in complicated cases of bacterial meningitis.MATERIALS & METHODSWe reviewed DWI and MR findings in 11 patients with acomplicated course of bacterial meningitis. The patientswere 6 males and 5 females, ages ranging from 7 days to 81years. There were 6 patients with different degrees of braininfarction due to vasculitis. Four patients had purulent leptomeningitis.One patient had subdural empyema and periorbitalabscess. Diffusion-weighted imaging and the apparentdiffusion coefficient (ADC) maps (b = 0, 1000 sec/mm2, 3orthogonal orientations) were obtained. T1- and T2-weighted,gadolinium-enhanced T1-weighted, and fluid attenuatedinversion recovery images (FLAIR) and MR angiography(MRA) also were obtained.RESULTSIn 3 of 6 patients with brain infarction, DWI showed hyperintensitywith decreased ADC, characteristic finding of acuteinfarction in the bilateral fronto-parietal or parieto-occipitalcortices due to vasculitis. In neonatal brain, there was a clearadvantage of DWI over T2-weighted images due to increasewater content. In other 3 patients, acute infarction was detectedon DWI to a better extent compared to T2-weighted imagesin bilateral basal ganglia, the deep white matter or the corpuscallosum. These infarctions were related to vasculitis of smallto large arteries, which were seen on MRA. In 4 patients, DWIshowed purulent meningitis as hyperintensity with decreasedADC compared with CSF. Although FLAIR images demonstratedthe findings to a good extent, DWI were clearly superiorto show the abnormalities. In 1 patient, DWI showed periorbitalabscess and subdural empyema as hyperintensity withdecreased ADC. One patient with Lemierre’s syndromeshowes right jugular vein thrombosis, right sigmoid sinusthrombosis, cavernous sinus thrombophlebitis, and abscess formationin the cavernous sinus with severe narrowing of theright internal carotid artery and watershed infarction. OnlyDWI could detect the abscess formation in the cavernous sinus.CONCLUSIONDiffusion-weighted imaging are useful in characterizingcomplications of meningitis such as cerebral infarction,purulent leptomeningitis, subdural empyema, cavernosussinus abscess formation. Although many of these complicationswere recognized with conventional MR imaging, DWIincreased the conspicuity of these findings being particularlyimportant in the pediatric brain for vascular insults, purulentleptomeningitis, and cavernous sinus abscess.KEY WORDS: Meningitis, diffusion-weighted imaging, complicationsUniversity Hospital AntwerpEdegem (Antwerp), BELGIUMPURPOSEThe aim of this study is to compare the flow characteristicsof carotid arteries using MR and Doppler flowmetry.MATERIALS & METHODSTwenty healthy subjects and 20 patients with a carotid arterystenosis underwent both MR and Doppler examinations forassessment of the degree of stenosis. Three-dimensionalphase-contrast MR flowmetry is obtained using retrospectivecardiac-gating with a VENC factor of 200 cm/s. Peaksystolic velocity, peak diastolic velocity, RI values,ICA/CCA index for both systolic and diastolic peak values,and curve changes were compared with those obtained onDoppler imaging.RESULTSAlthough, the peak systolic and diastolic velocity valueswere significantly different, RI, ICA/CCA index, and thecurve profiles were comparable on both modalities inhealthy subjects, and the patients with a stenosis (p< 0.001for both RI and ICA/CCA index). These results are showingthat MR flowmetry is competitive to the carotid Dopplerexamination for assessing the carotid artery stenosis.CONCLUSIONThe phase contrast MR flowmetry allows a hemodynamicassessment of the carotid arteries with comparable findingsobtained on Doppler imaging.KEY WORDS: MR flowmetry, carotid, stenosisPaper 314 Starting at 3:48 PM, Ending at 3:56 PMInterobserver Variability of CT PerfusionPerlow, A. 1 · Choksi, V. R. 2 · Shah, G. V. 2 · Hoeffner, E. H. 21University of Miami, Miami, FL, 2 University of Michigan,Ann Arbor, MIPURPOSETo assess the interobserver reproducibility for the calculationof CT perfusion parameters including cerebral blood volume(CBV), cerebral blood flow (CBF), and mean transit time(MTT).MATERIALS & METHODSFour independent observers (2 neuroradiology fellows and 2attending neuroradiologists) performed CT perfusion analysisusing perfusion 2 software (GE Medical Systems,Milwaukee, WI) on 10 patients at 2 different slice levels.Three observers were blinded to patient diagnosis. Theobservers selected input artery, input vein and selectedregion of interest independently. All selected the anteriorcerebral artery as input artery. One attending neuroradiolo-
gist has calculated independently over 100 CT perfusioncases, the other 3 observers were given a 45-minute instructionby the experienced neuroradiologist. Multivariateregression analysis for the calculation of fraction of variancein observer for MTT, CBF, and CBV, correlation of patient,affected side and vascular territory (anterior cerebral artery,middle cerebral artery, and posterior cerebral artery) wasperformed. P value of < 0.05 was significant.RESULTSThe interobserver fraction of variance (Rho) for MTT, CBF,and CBV was 0.04, 0.001, and 0.02 respectively. Correlationfor affected side and arterial territory for MTT was (Rho) 0and 0; CBF - 0.03 and 0.08; CBV - 0.1 and 0 respectively.CONCLUSIONThere is good correlation between observers measuringMTT, CBF, and CBV. CT perfusion calculations can be masteredin a relatively short time, if performance criteria areadhered to strictly. We advocate that CTP analysis be taughtand performed by radiology technicians.KEY WORDS: CT perfusion, interobserver variabilityPaper 315 Starting at 3:56 PM, Ending at 4:04 PMEvaluation of Sinus Vein Thrombosis by Contrast-Enhanced MR VenographyKlingebiel, R. 1 · Bohner, G. 1 · Kirsch, R. 21Charité, Berlin, GERMANY, 2 Siemens, Erlangen,GERMANYPURPOSESlow and alternating flow as well as anatomical variants maymimic sinus vein thrombosis (SVT) using conventional 2Dtime-of-flight MR venography. We defined a contrastenhanced(CE) MR venography (MRV) acquisition protocoland report preliminary results of an ongoing study in SVTpatients.MATERIALS & METHODSIn nine patients (7 female, 2 male, mean age 32.6 years),clinically suspected of suffering from SVT, ten CE FLASH3D GE MRV studies were performed using a care bolus technique(TR 5.28, TE 1.91, FOV 250, TA 3:22) and powerinjection (2 ml/s) of gadolinium (0.2 mmol/kg). In 7/10 CEMRA studies the findings were compared to 2D time-offlightMR venography (TOF MRV) and/or multlislice CTvenography (CTV).RESULTSIn 4 studies (3 patients) SVT was diagnosed and in sixpatients SVT could be ruled out on the basis of CE MRVwithout requiring additional imaging procedures. The findingsof multislice CTV, preceding CE MRV due to logisticreasons in three patients, agreed well with CE MRV.Contrast-enhanced MRV provided detailed anatomical informationwith respect to the dural sinus, bridging veins, andinternal cerebral veins superior to TOF MRV and equivalentto CTV, without requiring bone segmentation techniques likeCTV.243CONCLUSIONOur preliminary results indicate that the applied CE MRVsequence might be appropriate for the assessment of SVTpatients without using ionizing radiation. It combines superiorspatial resolution as compared to TOF MRV with shorteracquisition times as compared to TOF MRV and previouspublished CE MRV techniques.KEY WORDS: Sinus vein thrombosis, MR imaging, venographyPaper 316 Starting at 4:04 PM, Ending at 4:12 PMMR Digital Subtraction Angiography in Patients withCerebral Arteriovenous MalformationsEssig, M. 1 · Giesel, F. 1 · Debus, J. 21German Cancer Research Center, Heidelberg, GERMANY,2University of Heidelberg, Heidelberg, GERMANYPURPOSEThe purpose of this study was to evaluate the usefulness of anew ultrashort contrast-enhanced (CE) MR angiography(MRA) for the morphologic evaluation of cerebral arteriovenousmalformations (AVMs).MATERIALS & METHODSTwenty-five patients with angiographically confirmed cerebralAVMs were included into the protocol. For ultrashortCE MRA a 3D spoiled gradient-echo sequence with a TR/TE= 5/2 ms flip angle of 50° and a matrix size of 128 x 256 wasperformed with an acquisition time of 9 sec. The CE MRAwas performed after bolus application of 0.1 mmol/kg BW ofGd-BOPTA (MultiHance®). The method was comparedwith conventional X-ray DSA and time-of-flight (TOF)MRA to assess the angioarchitecture of the malformationswhich is essential for treatment planning and follow-up. Thepatient studies were evaluated in a double blind reading. Twoexperienced MR imaging readers independently evaluatedboth techniques with regard to the assessment of feedingarteries, AVM nidus and venous drainage patterns. For quantitativeevaluation, which was performed from the digitalsource images, vessel to background contrast and contrastto-noiseratios were calculated. CE MRA was able to detectall AVMs seen on DSA, while the TOF MRA failed in onepatient with a very small AVM. In the assessment of the differentvessel components of the AVM there was no differencefor the detection and delineation of feeding arteries andthe AVM. The venous drainage patterns always could bedelineated clearly in the CE MRA whereas TOF MRA coulddemonstrate the exact venous drainage in only 9 patients.RESULTSIn the quantitative analysis both the vessel to backgroundcontrast and contrast-to-noise was significantly (p < .001;unpaired t-test) better for the CE MRA for all vascular components.CE MRA with Gd-BOPTA was found to be superiorto conventional TOF MRA in the assessment of theangioarchitecture of cerebral AVMs especially regarding theassessment of the venous drainage patterns. The superiorityis supported by the improved vessel-to-background contrastand contrast-to-noise ratios.Thursday
Thursday244CONCLUSIONPaper 318 Starting at 4:20 PM, Ending at 4:25 PMThe major limitations of this new technique consist of a lowspatial resolution at the used time resolution which can bePosterior Cerebral Artery Occlusion as a Result ofimproved by further sequence modifications. CE MRA is Racemose Neurocysticercosisthus an important additional imaging technique for treatmentplanning and follow-up of AVMs.Perez, C. L. · Chason, D. P. · Mendelsohn, D. B.University of Texas Southwestern Medical CenterKEY WORDS: Arteriovenous malformations, MR DSA, contrastDallas, TXmediaThe authors of this work have indicated that they will be discussing/presentingan unapproved or investigative use ofMultiHance® made by Bracco for cerebral MRA.Paper 317 Starting at 4:12 PM, Ending at 4:20 PMMR Imaging of Pyogenic Ventriculitis: Differencebetween Imaging TechniquesTsuchiya, K. · Honya, K. · Fujikawa, A.Kyorin UniversityTokyo, JAPANPURPOSEPyogenic ventriculitis usually develops secondary to meningitisor cerebral abscess. As it may be lethal due to complicationssuch as hydrocephalus, the diagnosis should be establishedpromptly and precisely. Our purpose was to report MR imagingfeatures of ventriculitis comparing those on different MRimaging techniques including postcontrast T1-weighted imaging,FLAIR imaging, and diffusion-weighted (DW) imaging.MATERIALS & METHODSWe reviewed MR images from seven patients (four men andtwo women aged 0 to 75 years) with clinically diagnosed ventriculitis.All of them had meningitis diagnosed on the basis ofCSF findings. MR examinations at 1.5 T included T2-weightedspin-echo, FLAIR, pre and postcontrast T1-weighted spinechoimaging as well as single-shot echoplanar DW imaging.PURPOSETo report a case of subarachnoid racemose neurocysticercosiscomplicated by PCA territory infarct.MATERIALS & METHODSCase report with clinical and radiologic observations.RESULTSA 47-year-old Hispanic male presented to the ER with 3 daysof frontal headache, followed by sudden onset of blurryvision. The patient had emigrated recently to the UnitedStates from Mexico, and his past medical history wasremarkable for a single episode of seizure 12 years prior,which was untreated. Physical exam revealed righthomonomous hemianopsia. Nonenhanced head CT demonstrateda large low-density area involving the left parasagittaloccipital lobe, and a large cyst in the left ambient cistern.MR of the brain exhibited a minimally enhancing, multiloculated,cystic mass in the left ambient cistern with masseffect on the midbrain and pons. Diffusion-weighted imagingdemonstrated restricted diffusion in the medial leftoccipital lobe, consistent with an acute left PCA territoryinfarct. Repeat MR imaging/MRA 3 days later showed anevolving subacute infarct, and an occluded left PCA. Studiesfor CSF and serum cysticercus antibodies were positive.RESULTSAll patients showed both ependymal enhancement on postcontrastT1-weighted images and hyperintensity within thetrigone of the lateral ventricle on diffusion-weighted images.The extent of the ependymal enhancement exceeded that ofthe hyperintensity on DW images in four patients, while thehyperintensity on DW images was larger than or equal to theependymal enhancement in three patients. Although thehyperintensity on DW images possibly representing intraventricularpus was an outstanding finding, correspondinghyperintensity also was demonstrated on FLAIR images insix of the seven patients. Other abnormalities includedhydrocephalus (six patients), abnormal meningeal enhancement(five patients), subdural empyema (two patients), andbrain abscess (one patient).CONCLUSIONThe diagnosis of ventriculitis is made most reliably when theabnormal ependymal enhancement is present on postcontrastT1-weighted images. However, hyperintensity that is foundon FLAIR and DW images also can be a suggestive findingof ventriculitis before contrast administration.KEY WORDS: MR imaging, ventriculitis, diffusion-weightedimaging
CONCLUSIONNeurocysticercosis is the most common parasitic diseaseinvolving the nervous system. Although endemic in LatinAmerica, China, India, and sub-Saharan Africa, cysticercosisis becoming increasingly prevalent in the United Statesbecause of continued immigration. Cerebral infarctioninduced by neurocysticercosis is an uncommon, yet acceptedcomplication. In the appropriate clinical setting, neurocysticercosisshould be included in the differential diagnosisas a potential cause of stroke.REFERENCES1. Alarcon F, Hidalgo F, Moncayo J, et al. Cerebral Cysticercosisand Stroke. Stroke 1992;23:224-2282. Cantu C, Barinagarrementeria F. CerebrovascularComplications of Neurocysticercosis, Clinical andNeuroimaging Spectrum. Arch Neurol 1996;53:233-2393. Del Brutto OH. Cysticercosis and Cerebrovascular Disease: AReview. J Neurol Neurosurg Psychiatry 1992;55:252-2544. Jha S, Kumar V. Neurocysticercosis Presenting as Stroke.Neurology India 2000;48:391-394KEY WORDS: Neurocysticercosis, stroke245necrosis. The periodic acid-shiff (PAS) and Grocottmethanamin silver stain (GMS) revealed many septate fungalhyphae. There was no evidence of calcium or hemosiderinbetween the well formed granuloma and the necroticcenter. However, prominent iron deposits were noted onPerl’s stain for iron. Elemental analysis by inductively coupledplasma atomic emission spectrometry (ICP-AES) confirmedincreased iron. Other intrinsic mineral elements suchas magnesium, zinc, and calcium were also found. Culturefrom brain biopsy material showed Aspergillus flavus. Thepatient received long term antifungal drug therapy andimproved clinically. The patient has survived more than 2years since initial diagnosis.Paper 319 Starting at 4:25 PM, Ending at 4:30 PMMR Features of Cerebral Aspergillosis in anImmunocompetent Patient: Correlation with Histologyand Elemental AnalysisPhuttharak, W. · Hesselink, J. · Wixom, C.University of California San Diego Medical CenterSan Diego, CAPURPOSETo present an unusual case of cerebral aspergillosis in animmunocompetent patient and correlate the MR appearancewith pathology and laboratory data.MATERIALS & METHODSA 24-year-old African man from Sudan presented withsevere headaches, worse on the left side. He was diagnosedwith pulmonary tuberculosis 10 months earlier, which wasincompletely treated. He had no history of any systemicunderlying disease or immunosuppressive therapy. Serologyfor HIV was negative. MR imaging was performed.RESULTSThe mass had a complex appearance on MR imaging. T2-weighted images revealed a thick hypointense perimeter anda heterogeneous hyperintense core. Margins of the lesionwere well-defined but irregular. On T1-weighted images themass was heterogeneous but mostly mildly hypointense. Athick enhancing rim with a central nonenhancing portion wasseen on postcontrast T1-weighted scans. The T2 hypointensezone was thicker than the enhancing rim, which correlatedwith a very dark 2 mm band on the T2-weighted imagesalong the inner margin of the enhancement. Peri-lesionalvasogenic edema and evidence of brain herniation also weredepicted. The patient had a craniotomy and excisional biopsy5 days after admission. A hardened mass was found, withoutareas of gross hemorrhage. No fluid or pus could be aspiratedfrom the central cavity. Microscopic specimensshowed a well formed granuloma with central areas ofCONCLUSIONCerebral aspergillosis is rare in immunocompetent patients.A huge mass as demonstrated in this case also is uncommonand makes differentiation from malignant tumor more difficult.The wall of a fungal lesion is thicker and more pronouncedin a host with an intact immune system. The lowsignal zone along the inner wall of this mass on T2-weightedimages is a characteristic feature of fungal infection. Thislow signal zone had been attributed to hemorrhage or denseaspergillus hyphae. Recently, this finding has been related toiron accumulation, which is known to be essential for thegrowth of fungi. Other paramagnetic elements such as magnesium,zinc, and calcium as found in our elemental analysisare also probable components.KEY WORDS: Aspergillosis, cerebral infection, MR imagingThursday
ThursdayThursday Afternoon3:00 PM - 4:30 PMRoom 611 - 612(60d) Adult Brain: General and 3.0 T(Scientific Papers 320 - 330)See also Parallel Sessions(60a) Adult Brain: General(60b) Interventional: Aneurysms(60c) Adult Brain: General and Diffusion ImagingModerator:Norman J. Beauchamp, Jr., MD, MHSSuresh C. Patel, MDPaper 320 Starting at 3:00 PM, Ending at 3:08 PM3 T MR Evaluation of Brain Tumors with Spectroscopyand Arterial Spin Labeling Perfusion StudiesAppignani, B. · Alsop, D. · Hackney, D. B. · Lenkinski, R. ·Wong, E. T. · Wu, J.Beth Israel Deaconess Medical CenterBoston, MAPURPOSEThese studies investigate whether perfusion measurementsobtained by arterial spin labeling (ASL), and interpreted incombination with metabolic data from 3 T MR spectroscopy(MRS), provide useful diagnostic information about the viabilityand extent of brain tumors. The ASL technique permitsan actual measurement of blood flow in and around tumors.In contrast, susceptibility imaging techniques yield measurementsof relative cerebral volume complicated by the effectsof varying vascular permeability and disruption of the bloodbrainbarrier in brain tumors. Assessment of brain tumor perfusionhas clinical value because brain tumor vascularity isan indicator of tumor grade, and appears to be related totumor proliferation and metabolic activity (1-5). Spectralabnormalities in MRS correlate with tumor grade (6) andreveal the presence of tumor infiltration beyond enhancingmargins (7). The combination of perfusion and MRS datamay provide information about the effectiveness of braintumor treatment and the development of recurrence or progression.MATERIALS & METHODSArterial spin labeling and MRS data were obtained on 12patients with gliomas and 2 with metastases. All but onepatient had had surgery and radiation therapy, and some hadbeen given chemotherapy. Single and multivoxel MRS wasperformed. Evaluation was based on the relative amounts ofcholine (Cho), creatine (Cr), N-acetyl-aspartate (NAA),lipid/lactate, and myo-inositol in the spectra and on measurementsof Cho/Cre ratios. Arterial spin labeling was per-246formed using background suppressed continuous arterialspin labeling with a stack of variable density spiral readout.Areas of MRS abnormality were compared to ASL and otherimages.RESULTSArterial spin labeling of glioblastomas (n = 6), revealedincreased perfusion, relative to gray matter, in most tumortreatment sites, generally in regions of enhancement andmatched with areas of elevated choline. Some radiationtreatedregions with both choline and lipid/lactate elevationswere hypoperfused. In intermediate grade tumor treatmentsites mildly increased choline and mild perfusion increasesor decreases were identified in stable tumors, but hyperperfusionand high levels of choline were found in growingtumors. One patient with an untreated oligodendrogliomahad modestly increased choline and decreased NAA, buthyperperfusion on ASL. A low-grade brain stem gliomawhich shrunk after therapy demonstrated hypoperfusion.Both metastases, suspicious for recurrence on MRS, hadonly mild increases in perfusion on ASL.CONCLUSIONArterial spin labeling in combination with MRS added metabolicinformation to the assessment of brain tumors. Arterialspin labeling may help to map areas of tumor which areactive and those which have responded to treatment.Important advantages of the ASL method are that it is rapid,requires no contrast injection and, with appropriate imagingsequences, it can be free from susceptibility artifacts oftenfound in surgical sites and associated with tumor hemorrhage.REFERENCES1. Warmuth C, et al. Radiology 2003;228(2):523-5322. Cha S, et al. Radiology 2002;223:11-293. Law M, et al. Radiology 2002;222:715-7214. Henry RG, et al. AJNR Am J Neuroradiol 2000;21:357-3665. Cha S, et al. AJNR Am J Neuroradiol 2000;21:881-8906. Nafe R, et al. J Neurooncol 2003;63(3):233-2457. McKnight TR, et al. J Neurosurg 2002;97(4):794-802KEY WORDS: Brain tumor, arterial spin labeling, spectroscopyPaper 321 Starting at 3:08 PM, Ending at 3:16 PMT1-Weighted Imaging of the Brain at 3 T: SequenceOptions and OptimizationDeLano, M. C. · Berger, K. L. · Knight, T. E. · Schulz, D. I.· Potchen, M. J.Michigan State UniversityEast Lansing, MIPURPOSETo demonstrate the advantages and challenges of T1-weightedbrain imaging at 3 T with emphasis on sequence optionsand optimization for whole brain clinical imaging.MATERIALS & METHODSAxial two-dimensional (2D) spin-echo (SE), fast spin-echo(FSE), T1-FLAIR, and 3D fast spoiled-gradient recalled(FSPGR) T1-weighted sequences were evaluated during
clinical protocol development on a 3 T whole body scanner(GE Medical Systems, Waukesha, Wisconsin) using a quadraturehead coil. Contrast features were assessed with respectto gray-white differentiation and uniformity. The impact ofdielectric effect, susceptibility, and chemical shift artifacts,crosstalk, contrast enhancement, sequence imaging time, andsignal-to-noise ratio (SNR) were compared. The effects ofreceiver bandwidth (RBW), echo train length (ETL), andchoice of flip angle (FA) and TR and TE on image qualityand artifacts also were evaluated. Practical scan parametersfor whole brain clinical imaging at 3 T are suggested.RESULTSGreatest differentiation of gray and white matter wasachieved with T1 FLAIR and FSPGR. Inherent magnetizationtransfer effects in the FSE sequence result in less intrinsicimage contrast but improve conspicuity of contrastenhancement. T1 FLAIR occasionally does not show lesionenhancement. Two-dimensional acquisitions showed greaterSNR with interleaved acquisitions compared to contiguousslice profiles presumptively because of cross-talk betweenadjacent slices. T1 FSE sequences were compromised byblurring with increasing ETL beyond 4 but the T1 FLAIRsequences tolerated ETL of 8 without degradation.Susceptibility was greatest about the posterior paranasalsinuses. Susceptibility artifact was lessened by using a higherETL for FSE, and increasing RBW to 31.25 kHz for all thesequences. The increased RBW partially negates the SNRbenefits of the higher field strength and the image qualitywas better with RBW of 15.6 kHz. Chemical shift misregistrationartifacts were minimal at 15.6 kHz. Dielectric effectwas most conspicuous with SE and least with the FSPGRsequence but did not interfere with expected contrast featureson any scan. Flow-related artifacts were greater withthe spin-echo sequences. Relative signal-to-noise was greatestfor the FSE, followed by the T1-FLAIR, SE, and FSPGR,respectively.Sequence TR TE ETL/TI/IR FA NEX Matrix Slice Slice SNR ScanPREP Thk Gap TimeSE 450 19 ———— RF2 180 2 320 x 192 5 mm Interleave33 4:26FSE 667 16 ETL 2 RF2 160 2 320 x 192 5 mm Interleave46 3:18T1 FLAIR 2400 16 ETL 6/TI RF2 160 2 320 x 192 5 mm Interleave42 3:57860 ms3D FSPGR5.5 1.4 IR PREP 8 1 256 x 224 1.5 mm 128 locs/ 27 5:43500 ms volumeCONCLUSIONImaging at 3 T presents different challenges compared with1.5 T mandating careful attention to the choice of pulsesequence parameters to achieve high quality. Signal-to-noiseratio was greatest for the FSE sequence. Proper managementof the tradeoffs related to ETL choice and interleaved scanprofiles leads to improved image quality or faster scan times.KEY WORDS: Protocol, 3 T, brainThe authors of this work have indicated the following affiliations/disclosures:General Electric Medical Systems:Comprehensive research agreement.247Paper 322 Starting at 3:16 PM, Ending at 3:24 PMComparison of the Differences of Fractional AnisotropyMap and Tractography between 6-Direction DiffusionTensor Imaging and 12-Direction Diffusion TensorImaging on 3 T ScannerLiang, L. · Smith, J. S. · Provenzale, J. M.Duke University Medical CenterDurham, NCPURPOSETo compare the differences of fractional anisotropy (FA) andtractography between 6-direction diffusion tensor imaging(DTI) and 12-direction DTI on 3 T.MATERIALS & METHODSFour healthy volunteers and 4 patients with brain gliomasunderwent single-shot spin-echo echo-planar DTI of both 6directions and 12 directions on Siemens 3 T scanner. Samestudy was repeated on the following day for the four gliomapatients. Two patients repeated the same study before andafter operation. All parameters (TR/TE, 8800/80, thickness/distance,3 mm/0; b = 0, 1000; NEX, 4) were same forthe two sequences except the number of directions and scantime (3 min vs 6 min). Contrast-to-noise ratio (CNR)between compact white matter (WM) and gray matter (GM)and visual conspicuity between WM and GM on FA mapwere evaluated. Regions of interest (ROIs) were placed ongenu and splenium of corpus callosum and bilateral posteriorlimb of internal capsule to represent the compact whitematter. Regions of interest were put on globus pallidus andgray matter of temporal lobe to represent the deep gray matter(DGM) and peripheral gray matter (PGM). Contrast-tonoiseration 1 = (FA WM-FA DGM)/SD DGM; CNR2 = (FAWM-FA PGM)/SD PGM, SD, standard deviation. For tractography,two ROIs were chosen with one covering thewhole internal capsule at the level of roof of the 3rd ventricleand another covering the half ipsilateral brain stem at thelevel of cerebral peduncle. Fiber number which passedthrough those two ROIs and mean FA values were recorded.All the tracking parameters were the same for both 6- and12-direction tractographic processing. Then fiber numbersand FA values on the contralateral side were recorded byplacing the corresponding ROIs at the same level. Paired t-test was used to analyze the difference between the twosequences.RESULTSFractional anisotropy values of GM and their SD were significantlylower on 12-direction FA map than on 6-directionone. The CNRs between compact WM and deep/or peripheralGM were significantly higher on 12-direction FA mapthan on 6-direction map. The conspicuity between WM andGM on 12-direction FA map was superior to that on 6-directionmap. Fiber numbers delineated on 6-direction tractographywere significantly more than those on 12-direction tractography.Mean FA values on 6-direction tractography alsowere significantly higher than on 12-direction tractography.Pseudofibers generated by the artifacts between the interfaceof brain parenchyma and peripheral cerebral spinal fluid aresignificantly more on 6-direction tractography than on 12-direction one.Thursday
Thursday248patient demographics, clinical presentation, diagnosis, andstudy field strength reviewed the same studies performed atboth magnetic field strengths. All studies were examined forconspicuity of anatomical structures, such as basal ganglia,vessels, gray-white differentiation, cerebellar and brainstemstructures, as well as for motion, susceptibility, flow, andchemical shift artifacts. Each reader also was asked to determinewhether each sequence was performed at 1.5 or 3.0 T.Figure 1 (left). FA map generated by 6-direction DTI. Figure2 (right). FA map generated by 12-direction DTI.CONCLUSIONFractional anisotropy map obtained by 12-direction DTI issuperior to that obtained by 6-direction DTI in terms of contrastand conspicuity between white matter and gray matter.An increase in the quality of the tractography on 12-directionDTI also was observed. This is probably due to its lowernoise levels, which resulted in fewer extraneous artificialfiber calculations.KEY WORDS: DTI, FA map, tractographyThe authors of this work have indicated that they will be discussing/presentingan unapproved or investigative use of aDTI task card made by Massachusetts General Hospital(software program) for tractography.Paper 323 Starting at 3:24 PM, Ending at 3:32 PMComparison of Signal-to-Noise Ratio, Contrast-to-NoiseRatio, Image Quality, and Anatomical Conspicuitybetween 1.5 and 3.0 T for Clinical NeuroimagingLaw, M. · Wu, C. · Orbach, D. · Oh, S. · Johnson, G. ·Knopp, E.New York University Medical CenterNew York, NYPURPOSEMR imaging in medicine and basic research has seen asteady growth with an increase in magnetic field strength.The installation of high-field strength (i.e., 3 T and above)systems has led to these systems being utilized more extensivelyfor clinical neuroimaging. The purpose of this study isto determine differences in signal-to-noise ratio (SNR), contrast-to-noiseratio (CNR), image quality, and anatomicalconspicuity of clinical neuroimaging between 1.5 and 3.0 T.MATERIALS & METHODSEighteen patients were studied with conventional MR imagingT1-weighted before and after contrast administration, T2-weighted, and FLAIR of the head at 1.5 and 3.0 T. Signalintensity was measured by drawing user-defined regions ofinterest of the same size and shape. Signal-to-noise ratio wasmeasured by dividing the mean signal intensity of tissue A bythe standard deviation of the background noise outside of thebody. Contrast-to-noise ratio was determined by subtractingthe mean signal intensity of tissue A from that of tissue B, anddividing this result by the standard deviation of the backgroundnoise outside of the body. Two readers blinded to theRESULTSPrecontrast T1-weighted images performed at 3.0 T show a29-48% increase in SNR (p = 0.007, 0.02, 0.0009 for whitematter, gray matter and CSF, respectively) and a 33%increase in CNR between white and gray matter (p = 0.004).T2-weighted images demonstrated a significant difference inthe SNR of white matter and gray matter (p = 0.0003 and0.03 respectively) but not CNR for white matter and graymatter. There was no significant difference in SNR and CNRwith postcontrast T1-weighted images and FLAIR images.Scoring for two readers demonstrated increased conspicuityof anatomical structures, such as basal ganglia, vessels, graywhitedifferentiation, peri-vascular spaces, cerebellar andbrainstem structures at 3.0 T but increased artifacts such asmotion, susceptibility, flow, and chemical shift compared to1.5 T. Reader 1 correctly identified the field strength in75/105 sequences. Reader 2 correctly identified the fieldstrength in 102/105 sequences.CONCLUSIONThe results suggest that SNR and CNR improve for precontrastT1-weighted images at 3.0 T with increased anatomicalconspicuity for clinical neuroimaging. However, there isincreased susceptibility, flow, and chemical shift artifact athigher field.KEY WORDS: High field MR imaging, 3.0 T, neuroimagingPaper 324 Starting at 3:32 PM, Ending at 3:40 PMApparent Diffusion Coefficient Changes in Cerebellumand Deep White Matter with Acute Alcohol IngestionRowley, H. A. 1 · Dydak, U. 2 · Tyszka, J. M. 3 · Roberts, T. P.L. 41University of Wisconsin Madison, Madison, WI,2University and ETH, Zurich, SWITZERLAND, 3 CaliforniaInstitute of Technology, Pasadena, CA, 4 University ofToronto, Toronto, ON, CANADAPURPOSEAcute alcohol ingestion causes a range of cognitive andmotor deficits, including severe cerebellar ataxia. In addition,chronic alcohol use has been linked to cerebellar atrophyand cell loss which is disproportionate to supratentorialcerebral injury. This study was undertaken to investigate thetemporal and regional diffusion changes in the human cerebellumand cerebrum in response to acute alcohol ingestion.MATERIALS & METHODSThree healthy adult volunteers were studied on a total of fouroccasions. Diffusion-weighted echo-planar imaging was performedusing a 3 T Intera MR unit (Philips Medical Systems,Best, NL) over the whole brain (22 slices, 5 mm) using a b-value of 1000s/mm 2 in x, y, and z directions as well as a b-
value of 0 s/mm 2 . Images were acquired at baseline, prior toalcohol ingestion, and approximately 60, 75, 90, and 120minutes after ingestion of 200-220 ml of 40% ethanol (1ml/kg ethanol), diluted with an equal volume of cordial.Average apparent diffusion coefficient (ADC) maps wereconstructed using the EasyVision postprocessing workstationat each timepoint. Regions of interest containing at least20 pixels were drawn in cerebellum and deep white matter(DWM) and were interrogated at each timepoint. Breathalcohol content was assessed using a digital alcometer, calibratedto provide measurement of blood alcohol content(BAC). Peak change in ADC was compared for each regionwith baseline ADC determination, using a paired t-test.RESULTSApparent diffusion coefficient DC values at baseline were0.723 +/- 0.005 mm2/s (DWM) and 0.719 +/- 0.012 (cerebellum).Blood alcohol content values rose over the timecourseof the experiment from 0 to 0.67 +/- 0.08%% (promille), approximately equal to the legal definition of intoxicationfor the purposes of motor vehicle driving. The ADCshowed a 2% alcohol-mediated decrease in DWM (0.708 +/-0.009, p < 0.05) and a striking 7% decrease in cerebellum(0.672 +/- 0.007, p < 0.01).CONCLUSIONAcute alcohol ingestion at intoxicating doses is linked to a7% decrease in ADC for the cerebellum and 2% decrease fordeep cerebral white matter. Disproportionate involvement ofthe cerebellum on ADC mirrors the clinical deficits of acuteataxia and chronic cerebellar atrophy seen with alcohol use.Potential mechanisms for observed ADC decreases couldinclude acute cytotoxic edema, energy failure, direct cellulartoxicity, membrane stiffening, or osmotic effects. Acutetoxic effects of alcohol vary across different regions of thebrain, and preferentially affect the cerebellum.KEY WORDS: Alcohol, diffusion, metabolicPaper 325 Starting at 3:40 PM, Ending at 3:48 PMPostoperative Assessment of External Carotid-InternalCarotid Bypass by MR Digital Subtraction AngiographyUsing Parallel ImagingTsuchiya, K. · Honya, K. · Nakajima, M. · Fujikawa, A.Kyorin UniversityTokyo, JAPANPURPOSEOur purpose was to evaluate the feasibility of fast 3D MRdigital subtraction angiography (DSA) using a SPEEDERtechnique, one of parallel imaging methods, in combinationwith a 3D fast field-echo sequence and a segmented k-spacesampling technique in the postoperative assessment of externalcarotid (EC)-internal carotid (IC) bypass surgery.MATERIALS & METHODSOn a 1.5 T imager, a 3D fast field-echo sequence(TR/TE/excitations = 3.1/0.9/1, flip angle = 20 degrees,matrix = 128 x 256, field of view = 26 x 28 cm, reductionfactor = 2) was used. The slab was 75 mm thick with 15 5mm partitions that were interpolated to 30 2.5 mm partitions.We obtained 30 scans of the slab and intravenously injected2497 ml of gadolinium at a rate of 3 ml/sec during scanning. Wesubtracted source images of one early phase from those ofsubsequent phases followed by postprocessing with a maximum-intensity-projectiontechnique. We obtained MR DSAimages from eight patients (four males and four femalesaged 42-68 years). They comprised seven patients aftersuperficial temporal artery (STA) middle cerebral artery(MCA) anastomosis and one patient after EC MCA anastomosisusing a graft that had been performed for stenosis orocclusion of the MCA or internal carotid artery. The MRDSA images were assessed visually regarding visualizationof the anastomosis as well as of distal flow comparing with3D TOF MR angiograms obtained on the same occasion. Wealso compared MR DSA images with conventionalangiograms in three patients.RESULTSThe technique achieved a temporal resolution of as short as0.8 sec. In seven patients, patency of the STA MCA anastomosiswas better demonstrated than on 3D TOF MRA.Furthermore, in these patients, MR DSA well visualizedgood distal perfusion that was not visualized fully on 3DTOF MRA. In the remaining one patient, MR DSA providedimages that revealed failure of bypass surgery suspected on3D TOF MRA. In the three patients whose MR DSA andconventional DSA were compared, they showed good correspondence.CONCLUSIONFast MR DSA using the parallel imaging technique can be avaluable method to evaluate the postoperative status of EC-IC bypass. Quantitative analysis of MR DSA images, whichis at present under development by us, may provide informationof perfusion in the scanned area.KEY WORDS: MR digital subtraction angiography, parallelimaging, EC-IC bypassPaper 326 Starting at 3:48 PM, Ending at 3:56 PMReassessment of the Reproducibility of Postprocessing ofComputed Tomography Perfusion (CTP) DataFiorella, D.Barrow Neurological InstitutePhoenix, AZPURPOSETo define the intra and inte-analyzer variability of quantitativecerebral blood volume (CBV), cerebral blood flow(CBF), and mean transit time (MTT) measurements derivedfrom computed tomographic perfusion (CTP) maps.MATERIALS &METHODSRaw data derived from dynamic CTP examinations performedon 19 different subjects were postprocessed twice byeach of three operators – two experienced CT technologistsand one neuroradiologist (DF) – using a commercially availablesoftware program. Criteria for the selection of postprocessingparameters were prospectively optimized to maximizereproducibility. Parenchymal ROIs (regions of interest)derived from each map (CBV, CBF and MTT) were compared.Decisions made by each analyzer during postprocessingwere assessed.Thursday
ThursdayRESULTSThe variability in parenchymal ROI values expressed ascoeffieicents of variation (CV; i.e., the standard deviationover the mean x 100), was 12.2, 17.8 and 11.1 percent formeasurements of CBV, CBF and MTT, respectively. Theleast experienced of the two CT technologists demonstratedsignificantly greater intra-observer variability (p < 0.001)than the more experienced CT technologist and the neuroradiologist.The variability in CBV and CBF measurementsattributable to postprocessing was significantly less than thatreported in a previous study in which different criteria wereapplied for the selection of postprocessing parameters.CONCLUSIONOptimization of postprocessing parameters, specifically, thepostenhancement image selection, significantly reduces thevariability attributable to the postprocessing of dynamicCTP data using a commercially available software program.Postprocessing may be performed by an experienced CTtechnologist with an intra-observer reproducibility equal tothat of a neuroradiologist. Variability attributable to postprocessingmust be taken into consideration if quantitative CBV,CBF and MTT values are to be used to guide clinical decisionsor as endpoints in cerebrovascular research studies.This paper was selected to receive the Gabriel H. WilsonBest Paper Award by the Western Neuroradiological Society(WNRS) at its 35th Annual Meeting held in October, 2003.250ROI, whereas no significant differences were seen betweenthe parenchymal ROI among themselves. In contrast, PI variedwidely interindividually, but the inter-ROI comparisonrevealed statistical significance in most of the cases, accordingto the following pattern: a) lentiforme nucleus > thalamuspost./ant. and white matter region, b) thalamus post./ant.> white matter region, and c) main vessel > any parenchymalstructure. The same results were achieved in both centersindependently. The only mismatch was seen in the comparisonof thalamus ant. vs thalamus post., where a statisticalsignificant difference (thalamus post. > thalamus ant.) wasassessed only in center 1.Paper 327 Starting at 3:56 PM, Ending at 4:04 PMTranscranial Ultrasound Brain Perfusion Assessmentwith Contrast Burst ImagingHoelscher, T. · Wilkening, W. · Meves, S. · Draganski, B. ·Voit, H. · Bogdahn, U. · Przuntek, H. · Poster, T.University of California San DiegoSan Diego, CAPURPOSEThe purpose of this study was to prove the reliability andreproducibility of brain perfusion assessment with an ultrasoundcontrast specific imaging mode in a two center trial.MATERIALS & METHODSA total of 32 individuals without known cerebrovascular diseasewere included into the study. The contrast burst imaging(CBI) studies were performed ipsilateral in an axial diencephalicscanning plane after intravenous administration of1.75 ml of a perfluorgas-filled echo contrast agent. Off-linetime intensity curves (TIC) were generated and the parametersmaximum peak intensity (PI) and time to peak intensity(TPI) were calculated in the following anatomical regions ofinterest (ROI): thalamus anterior (ROI TA ), thalamus posterior(ROI TP ), lentiforme nucleus (ROI LN ), white matter(ROI WM ), and one of the main vessels (ROI MV ). Both centersused identical study protocols, machinery equipment,and settings, respectively. The statistical analysis was donein a blinded and comparative fashion.RESULTSIn 306 out of 320 ROIs appropriate time intensity curvescould be generated. In both centers, the interindividual comparisonof TPI revealed statistical significance in the comparisonof a main vessel structure with any parenchymalCONCLUSIONThe study demonstrates for the first time that with a contrastspecific imaging mode the results of transcranial ultrasoundbrain parenchymal perfusion assessment are reproducible.Both overall and single center analysis rendered comparableresults to a great extent.KEY WORDS: Transcranial ultrasound, brain perfusion, contrastburst imagingThe authors of this work have indicated that they will be discussing/presentingan unapproved or investigative use ofOptison made by Mallinckrodt for transcanial assessment.Paper 328 Starting at 4:04 PM, Ending at 4:12 PMDigital Subtraction Topography: Development of a NovelHigh-Definition CT Angiogram that Eliminates MetalArtifactMedow, J. E. 1 · Turk, A. S. 1 · Tolakalahani, R. 1 · Mistretta, C.A. 1 · Hseih, J. 21University of Wisconsin, Madison, WI, 2 General ElectricCorp., Waukesha, WIPURPOSECerebrovascular noninvasive imaging in evaluation ofpatients who have undergone prior aneurysm clipping orcoiling is limited significantly by metal artifact in manycases. We have developed a novel technique for manipulatingthe raw data obtained during a standard CT angiogramthat yields 2D topographic, slice, and reconstructed 3Dimages that are free of metal artifact.
MATERIALS & METHODSTen patients underwent a standard CT angiography (CTA)protocol that was revised using identical scan parameters andtable position for the precontrast and contrast bolus studies.The raw data from the contrast bolus projection then wassubtracted from the original noncontrast raw data projection.The subtracted data set was concatenated to yield 924topograms, similar to a scout topogram, representing each ofthe gantry angles that data were acquired. This yielded aseries of 2D topograms and standard CT slices of the cerebralvasculature. The acquired slices then were reconstructedinto 3D images.RESULTSDigital subtraction topography (DST) demonstrated comparableimage quality to DSA in high-definition 2D topographicimage sets and permitted standard 3D CT reconstructionimages that were noticeably absent of metal artifact.Standard pre and postcontrast slice images were available aswell.CONCLUSIONDigital subtraction topography is a novel utilization of CTtechnology that manipulates the raw data to provide a highdefinition angiogram that is nearly equivalent to conventionalDSA without the degradation from bone or metal artifactsinherent to conventional CT. This revolutionary utilization ofCT technology has never been performed and is proving tobe a very effective tool.KEY WORDS: CT, aneurysm, angiogramThe authors of this work have indicated the following affiliations/disclosures:General Electric Corp.: Employee.251s/mm≈ (Sonata), 3-5 mm thickness, 6 acquisitions. Toimprove the performance of the tracking algorithm in theperitumoral area, a subgroup of them was examined withspecially high b-values. From the DTI measurements a continuoustensor field approximation was computed and trackingwas performed by an in-house developed software, usinga line propagation based algorithm. The algorithm had beenmodified by us (PD) to improve tracking on fiber crossings.Stopping criteria [fractional anisotropy (FA) = 0.2 units anddeviation angle = 20°] and the scale of the continuous tensorfield approximation were modified in peritumoral areas. Inselected cases, the 3D MP RAGE images and the DTI dataset were coregistered using SPM and AIR, allowing the precisetransfer of the trajectories by in-house developed software.The images were encoded in DICOM format, allowingtheir transfer to the neurosurgical planning system(Dextroscope®) and a neuronavigation system (BrainLab®).RESULTSIn all cases, the trajectories of the pyramidal tracts and of thefibers of the corpus callosum could be demonstrated. Withinthe peritumoral edema, but outside the enhancing part of thetumor (in meningiomas and glioblastomas), tracking resultscould be improved by reducing the FA threshold, by increasingthe deviation angle threshold, but not by imaging withhigher b-values because of declining signal-to-noise ratio.The information about the probable position of the fibertracts was included into planning a minimal invasive surgicalapproach, and also used for intraoperative navigation incase of tumors invading the central white matter.Paper 329 Starting at 4:12 PM, Ending at 4:20 PMIntegration of Fiber Tracking into Planning andNavigation of Neurosurgical ProceduresDellani, P. R. · Wille, P. R. · Vucurevic, G. · Tropine, A. ·Glaser, M. · Grunet, P. · Stadie, A. · Perneczky, A. · Stoeter,P.University Clinic MainzMainz, GERMANYThursdayPURPOSEStrategies to include results of white matter tractography intoplanning and navigation of neurosurgical procedures.Although diffusion tensor imaging (DTI) based fiber trackingis the only method to demonstrate white matter tracts inthe living human brain, there are only few reports about itsclinical value. This study was performed to show the applicabilityof fiber tracking in patients with brain tumors.MATERIALS & METHODSForty patients were included: 13 meningiomas, 15 highgradegliomas, 9 low-grade gliomas, 1 metastasis, 1 large 8thnerve schwannoma, 1 postradiation necrosis. Scanning wasperformed using 1.5 T Vision with 25 mT/m gradients (32patients) and 1.5 T Sonata with 40 mT/m gradients (8patients). Routine: T1-weighted -/+ CM, T2-weighted,FLAIR, 3D data sets (MP RAGE) for coregistration. DTI:EPI-based, b = 0 s/mm≈ and 6 noncolinear directions with b= 900 s/mm≈ (Vision) and b = 1000, 1500, 2500, and 5000CONCLUSIONWe successfully demonstrated white matter fiber tracking inpatients with brain tumors and included the results into neurosurgicalplanning and navigation systems. In the “difficult“peritumoral edema, tracking may be improved by modificationof stopping criteria, but not by imaging with increasedb-values. Further studies, including electrophysiologic stimulationare planned to determine the accuracy of the method.KEY WORDS: Fiber tracking, diffusion tensor imaging, neuronavigation
ThursdayPaper 330 Starting at 4:20 PM, Ending at 4:28 PMQuantitative Cerebral Blood Flow Measurements inRecent StrokeCurtin, K. R. · Sakaie, K. E. · Shin, W. · Cashen, T. A. ·Khawar, S. A. · Walker, M. T. · Shaibani, A. · Bernstein, R.A. · Carroll, T. J.Northwestern UniversityChicago, ILPURPOSETo evaluate a new, easily obtainable quantitative MR perfusion(MRP) measurement of cerebral blood flow (CBF) inpatients with recent ischemic infarction.MATERIALS & METHODSImages were acquired on a 1.5 T scanner. Standard clinicalFLAIR and diffusion-weighted images (DWI) were acquiredas a baseline determination of the region of infarct. RelativeCBF and cerebral blood volume (CBV) values were measuredby a multislice 2D EPI acquisition (axial, FOV = 23 x23 cm, matrix = 256 x 256, 12 slices, slice thickness = 5 mm,space between slices = 6.5 mm TR/TE/flip angle = 1660ms/47 ms/30°) with injection of 0.1 mmol/kg Gd-DTPA.Standard indicator-dilution based theory was used to calculatemean transit time (MTT), rCBF, and rCBV. Quantitationwas achieved by an independent absolute measurement ofCBV based on fast T1 measurements before and after theEPI acquisition. T1 measurements were performed in a singleslice with a true FISP readout of inversion recovery(axial, FOV = 20 x 19cm, matrix = 128 x 123, TR/TE =2.95/1.48, slice thickness = 5 mm, flip angle = 40°). A globalcorrection factor, the ratio of absolute CBV to relativeCBV in the same region of healthy white matter, was used tocalibrate the relative CBF values in every voxel, yieldingabsolute, quantitative (qCBF) values. Recently, this “bookend”technique was utilized to study healthy volunteers,resulting qCBF values of 23.4 ± 4.7 and 54.9 ± 15.2 ml/(100g/min) in white matter and gray matter, respectively. Thevalues are comparable to those found by the gold standard,H 2 [ 15 O] PET (23.7 ± 3.3 and 58.5 ± 7.7 ml/(100 g/min) inwhite matter and gray matter.RESULTSFLAIR and DWI images in each patient confirmed the presenceof recent cerebral infarction. The FLAIR (Fig. 1A) andqCBF (Fig. 1B) in one patient is shown, demonstratinginfarct with hypoperfusion (arrow). Regions of interest(ROI) were drawn to include the infarcted brain for qCBFmeasurements. ROIs were placed in normal contralateral tissuefor comparison (Table 1). Low qCBF values are seen inthe infarcted parenchyma and correspond to published valuesfound in experimental animal models of infarct. Thesevalues also correlate with published gold standard valuesmeasured by H 2 [ 15 O] PET.252Quantitative Cerebral Blood FlowPatient Infarct CBF Normal Contralateral Tissueml/(100 g/min) CBF ml/(100 g/min)1 12.5±17 60.9±28 Occipital Gray and White Matter2 21.2±5.8 44.5±6.6 Occipital Gray Matter3 17.5±14 34.8±5.5 Cerebellar Gray and White MatterCONCLUSIONWe present the clinical application of a quantitative CBFprogram aimed at evaluating hypoperfusion in strokepatients. The independent CBV measurement used for calibrationadds less than 4 minutes to a standard clinical scan,making it feasible for assessment of acute stroke. In regionsof ischemia delineated by standard MR imaging, the qCBFvalues are consistent with previously reported values.Accurate and rapid quantitation of CBF may improve treatmentof acute stroke by determining the extent of salvageablebrain parenchyma.KEY WORDS: MR, perfusion, cerebral infarctionThe authors of this work have indicated that they will be discussing/presentingan unapproved or investigative use of: 1.MR Perfusion Software made by Siemens for MR perfusioncolor map construction; 2. Perfusion Software made byNorthwestern University for quantitative perfusion calculation.Thursday Afternoon4:40 PM - 5:40 PMRoom 606 - 609(61) ELC Lecture I: Digital TeachingFiles: An Overview of Techniques— Gregory L. Katzman, MD
Thursday Afternoon4:40 PM - 6:10 PMBallroom 6 B/C(62) Aneurysms (ASITN)(62a) New Devices/Treatments— John D. Barr, MD(62b) Hemodynamics— Ajay K. Wakhloo, MD, PhD(62c) Biological Treatment— Yuichi Murayama, MDModerators:New Devices/TreatmentsJohn D. Barr, MDDonald W. Larsen, MDTimothy W. Malisch, MDLEARNING OBJECTIVESUpon completion of this session, participants will be able to:1) Evaluate the latest interventional techniques for endovascularaneurysm treatment2) Asses the patient selection criteria for using the latestinterventional devices and techniques for endovascularaneurysm treatment253PRESENTATION SUMMARYThe first device for direct endosacular aneurysm treatment,the Guglielmi detachable coil (GDC) system (TargetTherapeutics, Natick, MA), was approved in 1995. The GDCcoils were available initially in only a simple helical configuration.Difficulty with treatment of wide and large neckedaneurysms was recognized quickly; the coils could not becontained within the aneurysm. Controlled detachment platinummicrocoils in a variety of complex configurations nowhave become available from multiple manufacturers. Thesenewer coil configurations are designed to facilitate treatmentof aneurysms with larger necks. As more densely packing theaneurysm with coils was recognized as a key to durableocclusion, a variety of softer coils designed to improve thepercentage of the aneurysm filled also were developed. Thelatest development in coil technology is the transition frombare metal coils to coils with bioactive coatings. It is hopedthat these bioactive coils will induce a healing responsewithin the aneurysm to produce a more effective and durableocclusion. At this time, limited human data are available tosupport this theory. Endovascular treatment of wide andlarge necked aneurysms remains challenging. Moret and colleaguesdeveloped the technique of balloon-assisted coilplacement. A small balloon is inflated across the neck of theaneurysm as the coils are placed, so that the coils will bedirected into the aneurysm and, hopefully, assume a stableconfiguration without herniation into the normal artery. Thistechnique has expanded greatly the range of aneurysmsamenable to endovascular treatment. However, the balloonassistedcoiling technique is not always successful.Placement of intravascular stents to create a barrier betweenthe normal artery and the aneurysm also has been used tofacilitate treatment of aneurysms with wide and large necks.Coils then may be placed into the aneurysm through theinterstices of the stent. When successful, the combined useof a stent and coils allows treatment of aneurysms withextraordinarily large necks. The major limitation of this techniquehas been the difficulty and risk associated withintracranial placement of stents designed for the coronaryarteries. A self-expanding stent designed specifically for useas an adjunct to intracranial aneurysm treatment becameavailable in 2002 (NeuroForm Microdelivery Stent System,Boston Scientific). This device represents a vast improvementrelative to the use of coronary stents. A remaining limitationto the use of intracranial stents is that manyaneurysms arise at arterial bifurcations, which complicatesstent placement across the neck of the aneurysm. Liquidaneurysm treatment devices also are being developed.Relative to coils, the theoretical advantages of a liquiddevice include: decreased stress on the aneurysm wall duringtreatment, more complete filling of the aneurysm, improvedocclusion of acutely ruptured aneurysms, and improved abilityto conform to the aneurysm's shape. The theoretical disadvantagesto liquid devices include: the necessity for temporaryocclusion of the aneurysm's neck during treatment,and the possibility of unintentional embolization of the liquidinto normal arteries. Micro Therapeutics' Onyx liquidembolic device is an ethylene vinyl alcohol copolymer dissolvedin a dimethyl sulfoxide solvent. This device has beenused recently in an investigational trial in the United States.The company is currently seeking approval for Onyx underthe Humanitarian Device Exemption category, as was usedalso to make the Neuroform stent available. As the currentgeneration of devices is replaced by improved technologythat allows for more complete aneurysm occlusion, theadvantages of endovascular therapy will continue to grow.Whether endovascular therapy at present has evolved to anequal or better alternative to surgical clipping remains debatable.However, given the rapid and continuing technologicaladvances, there seems to be little doubt that endovasculartherapy soon will become accepted as the preferred treatmentfor most aneurysms.Disclosure: The author of this presentation has indicated thefollowing affiliations/disclosures: 1. Micrus Corporation,MicroVention, Inc, Boston Scientific: Stock options; 2. MicroTherapeutics, Inc., Siemens Medical Systems, Inc.: Researchgrant; 3. Cordis Neurovascular, Inc.: Consulting fees; 4.Boston Scientific: Speakers' Bureau.Thursday
ThursdayHemodynamicsAjay K. Wakhloo, MD, PhDLEARNING OBJECTIVESUpon completion of this session, participants will be able to:1) Differentiate in vitro and vivo methods to study hemodynamicsin aneurysm2) Relate the impact of local flow dynamics on tissue remodeling3) Evaluate flow dynamics and its implication for therapeuticapproachPRESENTATION SUMMARYHemodynamic mechanisms for the initiation and progressionof intracranial aneurysms currently are being studied.Attention has focused on flow impingement areas, oscillatingshear stress, and pressure together with the very specificintracranial arterial wall construct. Different in vitro and invivo modalities are presented here to study the complexintracranial flow, which may contribute to remodeling of thearterial wall. Flow analysis within the aneurysm/parentartery complex may help to understand why under certaincircumstances a coiled aneurysm may reopen. This mayimprove the development of minimally invasive endovasculartherapy and noninvasive strategies.Disclosure: The author of the presentation has indicated thathe will be discussing/presenting an unapproved/investigativeuse of stents. The stents are made by Boston Scientific,Cordis Neurovascular, Johnson & Johnson.Biological TreatmentYuichi Murayama, MDDr. Yuichi Murayama was born in Tokyo, Japan in 1964. Hegraduated and received his M.D. degree from JikeiUniversity School of Medicine in 1989. He receivedNeurosurgical training at Jikei University. After completinghis residency in 1995, Dr. Murayama joined the Division ofInterventional Neuroradiology at the University ofCalifornia Los Angeles. He completed InterventionalNeuroradiology training under Fernando Vinuela, M.D. In2001, he became an Associate Professor of RadiologicalScience and Co-Director of Leo G. Rigler RadiologicalResearch Center at the University of California Los AngelesSchool of Medicine. Currently, Dr. Murayama is also aProfessor and Director of Endovascular Neurosurgery atJikei University. His academic interests includeEndovascular Neurosurgery and development of biocompatibletherapeutic devices, such as Matrix detachable coil system.LEARNING OBJECTIVEUpon completion of session, participants will be able to:1) Evaluate new imaging techniques and procedure optionsfor diagnosis and management of stroke and cerebralaneurysm in the adult population.254PRESENTATION SUMMARYIn the last decade, endovascular therapy using detachablemetallic coil such as GDC has proven to be a successfulalternative for the treatment of intracranial aneurysms. Themost important limitation of current coil embolization is thepossibility of aneurysm recanalization, particularly in widenecked or large/giant aneurysms. Platinum coils produce amild biological response when delivered into an aneurysm.Acceleration of intraaneurysmal clot organization and fibrosismay be a solution to preventing aneurysm recanalizationafter endovascular treatment. Matrix coil is a new bioactive,bioabsorbable coil for brain aneurysm therapy. Matrix coilsconsist of thin platinum coils covered with a bioabsorbable,polymeric material (polyglycolic acid/lactide). This devicewas approved by FDA in February 2002. To date more than1500 patients were treated with the Matrix detachable coilsystem world-wide. Initial clinical results were excellent andas safe as the GDC system. Long-term angiographic evaluationdemonstrated healing reaction of treated aneurysms.Treatment with Matrix exhibits an improved tissue organizationin aneurysm when compared to the standard GDC treatment.Longer angiographic follow-ups are needed to documentthe long-term efficacy. Further ongoing research alsowill be presented.REFERENCES1. Murayama Y, Vinuela F, Tateshima S, Song JK, Gonzalez N,Wallace MP. Bio-Absorbable Polymeric Material (BPM)Coils for Embolization of Intracranial Aneurysms:Preliminary Experimental Study. J Neurosurg 2001;94: 454-4632. Murayama Y, Vinuela F, Tateshima S, Gonzalez NR, Song JK,Alispe L. Cellular Responses of Bioabsorbable PolymericMaterial (BPM) and Guglielmi Detachable Coil (GDC) inExperimental Aneurysms. Stroke 2002;33:1120-11283. Murayama Y, Nien Y, Duckwiler GR, Jahan R, Frazee J, MartinNA, Vinuela F. Guglielmi Detachable Coil Embolization ofCerebral Aneurysms: 11 Years' Experience. J Neurosurg2003;98:959-9664. Murayama Y, Tateshima S, Gonzalez NR, Vinuela F. Matrixand Bioabsorbable Polymeric Coils Accelerate Healing ofIntracranial Aneurysms. Long-Term Experimental Study.Stroke 2003;34:2031-2037Disclosure: The author of this presentation has indicated anaffiliation with Boston Scientific: Consulting fees.
Thursday Afternoon4:40 PM - 6:10 PMBallroom 6 A(63) Advanced Imaging Seminar -Functional Mapping(63a) Functional MR Imaging Basics— Jonathan H. Burdette, MD(63b) Functional MR Imaging Clinical Applications— Andrei I. Holodny, MD(63c) MEG and MSI "From Squiggles to Surgery"— Steven M. Stufflebeam, MD(63d) Functional MR Imaging Analysis TechniquesModerators:— James J. Pekar, PhDTimothy P.L. Roberts, PhDHoward A. Rowley, MD255radiologists will find themselves increasingly asked to performfMRI studies. This portion of the fMRI AdvancedImaging Workshop will address the techniques used to performfMRI, with emphasis on the fMRI techniques usedmost commonly for clinical examinations. Discussed will behow one gets from an idea of an fMRI experiment to thepretty, colorful results seen commonly in the literature today.Following a brief discussion of the history of functionalbrain imaging in general, the specific areas to be coveredwill include the Physiologic basis of blood oxygen leveldependent (BOLD) imaging, paradigm design, rapid MRscan techniques necessary for fMRI studies, data analysis,and MR compatible equipment used to present various paradigmsto the subjects. Various useful paradigms alreadybeing used for clinical fMRI also will be presented. At theend of this session, the attendee should better understandwhy and how fMRI works and most of the steps necessaryfor successful implementation of fMRI into a standard practice.REFERENCES1. Friston KJ, Frith CD, Frackowiak RS, Turner R.Characterizing Dynamic Brain Responses with fMRI: AMultivariate Approach. Neuroimage 1995;2(2): 66-1722. Ogawa S, Lee TM, Kay AR, Tank DW. Brain MagneticResonance Imaging with Contrast Dependent on BloodOxygenation. Proc Natl Acad Sci USA 1990;87(24):9868-98723. Buchbinder BR, Cosgrove GR. Cortical Activation MRStudies in Brain Disorders. Magn Reson Imag Clin N Am1998;6(1):67-93Disclosure: The author of this presentation has indicated anaffiliation with GE Medical Systems: AVR ResearchFellowship grant.Functional MR Imaging BasicsJonathan H. Burdette, MDDr. Jonathan H. Burdette is an Assistant Professor ofNeuroradiology at Wake Forest University School ofMedicine in Winston-Salem, North Carolina. His currentresearch in fMRI focuses on abnormal cross-modal integrationof multiple sensory systems (audition and vision) indyslexia and aging.LEARNING OBJECTIVESUpon completion of this session, participants will be able to:1) Assess the neurophysiologic underpinnings of the BOLDtechnique2) Define the main types of tasks performed in the MR scanner3) Express a basic level how the MR data is processed to createthe colorful blobs of activation4) Analize the few steps required to implement functionalMR imaging (fMRI) into a clinical practicePRESENTATION SUMMARYEveryone has seen the beautiful pictures in the press of multicoloredblobs of brain activity "lighting up" on exquisite,high-resolution MR images. These pictures are generatedusing functional MR imaging (fMRI). While it has been primarilya research tool so far, as familiarity with the techniquegrows among referring physicians and the lay public,Functional MR Imaging Clinical ApplicationsAndrei I. Holodny, MDPRESENTATION SUMMARYFunctional MR imaging (fMRI) is an extremely powerful toolwhich has revolutionized the study of the human brain. Asidefrom the basic sciences, fMRI has clear applications to clinicalmedicine. Recent advances will make fMRI studies accessiblefor clinical radiologists, including those in private practice.This will bring this commanding technology to the aid ofour patients. Functional MR imaging can and should be usedin the clinical setting; however, there are differences in applicationof fMRI between research subjects and clinicalpatients that radiologists should be aware of. I shall use theexample of patient with a brain tumor. First, the clinical fMRIexam should be individualized depending upon the specificlocation of the tumor and the patient's symptomatology. Forexample, in a patient with a motor strip lesion resulting inparalysis, one may perform a passive motion or sensory paradigminstead of the standard finger tapping. Second, the paradigmsthat the patient will perform in the magnet should bepracticed prior to the actual fMRI. Patients with brain tumorsmay be more forgetful, may fatigue faster, and may havemore difficulty concentrating on the task at hand than healthyvolunteers. Third, while in the magnet, the patient has to bemonitored to make sure that s/he is performing the paradigmcorrectly. This is especially problematic for paradigmsThursday
Thursdayinvolving higher cortical functions. Functional MR imaginghas a number of known limitations. However, the radiologist,understanding the physics of MR imaging and having thecapacity to interpret the routine MR images that come withthe fMRI data, is in a unique position to appreciate these limitationsand avoid the associated pitfalls.256LEARNING OBJECTIVESUpon completion of this session, participants will be able to:1) Distinguish how information about brain function isencoded in raw fMRI data2) Assess how raw fMRI data is processed to yield brain activationmapsMEG and MSI "From Squiggles to Surgery"Steven M. Stufflebeam, MDLEARNING OBJECTIVESUpon completion of this session, participants will be able to:1) Define the neuromagnetic inverse problem and discuss thepractical implementations of a solution2) Define methods of using MEG to determine hemisphericdominance of language3) Review methods for intraoperative localization usingMEG and other functional imaging methodsPRESENTATION SUMMARYMagnetoencephalography (MEG) has been used for well overa decade to aid the neurosurgeon in localizing both abnormaltissue to be resected, and healthy essential areas of the brain,which are to be preserved during a procedure. We will reviewthe neuromagnetic inverse problem and possible solutions,with emphasis on localization accuracy while preservation oftemporal information. This is essentially distilling hundreds ofsquiggles into a few critical images that can be used efficientlyin the operating room suite. The use of MEG in epilepsy andthe use of both focal inverse source estimates, such as theequivalent current dipole method, and distributed solutionssuch as the minimum norm estimate. The use of language mappingin order to determine hemispheric dominance, and the useof MEG for regional language mapping also will be reviewed.PRESENTATION SUMMARYBlood oxygenation level dependent functional MR imaging(BOLD fMRI) exploits deoxy-hemoglobin as an endogenousparamagnetic susceptibility contrast agent to sensitizedynamic susceptibility-weighted MR acquisitions to thehemodynamic concomitants of brain activation. Reductionof the resulting large (ca. Gbyte) whole-brain four-dimensionalspatio-temporal raw data sets to activation maps hasbeen achieved for the most part with massively univariateinferential modeling: voxel-wise testing of prior temporalhypotheses [a.k.a. regression, correlation, and general linearmodel (GLM)]. Bayesian approaches may have advantagesin analyzing these rich data, especially when simultaneousdata from other modalities (e.g., EEG and EMG, but alsomonitors reporting upon physiologic sources of variance inBOLD fMRI data, such as pulse oximeter, respiratory bellows,and end-tidal expired concentration of CO2) are availablefor "multimodal" or "multispectral" analysis.Multivariate exploratory approaches, such as spatial independentcomponent analysis (ICA), may reveal structure inBOLD fMRI data resulting from unanticipated brain activity;the timings of these "brain networks" then may be enteredas additional hypotheses into a GLM. Thanks to advances incomputer performance, analysis of BOLD fMRI data can beperformed on laptops. Much excellent free fMRI analysissoftware is available for download. Rapid analysis of BOLDfMRI data with "real time" display of brain activation mapshas been demonstrated for GLM and with ICA. Alternativesources of fMRI contrast, such as cerebral blood flow (CBF)and cerebral blood volume (CBV)-based fMRI methods, canprovide synergistic data to explore.Functional MR Imaging Analysis TechniquesJames J. Pekar, PhDJames J. Pekar is Associate Professor of Radiology at TheJohns Hopkins University in Baltimore, Maryland, where healso serves as Manager and Research Coordinator of theF.M. Kirby Research Center for Functional Brain Imaging(http://mri.kennedykrieger.org) at Kennedy Krieger Institute.Dr. Pekar received his B.S. in Physics from M.I.T. and hisPh.D. in Biophysics from the University of Pennsylvania. Hewas National Research Council Research Associate at the InVivo NMR Research Center, National Institutes of Health,and then Senior Staff Fellow at the Laboratory of DiagnosticRadiology Research, National Institutes of Health. From1995 through 1998 he was on the faculty of the Departmentof Neurology, Georgetown University Medical Center. Dr.Pekar's research interests include exploratory approaches tofunctional brain mapping and the biophysics of functionalMR imaging.Disclosure: The author of this presentation has indicated anaffiliation with Philips Medical Systems: Research grant.The author of the presentation has indicated that he will bediscussing/presenting an unapproved/investigative use ofIntera MR Scanner (1.5 & 3.0 Tesla). The Scanner is madeby Philips Medical Systems.
257Thursday Afternoon5:40 PM - 6:10 PMRoom 606 - 609(64) ELC Roundtable: Q & A withToday’s Speakers— Dale A. Charletta, MD— Gregory L. Katzman, MD— Todd B. Parrish, PhD— Richard L. Wiggins, III, MDThursday
ThursdayNotes:
Friday259NOTE ABOUT SCANNED IMAGES: Scanned images are included in theproceedings book. Some submitted images were reduced during the printing process, therebydecreasing clarity. The images as originally submitted can be viewed within the abstract on the<strong>ASNR</strong> website at www.asnr.org/<strong>2004</strong>.Friday Morning8:00 AM - 9:41 AMBallroom 6 B/C(65a) Interventional: Aneurysms(Scientific Papers 331 - 343)See also Parallel Sessions(65b) Adult Brain: Functional Imaging (fMRI, MSI,MRS, PET)(65c) Interventional: General(65d) Adult Brain: Vascular ImagingModerators:Charles M. Strother, MDFernando Vinuela, MDPaper 331 Starting at 8:00 AM, Ending at 8:08 AMCoil Occlusion of 2029 Intracranial Aneurysms: Resultsof Initial TreatmentHenkes, H. · Fischer, S. · Weber, W. · Liebig, T. · Mariushi,W. M. · Kuehne, D.Alfried Krupp KrankenhausEssen, GERMANYPURPOSETo evaluate the efficacy and safety of the endovascular coilocclusion of intracranial aneurysms.MATERIALS & METHODSRetrospective data registry of the first endovascular treatmentsessions of 2029 intracranial aneurysms in 1748patients, treated in a single center between November 1992and November 2003. The analysis comprised both angiographicand clinical results (e.g., degree of aneurysm occlusion,frequency and nature of procedural complications, clinicaloutcome).RESULTSA total of 2029 aneurysms (1098 ruptured, 931 unruptured)in 1748 patients were treated by endovascular coil occlusion.A straightforward single-catheter technique was used mostfrequently (87.6 %). The degree of occlusion of the aneurysmalsac was 90-100% (considered sufficient to prevent hemorrhage)in 1759 aneurysms (86.7%). Sixteen hundred seventy-four(82.5%) analyzed treatment sessions were accomplishedwithout a procedural complication. Thrombo-embolicevents (n = 195, 9.6%) and periprocedural aneurysm rupture(n = 72, 3.5%) were the most frequently observed complications.The clinical outcome after the first treatment sessionwas (according to the Glasgow Outcome Scale, GOS)graded as I (dead) (n = 86, 4.3%), II (n = 61, 3.0%), III (n =219, 10.9%), IV (n = 132, 6.6%) or V (no disability) (n =1508, 75.2%), with still undefined outcome in 23 aneurysms.Previous hemorrhage and procedural complications but notaneurysm location mainly influenced the clinical outcome.CONCLUSIONThese data confirm the efficacy and relative safety of theendovascular coil occlusion of intracranial aneurysms, basedon the experience of a dedicated high-volume neuroendovascularcenter.KEY WORDS: Aneurysm, endovascular treatment, Coils,detachableThe authors of this work have indicated that they will be discussing/presentingan unapproved or investigative use offibered electrolytically detachable coils made byDendron/MTI for the treatment of intracranial aneurysms(this product has no FDA approval for this use).The authors of this work have indicated the following affiliations/disclosures:1. EFMT, Bochum, Germany:Consultant; 2. Dendron/MTI, Irvine, CA: Research grant; 3.ev3, Germany: Consultant.Paper 332 Starting at 8:08 AM, Ending at 8:16 AMCoil Treatment of 2029 Intracranial Aneurysms: Follow-Up Data in 1063 AneurysmsHenkes, H. · Fischer, S. · Weber, W. · Liebig, T. ·Miloslavski, E. · Kuehne, D.Alfried Krupp KrankenhausEssen, GERMANYPURPOSETo evaluate the mid- and long-term results of the endovascularcoil occlusion of intracranial aneurysms.MATERIALS & METHODSRetrospective data registry of the angiographic and clinicalresults of the subsequent endovascular treatment sessionsand follow-up examinations of 1063 out of 2029 (52.4%)intracranial aneurysms which underwent follow-up examinations,carried out in a single center between November1992 and November 2003.RESULTSIn 1063 aneurysms the first angiographic follow-up examinationwas performed at a mean interval of 23.5 months afterthe first treatment session and showed a 90-100% aneurysmocclusion in 771 aneurysms (72.5%). A degree of occlusion
Fridaybelow 90% was found in 292 aneurysms (27.5%), and 203(69.5%) of these aneurysms had been occluded previously at90-100%. Detailed anatomical analysis revealed any type ofrecurrence in 337 aneurysms (31.7%), which was attributedmostly to either coil compaction (n = 271, 25.5%) or coilmigration into thrombus (n = 28, 2.6%). Repeated treatmentsessions after the first coil treatment were carried out as follows:1 in 154 aneurysms, 2 in 33 aneurysms, 3 in 11aneurysms, 4 in 4 aneurysms, 5 in 1 aneurysm, 7 in 1aneurysm, 8 in 1 aneurysm. In 26 aneurysms (1.2%) ruptureafter endovascular coil occlusion was documented. For 922patients clinical follow-up data comprising 35676 patientsmonths(equivalent to 2973 patient-years) are available. In816 of these 922 patients (88.5%) the clinical condition at amean of 37 months after the 1st treatment session was(according to the Glasgow Outcome Scale) graded as GOS V.CONCLUSIONThe clinical long-term results after the endovascular coilocclusion of intracranial aneurysms are obviously good.Minor degrees of neck recurrence are observed frequentlyand mostly are due to coil compaction. The low rate ofaneurysm (re-)bleeding after coil treatment is encouragingbut confirms the need for rigorous angiographic follow-upexaminations and eventually retreatments.260Analysis of long-term angiographic data at 2, 6, and 10weeks is in progress and is complete for the HydroCoil andplatinum groups. Histologic analysis is in progress. Groupswere compared using ANOVA.RESULTSThere was no significant difference among groups regardinganeurysm size or dome:neck ratio. There was no differenceamong groups regarding total device length, initial angiographicocclusion score, or procedure time. The mean numberof devices for Matrix subjects was less than that for platinum(p = .03); mean number of devices for HydroCoil subjectswas not different from other groups. Volumetric occlusionfor HydroCoil (76% +/- 34) was significantly greaterthan both platinum (31% +/- 9) and Matrix (22% +/- 6).Angiographic follow-up data are complete for HydroCoiland platinum subjects. For the HydroCoil cohort, angiographicallystable occlusion was seen in 5 of 9 cases.Progressive occlusion was observed in the remaining 4cases. Recanalization or aneurysm regrowth was not seen inany of the aneurysms. For the platinum coil aneurysms, stableocclusion was observed in 6 cases, progressive occlusionin 1 case, and compaction in 2 cases. Angiographic occlusionscore at follow-up was greater for HydroCoil as compared toplatinum (p = .03).KEY WORDS: Aneurysm, endovascular treatment, follow-upThe authors of this work have indicated that they will be discussing/presentingan unapproved or investigative use offibered electrolytically detachable coils made byDendron/MTI for the treatment of intracranial aneurysms(this product has no FDA approval for this use).The authors of this work have indicated the following affiliations/disclosures:1. EFMT, Bochum, Germany:Consultant; 2. Dendron/MTI, Irvine, CA: Research grant; 3.ev3, Germany: Consultant.Paper 333 Starting at 8:16 AM, Ending at 8:24 AMComparison of HydroCoil Embolization System,Platinum Coils, and Matrix in the Embolization ofExperimental Aneurysms in RabbitsKallmes, D. F. · Ding, Y.Mayo ClinicRochester, MNPURPOSETo evaluate and compare the performance of three productsfor the embolization of experimental aneurysms.MATERIALS & METHODSElastase-induced, saccular aneurysms were created in 27New Zealand White rabbits. Nine aneurysms wereembolized with each of the three products evaluated in thisstudy, the HydroCoil Embolization System (HES,MicroVention, Aliso Viejo, CA), platinum coils, andMatrix (Target Therapeutics, Fremont, CA). We comparedbetween groups the following parameters: aneurysm size,neck size, dome:neck ratio, procedure duration, number ofdevices deposited, total device length deposited, angiographicocclusion score, and volumetric occlusion percentage.CONCLUSIONImmediate angiographic occlusion is similar among platinum,Matrix, and HydroCoil devices. Volumetric occlusionis improved using HydroCoil as compared to other devices.Compared to platinum, HydroCoil results in improved longtermocclusion rates. Additional data regarding long-termperformance of Matrix devices in the rabbit model will bepresented, along with histologic analysis of all three devices.KEY WORDS: Aneurysm, animal model, coilsThe authors of this work have indicated the following affiliations/disclosures:MicroVention, Inc.: Shareholder.Paper 334 Starting at 8:24 AM, Ending at 8:32 AMAccuracy of Algebraic and Voxel Methods forQuantifying Cerebral Aneurysm Volume by 3DRotational Digital Subtraction Angiography: An In Vitroand In Vivo StudyFanning, N. F. · O’Dwyer, H. · Bowden, J. · Brennan, P. ·Thornton, J.Beaumont HospitalDublin, IRELANDPURPOSEWith the development of liquid embolic polymers andexpandable gel-coated coils accurate assessment of the volumeof an aneurysm will be valuable in guiding the volumeof material required to fill the aneurysm sac and in assessingthe percentage volume filling achieved. Following 3D DSAacquisition, aneurysm volume can be quantified using simplealgebraic equations based on the assumption they haveregular geometry or by quantification of voxel volume usingdedicated software (GE Medical Systems, Buc, France). Ouraim was to determine the accuracy of these various methodsfor calculating aneurysm volume using an in vitro model andconfirm the findings in vivo.
MATERIALS & METHODSOur in vitro model consisted of 13 latex aneurysm molds.The volumes of these experimental aneurysms were measured5 times using a micropipette and the mean volume wastaken as the true volume of the model aneurysm. Following3D DSA acquisition, the volumes of the experimentalaneurysms were calculated, first, on a dedicated workstationby multiplying the total number of voxels belonging to theaneurysm by the corresponding voxel volume (0.3 mm 3 forthe 23 cm field of view used) and, second, by simple algebraicequations assuming the aneurysms were either ellipsoidor cylindrical. We next quantified aneurysm volume in50 patients with cerebral aneurysms comparing the voxeland algebraic methods for volume estimation.RESULTSIn our in vitro study the voxel volume method for aneurysmquantification was significantly more accurate than the algebraicmethod. The mean percentage deviation of the voxelvolume from the true volume was 3.7 ± 3.5% (range -3.3 to7.9%; p = 0.9). Algebraic methods based on the assumptionthat the aneurysms were cylindrical, resulted in a significantoverestimation in volume size (mean percentage overestimationof the cylindrical volume method from the true volumewas 36.9 ± 22.3%; range -15.9 to 82.4%; p = 0.018).Assuming the aneurysms were ellipsoid resulted in no correlationwith true aneurysm volume (mean percentage deviationof the ellipsoid volume method from the true volumewas 63.9 ± 109.7%; range -35.7 to 327.6%). Using the voxelmethod as a standard in the in vivo model, we confirmed thatthe cylindrical method overestimated aneurysm volume(22.4 ± 34%; p = 0.004) and that calculations based on theassumption that aneurysms in vivo are ellipsoid were notcorrelated with voxel aneurysm volume.CONCLUSIONThe voxel volume method is accurate in quantifying trueaneurysm volume. Aneurysms in vivo do not conform tosimple algebraic geometry. Calculations based on theassumption that aneurysms are cylindrical results in significantoverestimation in volume size, with no correlation withtrue size when aneurysms are assumed to be ellipsoid.Assessing percentage aneurysm filling with any embolicagent using an algebraic method would be inappropriate.KEY WORDS: Volume, aneurysm, 3D DSA261determined. We retrospectively analyzed small aneurysmstreated with a single Guglielmi detachable coil (GDC) inorder to determine if the volume embolization ratio is predictiveof stability.MATERIALS & METHODSThe volume embolization ratio is determined for 20 consecutivesmall (all < 7 mm diameter) intracranial aneurysmstreated with a single embolization coil from August 1997 toApril 2003. The aneurysms were identified in 20 differentpatients, 12 females and 8 males, ranging in age from 21 to72 years (mean and median age 48 years). Sixteenaneurysms were in the anterior circulation and four were inthe posterior circulation. Eight aneurysms had ruptured previously.Aneurysm volumes are calculated assuming thatthese small lesions are spherical in shape. The largestaneurysm dimension, estimated by comparison to anatomicallandmarks, was used for volume calculation. Coil volumesare as per manufacturer specification. Volumeembolization ratio is calculated by the formula (coil volume/aneurysmvolume) x 100%. Stability was assessed byangiographic follow-up. New aneurysmal filling on the follow-upexam was considered to be a recurrence.RESULTSFollow-up angiographic assessment was conducted at 6 +/- 6months after initial treatment. The average volumeembolization ratio for all aneurysms was 12.4 +/- 8.2%(range 1.5 to 28.2%). Twenty percent of the aneurysms hada packing density greater than 20%. One large (6 x 10 mm)and three small (< 1 mm) recurrences were identified. Threeof the four recurrent aneurysms (one basilar apex and twoanterior communicating) had ruptured previously. The fourthrecurrence was a previously unruptured anterior communicatinganeurysm. The average embolized volume forunchanged aneurysms was 12.6 +/- 7.7%. Volume embolizationratios for the recurrent aneurysms were: 3.4, 3.9, 11.5and 28.2% (average 11.8 +/- 11.6%). There was not a significantdifference between these two groups (P = .86).CONCLUSIONAverage embolization ratio for aneurysms treated with a singlecoil was less than the recommended packing density of20-33% (1, 2, 3). Coil embolization ratio was not predictiveof recurrence in small intracranial aneurysms treated with asingle detachable coil.Paper 335 Starting at 8:32 AM, Ending at 8:40 AMCalculation of the Volume Embolization Ratio in SmallAneurysms Treated with a Single Detachable CoilGoddard, J. K. · Moran, C. J. · Cross, D. T. · Derdeyn, C. P.Mallinckrodt Institute of RadiologySt. Louis, MOPURPOSEDense coil packing of intracranial aneurysms is an importantgoal of endovascular embolization. However, because ofsmall size, some aneurysms only can be treated with a singleembolization coil. Previous authors have described a significantcorrelation between the stability of coiled aneurysmsand a volume embolization ratio greater than 20-33% (1, 2,3). Usefulness of the ratio in predicting stability of smallaneurysms treated with a single detachable coil has not beenREFERENCES1. Tamatani S, Ito Y, Abe H, Koike T, Takeuchi S, Tanaka R.Evaluation of the Stability of Aneurysms after EmbolizationUsing Detachable Coils: Correlation between Stability ofAneurysms and Embolized Volume of Aneurysms. AJNR AmJ Neuroradiol 2002;23:762-7672. Kawanabe Y, Sadato A, Taki W, Hashimoto N. EndovascularOcclusion of Intracranial Aneurysms with GuglielmiDetachable Coils: Correlation between Coil Packing Densityand Coil Compaction. Acta Neurochir (Wien)2001;143(5):451-4553. Satoh K, Satomi J, Matsubara S, Nagahiro S. Measurement ofVolume Ratio to Predict Coil Compaction, on AneurysmalEmbolization. Int Neuroradiol 1998;4(suppl 1) :179-182KEY WORDS: Aneurysm, embolization, ratioFriday
Friday262Paper 336 Starting at 8:40 AM, Ending at 8:48 AM Paper 337 Starting at 8:48 AM, Ending at 8:56 AMClinical and Morphologic Long-Term Results of Basilar Endovascular Coil Embolization of Middle CerebralTip Aneurysms Treated by Reversal of FlowArtery AneurysmsWeill, A. · Roy, D. · Guilbert, F. · Raymond, J.Centre Hospitalier Universite Montreal, Hopital Notre-DameMontreal, PQ, CANADAPURPOSETo determine the long term clinical and morphologic resultsof saccular basilar tip aneurysms treated by reversal of flow.MATERIALS & METHODSFrom October 1996 to August 2003, 11 patients (9 females,2 males) (44-77 years old, average 54 years) had a saccularbasilar tip aneurysm treated by reversal of flow. Fiveaneurysms were giant, 4 were large. Five were ruptured previouslybut none were treated this way in acute phase. Sixaneurysms were treated because of progressive mass effect,5 after recurrence of selective treatment. Clinical follow-upranged from 2 to 54 months (average 21 months).Morphologic follow-up (with CT and/or MR imaging and orangiography) ranged from 0 to 54 months (average 15months).RESULTSReversal of flow was obtained after occlusion of vertebralarteries below PICAs. In one case a surgical by-pass betweenthe superficial temporal artery and the posterior cerebralartery was necessary. Parent vessel occlusion led to 2 strokes(1 fatal, 1 minor). Clinical long-term results: No bleeding orrebleeding occurred during follow-up period. From the 5patients with symptoms related to mass effect who survived,2 improved, 2 continued to deteriorate and 1 remainedunchanged (average observation period 17 months).Morphological long-term results: 2 aneurysms decreased insize or completely thrombosed, 4 aneurysms did not change,1 continued to growth, 3 were not followed (2 patientsrefused imaging, 1 is pending). Specific analysis of the flowat the level of the neck of the aneurysm at the time of the parentvessel occlusion gives some valuable information but cannot predict with certainty the evolution of the aneurysmsince the flow might continue to change with the recruitmentof collateral circulation as demonstrated when late controlangiograms are performed (3/3).CONCLUSIONLong-term clinical and morphologic results of bilateral vertebralartery occlusion for basilar tip aneurysm treatment areuncertain. Therefore this treatment modality should beweighed carefully before being attempted.In the future, virtual models on computer might be helpfulby showing the impact of flow modification on aneurysmgrowth and might allow for a more accurate selection ofpatient. However, this selection probably will never be perfect,because collateral circulation development after parentvessel occlusion is difficult to predict and might change theposterior circulation flow distribution with time.KEY WORDS: Aneurysm, parent vessel occlusion, basilar tipDoerfler, A. · Wanke, I. · Goericke, S. · Sandalcioglu, E. ·Stolke, D. · Forsting, M.University of EssenEssen, GERMANYPURPOSETo analyze technical feasibility, safety, and efficacy ofendovascular coil embolization in a consecutive series ofruptured and unruptured aneurysms of the middle cerebralartery (MCA).MATERIALS & METHODSThirty-nine patients with ruptured (n = 16) or unruptured (n= 25) MCA aneurysm (n = 41) were considered for endovasculartherapy with detachable coils. Twenty-two patients hadan acute SAH; of which six patients had a ruptured aneurysmin a different location. In 17 patients the MCA aneurysm wasan incidental finding. Five patients had a residual aneurysmafter surgical clipping. Patients with SAH were classified asH&H; Grade I (7), II (8), III (6), and IV (1). Aneurysm sizewas: < 6 mm (24), 6-10 mm (13), 11-25 mm (4). At the timeof treatment three patients had severe vasospasms.Occlusion rate was devided into total (100%), subtotal (95-99%), and incomplete (< 95%) occlusion. Follow-up angiographyand clinical evaluation based on the GlasgowOutcome Scale (GOS) were performed at 6 months.RESULTSIn 5/39 patients coil embolization of the aneurysm was notperformed (4) or failed (1) because of an unfavorableangioanatomy (n = 4) or severe vasospasm (n =1 ). In 34/39patients complete occlusion could be achieved in 35aneurysms (total n = 20; subtotal n = 15), and incomplete inone. Procedural complications included coil protrusion intothe parent artery (1), and thromboembolic artery occlusion(4). Selective thrombolysis resulted in recanalization in 3/4cases, with persistent neurologic deficit (ND) in one patient.There was no procedure-related death, procedural morbiditywas 2.6%. Of the 15 patients with subtotal occlusion eightpatients progressed to total occlusion during follow-up, twopatients had recanalization of the aneurysm due to coil compaction.Both patients were retreated. One patient had slightrecanalization without coil compaction. No patient rebled.Glasgow Outcome Scale at 6 months for the embolizedpatients with SAH (n = 19) was: GR (14), ND (4), D (1), andGR for all patients embolized for an incidental aneurysm. Infour of the five patients in whom endovascular therapy wasnot performed neurosurgically clipping was performed, withcomplete aneurysm occlusion in three and incomplete in onepatient. Clinical outcome after 6 months according GOS wasGR (3) and ND (1).CONCLUSIONEndovascular coil embolization can be performed safely andeffectively in selected MCA aneurysms. Anticoagulationmanagement is of great importance in this setting. Ourresults demonstrate that initial subtotal aneurysm occlusionmight progress to total occlusion during follow-up.KEY WORDS: Aneurysm, middle cerebral artery, embolization
Paper 338 Starting at 8:56 AM, Ending at 9:04 AMEndovascular Treatment of Posterior CirculationAneurysms: Alternative ApproachesGhodke, B. V.University of WashingtonSeattle, WAPURPOSEEndovascular treatment has been established as an effectivetreatment modality, most successfully in the posterior fossa.There are many instances when the treatment is limited byunfavorable anatomy, like extreme tortuosity in the vertebrobasilarsystem, atherosclerotic disease with stenoses inthese vessels, vasospasm, catheter and wire-induced injury,dissections, etc. The purpose of this article is to describe ourexperience with alternative approaches to aneurysms in theposterior fossa. The hardware, technical modifications, andcase selections will be discussed.MATERIALS & METHODSWe present four representative cases of aneurysms in theposterior circulation admitted at the University ofWashington Medical Center and Harborview Medical Centerbetween 2002 and 2003. All patients underwent a completediagnostic angiogram and were referred for endovasculartreatment of the aneurysms. Case 1 had an aneurysm on thedistal right vertebral artery involving the right PICA origintreated by approaching the aneurysm through the left vertebralartery while protecting the right PICA via the right vertebralartery. Case 2 had a distal left PICA aneurysm treatedvia a direct puncture of left vertebral artery at C1-2 level.There was extreme tortuosity of the left vertebral arterywhile the right vertebral artery was ending in PICA. Case 3had a basilar tip aneurysm treated through combined leftPCOM and vertebral approach as the patient had a wideneckedaneurysm and remodelling was performed throughthe left PCOM across the aneurysm neck. Case 4 had a rightP2-3 segment aneurysm treated through the right PCOM,due to severe spasm in the vertebral arteries on attempts tocatheterize them.RESULTSCase 1, we were able to preserve the right PICA with occlusionof the aneurysm. Cases 2-4, we were able to deploycoils in the aneurysms successfully. All cases had successfuloutcomes with angiograms showing stable occlusion.CONCLUSIONWith ongoing advances in the endovascular hardware,catheters, guide wires and improved imaging equipment, it ispossible to approach complex intracranial lesions via alternativeapproaches as described and increase the number oflesions that can be treated successfully.KEY WORDS: Aneurysm, GDC, embolization263Paper 339 Starting at 9:04 AM, Ending at 9:12 AMFibered Electrolytically Detachable Platinum Coils forthe Endovascular Occlusion of Intracranial Aneurysms:Clinical Experiences and Analysis of 474 AneurysmsLiebig, T. · Henkes, H. · Fischer, S. · Brew, S. · Weber, W. ·Miloslavski, E. · Mariushi, W. · Kühne, D.Alfried Krupp KrankenhausEssen, GERMANYPURPOSETo determine the safety and clinical efficacy of electrolyticallydetachable coils with attached nylon fibers (SapphireDetachable Coil System, MTI, Irvine, CA) for the endovasculartreatment of intracranial aneurysms in comparison tobare platinum coils.MATERIALS & METHODSBetween November 1992 and October 2003 a total numberof 2029 aneurysms was treated by endovascular occlusionwith electrolytically detachable coils in 1748 patients. In thisseries, nylon-fibered platinum coils were used in 474aneurysms solely or in combination with bare coils from variousmanufacturers. Retrospective analysis was done withrespect to clinical status, and numerous parameters concerningindividual aneurysm characteristics (e.g, location, neckwidth, fundus diameter). Treatment-related facts includedthe use and percentage of fibered coils, occlusion rate, proceduralcomplications, early clinical outcome and GlasgowOutcome Scale (GOS) scores. Finally, follow-up results likeocclusion rate, occurrence and cause of recurrence, incidenceof posttreatment hemorrhage, and clinical long-termfollow-up were included. Angiographic follow-up data wereavailable for 904 aneurysms treated with bare coils and for156 aneurysms treated with fibered coils. Statistical analysisfor comparison between aneurysms treated with either bareor fibered coils was done by means of logistic regression andmatched pairs analysis. Only treatments with available datafor all matching variables were used resulting in 421matched pairs.RESULTSBoth logistic regression and matched pairs analysis showeda statistically improved early occlusion rate if fibered coilshad been used (roughly 96% occlusion rate of 90%-100%with the use of fibered coils vs 78% in the matched pairsanalysis and 84% with logistic regression with the exclusiveuse of bare coils). However, the amount of fibered coils calculatedas percentage of coil length did not seem to have arelevant impact. Procedures with fibered coils did not lead toa higher rate of thromboembolic events. Actually, there wasa statistically insignificant trend towards a reduced frequencyof this kind of complication (8% fiber vs 10% bare coils).Also, the clinical outcome was insignificantly better in thegroup treated with fibered coils determined by both postproceduraloutcome and GOS. Analysis of the anatomical propertiesshowed no differences between the groups treated withbare and fibered coils in terms of neck width, fundus diameter,and anatomical location. As expected, a higher occlusionrate was achieved in aneurysms with smaller neck and fundusindependent from the type of coil used. On follow-upangiography, there was a statistically nonsignificant trendtowards a lower rate of recurrence secondary to coil compactionin the group treated with fibered coils but these dataFriday
Fridaywere compromised by the fact that up to date, only 156 outof 474 aneurysms underwent angiographic follow-up afterfibercoil treatment.CONCLUSIONIn our series, fibered electrolytically detachable platinumcoils exhibit significantly improved occlusion rates overbare platinum coils. Statistically insignificant trends towardsa reduced rate of thromboembolic events, an improved clinicaloutcome, and a reduced recurrence rate remain subjectto validation by more angiographic long-term follow-up datato be collected.KEY WORDS: Aneurysm, endovascular, fibered coilsThe authors of this work have indicated that they will be discussing/presentingan unapproved or investigative use offibered electrolytically detachable coils made byDendron/MTI, Irvine, CA for the treatment of intracranialaneurysms.The authors of this work have indicated the following affiliations/disclosures:1. EFMT, Bochum, Germany:Consultant; 2. ev3: Consultant; 3. Dendron/MTI, Irvine, CA:Research grant.Paper 340 Starting at 9:12 AM, Ending at 9:20 AMFirst Year Single Center Experience with the MatrixDetachable Coils for Treatment of 139 ConsecutiveIntracranial Aneurysm Cases: Technical and ClinicalOutcomes Including 6-Month Angiographic Follow-UpChaloupka, J. C. · Johnson, M. C. · Ugurel, M. S. · Lee, S. ·Tejada, J. · Hsu, S. W.University of Iowa Hospitals and ClinicsIowa City, IAPURPOSEWe present the worlds’ largest single center clinical series ofIC aneurysms treated with the Matrix detachable coils inwhich immediate/short term technical and clinical efficacy isassessed, as well as 6-month angiographic follow-up in ourfirst 50 patients.MATERIALS & METHODSOver a 12-month period, 159 consecutive aneurysm caseswere treated by endovascular surgery at our center, of which139 were treated successfully with Matrix coils. Anyaneurysm treated with at least one Matrix coil was includedin the study. Conventional co-axial microcatheter techniqueswere used to access and fill the aneurysms with coils. Inmost cases, aneurysms were treated with a combination ofMatrix and other bare platinum coils (GDC, Micrus, andOrbit). Wide-neck aneurysms were treated mostly adjunctivelywith neck bridging microstents (Neuroform), or occasionallyballoon neck remodeling. Systemic heparinizationwas used in all cases during ES, while either oral (ASA andPlavix) and/or intravenous (Aggrastat) antiplatelet thereapywas administered when stenting was performed.Conventional angiographic and clinical outcome criteriawere used for immediate, 6-week, and 6-month follow upassessments.264RESULTSPatient female:male ratio = 13:7. Aneurysm sizes variedfrom 2-28 mm (median = 6 mm). All anatomical sites wereencountered with most common: ICA paraclin. (N = 33),ACoA (N = 31), MCA (N = 27), ICA-PCoA (N = 22), andBasilar tip (N = 17). Attempted Matrix placement wasunsuccessful in 5/142 cases (3.5%). Good or excellent angiographicobliteration was noted in 130/139 cases (93%),although small neck remnants were noted in 20% of cases onimmediate control angiography. A wide spectrum of Matrixbareplatinum coil blends were encountered (20-100%) withan average of 45%. Four patients suffer major complicationsdirectly attributable to ES, which included 1 overpacking, 1aneurysm perforation, 1 delayed coil migration into the parentartery, and one distal perforation from a wire exchangeused for NF placement. A detailed accounting of additionaltechnical and short term clinical outcomes will be tabulatedand presented. Six-month angiographic follow-up to date hasbeen obtained in 48 patients. Clinically significant recanalizationof an aneurysm treated with Matrix, which requiredretreatment was seen in 11 cases, resulting in an overallretreatment rate of 22.9%. There appeared to be no correlationwith size, location, or proportion of Matrix coils usedand the need for retreatment.CONCLUSIONFrom a purely technical perspective, our experience with theMatrix coils has been overall very favorable, although wehave encountered certain problems and limitations withthese coils (e.g., framing compartmentalization, relativelyincreased stiffness), which likely were responsible either forearlier encountered complications or current inability to utilizethe device universally in the full spectrum of technicalapplications. Clearly, with increasing cumulative experience,our group is now routinely using the system in nearly everyaneurysm. The overall retreatment rate of 22.9% comparesvery well with previously reported series, particularly whenconsidering that our series represents an unselected patientpopulation (i.e., ES is the primary treatment modality).Retrospective studies are now ongoing to assess the actualimpact Matrix coils may have had on retreatment rates comparedto aneurysms treated with bare-platinum coils.KEY WORDS: Matrix coils, endovascular surgeryThe authors of this work have indicated the following affiliations/disclosures:Boston Scientific, Cordis Neurovascular,Micrus: Consultant, grant funding, honoraria.
265Paper 341 Starting at 9:20 AM, Ending at 9:28 AM Paper 342 Starting at 9:28 AM, Ending at 9:36 AMEffects of Intraarterial Nicardipine on Cerebral Blood Intraarterial Nicardipine vs Papaverine for CerebralFlow of Patients with Subarachnoid Hemorrhage- Vasospasm Following Subarachnoid HemorrhageInduced Vasospasm as Measured by Cine CT PerfusionRabinov, J. D. · Singhal, A. B. · Hirsch, J. A. · Hoh, B. L. ·Conrad, L. K. · Carter, B. S. · Ogilvy, C. S. · Badjatia, N. ·Pryor, J. C.Nogueira, R. G. · Lev, M. H. · Roccatagliata, L. · Rabinov, J.D. · Hirsch, J. A. · Ogilvy, C. S. · Pryor, J. C. · Gonzalez, G.R. · Rordorf, G. A.Massachusetts General HospitalBoston, MAPURPOSETo determine the effects of the administration of intraarterial(IA) nicardipine on the cerebral hemodynamics of patientswith vasospasm following subarachnoid hemorrhage (SAH).Massachusetts General HospitalBoston, MAPURPOSETo compare outcomes of patients treated with intraarterialnicardipine and/or angioplasty with patients treated withpapaverine and/or angioplasty for cerebral vasospasm followingsubarachnoid hemorrhage.MATERIALS & METHODSFive post-SAH patients with clinical and transcranialDoppler findings suggestive of vasospasm were evaluatedby CT angiography (CTA) and concomitant first-pass quantitativecine CT perfusion (CTP) immediately before angiographicevaluation for possible vasospasm treatment.Angiographic vasospasm was confirmed in all patients.CTA/CTP was repeated following IA administration ofNicardipine. Maps of mean transit time (MTT), cerebralblood volume (CBV) and cerebral blood flow (CBF) weregenerated and analyzed by a blinded investigator using theALICE software (Denver, CO). Corresponding regions ofinterest (ROI) from the bilateral middle cerebral artery territories,and whenever possible the bilateral anterior cerebralartery territories, were selected from both pre and posttreatmentscans and compared in order to establish the changes inCBF, CBV and MTT after IA Nicardipine.RESULTSIn four out of five patients, both CBF and MTT improvedsignificantly in the affected regions in response toNicardipine therapy [mean increase in CBF 56% (range 8-162%, p = 0.01), mean decrease in MTT 36% (range 5-68%,p = 0.0007)]. In one patient, we were unable to observe animprovement in flow parameters secondary to slice selectiondifferences between the pre and posttreatment examinations.CONCLUSIONIntraarterial nicardipine infusion improves CBF and MTT inischemic regions in patients with SAH-induced vasospasm.Our data complements, at the tissue level, the previouslyreported favorable effects of IA nicardipine seen with angiographicstudies. Quantitative CTP may provide a surrogatemarker for monitoring the success of treatment strategies forclinical trials of patients with SAH-induced vasospasm.KEY WORDS: Nicardipine, vasospasm, CT perfusionThe authors of this work have indicated that they will be discussing/presentingan unapproved or investigative use ofNicardipine made by ESP Pharma, Inc. and Roche for cerebralvasospasm treatment.MATERIALS & METHODSRetrospective analysis was used to identify and gatherpatient data. In the 2-year period 2000-2001, 26 patientswere treated for cerebral vasospasm using angioplastyand/or intraarterial papaverine. In the subsequent 2-yearperiod 2002-2003, 47 patients were treated with angioplastyand/or intraarterial nicardipine. Covariates = age (> or < 50years), sex, Hunt Hess grade (1-3) (HH), Fisher score (1-3),vasospasm severity on angiogram (mild/moderate/severe),therapy given (papaverine and/or angioplasty or nicardipineand/or angioplasty), and number of treatments. Outcomevariables: modified Rankin score (mRS), death, neurointensivecare length of stay (ICU LOS) and total length of stay(LOS). Multivariate analysis for outcomes after adjusting forage, Fisher, Hunt Hess, angioplasty, vasospasm severity,number of treatments.RESULTSPapaverine group - total 26 patients, mean age 52.1 years, 8males, mean HH grade 3.3, Fisher scale score 2.9, 8 required> 2 treatments, all 26 had concomitant angioplasty, mRS4.39 (22 with mRS 3 to 6; 21 with mRS 4 to 6, 7 deaths);NICU LOS 18.1 days, total LOS 28.0 days. Nicardipinegroup - total 47 patients, mean age 51.7 years, 12 males,mean HH grade 3.2, Fisher scale score 2.8, 10 required > 2treatments, only 6 had concomitant angioplasty, mRS 4.15(41 with mRS 3 to 6; 32 with mRS 4 to 6, 11 deaths); NICULOS 17.8 days, total LOS 26.3 days. Multivariate analysis -HH grade significantly associated with mRS (p < 0.001) anddeath (p < 0.001); patients needing more than 2 treatmentshad longer total LOS (p = 0.025). No difference in any outcomevariable between nicardipine and papaverine groups.Anecdotally, limitation to nicardipine for intracranial pressureissues was only 2/47 patients, and it was used in severalpatients with cardiac impairment without complication.Friday
FridayCONCLUSIONOur results suggest that intraarterial nicardipine is as effectiveas papaverine and/or angioplasty for treatment inpatients with subarachnoid hemorrhage. This regimen canavoid the risks of angioplasty and the complications encounteredwith papaverine.REFERENCES1. Badjatia N, Topcuoglu MA, Pryor JC, Rabinov JD, Ogilvy CS,Carter BS, et al. Experience with Intra-Arterial Nicardipinefor Cerebral Vasospasm. AJNR Am J Neuroradiol 2003, inpressKEY WORDS: Vasospasm, subarachnoid hemorrhage,aneurysmThe authors of this work have indicated that they will be discussing/presentingan unapproved or investigative use of: 1.Papaverine made by American Regent for cerebralvasospasm; 2. Nicardipine made by Weyth Laboratory forcerebral vasospasm.Paper 343 Starting at 9:36 AM, Ending at 9:41 AMHemorrhagic Foreign Body Granulomas FollowingStent-Assisted Aneurysm EmbolizationTong, F. C. · Abruzzo, T. A. · Cawley, C. M. · Dion, J. E.Emory University School of MedicineAtlanta, GAPURPOSEWe describe a 59-year-old female with an incidentally discoveredleft superior hypophyseal artery aneurysm that initiallywas treated endovascularly with bare platinum coilswith subsequent recurrence. The recurrence was retreatedendovascularly in a combined stent-coil procedure 7 monthslater in which there was unraveling and removal of aHydrogel-coated aneurysm coil. Her postoperative coursewas complicated by right upper extremity weakness, righthemiparesis, and disorientation with multiple small subcorticalinfarcts by follow-up MR imaging consistent with thromboemboli.She had a new unexplained 5 mm focus of intraparenchymalhemorrhage in the lateral left temporal lobe onpostoperative day 7 and was ultimately discharged to homeon postoperative day 15 with only mild residual rightextremity weakness. Seven days post discharge the patientpresented to her local emergency room with a 12 x 5 x 3 cmintraparenchymal hemorrhage in the left frontal lobe with asmall amount of overlying subarachnoid hemorrhage. Thepatient demonstrated no verbal or motor response with fixedand dilated pupils. Medical care was withdrawn at therequest of the family and an autopsy was obtained demonstratingdisseminated foreign body granulomas in the leftcerebral hemisphere.266models and aneurysmal catheterization was performed usingnew Excelsior (Boston Scientific) microcatheters and newAgility-14 (Cordis) microguidewires. A series of bare platinum,Hydrogel-coated (Microvention), and suture-coated(Boston Scientific) were placed through the stents into theaneurysms with video recording. Gross and histologic analysisof the brain specimen was performed including identicalH&E staining of the Hydrogel material. A cell block specimencontaining several brain granulomas was submitted forFourier transform infrared spectroscopy for analysis of theforeign body material.RESULTSVideo analysis of the stent-coil procedural recreation demonstratedejection of multiple white and blue fibers from themicrocatheter following placement in the aneurysm. Thiswas the case for both studied microcatheters. This materialwas collected on and sent for Fourier transform infraredspectroscopy which showed that it was consistent with cottonfibers and cellulose. Gross and histologic analysis of thetreated aneurysm showed no evidence of rupture. Histologicanalysis of the brain specimen demonstrated extensive disseminatedforeign body granulomas containing multinucleatedhistiocytic giant cells many containing blue string-likenonpolarizing material. Fourier rransform infrared spectroscopyof the foreign body granulomas in the cell blockdemonstrated findings also consistent with cotton fibers andcellulose.CONCLUSIONThis patient demonstrated clinical and imaging findings ofcerebral emboli resulting in the formation of foreign bodygranulomas that are likely the cause of her delayed intraparenchymalhemorrhage. These granulomas demonstratethe presence of cotton fibers and cellulose matching the foreignbody ejected from the microcatheters during videoanalysis which was confirmed by Fourier transform infraredspectroscopy. Further study into the etiology of these foreignbody fibers is necessary so that the source can be identifiedand eliminated.KEY WORDS: Foreign body, granuloma, embolizationMATERIALS & METHODSBenchtop stent and coil embolization was performed withvideo analysis utilizing identical catheter, microguidewire,and stent treatment materials for analysis of the stent-coilunraveling. This was performed using a 10 mm silicone sidewallaneurysm and pulsitile flow model using phosphatebuffered saline. S7 (AVE) and Neuroform 2 (BostonScientific) stents were placed across the aneurysm neck
Friday Morning8:00 AM - 9:36 AMBallroom 6 A(65b) Adult Brain: Functional Imaging(fMRI, MSI, MRS, PET)(Scientific Papers 344 - 355)See also Parallel Sessions(65a) Interventional: Aneurysms(65c) Interventional: General(65d) Adult Brain: Vascular ImagingModerators:Cesare Colosimo, MDAndrei I. Holodny, MDPaper 344 Starting at 8:00 AM, Ending at 8:08 AMComparison of Functional MR Imaging Guidance toElectrical Cortical Brain Mapping for TargetingSelective Motor Cortex Areas: A Study Based onIntraoperative Stereotactic Navigation for Motor CortexStimulation in Neuropathic PainPirotte, B. · Neugroschl, C. · Wikler, D. · Denolin, V. ·Voordecker, P. · Massager, N. · Brotchi, J. · Levivier, M. ·Balériaux, D. L. F.Hospital Erasme, Universite Libre de BruxellesBrussels, BELGIUMPURPOSETo assess, regardless of the clinical result, the contribution ofcombining the functional MR imaging (fMRI) to the intraoperativebrain mapping (iBM) to improve the quality of thetargeting method for epidural chronic motor cortex stimulation(MCS) in refractory central and neuropathic pain.MATERIALS & METHODSEighteen patients (10 female/8 male, mean age 55.6 years)suffering from refractory central [ischemic/traumatic (12cases)] and neuropathic pain [trigeminal neuropathy (6cases)] underwent surgery for the implantation of an epiduralMCS device under general anesthesia and with a framelesssurgery navigation system used for the image-guided targetingprocedure. The authors used the standard procedure ofcortical iBM with somatosensory evoked potentials andmotor cortex bipolar stimulation as functional targetingmethod. Preoperatively, the motor cortex activation aftermotor tasks of both hands (and foot/face when affected bypain) were systematically studied by fMRI investigating.Functional MR data obtained were analyzed with theStatistical Parametric Mapping 99 software with an initialanalysis threshold corresponding to P < 0.001.267Intraoperatively, the stereotactic coordinates of the centralsulcus and those of the motor target defined by MR imagingand iBM were correlated spatially into the navigation systemto the contours of the fMRI-activated motor areas in allpatients. The authors assessed the contribution of combiningfMRI to the standard, iBM-guided procedure to improve thequality of the peroperative functional targeting method.RESULTSPain relief was obtained in 11/18 patients. Excellent matchingbetween the contours of the fMRI-activated areas and theiBM target of the hand on precentral cortex was observed(focus of highest electrical wave found within the contoursof the fMRI-activated cortical area) in 11 patients and usedas functional target for MCS. The fMRI-activated areahelped to confirm the target of the hand in 6 other patients inwhich iBM was impaired by artifacts or wave attenuationand therefore not strictly reproducible or concordant (takingas functional target from iBM recordings the one that wasprojected within the contours of fMRI-activated area). ThefMRI-activated area helped to confirm the target of thefoot/face in 3 patients in which iBM was not strictly reproducibleor concordant. Finally, in one patient, iBM data werefully informative to allow targeting while fMRI data wereimpaired by patient’s poor cooperation during imagingprocess.CONCLUSIONAlthough specific aspects of fMRI technique must be validatedprior to its reliable use in routine image-guidance,these preliminary data show that: 1) fMRI-guidance can providedata matching those obtained from standard and independentmethod used for functional targeting, 2) the combinationof both techniques could help in validating fMRIguidanceas a valid adjunct to iBM for improving the qualityof the functional targeting procedure. Since appropriatetargeting is crucial to obtain pain relief, the combination ofstereotactic fMRI to iBM could improve the efficacy ofMCS on the alleviation of pain.KEY WORDS: Functional MR imaging, brain mapping,motor cortexPaper 345 Starting at 8:08 AM, Ending at 8:16 AMTongue Articulation Functional MR Imaging: Absence ofLateralization in the DeafShibata, D. K. · Zhong, J.University of WashingtonSeattle, WAPURPOSEThe congenitally deaf often have limited speech skills andthus the neural control of the vocal apparatus might beexpected to be relatively underdeveloped. The purpose ofthis functional MR imaging (fMRI) study was to localizebrain activity associated with simple tongue articulationmovements in the deaf and hearing and determine if the presenceor absence of speech alters the cortical representation.MATERIALS & METHODSFourteen students from a deaf college with prelingual hearingloss and relatively poor speech skills were compared to14 hearing subjects. All subjects were right-handed andFriday
Fridaybetween 18 and 31 years of age. The task in both groups wasto make a brief series of nonvocal movements of the tip ofthe tongue against the midline palate with mouth closed. Anevent-related design was used to minimize head motion.Echo-planar 2D spiral whole brain scanning was performedat 1.5 T (GE) with T-test analysis and Talairach-based intersubjectaveraging (SPM 99).RESULTSGroup analysis revealed overall fairly similar bilateral inferiorperirolandic cortex activations in the two groups.However, the deaf showed additional temporal lobe activity,primarily in the posterior left superior temporal gyrus (anteriorto usual auditory cortex) but also the right posterior middletemporal gyrus. Additionally, cerebellar activity wasmore prominent in the deaf. Both groups showed similarexpected SMA and basal ganglia activation. The hearingshowed a focus of activation not seen in the deaf in the leftsupramarginal gyrus extending towards the angular gyrus. Aregion of interest comparison was made along the posterioraspect of the inferior frontal gyrus (corresponding to theinferior aspect of Broca’s area) which showed an overall leftlateralization in the hearing but not the deaf.CONCLUSIONThese results support the hypothesis that the primary tonguessensory-motor center is relatively invariant in regard tospeech experience, but secondary sites which may showdevelopmental variation. The involvement of the temporallobe in the deaf correlates with increased involvement in thislobe in other tasks (1). Left lateralization of articulation hasbeen shown to be dependent on the linguistic content (2, 3),but also may be related to other factors such as chewingdominance (4). These differences may be relevant clinicallyin understanding the linguistic impact of lesions or for preoperativeplanning in deaf patients.REFERENCES1. Shibata DK, et al. Functional MR Imaging of Vision in theDeaf. Acad Radiol 2001;8:598-6042. Wildgruber D, et al. Functional Lateralization of SpeechProduction at Primary Motor Cortex: A fMRI Study.Neuroreport 1996;4:2791-27953. He AG, et al. Modulation of Neural Connectivity DuringTongue Movement and Reading. Hum Brain Map2003;18:222-2324. Shinagawa H, et al. Hemispheric Dominance of TongueControl Depends on the Chewing-Side Preference. J Dent Res2003;82:278-283KEY WORDS: Brain, tongue, deafnessACKNOWLEDGMENTSThe National Technical Institute of the Deaf at the RochesterInstitute of Technology, Rochester, NY provided assistancewith subjects.Sam McKennoch, Electrical Engineering, University ofWashington, assisted with data analysis.268Paper 346 Starting at 8:16 AM, Ending at 8:24 AMLack of Education and Intelligent Quotient Effects onHippocampal Activity in a Functional MR ImagingExperimentMohamed, M. A. 1 · Yousem, D. M. 1 · Kusevic, I. 1 · Caffo, B.S. 2,1· Cristinzio, C. 1 · Honeycutt, N. A. 1 · El-Dieb, A. 1 · Yassa,M. A. 1 · Bassett, S. S. 11The Johns Hopkins Medical Institutions, Baltimore, MD,2The Johns Hopkins Bloomberg School of Public Health,Baltimore, MDPURPOSEAs more individuals are now enrolled in clinical functionalMR imaging (fMRI) studies, we sought to determine theeffect of education and intelligent quotient (IQ) on fMRIhippocampal activation. We hypothesized that fMRI activation(maximum amplitudes and numbers of activated voxels)will be correlated inversely with the subject’s years of educationand IQ.MATERIALS & METHODSEighty-nine normal subjects were involved in this study (48males and 41 females) with their age ranging from 48-83years (mean 63 years, SD 7.9). The subjects’ years of educationand performance on the North American Adult ReadingTest (NAART) were recorded. The NAART scores wereconverted to both Verbal and Full Scale IQ. The fMRI paradigmused was a block design with a series of memoryencode (learning), memory recall (memorizing), and baseline(rest) periods. Statistical parametric mapping (SPM99)was used and activation maps were produced for each subject.Our regions of interest (ROI) were defined as the rightand left hippocampi. Multiple regression analysis then wasperformed between the maximum amplitudes and voxels ofactivation of the different conditions and the years of educationand IQ. The analysis controlled for age and genderbecause of our earlier findings of gender effects for this task.RESULTSThere was no significant correlation between the years ofeducation or IQ and the maximum activation amplitudes orthe number of activated voxels for either memory encode ormemory recall conditions. There was no effect of age oneither amplitude or volume of activation, however, asexpected from our previous report, there are gender differences.CONCLUSIONOur results suggest that the education and IQ have littleinfluence on the fMRI hippocampal activation in a memorytask. Thus the need to control for education and IQ effectsseems to be less critical in the analysis of a memory-basedfunctional MR imaging task.KEY WORDS: Education, intelligent quotient, fMRI
Paper 347 Starting at 8:24 AM, Ending at 8:32 AMMultifunctional Neuroimaging: Functional MR ImagingAssessment of Occipital Lobe Pathologies with VisualField LossSzeder, V. 1 · Williams, K. 1 · Wieser, J. A. 1 · Maciejewski,M. 1,2 · Janik, J. 1,2 · Hacein-Bey, L. 1 · Remler, B. F. 1 · Ulmer,J. L. 1 · DeYoe, E. A. 11Medical College of Wisconsin, Milwaukee, WI, 2 MarquetteUniversity, Milwaukee, WIPURPOSEThe advent of functional MR imaging (fMRI), created theopportunity to integrate structural and functional data into acomprehensive system for the diagnosis and management ofdifferent brain pathologies. Here we describe two illustrativecase studies in which fMRI was used in a novel way to mapvisual function in and near occipital lobe sites of cerebralpathology. The resulting data were used to create unique“functional field maps” (FFmaps) that were compareddirectly with conventional Humphrey perimetry to assess thepotential clinical utility of this approach.MATERIALS & METHODSCase 1: 58-year-old male with bilateral occipito-temporalinfarcts. Humphrey visual field testing revealed a left hemianopsiaplus partially impaired vision in the upper rightquadrant with sparing of macular vision in both the upperright and lower left quadrants. Functional MR imaging visualfield mapping was performed 1.5 years after the strokes.Case 2: 31-year-old female with history of migraineheadaches, unresponsive to medication. Initial work-uprevealed an occipital arteriovenous malformation (AVM)with no apparent visual field loss. This was followed byfMRI visual field mapping. In both cases, gradient-echo,echo-planar fMRI mapping of occipital visual cortex wasperformed using a video display of an expanding checkeredannulus followed by a rotating checkered wedge to activatesuccessive locations within the central 28 o of the patient’svisual field. Using a temporal phase mapping paradigm(DeYoe, 1996), the resulting data identified the visual fieldlocation represented by each active brain voxel within occipitalvisual cortex. These data were used to create FFmapsshowing the pattern of normal and impaired vision withineach patient’s field of view. Both patients underwentHumphrey visual field testing using the 24-2 test array.RESULTSIn Case 1, involving a post-stroke patient with chronic visualfield deficits, there was a detailed correspondencebetween the visual field maps produced by fMRI andHumphrey perimetry including fine details such as macularsparing. In Case 2 involving a patient with an active AVMpathology, the fMRI maps revealed an undetected upper leftquadrantanopsia that subsequently was verified with perimetry.However, the fMRI map also indicated a partial field lossin the lower left quadrant that could not be verified behaviorally.Thus, there was a mismatch between the fMRI andbehavioral results in the second case.269case, fMRI was able to show a field defect that had not beendetected with confrontation testing but also indicated a largerregion of impairment than could be verified behaviorally.Since the blood oxygenation level dependent (BOLD) mechanismresponsible for the fMRI signal is based on a localvasoactive response linked to neuronal activity, the apparentloss of signal likely reflected a local uncoupling of this linkage.Such uncoupling may be predictive of the potential foradditional vision impairment following surgical treatment ofthe AVM.KEY WORDS: fMRI, vision, clinicalThe authors of this work have indicated the following affiliations/disclosures:Funded by National Institutes of HealthEB00843, EY13801, RR00058 and Dana Foundation.Paper 348 Starting at 8:32 AM, Ending at 8:40 AMMR Protocol in the Confirmatory Diagnosis of BrainDeath: Analysis of 43 CasesCartaxo, H. Q. 1 · Caetano-Barros, A. 1 · Branco, F. C. 1 · CostaNeto, A. 1 · Leimig, C. 1 · Loureiro, R. 1 · Santos-Filho, P. B. 1,21Real Hospital Portugues de Beneficencia em Pernambuco,Recife, Pernambuco, BRAZIL, 2 North Carolina StateUniversity, Raleigh, NCPURPOSEWithin this work, we will demonstrate the potentials of theMR techniques of diffusion-weighted imaging, perfusionweightedimaging, and contrast-enhanced (Gd-DTPA)angiography (CE MRA) in the diagnostic confirmation ofbrain death (CD) and also death of the brain stem (BSD).MATERIALS & METHODSForty-three individuals with clinical suspicion of brain deathwere studied between 2000 and 2003. All patients were subjectedto CE MRA measurements; 33 of these patients alsohad diffusion-weighted and perfusion-weighted imaging. Allbrain death cases were confirmed by MR imaging, and allmedications and mechanical support were maintained untilthe clinical declaration of death by spontaneous cardiacarrest.RESULTSContrast-enhanced MRA brain death was positive in 77%(33/43) of the patients, with 5 cases of full intracranial arterialfilling, 3 cases of full arterial filling of the posterior circulation,and 2 cases of full arterial filling of the anterior circulation.Diffusion and perfusion were capable of confirming32 of the 33 individuals with the diagnosis of brain death,and death of the brain stem. All measurements were negativein one patient, but it so happens that eventually he came outof the state of coma. Indeed, diffusion-weighted and perfusion-weightedimaging were capable of discriminating 100%of cases.FridayCONCLUSIONFunctional MR imaging-based mapping of function in theoccipital lobe in and around a site of cerebral pathology wasaccurate in the case of chronic pathology. In the acute AVM
FridayCONCLUSIONDiffusion-weighted and perfusion-weighted imaging areaccurate techniques in the detection of brain death and itssub-types, and are to be prescribed in studies of inconclusiveintracranial macrocirculatory tests. The complete protocol,as used by Real Imagem, requires confirmatory studies byakin groups if it is to be accepted by the normative institutions,medical community, and general public as a moreinclusive and liable diagnostic tool for determining braindeath and its variants.KEY WORDS: Brain death, diffusion, perfusionPaper 349 Starting at 8:40 AM, Ending at 8:48 AMBrain Death Studied by Proton MR Spectroscopy:Definition of a Relaxation Time for Brain DeathSantos-Filho, P. B. 1,2 · Cartaxo, H. Q. 1 · Caetano-Barros, A. 1· Santos, G. B. 11Real Hospital Portugues de Beneficencia em Pernambuco,Recife, Pernambuco, BRAZIL, 2 North Carolina StateUniversity, Raleigh, NCPURPOSEThe definition of a parameter “The Relaxation Time forBrain Death” - T1(BD) is herein associated with the loss ofthe brain spectroscopic neuronal marker metabolite N-acetylaspartate(NAA), and also with the appearance and increasein the intensity of the hypoxic marker, the doublet of lactate(Lac), as measured by proton MR spectroscopy (MRS-H).MATERIALS & METHODSSixteen patients from the hospital’s neurologic intensive careunit have been studied by single voxel proton spectroscopy(SVS) in the parietal-occipital gray matter region and otherlocals, in a Siemens Sonata or Siemens Vision magnetons,field of 1.5 T, TE of 20 ms, and TR of 1,500 ms. The inclusionof the MRS-H sequences in the angio-resonance (MRA)and diffusion/perfusion-weighted imaging protocol of theReal Imagem service increased exam time by approximately4 minutes per spectrum. Usually only one spectrum is sufficientper patient.RESULTSBrain spectra from 0.0 to 4.2 ppm attest to the final and irreversiblestate of patients with brain death. MR and spectroscopymeasurements were performed in patients followingthe standard Brazilian brain death evaluation protocol, aspatients were sent to our imaging unit for complementaryMR angiography, diffusion, perfusion, and proton spectroscopyexams. The decay of the NAA signal from its normalaverage value (for the patients age group) and theappearance and growth of the Lactate doublet take place inconjunction, and are used to characterize the time, “TheRelaxation Time for Brain Death” - T1(BD) herein proposed,in analogy to the mathematical definition of a usualspin lattice T1 time. In this study, one patient presented thestate of “incarceration” or “locked in” where the parietaloccipitalgray matter and white matter had regular MRS-Hspectra and the cerebral brain stem presented an over threeday-oldbrain death spectrum.270CONCLUSIONThe definition and determination of the parameter“Relaxation Time for Brain Death” - T1(BD) by MR spectroscopy,we believe, is a relevant and unequivocal way ofpredicting and establishing the moment when the legal, ethical,familial, and religious considerations are to appreciatescientifically the process of organs donation.KEY WORDS: Brain death, spectroscopy, timePaper 350 Starting at 8:48 AM, Ending at 8:56 AMRole of Impaired Proprioception in Primary WritingTremors and Writer’s Cramp: A Functional MR ImagingStudyJayakumar, P. N. · Sahni, H. · Pal, P. K. · Balivada, S.National Institute of Mental Health and NeurosciencesBangalore, INDIAPURPOSEPrimary writing tremors (PWT) has been regarded both as afocal form of essential tremor and also as a variant of focaltask specific dystonia writer’s cramp (WC). It is not clearwhether they are different entities or form part of the spectrumof a single disorder (1, 2). Results of functional MRimaging (fMRI) across studies on patients with PWT andWC have shown both reduced and increased activations indifferent regions of the brain (1, 2). We hypothesized, therole of proprioception may explain differences in regionalactivation patterns and prospectively compared cerebral activationpatterns in patients of PWT and WC with that ofhealthy volunteers while signing on paper and in air.MATERIALS & METHODSSix subjects with PWT, three with WC and six healthy volunteerswere examined. All subjects in the study were righthanded. The volunteers and patients had no sensory impairmentor structural lesions in the brain and were not on anymedication. A total of 120 blood oxygen level dependent(BOLD), single-shot EPI acquisitions were obtained with aparadigm of 3 sets of alternating periods of 40 seconds eachof rest and signing on paper followed by 3 sets of alternatingperiods of 40 seconds each of rest and signing in air usingthe dominant right hand. SPM analysis was done using SPM99.RESULTSCerebral activation was depicted with a statistical thresholdof p = 0.05 (corrected). Group analysis was done independentlyfor each of the 3 groups of subjects for the tasks ofsigning on paper and signing in air. Slice and sectional overlayswere studied to identify the localization of various clustersof activity and their time activity curves were plottedand 3D surface rendered. As compared to normal subjects,patients with PWT showed significant activity in primarymotor (PMA) and supplementary motor areas (SMA) onboth paradigms of signing on paper and in air (3). Whilepatients with WC did not show such activities in the PMAand SMA, they showed significant activity in the contralateralcingulate gyrus and thalamus (2). Cerebellum showedreduced activation in both writer’s cramp and primary writingtremor as compared to normal subjects (Figure).
Figure: Three-dimensional rendering of fMRI activity:Patients with WT are shown in two columns on left andpatients with WC in two columns on right.CONCLUSIONCerebral activation in patients with PWT and WC differsfrom healthy individuals both with respect to regions as wellas patterns of activation both while writing on paper (withproprioceptive input) and in air (no proprioceptive input).This may suggest the role of differences in the impairedmanagement of proprioceptive inputs as a possible pathophysiologicmechanism in these disorders.271phrase tasks were counterbalanced. On each trial, a picturewas presented for 2 sec, preceded by a fixation cross for 2sec and followed by a 6-, 10-, or 14-sec inter-test interval,during which an asterisk was displayed. Each subject namedthe picture according to the single word, phrase, or sentenceinstructions given at the beginning of the run. FunctionalMR imaging data processing involved motion correction andthe generation of activation maps for each condition by usingcross-correlation of a reference waveform with the motioncorrectedEPI data on a pixel-by-pixel basis (AFNI) (Cox,1996). Data then were transformed into the TalairachTournoux coordinate space and overlaid on the 3D high-resolutionvolume data. Results were merged such that for eachof the two sessions for each participant, three datasets werecreated (single-word, sentence, and phrase).RESULTSPhrases yielded greater activity in a left inferior frontalregion relative to single words, while the sentence vs singleword comparison did not show this effect. Relative to covertresponses, overt responses produced stronger activation inlanguage-related areas (e.g., Broca’s area, superior temporalgyrus) and additional activation in motor areas.KEY WORDS: fMRI, writing tremors, writer’s crampPaper 351 Starting at 8:56 AM, Ending at 9:04 AMNeural Substrates of Lexical-Semantic WorkingMemory: Imaging Speech Planning with Functional MRImagingMahankali, S. 1 · Burton, P. C. 2 · Jackson, E. F. 1 · Martin, R.C. 21The University of Texas M.D. Anderson Cancer Center,Houston, TX, 2 Rice University, Houston, TXPURPOSEAphasic patients with lexical-semantic retention deficitshave great difficulty comprehending and producing sentencesin which several lexical/semantic representationsmust be held simultaneously (Martin & Romani, 1994;Martin & Freedman, 2001). There is some evidence thatthese deficits are associated with left frontal brain lesions(Romani & Martin, 1999), but this corroboration is based ona limited number of subjects. The present study used anevent-related functional MR imaging (fMRI) paradigm todetermine if we would find verification from young normalsubjects for the involvement of left inferior frontal gyrus inmaintaining semantic information during phrase production.MATERIALS & METHODSSeven (6 females + 1 male) young healthy volunteers participatedin this protocol that used a two (response type: overtvs covert) x three (task: single word vs sentence vs phrase)event-related design (picture description paradigm). Subjectsperformed overt and covert tasks during separate scanning(GE 1.5 T Signa Echo Speed NV/i; TR/TE/q = 2000 ms/50ms/90 0 ; 12 contiguous 6 mm thick axial slices; sella to theprimary sensorimotor hand area) sessions on different days.Each session consisted of seven runs including single word(e.g., “cup,”“new”; 3 runs); sentence (e.g., “The cup is newand blue”; 2 runs); and phrase responses (e.g., “new bluecup”; 2 runs), respectively. Additionally, the orders of overtand covert sessions and those of the word, sentence, andCONCLUSIONAs anticipated, the phrase vs single word comparison yieldedsignificant activation involving the left inferior frontalgyrus for both the covert and overt response conditions. Thesentence vs single word comparison did not show this effect.Although the phrase vs sentence comparison did not showsignificant differences in left inferior frontal regions in eitherthe overt or covert conditions, a marginally significant cluster(p < 0.10) was noted in the covert condition with deconvolutionanalysis and left inferior frontal gyrus designated aregion of interest. Testing of additional participants isplanned to increase statistical power.KEY WORDS: Brain, functional MR imaging, memoryThe authors of this work have indicated the following affiliations/disclosures:National Institutes of Health/NIDCD1R21 DC005496: Principal investigator.Paper 352 Starting at 9:04 AM, Ending at 9:12 AMCombined Morphologic, Perfusional, and FunctionalMR Examination for the Presurgical Planning ofPatients with Nonenhancing Brain GliomasCaulo, M. · De Nicola, A. · Cifaratti, A. · Torriero, N. ·Tartaro, A. · Colosimo, C.University of ChietiChieti, ITALYPURPOSEThis study aims to explore the possibility to obtain morphologicand functional data in a single MR session to predicttumor grade and tumor precise localization in respect to eloquentcortices.MATERIALS & METHODSTen patients harboring nonenhancing space occupyinglesions received morphologic MR imaging followed byfunctional (BOLDc) and perfusional evaluation in a singlesession. Perfusion imaging was acquired with a temporalFriday
Fridayresolution of 1.9 seconds, 10 seconds after an intravenousbolus of contrast material (1.0 mol/L Gadobutrol, 5 mL/sec).Maps of CBV, CBF, MTT, and TTP were calculated.Functional MR imaging with BOLD technique was performedwith a block paradigm alternating rest/control to taskconditions. Motor and language functions were explored.RESULTSPatients complained during the MR study. MR imagingrevealed nonenhancing lesions highly suspected for glioma.In 2 patients the CBV was increased in regions of the tumorshowing anaplasia at histopathology. BOLDc fMRI duringmotor tasks revealed region of activation with a good somatotopicalcongruence while language tasks allowed lateralizationof verbal functions.CONCLUSIONThe combination of three different MR studies in a singlesession is a practicable task which allows to obtain a globalassesment of the location and perfusional status of the tumoras well as a precise cortical mapping.272observations are very similar to some published short-TEspectra (1), but differ from some earlier published reports (2-5).CONCLUSIONAt TE = 144 ms, a dominant lipid peak at 1.2 ppm stronglysuggests toxoplasmosis and a dominant choline peak at 3.2ppm strongly suggests lymphoma. In questionable cases,evidence of lactate, or a 0.9 ppm lipid peak that is smallerthan the broad Glx peaks near 2.2 ppm at short TE, suggestslymphoma. Standard metabolite ratios of N-acetyl aspartate(NAA), creatine, and choline often are not helpful due tocontamination with normal tissue in the MRS voxel.Table 1. Spectral Comparison of Toxoplasmosis andLymphoma.Lymphoma ToxoplasmosisTE = 30/35 Glx >= 0.9 ppm 0.9 ppm >= GlxLactate shoulder No lactate shoulderTE = 144 Cho > 1.2 ppm 1.2 ppm > ChoLactate (negative) No lactateKEY WORDS: fMRI, perfusion, brain tumorsPaper 353 Starting at 9:12 AM, Ending at 9:20 AMThe Use of MR Spectroscopy at Two Echo Times toDifferentiate Toxoplasmosis from Central NervousSystem Lymphoma in Immunocompromised PatientsWoldenberg, R. F. · Schoenberger, E. A. · Kingsley, P. B.North Shore University HospitalManhasset, NYPURPOSETo examine the advantages of using MR spectroscopy(MRS) with long echo times (TE = 144 ms) along with shortTE (30-35 ms) to distinguish central nervous system (CNS)toxoplasmosis from lymphoma in the immunocompromisedpatient.MATERIALS & METHODSSingle-voxel MR spectra were acquired with both short andlong TE to evaluate seven lesions in immunocompromisedpatients. Diagnoses of CNS toxoplasmosis and lymphomawere considered possible based on conventional MR imagingappearance and clinical presentation. Diagnosis was confirmedvia direct pathologic correlation or response to treatmentin all lesions evaluated.RESULTSAt short TE all seven lesions had elevated lipid peaks atspectral positions of 1.2 parts per million (ppm) and 0.9ppm. Only the two lymphoma spectra had a lactate signalappearing as a small spike or shoulder on the left side of the1.2 ppm peak (Table 1). The 0.9 ppm lipid peak was smallerthan the broad glutamate + glutamine (Glx) peak at 2.2 ppmin the lymphomas, and was comparable to or larger than theGlx peak in toxoplasmosis. At TE = 144 ms, all five toxoplasmosislesions had an elevated lipid peak, while the twolymphomas did not. Both lymphoma spectra had a largecholine peak at 3.2 ppm, and a negative lactate signal at 1.3ppm which was absent from toxoplasmosis spectra. OurREFERENCES1. Danielsen ER, Ross B. Magnetic Resonance Spectroscopy ofDiagnosis of Neurological Diseases. New York, NY: MarcelDekker; 1999;196-199.2. Chang L, Miller BL, McBride D, et al. Brain Lesions inPatients with AIDS: H-1 MR Spectroscopy. Radiology1995;197(2):525-5313. Chinn RJS, Wilkinson ID, Hall-Craggs MA, et al.Toxoplasmosis and Primary Central Nervous SystemLymphoma in HIV Infection: Diagnosis with MRSpectroscopy. Radiology 1995;197:649-6544. Chang L, Cornford ME, Chiang FL, Ernst TM, Sun NCJ, MillerBL. Cerebral Toxoplasmosis and Lymphoma in AIDS. AJNRAm J Neuroradiol 1995;16(8):1653-16635. Simone IL, Federico F, Tortorella C, et al. Localized 1 H-MRSpectroscopy for Metabolic Characterization of Diffuse andFocal Brain Lesions in Patients Infected with HIV. J NeurolNeurosurg Psychiatry 1998;64:516-523KEY WORDS: MR spectroscopy, toxoplasmosis, HIVPaper 354 Starting at 9:20 AM, Ending at 9:28 AMProton MR Spectroscopy of Mesial Temporal Sclerosis:Analysis of Voxel Shape and Position to ImproveDiagnostic AccuracyImbesi, S. G. · Niku, S.University of California San Diego Medical CenterSan Diego, CAPURPOSETo determine if change in voxel shape and position willimprove the diagnostic accuracy of proton MR spectroscopyin patient evaluation for mesial temporal sclerosis.MATERIALS & METHODSIn ten consecutive patients with the diagnosis of unilateralmesial temporal sclerosis on MR imaging and/or electroencephalography,proton MR spectroscopy was performed.Using a 1.5 T MR unit (Symphony, Siemens, Erlangen,Germany) and the standard PRESS protocol with long TE(144 msec), single voxel spectroscopy was obtained in the
ight and left hippocampus and adjacent medial temporallobes. First, the standard 2 x 2 x 2 cm (total volume 8 ml)cubic voxels were placed sequentially bilaterally and spectragenerated. Then, 1 x 2 x 4 cm (total volume 8 ml) rectangularvoxels were placed sequentially bilaterally and repeatspectra generated. For these elongated rectangular voxels,the dimensions were 1 cm superior-inferior, 2 cm medial-lateral,and 4 cm anterior-posterior. With this voxel shape, moreof the entirety of the hippocampus and less of the adjacentmedial temporal lobe brain parenchyma was included in theinterrogation voxel. From each MR spectra, N-acetylaspartateto creatine (NAA/Cr) ratios and choline to creatine(Cho/Cr) ratios were obtained. The difference of NAA/Crand Cho/Cr ratios between the affected and unaffected sideswas calculated for each of the voxel types in each patient.Additionally, the mean difference and standard deviationalso was calculated for each of the voxel types.RESULTSIn all ten patients, the rectangular voxel correctly identifiedthe abnormal side with a lower NAA/Cr ratio on the affectedside compared to the unaffected side (predictive value =100%). However, the cubic voxel only identified the abnormalside in six of the ten patients (predictive value = 60%).Additionally, the mean difference in NAA/Cr ratios betweenthe affected and unaffected sides was 0.30 (s n-1 = 0.17) forthe rectangular voxel but was 0.003 (s n-1 = 0.26) for thecubic voxel; that is, there was no overall significant differencein right and left NAA/Cr ratios when using the cubicvoxel (P = 0.007). No significant correlation between theaffected and unaffected sides was found using the Cho/Crratios.273Paper 355 Starting at 9:28 AM, Ending at 9:36 AMNew Techniques in Neuroradiology:Magnetoencephalography Offers Insight into AutismRoberts, T. P. L. 1,2,3 · Ferrari, P. 1 · Oram, J. 1 · Flagg, E. 1 · Gage,N. 4 · Siegel, B. 5 · Roberts, W. 21University of Toronto, Toronto, ON, CANADA, 2 Hospitalfor Sick Children, Toronto, ON, CANADA, 3 TorontoWestern Research Institute, Toronto, ON, CANADA,4University of California Irvine, Irvine, CA, 5 University ofCalifornia San Francisco, San Francisco, CAPURPOSEMany neurologic, psychiatric, and developmental disorders,in the absence of obvious structural lesions in the brain arerelatively poorly served by conventional neuroradiology.However, emerging radiologic technologies such as magnetoencephalography(MEG) and its spatial analog, magneticsource imaging (MSI), well founded for presurgical localizationof eloquent cortex, additionally allow a characterizationof brain function in the time domain as well as in space.We applied state of the art MEG methodology to the study ofchildren with autism spectrum disorder. A characteristic featureof autism is impairment of communication ability. Onehypothesis is that this arises from an inability to processcomplex sounds and speech in auditory cortex and associatedcenters. Suggestion has been made that while processingmay occur in typical anatomical substrates, the synchronyand timing of neuronal activity is disrupted, leading toimpaired feature extraction, parsing, and processing ofacoustic and language-related information.CONCLUSIONUse of proton MR spectroscopy can be very helpful in thepatient assessment of mesial temporal sclerosis.Confirmation of the abnormal side using electroencephalography,high-resolution coronal MR imaging, and now MRspectroscopy is critical prior to temporal lobe resection (1).Use of a 1 x 2 x 4 cm rectangular voxel places more of thehippocampus in the region of interrogation and results in lesspartial voluming artifact from the adjacent brain parenchymawhich occurs with use of the standard 2 x 2 x 2 cm cubicvoxel. While this sample size is small, use of the rectangularvoxel appears to result in a much more accurate examination.REFERENCES1. Antel SB, Li LM, Cendes F, Collins DL, Kearney RE, ShinghalR, et al. Predicting Surgical Outcome in Temporal LobeEpilepsy Patients Using MRI and MRSI. Neurology2002;58(10):1505-1512KEY WORDS: MR spectroscopy, mesial temporal sclerosis,voxel shape/positionMATERIALS & METHODSWe report on the use of magnetoencephalography to studyauditory cortex of autistics, focusing on feature encoding instimulus latency, language lateralization through late fieldactivity and difference detection, as revealed by the mismatchnegativity and its magnetic field, MMNm. These threemeasures rely on the millisecond temporal resolution ofMEG, do not require subject compliance in task performance,and reveal activity at characteristic poststimulus timesranging from 100 ms to approximately 500 ms. Unlike functionalMR imaging (fMRI), MEG is ideally suited to studiesof temporal processing in auditory cortex and impairmentsof communication potentially arising from deficits at earlierstages of stimulus processing. We studied 30 children withautism (8-18 years) and age-matched controls, using tones,vowels, and consonant vowel (CV) combinations.RESULTSWhile in healthy controls, there is a pronounced impact ofstimulus tone frequency on evoked response componentlatency, suggesting “frequency encoding” in the timedomain, the frequency resolution of such stimulus toneencoding at and around the 100 ms response is compressedin autistics (especially in the RH, D (100 Hz-1k Hz) = 17 msvs 35 ms (control), p < 0.05). Furthermore, processing (150-450 ms) of simple linguistic tokens tends to occur bilaterallyin healthy developing children (as opposed to hemisphericallylateralized in adults) but there is little activity evidentin the RH of children with autism. Finally, phonetic featuredifferences (e.g. /a/ vs /u/) are associated with delayed (~350Friday
Fridayms poststimulus onset) “change detection reponses”, or mismatchfields, MMF, in children with autism, compared toage-matched controls, (D = 92 ms, p < 0.05).CONCLUSIONThese findings can be interpreted as neural correlates of processingslowing and resolution degradation in autism anddemonstrate the utility of MEG along with passive paradigmsfor the study of developmental disorders associatedwith language impairment. Techniques such as MEG whichfocus on temporal features of brain functional activity shouldbe considered as useful adjuncts to spatial brain mappingtechniques, such as fMRI, especially in the study of developmentallanguage disorders.KEY WORDS: Magnetoencephalography, autism, functionThe authors of this work have indicated the following affiliations/disclosures:1. National Alliance for AutismResearch: Support of these studies; 2. Canadian Institutes ofHealth Research: Support of these studies; 3. UC MINDInstitute: Support of these studies.274Paper 356 Starting at 8:00 AM, Ending at 8:08 AMImproved Distal Distribution of N-Butyl CyanoacrylateGlue by Simultaneous Injection of Five Percent Dextrosethrough the Guiding Catheter: Technical NoteGailloud, P. · Heck, D. · Carpenter, J. · Moore, C. · Murphy,K.The Johns Hopkins Medical InstitutionsBaltimore, MDPURPOSETo report a simple new approach to the problem of distal n-butyl cyanoacrylate (n-BCA) glue distribution for cases inwhich the lesion itself cannot be reached by superselectivecatheterization, and which does not require wedging of themicrocatheter.MATERIALS & METHODSThe technique, which involves the injection of relativelylarge volumes of 5% dextrose (60 to 120 ml) through theguiding catheter concomitantly to the n-BCA injectionthrough the microcatheter, is illustrated with four cases ofposterior fossa DAVF in which a transvenous access wasprecluded by unfavorable venous anatomy.Friday Morning8:00 AM - 9:36 AMRoom 606 - 609(65c) Interventional: General(Scientific Papers 356 - 367)See also Parallel Sessions(65a) Interventional: Aneurysms(65b) Adult Brain: Functional Imaging (fMRI, MSI,MRS, PET)(65d) Adult Brain: Vascular ImagingRESULTSFlooding the territory of the targeted vessel with 5% dextroseallows for deeper progression of the glue by delayingcontact with ionic substances and subsequent polymerization.In our experience, n-BCA glue stopped progressingonly when the dextrose injection was interrupted. Manualinjection of the 5% dextrose with 60 ml syringes thereforeprovides excellent control on the extent of n-BCA penetrationand distribution. At the same time, flooding the entiretargeted arterial tree with 5% dextrose before and during n-BCA injection seems to prevent the occurrence of early polymerizationobserved with the wedged microcatheter technique.In each of the four reported DAVF cases, the n-BCAdistribution matched the contrast agent distribution seen duringsuperselective angiography. Figure 1 illustrates the injectionof n-BCA in a posterior meningeal artery feeding astraight sinus DAVF: note the glue reaching the site of thefistula despite the extracranial location of the microcathetertip.Moderators:Glen K. Geremia, MDJacques E. Dion, MD
275CONCLUSIONWe report our experience with a technique improving thedistal progression of n-BCA glue in intricate arterial networksthat cannot be superselectively catheterized, as it isoften the case with DAVFs. In such an instance, the injectionof 5% dextrose through the guiding catheter immediatelybefore and during the superselective injection of n-BCA gluethrough the microcatheter optimizes the distal distribution ofthe adhesive agent.KEY WORDS: NBCA glue, embolization, dural arteriovenousfistulasThe authors of this work have indicated that they will be discussing/presentingan unapproved or investigative use of N-BCA glue made by Cordis Neurovascular for embolization ofDAVF.The authors of this work have indicated the following affiliations/disclosures:Cordis Neurovascular: Consultant.Paper 357 Starting at 8:08 AM, Ending at 8:16 AMEndovascular Treatment of Carotid Cavernous FistulaUsing a Combination of Metallic Stents and PlatinumCoilsMoron, F. E. · Klucznic, R. P. · Strother, C. M. · Mawad, M.E.The Methodist Hospital, Baylor College of MedicineHouston, TXPURPOSEThe ideal treatment for patients with carotid cavernous fistulas(CCF) is endovascular. Embolic materials that have beenused for this purpose include: detachable balloons, platinumcoils, fibered coils, and N-butylcyanoacrylate (NBCA). Theideal technique should preserve and reconstruct the parentartery while completely obliterating the fistula. We reportour experience using a metallic stent in the carotid artery andplatinum coils to occlude the fistula or the cavernousaneurysm responsible for the CCF.MATERIALS & METHODSThis is a retrospective study of six patients presenting withdirect (type A) CCF who were treated with stent deploymentin the ICA combined with transarterial and/or transvenousobliteration of the fistula with platinum coils. In all sixpatients platinum coils (GDCs) were used as the embolicmaterial and in two patients liquid adhesive also was used asan adjunct. In all patients, the parent artery was protectedduring the procedure with a nondetachable balloon. Accessto the venous site of the fistula was achieved through avenous approach (4/6) or via a transarterial route (2/6).RESULTSIn all six patients, the CCF was obliterated completely usingthis combined technique. The ICA was preserved in all 6patients. The clinical outcome was excellent in all patientsexcept for residual posttraumatic cranial nerve injury in onepatient.CONCLUSIONCombined endovascular techniques using a metallic stent toreconstruct the parent artery and embolic material (platinumcoils) to obliterate the AV shunt can be used in the successfultreatment of CCF while preserving the ICA.KEY WORDS: Carotid cavernous fistula, metallic stent,embolizationPaper 358 Starting at 8:16 AM, Ending at 8:24 AMEmbolization of Cavernous Sinus Dural ArteriovenousFistulae with Type IV Inferior Petrous SinusLiu, H. · Wang, Y. · Chen, Y. · Hsieh, H.National Taiwan University HospitalTaipei, TAIWAN REPUBLIC OF CHINAPURPOSEInferior petrous sinus (IPS) approach is the first choice oftreatment of cavernous dural AVF (CSAVF) in many centers.However, this approach depends on the status of IPS on thelesion side. Type IV IPS drainage means no direct communicationbetween the IPS and internal jugular vein (bulb).MATERIALS & METHODSWe report 22 cases of CSDAVF with type IV IPS that weencountered in the last 4 years. Sixteen cases were femaleand 5 were male. Their age ranged from 45 to 71 years.Sixteen cases had increased introcular pressure and 3 caseshad seizures attached.RESULTSThey all had cortical drainage in the angiography study andipsilateral type IV was noted in 13 cases and bilateral notedin 9 cases. All of the 13 cases with unilateral type IVdrainage were treated successfully by contralateral IPSapproach. In the 9 cases with bilateral type IV drainage, 1was treated via the superior petrous sinus, 1 via the posteriorcondylar vein, 2 via the facial vein, 1 vein the contralateralfacial vein, 1 via the paraspinal venous plexus, and 3 ofthem failed to be treated via transvenous approach. In these3 cases, 1 was treated via the meningohypophyseal trunck, 2via multiple transarterial approaching. All of them weretreated successfully. One case suffered from transient 6thcranial nerve palsy.Friday
Friday276CONCLUSIONPaper 360 Starting at 8:32 AM, Ending at 8:40 AMThe outcome of TVE for CSDVF is good and the complicationrate is low. The success of TVE depends on the drainageSerial Angiographic and Angioscopic Evaluation ofstatus of the cavernous sinus. Transvenous approach is the Neointimal Changes after Aneurysm Treatment withtreatment of choice for CSDAVF and if it is impossible to Cerecyte Bioactive Coils in Dogstreated with TVE, transarterial approach is a very promisingalternative treatment.Miskolczi, L. · Onizuka, M. · Cesar, L. · Wakhloo, A. K.University of MiamiKEY WORDS: Arteriovenous fistula, dura, sinus, petrous Miami, FLsinusPaper 359 Starting at 8:24 AM, Ending at 8:32 AMThree-Dimensional Rotational Angiography Using thePropeller Rotation for the Evaluation of IntracranialAneurysmsGauvrit, J. 1 · Leclerc, X. 1 · Lubicz, B. 1 · Despretz, D. 2 ·Lejeune, J. 1 · Pruvo, J. 11Salengro Hospital, Lille, FRANCE, 2 Philips MedicalSystem, Suresnes, FRANCEPURPOSEThree-dimensional digital subtraction angiography (3D DSA) is used routinely for the evaluation of intracranialaneurysms. Technical progress including the “propeller rotation”recently has been achieved allowing larger range ofrotation and faster rotational speed. Our purpose is to evaluatethe potential advantages of this new technique for theassessment of intracranial aneurysms.MATERIALS & METHODSFrom November 2002 to March 2003, 23 patients with 24aneurysms admitted for a subarachnoid haemorrhage (SAH)underwent 3D DSA with both standard and propeller rotations.The range of rotational angiographies extends over180° for standard 3D DSA and 240° for propeller technique.Volume of 16 and 28 ml of contrast material was injectedinto the internal carotid artery or the vertebral artery for standardrotation vs 9 and 16 ml for propeller rotation. Both techniqueshave been compared for the assessment of aneurysmmorphology and its relation to the neighboring vessels.RESULTSOverall image quality was optimal in all cases. Aneurysmswere visualized and localized correctly by both techniques.A vessel incorporation into the neck was present in 10 casesincluding one that was judged poorly visualized by using thestandard 3D DSA technique and accurately visualized byusing the propeller rotation technique.CONCLUSIONThree-dimensional DSA using the propeller rotation techniqueseems to be effective and allows to reduce the amountof contrast material related to the shortened acquisition time.In our series, the image quality was excellent in all caseswith optimal anatomical information. This technique probablywill replace the standard technique in the near future.KEY WORDS: 3D DSA, aneurysmsPURPOSENeointimal thickness at the aneurysm neck is considered agood predictor of stable aneurysm coiling. It is difficult toevaluate neointimal thickness in the same group of animals:angiography is not sensitive enough; histology requires a terminalprocedure so the same artery cannot be evaluated atmultiple time points. Angioscopy provides direct visualizationof tissue thickness covering metal structures. Visualestimates of tissue thickness can be performed after obtainingsome experience using histopathologic comparison. Ourgoal was to evaluate changes of neointimal thickness at theaneurysm neck between 3 and 6 months post-embolizationwith Cerecyte bioactive coils (Micrus Corporation).MATERIALS & METHODSFive surgically created aneurysms were embolized withPGA-treated coils in three heparinized dogs. Packing density,neck remnant, coil protrusion, and parent vessel compromisewere assessed with angiography immediately after coiling.Follow-up angiography and angioscopy was performedat 3 and 6 months. At 6 months the arteries were harvestedand angioscopic results were compared to histology. Finally,neointimal thickness was assessed in a retrospective fashionbased on the 3- and 6-month angioscopic recordings. Tissuethickness over platinum coils was estimated based on tissueopacity. No opacity (clear visualization of coils) means notissue on the coils. Coils covered with tissue thicker than 250microns cannot be seen. Between 0 and 250 micron the coveringneointimal tissue causes gradual loss of visualizationof coils.RESULTSAll aneurysms featured wide neck that limited dense packing.Suboptimal packing was achieved in three, dense in twocases. Coil protrusion was seen in four, neck remnant in twocases. Radiopacity and mechanical properties felt similar toregular coils. At 3 months excellent endothelial coveragewas observed even where wide gaps existed between coils.One aneurysm had a small proximal dog-ear, as evidencedby both angiography and angioscopy. A second aneurysmhad a distal neck remnant, indicated by angioscopy only. Nocoil-compaction was observed. All protruding coils had thinendothelial coverage without causing lumen compromise.Histology revealed endothelial thickness between 176 and488 microns at the aneurysm neck. When comparing 6month findings to the 3-month results, coil protrusion andthe neck remnants remained unchanged by 6 months. Therewas no significant difference in the neointimal thicknesswhen evaluating the same areas as at 3 months.The authors of this work have indicated the following affiliations/disclosures:Philips Medical Systems: Employee.
CONCLUSIONExcellent endothelial coverage of the aneurysm neck wasachieved using Cerecyte coils, without parent vessel compromise,as observed by histology and angioscopy at 6months. These results provided the correlation between thetwo techniques allowing for neointimal thickness evaluationat intermediate time points. Based on these results it is concludedthat, as observed by angioscopy, a thick neointimallayer was fully developed by 3 months.KEY WORDS: Aneurysm, coil, bioactiveThe authors of this work have indicated the following affiliations/disclosures:Micrus Corporation: Research support.Paper 361 Starting at 8:40 AM, Ending at 8:48 AMCovered Stents for the Treatment of ArteriovenousFistulas and PseudoaneurysmsGomez, F. 1 · Escobar, W. 1 · Vargas, S. 21Centro Medico Imbanaco, Cali, COLOMBIA, 2 Hospital SanVincente de Paul, Medellin, COLOMBIAPURPOSETo demonstrate that the covered stent is the best therapyoption to preserve the parent vessel in traumatic vascularinjury such as arteriovenous fistulas and pseudoaneurysms.MATERIALS & METHODSA total of 14 patients, 13 men and 1 woman, with agesbetween 15-58 years with traumatic vascular injury in headand neck were treated These patients exhibited pseudoaneurysmslocated in the common carotid, cervical carotid,petrous carotid artery, and subclavian artery. The types of fistulaswere vertebral arteriovenous, carotid-jugular andcarotid cavernous. In the latter, success depends on location,the most complex being the ones located in segments 1 and2 of the cavernous portion of the carotid.RESULTSFourteen patients were treated with covered stent. No neurologiccomplications occurred as a result of covered stentdeployment. All patients had follow-up examinations withstandard angiography, performed at 3 to 36 months. In onepatient neo intimal hyperplasia was documented at threemonths follow-up without restriction to the flow, 2 CCFwere incomplete after stent deployment and it was necessaryto complete the occlusion with histoacryl.CONCLUSIONCovered stents are the best treatment option for pseudoaneurysmsand arteriovenous fistulas because it allowspreservation of the parent vessel. This technically has agreater complexity in segments 1 and 2 of the cavernouscarotid artery because of the characteristics of the materialand the anatomy of the siphon.277Paper 362 Starting at 8:48 AM, Ending at 8:56 AMStenosis Following Suture-Mediated ArteriotomyClosure: Experience with the Perclose DeviceShownkeen, H. · Coleman, C. · Ortiz, C. · Hall, M.Loyola University Medical CenterMaywood, ILPURPOSESuture-mediated arteriotomy closure devices have beenshown to be effective in postcatheter groin managementcompared to manual pressure. We describe our experiencewith the perclose arteriotomy closure device. We also look atthe stenosis rate in patients who had multiple catherizations,and repeat perclose management.MATERIALS & METHODSWe reviewed 1330 femoral artery punctures performed from08/10/99 to 12/05/03. Within this sample, 1114 puncturesites met the criteria for perclose attempt, and the remaining216 were managed by direct pressure. Of the sites where perclosewas attempted, hemostasis was achieved in 1040.Hemostasis was achieved by direct pressure in the remainingsites where perclose failed. There were 350 percloseattempts at sites where perclose had been done previously.Nineteen of the failed perclose attempts were at sites wherethere was prior perclose management. We compared theexternal iliac angiograms in the sites where there was previousperclose in to see if there was evidence of interval stenosis.RESULTSThe overall perclose success rate 93% and the overall complicationrate 0.4% when the perclose was successful (2pseudoaneurysms, 1 infection, 1 hematoma). In the patientsthat had been perclosed previously had a 95% success rateand 0% complications. The complication rate was 5% (1 psedoaneurysm,2 hematomas, 1 excessive bleeding) in thegroup where perclose was attempted and failed, and 2% inthe direct pressure group (1 pseudoaneurysm, 3 hematomas).We found a stenosis rate of less than 2% at arteriotomy sitesin which a prior perclose procedure was performed, andnone of these were hemodynamically significant with lessthe 20% luminal compromise.CONCLUSIONSuture mediated arteriotomy devices such as perclose are asafe way to manage arterial puncture postfemoral arterycatherization in patients for diagnostic and interventionalpatients. Approximately 30% percent of the patients werefully heparinized. Our experience is that repeat perclose useis also safe and effective.KEY WORDS: Perclose, angiography, hemostasisFridayKEY WORDS: Covered stent, pseudoaneurysms, arteriovenousfistulas
FridayPaper 363 Starting at 8:56 AM, Ending at 9:04 AMMechanical Thrombectomy for Acute StrokeVersnick, E. J. · Marks, M. P. · Marcellus, M. L. · Do, H. M.Stanford UniversityStanford, CAPURPOSEIntraarterial thrombolysis has been shown to be of benefit inthe treatment of acute ischemic strokes (1). However,recanalization rate, time to recanalization, and hemorrhagiccomplications may be improved with mechanical thrombectomy.This study evaluated the results using a protocol of primarythrombectomy for acute thromboembolic stroke.MATERIALS & METHODSAll patients seen with anterior circulation strokes < 8 hoursduration and postcirculation strokes < 12 hours durationwere treated with this endovascular protocol during a 10-month period in 2003. Patients were excluded if they werecandidates for IV tPA (0-3 hours). Treatment was with eitherthe Concentric Retriever (Concentric Medical) or theNeuronet Retriever (Guidant Corp). Retrieval was augmentedby low dose IA tPA (< 10 mg total dose) if revascularizationwas suboptimal. Outcome was measured using theNIHSS at presentation, 24 hours postprocedure, 5 days postprocedure/ortime of discharge and at 1 month.278the anterior circulation more rapidly and completely. A largerrandomized series of patients will be needed to establishefficacy of the therapeutic approach.REFERENCES1. Furlan A, Higashida R, Weshsler L, et al. Intra-arterialProurokinase for Acute Ischemic Stroke. The PROACT IIStudy: A Randomized Controlled Trial. JAMA1999;282:2003-2011KEY WORDS: Ischemic stroke, thrombolysisThe authors of this work have indicated that they will be discussing/presentingand unapproved or investigative use ofthe Neuronet Retriever made by Guidant Corp. forthrombectomy.Paper 364 Starting at 9:04 AM, Ending at 9:12 AMIntracranial Angioplasty without Stenting forSymptomatic Atherosclerotic Stenosis: Long-TermFollow-UpMarks, M. P. · Marcellus, M. L. · Do, H. · Steinberg, G. K. ·Tong, D. C. · Albers, G. W.Stanford UniversityStanford, CARESULTSTen patients were treated, six with anterior circulationstrokes, three with posterior circulation strokes and one withembolic strokes involving both anterior and posterior circulations.Eight of ten (80%) were revascularized successfully(TIMI 3). The two patients not revascularized had posteriorcirculation strokes. One patient could not be treated due toproximal vessel tortuosity and one patient suffered amicrowire perforation prior to complete revascularization.The Neuronet device was used in three and the ConcentricRetriever device in five cases where successful revascularizationoccurred. Three cases required tPA (mean dose 9.7mg) to aid revascularization. No patients had asymptomaticor symptomatic hemorrhages posttreatment. Mean time fromonset of symptoms to initiation of procedure was 6 hours(5.3 hours for anterior circulation and 7.0 hours for posteriorcirculation). Time for recanalization from the start of theprocedure was 0.2-1.8 hours for the six anterior circulationstrokes (mean 1.17 + 0.58). Only two of the posterior circulationstrokes were revascularized in a mean procedure timeof 2.75 + 1.34 hours. The NIHSS at time of presentation was9-42 (mean 25 + 11.5). There were four deaths within 24hours and an additional death at 48 hours. All 5 had posteriorcirculation strokes. The mean NIHSS at presentation inthe patients that died was 34.8 + 6.1. The mean NIHSS atpresentation in the surviving patients was 15.2 + 4.5. Themean NIHSS at 24 hours in the survivors was 9.0 + 7.7. Themean NIHSS at 5 days was 5.6 + 7.2. At 30 days the NIHSSwas 3.0 + 3.1.CONCLUSIONThis preliminary experience suggests acute stroke treatmentwith mechanical thrombectomy may improve recanalizationrates and time to recanalization compared to IA thrombolysis(1). These thrombectomy devices appear to revascularizePURPOSEEndovascular therapy for intracranial stenosis may be doneusing primary stenting or angioplasty alone. Proponents ofstenting have suggested it may improve outcome and assistwith complications such as dissection (1, 2). This study wasundertaken to assess the efficacy and long-term outcome ofangioplasty without stent placement for patients with symptomaticintracranial stenosis.MATERIALS & METHODSThirty-six patients with thirty-seven symptomatic atheroscleroticintracranial stenosis underwent primary balloonangioplasty. All patients had symptoms despite medical therapy.Peri-procedural angiograms were assessed for pre andposttreatment stenosis and evidence of dissection. Thirtyfourof 36 patients were available for follow-up ranging from6-128 months. Mean follow-up was 52.9 months.RESULTSMean pretreatment stenosis was 84.2% prior to angioplastyand was 43.3 % after angioplasty. The peri-procedural deathand stroke rate (up to 30 days following procedure) was8.3% (two deaths and one minor stroke). Two patients hadstrokes in the territory of angioplasty at 2 and 37 monthspostangioplasty. The annual stroke rate in the territory appropriateto the site of angioplasty was 3.36%. The annualstroke rate in the territory appropriate to the site of the angioplastyfor those patients with a residual stenosis of > 50% (N= 18) was 3.00%. Patients with iatrogenic dissection (N =11) did not have TIAs or strokes following treatment.CONCLUSIONLong-term follow-up suggests that intracranial angioplastyreduces the risk of further stroke in symptomatic patients.Residual stenosis of > 50% or evidence of iatrogenic dissectionat the time of angioplasty do not appear to confirm ahigher risk of stroke in follow-up.
279REFERENCES1. Gomez C, Orr S. Angioplasty and Stenting for PrimaryTreatment of Intracranial Arterial Stenoses. Arch Neurol2001;58:1687-16902. Mori T, Kazita K, Chokyu K, Mima T, Mori K. Short-TermArteriographic and Clinical Outcome after CerebralAngioplasty and Stenting for Intracranial Vertebrobasilarand Carotid Atherosclerotic Occlusive Disease. AJNR Am JNeuroradiol 2000;21:249-254KEY WORDS: Angioplasty, stent, intracranial atherosclerosisPaper 365 Starting at 9:12 AM, Ending at 9:20 AMIntraarterial Thrombolysis for Stroke in Under 6 Hours:One Institution’s ExperienceBourekas, E. C. · Slivka, A. P. · Shah, R. · Fetko, N. · Triola,C. · Kogut, M. · Christoforidis, G. A. · Mohammad, Y. ·Slone, W.The Ohio State University Medical CenterColumbus, OHPURPOSEIntraarterial (IA) thrombolysis has shown promise in thetreatment of acute ischemic stroke. The PROACT II (Prolysein Acute Cerebral Thromboembolism II) trial concluded thatpatients with middle cerebral artery occlusions treated withIA recombinant prourokinase (r-proUK) within 6 hours ofthe onset of acute stroke had significantly improved clinicaloutcome. Although the results of the trial did not lead toFDA approval of a specific drug, the results of this trial areconsidered convincing evidence by the American Society ofInterventional and Therapeutic Neuroradiology (ASITN)and the Society of Interventional Radiology (SIR) that IAthrombolytic therapy is an acceptable and appropriate therapyfor acute stroke. We prospectively treated patients withacute ischemic strokes within 6 hours of the onset of symptomswith intraarterial thrombolytics and report our institution’sexperience.MATERIALS & METHODSA total of 71 patients with angiographically demonstratedocclusions were treated with urokinase (25/71), rt-PA(43/71), or r-proUK (3/71) within 6 hours of stroke onset.The primary outcome was based on the percentage ofpatients with no or minimal neurologic disability at 30-90days as indicated by a modified Rankin Scale (mRS) scoreof 0-2. Patients with prestroke disability, with a mRS ofgreater than 2, were considered to have a good outcome ifthere was no change in their mRS. Secondary outcomesincluded recanalization rates, frequency of intracranial hemorrhagewith neurologic deterioration, and mortality.RESULTSThe average age of the patients treated was 65 years (range15-90 years) with 49% being females. The median admissionNational Institutes of Health Stroke Scale (NIHSS)score was 16. Fifty-four percent (34/64 patients, 8 lost to follow-up)of treated patients had a good outcome. The recanalizationrate was 70%, with 44% demonstrating completerecanalization. The symptomatic intracranial hemorrhagerate was 8% (6/71) and mortality 14% (9/63).CONCLUSIONIntraarterial thrombolysis performed within 6 hours of onsetof symptoms of acute ischemic stroke can result in improvedoutcomes, high recanalization rates, low frequency of symptomaticintracranial hemorrhage and low mortality.KEY WORDS: Thrombolysis, stroke, tissue plasminogen activatorPaper 366 Starting at 9:20 AM, Ending at 9:28 AMAngiographic Collateral Scales for IntraarterialThrombolysisLiebeskind, D. S. 1 · Sayre, J. W. 2 · Weigele, J. B. 1 · Bagley,L. J. 1 · Hurst, R. W. 11University of Pennsylvania, Philadelphia, PA, 2 University ofCalifornia Los Angeles, Los Angeles, CAPURPOSECollateral circulation is a critical determinant of outcome inacute ischemic stroke. Angiographic demonstration of leptomeningealcollaterals during intraarterial thrombolysismay be used for therapeutic and prognostic considerations.Numerous angiographic grading systems incorporate elementsthat assess the collateral circulation, employing differentcriteria that may vary with the site of vascular occlusion,corresponding collaterals, and available injections. Wesystematically evaluated all published or presented angiographicgrading systems with respect to the collateral circulationin a consecutive case series of intraarterial thrombolysis.MATERIALS & METHODSAll published or presented angiographic grading systems (n= 19) were used to score the extent of the collateral circulationon prethrombolysis injections of the affected territory in58 cases (median age 65 years, range 18-93 years; 36:22M:F) of intraarterial thrombolysis performed at a single center.A novel measure, the angiographic collateral ratio(ACR), compared arterial conduction times in ischemic andnonischemic regions. Angiographic scores were converted tonumeric data with scale comparisons based on each vascularterritory.RESULTSPrethrombolysis injections of the affected vascular territorywere reviewed in occlusion of 18 M1 MCA segments, 9 M2MCA segments, 11 ICA, 17 basilar arteries, 2 vertebral arteries,and 1 PCA. Including the novel angiographic collateralratio, 19 scales were applicable in cases of M1 MCA occlusion,18 in anterior M2 MCA occlusion, 14 in posterior M2MCA occlusion, 19 in ICA occlusion, and 12 in vertebral orbasilar occlusion. The angiographic grading systems included5 binary scales and up to 8 scores per scale. The scalesfrequently were inapplicable due to inavailability of proximalinjections that adequately depict all potential collateralsources. Frequent agreement was noted across scales incases of poor or no collaterals, yet considerable discrepancywas noted when subtotal occlusion was present.Discriminant ability varied across scales, with limited applicationof binary scales. The ACR provided an objectivenumeric score that could be abstracted even when proximalinjections were unavailable.Friday
Friday280postprocedure. The patients underwent diagnostic cerebralangiograms. All patients had complete basilar occlusion andwere treated with a combination of IA rtPA by superselectivecatheterization and IA Abciximab (Reopro). Heparin wasused only in flush solutions. The patients underwent postprocedureCT scans to document hemorrhage, edema, andextent of infarcts.CONCLUSIONAngiographic grading systems for collateral circulation varyconsiderably. Angiographic collateral scales are dependenton the site of vessel occlusion, definition of the ischemic territory,consideration of potential collateral sources, andavailability of proximal injections. The ACR, a quantitativeratio of arterial conduction times, may facilitate correlationof angiographic collaterals with ischemic markers on perfusionmodalities.REFERENCES1. Liebeskind DS. Collateral Circulation. Stroke 2003;34:2279-22842. Kucinski T, Koch C, Eckert B, et al. Collateral Circulation Isan Independent Radiological Predictor of Outcome afterThrombolysis in Acute Ischaemic Stroke. Neuroradiology2003;45:11-183. Higashida RT, Furlan AJ, Roberts H, et al. Trial Design andReporting Standards for Intra-Arterial CerebralThrombolysis for Acute Ischemic Stroke. Stroke 2003;34:109-137RESULTSThere were no procedural complications. The postprocedurescans did not reveal any new hemorrhage or edema. Onepatient who had symptoms following GDC embolization ofbasilar tip aneurysm had complete recanalization of the basilarartery with complete resolutions of symptoms. Theremaining patients all showed partial recanalization with nosignificant alteration in mental status.CONCLUSIONThe findings of this small pilot study show that addingGpIIb/IIIa inhibitor to thrombolytic therapy did not causesignificant complications with any of the patients showingnew hemorrhage or significant increase in edema. The onlypatient to present within 3 hours of symptoms showed completeresolution of symptoms. These results are encouragingand a larger study to demonstrate the risk of bleeding andevaluate clinical benefit of this combination treatment arewarranted. The application of these regimens to the anteriorcirculation stroke also can be studied.KEY WORDS: Stroke, thrombolysis, abciximabKEY WORDS: Collateral circulation, thrombolysis, strokePaper 367 Starting at 9:28 AM, Ending at 9:36 AMCombination Treatment Fibrinolytics with Abciximab inPosterior Circulation Stroke: Pilot Study for SafetyGhodke, B. V. · Britz, G. · Eskridge, J. M.University of WashingtonSeattle, WAPURPOSEAcute stroke due to occlusive vascular disease is a leadingcause for morbidity and mortality. Current therapies foracute stroke include IV thrombolytic therapy or IA thrombolysis,within a therapeutic time window. There have beenmultiple studies describing benefits of adding GpIIb/IIIainhibitor antiplatelet agents to thrombolytics in acutemyocardial infarction.We undertook this study to evaluatethe safety of GpIIb/IIIa inhibitor antiplatelet agents administeredin conjunction with IA thrombolytics for acute strokein the posterior circulation where outcomes traditionallyhave been poor despite optimal thrombolytic therapy.MATERIALS & METHODSSix patients who presented with acute posterior circulationstroke were admitted to the University of WashingtonMedical Center and Harborview Medical Center. Baselineneurologic evaluation was performed. All patients had significantneurologic impairment with locked in syndrome.These patients presented within 12 hours after onset ofsymptoms and underwent CT scans to rule out hemorrhage.One patient had a GDC coil embolization of an unrupturedbasilar tip aneurysm and presented with symptoms 3 hoursFriday Morning8:00 AM - 9:30 AMRoom 611 - 612(65d) Adult Brain: Vascular Imaging(Scientific Papers 368 - 378)See also Parallel Sessions(65a) Interventional: Aneurysms(65b) Adult Brain: Functional Imaging (fMRI, MSI,MRS, PET)(65c) Interventional: GeneralModerators:Katie Dieu-Thu Vo, MDJohn L. Go, MD
281Paper 368 Starting at 8:00 AM, Ending at 8:08 AM Paper 369 Starting at 8:08 AM, Ending at 8:16 AMImproved Discrimination of High-Grade Carotid Reducing the Overestimation of Carotid Stenosis inStenoses with Supplemental Focused Axial Bolus Contrast-Enhanced MR Angiography: Flow ModelGadolinium MR AngiographyOptimization with In Vivo ConfirmationKaufmann, T. J. · Krecke, K. N. · Kallmes, D. F. · Huston, J.Mayo ClinicRochester, MNPURPOSETypical coronal bolus gadolinium MR angiography (MRA)techniques provide an excellent overview of the arterial vasculaturein the neck. However, this technique does not provideadequate spatial resolution to accurately discriminatebetween luminal diameter stenoses greater than 50%, secondaryto the slice thickness in the z-axis. We present a supplemental,focused, axial bolus gadolinium MRA sequenceproviding improved spatial resolution to more accuratelyrepresent high-grade carotid stenoses.MATERIALS & METHODSOur existing coronal bolus gadolinium MRA neck techniquewas modified to emphasize spatial resolution in the axialplane. One-half millimeter square pixel size, in the axialplane, was chosen in order to provide accurate characterizationof a gadolinium-enhanced lumen as small as 1.0 mmdiameter, based on the Nyquist Criteria for digital sampling.Iterative adjustments to sequence parameters were performedon 30 patients with suspected carotid occlusive diseaseto generate a robust pulse sequence meeting the goalsfor spatial and contrast resolution. Base parameters: 3Delliptical centric encoding, axial plane, 3D mode, NEX = 1,TE = minimum, flip angle = 45, bandwidth = 32, ZIP x 2,ZIP 512, gadolinium injection = 25 cc at 3 cc/sec.RESULTSBolus gadolinium MRA parameters can be adjusted toimprove spatial resolution in the axial plane from 1.5 mm to0.5 mm thereby theoretically allowing accurate characterizationof residual patent lumen from 3.0 mm to 1.0 mm diameter.Given average internal carotid luminal diameters inhumans, this allows accurate discrimination of luminaldiameter stenoses to 80% luminal diameter narrowing.Optimized parameters for axial acquisition: FOV = 25 cm,phase FOV = 0.5, freq. direction = R/L, slice thickness = 1mm, slices = 70, matrix = 512 x 256, scan time 1:20, scanvolume centered on stenosis in SI and AP planes. Bolus timingand gadolinium volume are copied from the coronalbolus MRA sequence.CONCLUSIONA second bolus gadolinium MRA sequence, optimized forspatial and contrast resolution in the axial plane at the levelof known stenosis, can characterize luminal diameter stenosisdown to 80%, providing important discrimination ofstenoses near the 70% NASCET criterion.KEY WORDS: MR angiography, carotid stenosisVaid, R. · Rapp, J. H. · Saloner, D.University of California San FranciscoSan Francisco, CAPURPOSEContrast-enhanced MR angiography (CE MRA) has beenreported to overestimate the severity of carotid artery stenosiswhen compared to time-of-flight (TOF) MRA. The objectivesof this study were to systematically investigate potentialsources for this discrepancy and to optimize the parametersfor CE MRA in vitro by using a carotid phantom flowparadigm. Finally, we sought to prospectively validate the invitro findings by evaluating patients with known carotid diseaseusing optimized MR parameters established by thecarotid phantom studies.MATERIALS & METHODSA set of carotid phantoms with stenosis greater than 70%was employed for the in vitro studies. High resolution MRimages of the lumen of carotid plaques excised en bloc werereproduced in acrylic by laser polymerization. Using a lostwax casting technique, silicone negative molds were createdaround wax reproductions of the acrylic lumen. The phantomsthen were perfused with a glycerol and water mixture.Gadolinium was added for the CE MRA experiments in concentrationssimulating physiologic conditions. Time-offlightMRA was compared to CE MRA. Systematic alterationsof various MR parameters allowed for assessment ofthe effects of differences in through-plane resolution, thetime between injection of gadolinium and scan acquisition,and flow-related phenomenon (including the direction of thephase encoding gradient and the presence or absence of flowcompensation) on CE MRA. The image appearance wascompared also across different phantom geometries. Patientswith known carotid stenosis then were evaluated to validatethe findings established by the carotid phantom studies.RESULTSDegraded images were demonstrated when the frequencyencoding gradient was applied along an axis parallel to thedirection of flow. Standard implementation of CE MRAeliminates flow compensation and that was shown to contributeto image degradation. Marked improvement in imagequality was demonstrated in flow models by orienting thefrequency encoding gradient perpendicular to the directionof flow. This effect also was demonstrated clearly in patientswith carotid stenosis. The model also was shown to corroboratenumerous findings relating to CE MRA that have beenreported in clinical studies including marked signal dropoutin areas of stenosis when compared to TOF MRA, the detrimentaleffects of suboptimal delays between infusion of contrastmedia and scan acquisition, and the deterioration of thesignal-to-noise ratio with increased through-plane resolution.Friday
FridayCONCLUSIONContrast-enhanced MRA imaging using a carotid phantomflow paradigm demonstrates that several flow-related phenomenacontribute to a loss of ability to accurately characterizethe degree of luminal stenosis. In particular, orientationof the frequency encoding gradient is an importantdeterminant of image quality, an effect validated in patientswith carotid stenosis. Clearly, these parameters need to betaken into consideration if CE MRA is to be used in theassessment of carotid artery stenosis.KEY WORDS: Carotid artery stenosis, contrast-enhancedMRA, carotid phantom modelPaper 370 Starting at 8:16 AM, Ending at 8:24 AMSpontaneous Cervicocephalic Arterial Dissection inOlder AdultsLiebeskind, D. S. · Rastogi, S. · Weigele, J. B. · Luciano, J.M. · Hurst, R. W.University of PennsylvaniaPhiladelphia, PAPURPOSESpontaneous cervicocephalic arterial dissection is a commoncause of stroke in young adults, yet this diagnosis is characterizedpoorly and rarely entertained in older individuals. Wecharacterized spontaneous cervicocephalic arterial dissectionin older adults to emphasize that dissection is a pathophysiologicmechanism that may be associated with vasculardisease in all age groups.MATERIALS & METHODSRetrospective review of spontaneous cervicocephalic arterialdissection in individuals greater than 50 years old, withabstraction and analysis of clinical and radiographic data.Dissections were identified with CT angiography (CTA),axial fat-saturated T1-weighted MR imaging with MRangiography, or conventional angiography. We noted dissectionlocation, mutlivessel involvement, and the presence ofdissecting aneurysms. Parenchymal lesions and other angiographicfindings were documented.RESULTSSpontaneous cervicocephalic arterial dissection was diagnosedin 50 cases (median age 58.8 years, range 50.6-79.8;30 women, 20 men). Dissections were diagnosed initiallywith CTA in 9 cases, MR imaging/MR angiography in 27,and conventional angiography in 14. Carotid dissectionsoccurred in 25/50 cases, with vertebral dissections in 26/50.Isolated dissections were noted in 40 cases, with 2 vesselsdissected in 8, 3 vessels in 1, and 4 vessels in 1. Dissectinganeurysms were noted in only 18/50 cases. Fibromusculardysplasia (FMD) was evident in 11/50 cases (median age58.2, range 50.6-69.2; 8 women, 3 men). Atheroscleroticfindings manifest as small vessel ischemic disease or angiographiclesions were observed in 30/50 cases (median age64.7, range 54.2-79.8; 16 women, 14 men). ConcomitantFMD and atherosclerosis occurred in 8/50 cases.282CONCLUSIONSpontaneous cervicocephalic arterial dissection may occurin older adults, possibly involving multiple vessels and frequentlywithout evidence of a dissecting aneurysm.Atherosclerosis or FMD may be noted in the majority ofcases. Atherosclerosis may be a predisposing factor for cervicocephalicarterial dissection.REFERENCES1. De Baets P, Delanote G, Jackers G, De Puydt P, Wilms G.Atherosclerosic Dissection of the Cervical Internal CarotidArtery—A Case Report. Angiology 1990;41:161-163KEY WORDS: Dissection, atherosclerosis, agePaper 371 Starting at 8:24 AM, Ending at 8:32 AMMultislice CT Angiography in Diagnosing VertebralArtery Dissection: Comparison with CatheterAngiographyChen, C. · Tseng, Y. · Hsu, H. · Lee, T.Chang Gung Memorial HospitalTaipei, TAIWAN REPUBLIC OF CHINAPURPOSETo assess the sensitivity and specificity of a routine standardizedmultislice CT angiographic protocol for the detectionof vertebral artery (VA) dissection.MATERIALS & METHODSMultislice CT angiograms of 17 patients with VA dissectionand 17 control subjects were reviewed retrospectively. Theacquisition protocol for multislice CT angiography was 1.25mm nominal section thickness, a table speed of 7.5 mm perrotation (9.4 mm/sec), and a 0.8 second gantry rotation period.Maximum intensity projection and axial source imagesof the VAs were assessed by two radiologists. The sensitivityand specificity of multislice CT angiography in revealingVA dissection were determined.RESULTSCatheter angiography depicted 15 normal and 19 dissectedVAs (including 5 stenotic-, 7 occlusive-, and 7 aneurysmaltypedissections) in the patient group and 28 normal and 6atherosclerotic VAs in the control group. Multislice CTangiography enabled successful diagnosis of all (100%) ofthe 19 dissected VAs and 48 (98%) of the 49 nondissectedVAs, but misplaced a severe atherosclerotic lesion as ananeurysmal-type dissection. The sensitivity, specificity,accuracy, positive and negative predictive values of multisliceCT angiography in diagnosing VA dissection was 100%, 98 %, 98.5 %, 95 %, and 100%, respectively.CONCLUSIONIn this series, multislice CT angiography was a sensitive andaccurate technique for diagnosis of VA dissection.KEY WORDS: CT angiography, dissection, vertebral artery
Paper 372 Starting at 8:32 AM, Ending at 8:40 AMComparison of Gadolinium-Enhanced MR Angiographywith High Resolution Black Blood MR Imaging inAssessment of Carotid Artery StenosisBabiarz, L. S. 1 · Astor, B. 2 · Mohamed, M. A. 1 · Wasserman,B. A. 11Johns Hopkins Hospital, Baltimore, MD, 2 The JohnsHopkins Bloomberg School of Public Health, Baltimore,MDPURPOSEAtherosclerotic disease in the proximal internal carotidartery (ICA) and carotid bulb is a frequent source of stroke.The assessment of stroke risk from carotid atherosclerosishas relied on angiography, with surgical management indicatedfor symptomatic narrowing of 70% or more based onNASCET. Angiography does not represent accurately theplaque burden because of vascular remodeling that occursduring atherogenesis. This underestimation is exaggeratedfor bulb lesions, since the reference diameter for measuringstenosis may be larger than that at the point of narrowing.Our aim was to show that contrast-enhanced MR angiography(CE MRA) underestimates narrowing compared withhigh resolution black blood MR images (BB MRI), and thatmeasurements of bulb stenosis by CE MRA correlate betterwith BB MRI when the common carotid artery (CCA) isused as the reference point rather than the distal ICA segmentas advised by NASCET.2830.73, 0.94; p = 0.14 compared with r = 0.77); however, thisdid not effect the BB MRI stenosis measurement that correspondedwith 70% diameter stenosis by CE MRA (89.7%[95% CI: 85.7, 93.7]).CONCLUSIONContrast-enhanced MR angiography underestimates thedegree of luminal narrowing when compared to BB MRI,which measures the outer wall and therefore accounts forvascular remodeling. Therefore, BB MRI provides a moreaccurate assessment of plaque burden. Contrast-enhancedMR angiography tended to correlate better with BB MRImeasurements when the CCA was used as the referencediameter for carotid bulb lesions rather than using stenosesbased on NASCET criteria, suggesting this may help to correctthe underestimation of stenosis.KEY WORDS: Arteriosclerosis, carotid artery, stenosis orobstruction, MR imaging, vascular studiesPaper 373 Starting at 8:40 AM, Ending at 8:48 AMMR Angiographic Evaluation of Platinum Coil Packs at1.5 and 3.0 T: An In Vitro Assessment of ArtifactProductionTsai, J. 1 · Walker, M. T. 1 · Parrish, T. 1 · Shaibani, A. 1 · Tzung,B. 1 · Krupinski, E. 2 · Russell, E. J. 11Northwestern Memorial Hospital, Chicago, IL, 2 Universityof Arizona, Tucson, AZMATERIALS & METHODSTwenty-four subjects (20 men and 4 women; age range, 57-83 years; mean age, 70.5 years ± 8.1 [SD]) with knowncarotid atherosclerosis underwent CE MRA and BB MRI.MR imaging was performed with a 1.5 T MR imager (GEMedical Systems, Milwaukee, WI) using a dual 3 inchphased-array surface coil. Black blood MR imaging wasachieved by a electrocardiography-gated, double inversionrecovery,fast spin-echo sequence. A three-dimensional MRangiogram (CE MRA) was acquired atthe arterial phase duringadministration of gadolinium(0.1 mmol/kg). Proton-densityand postcontrast T1-weighted BB MRI images wereacquired. MR angiograms were evaluated for degree ofstenosis based on area and then on minimal diameter accordingto NASCET criteria by automated software (VesselMass;Leiden University). Patients with carotid bulb stenoses wereevaluated also using CCA as the reference diameter. Outerwall and lumen contours were drawn on postcontrast T1-weighted BB MRI images at the point of the greatest narrowingusing VesselMass software. Percent stenoses werecompared with stenoses by CE MRA based on area anddiameter measurements.RESULTSPercent stenosis based on CE MRA area measurements usingNASCET criteria correlated with stenosis determined by BBMRI (r = 0.77; 95% CI: 0.58, 0.89). Black blood MR imagingvalues exceeded corresponding CE MRA measurements(0% stenosis by CE MRA corresponded to 63.1% [95% CI:54.6, 71.6] by BB MRI). Seventy percent diameter stenosisby CE MRA corresponded to 89.4% (95% CI: 85.1, 93.6) byBB MRI. When the CCA was used as the reference diameterfor cases with bulb stenosis (n = 3), the correlation with BBMRI measurements tended to be stronger (r = 0.87; 95% CI:PURPOSEThe ISAT trial has provided data suggesting that in theappropriately selected population, aneurysm patients treatedwith endovascular therapy will have a superior outcomecompared to those who undergo surgical clipping at 1 year.Despite the lack of long-term data regarding aneurysm recurrenceand the existence of short-term data, which shows thatcoiled aneurysms can recur even after initial total occlusion,the number of aneurysms referred for endovascular evaluationand therapy is increasing. It follows that the number ofpatients who will require follow-up evaluation will increase.Although digital subtraction angiography (DSA) is the goldstandard examination to evaluate the postcoiled aneurysm,recent reports have suggested that ultrashort echo time (TE)techniques can adequately decrease the susceptibilityinducedartifact that has thus far limited the use of MRA.The purpose of this study was to examine the characteristicsof platinum coil packs of different densities, with differentTEs, and at two different field strengths (1.5 and 3.0 T).Multiple 3D TOF sequences and a contrast-enhanced (CE)MRA sequence were investigated.MATERIALS & METHODSTwo aneurysm models were created from Word BartholinGland catheters and filled with TruFill DCS detachable coils,which resulted in the following coil pack densities (CPDs):44.9% (Model 1) and 22.4% (Model 2). These models thenwere suspended in a Jell-O matrix and scanned at 1.5 and 3.0T. On the 3D TOF sequences, the TE was decreased incrementallyto reduce the amount of susceptibility-induced signalloss. A single CE True FISP MRA was performed.Absolute diameter measurements in three orthogonal planesand volume calculations were performed and overestimationFriday
Fridayfactors calculated. Statistical analysis was performed includingAnalysis of Variance and Protected Least SquaresDifference post-hoc tests.RESULTSSusceptibility-induced signal loss was significantly greaterat higher coil pack densities, longer TEs, and higher fieldstrength. Signal loss decreased significantly with decreasingTE on 3D TOF sequences and was the least on the CE MRAsequence. There was no significant change in artifact for theCE MRA sequence at 1.5 and 3.0 or among the two CPDs.With 3D TOF techniques, significantly more artifact wascreated in the frequency-encoding direction compared to theother two dimensions.CONCLUSIONAt 1.5 T, short TE 3D TOF techniques and CE MRA producethe least amount of susceptibility-induced signal loss and canbe used to assess the postcoil patient. At 3.0 T, any improvementgained from decreasing the TE on 3D TOF techniquesis overwhelmed by the increase in susceptibility artifacts. CEMRA, however, does not result in a significant change inartifact compared to 1.5 T and can benefit from improvedsignal-to-noise, spatial and temporal resolution. Statisticallymore artifact was created in the frequency encoding directionand is related to its lower gradient strength. Aneurysmneck orientation relative to the frequency encoding gradientdirection is therefore a critical consideration when prescribingan MRA sequence in this setting. Future developments inpostcoiling MRA imaging should be focused on artifactreduction with 3D TOF techniques at 1.5 T and CE MRAtechniques at 3.0 T.KEY WORDS: MRA, aneurysmPaper 374 Starting at 8:48 AM, Ending at 8:56 AMScreening of Unruptured Intracranial Aneurysms withMR Angiography: Development of Novel Computer-Aided Detection SystemKorogi, Y. 1 · Hirai, T. 2 · Arimura, H. 3 · Li, Q. 3 · Abe, H. 3 ·Ikeda, R. 2 · Katsuragawa, S. 4 · Doi, K. 31University of Occupational & Environmental Health,Kitakyushu, JAPAN, 2 Kumamoto University, Kumamoto,JAPAN, 3 University of Chicago, Chicago, IL, 4 Nippon BunriUniversity, Oita, JAPANPURPOSEMR angiography (MRA) without use of contrast media candetect noninvasively unruptured intracranial aneurysms withpotential risk of rupture. However, it is difficult and timeconsumingfor radiologists to find small aneurysms,aneurysms overlapping with adjacent vessels, or aneurysmsin unusual locations, on the maximum intensity projection(MIP) images of MRA. Our purpose is to develop an automatedcomputerized scheme for detection of intracranialaneurysms based on the use of three-dimensional (3D) selectiveenhancement filters.MATERIALS & METHODSMR angiography studies of 60 patients for evaluation of possibleintracranial vascular disease were acquired on a 1.5 TMR scanner by use of 3D time-of-flight technique. TheMRA data base consisted of 29 abnormal cases with 36284aneurysms (effective diameter: 3-26 mm, mean of 6.6 mm)and 31 normal cases, where each MRA isotropic volumedata was obtained from original data by use of a linear interpolation,and the data was 400 x 400 x 128 voxels with avoxel size of 0.5 mm. First, the isotropic 3D MRA imageswere processed by use of three selective, multiscale filtersfor the enhancement of aneurysms, vessels, and vessel walls.Second, a region for searching initial aneurysm candidatesfor each case was determined by a distance from the surfaceof main vessels. The initial candidates were identified by useof multiple gray-level thresholding on the dot-enhancedimages. Third, candidate regions were segmented by use ofa region growing technique with monitoring the changes ofimage features on size, shape, and gray level. Some falsepositives subsequently were removed by use of rules basedon localized image features. Fourth, all candidates were classifiedinto several types by size and local structures. Finally,the partial 3D images for a specific volume region were createdautomatically for radiologists’ review to identify ananeurysm or a false positive.RESULTSWith our CAD scheme, all aneurysms were detected correctly(sensitivity 100%) with 0.55 false positives per patient.The partial 3D images of each candidate were useful forassisting radiologists in identifying correct aneurysms.CONCLUSIONOur CAD system would be useful in assisting radiologistsfor detection of intracranial aneurysms in MRA images.KEY WORDS: Intracranial aneurysms, MR angiography,computer-aided diagnosis (CAD)Paper 375 Starting at 8:56 AM, Ending at 9:04 AMThe Distal Dural Ring: A Radiologic and MicrosurgicalStudy in CadaversGavin, C. G. 1,2 · O’Connell, A. 1 · Brennan, P. 1 · Rawluk, D. 1· Bannigan, J. G. 2 · Thornton, J. 11Beaumont Hospital, Dublin, IRELAND, 2UniversityCollege Dublin, Dublin, IRELANDPURPOSETo evaluate the efficacy of MR imaging in identifying thedistal dural ring of the internal carotid artery (ICA). In 2003we reported a study of 20 patients where MR imaging wassuccessful in visualizing the distal dural ring and its intimateanatomical relationships. The aim of this cadaveric studywas to develop a technique of imaging the distal dural ringto validate our original findings by direct anatomical comparison.MATERIALS & METHODSFifteen cadavers comprised the study cohort. The followingsequences were used: unenhanced thin slice coronal heavilyT2-weighted, T2-weighted simulated flow using water andT1-weighted post ferrous oxide. All sequences were not performedon all cadavers. MR parameters were: fast spin echo,TR 5000 ms, TE 99 ms, FOV 24 x 18, 2 mm coronal sliceswith zero spacing, 384 x 256/4 NEX using a 1.5 T GE magnet.Source images were reformatted to 0.4 mm thicknessand reviewed at a workstation to identify the distal dural ringon each side. All 15 cadavers were injected with colored
latex and underwent microsurgical dissection. The distaldural ring and its relationship to the ICA and surroundinganatomical structures was located using a surgical microscopeand compared with the reformatted MR images.RESULTSThe ferrous oxide enhanced images were successful in visualizingthe distal ICA and its distal dural ring in 15 of 28ICAs. Ferrous oxide was successful but caused minimal“blooming” of the vessels in 2 of 28 ICAs and was unsuccessfulin 11 of 28 ICAs. Unenhanced T2-weighted imageswere successful in 21 of 26 ICAs, and was identified as theoptimal imaging technique. Extravasation of contrastobscured the distal dural ring in 2 cadavers. Microsurgicaldissection of the specimens demonstrated the intracranialanatomy and the relationship of the ICA and ophthalmicartery to the distal dural ring. Successful sequences correlatedwith the location of the distal dural ring at dissection.285Paper 376 Starting at 9:04 AM, Ending at 9:12 AMTitanium vs Nontitanium Aneurysm Clips at 1.5 and 3.0T and the Effects of Decreasing the Echo Time: An InVitro Assessment toward Noninvasive Imaging of thePostclip Aneurysm PatientTsai, J. · Walker, M. T. · Parrish, T. · Shaibani, A. · Tzung, B.· Krupinski, E. · Russell, E. J.Northwestern Memorial HospitalChicago, ILPURPOSEOpen surgical clipping has been the mainstay of aneurysmtherapy for decades and will be an integral component of thetreatment algorithm for years to come. Digital subtractionangiography (DSA) is the gold standard exam to assess thepostclip patient but carries a small risk of neurologic complication.Advances in noninvasive imaging such as MRangiography (MRA) are challenging the role of DSA in avariety of clinical scenarios. The postclip patient remainsproblematic because of susceptibility-induced artifact onMRA. The introduction of titanium clips positively impactedMRA imaging of aneurysm clips because of its improvedartifact profile but nontitanium clips are still ubiquitous dueto their physical properties. The introduction of higher fieldmagnets provides an opportunity to investigate and optimizeimaging protocols at different field strengths and aneurysmclip metallurgy. The purpose of this study was to investigatethe differences in artifact production at 1.5 vs 3.0 T of titaniumand nontitanium aneurysm clips and evaluate the effectof optimizing (decreasing) the echo time (TE) to decreasesusceptibility-induced signal loss. Seven different 3-dimensionaltime of flight (3D TOF) and our standard contrastenhanced(CE) MRA were studied.CONCLUSIONThin slice T2-weighted coronal MR imaging with reformattingis the optimal sequence for visualizing the distal duralring and distal ICA. Clinical application of this sequencewill assist the multidisciplinary management of distal ICAaneurysms.REFERENCES1. Bouthillier A, Van Loveren HR, Keller JT. Segments of theInternal Carotid Artery: A New Classification. Neurosurgery1996;3):425-4332. Seoane E, Rhoton AL Jr, de Oliveira E. MicrosurgicalAnatomy of the Dural Collar (Carotid Collar) and Ringsaround the Clinoid Segment of the Internal Carotid Artery.Neurosurgery 1998;42(4):869-8863. Kim JM, et al. Microsurgical Features and Nomenclature ofthe Paraclinoid Region. Neurosurgery 2000;46:679-6824. Thornton J, Aletich VA, Debrun GM, Alazzaz A, Misra M,Charbel F, et al. Endovascular Treatment of ParaclinoidAneurysms. Surg Neurol 2000;54:288-299KEY WORDS: Distal dural ring, MR imaging, anatomicalstudyMATERIALS & METHODSA straight titanium (Sugita titanium alloy) and a straight nontitaniumaneurysm clip (Sugita Elgiloy-cobalt alloy) of thesame length were suspended in a Jell-O mold to mimicintracranial placement. Seven 3D TOF sequences and ourstandard CE True FISP MRA technique were performed atboth 1.5 and 3.0 T. For the 3D TOF sequences, the echo time(TE), pixel bandwidth (BW), percent phase encode sampling,and flow compensation were changed incrementallyand progressively to minimize the clip artifact. The TrueFISP sequence was run once. Artifact size was quantified bymeasuring the greatest diameter of both susceptibilityinducedsignal loss and adjacent signal displacement in twoorthogonal planes relative to the tip of the aneurysm blades.Also, volumetric measurements of the entire clip-inducedsignal loss were quantified using an automated region growingsegmentation algorithm. Statistical analysis was performedand the null hypothesis was rejected at p < .05.RESULTSThe titanium clip produced significantly less artifact comparedto the nontitanium clip with each sequence and at bothfield strengths. Artifacts were statistically improved withdecreasing the TE on 3D TOF MRA. As expected, artifactwas significantly less on the CE True FISP acquisitions.Friday
FridayCONCLUSIONImproved visualization of the perianeurysmal soft tissues inpostclipped patients is best accomplished by short-TE, 3DTOF techniques at 1.5 T in patients with titanium clips.Scanning at higher field strengths does not provide incrementalgain with 3D TOF techniques and in fact degradesimage quality due to significant increases in susceptibilityinducedartifacts. At 3.0 T, CE True FISP MRA techniquesmay provide the best opportunity for advancement of minimallyinvasive vascular imaging. As predicted, nontitaniumclips produced significantly more artifact than titanium clipsat both field strengths and may require DSA for accuratepostoperative assessment.KEY WORDS: MRA, aneurysm clips286baroreceptor stretching is increased vagal tone and decreasedsympathetic tone, which synergistically act to decrease heartrate and arterial tone, thus decreasing blood pressure.Carotidsinus syndrome (CSS) was first described as an exaggeratedbaroreceptor mediated reflex whereby carotid sinus massageresults in bradycardia and/or hypotension in patients with ahistory of syncope or dizziness. Three subtypes of CSS havebeen described: cardioinhibitory, vasodepressor, and a mixedform. The pathogenesis of CSS remains poorly understood.It has been reported in elderly people with hypertension orcarotid atherosclerosis, and with space-occupying lesionsnear the carotid bifurcation, such as primary neoplasms,lymph node enlargement, and abscesses, and after carotidstenting. Paradoxically, our patient’s CSS disappeared aftercarotid stenting.Paper 377 Starting at 9:12 AM, Ending at 9:17 AMReversal of Carotid Sinus Syndrome Following CarotidStenting: Possible Synergistic MechanismHacein-Bey, L. · Ulmer, J. L. · Sharp, M. J. · Wong, S. J. ·Lemke, D. M. · Daniels, D. L.Medical College of WisconsinMilwaukee, WIPURPOSEHemodynamic disturbances that occur in relationship tocarotid stenting are becoming increasingly recognized.Sustained hypotension with or without bradycardia maydevelop after carotid angioplasty and stent placement, whichhas been attributed primarily to carotid sinus dysfunction.We report on a patient with a severe carotid stenosis andproven preexisting carotid sinus syndrome which disappearedfollowing carotid stenting. To our knowledge this isthe first report of reversal of carotid sinus syndrome aftercarotid stenting.MATERIALS & METHODSA 49-year-old white male with a history of right pyriformsinus squamous cell carcinoma treated with radiation therapy3 years ago presented with recurrent syncopal episodesfollowed by diaphoresis and loss of consciousness. Cardiacevaluation was negative. Duplex ultrasound of the carotidarteries demonstrated bilateral stenoses, > 75% on the right.CT of the neck showed local invasion by cancer of the leftpyriform sinus carcinoma with level II nodes. A table tilt testconfirmed the diagnosis of carotid sinus syndrome.Angiography confirmed a 90% right carotid stenosis with alarge calcified ulcerated, and a 50% stenosis on the left withthe carotid artery surrounded by cancer. Because of concernfor impending left carotid blow-out syndrome, right carotidstent reconstruction was first offered to the patient prior totreating the left side. Two days after the right carotid stentingprocedure, the patient experienced one last 5-minuteepisode of diaphoresis, headache, blood pressure drop to77/57 and a heart rate of 68. One week later, the patient wasdischarged home and no further episodes of carotid sinusdysfunction were observed for the next 12 months.RESULTSThe normal carotid sinus baroreceptor system traditionallyhas been thought of as a short term regulator of arterial pressure,but now is recognized to be predominantly involved inlong-term arterial pressure control. The net effect of carotidCONCLUSIONIn this patient with long-standing right carotid stenosis, CSScorresponded temporally to the development of left neckcancer. Yet, relief followed right carotid stenting. This is thefirst case that suggests the possibility of a synergy betweenlocal effects (left neck cancer) and central effects (flow-limitingright carotid stenosis) triggering CSS. Improving rightcarotid flow may have reduced the tone in the neural pathwaysinvolved to a subthreshold level, thereby relieving clinicallymanifest CSS.KEY WORDS: Carotid sinus syndrome, stentThe authors of this work have indicated that they will be discussing/presentingan unapproved or investigative use of acarotid stent made by Cordis/Johnson & Johnson.Paper 378 Starting at 9:17 AM, Ending at 9:22 AMTransverse Sinus Stenting as Treatment for BenignIntracranial Hypertension in Young MaleNiemann, D. B. · Turk, A. S. · Aagaard-Kienitz, B.University of WisconsinMadison, WIPURPOSEVenous outlet obstruction has been reported recently as apotentially treatable etiology of benign intracranial hypertension(BIH). Small case series from the United Kingdomand Australia have been reported utilizing stents in the transversesinuses for stenosis in BIH patients with favorableresults. A series from the United States described that angioplastyand thrombolytics were ineffective in consistentlyalleviating symptoms in BIH patients. We describe an unusualcase of a 15-year-old male who had symptoms and findingsof BIH including headaches, diplopia (bilateral 6thnerve palsies), papilledema, and visual acuity deterioration,which resolved after stenting of a transverse sinus stenosis.MATERIALS & METHODSCerebral venography was performed using MR imaging, CT,and conventional angiographic techniques. Pressure measurementswere obtained across the bilateral transverse sinusstenoses through a microcatheter and pressure differentialsof ~25 cm of water were obtained. The right transverse sinuswas selected for therapy as it was slightly larger and drainedthe nondominant hemisphere. At a second procedure, a selfexpanding10 mm x 40 mm Cordis Precise stent was
deployed across the stenosis under systemic heparinization.The patient was maintained on aspirin and warfarin postoperatively.RESULTSThe right transverse sinus was patent after primary stentingwith no residual stenosis and the patient’s visual symptomsand headaches completely resolved within 1 week. Hisdipolpia, visual acuity, and papilledema resolution were documentedby an independent neuroophthalmologist.CONCLUSIONVenous outlet obstruction should be considered as a possibleetiology in patients with BIH. If sinus stenosis is presentwith a significant pressure gradient, stenting may be a viabletreatment option.REFERENCES1. Owler BK, Allan R, Parker G, Besser M. PseudotumourCerebri, CSF Rhinorrhoea and the Role of Venous SinusStenting in Treatment. Brit J Neurosurg 2003;17(1):79-832. Owler BK, Parker G, Halmagyi GM, Dunne VG, Grinnell V,McDowell D, et al. Pseudotumor Cerebri Syndrome: VenousSinus Obstruction and Its Treatment with Stent Placement.J Neurosurg 2003;98(5):1045-10553. Higgins JN, Owler BK, Cousins C, Pickard JD. Venous SinusStenting for Refractory Benign Intracranial Hypertension.Lancet 2002;359(9302):228-2304. Karahalios DG, Rekate HL, Khayata MH, Apostolides PJ.Elevated Intracranial Venous Pressure as a UniversalMechanism in Pseudotumor Cerebri of Varying Etiologies.Neurology 1996;46(1):198-202KEY WORDS: Benign intracranial hypertension287Friday Morning10:00 AM -11:30 AMBallroom 6 B/C(67) Stroke (ASITN)(67a) Devices UpdateDevices UpdateGary R. Duckwiler, MD— Gary R. Duckwiler, MD(67b) Current Imaging of Stroke— J. Pablo Villablanca, MD(67c) Thrombolysis Update— Thomas A. Tomsick, MDModerators:John C. Chaloupka, MDJeffrey L. Sunshine, MD, PhDFriday Morning10:00 AM - 10:30 AMBallroom 6 A(66) Open Forum with the ELC Chair:What Would You Like for the 2005ELC?— Gregory L. Katzman, MDLEARNING OBJECTIVESUpon completion of this session, participants will be able to:1) Evaluate the interventional techniques for acute stroketreatment2) Distinguish and review the patient selection criteria forinterventional treatment techniques in acute strokePRESENTATION SUMMARYAs of the writing of this summary, there are no FDAapproved devices for the acute interventional treatment ofstroke. Multiple devices have been used, either under theauspices of phase I IDEs or under off-label use. Promisingtechnologies using laser, laser-acoustic coupling, ultrasound,clot aspiration, maceration, angioplasty, and snares all havebeen explored. However, the only devices currently in trialsare the Concentric Clot Retrieval Device (CRD) and theEkos ultrasound thrombolytic infusion catheter. A review ofthese devices and an in-depth analysis of the CRD Phase I-IIwill be presented. By the time of the presentation, the CRDwill have undergone an FDA review for approval.Friday
FridayREFERENCES1. Leary MC, Saver JL, Gobin YP, Jahan R, Duckwiler GR,Vinuela F, et al. Beyond Tissue Plasminogen Activator:Mechanical Intervention in Acute Stroke. Ann Emerg Med2003;41(6): 38-846. Review2. Kerber CW, Barr JD, Berger RM, Chopko BW. Snare Retrievalof Intracranial Thrombus in Patients with Acute Stroke. JVasc Interv Radiol 2002;13(12):1269-12743. Mayer TE, Hamann GF, Brueckmann HJ. Treatment ofBasilar Artery Embolism with a Mechanical ExtractionDevice: Necessity of Flow Reversal. Stroke 2002;33(9):2232-22354. Bellon RJ, Putman CM, Budzik RF, Pergolizzi RS, ReinkingGF, Norbash AM. Rheolytic Thrombectomy of the OccludedInternal Carotid Artery in the Setting of Acute IschemicStroke. AJNR Am J Neuroradiol 2001;22(3):526-5305. Lutsep HL, Clark WM, Nesbit GM, Kuether TA, Barnwell SL.Intraarterial Suction Thrombectomy in Acute Stroke.AJNR Am J Neuroradiol 2002;23(5):783-7866. Clark WM, Buckley LA, Nesbit GM. Intraarterial LaserThrombolysis Therapy for Clinical Stroke: A FeasibilityStudy. Stroke 2000;31:3077. Lutsep HL, Campbell M, Clark WM. EPAR Therapy Systemfor Treatment of Acute Stroke: Safety Study Results. Stroke2001;32:19b8. Lutsep HL, Clark WM, Nesbit GM. Intra-Arterial SuctionThrombectomy in Acute Stroke. Stroke 1999;30:2709. Mahon BR, Nesbit GM, Barnwell SL. The North AmericanClinical Experience with the EKOS Ultrasound ThrombolyticDrug Infusion Catheter for Treatment of Embolic Stroke.Presented at: The American Society of Neuroradiology(<strong>ASNR</strong>);April 26, 2001:Boston, MA10. Wikholm G. Mechanical Intracranial Embolectomy: AReport of Two Cases. Interven Neuroradiol 1998;4:159-16411. Qureshi AI, Siddiqui AM, Suri MF, Kim SH, Ali Z, Yahia AM,et al. Aggressive Mechanical Clot Disruption and Low-DoseIntra-Arterial Third-Generation Thrombolytic Agent forIschemic Stroke: A Prospective Study. Neurosurgery2002;51(5):1319-1327; discussion 1327-1329Current Imaging of StrokeJ. Pablo Villablanca, MD288ability and reliability of CT to serve as a screening tool toidentify early infarct signs, exclude hemorrhage and nonischemiccauses of acute neurologic deficits. The role of CTAto provide rapid and minimally invasive information aboutthe presence and cause of arterial stenoses or occlusions willbe illustrated. The ability of CTP to provide informationabout size, location, and severity of cerebral ischemia, cerebrovascularreserve, tissue at risk, and possibly thresholds ofischemia and the status of collateral circulation will bereviewed. The added value of MR imaging to identify thelocation and size of ischemia within minutes of symptomonset using diffusion weighted imaging (DWI) will beemphasized, including an examination of the transientischemic event (TIA) population. The ability of relative perfusionMR (PWI) to identify all of the tissue at risk of infarctionif vessel recanalization does not occur will be demonstrated.The ability to visualize the ischemic penumbra (thezone of perfusion, but not diffusion abnormality) in realtime, and the opportunity to tailor treatment decisions basedon individual patient hemodynamics and pathophysiologywill be illustrated. The emerging application of gradient echo(GRE) sequences in the detection of microbleeds, and theirsignificance in the thrombolysis population will be examined.The role of both time-of-flight (TOF MRA) anddynamic contrast-enhanced MRA (CE MRA) in the identificationof stenosed or occluded large and medium sized cerebralvessels will be reviewed. Emphasis will be placed on themanner in which this information is being used not only toselect the best candidates for treatment, but also to potentiallyextend the traditional therapeutic window, and to guideboth acute and long-term treatment decisions. The utilizationof these techniques, in isolation or combination, is influencedby a number of factors, including availability, ease ofdata acquisition and postprocessing requirements, patientrisks, and cost. Finally, the relative advantages and disadvantagesof each modality will be summarized briefly.REFERENCES1. von Kummer R, Allen KL, Holle R, et al. Acute Stroke:Usefulness of Early CT Findings before ThrombolyticTherapy. Radiology 1997;20:327-3332. Leary MC, Kidwell CS, Villablanca JP, et al. Validation ofComputed Tomographic Middle Cerebral Artery "Dot"Sign: An Angiographic Correlation Study. Stroke2003;34:2636-2640LEARNING OBJECTIVESUpon completion of this session, participants will be able to:1) To utilize CT and MR angiographic, diffusion and perfusiontechniques to:2) Distingusih the vascular etiology of a neurologic deficit3) Assess reversibility and eligibility for acute therapies4) Differentiate between tissue ischemia and stroke mimics5) Utilize CT and MR to discriminate hemorrhagic fromischemic strokePRESENTATION SUMMARYThe role of multimodal CT and MR techniques in the evaluationof acute stroke will be examined. The ability of thesemodalities to provide information about the presence, location,and vascular territory of an ischemic lesion, the state ofcerebral perfusion and tissue viability, and the status of thecervicocranial vasculature will be illustrated using a casebasedpresentation approach. The value of multimodal CTincluding routine CT, CT angiography (CTA) and quantitativeCT perfusion (CTP) will be evaluated, including theThrombolysis UpdateThomas A. Tomsick, MDDisclosure: The author of this presentation has indicatedthe following affiliations/disclosures: 1. Genentech:Research grant; 2. Cordis Neurovascular, Inc.: Consultingfees.The author of the presentation has indicated that he will bediscussing/presenting an unapproved/investigative use ofAltaplase in intraartirial infusion and Abciximab in infusionfor stroke. Altaplase is made by Genentech and Abciximab ismade by Centocor, Inc.
289Friday Morning10:30 AM - 11:00 AMRoom 611 - 612(67A) National Library of Medicine(NLM): MEDLINEplus ShortDemonstration— Gail KouameFriday Morning11:30 AM - 11:45 AMBallroom 6 B/CClosing Remarks— Victor M. Haughton, MD, <strong>ASNR</strong> PresidentFriday
FridayNotes
291NOTE ABOUT SCANNED IMAGES: Scanned images are included in theproceedings book. Some submitted images were reduced during the printing process, therebydecreasing clarity. The images as originally submitted can be viewed within the abstract on the<strong>ASNR</strong> website at www.asnr.org/<strong>2004</strong>.Scientific Posters 1-185Exhibit Hall 4B (Level 4)follow-up DWI and normal staining on TTC stain. TheDrCBV 3hr-24hr was defined as the difference between the rCBVratios at 3 and 24 hours after reperfusion: DrCBV 3hr-24hr = [|rCBV 3hr - rCBV 24hr | / rCBV higher ] x 100.PostersMonday, June 76:00 PM – 9:00 PMTuesday, June 8 - Thursday, June 106:30 AM - 9:00 PMFriday, June 116:30 AM – 11:45 AMNote: A missing Poster number indicates an abstracthas been withdrawn.Adult Brain1-93Poster 1Effect of Postischemic Hyperemia on Ischemic BrainTissue: Perfusion MR Evaluation with Transient FocalCerebral Ischemia in CatsKim, H. 1 · Kim, D. 2 · Lee, S. 2 · Yu, I. 3 · Choi, Y. 1 · Lee, T. 11Eulji University School of Medicine, Seoul, REPUBLIC OFKOREA, 2 Yonsei University Medical College, Seoul,REPUBLIC OF KOREA, 3 Eulji University School ofMedicine, Taejeon, REPUBLIC OF KOREAPURPOSETo evaluate the effect of postischemic hyperemia onischemic brain tissue in cases of hyperacute stroke by evaluatingthe regional cerebral blood volume (rCBV) of thereversible ischemia occurring in the transient focal cerebralischemia in cats.MATERIALS & METHODSSeven adult Korean cats weighing 3-3.5 kg were used. Theoccluded artery was reperfused after temporary occlusion ofthe middle cerebral artery for 60 minutes. Both diffusionweightedimages (DWI) and perfusion-weighted images(PWI) were obtained at 1, 3, and 24 hours after reperfusion.The rCBV images were reconstructed from the PWI. Thecats were killed after the 24-hour imaging. Brain slices wereobtained and triphenyl tetrazolium chloride (TTC) stainingwas performed. The reversible ischemia was defined asoccurring in the area of normalized high signal intensity onRESULTSThe periods of the increased rCBV varied in each cat. Areversible ischemic area demonstrating the period ofincreased rCBV during the 24 hours after reperfusion wasevident in all 7 cats. Cat 1 showed severely increased rCBVvalues in the reversible ischemia and infarct at both 1 and 3hours after reperfusion. At 24 hours after reperfusion, rCBVwas decreased abruptly in the reversible ischemia. Cat 5showed persistently decreased rCBV in the infarct throughoutthe observation period; but, postischemic hyperemia wasobserved at 24 hours after reperfusion in the reversibleischemia of this cat. The rCBV values at 1, 3, and 24 hoursafter reperfusion showed no statistically significant differencebetween the reversible ischemia and the infarct(reversible ischemia: 1.28 ± 0.34, infarct: 1.10 ± 0.42). In theinfarct, postischemic hyperemia was observed at varioustimes and to various degrees after reperfusion. However theDrCBV 3hr-24hr of the reversible ischemia and the infarct differedfrom other to a statistically significant degree (p =0.018). DrCBV 3hr-24hr of the reversible ischemia was above27% in all cats (sensitivity: 100%, specificity: 71%).CONCLUSIONPostischemic hyperemia was more dynamic in the reversibleischemia than in the infarct. This suggests that postischemichyperemia does not represent a harmful phenomenon forhyperacute ischemic tissue in cases of early recanalization.KEY WORDS: Stroke, perfusion MRPoster 2Three-Dimensional White Matter Tractography withDiffusion-Tensor Analysis and Fiber Tracking forEvaluation of Corticospinal Tract Injury with AcuteDeep Intracerebral HemorrhageIshigame, K. 1 · Toyoshima, H. 1 · Aoki, S. 2 · Masutani, Y. 2 ·Ibaraki, M. 1 · Umetsu, A. 1 · Shimosegawa, E. 1 · Moroi, J. 1 ·Suzuki, A. 11Akita Research Institute of Brain and Blood Vessels, Akita,JAPAN, 2 Graduate School of Medicine, Tokyo University,Tokyo, JAPANPURPOSEThree-dimensional white matter tractography with diffusiontensorMR analysis and fiber tracking can be used to depictthe main white matter tract anatomy, such as of the corticospinaltract. Seventy percent of intracerebral hemorrhages(ICH) occur in the putamen or thalamus, that is in the deepgray matter. A common symptom of putaminal or thalamichemorrhage is hemiparesis that results in impaired motor
Postersfunction. Such impairment in patients with deep ICH may becaused by corticospinal tract injury. Perihematomal tissueinjury can be seen on diffusion-weighted MR images. Ourgoal was to assess the usefulness of three-dimensional whitematter tractography for predicting functional motor outcomein patients with acute deep ICH.MATERIALS & METHODSStudy subjects were 35 who underwent MR study within 72hours after onset of putaminal or thalamic hemorrhage.Diffusion tensor images were obtained with a 1.5 T MRscanner (Magnetom Vision, Siemens Medical System,Erlangen, Germany). An echo-planar imaging was used,with diffusion gradient applied in six directions and a maximumb value of 1000 s/mm2. Softwares (Volume one anddTV) downloaded from the internet [http://www.volumeone.org/][http://www.ut-radiology.umin.jp/people/masutani/dTV.htm]were used for diffusion tensor analysis andfiber tracking. We were able to depict corticospinal tractsthat passed both the cerebral peduncle and precentral gyrus.In patients in which the corticospinal tract ipsilateral to theICH side was depicted, we set separate regions of interest(ROI) at three levels bilaterally along the corticospinal tractand obtained apparent diffusion coefficient (ADC). We calculatedthe minimum ADC ratio between the ICH and thecontralateral side among ROIs at each of the three levels.Depiction of the corticospinal tract and ADC were analyzedin association with functional motor outcome according tothe NIH Stroke Scale scores at 4 weeks onset.292CONCLUSIONOur findings indicate that three-dimensional white mattertractography with diffusion tensor MR analysis and fibertracking is useful for predicting functional motor outcome inpatients with deep ICH.KEY WORDS: Fiber tracking, diffusion-tensor imaging,intracerebral hemorrhagePoster 3Effect of Skull Volume and Density on DifferentiatingGray and White Matter on Routine CT Scans of theBrainCraddock, D. C. · Chen, M. Y. · Williams, D. W.Wake Forest University Baptist Medical CenterWinston-Salem, NCPURPOSEIt is often difficult to diagnose early ischemic brain injury byCT and thus reliance often is placed upon subtle loss of thenormal gray-white matter differentiation for its detection.Increased volume and density of the skull may compoundthe problem by diminishing the gray-white matter attenuationdifference. The purpose of this investigation was then toexamine the effects of skull volume and bone density ongray-white matter differentiation.RESULTSThe corticospinal tract ipsilateral to the ICH was not depictedin 11 patients, all of whom had a poor outcome at 4weeks. In all cases, the corticospinal tract contralateral to theICH was depicted. In all cases in which the ipsilateral corticospinaltract was depicted, there was an adequate displacementof the tract, which was attributed to the ICH (Figure 1).The ADC ratios of patients with an NIH Stroke Scale of 3 or4 were significantly lower than the ADC ratios of patientswith a good outcome.MATERIALS & METHODSPatients were selected retrospectively as a thick/dense skullgroup based upon the subjective CT appearance of the calvarium.These patients had been diagnosed with thickenedbone secondary to anemia, hyperostosis frontalis interna,renal disease, and long-term antiepileptic therapy. A total of21 patients (4 men, 17 women; mean age, 49 years; agerange, 21-84 years) with thick calvaria were compared witha control group of 22 patients whose brain CT had beeninterpreted as normal (6 men, 16 women; mean age, 32years; age range, 22-49 years). Images were acquired helicallyat 10 mm intervals, 140 mA, and 140 kV. Three contiguoustransaxial slices that included the basal ganglia on atleast one image were evaluated for bone volume and densityon a separate workstation using standard image analysis software(GE Advantage, Voxtool 3.0.26i). Patients wereexcluded at analysis if pertinent slices contained pneumatizedbone. Attenuation values in Hounsfield units (HU)were obtained for the putamen, and frontal gray and whitematter in both brain halves. Calvarial bone volumes, attenuationdifferences between white and gray matter, and meanpixel values for each slice, was compared between the thickskull and control groups using the Student’s t-test.RESULTSThe mean slice volumes in the thick skull group were 55.7,54.3, 56 cc, compared with those in the normal group thatwere, respectively, 39.3, 38.5, and 39.9 cc, (p < 0.001) representingan overall 41% excess volume. The mean pixelvalue in the thick/dense group was 936 and 987 in the controlgroup, an insignificant difference in bone density. Themean attenuation difference between right side white andgray matter was 5.48 HU for the thick/dense group and was11.61 HU for the control group (p < 0.0001). Similarly, themean attenuation difference between left side white and gray
matter was 5.17 HU for the thick/dense group and was 11.14HU for the control group (p < 0.0001). There was no statisticallysignificant difference between right and left sideswithin the same control and thick/dense groups.CONCLUSIONPatients with a relatively thick calvarium demonstrated significantlydiminished difference in the attenuation of grayand white matter. Therefore, gray-white matter discriminationin subjects with a thicker calvarium is comparativelymore difficult, and likely makes ischemia in these patientsmore difficult to detect. Possible solutions include increasingthe kV or mA to exaggerate gray-white matter attenuationdifference or performing MR imaging when possible.REFERENCES1. Arimitsu I, DiChiro G, Brooks RA, Smith PB. White-GrayMatter Differentiation in Computed Tomography. J CompAssist Tomog 1977;1:437-4422. Barnes JE. AAPM Tutorial: Characteristics and Control ofContrast in CT. Radiographics 1992;12:825-837KEY WORDS: Stroke, skull, CT methodsPoster 4Low Cerebral Blood Flow Values Do Not always IndicateDecreased Cerebral Blood FlowPhilip, J. V. 1 · Hamberg, L. M. 2 · Gonzalez, R. G. 1 ·Koroshetz, W. 1 · Buonanno, F. 1 · Hunter, G. J. 21Massachusetts General Hospital, Boston, MA, 2 TheUniversity of Texas M.D. Anderson Cancer Center, Houston,TXPURPOSEWhen constructing cerebral perfusion maps using “CTPerfusion 2” software, areas of low CBF and prolongedMTT which do not infarct are often seen. We systematicallyinvestigate this paradox and identify the reason for lack ofinfarction, despite the presence of abnormally low CBF andprolonged MTT values.MATERIALS & METHODSRetrospective analysis was performed in patients who presentedto the emergency room with symptoms of acutestroke and who underwent a multislice CT perfusion study.Included patients were those who developed an infarctionwithin the 2 cm CT perfusion acquisition volume, who didnot move during imaging, and who had a visible deficit onCBF maps that was clearly larger than the final infarct by atleast one third of a vascular territory. Out of 156 consecutivepatients, 12 fulfilled these criteria and were analyzed. Weperformed region of interest (ROI) analysis within an areathat did infarct (ROI1) and within a low CBF area that didnot infarct (ROI3). Contralateral controls for both regionswere analyzed, ROI2 and ROI4, respectively. For each ROI,the enhancement curve peak height (minus baseline) wasdetermined using the cine data. Cerebral blood volume,MTT and CBF values for each ROI were generated using“CT Perfusion 2” software (GE Medical Systems,Milwaukee, WI). Ipsi and contralateral data were comparedstatistically using a paired t-test.293RESULTSThe average enhancement curve peak height of ROI1(infarct) is 37% of its control ROI2 and is significantly different(p < 0.0001). The average enhancement peak of ROI3(low CBF, no infarct) is equal to its control ROI4 and is notsignificantly different (p > 0.4). The average ROI1 CBV is49% of its control and is significantly different (p < 0.0001).The average ROI3 CBV is 97% of its control and is not significantlydifferent (p > 0.2). The average ROI1 and ROI3MTT were 3.64 and 3.73 times larger than their respectivecontrols and both significantly different (p < 0.0001) fromtheir controls. The average ROI1 and ROI3 CBF were 19%and 32% of their respective controls and both significantlydifferent (p < 0.0001) from their controls. It should be notedthat visually, in all patients, the CBV lesion matched thefinal infarct, and the MTT “lesion” was identical to the CBF“lesion” and neither matched the final infarct.Average ratio (+/- Standard deviation) of ROI1/2 & ROI3/4Ratio ROI1/ROI2 St.Dev ROI3/ROI4 St. Devpeak height 0.37 +/- 0.10 1.00 +/- 0.16CB 0.49 +/-0.08 0.97 +/- 0.12MTT 3.64 +/-1.27 3.73 +/- 1.17CBF 0.19 +/- 0.08 0.32 +/- 0.12CONCLUSIONIn regions of low CBF, prolonged MTT and no infarct, wemeasured normal peak enhancement and normal CBV indicatinga normal amount of blood delivery. Thus, a low CBFin the presence of normal peak enhancement, normal CBVand prolonged MTT appears to be an artifact in generatingCBF maps. To avoid possible overestimation of “tissue atrisk” of infarction, interpretation must be performed with anunderstanding of the underlying pathophysiology of infarctionand the limitations of the tools used.KEY WORDS: Perfusion, stroke, CTPoster 5Comparing Perfusion Measurements Using SingularValue Decomposition and Maximum LikelihoodExpectation MaximizationLee, J. J. · Markham, J. · Videen, T. O. · Derdeyn, C. P. ·Powers, W. J. · Shimony, J. S.Washington University Medical CenterSt. Louis, MOPURPOSETo compare perfusion measurements based on maximumlikelihood expectation maximization (MLEM), singularvalue decomposition (SVD), as well as SVD with block circulantsand minimization of oscillations (oSVD) (1-3). Eachmethod was compared to reference perfusion data obtainedby positron emission tomography (PET).MATERIALS & METHODSWe retrospectively analyzed MR and PET perfusion dataobtained from seven patients of the St. Louis CarotidOcclusion Study (4). These patients with chronic, stable,carotid artery occlusions had MR and PET perfusion studiesperformed on the same day. MR data were collected on aPosters
PostersSiemens Magnetom Vision using EPI with power injectionof gadodiamide dosed to 0.2 mmol/kg. Bolus passages weredeconvolved using the methods of Vonken, et al. (1),Ostergaard, et al. (2), and Wu, et al (3). So as to maintaintemporal causality for SVD, artificial time delays wereadded between arterial inputs and regions of interest (ROIs).This was done equally for all deconvolution methods. Theprocessed results then were compared directly against PETresults obtained by the Kety auto-radiographic method andthe cerebral blood flow (CBF) corrections of Herscovitch, etal. (5). PET perfusion measurements were made on an ECATEXACT HR scanner using boluses of [ 15 O]-H 2 O. For statisticalanalysis, MR pixels were binned in 6 mm x 6 mm x 6 mmvolumes to match 6 mm three-dimensional Gaussian filteringused in PET processing. Arterial pixels were excludedfrom analyses. For each patient, MR CBF values from whitematter ROIs were scaled to match PET CBF values from thesame ROIs.RESULTSPerfusion processing by oSVD or SVD, when compared toPET, yielded more favorable Pearson correlations, Spearmanrank correlations, and chi 2 values. For patient four, who sufferedabnormally elevated ipsilateral vascular mean transittime, MLEM provided stronger associations with PET.However, other patients with elevated vMTT did not similarlybenefit from evaluation by MLEM. The absolute numberof sampled ROIs is shown.pt1 pt2 pt3 pt4 pt5 pt6 pt7294Poster 6Deoxygenation of Leptomeningeal Collaterals inMoyamoya SyndromeLiebeskind, D. S. · Ances, B. M. · Weigele, J. B. · Hurst, R.W. · Melhem, E. R.University of PennsylvaniaPhiladelphia, PAPURPOSELeptomeningeal collateral vessels sustain cerebral perfusionin the setting of moyamoya syndrome. The anatomical constraintsassociated with proximal arterial occlusion mayincrease longitudinal oxygen gradients and precapillary oxygenloss. We characterized the MR appearance of leptomeningealcollaterals in moyamoya syndrome and correlatedslow flow in these circuitous collaterals with the presenceof deoxygenation observed on gradient-echo T2*-weighted sequences.MATERIALS & METHODSRetrospective review of MR studies acquired in 24 cases(median age 35 years, range 19-67 years; 8:16 M:F) of moyamoyasyndrome. Slow flow in leptomeningeal collateralswas identified as flow-related enhancement on FLAIRsequences. The presence of deoxygenation in these vascularsegments was assessed on gradient-echo T2*-weightedsequences.Pearson’s R MLEM 0.393 0.429 0.642 0.609 0.683 0.670 0.592SVD 0.416 0.449 0.647 0.549 0.740 0.706 0.500oSVD 0.419 0.434 0.656 0.586 0.713 0.713 0.602chi2/N MLEM 97.0 122.2 73.0 70.6 76.1 77.9 61.8SVD 95.0 119.5 72.2 78.4 64.6 70.9 71.5oSVD 94.6 121.5 70.7 73.7 70.2 69.4 60.7N(ROIs) 1559 394 986 1426 879 519 792CONCLUSIONFor six of seven patients with chronic carotid artery occlusion,MR CBF determined using SVD or oSVD had strongerassociations with PET results. The benefit of using SVD oroSVD over MLEM was significant with respect to numberof chosen ROIs for a given patient; however, results did notgeneralize across patients.REFERENCES1. Vonken, et al. Magn Res Med 1999;41:3432. Ostergaard, et al. Magn Res Med 1996;36:7153. Wu, et al. Magn Res Med 2003;50:1644. Derdeyn CP, et al. Neurology 1999;53:2515. Herscovitch, et al. J Nucl Med 1983;24:782KEY WORDS: Perfusion, MR imaging, PETThe authors of this work have indicated the following affiliations/disclosures:1. The NER Foundation: Fellowship inCerebrovascular Disease Research; 2. Boston Scientific:Financial support.RESULTSFLAIR vascular hyperintensities (FVH) were observed in21/24 (88%) cases. These FVH were noted over bilateralconvexities in 11/15 (73%) cases with bilateral proximalarterial stenoses. FVH were typically situated in the peri-sylvianregion and fronto-parietal cortices. FVH were locatedpredominantly adjacent to noninfarcted tissue, as mostinfarcts were deep, subcortical lesions in lenticulostriate territory(15/24 cases). Gradient-echo T2*-weightedhypointensity of leptomeningeal collaterals was noted in17/21 (81%) cases with FVH. The extent of T2*-weightedhypointensity in leptomeningeal collaterals was limited withrespect to the extent of the FVH. A gradation in the degree ofT2*-weighted hypointensity was not observed.CONCLUSIONMR imaging may reveal subtle features of leptomeningealcollaterals in moyamoya syndrome. Slow flow in these vascularsegments may be apparent as FVH, with correspondingT2*-weighted hypointensity suggesting intravascular deoxygenationand the presence of a longitudinal oxygen gradient.REFERENCES1. Liebeskind DS, Ances BM, Weigele JB, Hurst RW.Intravascular Deoxygenation of Leptomeningeal CollateralsDetected with Gradient-Echo MRI. Stroke <strong>2004</strong>;35KEY WORDS: Moyamoya, deoxygenation, collateral circulation
Poster 7Imaging of Intracranial Atherosclerotic Disease inSymptomatic Patients: A Comparison of Cerebral DigitalSubtraction Angiography with MR AngiographyGiles, B. P. · Kassab, M. Y. · Firat, A. K. · Hynan, L. S. ·Graybeal, D. F. · Dutton, K. · Rappard, G.The University of Texas Southwestern Medical CenterDallas, TXPURPOSETo determine the sensitivity and specificity of MRA for thedetection of intracranial stenosis in patients presenting withan ischemic stroke or a transient ischemic attack (TIA) andto determine the relationship between intracranial stenosisand stroke distribution as seen on MR imaging diffusionweightedimaging (DWI).MATERIALS & METHODSA retrospective review of all patients presenting at our institutionbetween July 1, 2001 and July 1, 2002 who were diagnosedwith either stroke or TIA, identified by ICD-9 code of435.9 or 436, and who also underwent cerebral DSA andMRA, or DSA and DWI, as identified by the following CPTcodes 70552, 70551, 70553, 70541, 70541, and 36216, wasperformed. Digital subtraction angiography was consideredto be the gold standard for determining intracranial stenosis.On DSA, significant stenosis of the intracranial ICA, MCA,and vertebrobasilar circulation was judged to be > 50% narrowing.When the degree of intracranial stenosis was notreported in terms of percentages, angiograms were reviewedby 2 radiologist (AKF and GR). Intracranial MRA reportswere evaluated by 2 radiologists (BPG and GR) as follows.When stenosis was reported in a vessel, this was assumed torepresent > 50% narrowing. When terms other than stenosiswere used to describe a vessel they were interpreted as follows:Few branch vessels seen = parent artery patent; absentor not seen = occlusion or severe stenosis; slow flow orsevere irregularity = stenosis. Intracranial MRA technique atour institution is as follows: 3D single slab TOF SPGR,TR/TE, 6.9 msec/37 msec; flip angle, 20 degrees; bandwidth,15.63 khz; FOV, 22 cm; phase FOV, 0.75; matrix, 320x 224; slice thickness, 1.4 mm processed to 0.7 mm; excitations,1 with superior saturation band and magnetizationtransfer. Diffusion-weighted images reporting restricted diffusionwere evaluated for vascular territory of acute infarction.RESULTSTwenty-two of 37 patients that had undergone MRA andDSA following TIA or stroke were found to have a significantintracranial stenosis on DSA. Overall sensitivity andspecificity of MRA for determining intracranial stenosis wascalculated to be 42.9% (95% CI, 26.8-60.5) and 92.1% (95%CI, 87.1-95.4), respectively. Thirty-nine patients had anacute stroke on DWI, and 23 lesions were in the vascular distributionof the stenotic vessel as seen on DSA, while 9lesions were not in the distribution of a stenotic vessel, and7 lesions did not have any intracranial stenosis.CONCLUSIONWhile MRA findings for intracranial stenosis are highly specific,MRA as it is commonly practiced at our institution isnot sensitive for the detection of intracranial stenosis.295Therefore, this form of MRA is not suitable as a screeningexam for intracranial stenosis. Since 59% (95% CI, 42-74) ofall stroke cases and 72% (95% CI, 53-86) of stroke caseswith a significant intracranial stenosis had a DWI infarct inthe distribution of the stenotic vessel, such poor sensitivitymay grossly under-diagnose symptomatic intracranial stenosis.As medical and endovascular therapy of these lesionsadvance, accurate means of screening will gain in importance.KEY WORDS: Stroke, MR angiography, intracranial stenosisPoster 8Are Rapid Access Transient Ischemic Attack ClinicsRapid Enough?Widjaja, E. 1 · Griffiths, P. D. 2 · Venables, G. S. 11Royal Hallamshire Hospital, Sheffield, UNITED KINGDOM,2University of Sheffield, Sheffield, UNITED KINGDOMPURPOSERapid access clinics for patients with transient ischemicattacks (TIA) were established to provide a rapid diagnosticservice for those with suspected TIA or minor strokes. Theaim of this study was to review the outcomes of those whowere referred to the clinic.MATERIALS & METHODSOne thousand four hundred sixty patients were referred tothe clinic in the 27 months between October 2000 toDecember 2002. One thousand three hundred thirty-ninepatients attended and the reports of carotid Doppler ultrasoundwere reviewed. Those who subsequently proceeded tocarotid angiography and intervention of the carotid stenosisalso were reviewed. One hundred twenty-one patients failedto attend the clinic and the reasons for this were recordedfrom the medical notes and the general practitioners.RESULTSThe median waiting time from referral to appointment was17 days (0-90 days). One hundred of 1339 (7.5%) hadgreater than 50% stenosis on the appropriate side of symptoms.Eighty-three of 1339 (6.2%) patients proceeded tocerebral angiography and 65/1339 (4.9%) patients had interventionfor the carotid stenosis. Thirty-nine of 121 (32.2%)of those who did not attend the clinic did so because they hadhad a completed stroke in the interval between seeing theirGP and the clinic appointment. Twenty-seven of 39 (71%) ofthe strokes occurred within the first 3 days of referral.CONCLUSIONOnly a small proportion of those who attended the clinic haddirect intervention on the carotid stenosis. Nonattendees hada high risk of stroke in the first few days after TIA, suggestingthat highest risk patients were not seen in time. Thisemphasizes the need for a more aggressive approach to preventstroke progression.KEY WORDS: Transient ischemic attacks, carotid arterystenosisPosters
PostersPoster 9Relationship of Cerebral Blood Flow, CerebralVasoreactivity, and Hematocrit in Xenon CT CerebralBlood Flow MeasurementLiu, H. · Tseng, S. · Tai, M. · Tseng, Q.National Taiwan University HospitalTaipei, TAIWAN REPUBLIC OF CHINAPURPOSEMeasurement of cerebral blood flow is dependent on thepatient’s hematocrit. We try to evaluate the relationshipbetween the cerebral blood flow, cerebral vasoreactivity, andhematocrit in different groups of normal, patient with infarct,patient with cervical stenosis.MATERIALS & METHODSFifty persons were included in this study; there were 24males and 26 females. Ages ranged from 40 to 78 years old.We used 5 different hematocrit (20%, 25%, 30%, 35%, 40%,and 45%) values to calculate the cerebral blood flow. All theregion of interest (ROI) was in the same location. The samestudy was repeated with Diamox challenge.296MATERIALS & METHODSFifty-five patients underwent first-pass perfusion CT within6 hours of stroke onset. The first-pass perfusion CT examinationconsisted of two 40-second series at 5 minute intervals.Multidetector-array technology allowed data acquisitionfrom 2 adjacent 10 mm sections for each series. Thus thetwo perfusion CT series allowed data acquisition of 4 cerebralsections at the level of the basal ganglia and the centrumsemiovale. Cerebral blood flow, CBV, and MTT maps wereobtained from serial CT images, and the initial lesion size,revealed by perfusion CT, were compared with clinicalscores and final infarct size.RESULTSOverall, the lesion size seen on CBV maps correlated moststrongly with final infarct size (R 2 = 0.847, p < 0.001).Individual data of CBV maps showed that each perfusiondefect lesions were less than CBF and MTT maps in 96% ofpatients. Cerebral blood flow and MTT maps showed sensitiveperfusion abnormal findings of MCA territory involved,but final infarct area tended to be overestimated by CBF andMTT maps. The lesion size depicted by CBV maps showedmoderate correlation with baseline clinical scores and clinicaloutcomes (R 2 = 0.531, p< 0.001).CONCLUSIONFirst-pass perfusion CT scan is a practical and rapidadvanced imaging technique. It provides important hemodynamicinformation in acute stroke patients, thus offers reliableinformation, which brain tissue is salvageable by thrombolytictherapy, and in predicting the outcomes.RESULTSIf all the other parameters were consistent, a reverse linearrelationship was shown between the hematocrit and the cerebralblood flow. All the R 2 value was more than -0.98 in thenormal side, infarcted side, and the side with cervical carotidstenosis.CONCLUSIONHematocrit reveals reverse linear relationship with cerebralblood flow when xenon CT used for cerebral blood flowmeasurement. The finding is compatible to the prior animalsstudy and the effect of hemodilution is confirmed in humanbeing.KEY WORDS: Cerebral blood flow, hematocrit, xenonPoster 10First-Pass Perfusion CT in Acute Middle CerebralArtery Ischemic StrokeLee, M. S. · Kim, M. S. · Lee, J. Y. · Whang, K. · Lee, Y. H.Yonsei University Wonju College of MedicineWonju, REPUBLIC OF KOREAPURPOSETo assess the utility of first-pass perfusion CT in the relationshipbetween lesion size revealed by perfusion CT andclinical outcome, and the prediction of final infarct lesion inacute ischemic stroke patients who have not undergonethrombolytic therapy.KEY WORDS: Brain, ischemia, CTPoster 11Brain MR Abnormalities in Renal Transplant PatientsKini, S. · Besenski, N. · Rumboldt, Z. · Budisavljevic, M. ·Emovon, O.Medical University of South CarolinaCharleston, SCPURPOSEThe purpose of the study was to establish the incidence ofneurologic symptoms in kidney transplanted patients (KTP)as well as to describe the spectrum and location of brain MRabnormalities.MATERIALS & METHODSOut of 744 KTP patients, 72 adults (9.7%) aged 18 to 72years old (mean 54 years old) exhibited various neurologicsymptoms and were evaluated by a total of 92 brain MRstudies. Patients were put into 3 groups based on how longafter transplantation that the brain MR was performed.Group 1 consists of 17 patients imaged up to 3 months aftertransplantation. Group II consists of 20 patients imaged 3months up to 1 year after transplantation. Group 3 consists of35 patients imaged more than 1 year after transplantation.Two neuroradiologists independently and retrospectivelyreviewed MR images and a final consensus was made. Inmost patients, standard MR brain protocol was used includingsagittal T1, axial T2, axial FLAIR, and axial and coronalpostcontrast sequences. Diffusion-weighted images weredone in 66 patients. In 5 patients, MRA was done. In 2patients, an MR sella protocol was performed, and onepatient required an MR orbits.
RESULTSThe most common clinical symptoms were as follows:altered mental status (25%), headache (22.2%), seizures(16.7%), blurry vision (9.7%), confusion (9.7%), hemiparesis(9.7%), weakness (8.3%), and dizziness (6.9%). Othersymptoms like gait abnormality, syncope, and lethargy wereless common. The symptom duration, magnesium, cholesterol,and calcineurine inhibitor levels were analyzed. Attime of MR imaging, serum levels of cyclosporine A andtacrolimus were within the normal range. In 25 (20.8%)patients, the brain MR was normal. MR imaging lesions typicallyhad hyperintense signal on T2 and FLAIR sequencesand isointense or hypointense signal on T1. Vascular changesincluding various types of infarction and scattered whitematter ischemic changes related to microangiopathy werepresent in a total 49 out of 72 (68.1%) patients. Interestingly,these lesions were seen more commonly in a white matterdistribution in the periventricular and subcortical frontalregion. Additional diagnoses included infection in 5 patients(6.9%), posterior reversible encephalopathy syndrome(PRES) in 2 patients (2.8%), and cerebellar lymphoma in 1patient (1.4%). In 6 patients (8.3%), there were additionalfindings within the calvarium related to renal osteodystrophyand occurred only in patients who received multiple renaltransplants. Other unrelated imaging findings includedmeningioma in 2 patients (2.8%), temporal bone tumor in 1patient (1.4%), and venous developmental anomaly in 2patients (2.8%).CONCLUSIONIn kidney transplant patients various neurologic symptomsand imaging features may be observed. Hemispheric whitematter changes were significantly more common thanchanges in gray matter. Ischemic changes predominate inthis patient population. Infection can be expected in the firstmonths after transplantation while PRES can occur later.Changes in the calvarium and de novo malignancies also canoccur.KEY WORDS: Kidney transplant, MR imagingPoster 12Evaluation of Early Infarct Volume as Assessed by CTPerfusion- and Diffusion-Weighted MR Imaging inStroke Patients297after the onset of symptoms in the mean. Parameter maps ofcerebral blood perfusion (CBP), cerebral blood volume(CBV) and mean transit time (MTT) were generated.Volume of diffusion abnormality was compared with theinfarct volumes as assessed by two blinded neuroradiologistsfor each of the perfusion maps.RESULTSAll patients developed infarction on follow-up studies. Sixpatients showed perfusions deficits in all perfusion images.In one patient, who had no DWI abnormality, perfusiondeficits only were found on CBP and MTT images. Meanvolumes of ischemia as assessed by CBP, CBV, and MTTwere 36.0, 16.5, 40.7 ml, respectively. Mean volume of DWIchanges was 25.1 ml. The most significant correlation wasfound between the extension of CBV reduction and the earlyinfarct volume assessed by DWI (r = 0.862, P < 0.01).CONCLUSIONOur preliminary results suggest that CBV maps based on theCTP technique applied in this study permit prediction ofinfarct volume in early stroke, so CTP would deliver informationabout the ischemic penumbra.KEY WORDS: Stroke, CT perfusion, diffusion-weightedimagingPoster 13Rate of Atrophy within the Medial Temporal Lobe as aDiagnostic Marker of Alzheimer’s DiseaseEndo, Y. · Rusinek, H. · De Santi, S. · Frid, D. · Tsui, W. ·Segal, S. · Convit, A. J. · de Leon, M. J.New York University School of MedicineNew York, NYPURPOSEIncreased volume loss occurs within medial temporal lobe(MTL) in Alzheimer’s disease (AD) patients (1). However,atrophy occurs with age even in normal elderly. The rate ofatrophy also has been shown to be higher in AD compared tocontrol groups (2). This study evaluates the utility of theannual MTL atrophy rate, as measured by serial MR imagingusing automated software tools, in differentiating ADfrom control.PostersBohner, G. · Bauknecht, H. C. · Stiepani, H. · Klingebiel, R.CCM, CharitéBerlin, GERMANYPURPOSEIn the acute phase of cerebral ischemia intraindividualassessment of infarct volume by means of different imagingmodalities is limited to single subjects because of narrowtherapeutic windows. We present first results from a study tocompare early infarct volume as assessed by CT perfusion(CTP) and MR diffusion-weighted imaging (DWI) in strokepatients.MATERIALS & METHODSSeven patients (age range 52 - 89 years) with clinical signsof acute cerebral ischemia underwent CTP in the mean 4.3hours after symptom onset; DWI was performed 6.0 hoursMATERIALS & METHODSAmong subjects evaluated in our AD center, we selectedthose with at least 2 MR images and with known time ofonset of AD (range 2.9 years prior to onset to 4.2 years afteronset). The control group consisted of elderly subjects withoutcognitive impairment. Baseline and follow-up MRimages were coregistered (3), and the region of interest(ROI) incorporating the left and right MTL was constructed.The annual atrophy rate was calculated using a locally developedautomated brain boundary shift procedure.RESULTSEighteen AD subjects (5 men/13 women, ages 54-85 years,baseline Mini Mental Status Exam score 26.0 +/- 3.4) and 21normal controls (7 men/14 women, ages 60-78 years) fulfilledthe inclusion criteria for the study. The mean MTLatrophy rate was 2.2 +/- 1.5% per year for the AD group and
Posters0.3 +/- 0.3% per year for the control (Figure). In eithergroup, there was no significant correlation between the MTLatrophy rate and age, gender, or education. Logistic regressionaimed at predicting the group given the age, gender,education, and MTL atrophy rate yielded a diagnostic accuracyof 92.3%, with 20/21 control and 16/18 AD subjectscorrectly classified. The two falsely classified AD patientswere both imaged 2.8-2.9 years before the diagnosis of probableAD (arrows, Figure). The maximum discrepancy in estimatingthe annual MTL atrophy rate by the two observerswas only 0.11% (mean absolute discrepancy 0.06%).298Poster 14A Longitudinal Study in Patients with Early Relapsing-Remitting Multiple Sclerosis: Diffusion MR ImagingChanges in Normal-Appearing White MatterGaudiello, F. · Garaci, F. · Ludovici, A. · Marziali, S. ·Colangelo, V. · Floris, R. · Simonetti, G.University of Rome Tor VergataRome, ITALYPURPOSESeveral reports have demonstrated increased tADC values inmultiple sclerosis (MS) patients white matter that appearsnormal (NAWM) on studies obtained with conventionaltechniques. The present study investigates water diffusionchanges over time and their relationship to different clinicalactivity and disability status in NAWM of patients with earlyrelapsing-remitting MS.CONCLUSIONThe annual MTL atrophy rate may be a candidate for a diagnosticmarker, as it was able to distinguish AD from controlwith 92.3% accuracy. Regional brain atrophy rate may beused to monitor the progression of AD and patients’ responseto therapy.REFERENCES1. Seab JP, Jagust WJ, Wong ST, Roos MS, Reed BR, Budinger TF.Quantitative NMR Measurements of Hippocampal Atrophyin Alzheimer’s Disease. Magn Reson Med 1988;8:200-2082. Schott JM, Fox NC, Frost C, et al. Assessing the Onset ofStructural Change in Familial Alzheimer’s Disease. AnnNeurol 2003;53;181-1883. Fox NC, Freeborough PA. Brain Atrophy ProgressionMeasured from Registered Serial MRI: Validation andApplication to Alzheimer’s Disease. J Magn Reson Imag1997;7:1069-1075KEY WORDS: Alzheimer’s disease, MR imaging, cerebralatrophyMATERIALS & METHODSWe selected 54 early MS patients and 18 age-matchedhealthy controls. Conventional MR study and diffusion MRimaging (DWI) study were obtained. Inclusion criteria were:a) definite relapsing-remitting MS according to MCDonald’s criteria; b) age between 18 and 50 years (mean age37.4 years); c) drug free for at least 60 days before enrollment;d) expanded disability status scale (EDSS) < 3.5. In asecond step 18 out of 54 patients completed a 6 month clinicaland MR imaging follow-up (baseline, 3 months and 6months). Nine of them had one relapsing episode during the6 month follow-up. Bilateral and symmetrical ROIs (elliptical,60 pixels) were drawn on FLAIR images in frontal WM,parietal WM, centrum semiovale, and middle cerebellarpeduncle and then transferred onto the trace maps to obtainthe corresponding tADC values. Regions of interest werenever placed over areas hyperintense on FLAIR and T2-weighted imaging.RESULTSTADC of NAWM of MS patients was significantly higherthan in controls (patients mean tADC ± SD = 0.768 ± 0.040mm2/sec x 10-3; controls mean tADC ± SD = 0.699 ± 0.036mm2/sec x 10-3; p < 0.001). TADC of NAWM of patientswith EDSS 2 was significantly higher than patients withEDSS < 2 (patients with EDSS 2 mean tADC ± SD =0.787 ± 0.036 mm2/sec x 10-3; patients with EDSS < 2 meantADC ± SD = 0.748 ± 0.038 mm2/sec x 10-3; p < 0.001).TADC of NAWM of relapsing patients was significantlyhigher than remitting patients (relapsing patients meantADC ± SD = 0.801 ± 0.027 mm2/sec x 10-3; remittingpatients mean tADC ± SD = 0.760 ± 0.043 mm2/sec x 10-3;p< 0.001).The longitudinal study completed in 18 of 54patients showed no statistically significant differences inmean tADC of NAWM at the different time points studied(T0,T3,T6). However tADC of the 9 patients that had arelapsing episode was significantly higher in their relapsingphase than in their remitting phase (relapsing phase meantADC ± SD = 0.787 ± 0.034 mm2/sec x 10-3; remittingphase mean tADC ± SD = 0.737 ± 0.026 mm2/sec x 10-3; p< 0.001).
CONCLUSIONThis study suggests that DWI can detect subtle alterations inNAWM in relapsing-remitting MS even in the early stage ofthe disease. These alterations are correlated with disabilitystatus and clinical activity. TADC changes in NAWM maysuggest ultrastructural alterations related to a more widespreadWM inflammatory process. These findings may representvariation in modulating factors (neurotransmissionand immunity) associated to inflammation and partiallyindependent of the presence and extent of axonal distruction.KEY WORDS: Multiple sclerosis, MR imaging, diffusionweightedimaging299time was very short (3.4 months) in those who showed deepgray matter involvement along with white matter involvementat the time of diagnosis (11/40 cases).CONCLUSIONThis study by using a relatively larger sample highlights theneuroimaging spectrum of “typical” and “atypical” findingsof PML. Findings like the deep gray matter involvementseen clearly on neuroimaging proved to be an importantprognostic sign for severity of disease. In a disease which isfatal and has no cure, invasive diagnostic procedures shouldbe avoided and hence lays the importance of knowing theneuroimaging spectrum.PostersPoster 15Progressive Multifocal Leukoencephalopathy: Imaging“A Pictorial Essay”Rehani, B. · Bharija, A. · Lankhkar, B.Kasturba Medical College HospitalManipal, INDIAPURPOSETo study the spectrum of neuroimaging findings in 40 casesof pathologically proven progressive multifocal leukoencephalopathy(PML) (in sero positive HIV and non HIVpatients) and to correlate it with clinical data and implications.MATERIALS & METHODSIt was a retrospective study of 40 patients (24 males and 16females) with confirmed PML by pathologic analysis (29autopsy reports, 11 stereotactic biopsy reports) reported from1998-2002 (5 years). Out of 40 patients 37 were sero positiveHIV, 2 were CLL-chronic lymphocytic leukemiapatients and one had hypogammaglobulinemia. Thirty-sixCT (34 contrast CT) and 29 MR (11 contrast MR) imageswere reviewed retrospectively and correlated with clinicaland pathologic data. These images helped outline a neuroimagingspectrum, which will be presented in this visualpresentation.RESULTSOut of 40 cases - Typical features were seen in 65% (26/40)cases as described in literature - multiple, asymmetrical, confluentand hypodense lesions on CT and hypointense on T1-weighted MR images and hyperintense on T2-weighted MRimages. Atypical features were - unifocal lesions seen in40% (16/40) cases, mild peripheral enhancement in 10%(4/40), mild atrophy in 15% (6/40) and deep gray matterinvolvement in 27.5% (11/40) cases. Site predilection notedin unifocal lesions was - high parietal lobe in 56% (9 /16)cases, temporo-occipital lobe in 12.5% (2 /16), and cerebellumin 18% (3/16) cases - with 2 out of them in middle cerebellarpeduncle. Clinical presentation correlated with the siteinvolved in case of unifocal lesions - such as ataxia in alesion in cerebellum and vision abnormalities in a lesion intemporo-occipital lobes. Overall, mortality was 100% andmean survival time in multifocal white matter involvementwas 4.6 months after diagnosis and 5.2 months in case ofunifocal white matter involvement. However, the survivalKEY WORDS: Progressive multifocal leukoencephalopathyPoster 16Can Hippocampal Volume Be an Indicator from MildCognitive Impairment to Alzheimer’s Disease ?: Three-Year Longitudinal Study of MR Hippocampal VolumetryLirng, J. · Liu, H. · Chang, F. · Guo, W. · Teng, M. M.Taipei Veteran’s General HospitalTaipei, TAIWAN REPUBLIC OF CHINAPURPOSETo evaluate if the hippocampal volume of the patients withmild cognitive impairment (MCI) at baseline and its annualdecline can predict the development of Alzheimer’s disease(AD), thus to serve as a risk factor for AD, and then as anindication for early antidementia treatment.MATERIALS & METHODSIn the past 3 years, we prospectively have recruited 126 participants,including 30 normal controls, 75 patients with MCIand 21 patients with AD. All individuals received memoryand neuropsychological tests, apoE genotyping, and MRstudy of hippocampal volumes. The high resolution obliquecoronal fast spin-echo (FSE) heavily T2-weighted imageswith the imaging orientation perpendicular to the long axisof the hippocampus was done for presentation of the detailedstructures of the hippocampi (TR/TE/NEX 4000/102/4,interleave 3 mm slice thickness). The area of the hippocampuswas measured semiautomatically in another workstationby manually tracing the outline of this structure. The volumewas obtained by the area timing the slice thickness (3 mm).RESULTSThe average hippocampal volume of the AD patients wassignificantly smaller than those of the normal controls andMCI subjects, but there was no difference between those ofcontrols and MCI individuals in the first year. Although thecognitive changes from the baseline were not differentbetween the groups of the normal controls and MCI, theMCI subjects showed significant decline in the hippocampalvolume compared to the controls in the second year. Thisimplies that the hippocampal volume may be more sensitivethan the cognitive decline in MCI subjects. In the third year,the MCI subjects had significant decline in most of the cognitivetests and also hippocampal volumes.
PostersCONCLUSIONThe MR hippocampal volumetry can be a more sensitivepredictor than the cognitive tests for the patients with MCI atan increased risk for developing AD.KEY WORDS: Hippocampus, Alzheimer’s disease, MR imagingPoster 17High Field (7 T) MR Imaging of Post-Mortem MultipleSclerosis BrainSchmierer, K. · Bainbridge, A. · Scaravilli, F. · Miller, D. H.· Ordidge, R. J. · Yousry, T. A.University College LondonLondon, UNITED KINGDOMPURPOSETo evaluate MR imaging characteristics (T1, T2) of postmortem(PM) multiple sclerosis (MS) brain under fresh conditionsand after fixation using a 7 T scanner.MATERIALS & METHODSOne tissue block of a fresh PM MS brain slice was used.After scanning under fresh conditions, the specimen wasfixed in 10% formaldehyde and scanned 6 times within 8weeks. MR imaging was performed on a 7 T Bruker Biospecspectrometer using a 2 cm diameter saddle coil. Images wereacquired with a field of view of 3 cm, an image matrix of 192x 256, and a slice thickness of 0.5 cm. Four sets of inversionrecovery images were acquired with imaging parameters: TE= 16 ms, TR = 5000 ms and inversion times (TI) = 100 ms,1000 ms, 2000 ms, and 4000 ms. Two sets of spin-echoimages were acquired (TE = 20 ms and 60 ms, TR = 2000ms). T1 and T2 parameter maps were produced. For one sliceat each timepoint, coregistered to the initial scan, T1 and T2were measured in the normal appearing (NA) white matter(WM) and the NA gray matter (GM), and in lesions. Afterthe final scan, the tissue block was processed for embeddingin paraffin and sections stained (H&E, Luxol-Fast blue,Bielschowsky’s silver impregnation). A Leica Q500MCimage analyzer was used to quantify myelin by measuringtransmittance (Tr) on LFB-stained slides. Point-countingwas performed to quantifiy axons.RESULTSTwo chronic inactive MS lesions were detected on MRimaging and confirmed histologically. One demyelinatedlesion included the WM and cortical GM, the second was aremyelinated WM lesion. Coregistration between MR imagingand histology, and between scans at the different timepointswas excellent. After fixation T1 of NAWM andNAGM decreased by 40% within 60 days of fixation (p
RESULTSFour individual cases were identified consisting of 4 females(average age 45.25 years). Three of the cases occurred inpatients on cyclosporine therapy. The remaining patient hada history of chronic renal failure and hypertension. All caseswere scanned within a 24-hour period following a presentingneurologic event. Diffusion coefficients were elevated significantlyin lesions (1.46 ± 0.25 x10 -3 mm 2 /s) compared tocontrol regions (0.775 ± 0.014 x 10 -3 mm 2 /s, p < 0.05). MTEin lesions (1.45 ± 0.13s) did not show any statistical differencecompared to ipsilateral caudate head (1.43 ± 0.13s, p >0.1). Lesion and control (caudate) values showed strong correlation(r = 0.99). A comparison of the lesion NEI (66.4 ±9.0) to a contralateral area of unaffected white matter NEI(64.5 ± 13.6) also did not show statistical difference (p >0.9). Graphs of “control vs lesion” for both NEI, MTE, andADC values are seen in Figure 1.301Poster 20Diffusion Tensor MR Imaging in Multiple Sclerosisda Cruz, L. C. H. 1,2 · Ferreira, F. B. 1,2 · Cantolo, A. C. P. 1 ·Domingues, R. C. 1,2 · Domingues, R. C. 1,21Multi-Imagem Ressonancia, Rio de Janeiro, BRAZIL,2CDPI - Centro Médico Barrashopping, Rio de Janeiro,BRAZILPURPOSETo determine whether diffusion tensor (DT) MR imagingcan demonstrate differences in acute and chronic multiplesclerosis (MS) plaques and to assess the normal appearingwhite matter (NAWM) surrounding the plaques to determinethe real extent of the lesions.MATERIALS & METHODSTwenty-seven MS patients (21 female, 6 male; mean age 32years old) and 15 healthy controls age-matched ( 9 male, 6female; mean age 29 years old) underwent diffusion tensorand conventional MR imaging exam performed in a 1.5 Tclinical scanner ( Siemens, Germany). Generation of fractionalanisotropy (FA) maps was performed in all patients.Identical regions of interest (ROIs) were placed by an experiencedneuroradiologist on the plaques, in the NAWM surroundingthe lesions and at the corresponding location in thecontrol group. Multiple sclerosis lesions were classified asacute or chronic plaques, depending on their appearance inthe conventional MR imaging and clinical symptoms.PostersRESULTSThe mean FA measured in acute plaque demonstratedreduced anisotropy 50% that of the averaged correspondingnormal white matter (NWM) in controls subjects. Chronicplaques had 65% of reduction comparing to NWM. Therewas a difference of about 30% between the FA values ofacute and chronic plaques. The mean FA of NAWM surroundingthe plaque was 80% of the value of NWM in controlsubjects. The abnormalities founded in the plaques FAvalues and in the NAWM surrounding them demonstratedthat the average plaque size increased around 150% of thesize visualized in conventional MR imaging.CONCLUSIONThese results suggest that DT imaging may represent a moreaccurate MR imaging method to determinate the extent ofthe demyelinating process in MS patients and also contributein the identification and differential diagnosis between acuteand chronic plaques.Figure 1.KEY WORDS: Multiple sclerosis, diffusion tensorCONCLUSIONMR perfusion analysis of 4 cases of PRES did not show anyregional difference in relative cerebral blood volume orbolus transit time when comparing lesion foci to areas ofnormal brain, despite pronounced elevation of apparent diffusioncoefficient. This shows that there is no focal perfusionabnormality within the affected areas, while supporting thehypothesis of vasogenic edema secondary to BBB disruption.KEY WORDS: Perfusion, diffusion, PRES
PostersPoster 21Lesions of the Corpus CallosumHeaney, C. J. · Campeau, N. G. · Witte, R. J. · Edmister, W.B. · Lane, J. I.Mayo ClinicRochester, MNPURPOSEA pictorial review of the MR findings of lesions of the corpuscallosum and summary of helpful radiographic featuresto differentiate among these lesions.302RESULTSCortical thickness decreases significantly every other decadeof normal aging (3.5 mm +/- 0.1 to 3.2 mm +/- 0.1 comparinggroups 1 and 6). The ventricular parameters scale up aswell, in particular the third ventricle (4.1 +/- 0.7 mm forgroup 1 to 7.7 +/- 2.7 mm for group 6). External and internalatrophy are strongly related (p < 0.01, r = -0.583) and bothshow a strong correlation with age (r = -0.69 and r = 0.65).MATERIALS & METHODSWe retrospectively reviewed cases of pathology of the corpuscallosum collected over the past 10 years.RESULTSThere is a wide spectrum of diseases that involve the corpuscallosum. These can be summarized under broad categoriesof congenital/developmental, neoplastic, vascular, inflammatory,demyelinating, and posttraumatic. These are discussedwith emphasis on differential imaging characteristics.CONCLUSIONThe imaging features encompassing the spectrum of abnormalitiesthat involve the corpus callosum are summarized inthis pictorial essay.KEY WORDS: Corpus callosum, epilepsy, postictalPoster 22Brain Atrophy in Normal Aging: A MorphometricEvaluation of 525 BrainsPreul, C. · Hund-Georgiadis, M. · Lohmann, G. · vonCramon, D.Max-Planck-Institute of Cognitive NeuroscienceLeipzig, GERMANYPURPOSETo morphometrically evaluate if external atrophy and internalatrophy physiologically appear with advancing age. Theeffects of gender and handedness on morphometric valueswere tested in a large sample of normal subjects.MATERIALS & METHODSThree-dimensional MR images of 525 healthy volunteers(17-68 years) were analyzed retrospectively for corticalthickness and planimetrically determined ventricular indices(ventricular body index, anterior horn index, 3rd ventricularwidth). Age groups 1-6 covering 6 decades of normal agingwere defined. Cortical thickness was assessed using an automatedalgorithm.CONCLUSIONOur results suggest that brain atrophy physiologically occurswith normal aging. Cortical thickness decreases in plateausevery other decade from teenage-life on, whereas the ventricularparameters increase more constantly. Our morphometricanalysis provides valuable information for the evaluationof MR images in terms of a physiologic or nonphysiologicatrophy with advancing age.KEY WORDS: Normal aging, cortical thickness, morphometryPoster 23Selective Brain Atrophy and Cognitive Impairment inRelapsing Forms of Multiple SclerosisAlonso, J. · Borras, C. · Aymerich, X. · Porcel, J. ·Montalban, X. · Rovira, A.Hospital Vall d’HebronBarcelona, SPAINPURPOSECognitive impairment is common in multiple sclerosis (MS)and various mechanisms have been proposed to explain it. Arelationship also has been observed between whole-brainatrophy and cognitive impairment, although the role ofregional atrophy has been studied less extensively. In consequence,the objective of this work is to study the associationbetween cognitive impairment and selective normalized volumesof the brain (gray and white matter).MATERIALS & METHODSA total of 20 MS patients and 11 healthy controls participatedin the study approved by the Research and EthicsCommittee of our hospital. MS patients were assessed bymeans of a comprehensive neuropsychological batterydesigned to assess attention, memory, executive functions,and visuospatial abilities. One deterioration mark was given
to each patient when the performance on the test was below2 standard deviations from test published norms. Cognitiveimpairment was defined as failure of 4 or more tests. MRstudies of patients and controls were performed with a 1.5 Tmagnet. MR studies consisted of T2- and T1-weightedimages (contiguous 3 mm slice thickness covering the wholebrain) from which the intracranial region, brain parenchyma,white and gray matter volumes were determined by means ofin-house developed software. Measures of brain parenchymafraction (BPF), white matter fraction (WMF) and gray matterfraction (GMF) were obtained from the ratio between thevolumes of these regions and the intracranial region volume.ANOVA and Bonferroni post-hoc test with a p < 0.05 significantlevel were used to assess significant differences amonggroups.RESULTSNine MS patients showed cognitive impairment. There wereno statistical differences in age, EDSS, years of education,and disease duration between cognitively impaired (CIMS)and nonimpaired (CNMS) MS patients. BPF values showedsignificant differences between controls and both MS groupsas well as between unimpaired and impaired MS groups.White matter fraction values were decreased significantly inboth MS groups as compared to the controls. Gray matterfraction values were decreased significantly in impairedpatients with respect to unimpaired patients and controls;nevertheless, in unimpaired patients, GMF values were similarto the controls.CONCLUSIONIn agreement with previous works, our study shows that cognitiveimpairment in MS is associated with brain tissue loss.Additionally, our results suggest that gray matter loss contributeto the pathologic process responsible for the cognitiveimpairment observed in relapsing MS patients.KEY WORDS: Multiple sclerosis, brain, MR imagingThe authors of this work have indicated the following affiliations/disclosures:“Fondo de Investigación Sanitaria” ofthe “Ministerio de Sanidad y Consumo” FIS Ref. 99/0236:Grant.Poster 24Afflictions of the Pons: Distinctive MR FeaturesRevisitedBonfante, E. · Cacayorin, E. D. · Sitton, C. W. · Lutzker, S.L.Memorial Hermann HospitalHouston, TXPURPOSEFamiliarity to the complex anatomical constituents of thepons and recognition of the predilection tendency and pathologicallyrelated MR features of certain disease processesconstitute the major objectives of this presentation.303RESULTSAs hereby anatomically depicted, the pons is the central portionof the brainstem, intrinsically constituted by descendingand ascending white matter motor tracts, along with graymatter nuclei of the cranial nerves V, VI, VII, and VIII.Certain disease processes may exhibit predilection for a particularanatomical constituent of the brainstem and closeintegrated analysis of their tendencies with the basic MRimaging findings would enhance our capabilities of understandingthe underlying pathologic substrates and accuracyof diagnosis of the lesions. Overall, there is a broad differentialdiagnosis for lesions of the pons which would includeinfarcts, primary and secondary neoplasm, demyelinatingdisease, osmotic demyelination, vascular malformation, andrhombencephalitis. Definitive diagnosis may not be attainableparticularly with viral encephalitis. Management neverthelessmay be influenced heavily by the clinical concernsand prevalent radiologic diagnostic consideration. Our presentationwill include cases that can be categorized as complexand difficult. Multiple sclerosis, a demyelinating disorderthat frequently involves the periventricular white matterand corpus callosum may affect the white matter tracts of thepons including the middle cerebellar peduncles. Recent andactive lesions can be identified as areas of restricted diffusionon the diffusion-weighted imaging sequence and mayexhibit paramagnetic contrast enhancement. The lesions areparticularly most conspicuous on the long TR images.Osmotic myelinolysis is characterized by symmetricdemyelination of the base of the pons, spreading centrifugallyfrom the median raphe. Focal myelinolysis also can beseen in the cerebral peduncles, lateral thalami, basal ganglia,and corticomedullary junction of the cerebellar hemispheres.The lesions that are of low T1 and high T2 intensities arepreponderantly delineated in the distribution of the transversepontine fibers with sparing of the corticospinal tracts.Most of the lesions do not enhance. Subacute sclerosingpanencephalitis (SSPE) preponderantly affects the periventricularand subcortical white matter and basal ganglia. Withinvolvement of the brainstem, there is predilection for thewhite matter tracts and substantia nigra with relative sparingof the pontine tegmentum. In acute disseminatedencephalomyelitis (ADEM), a disease process considered tobe autoimmune mediated, perivenular demyelination andinflammatory changes including gliosis, affect the deepwhite matter structures of the brainstem and cerebellum.Gray matter involvement also may be evident. Paramagneticcontrast enhancement particularly with use of double doseoften observed. Unless complicated by infarctions or hemorrhage,most of the lesions resolve. The changes ofencephalomyelitis are overall most conspicuous on the longTR images. We have observed restricted areas of diffusion inthe cases with corresponding areas of contrast enhancement.CONCLUSIONAlthough differential diagnosis of disease processes affectingthe pons can be challenging, analysis of anatomicalpredilection, MR features, and clinical correlation can give aclue to the management.KEY WORDS: Pons, demyelination, inflammatoryPostersMATERIALS & METHODSWe present different cases of pontine lesions and analyze thediagnostic approach with emphasis on the differential diagnosis.
PostersPoster 25Quantitative Morphologic Study of Hippocampus inAlzheimer’s DiseaseZicherman, J. M. 1 · Niculescu, G. 2 · Demarco, K. 1 · Foran,D. 21Robert Wood Johnson University Hospital, NewBrunswick, NJ, 2Center for Biomedical Imaging &Informatics, Piscataway, NJPURPOSETo compare hypocampal morphometry in Alzheimer’s diseasebased on a manual and automated segmentation.MATERIALS & METHODSSubjects met NINCDS/ADRDA criterion for the diagnosisof Alzheimer’s disease and had a minimental status examscore within the range of 10-24. MR images of fourAlzheimer’s subjects and three controls were obtained witha 1.5 T GE Sigma scanner from UMDNJ-RWJMS using astandard head coil and a coronal 3D spoiled gradient-echosequence (SPGR 3D: TR 25 msec, TE 5 msec, flip angle 40degrees, bandwidth 10.42, matrix 256 x 192, FOV 240 mm,slice thickness 1.5 mm). Hippocampal structures were segmentedby manual contouring using Analyze software(Mayo Clinic) and by automated mean shift algorithm developedin house. Volumes subsequently were calculated. Themanual segmentations were performed by the same expertrated on two occasions, separated by an interval of severaldays. Regions of interest included the hippocampal head,body, and tail. The most posterior extent of the hippocampaltail was at the coronal image demonstrating the retrosplenialgyrus of the corpus callosum. The anterior border of the hippocampalhead was the subiculum at the interface with theamygdala. The alveus and subiculum were included in volumeanalysis while the fornix and fibria were excluded. Theautomated segmentation decomposition of a gray levelimage into homogenous tiles was performed on a slice-byslicebasis. The image is interpreted as a joint spatial-rangedomain where the spatial domain is defined by the (x, y)coordinates and the range domain is defined by the intensityvalue. The modes are stationary points where the gradient ofthe joint density function is zero. Each pixel becomes associatedwith a significant mode of the joint domain densitylocated in its neighborhood and after nearby modes arepruned the segmentation results. We use double ellipticFourier descriptors to quantify changes in the shape of thehippocampus in Alzheimer’s subjects.WithdrawnRESULTSManually segmented volumes were significantly lower inAlzheimer’s subjects than in controls. The right and left hippocampalvolumes were reduced 34% in the subjects withAlzheimer’s disease when compared to the controls. Thevolume loss in patients’ hippocampus was associated withthe shape changes. The accuracy of the automated segmentationwill be determined by calculating the average percentagedifference.CONCLUSIONThe availability of automatic tools for neuromorphometry inconjuction with morphometric analysis should improve ourunderstanding of neurologic disorders.304KEY WORDS: Alzheimer’s disease, hippocampusPoster 26Delayed Encephalopathy after Acute Carbon MonoxidePoisoning: Mismatch between Diffusion-Weighted andDiffusion Tensor MR ImagingVila, J. F. 1,2 · Meli, F. 2 · Serqueira, O. E. 1 · Pisarello, J. 1 ·Lylyk, P. 11ENERI, Buenos Aires, ARGENTINA, 2Institute forNeurological Research, Buenos Aires, ARGENTINAPURPOSEA delayed neurological syndrome (DNS) occurs in 15% ofacute carbon monoxide poisoning (ACMP) cases. The severityof white matter (WM) lesions varies from simple palestaining myelin sheaths, demyelination with spared axons, toconfluent necrotic plaques (1). Some authors (2, 3) suggestthat diffusion-weighted imaging (DWI) may be helpful forearly identification of WM changes, though unrelated toclinical defects. We present a case that had better clinicalcorrelation with diffusion tensor image (DTI) than DWI.MATERIALS & METHODSA 51-year-old man was admitted in coma for ACMP. Thepatient was intubated and ventilated with oxygen, recoveringconsciousness 6 hours later. MRimaging showed globus palliduslesions, and diffuse high intensity of WM on T2-weighted imaging. At home 3 weeks later, the patient developedcognitive and motor impairment to progress to an akineticmutism with incontinence within 10 days. MR imagingrevealed increased signal intensity of WM in T2 and FLAIR.High signal intensity was seen at the same locations in DWIand apparent diffusion coefficient (ADC), with lower ADCvalues in frontal WM. Fractional anisotropy maps (FAM)showed qualitative frontal periventricular changes, andasymmetrical lower values in bifrontal WM. With a diagnosisof DNS, hyperbaric oxygen therapy was administered (35daily sessions of 45 min. each, at 2.5 absolute atm.).Treatment then was started with L-dopa agonist. Threemonths after ACMP, examination revealed right frontal signsand axial paratonia, cognitive frontal-subcortical impairment(Frontal Assessment Battery score 14), Barthel Index score100, Folstein Mini Mental State Examination score 29, andRankin score 1 pt. Five months after onset, clinical examinationand FAM were normal. MR imaging was performedwith a CVi/NVi 1.5 T imager (General Electric MedicalSystem, Milwaukee, WI) with a standard head coil.RESULTSIn agreement with reported findings (4-6), we found globuspallidus and diffuse bilateral WM lesions on T2-weightedimaging, FLAIR and DWI. White matter lesions wereincreased during delayed neurologic defects suggesting progressiverestricted diffusion. Unexpectedly, we observedqualitative asymmetrical patterns of bifrontal WM involvementin FAM of DTI images. Compared with DWI, theseimages showed a so-called DWI/DTI mismatch. Clinicaloutcome correlated more closely with DTI findings thanwith DWI images. Additional FAM values were significantlylower on right frontal than contralateral areas (mean FAM
was 0.15 on right, and 0.24 on left frontal WM). Total remissionof symptoms was confirmed by normal FAM at the lastMR imaging.305KEY WORDS: Multiple sclerosis, contrast agent, effectivenessCONCLUSIONDuring follow-up DWI showed diffuse high intensity lesionsin WM, and DTI revealed a focal asymmetrical decrease inFAM on frontal WM, which normalized at the last MR imaging.The mismatch between DWI and DTI in MR image correlatedpositively with the patient’s clinical improvement.Such clinical and radiologic reversibility supports includingDTI to glean additional information on the prognosis andevolution of patients with DNS after ACMP.KEY WORDS: Delayed encephalopathy, monoxide poisoning,diffusion tensor imagePoster 27Technical and Diagnostic Properties of T2-Weighted MRImaging after the Application of Gd-DTPA in the Follow-Up of Patients with Multiple SclerosisTaschner, C. A. · Kirsch, E. C. · Scheffler, K. · Kappos, L. ·Radü, E. W.Kantonsspital BaselBasel, SWITZERLANDPURPOSETo determine whether T2-weighted imaging of the brain canbe performed after the administration of Gd-DTPA in the follow-upof patients with multiple sclerosis.MATERIALS & METHODSIn 50 patients (16 patients with multiple sclerosis) T1- andT2-weighted MR imaging was performed before and afteradministration of Gd-DTPA (Magnevist, Schering, Berlin,Germany). The signal intensity in T2-weighted images wasmeasured within cerebral lesions, in enhancing lesions, andin various anatomical locations. Additionally the pre andpostcontrast series were evaluatedquantitatively and qualitativelyby two blinded readers. Finally the dependence of thesignal intensity of a T2-weighted turbo spin-echo sequenceof the Gd-DTPA concentration was simulated numerically.RESULTSNo significant changes in signal intensities were observedneither in the gray nor the white matter. In 20 enhancinglesions a significant rise of signal intensity in the range of4% (p < 0.01) was observed. Two experienced readers didnot observe any significant differences between T2-weightedpre and postcontrast series in the counted number oflesions, the maximal diameter of the largest lesion and in theinterpretation of images.CONCLUSIONT2-weighted imaging performed prior to and after theadministration of gadolinium provides similar information.The change of MR protocols with T2-weighted imagingacquired after the administration of gadolinium allows shorterexamination time and assures sufficient time for contrastenhancement in cerebral lesions with a disrupted blood-brainbarrier.Poster 29T1 and T2 Characterization in Mice Brain duringHyperoxia at High Magnetic FieldUematsu, H. 1 · Takahashi, M. 2 · Hatabu, H. 2 · Wehrli, S. L. 3 ·Wehrli, F. W. 4 · Asakura, T. 31University of Fukui, Fukui, JAPAN, 2 Beth Israel DeaconessMedical Center, Harvard Medical School, Boston, MA,3Children’s Hospital of Philadelphia, Philadelphia, PA,4University of Pennsylvania Medical Center, Philadelphia,PAPURPOSEAn increased concentration of dissolved oxygen in the bloodcauses a reduction in the T1 relaxation time that has beenattributed to the molecular paramagnetism of oxygen.Although this T1 shortening has been reported in the lungs,abdominal organs and skeletal muscle, studies of the centralnervous system are substantially sparse. On the other hand,it is known that the T2 value increases as the oxy-Hb contentin blood increases (BOLD effect). The aims of this studywere to characterize T1 and T2 changes in mice brain duringhyperoxia at 9.4 T.MATERIALS & METHODSThe experiments were carried out using wild-type mice. Allexperiments were performed on a 9.4 T MR system(Bruker). The mice inhaled either 100% oxygen (N = 8) orcarbogen (N = 8). After SE images were obtained for T1 andT2 measurement over approximately 15 min, the room airwas changed to either 100% oxygen or carbogen. Five minuteslater, the same scan protocol was repeated. The regionsof interest (ROIs) were placed on the cerebral cortex andpituitary gland to calculate the T1 and T2. Statistical analysisof the data was performed using paired Student’s t-test.RESULTSDuring hyperoxia, the T1 value of the cerebral cortex significantlydecreased in comparison with that under room air(100% oxygen: 11% decrease, P < 0.05 and carbogen: 9%decrease, P < 0.05), while there was no significant differencein the pituitary gland. No significant difference in %T1changes was observed between the 100% oxygen and carbogenconditions. The T2 value of the cortex and pituitarygland, as compared with that under room air, significantlyincreased during exposure to either 100% oxygen (cortex:3.7% increase, P < 0.05 and pituitary gland: 16.4% increase,P < 0.001) or carbogen (cortex: 5.4% increase, P < 0.05 andpituitary gland: 20.8% increase, P < 0.001). No significantdifference in %T2 changes was observed between 100%oxygen and carbogen conditions.CONCLUSIONShortening of the T1 value during hyperoxia was demonstratedclearly. The increased dissolved oxygen may act as adipole-dipole relaxation agent during hyperoxia. Thechanges in T1 were not significantly different between 100%oxygen and carbogen conditions. The reduced cerebral perfusionduring inhalation of 100% oxygen may have littleeffect on T1. The pituitary gland receives blood flow fromPosters
Postersthe brain, in addition to receiving regular arterial blood supplies.A reduced concentration of dissolved oxygen mightcause this insignificant T1 reduction in the pituitary gland. Inthe case of T2, the mechanism may be related to the conversionof deoxy-Hb to oxy-Hb, which may make the intracellularenvironment more diamagnetic (BOLD effect).Carbogen is known to have another effect that may alter theT2 value of the normal brain. Vasodilation increases thecerebral blood flow and blood volume, which may contributeto the observed prolongation of T2 during inhalationof carbogen. However, no significant difference in T2 wasobserved between the 100% oxygen and carbogen conditions.Therefore, our results suggest that at 9.4 T, the prolongedT2 during hyperoxia is caused mainly by increasedBOLD effect rather than by increased cerebral blood flowand blood volume.306of verbal test in Group A and B were 17.5 ± 5.6 and 17.3 ±5.1 respectively, and those of WAIS-R in Group A and Bwere 26.3 ± 9.6 and 26.1 ± 9.3 respectively. After the medication,the mean score of animal test in Group A and B were24.5 ± 6.3 and 17.6 ± 4.5 respectively (P < 0.001), those ofverbal test in Group A and B were 24.6 ± 6.9 and 17.7 ± 6.5respectively (P < 0.005), and those of WAIS-R in Group Aand B were 46.4 ± 12.3 and 27.6 ± 11.9 respectively (P 2.1) tend to have a good response tomedication or psychotherapy. The measurement of NAA/Crratio before treatment is useful for the prediction of prognosisin the depressive disease. Our data also suggest thatischemic change in deep white matter may be an unfavorablefactor for the effective treatment of the disease.REFERENCES1. Fazekas AJR Am J Roentgenol 1987;149:351-356KEY WORDS: MR spectroscopy, depression, prognosisPoster 31Technique and Clinical Utility of CT and MR Perfusionin Current PracticeSpitzer, E. M. 1 · Curtin, K. R. 1 · Walker, M. T. 1 · Shaibani,A. 1 · Carroll, T. J. 2 · Sakaie, K. E. 2 · Shin, W. 2 · Khawar, S. 2· Parrish, T. 21Feinberg School of Medicine of Northwestern University,Chicago, IL, 2 Northwestern Memorial Hospital, Chicago,ILPURPOSEIn this exhibit we will discuss the acquisition and postprocessingtechniques involved in cranial MR and CT perfusiontechniques. We will present specific cases where CT or MRperfusion provided useful clinical information.MATERIALS & METHODSQualitative dynamic susceptibility contrast-enhanced MRperfusion techniques will be described including data acquisitionand postprocessing techniques, which result in colormaps of relative cerebral blood flow (rCBF), relative cerebralblood volume (rCBV), and relative mean transit time(rMTT). Quantitative whole brain MR perfusion parameterscan be obtained utilizing a “bookends” technique, which willbe described. Quantitative CBV measurements of hemisphericwhite matter are calculated by utilizing separatemeasurements of cerebral hemispheric white matter T1 withrapid true FISP pulse sequence measurements from whichqCBF values can be obtained. Spin labeling MR perfusionflow measurements do not require gadolinium injection andinstead “label” the flowing blood with a saturation pulse. We
307also will discuss cranial CT perfusion acquisition and postprocessingtechniques including selection of an arterial inputfunction.RESULTSPerfusion imaging techniques can offer valuable clinicalinformation. In stroke patients, a penumbra of decreased perfusionaround a central core of restricted diffusion can beidentified and represents tissue that may be salvageable.Areas of chronic ischemia, such as in cases of carotid occlusionand moyamoya disease, can be studied to assess the statusof collateral circulation. In these cases, perfusion studiesoffer the neurosurgeon information that can support the utilityof an external carotid to internal carotid bypass. MR perfusionmaps can demonstrate improved regional flow aftersuccessful intracranial stent placement or angioplasty.Perfusion parameters also are affected by rapid blood pressurechanges, such as in cases of posterior reversibleencephalopathy syndrome (PRES). Hypoperfusion relativeto arterial vasospasm can be identified after subarachnoidhemorrhage and may become an important component oftheir management plan. A patient’s vasodilatory capacity canbe analyzed by the change in the rCBF after the administrationof acetazolamide (Diamox). Additionally, CBV ratiosmay better characterize an intracranial mass and help narrowthe differential diagnosis. Examples of these and other caseswill help illustrate the growing clinical utility of CT and MRperfusion techniques.CONCLUSIONCT and MR perfusion techniques can be helpful in managementand clinical decision-making in a wide variety of diseaseprocesses affecting the brain. As the technologyevolves, CT and MR perfusion likely will become an integralcomponent of many imaging algorithms.KEY WORDS: MR perfusion, CT perfusionPoster 32Multivoxel Proton Spectroscopy in Malformations ofCortical DevelopmentLeite, C. C. 1 · Otaduy, M. C. G. 1 · Lucato, L. T. 1 · Valente, K.D. 1 · Mukherji, S. K. 21University of São Paulo, São Paulo-SP, BRAZIL,2University of Michigan School of Medicine, Ann Arbor, MIPURPOSETo evaluate by multivoxel proton spectroscopy (1H-MRS)patients with malformations of cortical development (MCD).MATERIALS & METHODSWe studied 28 patients presenting epilepsy with MCD. TheMR imaging protocol included: sagittal T1-weighted imaging,axial inversion recovery imaging, coronal SPGR, coronalfluid-attenuated inversion recovery imaging, axial T2-weighted imaging and proton spectroscopy. Multivoxel protonspectroscopy was performed using PRESS technique onan axial slice exciting a large volume of interest (VOI)including the area with MCD. In each VOI, a smaller VOI of2.25 cm 3 centered on the MCD was selected to study N-acetyl-aspartate/creatine (NAA/CR), choline/creatine(CHO/CR) and N-acetyl-aspartate/choline (NAA/CHO)ratios. In patients who presented with unilateral involvementin anatomical imaging, we studied the metabolite ratios inthe apparently normal-appearing contralateral side. We alsostudied an age-matched control group (n = 30) with the same1H-MRS protocol.RESULTSThe MR images defined the type of MCD. Sixteen patientspresented unilateral MCD, and in these the contralateral sidealso was studied. From the 29 analyzed VOIs with MCD: 15were composed of gray matter heterotopia, 6 of cortical dysplasia,3 VOIs of schizencephaly, 3 of polymicrogyria, and 2of hemimegalencephaly. The 1H-MRS of both the MCDlesions and of the normal-appearing contralateral side inpatients with unilateral involvement showed decreasedNAA/CR and NAA/CHO ratios while CHO/CR ratio wasnormal when compared to the control group. The normalappearingcontralateral side in patients with unilateralinvolvement did not present statistical significant differencesin the metabolite ratios in comparison to the MCD lesions.Metabolites ratios obtained in the patients and control groupaccording to their locationNAA/CR CHO/CR NAA/CHOMalformations of cortical 1.70 ± 0.53 1.26 ± 0.33 1.46 ± 0.58development areasContralateral side 1.76 ± 0.56 1.29 ± 0.42 1.44 ± 0.52Control group 2.55 ± 0.35 1.26 ± 0.30 2.14 ± 0.58CONCLUSIONMultivoxel proton spectroscopy showed abnormal metaboliteratios in both the MCD lesions and in the normal-appearingcontralateral side in patients with unilateral MCD. Thesefindings suggest a more diffuse cerebral involvement thandetected by anatomical MR imaging. From a practical standpoint,in 1H-MRS studies of MCD, the contralateral normalappearingside should not be used as a control.KEY WORDS: MR imaging, multivoxel spectroscopy, malformationsof cortical developmentPoster 33Differentiation of Tumor Recurrence from Radiation-Induced Necrosis Using Diffusion Tensor ImagingSundgren, P. C. · Dong, Q. · Weybright, P. · Welsh, R. C. ·Mukherji, S. · Chenevert, T. L.University of Michigan HospitalsAnn Arbor, MIPURPOSETo evaluate the ability of diffusion tensor imaging (DTI) indistinguishing between radiation necrosis and brain tumorrecurrence in patients after radiotherapy.MATERIALS & METHODSWe reviewed 16 patients (7 males, 9 females, 5-56 years old,mean age 35 years) who developed new contrast-enhancinglesions 3-36 months after radiation treatment of the originaltumor. Histologic diagnoses of the original tumors in these16 patients were astrocytic tumors (11 patients), metastases(3 patients), medulloblastoma (1 patient), and ependymoma(1 patient). The final differentiation between tumor recur-Posters
Postersrence and nonneoplastic necrosis of the new enhancing massfound after radiotherapy was decided based on either histologicfindings or follow-up MR examinations and clinicalconditions. In 4 patients who received histologic verification(by either surgical resection or stereotactic biopsy), therewere 2 cases of tumor recurrence and 2 of radiation necrosis.In the remaining 12 patients who did not undergo surgicalintervention, the lesions were considered to be nonneoplastictherapy-related changes if the enhanced lesions disappeared(n = 3) or decreased in size (n = 2) in subsequent MRexaminations. Otherwise, tumor recurrence was entitled ifthe enhancing lesions increased extensively in size on follow-upserial MR examinations (n = 5), and the patient’sclinical condition deteriorated progressively during that period(n = 2). In addition to routine T1-weighted, T2-weighted,FLAIR and, contrast-enhanced T1-weighted sequences, DTIwas obtained using a single shot spin-echo EPI technique (9directions, b = 1000s/mm 2 ). All examinations used a 1.5 Tsystem with the manufacturer-supplied birdcage, quadraturehead coil. Image postprocessing was performed to generateADC and FA maps with vendor-provided software. Theregion of interest (ROI) was placed in solid part of theenhancing lesions according to contrast-enhancing T1images and T2-weighted (b0) images. ADC, FA values, andthe standard deviation then were calculated. Two-sample ttest was used for statistic analysis.RESULTSApparent diffusion coefficient values for tumor recurrence(range = 1.16-1.29 x 10 -9 mm 2 /s, mean ± SD=1.21 ± 0.12)were significantly higher (p < 0.05) than those for radiationinducedcerebral necrosis (range = 1.05-1.15 x 10 -9 mm 2 /s,mean ± SD = 1.10 ± 0.12). A decreased FA also was demonstratedin both groups related to normal white matter withranges of 0.10-0.32 (mean ± SD = 0.19 ± 0.05) for tumorrecurrence, and 0.15-0.5 (mean ± SD = 0.27 ± 0.06) fornecrosis.CONCLUSIONOur findings are consistent with previous reports (1, 2). Thehigher ADC values found in the areas of tumor recurrencemay be due to micronecrotic changes in treated brain tissuein these patients. On the other hand, the lower ADC in radiationnecrosis patients may be a result of scarred tissue thatretards water movement. Deceased FA value in both groupscan be explained by the destruction of white matter.However, this is not specific enough to distinguish the differencebetween tumor recurrence and necrotic change. Ourinitial results suggest that DTI potentially can provide a noninvasivemeans to distinguish between tumor recurrence andradiation necrosis.REFERENCES1. Le Bihan D, et al. Top Magn Reson Imag 1993;5:25-312. Tung GA, et al. AJR Am J Roentgenol 2001;177:709-712KEY WORDS: DTI, brain neoplasm, radiation-inducedchanges308Poster 34Proton MR Spectroscopic Evidence for FunctionalThalamic Involvement in Diabetic NeuropathySelvarajah, D. 1 · Wilkinson, I. D. 1 · Emery, C. J. 1 · Tesfaye,S. 2 · Shaw, P. J. 1 · Griffiths, P. D. 11University of Sheffield, Sheffield, UNITED KINGDOM,2Royal Hallamshire Hospital, Sheffield, UNITED KINGDOMPURPOSEDiabetic neuropathy (DN) is a common debilitating complicationof diabetes mellitus. In fact, diabetes is the leadingcause of nontraumatic lower limb amputations in the westernworld. Pathologic abnormalities of the peripheral nerves inDN have been well quantified. However, the extent of centralnervous system involvement remains unresolved. Acomplete understanding of the full extent of nervous systeminvolvement is crucial to elucidating the pathogenesis of DNand facilitates the development of rational treatments. Thisstudy uses proton MR spectroscopy (H - MRS) to determinethe neurochemical constitutional make-up of deep gray matterin DN.MATERIALS & METHODSA total of 16 diabetic patients and 8 healthy volunteers (HV)have been studied to date. Following a detailed neurologicevaluation to stage the severity of DN (1), diabetic patientswere divided into 2 groups. Group1, 8 normal diabetics withno DN (No-DN) and group 2, 8 diabetics with establishedneuropathy (Est-DN). Volunteers were all right-handedmales, matched for age and duration of diabetes. H + MRSevaluation of the right posterior lateral thalamic nucleus wasperformed subsequently at 1.5 T (Eclipse, Philips MedicalSystems). Proton spectra were obtained from a single voxel(2 x 2 x 2 cm 3 ) using short (STEAM: TE = 20 ms, TR = 300ms) and long (PRESS: TE = 135 ms, TR = 1600 ms) echotimetechniques. Long TE results are expressed as ratiosunder the three prominent resonances: Choline (CHO),Creatine (Cr), and N-acetyl (NA) groups. Short TE resultsare expressed as the areas under the NA, Cho, Cr, and myoinositol(mI) resonances relative to that of unsuppressedwater.RESULTSIn long TE sequence, mean NA:CHO ratio was significantlylower in EST-DN compared to the other 2 groups (Est-DN vsNo-DN, p = 0.036; Est-DN vs HV, p = 0.015). There was nosignificant NA:CHO differences between No-DN and HV (p= 0.596). Normalized metabolite areas were not significantlydifferent between the groups in the short TE sequence (p> 0.05).CONCLUSIONThe posterior lateral nucleus of the thalamus was chosenbecause most ascending sensory pathways relay within thisnucleus before projections are sent to higher cortical centers.The first spectroscopy sequence, which acquired data atshort, TE (20 ms) provides information regarding metabolitedensities thereby reflecting metabolite concentrations. Thesecond, at long TE (135 ms), yields information about relaxationrates of the neurochemical markers as well as their concentrations.Hence a reduction in NA resonance seen in longTE implies a change in neuronal physiology or function ofthe ascending sensory nerves in DN. The short TE results
suggest that this is not due to a lower mean concentration inthe Est-DN group, which may in turn indicate that the neuronaldamage is reversible. Further studies are required todetermine if these changes occur early in the natural historyof DN or if improved metabolic control can lead to directneuronal improvement.REFERENCES1. Dyck PJ, Davies JL, Litchy WJ, O’Brien PC. LongitudinalAssessment of Diabetic Polyneuropathy Using a CompositeScore in the Rochester Diabetic Neuropathy Study Cohort.Neurology 1997;49:229-239KEY WORDS: Diabetic neuropathy, MRS, thalamusPoster 35Decreased Brain Activation in Patients with HIVAssociated Dementia Measured by Functional MRImagingSmith, J. K. · Hall, C. D. · Robertson, K. R. · Wilber, K. ·Castillo, M. · Lin, W.University of North Carolina at Chapel HillChapel Hill, NCPURPOSETo determine if there are differences in brain activation thatcorrelate with cognitive impairment in patients infected withthe human immunodeficiency virus (HIV+) using functionalMR imaging (fMRI).309RESULTSFigure 1 shows fMRI results from one memory task (serialaddition hard).These are group activation maps showing brain areas activatedin the groups of HIV+ subjects with normal cognition(NL), and in groups classified as MCMD and HAD, for theserial addition task. Gray pixels indicate areas of brain activationwith threshold of t > 3.1 for all maps. This illustratesa pattern of decrease in functional activation in MCMD andHAD subject groups. We found a similar pattern ofdecreased areas of activation in MCMD and HAD groups forall cognitive tests (serial addition easy and hard, workingmemory), and the attention and motor tasks.CONCLUSIONThe analysis of the fMRI data supports the hypothesis thatthere are differences in fMRI activation that correlate withcognitive impairment in HIV+ subjects. This leads us tospeculate that there is a diffuse effect on fMRI. One possibilityis that there is an effect of HIV on vascular reactivityor baseline blood flow, which alters the sensitivity of fMRIto detect cortical activation.KEY WORDS: HIV, dementia, fMRIPostersMATERIALS & METHODSSubjects: fMRI was performed on 25 HIV+ subjects whowere clinically stratified into one of three cognitive classifications:normal cognitive function (NL), minor cognitivemotor disorder (MCMD), or HIV-associated dementia(HAD) based on comprehensive neuropsychologic testing.Image acquisition: All studies were performed on a 3 T headimaging system, with transmit/receive head coil. MR imageswere acquired using a 2D T2*-weighted echo-planar imaging(EPI) sequence. A block design was used with 30-secondactivation and 30-second resting periods. The ON/OFFcycles were repeated four times. For response all subjectspushed a button on the response pad with the right hand.fMRI paradigms: The following paradigms were utilized:modified paced visual serial addition task (PASAT) (easy),modified PASAT (hard), attention, working memory, andmotor function. fMRI data processing: The fMRI data wereimported into the Statistical Parametric Mapping (SPM99,Wellcome Department of Cognitive Neurology, London,U.K.) software running on Matlab (Version 6.1, Mathworks,Inc. Natick, MA). The fMRI time-series images weremotion-corrected using a least squares approach and a rigidbody spatial transformation. A 3D spatial normalization wasperformed to fit the fMRI images to a standard referencespace and spatial smoothing used a 5 x 5 x 5 mm FWHMGaussian kernel. The results were displayed as a statisticalparametric map depicting regional activations.Poster 36A Surpiginous Hyposignal Gradient T2 Tract: TheGnathostoma’s Migrating TrailLaothamatas, J. · Kampangtip, A. · Asavaphatiboon, S.Ramathibodi HospitalBangkok, THAILANDPURPOSETo evaluate the imaging patterns of CNS gnathostomiasis.MATERIALS & METHODSRetrospective analysis of CT and MR imaging of the brainand spine of 20 clinically proved cases of CNS gnathostomiasis(11 females and 8 males, age range 16-58 years old) performedat Ramathibodi Hospital with 1.5 T magnet and multidetectorCT from November 26, 1991 to September 9, 2002was done. The study was composed of 4 CT and 15 MRimages of the brain, 3 MR images of the orbits, 9 MR imagesof the spine, 1 cerebral and 1 spinal angiogram. Spin-echoT1-weighted, PD/T2-weighted and gradient T2-weightedpulse sequences were performed in all cases.RESULTSRandomly distributed recent intracranial and intrathecalhemorrhage of varying size and shape were found in 16cases (42.11%). They were composed of 3 subarachnoidhemorrhage (SAH) (7.89%), 4 subdural hemorrhage(10.53%), 6 intraparenchymal hemorrhage (15.79%), and 4hematomyelia (7.89%) without associated tumor nor abnormalvessels. Moderate leptomeningeal enhancement was
Postersfound in 1 case (2.63%) in 2 consecutive CT scans of thebrain representing eosinophilic meningitis. Follow-up MRimaging in this case demonstrated multiple scatteredhyposignal gradient T2 foci throughout the brain.Encephalomalacia with old blood product was found in 2cases (5.26%) with known intracranial gnathostomiasis severalyears ago. Thin surpiginous hyposignal gradient T2tracts (Figures A and B) were found in 13 cases (34.21%).They were composed of 9 brain (23.68%) and 4 spinal cord(10.53%). Ill-defined hypersignal T2 change in the cordwithout associated blood product was seen in 3 cases(7.89%). There were three other findings (7.89%), composedof thick dural enhancement with prominent epidural vascularityaround midthoracic cord and bilateral pleural effusionin the patient with eosinophilic meningitis and transientmigratory pain along left side of body and chest. The otherfinding was left periorbital swelling (2.63%) in the patientwith scattered intracranial hemorrhage and surpiginoushyposignal gradient T2 tracts.Table: Summary of imaging findings in CNS gnathostomiasisImaging Findings No. %Intracranial hemorrhage 13 34.21-SAH 3 7.89-subdural hemorrhage 4 10.53- cerebral hemorrhage 6 15.79Hematomyelia 3 7.89Hypersignal T2 change in the cord without associatedblood product 3 7.89Eosiniphilic meningitis 1 2.63Encephalomalacia 2 5.26Others 3 7.89-adjacent dural enhancement 1 2.63- periorbital soft tissue swelling 1 2.63- bilateral pleural effusion 1 2.63Total 38 100310Pleural effusion and periorbital swelling can be found associatedwith adjacent spinal and cerebral migrating tractrespectively.KEY WORDS: Gnathostomiasis, CNS, migratingPoster 37Initial and Follow-Up Diffusion-Weighted MR ImagingFindings of Herpes Simplex Type 1 EncephalitisThurnher, M. M. 1 · Bammer, R. 21University Hospital Vienna, Vienna, AUSTRIA, 2 StanfordUniversity, Stanford, CAPURPOSEHerpes simplex virus type 1 (HSV) is the most commoncause of viral encephalitis in adults. MR imaging contributesto early diagnosis with the earliest imaging findings on fluidattenuated inversion recovery (FLAIR) images 48 hoursafter the onset of symptoms. The results from the recentstudies have raised hope that diffusion-weighted MR imaging(DWI) may be more sensitive in early detection of HSVencephalitis. On DWI two distinct types of findings aredescribed in HSV-1 encephalitis: lesions similar to cytotoxicedema, and lesions similar to vasogenic edema. The goal ofthis study was to determine (a) the value of diffusion-weightedMR imaging in early detection of HSV encephalitis, (2)changes of DWI findings under therapy, (3) if there is a correlationbetween the DWI abnormalities and outcome of thedisease.MATERIALS & METHODSConventional MR imaging including T1- and T2-weighted,FLAIR, and DWI were performed in 6 patients with provenHSV encephalitis. Qualitative and quantitative analysis ofthe signal abnormalities DWI was performed on the initialstudies and in all follow-up studies in all patients. Apparentdiffusion coefficient (ADC) values form the abnormal andcontralateral normal-appearing brain white matter were calculated.Neurologic signs and symptoms and laboratoryparameters were documented and correlated with imagingfindings.CONCLUSIONRandomly distributed intracranial hemorrhage and hematomyeliaof varying size and shape without associated abnormalvessels nor enhancement are the most common findingsin CNS gnathostomiasis followed by thin surpiginoushyposignal gradient T2 tract which represents the most characteristicdiagnostic feature of parasitic migrating tract.Eosinophilic meningitis can be seen when only subarachnoidspace is invaded. Encephalomalacia with associated oldblood product is the late result of intracranial hemorrhage.RESULTSPatients ages ranged from 25-65 years. Two patients had 4, 1patient had 3, and 3 patient had 2 MR studies. On initial MRimaging the majority of the lesions showed high signal onDWI, and low ADC values (mean 0.72 x 10 -3 mm/sec, meanratio 0.8) indicating restricted diffusion. All lesions werehyperintense on FLAIR and T2-weighted MR images. Onfirst follow-up MR examination (mean 2 weeks later) anincrease in ADC was observed (mean 0.95 x 10 -3 mm/sec).Leukomalacia and atrophic changes were present on late follow-upstudies with further increase in ADC (mean 7.26 x10 -3 mm/sec) representing irreversible tissue changes. Onlyone lesion (insular cortex) showed increased ADC value(1.29 x 10 -3 mm/sec) suggesting vasogenic edema. On first(17 days) and all subsequent follow-up MR scans the lesionwas isointense on DWI with decrease of ADC value (1.02 x10 -3 mm/sec and 0.8 x 10 -3 mm/sec) and lesion/nomal-appearingwhite matter ratio of 1. Diffusion-weighted MR imaging
was equal to FLAIR imaging in 5 patients, in one patientDWI clearly showed abnormalities, whereas FLAIR showedno changes.CONCLUSIONOur results suggest that DWI is a sensitive method for theearly detection of HSV encephalitis. Calculation of ADC candistinguish between cytotoxic and vasogenic edema and furthermoreto be prognostic. Areas of restricted diffusion mostlikely represent irreversible changes which evolve in leukomalaciaand atrophy. Areas of vasogenic edema arereversible and normalize without tissue changes. More studiesin hyperacute phase should be preformed to clarify theability of DWI to detect abnormalities in HSV encephalitisearlier.KEY WORDS: Herpes simplex virus, MR imaging, diffusionweightedimaging311RESULTSIn our series of 88 patients, tuberculosis (37cases) was themost common - tuberculoma was seen in 24/37 cases (findingsof T2-weighted shortening and enhancement in 83%),tuberculous abscesses in 10/37 cases (which were multiloculatedand > 3 cm in 80%), communicating hydrocephalus in18/37cases and infarction in 12/37cases (83% in basal ganglia).In toxoplasmosis (11 cases) 82% cases showed multiplelesions with 91% having at least one lesion in basal ganglia.Ninety-one percent lesions were hypodense with ringenhancement and mass effect on CT. Classical target-shapedlesions on T2-weighted MR imaging were seen in 41% only.In PML (12 cases) multifocal, hypodense, nonenhancinglesions were seen in 83% cases on CT. T2-weighted hyperintensitywas seen in 91% cases. CNS lymphoma (9 cases)was hypodense on plain CT and showed fast contrastenhancement on CT in 89% cases. T1-weighted hyperintensitywith hypointense rim was seen in 89% cases; commonsites being paraventricular and corpus callosum. In HIVencephalopathy (19 cases) 63% cases showed “dirty whitematter lesions” on T2-weighted MR imaging. Eighty-fourpercent showed diffuse cerebral atrophy and 42% had coexistentopportunistic infections further complicating diagnosis.CONCLUSIONIn a developing country like India our study on neurologicmanifestations of HIV, tuberculosis was found to be mostprevalent (42%); prevalence of others being encephalopathy(21.5%), PML (14%), toxoplasmosis (12.5%), and lymphoma(10%). Radiologic clues such as multiplicity, location,patterns of enhancement, and white matter changeshelped to differentiate between neoplastic, inflammatory,and infectious lesions and will be displayed in the visualpresentation.PostersPoster 38Imaging of Neurologic Manifestations of HIVBharija, A. · Rehani, B. · Lankhkar, B.Kasturba Medical College HospitalManipal, INDIAPURPOSETo highlight the spectrum of neuroimaging findings inseropositive HIV patients with neuropsychiatric manifestationsin India. To identify some radiologic clues in neuroimagingfavoring a particular diagnosis and to presentthese in a pictorial format.MATERIALS & METHODSThis is a retrospective study of 122 seropositive HIV patientswith neuropsychiatric manifestations admitted in our “tertiarycare hospital” during the period of 3 years (2000-2002).Thirty-four had insufficient pathologic confirmation andhence were excluded and so the results refer to remaining 88cases, where the diagnosis was confirmed by biopsy (39cases) and/or autopsy reports (55 cases). It includes reviewof their clinical data and imaging findings, spiral CT in 78(69 contrast) and 0.5 T MR imaging in 61 (28 contrast).Their number, site, extent, morphology, and coexistent findingswere studied and the representative images are shown.KEY WORDS: HIV neuroimagingPoster 39Brain Abscess and Necrotic Brain Tumor:Discrimination with Perfusion- and Diffusion-WeightedMR ImagingHakyemez, B. 1 · Erdogan, C. 2 · Uysal, S. 3 · Ergin, N. 3 · Kilic,E. 11Burtom Radioimaging Medical Center, Bursa, TURKEY,2Uludag University, Bursa, TURKEY, 3 Bursa State Hospital,Bursa, TURKEYPURPOSEThe differential diagnosis between brain abscesses andnecrotic tumors such as glioblastomas and metastases oftenis difficult to establish by conventional MR imaging. Thegoal of our study was to evaluate the ability of perfusionanddiffusion-weighted (DW) MR imaging to differentiatebetween these pathologies.MATERIALS & METHODSMR imaging was performed in 18 patients with cystic brainlesions (4 abscesses, 6 glioblastomas, 2 anaplastic astrocytoma,6 metastases). In addition to standard MR sequences,trace DW imaging, apparent diffusion coefficient (ADC)map were performed. Perfusion MR imaging was performedby using a first-pass gadopentate dimeglumine T2*-weightedgradient-echo single-shot echo-planar sequence. Relativecerebral blood volume (rCBV) was calculated for all lesions.RESULTSThe central portion of all 6 metastases and 7 of 8 high-gradegliomas showed unrestricted diffusion, whereas all 4abscesses showed restricted diffusion (low ADC values).However, restricted diffusion also was found in one glioblastoma.The ADC values calculated in patients with abscess(mean ± SD; 0.69 ± 0.05 x 10 -3 mm 2 /s) were significantlylower than those measured in patients with necrotic tumors(2.36 ± 0.63 x 10 -3 mm≈/s); p < 0.001). The measured rCBVin abscess, high-grade glioma and metastases were 0.76 ±0.12 (mean ± SD), 5.51 ± 2.08, and 4.66 ± 2.39, respectively.The difference between abscess and necrotic tumors wasstatistically significant (p < .001).
PostersCONCLUSIONDiffusion-weighted imaging is useful for both identifyingbrain abscesses and differentiating them from cystic braintumors. However for intermediate lesions in which diffusionMR findings can be misleading, perfusion MR imagingseems to be a promising method.KEY WORDS: Abcess, necrotic tumor, diffusion MR imagingPoster 40Diffusion-Weighted Imaging and Apparent DiffusionCoefficient Values of Intracranial Tuberculomas andTuberculous AbscessesVenkatesh, S. K. 1 · Patel, K. 2 · Chong, J. 11National University Hospital, Singapore, SINGAPORE,2Bhopal Memorial Hospital and Research Center, Bhopal,INDIAPURPOSETo describe the MR diffusion-weighted imaging (DWI) featuresof intracranial tuberculomas and tuberculous abscesses,and to compare their apparent diffusion coefficient (ADC)values with other intracranial mass lesions includinggliomas, metastases, and pyogenic and fungal abscesses.MATERIALS & METHODSMR imaging of nine patients (4 males, 5 females, age range22-56 years) with clinical and pathologic diagnosis ofintracranial tuberculomas and/or abscesses were evaluated.A total of 114 tuberculomas and 7 tuberculous abscesseswere evaluated. The routine MR and isotropic DWI features,as well as ADC values were compared with gliomas (n = 10),metastases (n = 30), pyogenic abscesses (n = 20), and fungalabscesses (n = 2).RESULTSFour patients had both tuberculomas and tuberculousabscesses, and 4 had coexisting tuberculous basal meningitis.The tuberculomas were variable on isotropic DWI withsolid and necrotic areas appearing bright and dark respectively.Most of them demonstrated a characteristic peripheralbright rim. The mean ADC values of the solid, necrotic,and rim areas were 0.76, 2.2, and 1.2 respectively.Tuberculous abscesses appeared bright on DWI with a meanADC value of 0.41.The mean ADC values of gliomas,metastases, and pyogenic and fungal abscesses were 2.2, 2.4,0.54, and 0.67 respectively.CONCLUSIONTuberculomas have a variable appearance on DWI. Themean ADC value of the solid component of tuberculomasappears to be lower as compared to solid masses like gliomasand metastases, and therefore may be useful in differentiatingthem. The tuberculous abscesses show similar ADC valuesas those of pyogenic and fungal abscesses.KEY WORDS: Tuberculoma, diffusion imaging, abscess312Poster 41Evaluation of Postoperative Intracranial Empyemas andSubcutaneous Abscesses with Diffusion-Weighted ImagesMurata, Y. 1 · Hirai, T. 1 · Yamura, M. 1 · Hayashida, Y. 1 ·Korogi, Y. 2 · Yamashita, Y. 11Kumamoto University School of Medicine, Kumamoto,JAPAN, 2 University of Occupational and EnviromentalHealth, School of Medicine, Kitakyushu, JAPANPURPOSEDiffusion-weighted images (DWI) are useful for diagnosisof brain abscesses. However, there are no systematic reportsthat evaluate the findings of DWI for postoperative intracranialinfections. The purpose of this study was to evaluatepostoperative intracranial empyemas with or without subcutaneousabscesses with DWI.MATERIALS & METHODSConventional MR images and diffusion-weighted images insix patients with epidural or subdural empyemas with orwithout subcutaneous abscesses after surgery were reviewedretrospectively. Two radiologists evaluated signal intensitiesof the lesions on DWI. Apparent diffusion coefficients(ADCs) were measured in each lesion.RESULTSThe inflammatory lesions included epidural empyemas infour, subdural empyemas in two, and subcutaneous abscessesin two. In six empyemas, the signal intensity on DWI washyperintense to the brain in two, iso to slightly hyperintensein three, and isointense in one. The subcutaneous abscesseswere hyperintense and isointense in one each. The ADC valuesranged from 0.6 to 2.5 (mean, 1.5 ± 0.6).CONCLUSIONPostoperative intracranial epidural empyemas and subcutaneousabscesses had various signal intensities and a widerange of ADCs on DWI. This variability should be recognizedwhen evaluating DWI in patients with suspectedintracranial infections after neurosurgery.KEY WORDS: Infectious diseases, DWIPoster 42Distinguishing of High-Grade Gliomas from Metastaseswith Perfusion-Weighted MR ImagingHakyemez, B. 1 · Erdogan, C. 2 · Isik, I. 3 · Kilic, E. 11Burtom Radioimaging Medical Center, Bursa, TURKEY,2Uludag University, Bursa, TURKEY, 3 Bursa State Hospital,Bursa, TURKEYPURPOSEIntracranial metastases and high-grade gliomas are two commonbrain tumors with different management and differentoutcomes. We evaluated the role of perfusion-weighted MRimaging in the differential diagnosis of high-grade gliomasand metastases.
MATERIALS & METHODSThis study included 48 patients with brain tumors: 22 withhigh-grade gliomas and 26 with metastases (lung carcinoma16, breast carcinoma 4, renal carcinoma 4, colorectal carcinoma1, unknown primary site 1). MR imaging was performedby using a first-pass gadopentetate dimeglumineT2*-weighted gradient-echo single-shot echo-planar(1972/52) sequence followed by conventional imaging. TheCBV maps were obtained for each patient. The relative CBV(rCBV) of the lesions was calculated from the intratumoraland peritumoral area by comparing with the normal whitematter. Peritumoral area was defined to be within a 1-2 cmdistance from the outer enhancing tumor margin. Region ofinterest size was 1-5 mm in diameter (depending on the sizeof the lesion) and was placed based on the color map. Resultsobtained from intratumoral and peritumoral areas of metastasesand high-grade gliomas were compared with Student’st-test. A P value of less than 0.05 indicated a statistically significantdifference.RESULTSThe intratumoral rCBV ratios in the intratumoral regionwere measured 6.50 ± 4.29 for high-grade gliomas and 5.28± 2.91 for metastases. No statistically significant differencewas found between high-grade gliomas and all metastases (p= 0.245). The measured rCBV in the peritumoral region inhigh-grade gliomas and metastases were 0.86 ± 0.20 and0.41 ± 0.17, respectively. The difference between thispathologies was statistically significant (p
PostersFLAIR images, of the total 35 meningiomas 18 (51%)enhanced homogeneously, 6 (17%) inhomogeneously,whereas 11 (31%) meningiomas showed a bright peripheralrim enhancement not observed on T1-weighted images. Ofthe 11 meningiomas showing rim enhancement on FLAIRimages 8 (73%) were measured to be 2 cm or more in diameter.Dural tail sign was found to be positive in 10 (29%)meningiomas on T1-weighted images and in 18 (51%)meningiomas on FLAIR images.CONCLUSIONAlthough the enhancement degree of meningiomas on contrast-enhancedFLAIR images appear to be equal or inferiorcompared to T1-weighted SE images, the more readilydetected dural tail sign and the peripheral contrast enhancementpattern detected on the former technique can be helpfulin differentiating these lesions from other extraaxial masses.Therefore postcontrast FLAIR sequence can be used as avaluable adjunct to the postcontrast T1-weighted imaging inthe evaluation of intracranial meningiomas.314RESULTSThe diffusion tensor anisotropy distributions are shown inFigure (a) corresponding to a region including the lesionindicated by red dots and to a separate region of unaffectedtissue indicated by black dots. As can be seen in Figure (a)both distributions share common components except for thelow anisotropy component exhibited by the tumor itself. Thecombination of the anisotropy information with the diffusiontensor trace information (both obtained from the same set ofdiffusion-weighted images) used to perform the segmentationof the tumor is shown in Figure (b). Light gray zonescorrespond to the tumor, while dark gray and gray zones correspondto liquid (or necrotic tissue) and unaffected tissue,respectively.KEY WORDS: Meningioma, FLAIR, contrastPoster 45Brain Tumor Segmentation with Diffusion TensorAnisotropyMartín-Landrove, M. · Bautista, I.Universidad Central de VenezuelaCaracas, VENEZUELAPURPOSEThe present work exploits diffusion tensor anisotropy differencesbetween neoplastic tissue and white matter fibers toseparate the active portion of the tumor and necrotic tissuefrom unaffected tissue. Previous work (1) had demonstratedthat the segmentation of the tumor is possible by integrationof in vivo spectroscopy information with relaxation data, butin some cases the discrimination between the peripheral edematousregion and the tumor itself is rather difficult to perform.On the other hand, diffusion tensor anisotropy is not asmodified in the edematous tissue as it is in the tumoral ornecrotic tissue, and in consequence it can be used as a gooddiscrimination parameter which combined to other informationrelated to the diffusion tensor such as its trace could giverelevant parameters for a suitable segmentation of the tumorimage.MATERIALS & METHODSDiffusion-weighted images were obtained for b-parameterranging from 0 to 1350 s/mm 2 , for three different gradientdirections, on a Siemens Magnetom Sonata working at amagnetic field of 1.5 T. The images were analyzed with aspecially designed program that performs an Inverse LaplaceTransform of the diffusion-attenuated data and calculates thediffusion tensor anisotropy distribution with a suitable definitionapplicable for a partial determination of the diffusiontensor, i.e., using only three orthogonal directions of the fieldgradient. Finally, the program performs the segmentation ofthe image based on the trace of the diffusion tensor and itsanisotropy.CONCLUSIONThe methodology presented in this work clearly segmentsbrain tumor images with appropriate spatial resolution fortherapeutic needs, and overcomes the lack of discriminationbetween edematous and tumoral tissues as obtained by relaxationtechniques. This result suggests the convenience of thecombined use of both techniques to assess a confident segmentationof the tumor image.REFERENCES1. Martín-Landrove M, Bautista I, Mayobre F, Villalta R, ContrerasA. Tumor Assessment by in vivo Proton Spectroscopy andRelaxometry. MR Mat Phys, Biol, Med 2002;15:(S1) 225KEY WORDS: Segmentation, diffusion tensor, anisotropy
Poster 46Anatomical and Metabolic Imaging of Primary CentralNervous System AmyloidomaRickert, K. L. · Krouwer, H. · Rand, S. · Prost, R. · Sinson,G.Medical College of WisconsinMilwaukee, WIPURPOSETo demonstrate the anatomical and metabolic imaging of primaryfocal central nervous system (CNS) amyloidoma andto review these findings compared to the few cases previouslydescribed.MATERIALS & METHODSA 46-year-old woman presented with intermittent focalseizures and was found to have a lesion in the right frontalregion. This lesion was evaluated preoperatively with CT,MR imaging, positron emission tomography with fluoro-2-deoxyglucose (FDG-PET) and MR spectroscopy (MRS). Astereotactic biopsy of the lesion confirmed primary CNSamyloidoma. Eighteen previous reports of primary focalintraparenchymal CNS amyloidoma were reviewed. Elevenof these reported CT findings, six of these eleven reportedMR studies and no cases reported FDG-PET or MRS.RESULTSNoncontrast CT demonstrated a hyperdense lesion in theright posterior frontal region with probable involvement ofthe upper right internal capsule and no significant masseffect. Multiple small calcifications were seen. Calcificationwas described specifically in only one of 11 cases reported.On MR imaging the lesion was noted to be hyperintense onlong TR sequences. The MR imaging is consistent with variableT2 characteristics reported of an intraparenchymal amyloidoma.Gadolinium administration resulted in faint, patchyenhancement. Out of the six cases that gave long TR resultsthree reported the lesion to be hypointense, two mixed, onehyperintense, and five had intense enhancement. Utilizingproton MRS in the hyperintense area in the left frontal whitematter increased choline with greatly decreased N-acetylaspartate(NAA) level, an increased choline-to-NAA ratio andan increased glutamate + glutamine (GLX) level was demonstrated.We interpreted these findings to be consistent withlymphoma. The FDG-PET scan demonstrated no evidence ofabnormal uptake in or around the lesion.CONCLUSIONPrimary focal CNS amyloidoma is a rare entity with only 18other cases reported in the literature. This is the first case todescribe the metabolic and anatomical characteristics of abiopsy proven CNS amyloidoma. This information increasesour understanding of the nature of this lesion and may assistin its diagnostic evaluation.KEY WORDS: Amyloidoma, intraparenchyma, spectroscopy315Poster 47Usefulness of Calculated Apparent Diffusion Coefficientsin Differentiation and Grading of Common BrainTumorsBulakbasi, N. · Guvenc, I. · Unal, B. · Tayfun, C. · Ucoz, T.· Somuncu, I.Gulhane Military Medical AcademyAnkara, TURKEYPURPOSEApparent diffusion coefficients (ADC) calculation had somebenefits about tumor grading and differentiation (1, 2). Weevaluated the hypothesis that ADC calculation can improvethe diagnostic efficacy of MR imaging in patients with braintumor. The main purposes were as the follows: 1) to calculateADC values from tumoral and peritumoral region in thedifferentiation (benign vs malign) and grading (low or high)of tumor types; 2) to evaluate the ADC values to distinguishthe pathologic subtypes.MATERIALS & METHODSOne hundred nine lesions in 83 patients with histologicallyproven brain tumors were evaluated prospectively by contrast-enhancedMR imaging and isotropic, echo-planar diffusion-weightedimaging (b = 0, 500, 1000 s/mm 2 ) before thesurgical procedure. For statistical purposes tumors weredivided as benign (16 meningiomas, 10 tuberculomas, fivedysembryoplastic neuroepithelial tumors and five epidermoidtumors), low grade (24 low grade astrocytomas, ninenonastrocytic gliomas) and high grade (25 metastases and 15high grade astrocytomas) malign tumors. Tumoral and peritumoralADC values were calculated for comparison andexpressed in 10 -3 mm 2 /s. Data were analyzed with ANOVAand Student’s t-tests among the tumor groups comparingbenign vs malign, low grade vs high grade and differenttumor types. Mann-Whitney U test and a nondirectionalScheffe post hoc procedures by 95 % confidence intervalwere employed where appropriate to correct for the effect ofmultiple comparisons. The mean difference was significantat the 0.05 level.RESULTSTumoral and peritumoral ADC calculation easily can differentiatebenign (109.06 ± 8.34 and 88.36 ± 19.12) tumorsfrom malign (98.16 ± 19.94 and 146.36 ± 31.43) ones (p
PostersCONCLUSIONApparent diffusion coefficient values of different tumortypes, which reflect the restricted diffusion of protons due toalterations in the structure and cellularity, had more additionalinformation to conventional contrast-enhanced MRimaging in the differentiation and grading of brain tumors.Higher peritumoral and lower tumoral ADC values wereconsistent with higher tumor grade and visa versa. Benignand low grade tumors can be differentiated only from eachother by peritumoral ADC values.REFERENCES1. Lam WW, Poon WS, Metrweli C. Diffusion MR Imaging inGlioma: Does It Have Any Role in the Pre-OperationDetermination of Grading of Glioma? Clin Radiol2002;57:219-2252. Bulakbasi N, Kocaoglu M, Ors F, Tayfun C, Ucoz T.Combination of Single-Voxel Proton MR Spectroscopy andApparent Diffusion Coefficient Calculation in theEvaluation of Common Brain Tumors. AJNR Am JNeuroradiol 2003;24:225-233KEY WORDS: Brain neoplasm, brain diffusion, MR imagingPoster 48Diagnostic Value of Contrast-Enhanced Fluid-Attenuated Inversion Recovery Sequence in IntracranialMetastasesTokgoz, N. · Gultekin, S. · Celik, H. · Tali, T. · Öner, A. ·Erbas, G.Gazi University School of MedicineAnkara, TURKEYPURPOSEPostcontrast fluid-attenuated inversion recovery (FLAIR)imaging has been reported previously to be an efficaciousmethod for the diagnosis of parenchymal and leptomeningealmetastases with a limited number of patients.Our purpose was to compare postcontrast T1-weighted andFLAIR images in depicting intracranial metastases with alarger patient group.MATERIALS & METHODSSixty-nine patients with known primary malignancy andclinical suspicion of cranial metastases were studied. AxialFLAIR and spin-echo T1-weighted images were obtainedbefore and after intravenous administration of gadopentetatedimeglumine. Postcontrast FLAIR images were comparedwith postcontrast T1-weighted images for the lesion conspicuity,the contrast enhancement degree, the number oflesions for parenchymal metastases, and the extension of thelesions for leptomeningeal-cisternal metastases.RESULTSParenchymal metastases were demonstrated in 33 patients.Postcontrast FLAIR images showed more parenchymalmetastases in five patients while equal number of lesions in20 and less lesions in eight patients. Comparing the conspicuityof parenchymal metastases, contrast-enhancedFLAIR imaging was superior in five patients, equal in one,and inferior in 27 of 33 patients. The contrast enhancementdegree was superior on postcontrast FLAIR sequence in five316patients, equal in the other five, and inferior in 23 of 33patients. In the number, conspicuity and contrast enhancementdegree of the lesions, postcontrast FLAIR sequencewas superior to postcontrast T1-weighted images in the samefive patients, and in all these patients, postcontrast FLAIRimaging was obtained as the second contrast-enhancedsequence. There were 11 patients with leptomeningeal-cisternalmetastases, and the conspicuity, extension, and contrastenhancement degree of the lesions were superior onpostcontrast FLAIR sequence in eight of 11 patients. In fiveof eight patients, FLAIR was obtained as the second postcontrastsequence. There were four patients with cranialnerve metastases, and postcontrast FLAIR sequence surpassedthe contrast-enhanced T1-weighted imaging in theconspicuity and extension of the lesions in three of fourpatients. In two of these three patients, FLAIR was the secondpostcontrast sequence.CONCLUSIONPostcontrast FLAIR sequence is a valuable adjunct to thepostcontrast T1-weighted imaging, and use of FLAIR imagingroutinely before and after the administration of contrastmaterial is very efficacious in the delineation of parenchymal,and particularly leptomeningeal-cisternal and cranialnerve metastases.KEY WORDS: MR imaging, FLAIR, cranial metastasesPoster 49Diagnostic Accuracy and Complications of CT-GuidedBrain BiopsyGuàrdia, E. · De Juan, M. · San Román, L. · Castaño, C. ·Ruscalleda, J. · Molet, J. · Parés, P. · Bartumeus, F.Hospital de la Sant Creu I Sant PauBarcelona, SPAINPURPOSEThe stereotactic brain biopsy approach was described byClark in 1920 and was implemented in 1947 by Spiegel andWicis. In 1948 Lars Leksell designed the system which carrieshis name. Before the use of CT, stereotactic measurementswere taken by neumo and angiography. CT helped tolocalize the lesion in a rapid fashion for both the patient andradiologist. MR imaging is a potentially useful method aswell, but needs further improvements. Any surgical approachcarries its risks; nowadays hemorrhage is the most frequentcomplication for CT-guided biopsy. To assess the diagnosticaccuracy, neuroradiologic-pathologic agreement, and complicationsof CT-guided brain biopsies.MATERIALS & METHODSOne hundred forty-seven patients undergoing CT-guidedbiopsy from 90-102 were reviewed. Selection criteria were:high surgical risk masses, and tumoral or nontumoral lesionssubject of medical treatment. Barcia® and Leksell® guidesand a Toshiba 300, Somatom DR2, and Somatom Plus 4(Siemens) CTs were used. Parallel axial images to the stereotacticframe were obtained. Software provided both “X” and“Y” target axes, while “Z” was calculated by trigonometry.
RESULTSOne hundred twenty-five of 147 were positive biopsies ( 89glioma, 14 lymphoma, 11 LMP, 4 metastasis, 2 pinealoma, 2craniofaringioma, 1 toxoplasmosis, 1 ganglioglioma, 1ischemic necrosis, and 1 abscess). Twenty-one of 147 biopsieswere negative (9 normal brain tissue, 6 necrosis, and 6 gliosis).Complications were present in 15/147 cases: 11 hematoma (3died), 1 infection, 1 edema, 1 seizure, and 1 recovered palsy.Morbidity was 15/147 (10.2%) and mortality 3/147 (2%).Bleeding cases (11) were produced in following diagnosis: 7glioma III-IV, 2 LMP, and 1 metastasis. All death causes weredue to bleeding. Agreement between radiologic and pathologicdiagnosis was present in 107/125 cases (85.6%).CONCLUSIONDiagnostic accuracy of CT-guided biopsy was 85%.Neuroradiologic-pathologic agreement was 85.6%. CT-guidedbiopsy carried a 10% morbidity and 2% mortality.317Poster 51Susceptibility-Weighted Imaging of Brain MassesDelProposto, Z. S. 1 · Haddar, D. 2 · Sehgal, V. 1 · Haacke, E.M. 2 · Sloan, A. E. 1 · Zamarano, L. J. 1 · Kupsky, W. J. 11Wayne State University, Detroit, MI, 2 MRI Institute forBiomedical Research, Detroit, MIPURPOSETumor characterization involves understanding the angiographicbehavior of lesions, including angiogenesis andinternal hemorrhage. Susceptibility-weighted imaging(SWI) has been found to be particularly well suited for visualizationof venous structures, venous malformations, andmicrohemorrhage within the brain (1-2). In this study, weinvestigate the role of SWI in determining tumor structureand vascular boundaries.PostersKEY WORDS: CT, stereotaxia, complicationsPoster 50MR Findings of Primary Central Nervous System T-CellLymphoma Including Perfusion MR ImagingKim, E. Y. 1 · Kim, S. S. 1 · Ryoo, J. W. 1 · Na, D. G. 21Samsung Medical Center, Seoul, REPUBLIC OF KOREA,2Seoul National University Hospital, Seoul, REPUBLIC OFKOREAPURPOSETo describe the MR findings of primary central nervous systemT-cell lymphoma (T-PCNSL) and determine the utilityof perfusion MR in the differential diagnosis.MATERIALS & METHODSSeven patients with pathologically proven T-PCNSL byusing both immunohistochemical stainings and molecularstudies were included in our study. The location, shape,enhancement, and signal intensity of the tumor were determined.The relative cerebral blood volume (rCBV) was analyzedboth visually and quantitatively between the tumor andcontralateral white matter in two cases.RESULTSAll seven cases of T-PCNSL showed supratentorial and eithersuperficial or subcortical location. Five patients had solitarymass and the others had multiple masses (two and three massesin each case). All tumors showed low T1 and slightly highT2 signal intensity to adjacent gray matter. Irregular ringenhancement was seen in 7 of 10 masses and nodular enhancementwas seen in the others. Cortical hemorrhage was noted inthree patients and intratumoral hemorrhage was noted in one.The two masses on rCBV map demonstrated either similar toor slightly higher signal intensity than that of contralateralwhite matter. The rCBV ratio of each mass was 1.27 and 1.35.CONCLUSIONPredilection for subcortical location, relatively high incidenceof cortical hemorrhage, and lower rCBV may be helpfulfor differentiating T-PCNSL from other brain tumors.KEY WORDS: Lymphoma, T-cellMATERIALS & METHODSSusceptibility-weighted imaging is a high-resolution, threedimensional,fully velocity-compensated gradient-echosequence. Postprocessing is applied using both magnitudeand phase images to increase the conspicuity of the veins andother sources of susceptibility effects. This sequence hasbeen applied to 44 patients (24 males, 20 females, aged 15 to89 years, mean 50.3 years) with brain masses, pre and/orpost contrast and compared to conventional sequences (T1,T1 post contrast, T2, proton density, FLAIR and diffusionweightedimaging). Seventeen cases had pathologic correlation.RESULTSIn the majority of the cases SWI gave better contrast and/orstructural information than T1-weighted postcontrastimages. In a minority of cases, the reverse was true. Thisdemonstrates the complementary nature of the twoapproaches and the importance of collecting SWI data. Onthe whole, SWI was more sensitive for showing blood productsand venous vasculature. Susceptibility-weighted imagingshowed a useful FLAIR-like contrast and added complementaryinformation to conventional T1 postcontrastsequences for internal architecture study of the lesions. Goodpathologic correlations were found for blood products aspredicted by SWI.CONCLUSIONSusceptibility-weighted imaging should prove useful fortumor characterization because of its ability to better highlightblood products and venous vasculature.REFERENCES1. Reichenbach JR, Venkatesan R, Schillinger DJ, Kido DK,Haacke EM. Small Vessels in the Human Brain: MRVenography with Deoxyhemoglobin as an Intrinsic ContrastAgent. Radiology 1997; 204:272-2772. Tong KA, Ashwal S, Holshouser BA, Shutter LA, Herigault G,Haacke EM, et al. Hemorrhagic Shearing Lesions in Childrenand Adolescents with Posttraumatic Diffuse Axonal Injury:Improved Detection and Initial Results. Radiology2003;227:332-339KEY WORDS: Neoplasm, susceptibility-weighted imaging,hemorrhage
Posters318Poster 52Poster 53A Detailed, Comprehensive, and Quickly Performed Intracranial Epidermoid Cysts: Diffusion-Weighted,Functional MR Imaging Approach to Brainstem Tumors Fluid-Attenuated Inversion Recovery, and ConventionalMR FindingsDomingues, R. C. · da Cruz Jr, L. C. H. · Domingues, R. C.· Domingues, R. C.Multi-Imagem RessonanciaRio de Janeiro, BRAZILPURPOSETo determine whether functional MR imaging sequences(diffusion, diffusion tensor, tractography, perfusion, spectroscopy)can help add new information to aproach brainstem tumors.MATERIALS & METHODSDuring the period of 6 months, MR exams of 4 patients (2men and 2 woman, mean age 35 years) were performed in a1.5 T clinical scanner (Siemens,Germany), using MR clinicalstandard protocol and functional sequences (diffusion,diffusion tensor imaging, tractography, perfusion, and spectroscopy).All the patients had their histopathology diagnosisconfirmed by brain biopsy: gliomatosis cerebri (n = 1); lowgrade glioma type I (n = 2) and low grade glioma type II (n= 1). All of then had low relative cerebral blood volume.RESULTSProton MR spectroscopy imaging pattern was characterizedby the presence of high levels of myo-inositol/glycine, nosignificant elevation of choline, and mildly reduced N-acetylaspartate.Color maps of diffusion tensor imaging and tractographyof the brain stem white matter tracts were preservedin the cases of gliomatosis cerebri and low gradeglioma type I (n = 2).CONCLUSIONDiffusion tensor imaging and tractography may provide usefuladjunctive information about the infiltrating compartmentof the tumors which is not available in other MR techniques.Because this study was based on a small sample ofpatients, we should consider the results preliminary andexercise caution before using them in clinical practice.KEY WORDS: Brainstem neoplasm, diffusion tensor, tractographyHakyemez, B. 1 · Aksoy, U. 2 · Yildiz, H. 3 · Ergin, N. 2 · Uysal,S. 21Burtom Radioimaging Medical Center, Bursa, TURKEY,2Bursa State Hospital, Bursa, TURKEY, 3 S.D. University,Isparta, TURKEYPURPOSETo assess the utility of diffusion-weighted echo-planar imaging(DW EPI) sequence in the evaluation of epidermoidcysts (ECs) compared to conventional spin-echo (SE) andfluid-attenuated inversion recovery (FLAIR) sequence MRimaging, and to evaluate the role of T2 shine-through effect.MATERIALS & METHODSFifteen patients (10 primary, 5 residual ECs) were imagedprospectively in two different 1.5 T MR units with standardhead coils with T1-weighted SE, and T2-weighted fast SE,FLAIR and DW EPI sequences. The qualitative and quantitativeassessements were performed by two radiologists inconsensus. Apparent diffusion coefficient (ADC) valueswere obtained from all ECs. For 11 ECs, exponential DWimages are obtained to eliminate T2 shine-through effects.The results are analyzed with variance analysis (ANOVA)and Bonferroni t method.RESULTSAll ECs were moderately heterogeneous and isointense comparedto CSF on T1-weighted SE, and were isointense withCSF on T2-weighted fast SE. FLAIR sequence was superiorto T1- and T2-weighted sequences in showing ECs. In 13cases, the borders of the lesions could not be delineated fromthe surrounding structures with either FLAIR or T1/T2-weighted sequences. All ECs were markedly hyperintense onDW imaging compared to CSF and deep white matter. TheADC values of the lesions ranged from 0.986 to 1.360 (mean1.157 ± 0.12 (± SS) x 10 -3 mm≈/s), CSF ranged from 3.214to 3.762 (3.423 ± 0.16 x 10 -3 mm≈/s) and deep white matterranged from 0.879 to 1.40 (0.993 ± 0.08 x 10 -3 mm≈/s). TheADC values of ECs are significantly lower than CSF (p
Poster 54Usefulness of Gadobenate Dimeglumine (Multihance) forIntraoperative MR Monitoring of Brain Tumor SurgeryBalériaux, D. L. F. · De Witte, O. · Wikler, D. · Vandesteene,A. · Levivier, M.Hospital Erasme, Universite Libre de BruxellesBrussels, BELGIUMPURPOSETo illustrate the usefulness of Multihance (gadobenatedimeglumine) for intraoperative MR monitoring of braintumor surgery.MATERIALS & METHODSBetween October and November 2003, 59 patients underwenttumor resection monitored by repeated MR scanningperformed in the operating theater. An intraoperative MRsystem “Polestar N10” (Medtronic Odin) with a permanentmagnet operating at a low magnetic field of 0.12 T was used.A first MR acquisition was obtained at the beginning of thesurgery followed by one or two further acquisitions duringor/and at the end of the procedure. The following tumorswere included: 27 intrasellar tumors operated by transsphenoidalroute, 11 tumors in the frontal/parietal cortical region,7 tumors of the supra and parasellar region extending to thethird ventricule, 6 temporal lesions, 5 posterior fossa tumorsand three parieto-occipital paraventricular lesions.Pathologic examination confirmed 26 pituitary adenomas, 5craniopharyngiomas, 3 meningiomas, 13 glial tumors, 2metastases, 1 cavernoma, 1 vestibular schwannoma, and 1teratoma. A further 6 lesions comprising 3 mesiotemporalscleroses, 1 DNT, 1 cortical dysplasia and 1 low-grade temporalglioma were removed for treatment of epilepsy. Allpatients had a complete preoperative MR work-up for surgicalplanning. Gadobenate dimeglumine at a dose of 0.1mmol/kg was used. Further intraoperative injections of 0.1mmol/kg gadobenate dimeglumine were performed in 38patients to enhance and better delineate the tumors.RESULTSIntraoperative tumor detection and visibility was improvedin each of the 38 patients who received gadobenate dimeglumineduring surgical intervention. The increased T1 relaxivityof gadobenate dimeglumine compared to conventionalgadolinium chelates permitted lower overall doses to be usedand proved advantageous at the low magnetic field in use inthe operating theatre. The use of multiple injections was notproblematic and no adverse reactions were noted by theanesthesiologists.319CONCLUSIONMultiple contrast injections are required to monitor the progressiveremoval of brain tumors by intraoperative MRimaging. The high relaxivity characteristics of gadobenatedimeglumine allow excellent visualization of the enhancingtumors at lower doses compared to conventional gadoliniumcontrast agents.KEY WORDS: Intraoperative MR imaging, brain tumors,MultihanceThe authors of this work have indicated that they will be discussing/presentingan unapproved or investigative use ofMultihance (gadobenate dimeglumine) made by Bracco (Italy)for intraoperative MR monitoring of brain tumor surgery.Poster 55Correlation of Dynamic Contrast MR Imaging toAngiographic Imaging Findings in Extraaxial TumorsChristoforidis, G. A. · Yang, M. · Chang, J. · McGregor, J.The Ohio State UniversityColumbus, OHPURPOSETo determine whether perfusion patterns of extraaxialtumors receiving most arterial supply from the externalcarotid circulation significantly differ from those predominantlyreceiving arterial supply from the internal carotidartery.MATERIALS & METHODSArteriograms and dynamic contrast MR images werereviewed in 13 patients who presented with extraaxialtumors. These patients all underwent echo planar T2 dynamiccontrast-enhanced 1.5 T MR imaging using spin-echomultiphase EPI using (11 interleaved slices with TE = 80, aTR = 1900, FOV = 30, NEX=1). Adequate intravenousaccess was obtained using a 21-gauge needle and contrastwas injected at 5 cc/sec using a mechanical injector for atotal volume of 0.2 mmol/kg and a maximal dose of 20 mlcontrast. These patients also underwent cerebral arteriographyintended for preoperative embolization. Arteriogramswere inspected for source of blood supply and a percentagesupply from the extracranial vasculature was estimated.Signal intensity vs time curves were compared to gray matterand the relative delay in transit time relative to gray matterwas calculated. Relative cerebral blood volumes werecalculated using the limited integration method and thetumors were categorized as high medium or low relative togray matter.PostersRESULTSNo pattern could be identified which could help distinguishexternal carotid supply from internal carotid supply to thetumor. All neoplasms displayed similar curves regardless ofarterial source. Neither relative cerebral blood volumes nortumoral contrast transit time on MR imaging demonstratedany statistically significant correlation to the degree of externalcarotid supply.
PostersCONCLUSIONSource of vascular supply (internal carotid vs externalcarotid) does not appear to have a substantial influence onthe pattern of tumoral perfusion in extraaxial tumors. Thepattern of perfusion is thought to be related to the intrinsicnature of the neoplasm.KEY WORDS: Dynamic contrast MR imaging, meningioma,angiography320values of 1.05 vs 0.5, respectively). In the tumor patients, tissuesignatures of displaced white matter tracts were no differentfrom contralateral values. In infiltrated tracts therewas a marked increase in p values with minimal change in q.In disrupted tracts there was an increase in p with a correspondingdecrease in q. The magnitude of the largest vectorfrom the principal axis of diffusion inversely correlated tothe p value (Pearson coefficient -0.765, P < 0.001). Theangle of dispersion of the principal axes of diffusion inverselycorrelated with the q value.Poster 56Tissue Signatures Characterization of Diffusion TensorAbnormalities in Cerebral GliomasPrice, S. J. · Pena, A. · Burnet, N. G. · Green, H. A. L. ·Carpenter, A. · Pickard, J. D. · Gillard, J. H.University of CambridgeCambridge, UNITED KINGDOMPURPOSEThe appalling prognosis of cerebral gliomas relate to theirpropensity to diffusely infiltrate white matter tracts. Tumorcells extend beyond the limit of the tumor seen on conventionalMR imaging. Better methods of identifying tumormargins may allow us to individualize radiotherapy plans.Diffusion tensor imaging (DTI) is a technique that is sensitiveto the ordered diffusion of water molecules along whitematter tracts. It can detect abnormalities beyond the limitsseen on T2-weighted images. The diffusion tensor is representedcommonly by the fractional anisotropy index (FA),but this can be insensitive to subtle pathologic changes. Wehave developed a novel methodology that decomposes thediffusion tensor into the isotropic (p) and anisotropic (q)components. By plotting these graphically as the x and y axiswe can derive a diffusion tissue signature. We report ourexperience of this technique in both normal brain and cerebralgliomas.MATERIALS & METHODSThirty-five patients with cerebral gliomas and 7 normal volunteerswere recruited for this study. All patients wereimaged at 3 T using a T2-weighted sequence and a singleshotspin-echo EPI DTI sequence ( TR = 5070 ms, TE = 107ms, matrix 128 x 128, FOV 25 x 25 cm, slice thickness 5mm, 8-27 slices, using 12 noncolinear gradients and 5 b-valuesfrom 318 - 1570 s/m). Maps of FA, p and q were producedfor each patient. The principal axes of diffusion alsowere determined and RGB color-coded orientation maps created.Regions of interest (ROI) then were selected as showingwhite matter disruption, infiltration, or displacementaccording to the method described by Witwer. For each ROIp and q values were derived and plotted as tissue signatures.In addition, the direction of the principal axis of diffusionfrom a 3 x 3 ROI was displayed on a rose diagram. For each,the magnitude of the largest vector and the spread of the vectorswere determined.RESULTSThe diffusion tissue signatures for the normal volunteersshowed that there was limited spread of the p values. Theanisotropic q values varied with different white matter types;commissural fibers in the corpus callosum had larger valuescompared to association fibers like the occipital radiation (qCONCLUSIONDiffusion tensor tissue signatures are a useful method ofsimultaneously visualizing the anisotropic and isotropiccomponents of diffusion and can detect subtle changes inwhite matter in tumor infiltration. Further studies arerequired to identify the pathologic changes that the p and qvalues may identify.KEY WORDS: Diffusion tensor imaging, gliomasPoster 57Brain Tumor Characterization by MR Spectroscopic andPerfusion ImagingHammoud, D. A. 1 · Basso, G. 1,2 · Schlosser, M. 1 · Tihan, T. 3 ·Barker, P. 1 · Pomper, M. G. 11The Johns Hopkins University School of Medicine,Baltimore, MD, 2 Azienda Policlinico di Modena, Modena,ITALY, 3 University of California San Francisco, SanFrancisco, CAPURPOSEThe purpose of our study is to combine MR spectroscopic(MRS) and perfusion imaging to differentiate infiltrativetumor from vasogenic edema in patients with primary malignantbrain tumors.MATERIALS & METHODSFive patients with primary brain tumors (2 females, 3 males,mean age = 45.5 years, 1 anaplastic astrocytoma, 3 glioblastomamultiforme, and 1 oligodendroglioma) underwentMRS (1) and perfusion imaging (2) before surgical resection.Three or four biopsies were obtained intraoperatively ineach patient, from the tumor and peritumoral region, immediatelybefore resection with registration of the coordinatesof each biopsy site. The peritumoral region was defined asthe white matter immediately adjacent to the enhancing marginof the tumor, with high signal on T2 and FLAIR imagesand no enhancement on postcontrast T1-weighted images. Atotal of 10 biopsies were available for interpretation. Thebiopsies were analyzed by a neuropathologist blinded to theclinical information and were classified into four categories(1: no tumor cells, 2: < 50% tumor cells, 3: 50-99% tumorcells and 4: 100% tumor). We calculated the correspondingnormalized values for the relative cerebral blood volume (r-CBV), choline (Cho), creatine (Cr), N-acetyl aspartate(NAA), as well as the normalized Cho/NAA, and NAA/Crratios corresponding to the biopsy locations. The controlareas were chosen in the corresponding locations in the contralateralhemisphere. We used the Mann-Whitney U test toassess for significance in correlation with the histopatholog-
ic classification. We also calculated (r-CBVTumor xCho/NAA Tumor)/(r-CBV control x Cho/NAA control) forall the biopsies.RESULTSA trend emerged of increased r-CBV (P = 0.055), decreasedNAA (P = 0.63), NAA/Cr ratio (P = 0.66) as well asincreased Chol (0.52) and Chol/NAA ratio (P = 0.28) inbiopsies with >50% tumor cells when compared to biopsieswith < 50% tumor infiltration.321other available gadolinium agents due to a unique capacityfor weak and transient interaction with serum albumin. Thisfeature may contribute to the improved detection, delineation,and conspicuity of enhancing intracranial lesions forwhich blood-brain barrier breakdown results in elevated levelsof serum proteins. Presented are the results of a fullyblinded, independent off-site evaluation of the quantitativeand qualitative enhancement obtained after a dose of 0.1mmol/kg Gd-BOPTA, compared with that obtained after anequivalent dose of either Gd-DTPA or Gd-DOTA.PostersCONCLUSIONIn this pilot study, combined MRS and perfusion imagingmay enable differentiation of areas with tumor infiltrationfrom those with vasogenic edema in patients with primarybrain tumors.REFERENCES1. Golay X, Gillen J, van Zijl PC, Barker PB. Scan TimeReduction in Proton Magnetic Resonance SpectroscopicImaging of the Human Brain. Magn Reson Med2002;47(2):384-3872. Wityk RJ, Goldsborough MA, Hillis A, Beauchamp N, BarkerPB, Borowicz LM, Jr., et al. Diffusion- and Perfusion-Weighted Brain Magnetic Resonance Imaging in Patientswith Neurologic Complications after Cardiac Surgery. ArchNeurol 2001;58(4):571-576KEY WORDS: Glioma, MR spectroscopy, MR perfusionPoster 58Enhancing Lesions of the Brain: IntraindividualQuantitative and Qualitative Comparison of ContrastEnhancement after Gadobenate Dimeglumine vsEstablished Gadolinium ComparatorsTartaro, A. 1 · Tartaglione, T. 1 · Lodemann, K. 2 · Essig, M. 3 ·Knopp, M. 4 · Pirovano, G. 5 · Kirchin, M. 61University of Chieti, Chieti, ITALY, 2 Bracco-Altana,Konstanz, GERMANY, 3 German Cancer Research Center,Heidelberg, GERMANY, 4 Ohio State University Hospital,Columbus, OH, 5 Bracco Diagnostics Inc., Princeton, NJ,6Bracco SpA, Milan, ITALYMATERIALS & METHODSForty-five patients (31M/14F) with suspected glioma orcerebral metastasis underwent two successive randomized,double-blinded MR exams with Gd-BOPTA and either Gd-DTPA (n = 23) or Gd-DOTA (n = 22) at equal dose (0.1mmol/kg). The imaging parameters and equipment wereidentical for the two examinations for each patient. The contrastagents were administered by power injector at 2 ml/swith the second agent administered between 24 hours and 14days after the first agent. Images were acquired predose (T1-weighted SE, T2-weighted FSE sequences) and postdose(sequential T1-weighted SE sequences at 2,4,6,8,10,15 minwith a T1-weighted SE-MT sequence at 12 min) at either 1T (Philips; 16 patients) or 1.5 T (Siemens; 29 patients) usinga head coil. Quantitative [lesion-to-brain ratio (L/B), contrast-to-noiseratio (C/N), and % lesion enhancement (%En)]and qualitative assessment of lesion enhancement was performedby two independent fully-blinded off-site readers.Statistical significance for quantitative evaluations wasdetermined using paired t-tests while significance for qualitativeevaluations was determined using the Wilcoxonsigned rank test.RESULTSImages from 43/45 patients were available for quantitativeassessment. After correction for precontrast values, significantlygreater L/B (p < 0.003), C/N (p < 0.03) and %En (p
PostersCONCLUSIONThis fully blinded intraindividual comparison confirms thatGd-BOPTA has preferential contrast enhancing characteristicscompared to conventional gadolinium agents. The superiorcontrast enhancement achieved with Gd-BOPTA mayimpact positively on overall patient management as well aspresurgical planning and postsurgical follow-up.Furthermore, the significantly greater enhancement at earlypostcontrast time points may be clinically highly advantageousin permitting a greater daily throughput of patients.KEY WORDS: Contrast agents, comparative studies, braintumorsThe authors of this work have indicated that they will be discussing/presentingan unapproved or investigative use ofMultiHance (gadobenate dimeglumine) made by Bracco SpAfor CNS imaging.The authors of this work have indicated the following affiliations/disclosures:1. Bracco-Altanapharma: Employee; 2.Bracco Diagnostics Inc.: Employee; 3. Bracco ImagingSpA: Employee.Poster 593 T High Resolution MR Imaging and MR Spectroscopyfor Surveillance of Brain TumorsAppignani, B. · Wong, E. T. · Wu, J. · Lenkinski, R.Beth Israel Deaconess Medical Center, Harvard MedicalSchoolBoston, MAPURPOSETo employ MR spectroscopy (MRS) as a tool for tumorsurveillance.MATERIALS & METHODSNineteen patients with primary (no. = 14) and metastatic (no.= 5) brain tumors were followed with 3 T MRS and MRimaging. Patients with metastases had received radiationtherapy and were studied to determine if enhancing massesrepresented recurrent metastases or radiation necrosis. Someprimary brain tumor patients were referred for diagnosticevaluation and all were studied after treatment. Nine patientshad two examinations, six had three exams, one had sevenexams, and two had ten exams by the time of this report. 3 Texamination included 3 mm dual-echo T2-weighted, FLAIR,and GRE 3D T1-weighted pre and postinjection of 20 mlgadopentetate dimeglumine. MR spectroscopy was performedwith a PRESS sequence (TR = 2000/TE = 35 msec,FOV = 24 cm), 1cm slice thickness and 16 x 16 phase encodingsteps. Evaluation was based on the relative amounts ofcholine (Cho), creatine (Cr), N-acetylaspartate (NAA),lipid/lactate, and myoinisotol in the spectra and on measurementsof Cho/Cre ratios. Spectral samples were obtained inand around tumors and tumor resection/treatment sites, andmatched to T2-weighted and gadolinium-enhanced T1-weighted scans.322RESULTSSurveillance examinations of primary brain tumor patientsranged from improving or stable spectral abnormalities inpatients responding to treatment (surgery and radiation therapy;6 patients), to increasing abnormalities with tumor progression(5 patients). In tumors that progressed, there werevariable imaging signs of progression (i.e., increased area ofT2 signal abnormality and increased enhancement), which,overall, were not as extensive as the spectral abnormalities.In one case there is stable anatomical appearance of thetumor treatment site over 15 months and 10 examinations,but there is a trend toward increasing choline and decreasingNAA around the tumor resection site, which is a change thatmay represent late radiation effects or be an early sign ofrecurrence. In one patient with a brainstem glioma, treatmentreduced the bulk and signal abnormality of the mass, but themoderate spectral abnormalities observed at the time of diagnosispersisted. Surveillance examinations of the patientswith metastases demonstrated progressive MRS abnormalitiessuspicious for tumor recurrence, accompanied byenlargement of masses, in two patients. In both cases thisinformation lead to surgery and recurrence was proven. Intwo patients with metastases, spectra were mildly deviantfrom normal and suspected to be related to radiation effects.These patients have been clinically stable. One patient hadan enlarging enhancing mass without increased choline, butwith an elevated lipid/lactate peak. This was suspicious forradiation necrosis, which was proven at surgery.CONCLUSIONAs a tool for tumor surveillance, MR spectroscopy expandsour analytic and diagnostic capability for determining themetabolic activity of tumors. We have shown that MRS contributesadditional diagnostic information in the ongoingevaluation of brain tumors that can influence treatment decisions.Further study should demonstrate if the metabolicabnormalities detectable with MRS are reliably an earliersign of tumor recurrence than standard features, and thus,may lead to earlier intervention and improved outcomes forthese patients.KEY WORDS: Spectroscopy, brain tumor, three teslaPoster 60Cavernous Malformation: Diffusion-Weighted ImagingFindingsHiwatashi, A. · Moritani, T. · Wang, H. Z. · Ketonen, L. ·Ekholm, S. E. · Westesson, P.University of Rochester Medical CenterRochester, NYPURPOSEThe purpose of this study was to evaluate the detectability ofcavernous malformation by means of susceptibility influencewith different imaging sequences such as diffusionweightedimaging (DWI), spin-echo (SE) echo-planar imaging(EPI) (b o images), fast SE-T2-weighted imaging (T2WI)and gradient-echo (GRE) sequences.
MATERIALS & METHODSWe reviewed a series of 34 patients (13 men and 21 women;4-93 years of age, mean 43 years) with cavernous malformationswho underwent MR imaging including DWIbetween October 2001 and September 2003. Additionally,GRE was obtained in eleven patients and GRE EPI in anothertwelve. For each lesion, the maximum size of signal losswas statistically evaluated using the Student’s paired t-test.Surgical pathologies were obtained in eleven patients thatconfirmed cavernous malformations. Two patients had afamilial history of multiple cavernous malformations. Other23 patients were diagnosed on MR imaging findings. Thesymptoms of these patients were seizure (n = 12), headache(n = 7), focal weakness (n = 5), nausea (n = 2), loss of consciousness(n = 2), dizziness (n = 2), focal sensory loss (n =1), mental status change (n = 1), aphasia (n = 1). Threepatients had no neurologic symptoms.RESULTSAll patients were examined with T2-weighted imaging andDWI. Forty-seven lesions were seen on both DWI and b oimages. Forty-six of these lesions were also detected on T2-weighted imaging. The mean size of signal loss was 14(range: 1-83) mm 2 on T2-weighted imaging, 18 (1-110) mm 2on DWI and 20 (2-109) mm 2 on b o images. The differencewith regard to size of signal loss was statistically differentwhen comparing T2-weighted imaging vs DWI (P < .01),T2-weighted imaging vs b o images (P < .01), and DWI vs b oimages (P < .01). In eleven patients, GRE was obtained alsoshowing 22 lesions, whereas only 16 lesions of these werelarge enough to be detected on T2-weighted imaging, and 17on DWI and b o images. The mean diameter of these 16lesions was 22 (2-83) mm 2 on T2-weighted imaging, 29 (1-110) mm 2 on DWI, 31 (3-109) mm on b o images and 32 (3-109) mm 2 on GRE. There was a statistical difference in sizebetween T2-weighted imaging vs GRE (P < .05), but notbetween DWI, b o images and GRE. In another twelvepatients, GRE EPI also was obtained showing 18 lesions,which were also detected on T2-weighted imaging, DWI andb o images. The mean size of these lesions was 11 (1-36) mm 2on T2-weighted imaging, 14 (1-47) mm 2 on DWI, 17 (2-55)mm 2 on b o images and 26 (2-81) mm 2 on GRE EPI.Comparing these sequences, the difference between GREEPI vs T2-weighted imaging, DWI and b o images were statisticallysignificant (P < .01).CONCLUSIONThe susceptibility effect seen as increase in size of signalloss was the greatest on GRE sequences. The higher sensitivityfor these sequences made it possible to detect more andsmaller lesions. Diffusion-weighted imaging and b o imagesalso can detect cavernous malformations but are not as sensitive.323Poster 61Evaluation of Tumor Blood Flow Using an Arterial SpinLabeling TechniqueKodama, T. · Yano, T. · Miyata, Y. · Tamura, S.Miyazaki Medical CollegeMiyazaki, JAPANPURPOSEInformation about vascularity is important for evaluatingbrain tumors. Purpose of this study was to estimate the usefulnessof arterial spin labeling (ASL) techniques for evaluatingthe blood flow of brain tumors.MATERIALS & METHODSForty-three patients with intracranial mass lesions (14meningiomas, 14 gliomas, 7 metastatic tumors, 3 malignantlymphomas, 2 other tumors, and 3 brain abscesses) werestudied with MR perfusion imaging using an ASL technique.All studies were performed with a clinical 1.5 T scanner(VISART/Ex, Toshiba, Tokyo) using a quadrature head coil.A single slice 2D or multislice 3D ASTAR (signal targetingwith alternating radio frequency using asymmetric inversionslabs) technique was used with a TI of 1200, 1400, or 1600ms. Relative tumor blood flow (rTBF) was calculated as follows:rTBF = [signal intensity (SI) of a tumor]/[SI of braintissue in the territory of contra-lateral middle cerebralartery]. Angiography was performed in 14 patients with anextraaxial tumor. In these patients, correlation betweenangiographic findings and rTBF or pattern of ASL signalwas evaluated.RESULTSAll meningiomas but one showed rTBF higher than 1.0.Including atypical meningiomas, no significant difference ofrTBF was observed between different histologic types. Nineof 12 high grade gliomas displayed rTBF greater than 1.0.Though only three metastatic tumors displayed high rTBF,metastatic tumors and gliomas could not be discriminated byrTBF. Relative tumor blood flow of malignant lymphomas,low grade gliomas (pilocytic astrocytomas), and abscesseswas lower than 1.0. Findings of angiography and rTBF ofextraaxial tumors were not well correlated. In tumors withlarge tumor vessels, inhomogeneous hypervascular area wasobserved. This suggested the influence of residual intravascularlabeled spins on the signal of ASL. In some patients,TBF images were useful to diagnose recurrent tumor or radiationnecrosis (Figure).PostersKEY WORDS: Diffusion, cavernous malformation, MR imaging
324rCBV and rCBF maps in respect of delineation of clinicalutility, gray and white matter and basal ganglia delineationwere evaluated in an independent off-site assessment.PostersCONCLUSIONArterial spin labeling techniques could be used to estimatetumor vascularity. However, several problems such as theinfluence of arterial transit time remain to be resolved.KEY WORDS: Arterial spin labeling, perfusion, tumor bloodflowPoster 62Perfusion MR Imaging of Brain Tumors with Gd-BOPTA (MultiHance)Essig, M. 1 · Le-Huu, M. 1 · Kirchin, M. 2 · Lodemann, K. 3 ·Kauczor, H. 11German Cancer Research Center, Heidelberg, GERMANY,2Bracco Diagnostics, Milan, ITALY, 3 Bracco-Altanapharma,Konstanz, GERMANYPURPOSEPerfusion measurements of the brain by contrast-enhancedMR imaging is becoming more and more popular. Themethod already has proven effective for the assessment ofcerebrovascular diseases, for brain tumors, and for monitoringafter radiotherapy. A crucial aspect for the quality of theperfusion measurements and the reliability of the results isthe amount of the relative signal reduction, which is dependenton the concentration and the relaxivity of the contrastagent used. The present study was conducted to evaluate twoof the newer generation contrast agents for cerebral perfusionMR imaging. Specifically, the weakly protein interactingMR contrast agent MultiHance® was compared with theone-molar agent Gadovist® at single (0.1 mmol/kg) anddouble (0.2 mmol/kg) dose in both healthy volunteers andpatients.MATERIALS & METHODSA randomized intraindividual comparative study was conductedin 12 healthy male volunteers and 30 patients withcerebral gliomas. The imaging parameters, slice positioning,and contrast media application were standardized. For thequantitative assessment the rCBV and rCBF of gray andwhite matter, the percentage signal drop and the full widthhalf maximum (FWHM) of ROI signal time curves were calculated.For a qualitative analysis the image quality of theRESULTSOn-site evaluation of the study in healthy volunteersrevealed that single doses of the new contrast agents weresufficient to achieve high quality perfusion maps. No differencesin susceptibility effect, described by the percentage ofsignal loss, were apparent between the two contrast agents(Table 1). The FWHM was equal for the single dose of bothagents and the double dose of Gadovist®. Only the doubledose of MultiHance® led to a significant widening of thesignal time curve (p < 0.05). The calculated rCBV and rCBFvalues of the different ROIs were constant for both dosagesand contrast media. At the qualitative off-site assessmentboth readers found the double dose images to be better suitedfor gray-white matter differentiation and the delineationof the basal ganglia. However, there was no differencebetween the contrast agents and single dosage offered goodimage quality for rCBF in all but one of the exams (Table 2).In the patient study performed with single dose of contrastmedia all perfusion scans were of excellent diagnostic qualitywithout a difference between the used contrast media. Anabsolute quantification of perfusion data was possible withthe use of these new agents.CONCLUSIONThe susceptibility effect of the new generation contrastagents is stronger than for conventional MR contrastmedia.The one molar MR contrast agent Gadovist® has noadvantages over MultiHance®, an MR contrast agent with ahigher relaxivity in perfusion MR imaging. Both agentsallow the calculation of high quality perfusion maps at alower contrast agent dosage.KEY WORDS: Brain tumors, perfusion, absolute quantificationThe authors of this work have indicated that they will be discussing/presentingan unapproved or investigative use of: 1.MultiHance made by Bracco Diagnostics for cerebral perfusionMR imaging; 2. Gadovist made by Schering/Berlex forcerebral perfusion MR imaging.The authors of this work have indicated the following affiliations/disclosures:1. Bracco Diagnostics: Employee; 2.Bracco-Altanapharma: Employee.
Poster 63Unusual Presentation of Calcified, Isolated BrainMetastases in Patients with Previous History of BreastCarcinoma Treated with Surgery and Chemotherapy:Report of Four CasesDi Lella, G. M. 1 · Tirpakova, B. 1 · Colosimo, C. 21Catholic University of Sacred Heart School of Medicine,Rome, ITALY, 2 University “G. d’Annunzio,” and ITDB,Chieti, ITALYPURPOSECerebral metastases (CM) represent the most frequent braintumors. Although of typical appearance in most cases, sometimesan unusual presentation may behave to uncorrect diagnosis,the most frequent diagnostic dilemma being betweenCM and meningiomas. We observed four cases of CM inpatients previously treated for breast cancer with surgery andchemotherapy, initially misdiagnosed.MATERIALS & METHODSFour female patients, previously treated for breast carcinomawith surgery and chemotherapy (age range....), were studiedin our institutions in the period 1997-2003. All of themreceived chemotherapy with standardized protocols: threeunderwent also local radiotherapy. G.A. (age 62 years), 28months after surgery with lymph node ablation, chemo andradiotherapy, developed a large right posterior temporoparietalcystic and calcific lesion with surrounding edema. B.C.(age 56 years), 34 months after surgery and CMF protocolpresented a left cerebellar partially calcified and irregularlyenhancing mass. P.S. (age 58 years), 32 months after mastectomyand radio-chemotherapy showed neurologic cerebellardeficit: CT and MR imaging demonstrated a calcificlesion in the posterior fossa with dural and parenchymalinvolvement. C.A. (age 63 years), presented cerebellarsymptomatology 40 months after left breast quadrantectomyintegrated with chemo-radiotherapy. The following CT andMR examinations showed a calcified left emispherical lesioninvolving omolateral transverse sinus and tenthorium. Allpatients underwent pre and postcontrast CT scan, followedby 1 and 1.5 T pre and postgadolinium MR examination.RESULTSAll lesions had similar characteristics at the onset of neurologicsymptoms: large, single, calcified, cystic mass withinhomogeneous enhancement and slight surrounding edema.Surgery, with complete removal of the lesions, was performedin all cases. Histology documented secondary lesionscompatible with breast cancer cells. One month after surgeryall patients received whole brain radiotherapy.325CONCLUSIONAs reported in the literature atypical presentation of brainmetastases can create diagnostic difficulties. In our series allthe patients, with known previous breast cancer, developedlarge, calcified lesions with or without cystic component. Wesuggest that chemotherapy may play a role in the developmentof such atypical lesions.REFERENCES1. Stadnik T, Deroover J, Gosens A, Michotte A, Freson M,Osteaux M. Calcified, Cystic Brain Metastases. Eur J Radiol1997;25(1):36-402. Tagle P, Villanueva P, Torrealba G, Huete I. IntracranialMetastases or Meningioma? An Uncommon ClinicalDiagnostic Dilemma. Surg Neurol 2002;58(3-4):241-2453. Ricke J, Baum K, Hosten N. Brain Metastases from OvarianCarcinoma. Neuroradiology 1996;38(5):460-4614. Sastre-Garriga J, Pintore M, Montaner J, Montalban X, RoviraA, Codina A. Calcified Cerebral Metastases: Study of TwoCases and Review of Literature. Neurologia 2000;15(3):136-1395. Hwang TL, Valdivieso JG, Yang CH, Wolin MJ. Calcified BrainMetastases. Neurosurgery 1993:32(3):451-454KEY WORDS: Cerebral metastases, calcifications,chemotherapyPoster 64Correlation between Fiber-Tracking Images of OpticTracts and Visual Field Defects in the Cases afterTemporal LobectomyTaoka, T. 1 · Nakagawa, H. 1 · Iwasaki, S. 2 · Sakamoto, M. 1 ·Hirohashi, S. 1 · Kichikawa, K. 11Nara Medical University, Kashihara, Nara, JAPAN,2Higashiosaka City General Hospital, Higashiosaka, Osaka,JAPANPURPOSEPatients after anterior temporal lobectomy for temporalepilepsy shows various degrees of visual field defectsbecause of optic tract injury. Purpose of this study is to evaluatecorrelation between distribution and severity of visualfield defect and continuity of fiber-tracking images that representoptic radiation on diffusion tensor tractography forpostlobectomy patients.MATERIALS & METHODSWe examined 8 cases after temporal lobectomy for temporallobe epilepsy. Degree of visual field defect was classifiedinto three groups upon the deficits in upper quadrant visualfield: Group A: moderate deficit in the medial sector andintact lateral sector field; Group B: complete deficit in themedial sector and moderate deficit in the lateral sector field;Group C: complete deficit in both medial and lateral sectorfield. Diffusion tensor images (EPI sequence; TR = 180, TE= 96, b = 1000, 6 axis encoding) were acquired usingMagnetom Sonata (1.5 T, Siemens AG, Germany). Fibertrackingimages that are considered to represent optic radiationwas made using diffusion tensor imaging software (dTVver1.5) developed by Masutani (Department of Radiology,The University of Tokyo). Fiber-tracking images for globalside of optic tract was drawn by placing seeds at fibers ante-Posters
Posters326rior to lateral geniculate body. Seeds were placed at lateral Poster 65sagittal layer of temporal lobe to draw fiber-tracking imagesfor cortical side of optic tract. We evaluated continuity ofNeuron Cell Body Initialization: A New Algorithm for thethose fiber-tracking images for three patient groups and correlatedwith distribution and severity of visual field defect.Physiologic Initialization of 3D Curves in FiberTractographyRESULTSThere was a tendency that visual deficit spread from medialsector to lateral sector according to severity. Group A, whichis the least severe group, consisted of 2 cases, continuity offiber-tracking images for optic tract was well depicted onMR tractography in all 2 cases (Figure A). Group B consistedof 3 cases. Two of them showed incomplete continuity offiber-tracking images for optic tract and one showed completediscontinue of fiber-tracking images for optic tract atthe region of Meyer’s loop. Group C was the most severegroup and consisted of three cases. All of them showed completediscontinuity of fiber-tracking images for optic tract(Figure B).Stewart, J. E. · Port, J. D.Mayo ClinicRochester, MNPURPOSEMany algorithms have been developed for the creation ofthree-dimensional (3D) curves, the mathematical equivalentof white matter fibers, from MR diffusion tensor images(MR DTI). The purpose of this research is to develop a newmethod of 3D curve initialization to replace the commonpractice of initializing curves everywhere within the whitematter, a method we will refer to as uniform spatial initialization(USI). This new method, neuron cell body initialization(NCBI), simulates brain physiology by initializing 3Dcurves near the gray/white interface where axons normallywould enter the white matter.CONCLUSIONMedial sector of upper quadrant field tends to be moreimpaired than lateral sector after temporal lobectomy. Thisphenomenon seems to reflect anatomical construction thatthe fibers for medial sector are located in anterior part ofMeyer’s loop. Continuity of fiber-tracking images for optictract on diffusion tensor tractography correlated to thedegree of visual field defect after anterior temporal lobectomy.MR tractography of temporal lobe was useful in monitoringoptic tract after temporal lobectomy. This result wasobtained by using the free software dTV (http://www.utradiology.umin.jp/people/masutani/dTV.htm)for MR-DTIanalysis developed by Image Computing and AnalysisLaboratory, Department of Radiology, The University ofTokyo Hospital, Japan.KEY WORDS: Tractography, optic tract, temporal lobectomyMATERIALS & METHODSSpin-echo echo-planar diffusion tensor images are acquiredon eight normal volunteers in the axial plane using a GE1.5T LX MR scanner. A linear multiple regression algorithmstatistically estimates the diffusivity constants of the resultantsuper-tensor (13 axis) data sets, followed by diagonalizationand calculation of Eigenvalues and Eigenvectors.Sixty 128 x 128 images are acquired with a slice thickness of4.0 mm with a 2.0 mm offset. These images are super-sampledand 60 additional images are linearly interpolated for atotal three-dimensional (3D) matrix size of 256 x 256 x 120with a voxel aspect ratio of 0.9375 x 0.9375 x 1.0 mm. Thefractional anisotropy (FA) at each voxel is calculated. An FAthreshold of 0.3 was shown empirically to be a good estimateof the gray/white matter interface. Voxels within the whitematter that border gray matter have an FA between 0.3 to 0.7and are marked as possible candidates for 3D curve initialization.Next, the 3D image gradient is calculated from theFA data. This gradient produces a 3D vector at each of themarked voxels that points from the gray matter orthogonallyinto the white matter. This is the expected course of axonsentering the white matter from the neuron cell bodies in thegray matter. The axons following this course should bealigned with principal Eigenvector of the MR DTI. A dotproduct therefore is formed between these two vectors. If theabsolute value of this dot product is greater than 0.5 then a3D curve is initiated from this voxel and travels in bothdirections until it terminates when trilinearly interpolated FAfalls below 0.3. Termination therefore should occur at thegray/white interface. Results were output in VRML formatfor review.RESULTSCurves passing through the corpus callosum were segmentedand shown to correlate better with known fiber pathwaysand tract densities described in the literature when NCBI wasused compared to USI. Neuron cell body initialization wasalso more than twice as fast as USI in computing these pathwaysby reducing the number of curves calculated from over545K to 203K.
CONCLUSIONThis presentation describes the NCBI algorithm in detail. Itis our hope that other researchers might find this simple butpowerful method of value in their own research.KEY WORDS: Fiber tractography, diffusion tensor imaging,postprocessingPoster 66Optimization of T1-Weighted Brain Imaging on 3 T MRSystemPhillips, D. · Hamner, L. · Finlayson, A. · Rumboldt, Z.Medical University of South CarolinaCharleston, SCPURPOSEThe availability of high field (3 T) MR scanners in clinicalpractice theoretically offers the benefit of increased signalto-noiseratio (SNR) and therefore improved evaluation ofthe neurocranium. On T1-weighted images of the brain,however, the image contrast of this technique often may bepoor in high field imaging. Since T1 relaxation times arelonger at higher fields and the relative signal characteristicsof many brain tissues are similar, it is more difficult to obtainT1-weighted images with sufficient contrast on high fieldsystems, and the established protocols used in 1.5 T imagingcannot be simply extrapolated to 3 T imaging. Our goal wasto optimize 3 T image quality by testing a variety of T1-weighted sequences in the clinical setting.MATERIALS & METHODSTwenty-five consecutive patients imaged on a 3 T scannerwere divided into five groups. For each group of fivepatients a different T1-weighted sequence was utilized: spinecho(SE), inversion recovery (IR), gradient-echo (GRE),fluid-attenuated inversion recovery (FLAIR), and turbo gradient-echo(TGE). Subjective evaluation of susceptibilityand pulsation artifact degradation and overall image qualitywas performed by two independent observers, using a scalefrom one to three. Images then were analyzed via objectivemeasurement of contrast between white matter and gray matter,white matter and cerebrospinal fluid, as well as thedegree of increase in signal intensity with gadolinium.RESULTSGradient-echo images demonstrated pronounced susceptibilityartifact which degraded image quality and were excludedfrom further analysis. Subjective evaluation of FLAIR andTGE images was superior to the other T1 techniques. Theaverage overall score was 2.7 for FLAIR, 2.3 for turbo gradient-echo,2.1 for IR, and 2.1 for SE. There were no significantdifferences between the raters’ scores. Inversion recoveryimages showed by far the best overall contrast, howeverenhancement with gadolinium was inconspicuous. Objectivemeasurements of contrast however demonstrated better averagecontrast with spin-echo sequence than with FLAIR, butwith a much larger standard deviation (Table 1), indicatingthat spin-echo T1-weighted images were far less consistent.The same was true for enhancement with gadolinium. Theaverage increase in signal intensity/standard deviation327(AISI/SD) was 1167/382 with FLAIR and 1388/1184 withspin-echo sequence. Turbo gradient-echo images providedsomewhat less prominent, but less variable contrast enhancement:888/55 (AISI/SD).Contrast on different sequences (average/standard deviation)Inversion FLAIR Turbo Spin-echoRecovery T1w gradient- T1wT1wecho-T1wWhite Matter/Gray Matter 1333/506 204/59 180/35 263/208White Matter/CSF 5291/856 695/165 574/119 2696/696CONCLUSIONOverall, T1-weighted FLAIR offered superior image contrast,acceptable image artifact, and comparable acquistiontime. Interestingly, the literature shows that T1-weightedFLAIR also was found optimal for a low field (0.2 T) MRsystem. The T1-weighted FLAIR may be the sequence ofchoice for high field intracranial imaging in the clinical setting.Turbo gradient-echo sequence appears a good alternativewhen 3D acquisition is needed.KEY WORDS: 3 T, pulse sequences, T1-weighted imagesPoster 67Pyramidal Tracts by Diffusion Tensor Tractography inPatients with Arteriovenous MalformationsItoh, D. · Aoki, S. · Masutani, Y. · Maruyama, K. · Mori, H.· Masumoto, T. · Abe, O. · Yamada, H. · Hayashi, N.University of Tokyo HospitalTokyo, JAPANPURPOSEDiffusion tensor imaging and tractography can visualize thesupratentorial pyramidal tract consistently and can providedetailed anatomical information about the relationshipbetween the tracts and adjacent structures and diseases, suchas tumors, hematomas, and infarction. We used diffusiontensor tractography to analyze and clarify the relationshipbetween arteriovenous malformations (AVMs) and thepyramidal tract and also to clarify the changes of the tractsby the status of AVMs.MATERIALS & METHODSTwenty consecutive MR studies with diffusion tensor imagingof 12 patients with cerebral AVMs adjacent to the pyramidaltract were analyzed. Diffusion tensor imaging (TR/TE6000/78 ms, MPG 13 axes, b-value 1000 s/mm2, 128 x 128Matrix, 2 NEX, 5 mm thickness/interleave, acquisition time5.5 min) was performed by 1.5 T MR imager. Diffusion tensortractography (DTT) of the pyramidal tract were visualizedby the dTV and VOLUME-ONE software (Free softwareby Masutani Y). We evaluated the anatomical relationshipbetween the AVMs and the tracts, shape and deformityof the tracts compared with the contralateral side, andchanges of the anisotropy of the tracts. Clinical informationconcerning the pyramidal tracts also was reviewed.Posters
PostersRESULTSThe pyramidal tract could be visualized by DTT in allpatients with AVMs, although some changes were observedin complicated cases. In AVMs without hematoma and/orother complications, the pyramidal tract visualized by DTTshow almost normal appearance compared with the contralateralnormal tract. Even in the patients with large AVMjust at the portion of the pyramidal tract, the tract can bevisualized through the residual white matter between thedrainers and feeders with only mild shift by the mass effectof the large drainers. The anisotropy of the tract show minimalchanges compared with the normal side. Functions ofthe pyramidal tracts were well preserved in this group. InAVMs with hematoma, radiation necrosis, and severeedema, the pyramidal tract by DTT show deformity such asmoderate to severe shift, decreased anisotropy shown bychange of the color (red to white), and decreased number offibers on DTT. Diffusion anisotropy was decreased at theportion of the complications. Some functional deteriorationwas seen in this group.CONCLUSIONThe pyramidal tract can be visualized in patients with AVMby DTT. Visualization of the anatomical relationshipbetween the AVM and the pyramidal tract can be useful inoperation and irradiation planning.KEY WORDS: Arteriovenous malformation, pyramidal tract,diffusion tensor imagingPoster 68SENSE for Diffusion Tensor Imaging of the BrainMoon, W. 1,2 · Chung, E. 1,21Kangbuk Samsung Hospital, Seoul, REPUBLIC OFKOREA, 2 Sungkyunkwan University School of Medicine,Seoul, REPUBLIC OF KOREAPURPOSETo evaluate sensitivity encoding (SENSE) technique for diffusiontensor imaging.MATERIALS & METHODSSixteen normal volunteers underwent single-shot echo-planardiffusion tensor imaging with standard sequential andSENSE MR acquisitions with a 1.5 T Philips Intera (TR/TE= 7390 or 4331/62 ms, ETL = 127 or 67, NEX = 3, matrix =128 x 128, FOV = 220 x 220 mm, slice thickness = 4 mm,total b value = 600 s/mm 2 , six orthogonal diffusion gradients).With SENSE, echo train length was shortened (127 vs67) and acquisition time was reduced from 2 min 57 sec to 1min 22 sec for DTI. The diffusion tensor-encoded MRimages were transferred to a PC workstation and analyzedwith a house-made software. Fractional anisotropy (FA) andapparent diffusion coefficient (ADC) map were calculated.Image quality and presence of artifacts (ghost susceptibility,eddy current) were graded with a three-point scale. Apparentdiffusion coefficient and FA were measured in the majorwhite matter tract and gray matter nuclei. Signal-to-noiseratio also was measured. Fisher’s exact test and Student’s t-test were used for statistical analysis.328RESULTSImage quality at SENSE DTI was scored significantly higherthan that at standard DTI (p < 0.05). Susceptibility artifact(around brain stem and temporal base) and eddy current artifactwas reduced significantly at SENSE DTI when comparedwith those at standard DTI (p < 0.05). Ghost artifactwas not observed at SENSE DTI. Apparent diffusion coefficientvalue was not significantly different between SENSEDTI and standard DTI while FA value in the cerebral cortexand white matter was significantly higher at SENSE DTIthan at standard DTI (p < 0.05). Signal-to-noise ratio was13.44 at standard DTI and 16.20 at standard DTI.CONCLUSIONSENSE application for diffusion tensor imaging significantlyreduces geometric distortion by artifacts, shorten acquisitiontime, but tends to erroneously increase FA value of thetissue. Therefore, DTI with SENSE may provide better whitematter fiber tracking and diffusivity indices when imagingparameters for SENSE (such as NEX) are optimized.KEY WORDS: Brain, diffusion MR, diffusion tensor imagingPoster 69Line Scan Diffusion Tensor MR Imaging of Brain at 0.2THori, M. 1 · Okubo, T. 1 · Adachi, Y. 1 · Nakata, Y. 1 · Aoki, S. 2 ·Araki, T. 11University of Yamanashi, Yamanashi, JAPAN, 2 Universityof Tokyo, Tokyo, JAPANPURPOSEThe purpose of this study was to investigate and measure thevalues of apparent diffusion coefficients (ADC) and fractionalanisotropy (FA) of diffusion-tensor MR imaging(DTI) with line scan data acquisition in the healthy humanbrain at 0.2 T MR imager and compared them with the valuesat high field strength reported in the past, as a preliminarystudy before its clinical use.MATERIALS & METHODSA total of eight healthy volunteers with no history of neurologicdisease participated in this study. All MR imaging wasperformed on a 0.2 T MR imager (Signa Profile version 7.6,GE-YMS, Tokyo, Japan) equipped with gradients that had amaximum slew rate of 17 T/m/sec and a gradient strength of10 mT/m with a standard head coil. To cover the wholebrain, line scan diffusion-weighted imaging (LSDWI) wasperformed in 18 transverse sections. Line scan diffusionweightedimaging was the line scan spin-echo sequence witha pulsed-field-gradient diffusion preparation pulse employingtwo different b-values (0 and 700 s/mm2) along sixdirections. Imaging parameters of LSDWI were as follows:TR/ TE = 380/116 ms, matrix 128 x 64, bandwidth = 3.92kHz, FOV = 300 x 150 mm, slice thickness/gap = 6/0 mmand b value of 0 and 700 s/mm 2 with the maximum b valueapplied in six directions. Subsequently, ADC maps and FAmaps were calculated from the obtained LSDWI images ona pixel by pixel basis on a PC using a free software (dTV 1.5,developed by Image Computing and Analysis Laboratory,Department of Radiology, The University of Tokyo Hospital,Japan). For evaluation of ADC and FA, an region of interest
(ROI) analysis was performed. Regions of interest wereplaced in thalamus, genu of the corpus callosum, centrumsemiovales on the images obtained with a b value of 0sec/mm2 and then were projected onto FA maps (Figure 1)and mean diffusivity maps, where ROI mean signal intensitieswere calculated. Areas with severe geometric distortionswere excluded from the analysis.329Poster 70Parametric Maps Obtained from Direct Fit of theGeneral Kinetic Model to Dynamic-Enhanced MRImaging Data Using the Convolution of the MeasuredVascular Input Function with the Transfer FunctionButman, J. A. 1 · Gupta, S. N. 2 · Ferrier, M. C. 1 · Thomasson,D. 11Warren G. Magnuson Clinical Center, National Institutes ofHealth, Bethesda, MD, 2 Applied Science Lab, GeneralElectric Medical Systems, Baltimore, MDPostersPURPOSETo present a direct method for calculating parametric mapsof brain tumors from dynamic-enhanced MRI (DEMRI).The general kinetic model (GKM) of Kety describes thekinetics of contrast exchange between plasma and the extracellularspace (EES) based on three parameters. Mostapproaches to deriving parametric maps from DEMRI datasolve for these parameters by assuming a form of the vascularinput function to obtain a closed form solution of theGKM. We show that a closed form solution is not necessary,and that robust estimated kinetic parameters can be deriveddirectly from a convolution of a measured vascular inputfunction (VIF) to the transfer function of the GKMRESULTSAll LSDWI examinations were imaged successfully.Apparent diffusion coefficient value in the thalamus is 0.78± 0.03 (mean ± SD); that in the genu of the corpus callosum,0.7 ± 0.07; that in the centrum semiovales, 0.75 ± 0.04.Fractional anisotropy in the thalamus is 0.38 ± 0.01 (mean ±SD); that in the genu of the corpus callosum, 0.84 ± 0.10;that in the centrum semiovales, 0.49 ± 0.11. These valueswere comparable with the values at high field strengthreported in the past literature (1).CONCLUSIONThe ADCs and FAs measured using the data obtained at 0.2T MR imager shows the appropriate values. This means thatDTI at low field strength is available for clinical use to estimatestructural integrity and connectivity in the brain.REFERENCES1. Hunsche S, Moseley ME, Stoeter P, Hedehus M. Diffusion-Tensor MR Imaging at 1.5 and 3.0 T: Initial Observations.Radiology 2001;221:550-556KEY WORDS: Diffusion-weighted imaging, low fieldstrength, tractographyMATERIALS & METHODSDynamic-enhanced MR imaging in over 50 brain tumorpatients was performed at 1.5 T using a 3D SPGR sequence:TR 7.2, TE 3.1, FA 30°, BW 31 kHz, FOV 22 cm, matrix 256x 192 x 16, slab 8 cm, 20 sec. Sequential volumes wereobtained for 10 min (3 volumes/min). 0.1 mmol/kg Gd-DTPA was injected i.v. @ 0.3 cc/sec @ 100 seconds. T1mapping was performed in some cases by obtaining an additional3D SPGR with FA 5°. Parametric maps were generatedaccordingly: (1) DEMRI data converted to Gd concentration(C Tmeasured ) on a pixelwise basis using assumed T1 valuesor from T1 mapping (if performed); (2) place an ROI onvenous sinus to obtain VIF; (3) convolve the VIF (C Pmeasured )with the GKM to obtain:C Testimated = K trans˘(C Pmeasured Äexp(-k EP t)) + C Pmeasured˘f PV; (4)adjust K trans , k ep , and f PV to obtain best fit of C Testimated toC Tmeasured where K trans , k ep, and f PV refer to the volume transferconstant from plasma to the EES, the rate constant fromEES to plasma, and the fractional plasma volume.RESULTSReproducible parametric maps were generated. Goodness offit was high as assessed by c 2 values in regions of visibleenhancement including tumor, vessels, and extracranialstructures such as nasal mucosa and muscle. Nonenhancingportions of the brain showed uniformly low f PVand K trans, butvariable k ep . Figure shows parametric maps generated in apatient with GBM.
PostersCONCLUSIONDynamic-enhanced MR imaging provides some informationregarding the pharmacokinetics of tumor vessels and vascularpermeability. Accurate and repeatable measurements areimportant if these measures are to be used diagnostically oras surrogate markers in clinical trials of antiangiogenic therapies.Difficulties with some pharmacokinetic models arisebecause the measured tissue response C Tmeasured is used toderive not only the parameters describing tissue response(K trans , k EP , f pv ), but also the vascular input (C P ). BecauseDEMRI allows a direct measurement of C P in the brain, weshow the feasibility of directly fitting the GKM to obtain tissueparameters. This approach should be robust in the face ofalterations in injection strategy or hemodynamic response.KEY WORDS: Pharmacokinetics, tumor, angiogenesisThe authors of this work have indicated the following affiliations/disclosures:General Electric Medical Systems:Employee.330MATERIALS & METHODSThe basic principle is that the RF pulse shape should be suchthat the pulse tips the longitudinal magnetization along thecoil axis by larger and larger tip angles as the sensitivity fallsoff such that a constant level of transverse magnetization iscreated along the axis. To accomplish this, we take the reciprocalof the sensitivity of the coil as the working transversemagnetization profile, and then derive the pulse shape fromthis. Consider a circular surface coil. The sensitivity, S c , of acircular surface coil of radius R along the coil axis, y, can beexpressed as, S c (y) = kR 2 /(R 2 + y 2 ) 3/2 [1]. The working transversemagnetization profile, M t , then can be obtained as,M t (y) = 1/S c (y) [2]. When the RF pulse is applied in the presenceof a linear gradient, G y , we have, y proportional nu [3a];M t (y) proportional M t (nu) [3b], where nu is temporal frequency.For small tip angle excitation, the desired RF pulseshape, B 1 (t) = Fourier transform [M t (nu)] [4]. For large tipangle excitation, the pulse shape in Eq.4 can be optimized.The theory also can be applied to coils of other shapes suchas oval or Helmholtz pair. For a Helmholtz pair, the sensitivity,S h (y), is given by, S h (y) = kR 2 [1/(R 2 + (-D-y) 2 ) 3/2 + 1/(R 2+ (-D+y) 2 ) 3/2 ] [5], where D is center-to-center distance of theHelmholtz pair of coil-radius R with currents in the samedirection. The RF pulse shape then can be obtained, asbefore, by taking the Fourier transform of the reciprocal ofthe S h (y) in Eq. 5 for any arbitrary D. This may have extendedapplications in clinical practice, where D can be adjustedarbitrarily while still producing B 1 -insensitive excitation.RESULTSFurther Refinement and Parallel Imaging - If the same coil isused for signal reception, the received signal would be spatiallynonuniform, even if the excitation is constant, alongthe coil axis because of variable coil sensitivity. To obtainthe received signals of constant intensity, we first form a spinecho slice image of a constant spin density object (rectangularwater phantom) with slice plane parallel to the coil axisand B 1 (t) as the excitation pulse, and then plot an imageintensity profile through the center of the coil/phantom. TheFourier transform of the reciprocal of this profile would bethe refined RF pulse shape, which can be modulated furtherusing appropriate modulation functions to excite multipleslices simultaneously along the axis for SARSI parallel MRimaging (submitted to this meeting).Poster 71Theory of a New RF Pulse Design for B1-InsensitiveSpatially Selective Excitation with a Coil of B1-Varying-FieldSingh, S. 1 · Shekhara, R. 21Independent, Winnipeg, MB, CANADA, 2 Independent,Patna, INDIAPURPOSESurface coils have the advantage of producing higher signalto-noiseratio in MR experiments; however, the variation ofthe coil B 1 field/sensitivity along its axis concerns the reproducibilityand quantitative accuracy of MR experiments.Here we describe a new RF pulse design for creating B 1 -insensitive spatially selective excitation (B1ISSE) using acoil of B1-varying-field (B1VF).CONCLUSIONWe described our new RF pulse design without requiring anyadiabatic conditions to be met for B1ISSE with a B1VF forvarious applications.KEY WORDS: New B1-insensitive, spatially selective, RFpulsePoster 72Validation of the Accuracy of the Spatial Normalizationof the Brain Diffusion Tensor Imaging Using StatisticalParametric MappingHigano, S. · Tamura, H. · Mugikura, S. · Takahashi, S.Tohoku Graduate School of MedicineSendai, JAPANPURPOSEThe spatial normalization is the technique that transformsdifferent size or shape of brain images from multiple subjectsinto a “normalized brain.” This enables comparisonamong different brains on the same coordinate system. Thestatistical parametric mapping (SPM) is one of the famoussoftware with function of the spatial normalization.
Recently, several investigators have applied SPM to theanalysis of the brain diffusion tensor imaging (DTI) withspatial normalization, but there is no report evaluating itsaccuracy. Our purpose is to validate the accuracy and reproducibilityof the spatial normalization using SPM.MATERIALS & METHODSSubjects include three healthy volunteers, 9 patients withoutobvious MR abnormality and 6 cases with chronic cereberovasculardisease (CVD). The CVD cases were examinedtwice with 1-3 month interval. Diffusion tensor imaging wasobtained using SE type single-shot EPI sequence with 6 differentdirections of motion probing gradients (MPG, b =1000 sec/mm2) as well as images without MPG. In the volunteers,DTI was performed with several different imagingparameters (various slice thickness/gap/NEX, head position).The DTI data were transferred to the workstation, andapparent diffusion coefficient (ADC) images and fractionalanisotropy (FA) images were calculated. Using SPM 99, wemade two different normalized images of ADC and FA andcompared each other: 1) normalized ADC and FA imagesobtained by normalizing ADC and FA images calculatedfrom raw DTI data set, and 2) normalized ADC and FAimages directly obtained from normalized DTI data set. Tovalidate the anatomical accuracy of the normalization, mismatchof various anatomical landmarks such as cerebralmargins, central sulcus, margin of the corpus callosum,Monro foramen, pineal region, center of the middle cerebellarpeduncle was measured among cases. To see whether thequantitativeness of ADC and FA values was preserved afternormalization, correlation of these values between rawimages and normalized images was evaluated by definingregions of interest in various structures including middlecerebellar peduncle, cerebral peduncle, basal ganglia, thalamusinternal capsule, corpus callosum, and centrum semiovale.RESULTSMismatch of the anatomical landmarks among the samecases with different studies (the volunteers and 6 CVDcases) was 1.2 mm in average (maximum 8 mm). The mismatchamong different cases (15 clinical cases) was 2.8 mmin average (max 15 mm). The difference between the samecases and the different cases was statistically significant(Mann-Whitney: p < .0001). The ADC and FA values fromnormalized images with two different calculations wereidentical. There was good correlation of ADC and FA valuesin various structures between raw images and normalizedimages (r = 0.992 in ADC, r = 0.989 in FA). The correlationis almost identical in ADC but slightly underestimated in FA(slope of the regression line was 1.03 in ADC and 0.85 inFA).331Poster 73Quantified Contrast Enhancement in CT Correlate withDegree of Blood-Brain Barrier Disruption of the HumanBrainShelef, I. 1 · Kaufer, D. 2 · Koren, A. 3 · Golan, H. 4 · Soreq, H. 2· Shroff, M. 5 · Tomkin, O. 3 · Friedman, A. 31University of Toronto, Toronto, ON, CANADA, 2 TheHebrew University, Jerusalem, ISRAEL, 3 Ben GurionUniversity of the Negev, Beer Sheva, ISRAEL, 4 CampusGolda, Petah Tikva, ISRAEL, 5 Hospital for Sick Children,Toronto, ON, CANADAPURPOSEThe aim of the study was to detect, and to quantify by a noninvasiveand commonly used imaging modality, blood-brainbarrier (BBB) disruption. The BBB separates the brain’sinterstitial space from the blood and prevents the penetranceof circulating molecules and cells into the brain (1, 2). Inmost human studies, BBB permeability has been estimatedusing nonquantified imaging technique (3). Animal BBBdisruption can be measured quantifiably utilizing an invasivetechnique (4, 5).MATERIALS & METHODSStandard pre and postcontrast brain CT had been obtained in18 patients with various brain disorders and in a “control”group (randomly selected ambulatory patients who werereferred to brain CT and had both normal neurologic examinationand normal brain CT). The patients as part of theirclinical investigation underwent blood and CSF lumbar tapfor analysis.Enhancement was calculated by comparing Hounsfield Unit(HU) pre and postcontrast administration in different regionsof the brain and by using an image analysis program forrescaling to a colored spectrum (blue to red) between waterand bone densities (0-1000 HU, respectively). Proteins inCSF were measured utilizing gel electrophoresis for albuminand incubation with antibodies selective for acetylcholinesterase AChE-R.RESULTSDensitometry analysis of the immunopositive albumin andAch-R displayed positive and linear correlation with tissueenhancement of the brain (Figure 1).PostersCONCLUSIONUsing SPM 99, DTI was well normalized anatomically withpreserving quantitativeness. Application of the spatial normalizationshould provide reliable and subjective results inanalysis of DTI data obtained from various size/shape ofbrain with different scan parameters.KEY WORDS: Diffusion tensor imaging, normalization
PostersCONCLUSIONWe report the quantification of BBB disruption by measuringenhancement levels in CT of the brain. In this methodincreased level of enhancement was associated withincreased albumin and Ach-R accumulation in CSF.REFERENCES1. Rubin LL, Stadton JM. The Cell Biology of the Blood-Brain-Barrier. Ann Rev Neurosci 1999;22:11-282. Soreq H, Kaufer D, Friedman A, Glick D. Blood Brain BarrierModulations and Low Level Exposure to Xenobiotics. In:S.M. Somani, J.A. Romano, eds., Chemical Warfare Agents:Low Level Toxicity. Boca Raton FL: CRC Press; 2000:121-1443. Roman-Goldstein S, Clunie DA, Stevens J, Hogan R, Monard J,Ramsey F, et al. Osmotic Blood Brain Barrier Disruption: CTand Radionuclide Imaging. AJNR Am J Neuroradiol1994;15:581-5804. Abbruscato TJ, Davis TP. Protein Expression of BrainEndothelial Cell E-Cadherin after Hypoxia/Aglycemia:Influence of Astrocyte Contact. Brain 1999;842:277-2865. Friedman A, Kaufer D, Shemer J, Hendler I, Soreq H, Tur KaspaI. Pyridostigmine Brain Penetration under Stress EnhancesNeuronal Excitability and Induces Early ImmediateTranscriptional Response. Nat Med 1996;2:1382-1385KEY WORDS: Blood-brain barrier, CT, acetylcholinesterasePoster 74Usefulness of Phase-Contrast Cine MR in the Evaluationof Posterior Cranial Fossa Arachnoid Cysts and MegaCisterns MagnaZhu, X. 1 · Shen, T. 2 · Chen, X. 21No.1 Affiliated Hospital of Suzhou University, Suzhou,CHINA, 2 Hushan Hospital of Fudan University, Shanghai,CHINAPURPOSEConventional MR imaging falls short of a definitive evaluationbetween posterior cranial fossa arachnoid cysts andmega cisterns magna which affects treatment planning. Ourpurpose was to evaluate the values of phase-contrast cineMR imaging in differentiating posterior cranial fossa arachnoidcysts from mega cisterns magna and detecting communicationbetween cysts and the neighboring CSF space.MATERIALS & METHODSPhase-contrast cine sequences were performed in 18 cases ofarachnoid cysts or mega cisterns magna patients. Findingswere evaluated using three standards according to the 16phase-contrast cine images. MR phase-contrast cine diagnoseswere compared to intraoperative findings and CT cisternography.RESULTSSix mega cisterns magna and 12 posterior cranial fossaarachnoid cysts were diagnosed. Seven arachnoid cysts communicatedto the neighboring CSF space were determinedfurther. Different manifestations were displayed on thephase-contrast cine images. Obviously reverse flow signalsduring the cardiac cycle were revealed in mega cisternsmagna patients, and “fake septum” signs also were revealedat the axial phase amplitude images because of the different332flow in the CSF space. Jet flow signal or cranny-like hypointensitywas displayed in 7 arachnoid cysts which suggestedcommunication between arachnoid cysts and neighboringCSF space through a small cranny. Irregular flow hyperintensitywas viewed in another 5 arachnoid cysts which suggestedno clear communication to the neighboring CSFspace. Diagnoses were verified by operation in 11 cases, byCT cisternography in 7 cases.CONCLUSIONPhase-contrast cine sequence has important values in differentiatingposterior cranial fossa arachnoid cysts from megacisterns magna. It also can disclose the CSF pulsation amplitudesof the arachnoid cysts and visualize the communicationbetween cysts and neighboring CSF space.KEY WORDS: Arachnoid cyst, MR imaging, phase contrastPoster 75Utility of 6 Vessel Cerebral Angiography in PrimaryDiagnosis of Blunt Cerebrovascular InjuryHoit, D. A. · Malek, A.Beth Israel Deaconess Medical Center, Harvard MedicalSchoolBoston, MAPURPOSECerebrovascular injury may be an under recognized entity inblunt, high energy trauma. Incidence of carotid injury in allblunt trauma has been reported to be less than 1%, and fewreliable estimates exist for incidence of vertebral arteryinjury. Additionally, few studies of vascular injury in blunttrauma have evaluated systematically the cerebral and cervicalvasculature via angiography.MATERIALS & METHODSA protocol was developed to angiographically evaluatepatients at high risk for blunt cerebrovascular injury. Thispopulation was defined as patients who sustained severeneck hyperextension or flexion, direct neck injury, cerebralhemorrhage of presumed carotid or vertebral origin, signs ofexternal cervical trauma, lateralizing neurologic defectinconsistent with hemorrhage or ischemia on CT scan, cervicalspine fracture, diffuse axonal injury, basilar skull fracture,or displaced midface fracture. To date, a total of 41patients have been identified by these criteria (12 female, 29male), and have been evaluated by 6 vessel cerebral angiography.The mechanism of blunt injury is vehicular trauma in37/41(92%), and blunt closed head injury in 4/41(9%). Allpatients were evaluated initially by cervical spine and headCT. Cervical spine fractures were identified in 22 patients.Fractures through the vertebral canal were found in 13 ofthese patients. Fourteen patients had significant skull basefractures involving the bony elements of the carotid canal.Vertebral artery injury including dissection and occlusionwas angiographically identified in 6/41(15%), and carotidartery injury including dissection, occlusion, pseudoaneurysmformation, and cavernous carotid fistula formationwas identified in 8/41(20%). Outcome data including theincidence of stroke, and need for anticoagulation were alsoexamined. Among patients with vertebral artery injury,stroke occurred in 1/6(16%) and 4/6(66%) had significant
injuries warranting anticoagulation. Among patients withcarotid injuries, 5/8(63%) had radiographic evidence ofstroke, and 5/8(63%) had significant injuries requiring anticoagulation.Chi-square analysis was used to examine therelationship between carotid and vertebral artery injury andother radiographic markers of blunt trauma including skullbase fracture, cervical transverse foraminal fracture, cervicalfacet joint fracture, multilevel cervical spine fractures, andcerebral hemorrhage.RESULTSA significant association between vertebral injury and cervicalfacet joint fracture was identified (p < .005). A subset ofthe patient population in this study received additional vascularimaging (CTA or MRA).CONCLUSIONSensitivity and specificity estimates for vascular injury bythese modalities when compared with cerebral angiographywill be provided. Cerebrovascular injury is associated with ahigh rate of morbidity. Among patients with high energymechanisms of blunt injury, cerebral angiography may bewarranted as a primary diagnostic imaging modality giventhe relatively high incidence of vascular injury in this population.KEY WORDS: Cerebral angiography, carotid injury, vertebraldissectionPoster 76Cerebrospinal Fluid Activated Caspase-3 and bcl-2:Evidence for Involvement in the Neurologic Outcome inHuman Traumatic Brain InjuryAmiridze, N. · Arabi, B. · Fiskum, G. · Darwish, R.University of MarylandMaryland, MDPURPOSECaspase-3, a marker of apoptotic cell death, is expressed inhuman and animal traumatic brain injury. Expression of bcl-2 promotes cell survival by opposing some stimuli known toinduce cell death. We tested the hypothesis that increasedcerebral spinal fluid (CSF), activated caspase-3, anddecreased levels of CSF bcl-2 are associated with poor neurologicoutcome.333using Elisa (R&D) systems. Neurologic follow-up was performedfor 1 month after the injury. Poor outcome wasdefined as GCS < 5 or death.RESULTSSix patients had poor outcome. Active caspase-3 is increasedin all patients with poor outcome (70.8-85.1 ng/ml). Thestandard range for caspase-3 is 0.3 to 20 ng/ml. Theincreased levels were detected more than 12 hours after TBI.bcl-2 was not increased in either group. The standard rangeof bcl-2 is 5.1 to 20 ng/ml. Initial CT findings had low predictivevalue for functional outcome.CONCLUSIONAn increased level of activated caspase-3 is associated withpoor neurologic outcome. Low levels of bcl-2 were detectedin both groups. Development of imaging modality to evaluateapoptotic brain injury in trauma patients could detectpatients with potential for poor neurologic outcome.REFERENCES1. Blankenbert FG, Katsikis PD, Tait JF, et al. Imaging ofApoptosis (Programmed Cell Death) with 99m Tc Annexin V. JNucl Med 1999; 40:184-1912. Stone JR, Okonkwo DO, Singleton RH, Mutlu LK, Helm GA,Povlishock JT. Caspase-3-Mediated Cleavage of AmyloidPrecursor Protein and Formation of Amyloid Beta Peptidein Traumatic Axonal Injury. J Neurotrauma 2002;19:601-6143. Ray SK, Dixon CE, Banik NL. Molecular Mechanisms in thePathogenesis of Traumatic Brain Injury. Histol Histopathol2002;17:1137-11524. Qiu J, Whalen MJ, Lowenstein P, et al. Upregulation of the FasReceptor Death-Inducing Signaling Complex afterTraumatic Brain Injury in Mice and Humans. J Neurosci2002;22:3504-35115. Knoblach SM, Nikolaeva M, Huang X, et al. Multiple CaspasesAre Activated after Traumatic Brain Injury: Evidence forInvolvement in Functional Outcome. J Neurotrauma2002;19:1155-11706. Leppo J. Imaging Cell Injury and Death. Curr Cardiol Rep2003;5:40-44KEY WORDS: Activated caspase-3, bcl-2, apoptosisThe authors of this work have indicated the following affiliations/disclosures:National Institutes of Health: GrantNS34152.PostersMATERIALS & METHODSTen adult patients with severe traumatic brain injury (TBI)(Glasgow Coma Scale (GCS) < 8) admitted to the Universityof Maryland Shock Trauma Center. All patients with closedhead injury and no evidence of hypoxic brain injury underwentclinical and radiographic evaluation and placement ofan intraventricular catheter for monitoring and managementof increased intracranial pressure. Cerebral spinal fluid wassampled at the time of insertion and at defined intervals of 6,12, 24, and 48 hours. The CSF samples were frozen in liquidnitrogen (-70). Controlled CSF samples were obtained fromhealthy patients ASA1 undergoing spinal anesthesia for electivesurgical procedures. Head CT was obtained at admission,and as clinically indicated. Cerebral spinal fluid levelsof bcl-2 were measured using Elisa, bcl-2 Elisa (OncogeneResearch Products). Activated caspase-3 was measuredPoster 77Extracranial Carotid Angioplasty and Stenting:Angiographic and Clinical OutcomeChen, H. J. · Jahan, R. · Duckwiler, G. · Kidwell, C. · Saver,J. · Starkman, S. · Vinuela, F.University of California Los AngelesLos Angeles, CAPURPOSETo assess angiographic and clinical out-come in high risk,NASCET ineligible, patients with extracranial carotidstenoses treated with angioplasty and/or stenting.
PostersMATERIALS & METHODSFrom September 1993 to October 2003, carotid arterial stentplacement and/or angioplasty were attempted in 78 patients(47 males and 31 females; average age 71 years, age range:36-91 years) in 88 stenotic extracranial carotid arteries. Allpatients were considered to be high risk and NASCET ineligible.Patients were placed under either general endotrachealanesthesia for the procedure unless contraindicated due tocardiopulmonary disease. Postprocedure, all patientsreceived antiplatelet therapy for 2 months including ticlidand aspirin or plavix and aspirin followed after 2 months byaspirin alone. Imaging follow-up consisted of CT angiography,MR angiography, carotid ultrasound, or conventionalangiography. Significant restenosis was considered to be70% or greater narrowing in the treated vessel. Repeat procedurewas undertaken in patients with significant restenosis.RESULTSThe average pretreatment stenosis was 86% (range: 50%-100%). Sixty-seven out of 78 (86%) patients presented to uswith significant neurologic symptoms (e.g., TIAs). Therewere two failed treatment attempts. They were both due tofailure to access the lesion. The average postoperative stenosiswas 8.7%. Procedural-related mortality was zero.Imaging (CTA, MRA, ultrasound, conventional angiography)and/or clinical follow-ups were obtained for 69 out ofthe 88 procedures with a mean follow-up time of 12 months.Imagine follow-up is available in 47 arteries. Significantstenoses (> = 70%) were seen in 13 out of these 47 cases(28%). Sixteen patients underwent repeat treatment(s) due torestenosis. Clinical follow-up information is available in 45cases. In most of these cases (34/45, 75.6%), patients experiencedminimal or no neurologic symptoms. In 8 cases(17.8%), patients experienced clinically significant symptoms(e.g., TIAs). Finally, the remaining 3 patients (6.7%)died of causes nonrelated to the procedure.CONCLUSIONAngioplasty and/or stenting are both safe and efficacious intreating extracranial carotid stenoses for high risk, NASCETineligible patients.KEY WORDS: Stenosis, angioplasty, stentingPoster 78Vertebral Venous System in Relation to Cerebral VenousDrainage on MR AngiographyBaik, S. · Shon, C. · Woo, S.Keimyung UniversityDaegu, REPUBLIC OF KOREAPURPOSEIn the supine position, cerebral venous drainage occurs primarilythrough the internal jugular veins, as seen on venousphase cerebral angiography. However, in the erect position,the vertebral venous system (VVS) represents the majoralternative pathway of cerebral venous drainage and that outflowthrough the internal jugular veins is absent or negligible.The purpose of this study is to evaluate the VVS andrelationship between the surrounding venous structures andit on MR angiography (MRA) in the supine position.334MATERIALS & METHODSWe retrospectively reviewed 65 patients (M:F = 31:34, meanage = 61.6 years) who underwent multiphase contrastenhancedcarotid MRA. Imaging studies were performedusing a 3.0 T MR unit (TR: 5.2, TE: 1.1, FA: 20, 3.8 thickness,EC: 1). We analyzed appearance and extent of the VVS(vertebral venous plexus and vertebral artery venous plexus)and the internal jugular vein on venous phase. We also evaluatedmain drainage pattern of cerebral venous drainage anddrainage pattern of the VVS. Visualized the VVS weredefined poor, vertebral venous plexus dominant, vertebralartery venous plexus dominant and mixed.RESULTSIn the VVS, the vertebral artery venous plexus was visualizedin 54 cases (54/65, 83%). The appearance of visualizedvertebral artery venous plexus was symmetrical in 39 cases(39/54, 72%) and asymmetrical in 15 case (15/54, 28%). Theextent of visualized vertebral artery venous plexus was partialin 26 cases (26/54, 48%) and complete in 28 case (28/54,52%). The vertebral venous plexus was visualized in 62cases (62/65, 95%). The appearance of visualized vertebralartery venous plexus was symmetrical in 43 cases (43/62,69%) and asymmetrical in 35 case (19/62, 31%). The extentof visualized vertebral artery venous plexus was partial in 35cases (35/62, 56%) and complete in 27 case (27/62, 44%).The appearance of visualized internal jugular vein wasasymmetrical in 44 cases (44/65, 68%) and symmetrical in21 cases (21/65, 32%). Of the 44 asymmetrical cases, 4 casesdemonstrated partial nonvisualization of the internal jugularvein. The 4 cases had well visualized the ipsilateral VVS.Main cerebral venous drainage occurred through the internaljugular vein in 62 cases (63/65, 97%) and the VVS in 3 cases(3/65, 3%). Drainage pattern of the VVS was poor in 14cases (14/65, 21%), vertebral venous plexus dominant in 11cases (11/65, 17%), vertebral artery venous plexus dominantin 18 cases (18/65, 28%) and mixed in 22 cases (22/65,34%).CONCLUSIONIn the supine position, the VVS was well visualized. TheVVS was an alternative collateral pathway of the internaljugular vein in cerebral venous drainage. The internal jugularvein and the VVS may vary inversely.KEY WORDS: MR, vein, blood, flowPoster 79Carotid MR Angiography with Three-DimensionalBalanced Turbo-Field Echo Technique: Comparison withThree-Dimensional Time-of-Flight TechniqueKitajima, M. 1,2 · Arisako, T. 2 · Nagaoka, R. 2 · Hirai, T. 1 ·Korogi, Y. 3 · Yamashita, Y. 11Kumamoto University School of Medicine, Kumamoto,JAPAN, 2 National Kumamoto Hospital, Kumamoto, JAPAN,3University of Occupational and Environmental Health,School of Medicine, Kitakyushu, JAPANPURPOSEThree-dimensional balanced turbo-ield echo (b-TFE) technique,one of the steady-state free precession imaging, canacquire vascular imaging in shorter time than conventional
gradient-echo acquisition. The purpose of this study was toevaluate feasibility of the b-TFE technique for cervicalcarotid MR angiography (MRA) in comparison with thethree-dimensional (3D) time-of-flight (TOF) MRA.MATERIALS & METHODSAs the first step, five normal volunteers (10 carotid arteries;4 men and 1 woman; age 21-55 years; mean, 39.2 years)underwent both carotid MRA with b-TFE (4.7/2.3/100;TR/TE/FA) and carotid ultrasonography. Carotid diametermeasured was compared between MRA and ultrasonography.Second, 13 patients (26 carotid arteries, 5 men, 8women, age 22-83 years, mean, 59.6 years, 2 acute strokepatients, 11 nonstroke patients) underwent both 3D TOF(23/3.1/22) and 3D b-TFE MRA (4.5/2.3/100). In both techniques,parallel imaging was applied (SENSE factor = 1.2).The image acquisition time was 1 min 54 sec for b-TFE and3 min 55 sec for TOF. Spatial resolution was 1.25 x 1.25 x1.5 mm in b-TFE and 0.59 x 1.02 x 1.5 mm in TOF. BothMR imaging were compared using the following evaluations:;1) visualization of carotid bifurcation, commoncarotid artery, internal carotid artery, external carotid arteryand their branches, 2) signal loss at the carotid bifurcation,3) artifact other than flow related artifact. In two stenoticlesions, delineation of stenosis also was compared.RESULTSThe diameters of common carotid and internal carotid arteriesmeasured were well correlated between b-TFE and ultrasonography.Delineation of each carotid artery was equal inboth imaging technique. In three younger patients, the TOFtechnique showed more prominent signal loss at the carotidbifurcation than for b-TFE. Visualization of branches wasbetter in b-TFE. In two stenotic lesions, degree of stenosiswas visualized equally for both techniques. Some veins adjacentto the carotid arteries were visualized in b-TFE.335thrombosed aneurysms. The purpose of this study is to determinethe value of BPAS MR imaging for the brain screeningMR examination.MATERIALS & METHODSBasi-parallel anatomical scanning MR imaging means heavilyT2-weighted thick coronal scanning with gray-scalereversal in postprocessing (Figure). We performed BPASMR imaging in a 20 mm thick coronal section parallel to theclivus using fast spin-echo sequence (TR/TE/excitations:6000/250/2, FOV: 19 x 19 cm, matrix: 384 x 224) on a 1.0 Tscanner (GE, SIGNA Horizon LX). Both BPAS MR imagingand 3D TOF MRA obtained in 385 consecutive patients for6 months. Comparing BPAS MR imaging with MRA, wedetermined the role and value of displaying vascular outercontour.RESULTSUnilateral vertebral artery (VA) was not shown on MRA in56/385 patients (14.5%). Basi-parallel anatomical scanningMR imaging confirmed hypoplastic unilateral VA in 30/56patients (54%). Basi-parallel anatomical imaging MR imagingalso revealed the occlusion of the unilateral VA of normaldiameter in 26/56 patients (46%). Ten aneurysms of vertebrobasilarsystem were detected on MRA and/or BPAS-MR imaging. The shape of aneurysm depicted on MRA wasdifferent from its outer contour shown on BPAS-MR imagingin 8/10 aneurysms.PostersCONCLUSIONThree-dimensional b-TFE MRA can provide carotid imagingof equal quality to 3D TOF MRA in significantly shorterimaging time. Further investigation in patients with variousdegrees of carotid stenosis will be needed.KEY WORDS: Carotid MRAPoster 80Surface Appearance of the Vessel vs MR Angiography:Basi-Parallel Anatomical Scanning MR Imaging for theAccurate Evaluation of the Intracranial VertebrobasilarArteryNagahata, M. 1 · Ono, S. 2 · Abe, Y. 21Kuroishi City Hospital, Aomori, JAPAN, 2HirosakiUniversity School of Medicine, Aomori, JAPANPURPOSEBasi-parallel anatomical scanning (BPAS) MR imaging is asimple MR technique that we designed for visualization ofthe surface appearance of vertebrobasilar artery within thecistern (1). Basi-parallel anatomical scanning MR imagingcan clearly show the outer contour of occluded arteries or
PostersCONCLUSIONBasi-parallel anatomical scanning MR imaging was necessaryfor the accurate diagnosis in 16% of our series. Weshould evaluate not only MRA but also the vascular outercontour of the vertebrobasilar artery because we can easilyobtain its outer appearance by BPAS- MR imaging.REFERENCES1. Nagahata M, Hosoya T, Adachi M, Kondo R, Manabe H,Hasegawa S. Basi-Parallel Anatomical Scanning (BPAS)MRI: A Simple MRI Technique for Demonstrating theSurface Appearance of the Intracranial VertebrobasilarArtery. Nippon Acta Radiologica 2003;63(9):582-584(inJapanese)KEY WORDS: MR imaging, vertebrobasilar system336implantable cardiac defibrillator placement, diabetes, andchronic renal insufficiency developed acute onset of expressiveaphasia without other symptoms. The patient had a historyof a “carotid plaque” and concerns were raised about thepossible need for urgent carotid endarterectomy. Iodinatedcontrast was contraindicated because of chronic renal insufficiencywith a history of prior exacerbation after use ofiodine contrast. A gadolinium-enhanced CTA of the cervicalvessels revealed only mild stenosis of the left carotid bifurcationwith scattered atherosclerotic calcification and ahypodense plaque. In all three cases subjective image quality,although inferior to that of conventional CTA, was considereddiagnostically adequate. Contrast density within thecervical and intracranial arteries was between 94 and 150Hounsfield units, which is one third to one half of the typicalvalues for iodinated contrast CTA.Poster 81Gadolinium Contrast CT Angiography of the Circle ofWillis and NeckHenson, J. W. · Nogueira, R. G. · Covarrubias, D. J. ·Gonzalez, R. G. · Lev, M. H.Massachusetts General HospitalBoston, MAPURPOSECT angiography (CTA) of the cervical and intracranial vesselsis a rapid, noninvasive, and relatively inexpensive techniquefor the evaluation of vascular abnormalities. However,contraindications to the use of contrast can preclude use ofiodinated agents for CTA. We report the use of gadoliniumas contrast agent for CTA of the head and neck in threepatients with contraindications to iodinated contrast.MATERIALS & METHODSCTA imaging was acquired on a 16-detector multislice helicalscanner using a 25 second delay after contrast administration,140 kVp, 170 mA, 0.8 second rotation time, 1.25 mmslice thickness reconstructed at 0.6 mm intervals, 3.75mm/rotation table speed, pitch 0.75:1, and soft tissue algorithmreconstruction. Instead of iodinated contrast material,a power infusion of 60 ml of gadopentetate was followed bya 20 ml normal saline chase, both injected at 4 ml/s throughan 18-gauge cannula placed into an antecubital vein.RESULTSA 63-year-old man entered the emergency department with30 minutes of the severe right retro-orbital headache and aquestion of unruptured aneurysm. The patient had a permanentcardiac pacemaker and a history of anaphylaxis followingthe administration of iodinated CT contrast. CTA imagesdemonstrated no evidence of an intracranial aneurysm. A 52-year-old woman with severe complications from diabetes,including renal failure treated with renal transplant, had anMRA which suggested carotid dissections. Iodinated contrastwas contraindicated because of moderate chronic renalinsufficiency in setting a renal transplant. A gadoliniumenhancedCTA of the cervical vessels and circle of Willissuggested complete occlusion of the left internal carotidartery and severe stenosis of the right internal carotid arterywith tapered narrowing indicating the presence of carotiddissections (Figure). A 71-year-old man with an automaticCONCLUSIONGadolinium-enhanced CTA for vessels of the head and neckis technically feasible and is valuable in patients with contraindicationsto use of iodinated contrast.KEY WORDS: CTA, gadolinium, contrastPoster 82Hypertensive Encephalopathy: An Investigation into theRole of Endothelial DysfunctionGorniak, R. J. T. · Schwartz, R. B.Brigham and Women’s HospitalBoston, MAPURPOSETo use von Willebrand’s antigen (vWAg), a specific markerof endothelial damage, to determine whether damage or dysfunctionof the vascular endothelium plays a role in thedevelopment of hypertensive encephalopathy (HTE).MATERIALS & METHODSOver a five-year period, we studied sixty-eight patients withacute hypertension who developed clinical signs suggestiveof HTE (severe headache, seizures and/or visual changes)
and in whom von Willebrand’s antigen (vWAg) was measured.Fifty patients had MR findings of edema in the occipitallobes (HTE) and eighteen had normal scans (hypertensivenon-HTE). The level of vWAg was measured in each patientwithin 24 hours of the neurologic event. For each patient, themean arterial blood pressure at the time of the neurologicalevent [MAP (event)] was recorded, as was baseline bloodpressure at a time remote from the neurologic event [MAP(bl)]. The difference [MAP (diff)] was calculated. The meanage, vWAg level, MAP (event), MAP (bl), and MAP (diff)was compared between the two groups using the Student’s t-test. P values less than 0.05 were considered statistically significant.In addition, the vWAg values from each patientgroup were submitted to correlational analysis with the MAP(event) and MAP (diff) using the Pearson’s product momentcorrelation statistic.RESULTSThere was no significant difference between the mean agesof the two groups (HTE: 48 + 16 years, non-HTE: 43 + 17years) or the baseline MAPs( HTE: 93 + 11 mm Hg, non-HTE: 90 + 15 mm Hg). The average vWAg levels in thegroup of patients who developed HTE was 258 + 82 U vs203 + 78 U in the hypertensive non-HTE group. This differencewas significant (p = 0.018). There was no significantdifference in the average MAP (event) of the patients whodeveloped HTE (138 + 21 mm Hg) and in those who did notdevelop HTE (127 + 19 mm Hg). The average MAP (diff)was 44 + 17 mm Hg in the HTE group vs 37 + 16 mm Hg inthe hypertensive non-HTE group. This difference was notstatistically significant. There was no correlation betweenvWAg and MAP (event) or MAP (diff) in either group.337Poster 83Detection and Characterization of Anterior CerebralArtery Aneurysms by Using 2D and 3D Helical CTAngiography in Emergent Aneurysm ClippingChen, C.Taipei Medical UniversityTaipei, TAIWAN REPUBLIC OF CHINAPURPOSECerebral subarachnoid hemorrhage may result from ruptureof saccular aneurysms in the anterior cerebral artery (exclusionof anterior communicating artery). The purpose of thisstudy was to evaluate the usefulness of helical CT angiography(CTA) in detection and characterization of intracranialaneurysms at such an uncommon location.MATERIALS & METHODSBetween 1998 and 2003, fifty consecutive patients who hadundergone emergent aneurysm clipping for intracranialaneurysms were reviewed. Nineteen patients of the fifty withaneurysms occurred in the anterior cerebral artery. Afterexclusion of those patients with typical anterior communicatingartery aneursyms, there were nine aneurysms withuncommon location recruited in this study. Plain CT andCTA in all of the nine aneurysms and digital subtractionangiograms (DSA) in four of nine aneurysms were reviewedblindly by two radiologists. Interpretation includedaneurysm detection, quantification, and characterizationusing 2D multiplanar reformatted and 3D volume-renderingtechniques.PostersCONCLUSIONOur results suggest that acute hypertension by itself may notbe sufficient to produce HTE; endothelial damage also likelyplays a role in the development of the syndrome. It is notclear whether endothelial damage is a primary cause of HTEor is a consequence of the systemic hypertension that isresponsible for HTE. However, the absence of correlationbetween levels of vWAg and MAP (event) suggests thatendothelial dysfunction may be a distinct factor, separatefrom systemic hypertension, in the development of HTE.KEY WORDS: Hypertensive encephalopathy, vonWillebrand’s antigenRESULTSAll nine aneurysms were detected preoperatively by CTAand all were confirmed at surgery and/or angiography. Therewere two small aneurysms from A1 segment, one from A2segment, two at the junction of triplicated anterior cerebralarteries, two at the junction of A2-3 segment, one at the junctionof A2-3 segment of azygos ACA, one from the distalbranch of ACA. The average maximal aneurysm sac diameterwas 4.39 mm (range, 2.7-7.0 mm). The average aneurysmneck size was 2.52 mm (range, 1.2-3.5 mm). The smallestaneurysm was located in the A1 segment of left anteriorcerebral artery and measured 2.2 x 1.8 x 2.7 mm, with a neckmesured 1.2 mm. On plain CT, four of nine had intracranialhematoma, eight of nine had intraventricular hemorrhageand three of nine had acute hydrocephalus.
PostersCONCLUSIONThe anuerysms of anterior cerebral arteries are usuallysmaller and associated with complex vascular structureswhich wrapped around the aneurysms. The sensitivity ofCTA for the detection and characterization of ACA aneurysmin uncommon location is at least equal to DSA, with betterdemonstration of the body and neck of an aneurysm andadjacent complex vascular anatomy. In an emergent situation,such as deteriorating patients with an intracranialhematoma or acute hydrocephalus, noninvasive CTA canoffer a useful diagnostic modality.REFERENCES1. Villablanca JP, Jahan R, Hooshi P, et al. Detection andCharacterization of Very Small Cerebral Aneurysms byUsing 2D and 3D Helical CT Angiography. AJNR Am JNeuroradiol 2002;23:1187-11982. Suzuki M, Onuma T, Sakurai Y, et al. Aneurysms Arising fromthe Proximal (A1) Segment of the Anterior Cerebral Artery.J Neurosurg 1992;76:455-4583. Inci S, Erbengi A, Ozgen T. Aneurysms of the Distal AnteriorCerebral Artery: Report of 14 Cases and a Review of theLiterature. Surg Neurol 1998;50:130-140KEY WORDS: Aneurysm, anterior cerebral artery, CT angiography338the perilesional low density area. An additional ROI mirroredthe region including the clot and perihematomal lowdensity area was placed in the contralateral hemisphere.Cerebral blood flow, CBV, and MTT values were expressedin ml/100 g/min, ml/100 g and seconds, respectively.Statistical analysis was performed by Mann-Whitney U test.RESULTSRegional cerebral blood flow and rCBV mean levels werelower in hemorrhagic core than in perihematomal low densityarea (p < 0.001), in perihematomal low density area thanin normal appearing area (p < 0.001), and in both hemorrhagiccore and perihematomal area than in contralateralROI (p < 0.001). Regional cerebral blood flow and rCBVmean levels were similar in normal-appearing and contralateralareas. Regional mean transit time mean values werehigher in perihematomal low density area than in normalappearing area (p < 0.01) and in both hemorrhagic and perihematomalarea than in contralateral ROI (p < 0.001). Therewas no differences for rMTT mean values between hemorrhagiccore and perihematomal area, as well as between normal-appearingand contralateral areas (Table).Regions of Interest (ROI)CT Perfusion Maps Core Perihematomal Normal ContralateralArea Appearing AreaCBF (ml/100g/min) 10.909±7.034 35.661±16.262 72.485±54.357 71.025±35.663CBV (ml/100g) 0.868±0.465 2.299±0.955 3.837±2.433 3.777±1.699MTT (sec) 5.861±2.191 5.506±1.520 4.501±1.307 4.169±0.997Poster 84Acute Hematomal and Perihematomal Cerebral BloodFlow Changes as Measured by CT PerfusionFainardi, E. 1 · Borrelli, M. 1 · Saletti, A. 1 · Ceruti, S. 1 ·Schivalocchi, R. 1 · Russo, M. 1 · Azzini, C. 1 · Tamarozzi, R. 1· Chieregato, A. 21Arcispedale S. Anna, Ferrara, ITALY, 2 Ospedale M.Bufalini, Cesena, ITALYPURPOSEIn this study we sought to quantify cerebral blood flow(CBF) changes within and around acute spontaneous intracerebralhemorrhage (SICH) by using deconvolution-derivedCT perfusion hemodynamic imaging.MATERIALS & METHODSThe perfusion studies were performed by using a single-sectionCT scanner (CT Hispeed ZX/i; General Electric MedicalSystems, Milwaukee, WI) equipped for CT perfusion imaging(CT Perfusion; General Electric Medical Systems,Milwaukee, WI) in 40 patients (19 male and 21 female;mean age = 69.07 ± 10.17 years) with supratentorial acuteSICH at admission CT and having a Glasgow Coma Scale atentry ranging from 12 to 15. All CT perfusion scans wereobtained within 24 hours after symptom onset and analyzedwith a deconvolution-based algorithm by using an imagingworkstation (Advantage Windows; General Electric MedicalSystems, Milwaukee, WI). Cerebral blood flow, cerebralblood volume (CBV), and mean transit time (MTT) perfusionalmaps were generated for each patient. Regional CBF(rCBF), CBV (rCBV), and MTT (rMTT) levels were measuredin three different regions of interest (ROI) larger than 1cm2 and manually outlined on the baseline diagnostic CTscan: 1) hemorrhagic core; 2) perihematomal low densityarea; 3) 1 cm of normal appearing brain tissue surroundingCONCLUSIONOur findings suggest that dynamic CT perfusion scanningwith deconvolution analysis is a promising method for theevaluation of perfusional disturbances associated to acuteSICH and indicate that perfusional parameters are distributedconcentrically and gradually improve from the core tothe periphery. We found perfusional ischemic values in hemorrhagiccore, whereas perihematomal area showed hypoperfusionallevels reflecting edema formation, but notischemic penumbra. In addition, hyperperfusional levelswere observed in normal-appearing brain tissue located bothipsilaterally and contralaterally to hematoma.KEY WORDS: Acute hematoma, cerebral blood flow, CT perfusionPoster 85Comparing CT Angiography and Digital SubtractionAngiography in the Detection of Intracranial AneurysmsHeimberger, K. · Gentzsch, S. · Gruber, A. · Knosp, E.Vienna University ClinicsVienna, AUSTRIAPURPOSECT and intracranial aneurysm digital subtraction angiographic(IADSA) examinations were compared for sensitivityand specificity of detection of intracranial aneurysms inacute subarachnoid hemorrhage, and to determine whetherCT angiography could be the sole sufficient method replacingIADSA.
MATERIALS & METHODSSixty-eight patients with acute subarachnoid hemorrhagewere angiographically examined with a multislice CT scanner(data acquisition: 4-row adaptive array detector; datareconstruction: axial thin slice reconstruction, multidirectionalmaximum intensity projections (MIPs), shaded surfacedisplay) and a consecutive IADSA before initiating atherapeutic decision towards endovascular or operative treatmentof intracranial aneurysms. Sac/neck ratios were calculatedfrom CT MIPs in all aneurysm-bearing patients.RESULTSSensitivity of CT angiography was 96.8% with 63aneurysms in 56 patients. Specificity was 100% in 12patients without aneurysms (six of these patients sufferedfrom prepontine hemorrhages). True 3-dimensional expansionof the aneurysms was detected by either method(isotropic CT imaging and multiplanar IADSA projections).Two questionable sac/neck CT analyses turned out to belarge necks in IADSA.CONCLUSIONIn case of correlation of bleeding site and aneurysm localization,the high sensitivity of multislice CT angiographycan detect sufficiently the presence of wide-neckedaneurysms preoperatively in patients with acute subarachnoidhemorrhage. In cases of noncorrelation, the additionaluse of IADSA may reveal the true origin of hemorrhage. Incases of questionable sac/neck ratios in MIPs (selective)IADSA is necessary to increase architectural information fordecision on the appropriate therapeutic modality. Threedimensionalconfiguration of aneurysms and their operativeapproaches are very well imaged in CT-shaded surface displayreconstruction. The lack of imaging preinfarctvasospasm in subarachnoid hemorrhage is an unresolvedproblem in CT angiography without the use of CT perfusiontechnique. Although attempts to optimize diagnosis ofaneurysmatic disease, by using multislice techniques, haveresulted in improvement of detection and imaging, so far, CTangiography can not replace IADSA completely.KEY WORDS: CT angiography, aneurysmPoster 86Cyclosporin A/FK-506 Neurotoxicity, Preeclampsia/Eclampsia and PRES Syndrome: Different Names butSimilar Systemic PathophysiologyBartynski, W. S. 1 · Lister, J. 21University of Pittsburgh, Presbyterian University Hospital,Pittsburgh, PA, 2 The Western Pennsylvania Hospital,Pittsburgh, PAPURPOSENeurotoxicity in preeclampsia/eclampsia or after the administrationof the immune suppression drugs Cyclosporin A(CsA) and FK-506 are evaluated frequently together becauseof a similar brain imaging appearance and presence of hypertension.This is often labeled the posterior reversibleencephalopathy syndrome (PRES) syndrome. There aremany systemic biological parallels between these conditionssuggesting a more generic underlying pathophysiology leadsto the imaging features. These drugs are used to control339transplant rejection or graft vs host disease and in manyways, the fetal-placental unit could be viewed as a partiallymatched transplant. The purpose of this study is to reviewthe underlying biology of CsA/FK-506 toxicity andpreeclampsia/eclampsia to better characterize their systemicsimilarities and differences.MATERIALS & METHODSThe relevant literature related to CsA/FK-506 toxicity,preeclampsia/eclampsia and the PRES syndrome werereviewed and clinical/biological similarities and differenceswere noted.RESULTSEvidence of endothelial cell injury is present in both groupswith release of endothelial cell surface molecules or subendothelialcell matrix components (thrombomodulin,fibronectin) and evidence of microvascular red blood celldamage (shistocytes, hemolysis with LDH release). Renalglomerular, tubular and vascular injury develops withglomerular endothelial swelling (capillary endotheliosis),proteinuria and reno-vascular spasm with renal hypo-perfusion.Endothelial cell activation occurs due to release ofcytokines (tumor necrosis factor, interleukin 1, interferongamma) with resultant up-regulation of vasoactive substances(endothelin) as well as cell surface proteins and the developmentof endothelial leakage. Cell surface marker up-regulationleads to inflammatory cell adherence and furtherendothelial injury along with altered endothelial cell permeability.Proteinuria in combination with altered endothelialcell permeability leads to systemic edema. The coagulationsystem is activated with resultant platelet consumption andthrombocytopenia in both groups. Altered platelet adherencewith release of vasoactive agents along with up-regulation ofendothelin likely leads to marked alteration in systemic vasculartone and resistance. The resultant vascular instabilitywith resultant variable expression of hypertension,vasospasm, sympathetic vascular reactivity and alteredresponse to vasopressor agents is the likely common outcomein both groups. Immune system alteration occurs in patientswith transplantation and preeclempsia/eclampsia and is representedwidely in the patients who develop the otherwiselabeled PRES syndrome (lupus, scleroderma, Wegener’s).The effects of transplantation (marrow or solid organ) lead toa complex immune response with attempted transplant orhost rejection. Endothelial cell antibodies are common insolid organ rejection and are elevated in preeclampsia. Withthe development of severe toxicity, a similar pattern of systemiceffects are seen in both groups with the development ofthe HELLP syndrome (hemolysis, elevated liver enzymes,low platelets) in patients with preeclampsia/eclampsia andthe development veno-oclusive disease of the liver, bonemarrow transplant thrombotic microangiopathy and endothelialleakage syndrome (all potentially related to graft vs hostdisease) in patients with allogeneic marrow transplantation.CONCLUSIONThe underlying systemic biological and physiologic processesoccurring in patients with CsA/FK-506 toxicity,preeclampsia/eclampsia and PRES syndrome are similar.These systemic processes likely contribute to the developmentof neurotoxicity and the imaging appearance we ultimatelyobserve.KEY WORDS: Cyclosporin A neurotoxicity, eclampsia, PRESPosters
340Poster 87Poster 88Three-Dimensional Subtraction Venography of the Brain Corpus Callosum Hematoma Due to Isolated Inferiorwith a Volumetric Interpolated SequenceSagittal Sinus ThrombosisPostersMermuys, K. P. · Vanhoenacker, P. K. · Chappel, P. · VanHoe, L.Onze Lieve Vrouw HospitalAalst, BELGIUMPURPOSEThree-dimensional (3D) gradient-echo MR sequences can beoptimized for rapid acquisition through asymmetric k-spacesampling and interpolation. A T1-weighted volumetric interpolatedbrain examination (VIBE) sequence was comparedwith a magnetization-prepared rapid acquisition gradientecho(MP-RAGE) sequence for subtraction venography ofthe cerebral venous structures.MATERIALS & METHODSTwenty-eight patients were examined with MP-RAGE(acquisition time 6.06 min) and VIBE (acquisition time 1.24min) subtraction venography. Pre and postgadolinium subtractedsource images and MIP images were used for analysis.Signal-to-noise ratio (SNR) in the superior sagittal sinus(SSS) and greater cerebral vein (GCV), and CNR for SSSand GCV vs white (WM) and gray matter (GM) were compared.Image quality of multiple venous structures wasscored on a 1-4 scale and compared for the two techniques.The number of visualized cortical veins also was compared.RESULTSOn the source images, SNRs for SSS and GCV, and CNRs(contrast-to-noise ratio) for veins/GM and veins/WM weresignificantly lower for the VIBE sequence (p < 0.05).Qualitatively, there was no statistically significant differencefor the subjective visualization scores assigned to each technique(p < 0.05). There was no statistically significant differencefor the number of visualized cortical veins (p
patients with acute neurologic symptoms such as loss ofconscious, seizures must be considered for isolated inferiorsagittal sinus thrombosis.KEY WORDS: Cerebral venous sinus thrombosis, corpus callosumhematoma, hemorrhagic infarctPoster 89MR Angiography Image-Guidance for the MicrosurgicalClipping of Intracranial AneurysmsPirotte, B. · David, P. · Neugroschl, C. · Metens, T. · Wikler,D. · Lefranc, F. · Brotchi, J. · Levivier, M. · Balériaux, D. L.F.Hôpital Erasme, Universite Libre de BruxellesBrussels, BELGIUM341CONCLUSIONIntegration of MRA in the planning and neuronavigationprocedure for IA is accurate. It may be applicable routinelyand gain popularity, since these images may be handled easily,independently from the navigation equipment. Moreover,it may minimize the morbidity related to the surgicalapproach. This technique may be especially helpful forselected aneurysms located distally (MCA or pericallosalbifurcations) or very distally (being mycotic by nature andoften very difficult to find despite precise localization bypreoperative imaging) from the basal cisterns. Additionally,these aneurysmal locations are those for which the optimalchoice between surgery and embolization is often difficult.The benefit for the patients with IA should be evaluated interms of reduction of postoperative neurologic morbidity.KEY WORDS: Aneurysm, MRA, brainPostersPURPOSETo describe the method and the potential interest of integratingMR angiography (MRA) in neuronavigation proceduresfor microsurgery of intracranial aneurysms (IA).MATERIALS & METHODSMRA was combined with standard MR image acquisition inthe image-guided planning for the microsurgical clipping ofa saccular aneurysm in 2 patients (one 3 mm large middlecerebral artery and one 8 mm large pericallosal arteryaneurysm, diagnosed by catheter angiography in bothpatients) using two different neurosurgical navigation systems(Zeiss MKM microscope, Carl Zeiss, Oberkochen,Germany and StealthStation Treon, Medtronic SurgicalNavigations Technology, Louisville, CO). Conventional 3D-T1-weighted MR imaging (TR/TE: 5.9/1.6 msec; flip angle35°; FOV: 300 mm; matrix: 228 x 512; 122 slices; thickness:1.8 mm reconstructed with an overlap of 0.9 mm betweenslices) with gadolinium (2.5 ml/sec), and MRA pulsesequences consisting in axial 3D magnetization transfer(MT)-tilted optimized nonsaturating excitation (TONE)(TR/TE: 31/3.4 msec; flip angle 28°; FOV: 300 mm; matrix:261 x 512; 96 slices; thickness: 1.6 mm reconstructed withan overlap of 0.8 mm between slices) were acquired inframeless stereotactic conditions the day before surgery on a1.5 T magnet (Gyroscan, Intera, Philips Medical Systems,Best, The Netherlands) using skin-based markers. Bothimages were coregistered thereafter, allowing the definitiona minimally invasive straight trajectory to the aneurysmneck.RESULTSMRA-guided neurosurgery allowed to: 1) direct theapproach to the aneurysms at their distal location, 2) to calculatea high spatial accuracy between the target defined andits actual location, 3) reduce the invasiveness of the subarachnoidapproach by avoiding unnecessary, proximal todistal, or distal to proximal, dissection/exposure of the maintrunks and collateral vessels (lenticulo-striate and callosomarginalbranches), 4) tailor the bone opening by optimizingthe contours/size of the craniotomy, 5) avoid unnecessarydrilling on the midline or opening on parasagittal veins, 6)reduce the duration, strength, and extension of brain retraction.The aneurysms were eradicated successfully withoutcomplication.Poster 90Multislice CT Angiography in Detection of CerebralAneurysmsTeksam, M. 1,2 · McKinney, A. 1 · Casey, S. O. 1 · Asis, M. 1 ·Kieffer, S. 1 · Truwit, C. L. 11University of Minnesota, Minneapolis, MN, 2 BaskentUniversity Medical School, Ankara, TURKEYPURPOSEMultislice CT (MSCT) has great potential for use in vascularstudies. Our purpose was to determine the accuracy ofMSCT angiography in detecting cerebral aneurysms comparedto digital subtraction angiography (DSA) or surgery.MATERIALS & METHODSOne hundred consecutive patients who underwent MSCTAand DSA or surgery were included in the study. MSCTA andDSA results were evaluated independently by different neuroradiologistswho performed aneurysm detection, quantitation,and characterization using 2D multiplanar reconstructions,3D maximum intensity projection, and volume-renderedtechniques.RESULTSAt intraarterial DSA or surgery 113 aneurysms (True + andFalse -) were detected in 83 out of the 100 patients. A totalof 106 aneurysms (True +) were confirmed on DSA/surgery.The sensitivity of detecting aneurysms < 4 mm, 4-10 mm,and >10 mm on a per-aneurysm basis was 0.84 (95 % CI:0.72, 0.92), 0.97 (95%CI: 0.91, 0.99), and 1.00 (95%CI:0.88,1.00), respectively. There was moderate agreementbetween MSCTA and DSA/surgery for aneurysms < 4 mm(k = 0.59), excellent agreement for aneurysms between 4-10mm (k = 0.81) and for aneurysms larger than 10 mm (k =1.00). The sensitivity, specificity, and accuracy of MSCTAfor detecting aneurysms on a per-patient basis were 0.99(95% CI:0.96, 1.00), 0.88 (95% CI:0.96,0.99), and 0.98(95% CI:0.95,1.00), respectively (Table 1).
PostersTABLE 1: Accuracy of MSCT Angiography on a Per-Aneurysm BasisSize (mm) Sensitivity Specificity PPV NPV Accuracy k Statistics10 1.00 (22/22) 1.00 (15/15) 1.00 1.00 1.00 1.00(0.88,1.00) 0.83, 1.00 0.88, 0.83, 0.84,1.00 1.00 1.00Note.- The numbers in parentheses are the numbers of aneurysms, and the numbersunderlined are 95 % Confidence Intervals.CONCLUSIONMSCTA has a high sensitivity in detecting aneurysms thatwere confirmed by DSA and/or surgery (used as our goldstandards). However, our study suggests that MSCTA maybe less sensitive than DSA in detecting < 4 mm sizeaneurysms.KEY WORDS: Multislice CT, CT angiography, cerebralaneurysm342RESULTSSecond DSA revealed nonopacification of AVM nidus andslow flow in feeding arteries. Gradient-echo and T1-weightedimages demonstrated the thrombosis in draining vein. Thepatient is neurologically intact and at 6-months follow-uphas no recurrence of seizure on antiepileptic drugs.CONCLUSIONSpontaneous regression or thrombosis of cerebral AVM is apoorly understood phenomenon. The venous thrombosismay be an important factor in spontaneous obliteration ofcerebral AVM, which is beautifully demonstrated in the presentcase.KEY WORDS: Arteriovenous malformation, thrombosis,spontaneous regressionPoster 92Perfusion Abnormalities in “Benign” DevelopmentalVenous Anomalies: Are They Really Benign?Poster 91Angiographic and MR Imaging Demonstration ofSpontaneous Regression of Cerebral ArteriovenousMalformation Due to Thrombosis of Draining VeinSawlani, V. 1 · Powell, N. 1 · Phadke, R. 21Morriston Hospital, Swansea, UNITED KINGDOM,2Sanjay Gandhi Postgraduate Institute of Medical Sciences,Lucknow, INDIAPURPOSESpontaneous regression of cerebral arteriovenous malformation(AVM) is rare and poorly understood phenomenon. Wepresent a case of complete spontaneous occlusion of theAVM associated with thrombosis of the draining corticalvein, demonstrated on MR imaging and digital subtractionangiography (DSA).MATERIALS & METHODSA 44-year-old male patient presented with history of twofocal seizures 2 months apart involving left leg. Cranial CTshowed an ill-defined hyperdense lesion with a few specksof calcification in the right occipital region. Digital subtractionangiography revealed pial AVM in right parieto-occipitallobe with nidus size of 2 cm with multiple feeders fromright middle cerebral artery (MCA) and posterior cerebralartery (PCA) (Spetzler grade II). The MCA feeders were tortuousand curving around the convexity to supply the AVMnidus situated in parieto occipital sulcus. The feeding vesselsshowed dysplastic changes and uneven caliber. A dilated tortuouscortical vein along the parieto-occipital sulcus into thesuperior sagittal sinus drained the AVM. The patient was puton antiepileptic drugs and was planned for electiveembolization at a later date. Three months later preembolizationangiogram showed nonfilling of the AVM nidusand draining veins. Contrast was seen in arterial feeders incapillary and early venous phase suggestive of marked slowingof blood flow. MR imaging done on the same day,showed thrombosis of the cortical vein in parieto-occipitalsulcus.Mikulis, D. J. 1,2 · Martinovic, E. 1,2 · Kassner, A. 3,2 · Farb, R. 1,2· Willinsky, R. 1,2 · terBrugge, K. 1,21The Toronto Western Hospital, Toronto, ON, CANADA,2The University of Toronto, Toronto, ON, CANADA,3University Health Network, Toronto, ON, CANADAPURPOSEDevelopmental venous anomalies (DVAs) are consideredbenign variants of cerebral venous drainage. We report incidentalperfusion abnormalities due to underlying DVAs inthree patients undergoing MR imaging workup for symptomsof acute cerebral ischemia.MATERIALS & METHODSDynamic susceptibility perfusion MR imaging was performedas part of an acute stroke imaging protocol consistingof rapid T2*-weighted gradient-echo echo-planar imagingduring bolus injection of gadolinium-DTPA. Data wastransferred to a GE Advantage Windows workstation (softwareversion 4.1) and processed using Functool 2. The followingparametric maps were obtained: “negative enhancementintegral” (NEI), which is a measure of relative cerebralblood volume, “mean time to enhance” (MTE), which is ameasure of the bolus transit time, and “time to minimum”(TTM), which is a measure of the mid-bolus arrival time.Underlying DVAs were identified in three consecutive casesof focal perfusion abnormalities found in the nonsymptomatichemisphere. Region of interest analysis of perfusionparameters in the tissue around the DVAs and tissue aroundnormal cortical veins was performed to determine the extentof the perfusion changes. Results were expressed as a percentageincrease over the normal tissue. Statistical significancewas tested using an unpaired Student’s t-test. Long TEgradient-echo images were obtained also prior to contrastinjection to assess blood oxygen level dependent (BOLD)signal in the tissues around these vessels.RESULTSSurrogates of cerebral blood volume and circulation timedemonstrated significant increases (p < 0.005) in the tissuessurrounding the DVAs compared to tissue around normalcortical veins: NEI 12-95%, MTE 8-16%, and TTM 5-23%.
Decreased signal on long TE gradient-echo images wasobserved in the tissues around DVAs but not normal corticalveins suggesting increased oxygen extraction by the tissue.Figure 1 shows a transmedullary DVA (single arrow) on agadolinium-enhanced T1-weighted spin-echo. The doublearrow shows a normal cortical vein. Figure 2 shows the correspondingblood volume map (NEI) with ROI #1 on tissuessurrounding the DVA, and ROI #2 on tissues surrounding thenormal cortical vein. Black arrows show the extent of the relativecerebral blood volume increase around the DVA.CONCLUSIONOur findings indicate the presence of perfusion abnormalitiesaround DVAs that could put local tissue at metabolic riskfrom venous congestion, i.e., “misery” venous drainage.KEY WORDS: Developmental venous anomaly, MR perfusion,BOLD343the use of various imaging modalities, time delay to imaging,and neuroimaging findings. Multivariate logistic regressionanalysis examined predictors of intracranial pathology onemergent neuroimaging studies.RESULTSMultiparous, African-American women constituted a majorityof the cases, presenting with a severe headache at varioustimepoints throughout pregnancy (median gestational age 25weeks, range 6-40 weeks). Headaches generally persisted formore than several hours (median duration 48 hours) andwere frequently accompanied by photophobia (59%), nausea(52%), vomiting (37%), phonophobia (23%), and occasionallywith fever (11%), meningismus (9%), or seizures (7%).Headaches were described frequently as dull or throbbing(77%), bilateral (65%), and predominantly frontal (64%). Aneurology consult was obtained in 67% of cases, with neurologicexamination findings in 43%. Emergent neuroimagingincluded noncontrast head CT in 86%, MR imaging in60%, and MR venography in 40%. CT and MR imagingwere acquired in 46% of cases, whereas only CT was performedin 40% and only MR imaging in 14%. Emergent neuroimagingstudies revealed an underlying headache etiologyin 26%, although sinusitis accounted for 8%. Intracranialpathology included cerebral venous thrombosis in 6%,reversible posterior leukoencephalopathy/eclampsia in 6%,pseudotumor in 3%, and intracranial hemorrhage in 3%.There were no demographic or clinical variables that werepredictive of intracranial pathology on emergent neuroimagingstudies.PostersPoster 93Emergent Neuroimaging for Headaches duringPregnancyRamchandren, S. · Cross, B. J. · Liebeskind, D. S.University of PennsylvaniaPhiladelphia, PAPURPOSEHeadache is a common neurologic complaint during pregnancy.Although the majority of cases are unrelated tointracranial pathology, such headaches may herald ominousdiagnoses including eclampsia, stroke, tumor, subarachnoidhemorrhage, or cerebral venous thrombosis. Emergent evaluationof the pregnant headache patient requires rationalselection of acute neuroimaging studies, yet guidelines donot exist. We investigated the demographic factors and clinicalfeatures of pregnant women with headaches presentingto an emergency room that are predictive of intracranialpathology on acute neuroimaging studies.CONCLUSIONEmergent neuroimaging studies may reveal an underlyingheadache etiology in 26% of pregnant women. The diagnosismay be established on CT alone in a subset of cases.Despite the frequent occurrence of concerning symptomsand examination findings, no clinical features are predictiveof pathology on acute neuroimaging studies.REFERENCES1. Marcus DA. Headache in Pregnancy. Curr Pain Headache Rep2003;7:288-296KEY WORDS: Pregnancy, headacheMATERIALS & METHODSRetrospective review of demographic factors, clinical features,and radiologic findings was conducted in a consecutivecase series of 63 pregnant women (median age 25 years,range 15-41 years) emergently evaluated with a chief complaintof headache. Clinical data were abstracted from emergencyroom medical records, hospital course, and dischargesummaries. Clinical variables included prior pregnancy andmedical histories, presenting factors, gestational age, neurologicsymptoms, headache features, examination findings,and laboratory investigations. Radiologic variables included
Head and Neck94-108344Poster 95Cervical Fasciae and Spaces Justified by ModernImaging ModalitiesPostersPoster 94A Pictorial Review of the Anatomy and CommonPathology of the Buccal Space: “The Overlooked Space”Noujaim, S. · Seelagan, D. · Cacciarelli, A.William Beaumont HospitalRoyal Oak, MIPURPOSETo familiarize the reader with the detailed, important anatomyof the buccal space including its relationship to surroundingstructures and to illustrate a variety of pathologythat can occur including benign, malignant, vascular, andinfectious processes.MATERIALS & METHODSWe retrospectively reviewed a large series of cases from atertiary hospital demonstrating the CT, MR imaging, andsialographic manifestations of buccal space masses.Anatomical drawings were used to illustrate the buccal spaceand related structures.RESULTSA variety of pathology involving the buccal space will bedemonstrated including, but not limited to, ectopic salivarygland tumors, diseases related to the main parotid salivarygland duct, hemangioma of infancy, lymphangioma, venousdevelopmental anomalies, rhabdomyosarcoma, lymphoma,lipoma, neurofibroma, primary and metastatic tumors fromneighboring structures, and infectious processes.CONCLUSIONThe buccal space often receives less attention than the otherspaces of the head and neck due to its small size and predominantlyfatty composition. However, because of theclose relationship to important structures both in and aroundthis space, a variety of pathology may be seen. These structuresinclude the parotid gland, masticator space, minor salivaryglands, lymph nodes, muscle, sinuses, facial artery andvein, and other neurovascular structures. We hope that thisreview will enhance the readers knowledge of the anatomyand pathology of this often overlooked space, thereby facilitatingdiagnosis of lesions therein.KEY WORDS: Buccal space, anatomyChin, S.Tri-Service General HospitalTaipei, TAIWAN REPUBLIC OF CHINAPURPOSETo examine the accuracy of the documented cervical fasciaeand spaces by modern CT and MR images.MATERIALS & METHODSEnrolled are forty cases with the spectrum of head and neckdiseases from the indolent one as thyroid goiter, postradiationchange to the relentless neck infection collected forstudying the disease spread pathway and corroborated withthe prior anatomatical work done as early as 1938 byGrodinsky M. and Holyoke E.RESULTS1. Retropharyngeal space can freely communicate with pretrachealspace only at the hypopharynx level, whereas therest of these two spaces are independent as justified by thespreading route of cranially and/or caudally directing hugethyroid goiter. 2. The lateral boundary of suprahyoidretropharyngeal space, that is, cloison sagittale, is dehiscentor weak in most cases of postradiation neck and neck infection,allowing either sterile or infectious fluid collection,contiguous with that in parapharyngeal space. 3.Parapharyngeal and retropharyngeal spaces are more readilyfor extension of neck infection toward mediastinum, ratherthan the proposed “danger space.”CONCLUSIONBy observing the disease spreading routes on imaging study,the concept of cervical fasciae and spaces can be morerationalized.KEY WORDS: Fascia, neckPoster 96MR Findings of Angiosarcoma of the ScalpIsoda, H. · Imai, M. · Inagawa, S. · Sakahara, H.Hamamatsu University School of MedicineHamamatsu, JAPANPURPOSEAngiosarcoma of the scalp is a rare disease. There have beenmany published papers regarding pulmonary metastasesfrom angiosarcoma of the scalp; however imaging findingsof angiosarcoma of the scalp have not been reported yet. Thepurpose of our study was to investigate the MR findings ofangiosarcoma of the scalp retrospectively.MATERIALS & METHODSThere were 11 patients (7 male and 4 female, 70 years old onaverage, ranging from 51 to 90 years old) diagnosed as havingangiosarcoma of the scalp by biopsy or operation from1996 to 2003 in our institute. Ten out of 11 patients, whoseMR images or reading reports were available, were included
in our study. All patients were examined with 1.5 T MR unitsand commercially available head coils. T1-weighted imagingwas carried out for all patients. Eight patients underwentenhanced study and 4 of them had fat saturation technique.T2-weighted imaging was performed for 8 patients and 4 ofthem had fat saturation technique. Both MR images andreading reports were available for 8 patients and only readingreports were available for the other 2 patients. We retrospectivelyevaluated MR findings of angiosarcoma of thescalp.345Poster 97CT and MR Findings of Primary Facial T-CellLymphomaKim, E. Y. 1 · Kim, S. S. 1 · Ryoo, J. W. 1 · Na, D. G. 2 · Roh, H.G. 11Samsung Medical Center, Seoul, REPUBLIC OF KOREA,2Seoul National University Hospital, Seoul, REPUBLIC OFKOREAPostersRESULTSMR images revealed that all angiosarcoma of the scalp hadthickened scalps or tumors. Most tumors had prolonged T1and T2 relaxation times and they were well-enhanced. Sevenpatients had thickened galea aponeurotica and occipitofrontalmuscles with abnormal signal intensities. T1-weighted images demonstrated that thickened subcutaneousfat had comb-like or reticular hypointense patterns. T1-weighted images showed skull invasion as hypointensetumors in two patients. Extents of the skull invasion werewell demonstrated on contrast-enhanced T1-weightedimages with fat saturation. T2-weighted MR imaging withfat saturation, which was performed for 4 patients, demonstratedtumors as being larger than T1-weighted imaging.Contrast-enhanced T1-weighted imaging with fat saturation,which was carried out for 4 patients, more clearly showedtumors invading into subcutaneous fat tissue and musclesthan other imaging techniques. However contrast-enhancedT1-weighted imaging without fat saturation, which was donefor the other 4 patients, did not clearly reveal bordersbetween tumors and subcutaneous fat. At least two slice orientationswere required for better delineation of the tumors.We were able to compare inspection findings and MR findingsof angiosarcoma of the scalp for 7 patients. Fivepatients showed the tumors were larger on MR images thanon the inspections, due to the fact that we cannot see theinvading tumor by inspection if it has spread into the surroundingsubcutaneous fat tissue and subcutaneous muscles.The remaining 2 patients demonstrated the findings werealmost the same.CONCLUSIONContrast-enhanced T1-weighted images with fat saturationtechnique and T2-weighted images with fat saturation techniquedemonstrated angiosarcoma of the scalp very clearly.MR imaging was useful in demonstrating the extent ofangiosarcoma of the scalp because it demonstrated tumorsthat had invaded into the surrounding structures more clearlythan inspections.KEY WORDS: Angiosarcoma, scalp, MR imagingPURPOSETo describe the radiologic findings of primary facial T-celllymphoma.MATERIALS & METHODSCT and MR imaging findings of seven consecutive patientswith pathologically proven facial T-cell lymphoma wereevaluated retrospectively. Patients with T-cell lymphomainvolving sinonasal cavity or lymph nodes were excluded,those who were included consisted of extranodal NK/T-celland peripheral T-cell in four and three patients, respectively.RESULTSInfiltration and swelling of the superficial space of the facewere noted on both CT and MR imaging, mimicking inflammationor infection. Also seen were well enhancing, eithersmall nodular (n = 5) or infiltrative mass-like lesions (n = 2)within the areas of infiltration, which showed intermediatesignal intensity on T2-weighted images.CONCLUSIONPrimary facial T-cell lymphoma is a rarely encounteredtumor and demonstrates infiltration and swelling, mimickinginflammation or infection. Nodular or infiltrative mass-likelesions may be helpful for its diagnosis.KEY WORDS: Lymphoma, T-cellPoster 98Sequential Angiographic Changes in Carotid Arteriesafter PTA/StentingYamaga, H. · Terada, T. · Matsumoto, H. · Masuo, O. ·Tsumoto, T. · Itakura, T.Wakayama Medical UniversityWakayama, JAPANPURPOSERecently, the results of PTA/stenting for the internal carotidarteries are improving rapidly after the introduction of varioustypes of protective devices. However, the sequentialangiographic changes after stenting for the carotid stenosisare still unknown. We investigated sequential angiographicchanges after self-expanding stent deployment for internalcarotid arteries.MATERIALS & METHODSOne hundred eighty-six cases with 200 lesions treated withPTA/stenting for internal carotid stenosis were analyzed.Patinet’s age was varied from 53 years old to 82 years old(mean 71.3 years old). Male/female ratio was 174/26. Ninetypercent of the cases were treated using distal protection
Postersdevices and self-expanding stents (SMART, Acculinc,Wallstent) were deployed. We examined morphologicchanges of stent-treated carotid arteries before, immediatelyafter, and 6 months after stenting using angiogram and ultrasound.RESULTSAverage stenotic ratio improved from 77.1% to 7.3% afterstenting. Average stenotic ratio after 6 months was 18.2%.Five cases were treated repeatedly for restenosis with PTA.Restenosis improved after PTA, but one case resulted inasymptomatic total occlusion. The cases with distal kinkafter stenting tended to improve on angiogram 6 monthsafter stenting. The ulcerative lesions disappeared in all cases6 months after stenting.CONCLUSIONRestenosis greater than 70% appeared 6 months after stentingin three cases. The distal kink or ulceration tended toimprove on follow-up angiogram after stenting.KEY WORDS: Carotid artery, stent, angiographyPoster 99Algorithmic Approach to Imaging Diagnosis ofNeoplastic Lesions of the JawEl-Dieb, A. · Aygun, N. · Sciubba, J. J. · Yousem, D. M. ·Zinreich, S. J.The Johns Hopkins UniversityBaltimore, MDPURPOSEThe purpose of this communication is to present a practicalapproach to the diagnosis of neoplastic lesions occurringwithin the mandible and maxilla in association with dentition.A systematic, algorithmic approach based on appearance,morphology, and evolution will be presented to facilitatea clearer understanding and improve the accuracy of thepathologic diagnosis by the evaluator. CT, MR imaging andconventional radiography will be used to illustrate the spectrumof neoplastic pathology in this anatomical region.MATERIALS & METHODSPatients records with neoplastic pathologies of the mandibleand maxilla over the past 20 years were reviewed. Specificneoplastic pathologic entities which best illustrate the characteristicsto be highlighted were chosen.RESULTSThis algorithmic approach for the evaluation of neoplasticentities of the mandible and maxilla facilitates and significantlyimproves the evaluators approach to neoplastic pathologicentities in this area.CONCLUSIONIt is intended that the use of the above algorithm will affordall radiologists the ability to confidently evaluate neoplasticpathologies in this area.KEY WORDS: Neoplasm, mandible, maxilla346Poster 100Ocular Lesions: A Neuroimaging SpectrumKhan, A. M. · Carrel, C. E. · Wang, A. · Silbergleit, R. ·Cacciarelli, A. · Noujaim, S.William Beaumont HospitalRoyal Oak, MIPURPOSETo demonstrate the utility of CT and MR imaging in theidentification and characterization of ocular diseases and disorders.MATERIALS & METHODSCT and MR images of 30 patients with ocular lesions werereviewed.RESULTSA wide variety of ocular diseases and disorders were demonstratedwith CT and MR imaging including retinoblastomaand other primary neoplasms of the eye, metastatic lesions ofthe globe, retinal and choroidal detachments, traumatic conditionsof the eye including rupture of the globe, colobomas,retinopathy of prematurity, pseudotumor cerebri, drusenbodies, and persistent hyperplastic primary vitreous.CONCLUSIONCT and MR imaging can be valuable in the diagnosis andmanagement of ocular diseases and disorders. Neuroimaginghelped diagnose and guided treatment in many conditions ofthe eye. The imaging characteristics of each lesion will helpthe reader to better understand these conditions and thusfacilitate the differential diagnosis.KEY WORDS: Ocular lesionsPoster 101Head and Neck Lesions in the ImmunocompromisedHostMarsot-Dupuch, K. F. 1 · Quillard, J. M. 1 · Meyohas, M. M. 21Hopital Bicetre, le Kremlin Bicêtre, FRANCE, 2 HopitalSaint Antoine, Paris, FRANCEImmunosuppressed patients (e.g., HIV-infected individuals,diabetes mellitus, transplant recipients, patients treated withimmunosuppressive drugs), frequently present head andneck lesions. The involved organs are the salivary glands,the temporal bone, the pharyngolaryngeal mucosa and thenodes. Granulations tissues, perivascular inflammation, andneoplasms may be encountered. Our purpose is: 1. to illustrateby correlation imaging-clinical cases the main lesionsencountered; 2. to demonstrate imaging features and anatomopathologiccorrelations of Kaposi sarcoma, the pathogenyof which involves a complex interaction of angiogenicgrowth factor; 3. to demonstrate posttrasplantation lymphoproliferativedisorder which may mimic lymphoma; 4. Toshow complications of these lesions which may inauguratethe disease such as Lemiere syndrome, invasive fungalsinusitis, skull base osteomyelitisKEY WORDS: AIDS, immunocompromised host, posttranplantationdisorder
Poster 102Endovascular Treatment of Persistent Epistaxis Due toPseudoaneurysm Formation of Ophthalmic ArterySecondary to Nasogastric Tube RemovalSelcuk, H. · Albayram, S. · Soylu, N. · Cebi, D. · Selcuk, D.· Islak, C. · Kocer, N.Cerrahpasa Medical SchoolIstanbul, TURKEYPURPOSEPersistent epistaxis due to pseudoaneurysm formation duringnasogastric tube insertion or removal is very rare. Anteriorand posterior nasal tamponade, and cauterization are frequentinitial interventions. Angiography and endovasculartreatment had been preferred to surgical intervention for thedetection of the origin and management of persistent epistaxisrecently. We present a 60-year-old man with persistentepistaxis secondary nasogastric tube removal. A pseudoaneurysmformation which was developed from anterior ethmoidalbranches of right ophthalmic artery was observed andendovascular treatment performed successfully.MATERIALS & METHODSSixty-year-old man was admitted to our hospital because ofpersistent epistaxis for 20 days which has started duringnasogastric tube removal that was placed for an abdominaloperation. The patient had anterior and posterior nasal tamponades,cauterization, and multiple blood transfusions inthat period repeatedly at outside hospitals. The patient wastaken for angiography. The vessels were cannulated via theright femoral artery and selective angiographic studies of thefascial and internal maxillary artery were analyzed.Although there was no pathologic finding at specific injections,embolization with PVA particles was performed.Following this, anterior tamponades were removed. Thepatient did not continue to bleed. The procedure was stoppedand he was taken to observation room. One hour later thepatient developed massive epistaxis again requiring 5 unitsof packed red blood cell and 3 units of fresh-frozen plasma.He was immediately taken back for angiography.RESULTSThere was no pathologic finding at specific fascial and internalmaxillary artery injections. An injury to the ethmoidalbranch of ophthalmic arteries or other arterial origins ofbleeding was suspected. The ICA angiography revealed apseudoaneurysm of an anterior ethmoidal branch of rightophthalmic artery, which was approximately 3-4 mm ofdiameter. The catheter was advanced to these ethmoidalbranches through ophthalmic artery and the pseudoaneurysmwas occluded with NBCA-histoacryl injection. The epistaxiswas stopped suddenly. The patient was observed for twodays. There was no recurrent epistaxis during this time andon 1-month follow-up.347CONCLUSIONPseudoaneurysm formation and persistent epistaxis duringnasogastric tube insertion is very rare. Angiography andendovascular treatment can be life saving in cases of the originof bleeding cannot be found or the conventional methodsare impaired to stop bleeding. For this purpose the secondarybranches of nasal blood supply like ophthalmic artery shouldbe observed as well as internal maxillary and fascial arteryon angiography.KEY WORDS: Nasogastric tube, pseudoaneurysm, endovasculartreatmentPoster 103Apparent Diffusion Coefficients in the Evaluation ofSinonasal Inflammatory DiseaseWhite, M. L. · Zhang, Y. · Smoker, W. R. K.University of Iowa College of MedicineIowa City, IAPURPOSEThe sinonasal secretions in sinonasal inflammatory diseaserepresent the physiologic spectrum of mucous (primarilywatery, serous, thick, and desiccated mucous or even astone-like mucous plug). It has been demonstrated previouslythat changing T2-weighted signal intensity from high tolow signal, or even a signal void, reflects these mucousstates. The protein concentration, the amount of free water,and the viscosity in the secretions vary, leading to differencesof molecular motion. We, therefore, hypothesized thatapparent diffusion coefficients (ADCs) can be used to differentiatethe state of the sinonasal secretions. The purpose ofour study is to test this hypothesis.MATERIALS & METHODSWe retrospectively reviewed MR images of 23 patients withsinonasal inflammatory diseases. Abnormal sinonasal secretionswere found in 33 sinuses (13 in maxillary, 10 in sphenoid,5 in frontal, and 5 in the ethmoid sinuses). MR studiesincluding both conventional and diffusion-weighted imaging(b = 1000) were performed using a 1.5 T unit. Based on theT2-weighted signal intensity, the 33 sinuses involved byinflammatory diseases were divided into 2 groups based onT2-weighted images: 24 sinuses with high signal secretionsand 9 sinuses with iso ~ low signal secretions. The ADCswere measured and regions of interest were placed over thesinonasal secretions. The difference of the ADCs betweenthe two groups was analyzed statistically by using a t-test.RESULTSThe ADCs in the sinonasal secretions with high signal intensityon T2-weighted images ranged from 11.8 to 29.1 (mean± SD, 20.49 ± 6.19) x 10 -4 mm 2 /s. By contrast, in thesinonasal secretions with iso ~ low signal intensity on T2-weighted images, the ADCs ranged from 2.78 to 17.1 (mean± SD, 10.26 ± 5.98) x 10 -4 mm 2 /s. Despite the presence ofoverlap of the ADC values between these 2 groups, the formerwas significantly higher than the latter (P < 0.001).Posters
PostersCONCLUSIONThis study revealed that when the T2-weighted signal intensitygoes from high to iso/low the ADCs of sinonasal secretionsbecome significantly restricted. This suggests a correlationbetween the ADCs and components of the sinonasalsecretions. Diffusion-weighted imaging may provide quantitativeinformation useful to the diagnosis of sinonasalinflammatory disease.REFERENCES1. Som PM, Curtin HD. Head and Neck Imaging. Mo: Mosby2003;193-259KEY WORDS: Sinonasal inflammatory disease, apparent diffusioncoefficients, diffusion-weighted imagingPoster 104How to Distinguish the Glossopharyngeal Nerve from theVagus and Accessory Nerve Complex in the Region ofJugular Foramen: A Comparative RadioanatomicalStudyLiu, J. · Zhang, X. · Jin, Y. · Qi, J.Tianjin Medical UniversityTianjin, CHINAPURPOSETo distinguish the glossopharyngeal (IX) nerve to the vagus(X) and accessory (XI) nerve complex in the region of jugularforamen (JF) by multislice CT and MR imaging.MATERIALS & METHODSTen formalin-preserved adult cadavers were scanned by multisliceCT (General Electric lightspeed Qx/i) and 1.5 T MRscanner (Marconi, Eclipse) prior to dissection. Five cadaverswere dissected into 1.0 mm celloidin contiguous sections inaxial and coronal plane.RESULTSThe rootlets of the IX nerveemerge from the postolivary sulcus.The nerve enters the JF through the uppermost porus(pars nervosa). When it enters the JF, the nerve is wrappedby a connective tissue septum, which is defined as the glossopharyngealmeatus and just beneath the out opening of thecochlear aqueduct. In the lower section (mean 2.0 mm,witha range from 0.9 mm to 3.3 mm), the X and XI nerve complexpasses the JF through the vagal meatus. In all ten specimens,the vagal meatus obviously are wider and shorter thanthe glossopharyngeal meatus. Two complete and four incompletebony canals were found in all specimens, 10% and 20%separately. Both of the meatus can be well recognized by CTscan. So, these nerves can be distinguished from each otherby MR imaging. From the anterior to the posterior, the structureswithin the JF range as follows: the IX nerve, the inferiorpetrosal sinus, the X and XI nerves, the posteriormeningeal artery and the jugular bulb. When they exit thejugular foramen, all of these nerves are located medial totheinternal jugular vein. The IX nerve lies at the upper anddeeper portion. The X and XI nerve complex is more superficialthan the IX nerve.348CONCLUSIONWith the help of the anatomical landmarks of these nerves,we could distinguish them by CT and MR imaging.KEY WORDS: Anatomy, CT, MR imagingPoster 105So-called Huschke’s Foramen or Foramen Tympanicum:Anatomical and Pathologic SignificanceLacout, A. A. · Marsot Dupuch, K. K.Ap-Hp Kremlin BicetreLe Kremlin Bicetre, FRANCEPURPOSEHuschke’s foramen is an infrequent anatomical variationlocated on the tympanic bone connecting the external auditorycanal with the temporomandibular joint. Occasionallypathologic cases are reported in the literature. The purpose ofthe study is to define its precise location, its prevalence onhigh resolution CT, and its pathologic correlation.MATERIALS & METHODSOne hundred consecutive high resolution CTs of the temporalbone (200 ears) have been studied prospectively(Philips). High resolution CT was performed using the followingparameters: 120 KV, 400 MAS, high resolution filters,matrix of 728 x 728. Axial, sagittal, and coronal reformatedimages were acquired using slice of 0.6 mm. Patientswith previous history of ear surgery or less than 5 years oldhave been excluded from the study. For all the patients thefollowing items were appreciated: existence of the foramen,its size, its shape, and its location in regards to the tympanicmembrane. Patients with reduction of thickness of the tympanicbone (inferior to 1 mm) were numbered separately.RESULTSHuschke’s foramen was found in 15% of the ears with meandiameter of 2 mm. Reduction of thickness was found in 30%of the ears. Other cases of reduction of thickness are discussed(Santorini’s canal, petrotympanic suture). Two caseswith salivary herniation into the external auditory canalcausing otosialhorea and temporomandibular joint herniationare reported.CONCLUSIONHigh resolution CT identifies with great ease Huschke’sforamen due to MPR and to thickness. Its knowledge is usefulespecially for otology, otosialhorea, and temporomandibularjoint pathology.KEY WORDS: Tympanic, Huschke
Poster 106Otalgia: Algorithm of Imaging StudiesMarsot-Dupuch, K. F.Hopital Bicetrele Kremlin Bicêtre, FRANCEOtalgia with a normal tympanic membrane is a frequentsymptom causing a very difficult task for its imaging evaluation.Our purpose is: 1. to illustrate the anatomical patternsof the nervous ways causing ear pain, e.g., V3, VII, IX, Xcranial nerves; 2. to identify the main ear, nose, throat(ENT) sites to check in imaging study; 3. to propose thebest imaging protocol for imaging procedure; 4. to illustratethis algorithm by 10 cases of clinical imaging correlationsKEY WORDS: Ear, pharynx, otalgiaPoster 107Value of 3D T2-Weighted MR Imaging for Screening inAsymmetric Sensory Neural Hearing Loss in OlderPopulation Prior to Hearing AidsKhosla, A.Mallinckrodt Institute of Radiology/Veterans’Administration Medical CenterSt. Louis, MOPURPOSELaboratory testing and MR imaging commonly are used todelineate retro-cochlear pathology in asymmetric sensorineuralhearing loss (ASNHL). The aim of this study is todetermine the use of 3D T2-weighted MR imaging in diagnosticevaluation of ASNHL in older patients as a screeningprocedure prior to hearing aids.MATERIALS & METHODSRetrospective analysis of 200 consecutively investigatedpatients (males, mean age 56 years) from Veteran hospitalbetween 2001-2003. Results of audiogram, auditory brainstemevoked response (ABER) and MR imaging wasreviewed with clinical findings. MR imaging included T1,T2 (FSE fast spin-echo) in axial and coronal plane and 3DT2 volumetric imaging with multiplanar reconstruction.Additional axial and coronal T1-weighted images after intravenousgadolinium injection also was obtained. The examinationconcluded in average 40 minutes.RESULTSMost of the patients had asymmetrical hearing loss in highfrequency range. Auditory brainstem evoked response (n =36) was equivocal in 90%. Auditory brainstem evokedresponse was definitely abnormal in 3 patientsonly.Vestibular schwannoma was found only in 4 patients onMR imaging. Other findings that could be related to ASNHLwere dehiscent jugular bulb in one, vascular loop near rootentry zone in ten, pontine infarct in two, cerebellar infarctionfive, and mastoiditis in seven patients. Incidental finding ofloss of flow signal was seen in internal carotid arteries ofthree patients. In this particular age group the yield of MRimaging to detect retro-cochlear pathology is low. On analy-349sis of individual sequences T2-weighted 3D volume imagingwith reconstructions detected 95% of the findings and hadexcellent anatomical demonstration of the nerves.CONCLUSIONDetailed analysis of the above data suggests that prior to MRimaging patients are divided into low and high probabilityfor retro-cochlear pathology. In low probability group suchas older patients with ASNHL being screened for hearingaids, a T2 3D volumetric imaging is adequate in excludingretro-cochlear pathology. In high probability group detailedevaluation including postcontrast studies should be obtained.KEY WORDS: Hearing loss, sensorineural deafness, MRimagingPoster 108Papillary Endolymphatic Sac Tumors: Imaging Findingswith Histopathologic Correlation in 5 CasesLin, Q. 1 · Dai, J. 21QingDao University, QingDao, CHINA, 2 Capital Universityof Medical Science, Beijing, CHINAPURPOSETo determine the CT, MR imaging, angiographic appearance,clinical and histopathologic finding of papillaryendolymphatic sac tumors (PELSTs).MATERIALS & METHODSClinical, imaging, and histopathologic studies in 5 patientswith papillary endolymphatic sac tumors were reviewed retrospectively.There were 4 male patients and one female.Average age 26.8 years (range, 12-41 years). Clinical symptomssuch as hearing loss, tinnitus, facial palsy, and vertigopresented. The time range between the initial onset of symptomsand surgical resection was 4 to 9 years. Four of the fivepatients also underwent angiograms. CT scans were evaluatedfor bone erosion and calcification. MR images, for signalintensity, enhancemented patterns and flow voids, andangiograms, for tumoral blood supply.RESULTSAll tumors were destructive, contained calcifications centeredin the retrolabyrinthine region and showed irregularbone margins at CT. MR imaging appearance varied withlesion size and nature. Three of the five tumors showed ahigh-signal-intensity margin at unenhancemented T1-, T2-weighting, and the margins were more clear with fat-suppressimaging. The others were heterogeneous and containedcystic high-signal-intensity area with T1- and T2-weighting.Regions where endolymphatic sac were anatomically in alltumors showed irregular low-signal-intensity region. Alltumors had flow voids. The blood supply arose predominantlyfrom the external carotid artery. Two tumors had additionalsupply from posterior circulation. At histopathologicfindings, PELSTs were shown to consist of complex, interdigitatingpapillary processes that infiltrate the surroundconnective tissue and bone. These papillations typicallywere embedded in sheets of dense fibrous tissue with evidenceof recent and previous hemorrhage, and lined with asingle layer of cuboidal epithelial cells.Posters
PostersCONCLUSIONPapillary endolymphatic sac tumors are destructive, hypervascularlesions that arise from the temporal bone retrolabyrinthineregion and may be confused histopathologicallywith other common lesions. Combining these imaging findingswith original location of lesions may be more helpful todistinguish these lesions from other more common, aggressivetemporal bone tumors, and improve histopathologicdiagnosis.KEY WORDS: Papillary endolymphatic sac tumors, retrolabyrinthineregion, imaging findingsInterventional109-148350RESULTSA complete and persistent exclusion of the aneurysm wasobtained in all cases. No complications were observedexcept for one patient, with a posterior cerebral artery giantaneurysm, who presented transient parestheses and mildoculomotor paresis which completely regressed in 1 week.In the patients with giant partially thrombosed aneurysms,CT and MR follow-up studies showed an important shrinkageof the aneurysmal thrombosed compartment and disappearanceof the mass effect.CONCLUSIONIn some anatomical configuration, endovascular occlusion ofthe parent artery appears a safe and efficacious technique inthe treatment of giant and large aneurysms of the intracranialdistal arteries. Follow-up studies confirm exclusion of theaneurysm and good clinical tolerance to the occlusion.KEY WORDS: Aneurysm, intracranial, embolizationPoster 109Giant and Large Aneurysms of the Intracranial DistalArteries Treated by Endovascular Occlusion of theParent Artery: Long-Term Clinical and RadiologicFollow-UpBiondi, A. · Jean, B. · Boch, A. L. · Barragàn, H. · Chiras, J.Pitié-Salpêtrière Hospital - University Paris VIParis, FRANCEPURPOSETo evaluate long-term clinical and radiologic follow-up inpatients with large or giant aneurysms of distal intracranialarteries treated by endovascular occlusion of the distal parentartery.MATERIALS & METHODSRetrospective study was carried out in nine patients (fourmen and five women ranging in age from 18 to 64 years,mean age 42 years) with a distal giant or large aneurysmtreated by endovascular occlusion of the parent artery. Onlypatients with at least 1 year follow-up after treatment wereincluded in the study. Eight lesions were supratentorial anddistal to circle of Willis and one aneurysm was infratentorial.All four giant aneurysms were partially thrombosed (oneaneurysm of the superior branch of the middle cerebralartery bifurcation, one aneurysm of the left pericallosalartery, and two aneurysms of the P2-P3 segments of the posteriorcerebral artery) and four of five large aneurysms werefusiform (three aneurysms of a distal cortical branch of themiddle cerebral artery, one aneurysm of the pericallosalartery, and another lesion located distally on the posteroinferiorcerebellar artery. An occlusion test of the parentartery with a small balloon was performed in 3 cases in orderto evaluate the clinical and angiographic tolerance to theocclusion. After careful analysis of the leptomeningeal collaterals,the occlusion of the parent artery was performedusing coils in seven cases and glue in two. CT and/or MRstudies were available in all patients. Clinical and imagingfollow-up was performed from1.5 to7 years (mean: 4.5years) after treatment.Poster 110HIV-Associated Intracranial Aneurysms: EndovascularTreatmentGarg, A. · Gupta, V. · Mishra, N. K. · Gaikwad, S. B. ·Kumar, A.All India Institute of Medical SciencesNew Delhi, INDIAPURPOSEHIV-associated intracranial aneurysms have been reportedrarely in the literature. However, there is no report ofendovascular treatment in these patients. We present a casewith HIV-induced intracranial aneurysms that was treated byendovascular embolization.MATERIALS & METHODSRetrospective review of a case with HIV-associated multipleintracranial aneurysms was performed including result ofendovascular embolization of one of the aneurysms. Theclinical and radiologic details including the follow-up imagingwere studied.RESULTSA 14-year-old boy presented with sudden onset severeheadache. Patient was detected to be HIV positive at age of5 years; however, he did not have any symptoms related tothe disease. His mother was also HIV positive, indicatingantenatal transmission. CT and MR imaging revealed subarachnoidhemorrhage in the interhemispheric fissure infrontal region along with multiple aneurysms with vesselwall calcification. Digital subtraction angiography (DSA)showed multiple broad-based and fusiform aneurysmsinvolving B/L ICA, B/L MCA, B/L PCA and basilar arteryalong with a right distal ACA fusiform aneurysm. His HIVviral load was found to be high (40255 copy/ml).Endovascular embolization of the right ACA aneurysmalong with the parent artery occlusion was performed withdetachable coils. Presence of leptomeningeal collateral toright ACA cortical branches was seen and the procedure wasuneventful. Patient was started on antiretroviral therapy. Hehad an episode of right hemiparesis 4 months after the procedure,with complete recovery in 1 week. Imaging revealed
left basal ganglia infarct. At 1-year follow-up, CT angiogramshowed persistent occlusion of the embolized aneurysm withno apparent change in rest of the aneurysms. CT and MRimaging also did not show any new intracerebral lesions. Hisviral load also had come down to < 20 copy/ml.CONCLUSIONHIV virus infection rarely may be associated with intracranialaneurysms. Endovascular treatment may be feasible inthese cases. In contrast to the reported literature, our patienthas had a good clinical outcome with probable stabilizationof the aneurysms on retroviral therapy.KEY WORDS: HIV vasculopathy, aneurysm, coilingPoster 111Surgical Aneurysm Model in Swine: An Histologic andMolecular Analyses of the Natural History ofThrombosis and HealingLee, D. W. 1 · Murayama, Y. 1 · Nishimura, I. 2 · Yuki, I. 1 · Yih-Lin, N. 1 · Sayre, J. 3 · Chiang, A. 4 · Vinters, H. V. 1 · Vinuela,F. 11University of California Los Angeles School of Medicine,Los Angeles, CA, 2 University of California Los AngelesSchool of Dentistry, Los Angeles, CA, 3 University ofCalifornia Los Angeles School of Public Health, LosAngeles, CA, 4 University of California Los Angeles, LosAngeles, CAPURPOSEThe surgical model for carotid aneurysms in swine is usedwidely for reproducing the gross morphology of saccularaneurysms for experimental study. The aim of this investigationwas to describe the cytokine expression profile and histologyof this model during its natural course of thrombosisand healing.351the other for RNA harvesting and potential molecular analysis.Cytokine expression analysis was performed on the 7-,14-, and 30-day postop specimens. cDNA was reverse-transcribedfrom the harvested RNA and hybridized to a commerciallyavailable, nylon-based array spotted with cDNA of96 common human cytokines. Data were analyzed with theSignificance Analysis of Microarrays program (SAM version1.13, Stanford University).RESULTSPresacrificial angiograms confirmed aneurysm occlusionand parent carotid artery patency in all animals. Histologicexamination demonstrated marginal thrombus organization,granulation tissue formation, and cellular infiltration as earlyas 3 days postoperatively. At 7 and 14 days postoperatively,most thrombotic products had been replaced by granulationtissue and myofibroblasts. By 30 days postop, the aneurysmlumen was shrunken and replaced by fibroblasts and collagen.By 90 days, the shrunken aneurysms were replacedcompletely by collagenous scar. Statistical analysis of thecytokine-focused cDNA array showed significantlyincreased expression of 33 different cytokines. Thirtycytokines were elevated significantly above time zero levelsat 7 days postop (q-value = 0.174%), 20 cytokines were upregulatedat 14 days postop (q-value = 0.094%), and 26cytokines up-regulated at 30 days postop (q value =1.202%).The degree of overall up-regulation was highest at 7 dayspostop, with SAM scores ranging from 5.4-12.9, as opposedto 0.5-0.7 at day 14, and 0.6-1.1 at day 30. Seven cytokineswere up-regulated significantly only at day 7, including IL-22, PDGF a, PDGF b, TGF b-3, and VEGF-B. TGF-a wasthe single most up-regulated of these genes, with a SAMscore of 12.9. Sixteen cytokines were up-regulated at days 7,14, and 30, including IL-11, TGF b-1, and FGF homologues.FGF-11 was elevated only at day 30.CONCLUSIONThis investigation is one of the most detailed descriptivestudies to date of an important animal model for aneurysms.The results indicate that a multiple but selected repertoire ofpro and antiinflammatory cytokines may be involved in thepathophysiology of aneurysm healing, aneurysm growth,and endovascular treatment. The consistent cytokine geneexpression profile associated with histologic thrombosis andhealing sequence strongly validate the usefulness of theswine model for carotid aneurysms and will serve as a baselinefor comparison to findings in aneurysms treated withvarious experimental materials under development at ourinstitution.KEY WORDS: Aneurysm, model, cytokinePostersMATERIALS & METHODSForty-two lateral carotid aneurysms were created in 21Yorkshire-cross swine. Aneurysms were created with asmall, 3 mm ostium in order to encourage thrombosis.Thrombosis was confirmed angiographically before closure.Swine were sacrificed at seven time points: immediately, 1day, 3 days, 7 days, 14 days, 30 days, and 90 days postoperatively.Three swine were sacrificed at each time point. Ineach swine, one aneurysm was used for histopathology and
352Poster 112Poster 113Elastase-Induced Saccular Aneurysms in Rabbits: Utility of Three-Dimensional Angiography in theInstructions “for the Rest of Us”Treatment of Cerebral AneurysmsPostersMiskolczi, L. · Gounis, M. J. · Onizuka, M. · Cesar, L. ·Lieber, B. · Wakhloo, A. K. · Anaya, C. A.University of MiamiMiami, FLPURPOSEAlthough the creation of elastase-induced saccularaneurysms can be quick and easy, for many who have followedinstructions from existing publications and word-ofmouthit has been a nerve-wracking struggle with poor outcomes.Details on the survival rate of rabbits and theaneurysms’ neck-to-dome ratio have yet to be published -until now. We hereby detail some finer points of creatingelastase-induced saccular aneurysms in rabbits, making thismodel easier to reproduce by the entire research community.MATERIALS & METHODSWe created over 100 elastase-induced saccular aneurysms inrabbits during the past 2 years. Health, surgical, and autopsyrecords of all animals were saved. We recorded all digitalruns and saved them in DICOM format, also recorded fluoroscopicimages during procedures to S-VHS tape in most ofthe elatase treatment and follow-up sessions. This way webuilt a large database of our successful cases and failures.Retrospective data analysis was performed on a regular basisfor quality control, in order to improve our outcome. As newpitfalls were pointed out, preventive measures were establishedby changing our protocol. Beyond our quality controlfindings we also will provide instructions on how to evaluatecontrast washout, a reliable immediate predictor of successfultreatment.RESULTSOur initial outcome was below 40%, but improved to 96% aswe eliminated most of the pitfalls. Our difficulties wererelated to the following issues: poor quality rabbit supplier,poor infection prophylaxis, improper anesthesia and recoveryprocedures, improper catheters, effect of catheter andballoon position on outcome, effect of elastase quality andquantity on outcome, and effect of elastase injection methodand rate on outcome.CONCLUSIONWe believe that elastase-induced aneurysms in rabbits havefeatures that make them a better model for certain applicationsthan the surgical model created in dogs or pigs. It isimportant to make the method reproducible, thus widelyavailable to all interested researchers.KEY WORDS: Elastase, aneurysm, rabbitGandhi, C. D. · Johnson, D. M. · Patel, A. B.Mount Sinai Medical CenterNew York, NYPURPOSEAlthough pretreatment planning in the management of cerebralaneurysms has traditionally been based upon twodimensionalangiography (2DA), rotational three-dimensionalangiography (3DA) allows for a more accurate assessmentof both aneurysm and parent-vessel characteristics.Various institutions have reported on the clinical applicationsof this technique, but only a limited number of studiesactually have quantified the benefits (1, 2). This studyattempts to more clearly define the diagnostic utility of 3DAin comparison with 2DA for the management of both rupturedand unruptured cerebral aneurysms.MATERIALS & METHODSAngiograms from all patients with cerebral aneurysm presentingto our institution between June 2002 and January2003 were analyzed retrospectively. All angiograms werereviewed by both a neurosurgeon and neurointerventionalist.The 2DA and 3DA data were stratified as providing “exact”,“ambiguous”, or “poor” visualization in regards to aneurysmneck, aneurysm shape, and parent-vessel branch points. The2DA and 3DA data both were quantified further based ontheir usefulness in assessing the emobolization potential ofeach aneurysm. For this they were stratified into embolizationbeing “possible” based only on the study, “not possible”based only on the study, or the study providing “inadequateinformation” to determine whether the aneurysm could beembolized.RESULTSThere were 31 patients, 11 men and 20 women (mean age of53 years), with 35 aneurysms. Of the 35 aneurysms, 18 wereruptured and 17 were unruptured. Twenty-two aneurysmseventually underwent coiling, 12 aneurysms were surgicallyclipped, and one aneurysm could not be treated with eithercoiling or surgery. Neck anatomy was visualized exactly,ambiguously, or poorly in 57%, 23%, and 20% of cases with2DA and in 94%, 3%, and 3% of cases with 3DA, respectively.Similarly, aneurysm shape was visualized in 49%,37%, and 14% of cases with 2DA and in 94%, 0%, and 6%of cases with 3DA, respectively. Finally, branching patternswere visualized in 29%, 1%, and 1% of cases with 2DA andin 94%, 0%, and 6% of cases with 3DA, respectively. Basedupon only the 2DA, embolization was thought to be possiblein 49%, not possible in 9%, and there was inadequate informationin 43% of cases. With the addition of 3DA, embolizationwas found to be possible in 68%, not possible in 29%,and there was inadequate information in only 3% of cases.CONCLUSIONFrom these results, two unique conclusions can be made.First, 3DA significantly supplements the data on aneurysmneck, aneurysm shape, and parent-vessel branch characteristicsprovided by 2DA. Additionally, when attempting toassess the embolization potential of an aneurysm, 3DA aids
in establishing the optimal treatment in a large group ofaneurysms, 40% of cases in our series, in which 2DA providesonly inadequate information.REFERENCES1. Anxionnat R, Bracard S, Ducrocq X, et al. IntracranialAneurysms: Clinical Value of 3D Digital SubtractionAngiography in the Therapeutic Decision and EndovascularTreatment. Radiology 2001;218:799-8082. Albuquerque FC, Spetzler RF, Zabramski JM, McDougall CG.Effects of Three-Dimensional Angiography on the Coiling ofCerebral Aneurysms. Neurosurgery 2002;51;597-604353CONCLUSIONThis study shows that large and giant bifurcation canineaneurysms can be surgically created successfully and reliablyusing jugular veins. This model allows experimentalembolization materials/devices to be tested in high flowbroad-necked challenging aneurysms.KEY WORDS: Giant aneurysm, animal modelThe authors of this work have indicated the following affiliations/disclosures:MicroVention, Inc.: Consultant, investor.PostersKEY WORDS: Cerebral aneurysms, rotational angiography,three-dimensional angiographyPoster 114Surgically Created Experimental Giant BifurcationAneurysms in a Canine ModelAagaard-Kienitz, B. 1 · Strother, C. 2 · Rappe, A. 1 · Consigny,D. 1 · Consigny, D. 11University of Wisconsin Madison, Madison, WI, 2 MethodistHospital, Houston, TXPURPOSELarge and giant aneurysms are notoriously difficult to treatand have a high recurrence rate. Until recently no reliablegiant aneurysm model existed to test new aneurysm occlusionmaterials/devices. This study shows the creation of agiant bifurcation aneurysm using the canine model.MATERIALS & METHODSFour female mongrel dogs weighing approximately 10 kgwere used. All surgical procedures were performed undergeneral anesthesia and sterile conditions. Bilateral 8 cm incisionswere made in the neck to expose both common carotidarteries. Both external jugular veins were isolated and ligatedproximally and distally, and 3 cm segments of vein wereexcised and placed in heparinized saline (2000 u heparin/20cc normal saline). An arterial anastomosis was done attachingthe end of the left common carotid artery to the lowerthird of the opening in the right common carotid artery. Along access cut was made in both veins and subsequent 45degree angle cuts were made on one end of each vein. Bothveins then were placed on 28 french dilator. A continuousrunning suture was used to anastamose both sides of theveins together. The veins then were incorporated into thejunction of the common arteries. The top of the vein pouchthen was closed using two running continuous sutures. Theaneurysmal pouches measured approximately 20 mm x 15mm with a 9 to 10 mm neck. Postsurgery patency was evaluatedby ultrasound.RESULTSAfter 1 month of healing the animals were returned to thesurgical suite for angiographic evaluation of the aneurysmswhich showed that all aneurysms and outflow tracts werepatent. Aneurysm size was stable or increased up to 25 mmwith 10-14 mm necks.Poster 115Comparison of 2D and 3D Digital SubtractionAngiography in Planning Endovascular Treatment ofIntracranial AneurysmsFerrario, A. 1,2,3 · Miranda, C. 1 · Pabón, B. 1 · Doroszuk, G. 1 ·Lylyk, P. 11ENERI, Buenos Aires, ARGENTINA, 2 Clínica MédicaBelgrano, Buenos Aires, ARGENTINA, 3 FLENI, BuenosAires, ARGENTINAPURPOSEThe advent of three-dimensional angiography (3DA) has ledto better understanding of the morphologic features of vascularintracranial lesions required for more advanced surgicalor endovascular procedures. The purpose of this studywas to assess the therapeutic impact of 3DA in comparisonwith two-dimensional subtraction digital angiography(DSA) in the intracranial aneurysms endovascular treatment.MATERIALS & METHODSA total of 200 patients who underwent both DSA and 3DA tofind brain aneurysms were evaluated. Digital subtractionangiography was performed in standard projections, the 3DA rotational was performed with a 180°- 220° rotation ofthe C-arm. This information was transferred to a computerworkstation and finally the 3D reconstruction was obtained.Different anatomical parameters were registered. The defectof a cerebral arterial wall was classified as focal or segmentalafter evaluation of the neck. Parent vessel relation and theoverall usefulness of the DSA in comparison with the 3DAdata was rated on a three-point scale: 1.Very useful, 2.Sufficient, 3. Poor, according to the diagnosing or excludingthe aneurysm presence, the quality of the depiction of theaneurysm neck, the spatial relation to the parent vessel andadjacent vessels, its capacity of providing the best projection(optimal working angle) for embolization and especially theinformation that helped us to select the best strategy of treatment.RESULTSTwo hundred patients with 224 intracranial aneurysms wereselected. The mean age was 52 years (range, 27-84 years),12.5% patients with multiple aneurysms. The SAH was themost frequent clinical presentation. Eight-five percentaneurysms were located in the anterior circulation. The arterialwall defect was classified as focal defect in 65% of thecases and segmental defect in 35%. Forty-two patients(18%) had undergone previous treatment. The informationobtained and the usefulness of the 3DA in comparison withDSA was evaluated as very useful in 90%, sufficient in 7%,
Postersand poorly assessed in 3%. The choice of the strategy comparingDSA and 3DA information changed in 36 cases(18%). In 144 aneurysms, selective endovascular occlusionwith coils or endovascular reconstruction with stents wereperformed during the same angiographic session. The DSAhad a 3.5% rate of false positives. Two technical complicationswere observed. The procedural morbidity was 0% andthe mortality rate was 0%.CONCLUSIONTechnologic advances in cerebral angiography enable moreaccurate diagnosis of neurovascular diseases. The 3DA constitutesa diagnostic tool useful for intracranial aneurysmevaluation and offers multiple advantages in comparisonwith DSA in planning endovascular treatment of these conditions.All physicians are encouraged to be familiar withthis technology to obtain better clinical results.KEY WORDS: Aneurysms, 3D angiography, DS angiographyPoster 116Buenos Aires Experience in the Treatment ofIntracranial Aneurysms with Hydrogel-Platinum CoilsLylyk, P. · Miranda, C. · Ferrario, A. · Villasant, F.ENERIBuenos Aires, ARGENTINAPURPOSEThe purpose of this study was describe the safety, feasibility,and behavior on the time with the use of a new hybridHydrogel-platinum coil device - Hydrogel Embolic System(HES) for the treatment of intracranial aneurysms.MATERIALS & METHODSBetween November 2001 to April 2003 we enrolled 60patients with 64 aneurysms ( 38 SAH, 12 with mass effect,and 10 incidentals). Age range 29 to 75 years (mean: 52years). The device has been designed to entirely fill theaneurysm cavity, with complete or near-complete exclusionof unorganized thrombus for diminish recanalization. Thepopulation was classified into two groups in agreement ofthe characteristic of the aneurysms (size and neck diameter)and technical feasibility: Group A (n = 36 ) and Group B (n= 24 ). Angiographic occlusion rate was evaluated immediatelyposttreatment, at 20 minutes, 24 hours, 3, 6, and 12months after treatment.RESULTSInitial total occlusion was acquired in 65% of group A and39% of group B. Digital subtraction angiography 20 minutesdemonstrated increase of total occlusion rate at 89 - 62%respectively. Recanalization was observed in four patients.Clinical follow-up was performed in all patients and angiographicfollow-up in 77%. Technical complications presentedin six cases. No rebleeding cases were registered.354CONCLUSIONIn our experience, HES shows to be safe, feasible and thehydrogel expanded in a predictable way until 20 min.Percentage of occlusion was excellent in group A with notdense packing. More trials and long-term follow-up areneeded.KEY WORDS: Intracranial aneurysm, hydrogel, coilsPoster 117Relationship between Coil Packing Density andHistologic Outcome after Coil Embolization in Elastase-Induced Aneurysm Model: A Retrospective StudyDing, Y. · Dai, D. · Lewis, D. A. · Cloft, H. J. · Kallmes, D.F. · Danielson, M. A. · Ramanathan, K.Mayo ClinicRochester, MNPURPOSEThere exists no histologic data correlating packing densitywith outcome following coil embolization of aneurysms. Wereport a retrospective study comparing histologic outcome inelastase-induced aneurysms in rabbits following dense coilpacking and loose coil packing.MATERIALS & METHODSCoil packing density and histologic healing appearancesafter coil embolization were analyzed in 22 elastase-inducedaneurysms in rabbits. Eleven matched pairs of subjects wereidentified. Each pair had been embolized with similar typesof coils and had been implanted for similar durations.Duration of implantation ranged from 2 weeks to 10 weeksfollowing embolization. Volumetric occlusion percentage(coil packing density) was calculated as (PD = volume ofcoil/volume of aneurysm). We defined dense coil packing asgreater than 30% packing density. The histologic featuresanalyzed included neck coverage on gross inspection andhistologic processing (no membrane, thin membrane, orthick membrane) and histologic findings within theaneurysm cavity (thrombus, loose tissue, or dense connectivetissue with spindle cells). We defined good healing asthe presence of a thick membrane across the neck andabsence of thrombus within the aneurysm cavity. Chi-squaretest were used for the comparison.RESULTSAmong subjects in which dense packing had been achieved,good healing was present in 7 (64%) of 11 cases (Figure 1,hematoxlyin and eosin stain showing thick membrane traversingthe aneurysm neck). Among subjects that had beenloosely packed, 0 of 11 cases showed good healing (Figure2, hematoxlyin and eosin stain showing thin membrane traversingthe aneurysm neck). Good healing was significantlymore frequent in densely packed aneurysms as compared toloosely packed aneurysms (p = .001).
CONCLUSIONPacking density represents an important determinant of histologichealing following coil embolization of experimentalaneurysms.KEY WORDS: Aneurysm, embolization, histology modelThe authors of this work have indicated the following affiliations/disclosures:MicroVention: Shareholder; Researchgrant.Poster 118Buenos Aires Experience with Neuroform TM Self-Expanding Stent for Treatment of IntracranialAneurysmsLylyk, P. 1,2,3 · Miranda, C. 1 · Ferrario, A. 1 · Villasante, F. 11ENERI, Buenos Aires, ARGENTINA, 2 Clínica MédicaBelgrano, Buenos Aires, ARGENTINA, 3 FLENI, BuenosAires, ARGENTINAPURPOSEWe report our experience in intravascular reconstructionwith the Neuroform TM self-expanding stent, assessed thetechnical feasibility, the efficacy of the combined applicationof stent and detachable coils and the follow-up in the managementof complex wide-necked intracranial aneurysms.MATERIALS & METHODSThirty-seven consecutive patients with a wide-neckedintracranial aneurysm were selected for treatment. Thestrategies consistedof: a) stent deployment to cover the neckof the aneurysm without posterior coil embolization, b)combinedapproach with subsequent filling of the sac with coilsthrough the stent and c) coil embolization with further stentplacement. The performance of the device was evaluatedaccording to flexibility, trackability, radiopacity, and delivery.The final angiographic result was graded as optimal orsuboptimal in respect to the stent position if each proximal355and distal tip of the stent was anchored in at least 4 mm ofnormal vessel with total neck control. Clinical and angiographicfollow-up were registered.RESULTSTwenty-one female, 16 male, with 45 aneurysms wereenrolled. Twenty-eight large, 5 giant, 12 small, five patientswith multiple aneurysms. Of the total aneurysms, 40aneurysms were selected for stent placement. SAH 50%,mass effect 30%, incidentals 20%. The aneurysms werelocated at the internal carotidartery (n = 26), posterior circulation(n = 6), MCA (n = 8). The technical success with thestent deployment was acquired in 36 cases. The strategy was:Only stent 21%, stent and coils 55.2%, coils and further stent23.6%. In 2 cases the placement of stent was not possible. Ofthe 37 cases in which the device was implanted, the angiographicresult was optimal in 28 and suboptimal in 9.Technical limitations were registered, especially with themicrodelivery system, in 46% a coil pusher was necessary todeploy the stent. Clinical follow-up was registered in allpatients: functional independence was observed over the75%. Angiographic follow-up was obtained at 3-6 months in50% of the cases. Three cases in which the strategy was stentand coils revealed progressive thrombosis of the sac, neithersubacute thrombosis or any hemorrhagic event were registered.CONCLUSIONIn our clinical experience, the Neuroform microdeliverystent system has demonstrate that it can be manuevered easilyand safely through severely tortuous intracranial vessels,enabling the treatment of complex wide-necked aneurysms.Currently, this device offers a promising therapeutic alternativefor those lesions not amenable to coil embolizationalone in which endovascular reconstruction of the parentvessel is necessary. Technical improvements on delivery systemare mandatory to obtain better results during deploymentphase. More trials and long-term follow-up are needed todefine the precise indications and to determine permanentvessel patency and aneurysm occlusion rate.KEY WORDS: Aneurysms, stents, HSAPoster 119To Evaluate One-Year Experience in the Use of BioactiveCoils in HumansPerlow, A. · Linfante, I. · Wakhloo, A. K.University of MiamiMiami, FLPURPOSEAnimal studies using bioactive (Matrix) coils have shownthe formation of intraaneurysmal connective tissue,increased aneurysm neck tissue thickness, and reducedaneurysm size. The aim of this study is to evaluate theaneurysm contraction when using polymer-coated coils inhumans.MATERIALS & METHODSAs a part of a prospective multicenter study, 11 patients wereenrolled prospectively and treated with bioactive polymercoated Matrix coils. Aneurysms were packed tightly. Follow-Posters
up angiograms were obtained at 3 and 12 months.Measurements of packing density (coil volume/aneurysmvolume), and coil mass were performed at each follow-up.356second, of filling it with helical Micrus microcoils. Resultswere evaluated by univariate analysis. Multivariate analysiswas used to identify independent predictors of these results.PostersRESULTSEleven (9 women, average age 55 years) patients wereenrolled. Nine patients had 3- and 12-month angiograms, 1patient had a 3-month follow-up only and 1 had a 12-monthfollow-up only. Two aneurysms were at the basilar tip, theremainder were of the anterior circulation. Average coilpacking density was 35%. All but 2 patients had unrupturedaneurysms. Two patients experienced vasospasm during theinitial procedure, another had a residual dog ear postinitialcoiling. One patient had coil compaction that required repeatcoiling. Three patients had a residual neck not requiringrepeat treatment. Only one patient had a significant decrease(50%) in aneurysm area over 12-month follow-up, theremainder of the patients had no significant change inaneurysm area (1-8%).CONCLUSIONOnly one patient had contraction of coil mass on follow-up.The remainder of patients’ aneurysms decreased in size of 1-8%. There appears to be no significant advantage in usingMatrix coils to induce aneurysm contraction in humans.KEY WORDS: Aneurysm, polymer-coated coils, matrixThe authors of this work have indicated the following affiliations/disclosures:Boston Scientific/Target Corp.:Consultant.RESULTSAngiographic occlusion was complete in 31 (79%) and 16(70%) aneurysms in groups A and B respectively. Mean percentageof volumic occlusion in these groups was 31.4 and29.5% respectively. Postoperative morbidity rates were 3%and 4% in groups A and B respectively. There was no mortality.Anatomical and clinical results were not significantlydifferent between the two groups. However, percentage ofvolumic occlusion correlated with sac size (P = 0.037), andsac-to-neck ratio < 1.5 (P = 0.073), except when 3 or morethree-dimensional coils per aneurysm were used (P = 0.516,and 0.308 respectively). The better the percentage of volumicocclusion, the better the percentage of angiographicocclusion (P < 0.001). Percentage of volumic occlusion wasan independent predictor of angiographic complete occlusion(P = 0.002). No predictor of postoperative clinicalresults emerged.CONCLUSIONThe use of three-dimensional coils was safe and mayimprove the angiographic and volumic occlusion ofaneurysms with a neck > 4 mm, at the time of treatment, providedthe sac-to-neck ratio was 1.5 or greater, and the largestnumber of three-dimensional coils were positioned first.KEY WORDS: Unruptured aneurysms, 3D coils, endovasculartherapyPoster 120Volumic Occlusion Improvement by 3D Micrus CoilEmbolization of Unruptured Intracanial Aneurysms:Toward an Index Pronostic of Less Risk of AneurysmalRecanalization?Vallée, J. 1 · Pierot, L. 2 · Barragan-Campos, H. M. 1 · Turjman,F. 3 · Bracard, S. 4 · jean, B. 1 · Guillevin, R. 1 · Mont’Alverne,F. 1 · Chiras, J. 11Pitié-Salpétrière Hospital, Paris Cedex 13 , FRANCE,2Hôpital Maison Blanche, Reims, FRANCE, 3 HôpitalNeurologique, Lyon, FRANCE, 4 Hôpital Neurologique,Nancy, FRANCEPURPOSEPercentage of aneurysmal volumic occlusion using coils,particularly when it exceeds 25%, is an index pronostic ofless risk of recanalization. However, wide-neckedaneurysms constitute a persistent challenge for endovasculartherapy. Our purpose was to evaluate the postoperativeaneurysmal occlusion and clinical results of treating unrupturedintracranial aneurysms using three-dimensional coils.MATERIALS & METHODSOver a 2-year period, 62 aneurysms (39 with a neck 4 mm,group A; 23 with a neck > 4 mm, group B) in 62 patients in5 participating centers were consecutively treated. Fortynineaneurysms were small (< 10 mm), and 13 were large(10-24 mm). The procedure consisted, first of framing theaneurysm with one or more spherical Micrus microcoils,Poster 121Angiographic Follow-Up 3-6 Months in Patients Treatedwith Hydrocoils (a New Self-Expanding Coated Coil)Shownkeen, H. · Origitano, T. · Anderson, D. · Craig, E. ·Hall, M.Loyola University Medical CenterMaywood, ILPURPOSEConventional noncoated coils create a higher risk for coilcompaction and aneurysm neck regrowth. We have evaluatedaneurysm neck regrowth/coil compaction in patientstreated with Hydrocoil, as well as the safety and efficacy ofusing Hydrocoils to treat intracranial aneurysms includingwide neck aneurysms.MATERIALS & METHODSTwenty-seven patients with 27 aneurysms were treated withHydrocoils at our institution since October 2002. There were23 anterior circulation and 4 posterior circulation aneurysmswith 9 presenting as subarachnoid bleed. Twenty-one werenew, and 6 had regrowths after previous bare coil treatment.Seven patients were treated with a bridging Neuroform stentdevice, and 4 underwent a balloon remodeling technique.Twenty-three of the 27 aneurysms presented with wide neckshaving a dome/neck ratio < 2 or an absolute neck of 4 mm orgreater.
357RESULTSTechnical success was achieved in all 27 cases, with > 95%occlusion in 25 cases. Two patients had < 90% occlusion atinitial treatment; however, at 6-months follow-up 1aneurysm showed complete thrombosis, while the secondshowed no change in the neck remnant. Sixteen of the 27aneurysms had at least a 3-month follow-up, with noregrowth or coil compaction in any of these cases.CONCLUSIONThe use of Hydrocoils in the treatment of intracranialaneurysms is a viable treatment and may decrease the rate ofrecanalization in cerebral aneurysms including those withwide necks. Complications are low after an initial learningcurve.KEY WORDS: Aneurysm, hydrocoil, endovascularPoster 122Orbital Venous Outflow Patterns and Its Relation to theConjunctival Symptoms in Patients with CavernousSinus Dural FistulasKubo, M. · Kuwayama, N. · Endo, S.Toyama Medical and Pharmaceutical UniversityToyama City, Toyama, JAPANPURPOSETo report the angiographic pattern of the orbital venous outflowbefore endovascular treatment and its relation to theconjunctival symptoms in patients with cavernous sinusdural fistulas (CSDF).MATERIALS & METHODSThirty-one patients with CSDF draining into the orbit wereenrolled. Venous outflow pattern of these patients wasdescribed in detail, being related to their conjunctival symptomsbefore and after endovascular treatment.RESULTSIn 21 of the 31 patients, the superior ophthalmic vein (SOV)and inferior ophthalmic vein (IOV) were patent before treatmentregardless of the flow direction. Conjunctival symptomsof these 21 patients disappeared within 3 weeks aftertreatment. In the remaining 10 patients, SOV and/or IOVwere found to be angiographically thrombosed. Collateralvenous drainage patterns of these 10 patients were classifiedinto 4 groups; I: draining into the frontal vein through theapsidal veins (n = 3), II: draining into the facial vein throughthe apsidal veins (n = 2), III: draining into the pterygoidplexus through IOV via the inferior orbital fissure (n = 1),IV: no angiographic venous collateral routes disclosed (n =4). In all the patients in groups I, II, and III, conjunctivalsymptoms disappeared within 3 weeks, but in the 4 patientsin group IV, conjunctival symptoms persisted for 2-6 monthsafter treatment.CONCLUSIONDetailed evaluation of the angiographic orbital venous collateralsis important and useful to predict the prognosis ofconjunctival symptoms after endovascular treatment.KEY WORDS: Cavernous sinus dural fistula, orbital venouscollaterals, embolizationPoster 123Transarterial Balloon-Assisted N-Butyl-2-CyanoacrylateEmbolization of Direct Carotid Cavernous FistulasLuo, C. B. · Teng, M. M. H. · Chang, F. C. · Lirng, J. F. ·Chang, C. Y.Taipei Veterans General Hospital and National Yang-MingUniversityTaipei, TAIWAN REPUBLIC OF CHINAPURPOSETo present our experience with transarterial balloon-assistedN-butyl-2-cynoacrylate (NBCA) embolization of directcarotid-cavernous fistulas (DCCFs) in which failure toachieve angiographic cure with preservation of parent arteriesby transarterial balloon embolization.MATERIALS & METHODSOver 12 years, 128 out of 156 patients with traumatic DCCFwere managed by transarterial embolization with occlusionof the fistula and parent artery preservation. Of them, 18patients received transarterial balloon-assisted NBCAembolization (TBNE) after detachable balloon(s) and coilsplacement. The indications of TBNE were residual fistulaafter balloon(s) detached (n = 6), recurrent fistula because ofpremature balloon deflation or migration (n = 7) and repeatedpuncture of the detachable balloon by the bony fragmentat the cavernous sinus (n = 5). A total of 27 procedures wasperformed with an average 1.6 attempts per patient and thevolume of NBCA mixture varied from 0.4 to 2.3 ml with amean of 0.83 ml.RESULTSAll DCCFs were occluded successfully by NBCA mixturewith preservation of parent arteries on immediate postembolizationangiography. One patient with a giant CS varixhad a fatal subarachnoid hemorrhage. One patient had arecurrence and was managed by ICA occlusion. Sevenpatients had asymptomatic pseudoaneurysms at the parentartery. No evidence of adhesion of NBCA mixture to the protectiveballoon or microcatheter was observed, nor reflux ofthe NBCA mixtures into the parent arteries was shown. Theclinical follow-up periods were 1 week to 3 years (mean 17months).CONCLUSIONTransarterial balloon-assisted NBCA embolization is a feasible,efficient, and safe treatment for those DCCFs in whichfailure of angiographic cure with ICA preservation by traditionaltransarterial detachable balloon embolization.KEY WORDS: Direct carotid-cavernous fistula, embolization,n-butyl-2-cyanoacrylatePosters
PostersPoster 124Dural Arteriovenous Fistula of the Cavernous Sinus withRetrograde Cerebellar-Pontine Venous Drainage: Reportof Two Cases and Literature ReviewUchida, D. 1 · Sagara, Y. 2 · Kiyosue, H. 1 · Okahara, M. 1 · Hori,Y. 2 · Matsumoto, S. 1 · Mori, H. 11Oita University Faculty of Medicine, Oita, JAPAN,2Nagatomi Neurosurgical Hospital, Oita, JAPANPURPOSEDural arteriovenous fistulas (DAVFs) with retrograde cerebellar-pontinevenous drainage (RCVD) have a high risk ofaggressive symptom, such as intracranial hemorrhage andcentral nervous palsy, majority of which locate at transversesigmoidsinus or tentorium. We present two rare cases ofcavernous sinus (CS) DAVF with RCVD which were treatedsuccessfully by transvenous embolization (TVE), and discusstheir clinical symptoms, drainage routes, and treatmentswith literature review.MATERIALS & METHODSCase 1 was an 81-year-old woman with ocular symptoms for7 months. Case 2 was a 69-year-old woman with right ocularsymptoms and trigeminal pain gradually deteriorated for6 months. Diagnostic imaging included postcontrast CT, MRimaging, and angiography in both cases. We also reviewedcases with cavernous DAVF with RCVD published between1970 and 2003.358treated by TVE and one case treated by combined TAE andirradiation cured. Two cases treated by TAE alone werecured incompletely.CONCLUSIONAlthough CSDAVFs can be treated conservatively based ontheir nonagressive drainage pattern, careful attention shouldbe paid that CSDAVFs could be associated with RCVD withthrombosis/restriction of the main outlet of the CS.Dilatation of cerebellar veins or the petrosal vein on MR orCT images suggests RCVD which requires more aggressivetreatment.KEY WORDS: Cavernous sinus dural arteriovenous fistula,retrograde cerebellar-pontine drainage, endovascular treatmentPoster 125Hemodynamic Status and Treatment of Aggressive DuralArteriovenous FistulasKuwayama, N.Toyama Medical and Pharmaceutical UniversityToyama, JAPANPURPOSETo evaluate the hemodynamic status and treatment modalityof aggressive dural arteriovenous fistulas (dAVFs).RESULTSCase 1: Postcontrast CT showed mild dilatation of the rightsuperior orbital vein (SOV) and left cerebellar cortical veins.On MR images abnormal flow voids were noted in the rightcavernous sinus, the left superior petrosal sinus (SPS), andthe left petrosal vein. Cerebral angiography showed a DAVFof the left cavernous sinus and intercavernous sinus. TheSPS and inferior petrosal sinus (IPS) were occluded and theDAVF drained mainly into the left cerebellar veins throughthe petrosal vein. Another drainage route to the right SOVthrough the posterior intercavernous sinus also wasobserved. The left vertebral angiogram showed venous congestionof left posterior fossa. Case 2: Axial T2-weightedMR images showed a dilated right SOV and abnormal flowvoids in the right cavernous sinus. Postcontrast CT revealeddilatation of the right SOV and cerebellar cortical veins.Cerebral angiography showed DAVF of the right cavernoussinus with reflux to right SOV. The SPS and IPS wereoccluded and the DAVF drained mainly into the right cerebellarveins through the petrosal vein. The left vertebralangiogram showed venous congestion of right posteriorfossa. Treatment: The both patients were treated by TVEthrough the occluded IPS with detachable coils. The DAVFswere occluded completely. The symptoms improved andvenous congestion of posterior fossa disappeared at followupin both patients. From literature review, 5 cases ofCSDAVF with RCVD were encountered. All seven patients,including 5 cases previously reported and present cases, hadocular symptoms and 4 patients showed aggressive symptomsincluding one cerebellar hemorrhage. Commondrainage veins of RCVD included the petrosal vein and thelateral mesencephalic vein. All patients were treated by TVE(n = 4), transarterial embolization (TAE) with particles (n =2), or combined TAE and irradiation (n = 1). All 4 DAVFMATERIALS & METHODSOf 135 dAVFs which were treated in our clinic, there were35 aggressive lesions which presented with hemorrhage,infarction, convulsion, and symptoms of increased intracranialpressure. They included 3 (5% of all cavernous sinuslesions) cavernous sinus, 22 (42%) transverse-sigmoid andsuperior sagittal sinuses, and 10 (48%) direct cortical typedAVFs.RESULTSOf these 35 aggressive lesions, the retrograde leptomeningealvenous drainage was disclosed in 32 lesions,and the retrograde sinus drainage in 3. Fifteen cases weretreated only with endovascular procedures, 6 with surgicalintervention, and 14 with combined endovascular and surgicalprocedures. Angiographic results were complete obliterationin 74% of the cases, subtotal and partial obliteration in26%. Clinical outcome was GR in 63% of the cases, MD in11%, SD in 11%, VS in 11%, and D (acute cardiac infarction)in 3%. Symptomatic procedural complication occurredin 2 cases.CONCLUSIONAggressive dural AVF resulted from retrograde leptomeningealvenous drainage. Combined surgical andendovascular treatment played the leading part in the managementof this aggressive lesion.KEY WORDS: Dural arteriovenous fistula, endovasculartreatment
Poster 126Spinal Cord Arteriovenous Malformation Associatedwith Feeding Artery, Intranidal and Renal ArteryAneurysms in a Case with “Hypermobile JointSyndrome”Garg, A. · Gupta, V. · Mishra, N. K. · Gaikwad, S. G. ·Chugh, M.All India Institute of Medical SciencesNew Delhi, INDIA359PostersPURPOSESpinal cord arteriovenous malformations (SCAVMs) rarelyhave been reported in association with disorders such as neurofibromatosisand Renu-Osler-Weber syndrome. We reporta case of SCAVM associated with connective tissue disorder- “benign hypermobile joint syndrome.” This association hasnot been reported in the literature previously.MATERIALS & METHODSRetrospective review of a case of SCAVM associated withconnective tissue disorder - “benign hypermobile joint syndrome”- was performed, including result of endovascularembolization of one of the aneurysms. The clinical and radiologicdetails including the follow-up imaging were studied.RESULTSAn 18-year-old male presented with history of pain in lowerback radiating to right lower limb since 6 years. He complainedof slowly progressive weakness and numbness inright leg and foot since 1 year with power being 4/5 at hip,knee, and ankle. He also was found to have hypermobilejoints, thin sclera, varicose vein in right lower limb, anemia,and pansystolic murmur in mitral and aortic regions.Echocardiography showed dilatation of left ventricle and leftatrium along with floppy mitral valve. On basis of these features,a connective tissue disorder was suspected, and diagnosisof “Benign hypermobile joint syndrome” was made.MR imaging showed an intramedullary AVM at D11-D12level. MR imaging of brain was normal. Digital subtractionangiography (DSA) showed a intramedullary SCAVM atD11 - D12 level with main feeder from radiculopial branchof right 2nd lumbar artery and smaller feeder from radiculopialbranch from left 10th intercostal artery and radiculomedullaryartery arising from left 5th intercostal artery.Multiple aneurysms in the feeding artery and in the niduswere seen along with aneurysmal dilatation of the drainingvein. He also was found to have multiple aneurysms in renalartery branches bilaterally. Focal dilatation of right renalvein and diffuse dilatation of IVC also were noticed.Embolization of the AVM was done through right secondlumbar artery. Microcatheter injection showed jet of contrastapparently into the subarachnoid space. Rupture of AVMwas suspected and the nidus was embolized immediatelywith glue (Histoacryl). Postembolization angiogram showedcomplete occlusion of the feeder. Postoperative course wasuneventful with no new symptoms. Postoperative CT andMR imaging showed evidence of glue in the nidus with noobvious hematoma in the cord. CT head was also normal.CONCLUSIONRarely connective tissue disorder such as “benign hypermobilesyndrome” may be associated with SCAVM. This particularassociation should be looked for in cases withSCAVM associated with multiple aneurysms, or if associatedaneurysms are found in vascular system outside the CNS.Endovascular intervention in such cases should be undertakenwith precaution because of increased fragility of the bloodvessels.KEY WORDS: Spinal cord arteriovenous malformation,benign hypermobile syndrome, nidus rupturePoster 127Comparison of Radiosurgical Treatment Outcomes inEmbolized and Nonembolized AVMs: A Propensity ScoreApproachBurton, K. R. 1 · Tomlinson, G. 2 · Wallace, C. 3 · Schwartz, M. 41University of Toronto, Toronto, ON, CANADA, 2 TorontoGeneral Hospital, Toronto, ON, CANADA, 3 TorontoWestern Hospital, Toronto, ON, CANADA, 4 Sunnybrook &Women’s College Hospital, Toronto, ON, CANADAPURPOSEStereotactic radiosurgery is a desirable and effective treatmentoption for patients with AVMs; however it is not freefrom significant morbidity and mortality upon treatment failure.Given the range of treatment options available to AVMpatients (endovascular embolization, surgical resection,radiosurgery, or a multimodal combination of them), it isessential that the risks and factors associated with treatmentfailure be exposed. To do so helps ensure that radiosurgeryand the multimodal treatment of embolization and radiosurgeryare prescribed in the most advantageous contextsand safest manner.Withdrawn
360PostersMATERIALS & METHODSA retrospective cohort analysis of 200 patients who receivedstereotactic radiosurgery [linear accelerator (LINAC)] treatmentat the Toronto Sunnybrook Regional Cancer Centre(TSRCC)—one of the largest data bases of arteriovenousmalformation patients in North America—between 1989 and2001. Survival analysis (with AVM hemorrhage as the outcomeof interest) for radiosurgically and multimodally treatedAVMs is being performed using a propensity scoremethod to permit comparisons between treatment quintiles.RESULTSOur hypothesis is that multimodal endovascular embolizationand radiosurgery treatment is more successful thanradiosurgery alone in the treatment of cerebral AVMs.WithdrawnCONCLUSIONFinal results will be available shortly, and for inclusion in theposter presentation at <strong>ASNR</strong> <strong>2004</strong>.KEY WORDS: Arteriovenous malformation, radiosurgery,embolizationPoster 128Complete Obliteration of Dural ArteriovenousMalformations with OnyxNahser, H. C. · Niven, S. · Nixon, T. · Foy, P. · Shaw, D.The Walton Centre for Neurology and NeurosurgeryLiverpool, UNITED KINGDOMPURPOSETo describe a possible endovascular treatment of dural arteriovenousmalformations (DAVMs) at the falx and tentorium.MATERIALS & METHODSDural arteriovenous fistulae at the falx and dorsal tentoriumdrain into cortical veins exclusively and their most commonmode of presentation is hemorrhage. As they have collateralizingsupply their treatment is an endovascular challenge.A transvenous approach is impossible in most cases in thisanatomy and obliteration via an transarterial embolizationwith particles or glue usually is not achieved so that then surgeryhas to be instituted. We observed two patients withdural arteriovenous fistulae (DAVFs) at these locations inwhom with a single step embolization after microcatheterizationof the dominating feeding artery with Onyx was performedto occlude the fistula.RESULTSIn both cases complete obliteration of the fistula was documented.The mode of the penetration of the Onyx into thefistulous nidus suggests that the cavernous spaces in the duramater as described by Rowbothom and Little (1), which playan important role in the discussion of the pathogenesis ofDAVF, may exist.CONCLUSIONOnyx offers the possibility to completely obliterate anatomicallycomplex multiarterialized dural AVMs by a singlefeeder embolization.REFERENCES1. Rowbothom GF, Little E. Brit J Surg 1965;52:8-20KEY WORDS: Onyx, DAVFThe authors of this work have indicated the following affiliations/disclosures:1. MTI: Consultant/Proctor; 2. BostonScientific: Proctor.Poster 129Ex-Vivo Studies of the Neuroform Stent UsingTransparent Human Intracranial ArteriesHsu, S. 1 · Chaloupka, J. 1 · Cassell, M. 2 · Lee, S. 11University of Iowa Hospitals and Clinics, Iowa City, IA,2University of Iowa, Iowa City, IAPURPOSEAlthough increasing clinical experience has been gainedwith the Neuroform (NF) micro-stent over the past year, avariety of technical problems have been encountered withpositioning and deployment that are difficult to resolve,owing to the radiolucency of the majority of the stent.Therefore, the purpose of this study was to attempt to betterassess the behavior of the NF by direct visualization withinactual human intracranial (IC) arteries using an adaptation ofa novel method of creating transparency of the harvestedvessels.MATERIALS & METHODSSeven segmental human cadaveric intracranial arteries wereobtained from the gross anatomy laboratory. Long arterialsegments were dissected from the brain, including the cavernoussegment of internal carotid artery (ICA), distal ICA tomiddle cerebral artery (MCA), distal ICA to anterior cerebralartery (ACA), vertebrobasilar junction (VBA), basilar arterialtrunk (BA), and BA to posterior cerebral artery (PCA).Neuroform 2 (NF2) stents were either sized appropriately oroversized, and deployed into one of the above arterial segments,using the push-pull techniques commonly used inclinical applications. The harvested arterial segments weretreated with standard dehydration techniques followed byimmersion into Wintergreen Oil (Methyl Salicylate). Stentdeployment, conformity, cell configuration, and scaffoldingwere evaluated by digital photography in multiple views.Assessment of the morphologic situation in different arterialsegments, the interphase of stent and arterial wall, and relationshipof stent with side branches were studied.RESULTSNF2 stents have an open cell, segmental connection of azigzag Nitiol rings, in which each segment has only two connectionpoints with adjacent segments with 90 o differences.Preliminary results showed that the NF2 overall exhibitedvery good conformity to the stented arterial segment whensized appropriately. However, a few important potentiallyadverse properties were seen as follows: 1) deployment intolarger curvatures resulted in lack of attachment of the stent
ends to the arterial wall, 2) portions of the crown may protrudeinto the side branches when the size of the stent is largerthan the parent vessel and the connection point of stent isnot at the interface of the parent artery and/or side branchorifice, 3) the gap in between stent crowns could be considerablylarger than expected in the segments with acute orabrupt angulation, and 4) the radial force exerted by the NFcould straighten some arterial segments, particular thosewith very acute angulation.CONCLUSIONTransparent human IC arterial segments are excellent modelsfor evaluating certain important physical properties andbehavior of radiolucent stents such as the NF2. Our preliminarystudies already reveal several important findings.Proper sizing is appears to be particularly important forensuring good stent conformity within the arterial segments,particularly when significant curvature is encountered.Conversely, NF2 deployment in segments/branches of acuteangulation can be problematic, potentially resulting in excessivegaps in between segments that likely will not provideadequate scaffolding for containing coils within ananeurysm.KEY WORDS: Neuroform stent, aneurysms, transparentartery modelPoster 130Three-Dimensional Cerebral Angiography: RadiationDose Comparison with Digital Subtraction AngiographySchueler, B. · Kallmes, D. · Cloft, H. J.Mayo ClinicRochester, MN361and magnitude of the peak skin dose, as a measure of deterministiceffects risk, and the cumulative dose, as a measureof stochastic radiation risk.MATERIALS & METHODSTo acquire images for 3D RA, the frontal C-arm of anangiography system (Neurostar Plus, Siemens) was rotatedin a 200 degree arc with the x-ray tube traveling under thepatient table. A total of 162 images in the 30 cm image intensifier(II) field-of-view (FOV) were acquired in two rotationalarcs for contrast and mask images. For the biplaneDSA acquisition, the following technique parameters wereused to characterize a typical DSA run: 22 cm II FOV and 18frames for both frontal and lateral projections, 20 degreescranial angulation for the frontal C-arm. The distribution ofthe entrance skin dose was measured with direct exposurefilm (XV-2 Ready-Pak, Eastman Kodak) wrapped around thesurface of an anthropomorphic skull phantom (Aldersonangiographic head phantom, Cone Instruments). Once thelocation of the peak skin dose was determined, the dose wasmeasured there using a skin dose monitor (SDM Model 104-101, McMahon Medical) that was calibrated with an externalionization chamber. The cumulative dose, summed overall images in each acquisition, was measured using theangiography unit’s integrated dosimetry system. This systemcalculates air kerma at the reference distance of 60 cm fromthe X-ray source by measuring the dose-area-product anddividing by the exposure entrance port at that distance asdetermined by the collimator positions. The air kerma valuewas calibrated and corrected to account for table and padattenuation and the actual source-skin distance.RESULTSThe skin dose distribution for a 3D RA acquisition wasspread uniformly around the back and sides of the head. Thepeak skin dose, located at the back of the skull, was 15 mGy.For a biplane DSA run, the peak skin dose was 58 mGy, alsolocated at the back of the skull. The skin dose for the lateralprojection was 17 mGy. The cumulative dose for a 3D RAacquisition was 34 mGy, compared to the biplane DSA runcumulative dose of 53 mGy.CONCLUSIONThough 3D RA requires the acquisition of many moreimages than a typical biplane DSA run, the patient radiationdose for 3D RA is considerably lower: nearly a factor of fourlower in peak skin dose and 40% lower in cumulative dose.Note that acquisition of only the contrast rotational arc for3D reconstruction of unsubtracted images will reduce 3DRA doses by an additional factor of two. There is a potentialfor significant patient radiation dose savings if 3D RA acquisitionsare substituted for one or more biplane DSA runs duringinterventional neuroradiology procedures.KEY WORDS: Three-dimensional angiography, radiationdose, digital subtraction angiographyPostersPURPOSETo evaluate patient radiation dose associated with threedimensionalrotational angiography (3D RA) of the head, ascompared with biplane digital subtraction angiography(DSA). This evaluation includes assessment of the location
362Poster 131Poster 132Emergency Carotid Stenting for Acute Ischemic Stroke Evaluating the Use of Specific Absorption Rate as aPatients: A Clinical Pilot StudyDosimeter of MR Imaging-Related Implant HeatingPostersImai, K. · Mori, T. · Izumoto, H. · Watanabe, M.Shonan Kamakura General HospitalKamakura, JAPANPURPOSEIt remains unclear how to treat patients with symptoms-relatedtotal occlusion or a high-grade stenosis of the internalcarotid artery (ICA) in acute stroke stage. The purpose of ourstudy was to investigate the feasibility, safety, and efficacyof emergency carotid stenting (ECS) for symptomatic ICAlesions in acute ischemic stroke patients within 7 days of theonset.MATERIALS & METHODSA nonrandomized clinical pilot study was conducted.Inclusion criteria of the study were 1) patients admittedbetween July 2000 and June 2003, 2) serious neurologicsymptoms defined as National Institutes of Health StrokeScale (NIHSS) score of 5 or more, 3) total occlusion or ahigh-grade stenosis (> = 70% measured by NASCETmethod) of the ICA associated with symptoms, and 4)decrease of cerebral blood flow demonstrated by perfusionweightedMR images or single photon emission computedtomography scans ipsilateral to the ICA lesion. Exclusioncriteria were a large infarction with high-signal intensitydetected by means of diffusion-weighted MR images andpatients with contraindication of arteriography. Primary endpointswere the NIHSS at 7 days and the modified Rankinscale (mRS) at 3 months after the procedure. Secondary endpointswere procedure-related complications, restenosis,recurrence of any strokes, and any death.RESULTSEmergency carotid stenting was performed in 17 (male 13,mean age 69.9 +/- 13.4) of 896 acute ischemic patients(1.9%). The mean elapsed time from onset to ECS was 56.3+/- 57.6 hours. The mean degree of ICA stenosis was 96.0+/- 6.5% involving 4 lesions of total occlusion, and there wasa technical success of 100% with 17 carotid arteries treated,in which balloon-expandable stents were used for 11 arteries.The median NIHSS score at 7 days improved significantly incomparison with that on admission (5, 9, respectively; P
363CONCLUSIONThe findings revealed marked differences across two MRsystems in the level of RF-induced temperature changes perunit of whole body SAR for a conductive implant. Thus,these data suggest that using SAR to guide MR safety recommendationsfor neurostimulation systems or other similarimplants across different MR systems is unreliable and,therefore, potentially dangerous. Better, more universal,measures are required in order to ensure patient safety.KEY WORDS: Heating, specific absorption rate, MR imagingPoster 133Short-Term Clinical Outcome Following EndovascularTreatment for Intractable Long-Segmental TotalOcclusion of the Vertebrobasilar Artery in AcuteIschemic Stroke PatientsMori, T. · Izumoto, H. · Imai, K. · Watanabe, M.Shonan Kamakura General HospitalKamakura, JAPANPURPOSEClinical outcome of acute stroke patients with serious neurologicsymptoms due to long-segmental total occlusion (LTO)of the vertebrobasilar artery (VBA), in which no VBAs aredisplayed in MR angiograms, is usually poor and LTO of theVBA looks intractable. Endovascular treatment (ET) such asintraarterial fibrinolysis, cerebral balloon angioplasty(CBA), cerebral artery stenting (CAS), or their combinationfor recanalization of LTO is promising, however, the effectiveness,safety, and clinical outcome of ET for LTO of theVBA remain unknown. The aim of the study is to investigateretrospectively short-term clinical outcome following ET forLTO of the VBA in acute ischemic stroke patients.MATERIALS & METHODSBetween April 2000 and June 2003, consecutive 1091ischemic stroke patients were admitted to the authors’ institutionwithin 48 hours of stroke onset. Among them, 6patients with the median NIHSS of 20 (10-36) due to LTO ofthe VBA underwent ET on the admission day in an acutestroke stage. Their median age was 74 years (57-77 years).Three patients underwent CAS and other three patients weretreated with combination of CBA and intraarterial urokinase(IA-UK). They had no premedication of antiplatelets.NIHSS score 7 days after the onset (NIHSS-7) and modifiedRankin scale (mRS) on their discharge day were evaluated.RESULTSComplete recanalization was achieved immediately afterCBA or CAS in all patients. Median duration of in-hospitalizationwas 20 days (13-51). Median NIHSS-7 score was 14(4-32) and median mRS was 5 (3-6). There looked a differencebetween NIHSS score on admission and NIHSS-7,however, median mRS was not good. In 3 patients whounderwent CAS, reocclusion occurred within 7 days andNIHSS-7 (median: 31) was not improved and their mRS was5 or 6. In contrast, the VBA remained open 7 days after ETin 3 patients who underwent combination therapy of CBAand IA-UK and their NIHSS-7 (median 10) was better andmRS was 3 or 5.CONCLUSIONEndovascular treatment can recanalize LTO of the VBAlooking intractable. However, reocclusion may occur within7 days following emergency CAS without premedication ofantiplatelets and make their clinical outcome worse. If earlyreocclusion is prevented, clinical outcome can be improvedeven in acute stroke patients presenting serious neurologicalsymptoms due to LTO of the VBA.REFERENCES1. Mori T, Kazita K, Seike M, Nojima Y, Mori K. SuccessfulCerebral Artery Stent Placement for Total Occlusion of theVertebro-Basilar Artery in a Patient Suffering from AcuteStroke. J Neurosurg 1999;90: 955-9582 Mori T, Imai K, Izumoto H, Kamiya T, Watanabe M. Short-Term Clinical Outcome after Cerebral Balloon Angioplastyor Stenting for Vertebro-Basilar Artery Occlusive Lesions inAcute Stroke Patients. Circulation 2003;107:e131KEY WORDS: Vertebrobasilar artery, stent, angioplastyPoster 134Interventional MR Imaging with an Endospinal ImagingCoil: Preliminary Results with Anatomical Imaging ofthe Canine and Cadaver Spinal CordRappard, G. 1 · Metzger, G. J. 2 · Weatherall, P. T. 1 · Purdy, P.D. 11University of Texas Southwestern Medical Center, Dallas,TX, 2 Philips Medical Systems, Bethesda, MDPURPOSETo determine the feasibility of endospinal MR imaging andcompare signal-to-noise ratio (SNR) with that obtained by anoptimal external surface coil.MATERIALS & METHODSA human cadaver subject was obtained via an institutionalwilled body program. A live canine subject was obtained followingapproval from the Institutional Animal Care andResearch Advisory Committee. In both subjects, X-ray-guidedpercutaneous access to the spinal subarachnoid space wasobtained using a micropuncture set and vascular sheath. A100 cm length, .032 inch diameter looplessantenna/guidewire (Intercept vascular coil; Surgi-Vision,Inc., Gaithersburg, MD) then was advanced to the T4 level.Imaging was performed on a 1.5 T system with 33 mT/mgradient coils. Several sequences were evaluated forendospinal imaging (Table 1). Images obtained with theendospinal coil were compared with images obtained from alinear surface coil. Signal-to-noise ratio was determined forthe thoracic spinal cord using both techniques. The SNR wascalculated as follows: Mean tissue signal /Standard Deviation noise .Posters
PostersRESULTSResults comparing SNR in the thoracic spinal cord for thetwo coils are shown in Table 2. Using a fast spin-echo (FSE)T2 sequence SNR gain with the endospinal coil varied from193.37% to 164.22%. Using a steady state free precession(SSFP) sequence a 91.58% SNR gain was seen with theendospinal coil. Using the endospinal coil, high-resolution(0.23 mm x 0.23 mm x 3 mm) FSE T2-weighted images ofthe canine thoracic spinal cord were obtained with an SNRof 18.03 (Figure).Table 1Sequence parameters used in anatomic endospinal imagingType NSA TR TE Flip TSE % Slice FOV RFOV SR(ms) (ms) Angle Factor Scan (mm) (mm)TSE 1 4000 100 90 12 70 3 6 70 0.23 x 0.23TSE 1 4055.8 100 90 14 70 5 10 80 0.39 x 0.39TSE 1 1150 110 90 35 90 3 16 80 0.62 x 0.62SSFP 3 3.7 1.85 55 NA 50 15 25 75 0.98 x 0.98Table 2Comparison of SNR obtained with surface and endospinal coilsTSE 0.62 mm x TSE 0.39 mm x SSFP0.62 mm SR 0.39 mm SRSurface coil 22.46 13.5 69.23Endospinal coil 65.89 35.67 132.63% SNR gain 193.37 164.22 91.58364Poster 135Endovascular Management of Carotid BlowoutSyndrome: Lessons LearnedHacein-Bey, L. · Ulmer, J. L. · Harlin, D. C. · Wong, S. J. ·Nalwa, S. S. · Campbell, B. H. · Lemke, D. M. · Daniels, D.L. · Wackym, P. A.Medical College of WisconsinMilwaukee, WIPURPOSECarotid blowout syndrome refers to an acute, life-threateningtransoral or cervical hemorrhage attributable to thecarotid artery system (1). Although carotid blowouts obviouslymay be related to trauma to the neck, they occur mostcommonly in patients with head and neck squamous cell carcinoma.Known predisposing factors are: 1) previous radicalneck dissection, 2) previous radiation therapy to the neck, 3)the presence of infection with or without a fistula, 4) cancerrecurrence surrounding the carotid artery or its branches.Although previously thought to involve primarily the internalcarotid artery (ICA), it now is recognized that the responsibleartery is commonly the external carotid artery (ECA) orone of its branches (2). Endovascular treatment often used toinvolve internal carotid sacrifice (3) but with the advent ofstents, sparing of the vessel should become the rule.MATERIALS & METHODSWe retrospectively reviewed all carotid blowout syndromestreated at our institution in the past 3 years. A total of 20 procedureswere performed in 18 patients. In 13 patients, carotidblowout was secondary to head and neck cancer and in 5 totrauma (4 due to gunshots, one due to a stab injury). In twopatients with cancer, embolization had to be repeated forsuccessful control of hemorrhage, in one using a carotidstent.CONCLUSIONWe are able to demonstrate the acquisition of high SNR andhigh-resolution anatomical images of the spinal cord utilizingan endospinal coil. Endospinal MR imaging represents aunique potential opportunity for neurointerventional MRimaging, especially when one considers that the endospinalcoil also may serve as a guidewire during spinal procedures.While our initial results are promising, future work isrequired in order to determine threshold resolution, contrastand SNR needed to detect various pathologies of the spinalcord, as well as the applicability of advanced MR methods toendospinal MR imaging. This will be the focus of futureinvestigation.KEY WORDS: Interventional, MR imaging, endospinalRESULTSIn all patients, endovascular management resulted in controlof the hemorrhage. There were no neurologic complicationsin any of the patients. In 5 trauma patients, external carotidartery embolization was sufficient in 4, while one patientwith a stab wound to the cheek had to be treated with a combinationof stent and coils. Out of 13 patients with cancer, 7were treated with a combination of ICA stenting and ECAcoiling, while 6 were treated with ECA particulate and coilembolization. Despite the fact that neither antiplatelet agentsnor heparin were used, none of these patients experienced astroke. No recurrence of hemorrhage was observed.CONCLUSIONThe management of carotid blowout syndrome remains achallenge. This data supports the concept that common orinternal carotid artery sacrifice should become distinctlyunusual as experience with carotid stenting develops.Successful control of hemorrhage commonly requires a carefuland planned combination of stenting to protect the ICAand ECA coil obliteration. Thrombo-embolic risks in relationto the use of stents are minimal with proper technique.The authors of this work have indicated the following affiliations/disclosure:Philips Medical Systems: Employee
REFERENCES1. Chaloupka JC, Putman CM, Citardi MJ, Ross DA, Sasaki CT.Endovascular Therapy for the Carotid Blowout Syndrome inHead and Neck Surgical Patients: Diagnostic andManagerial Considerations. AJNR Am J Neuroradiol1996;17(5):843-8522. Pile-Spellman J, Sanchez R, Chin J, Joseph M. Carotid ArteryBlowouts: Importance of External Carotid Artery Sourcesand Endovascular Treatment. Abstract # 291, p 291, <strong>ASNR</strong>28 th Annual Meeting, Los Angeles, CA, March 19903. Levy EI, Horowitz MB, Koebbe C, Jungreis CC. Target-Specific Multimodality Endovascular Management ofCarotid Artery Blowout Syndrome. Ear Nose Throat J2002;81(2):115-183KEY WORDS: Carotid blowout syndrome, endovascularmanagement, stentThe authors of this work have indicated that they will be discussing/presentingan unapproved/investigative use of acarotid stent made by Cordis/Johnson & Johnson.Poster 136Preliminary Experience and Early Follow-Up UsingMatrix Coils at the Montreal Neurological HospitalTampieri, D. 1,2 · Linnell, G. 1 · Melanson, D. 11Montreal Neurological Hospital, Montreal, PQ, CANADA,2McGill University, Montreal, PQ, CANADAPURPOSEThe Matrix coils have been available recently for the treatmentof intracranial aneurysms. We report our preliminaryexperience in the use of Matrix coils in combination withUltrasoft GDC and occasionally Neuroform stent.MATERIALS & METHODSSince June 2003 we have used Matrix coils as a primary coilfor the treatment of intracranial aneurysms. Twenty patientshave been treated. Thirteen patients presented as acute subarachnoidhemorrhage; two patients had recanalization ofpreviously treated aneurysms with GDC. One case was agiant internal carotid artery aneurysm which had failed testballoon occlusion of the carotid before and following IC-ECby pass. In four cases due to the large neck of the lesionNeuroform stents were used also. All the patients who hadacute subarachnoid hemorrhage underwent a 3-months controlangiogram. The next control angiogram will be performedat 6 months in all patients.RESULTSThe different types of Matrix coil have been used in ourseries. No difference in the advancement or deployment ofthe coil was observed when compared with the regular GDC.The Matrix coils must be immersed in sterile saline solutionfor at least 30 seconds prior to delivery in the microcatheterto avoid friction that could potentially damage the PGLAcoating of the coil itself. We did not experience any coildamage or unraveling. The detachment time was within normallimits when compared with regular GDC. A good packingof the aneurysm fundus was obtained in 19 cases. Thegiant internal carotid aneurysm was voluntarily under365packed to prevent flow impairment in the dominant carotidartery itself. There was no aneurysms rupture or perforationdue to the Matrix. The 3-month control angiograms revealeda stability of the coiled aneurysms in all cases. No recanalizationrequiring further treatment was noted. The 6-monthangiographic results are pending. No embolic complicationoccurred.CONCLUSIONIn spite of these being very preliminary results it seems thatthe Matrix coil is safe and feasible in the treatment ofintracranial aneurysms. There is no major difference in thetechnique of deployment when compared with GDC coils.The preliminary results of the angiographic controls are veryencouraging. In the case Neuroform stent was used in combinationwith the Matrix no problem was encountered. Whilewe are awaiting the results of the 6-month angiogram follow-up,which will be available at the time of the <strong>ASNR</strong>Meeting in San Diego, we are under the impression thatMatrix coil is safe and efficient in the treatment of intracranialaneurysm.KEY WORDS: Aneurysm, coilsPoster 137Experimental Model of Subarachnoid Hemorrhage forCombined Angiography/MR ResearchTurski, P. · Turk, Q. · Aagaard-Kienitz, B. · Niemann, D.University of WisconsinMadison, WIPURPOSETo develop a canine model of hyperacute subarachnoid hemorrhage.MATERIALS & METHODSUnder an approved animal subjects protocol, four anesthetizedcanines underwent MR imaging (T1, T2 FLAIR)followed by transfemoral catheterization of the basilar arteryusing an Excel Tracker 14 microcatheter. A baseline DSAwas obtained of the vertebrobasilar system. The distal 19 cmof an Agility 14 guidewire was cut off to produce a relativelystiff distal segment capable of puncturing the arterial wall.Intravenous heparin (2000 units) was administered andunder fluoroscopic guidance the guidewire was advanced 1cm through the distal basilar artery wall. The DSA wasrepeated and the animals were returned to the MR scannerfor imaging. Following the second MR exam the animalswere euthanized and a limited necropsy performed.RESULTSThe post puncture DSA images revealed immediate extravasationof contrast in three animals. One animal requiredintraarterial verapamil (3 mg) to relieve arterial spasm at thepuncture site. SAH was confirmed in 3/4 animals by FLAIRimaging and by necropsy. In one animal there was no identifiableSAH on imaging and minimal SAH at necropsy.Posters
MATERIALS & METHODSThe head and spine were obtained in continuity from anembalmed male cadaver. The head and spine subsequentlywere encased in a low expansile foam. The model then wasbrought to our research angiography suite and placed in theprone position. A 7.5 F steerable endoscope was placed inthe subarachnoid space and advanced caudally in the cadavericmodel under both endoscopic and fluoroscopic guidance.Endoscopic images were captured using a digital framestorage apparatus. The endoscope was advanced into the ter-366minal thecal sac and nerve roots were imaged. Using thesteerable feature of the endoscope, lateralization of visualizationwas enhanced.PostersFigure: Sagittal FLAIR image following experimental subarachnoidhemorrhage. Note the high signal intensity ventralto the pons and surrounding the upper cervical cord.CONCLUSIONEndovascular transarterial pucture of the basilar tip is aviable method to produce hyperacute SAH. Vasospasm followingpuncture may limit severely the volume of SAH. Ingeneral the size of the vascular structures and volume ofSAH are suitable for XMR research.KEY WORDS: Subarachnoid hemorrhage, experimental, MRimagingRESULTSReal-time endoscopic and digital radiographic images of thesacral nerve roots and bony relationships with the endoscopewere obtained. Identification of the nerve roots was determinedby both the spinal position of the endoscope and byplacement of a 0.035” guidewire through the foramenthrough which the nerve root exited (Figure 1 - endoscope atright S2 root with a guidewire traversing through the right S2foramen). The nerve roots were visualized both as theycoursed caudally and as they exited the thecal sac (Figure 2 -endoscopic image of the right S2 root exiting the thecal sac).By placement of the endoscope in the terminal thecal sac, theS4, S5, and coccygeal nerves could be identified bilaterally aswell. Steerability of the endoscope was found to enhancevisualization but degrees of flexibility were suboptimal.Poster 138Visualization of Sacral Nerve Roots via PercutaneousIntraspinal NavigationGiles, B. P. · Tsai, J. G. · Replogle, R. E. · Miller, S. L. ·Purdy, P. D.The University of Texas Southwestern Medical CenterDallas, TXPURPOSENumerous conditions, including sacral neuralgia, pelvicfloor dysfunction, and neurogenic bladder are related tosacral nerve root pathology. Surgical approach to these structurescurrently involves open surgery, including removal ofvarying amounts of spinal bone. A minimally invasive techniquefor visualizing the sacral nerve roots via percutaneousintraspinal navigation (PIN)(1) is described. This techniqueprovides rapid, minimally invasive access to the sacral nerveroots and may enable both diagnostic and therapeuticapproaches to these structures without bony removal.CONCLUSIONAccessing the sacral nerve roots via the PIN technique istechnically feasible and straightforward. Using a combinationof fluoroscopy and endoscopy, nerve roots can be seenand identified. This approach thus may offer an alternative toopen surgical exposure for either diagnostic or therapeuticpurposes. Technical developments including greater endoscopeflexibility and control and devices for use via theworking lumen are needed. Safety and efficacy also must beestablished.REFERENCES1. Purdy PD, Replogle RE, Pride GL Jr, Adams C, Miller S,Samson D. Percutaneous Intraspinal Navigation (PIN): AFeasibility Study in Cadavers of a New and MinimallyInvasive Approach to the Spinal Cord and Brain. AJNR Am JNeuroradiol 2003;24:361-365KEY WORDS: Percutaneous intraspinal navigation (PIN),sacral nerve roots, endoscopyThe authors of this work have indicated that they will be discussing/presentingan unapproved or investigative use of a7.5 French flexible ureteroscope made by Karl StorzEndoscopy America Inc. for endoscopy of the spinal cord.The authors of this work have indicated the following affiliations/disclosures:Boston Scientific: Licensing agreementfor the percutaneous intraspinal navigation technique.
Poster 139Visualization of the Posterior Inferior Cerebellar Arteryvia Percutaneous Intraspinal NavigationGiles, B. P. · Tsai, J. G. · Replogle, R. E. · Miller, S. L. ·Purdy, P. D.The University of Texas Southwestern Medical CenterDallas, TX367CONCLUSIONAccessing the cisterna magna and its anatomical structuresvia the PIN technique is both technically feasible andstraightforward. PICA can be seen to its lateral medullarysegment using currently available fiberoptic endoscopes.Improvements in endoscope technology may enable furthervisualization. This approach may offer a potential alternativeto open surgical exposure if further study confirms safetyand efficacy for specific applications.PostersPURPOSEA percutaneous approach to the cerebral subarachnoid spacefrom a lumbar puncture has been described previously (1).Use of this approach for subarachnoid surgery requiresdetailed knowledge of the appearances of different anatomicalstructures. The purpose of this study is to determinewhether percutaneous intraspinal navigation (PIN) can beused to visualize the posterior inferior cerebellar artery(PICA) and to define its appearance using a combination ofa small-caliber endoscope and fluoroscopy. Since this techniqueprovides rapid access to the cisterna magna and itsanatomical structures without the need for open surgicalexposure, minimization of iatrogenic trauma might be feasibleif clinical use were enabled.MATERIALS & METHODSAn embalmed male cadaveric head and neck was obtained.X-ray and MR compatible fiduciary markers were affixed tothe head. The head subsequently was encased in a lowexpansile rigid foam. The model was brought to our researchangiography suite and placed in the prone position. A 7.5 Fsteerable endoscope was placed in the subarachnoid spaceand positioned ventro-lateral to the spinal cord and advancedcranially in the cadaveric head and neck model under X-rayfluoroscopy. Endoscopic images were stored using a directdigital capture apparatus.RESULTSRealtime endoscopic and X-ray fluoroscopic images ofPICA were obtained. Endoscope position relative to the vertebrobasilarsystem was confirmed with contrast injection inthe ipsilateral vertebral artery (Figure 1). The vertebral arterywas identified endoscopically and followed both to the vertebrobasilarjunction and to the origin of PICA (Figure 2).PICA and its course laterally were visualized as the endoscopewas advanced. The vagus and spinal accessory nervesalso were visualized and photographed. From the anteriorspinal subarachnoid space, PICA could be seen into its lateralmedullary segment.REFERENCES1. Purdy PD, Replogle RE, Pride GL Jr, Adams C, Miller S,Samson D. Percutaneous Intraspinal Navigation (PIN): AFeasibility Study in Cadavers of a New and MinimallyInvasive Approach to the Spinal Cord and Brain. AJNR Am JNeuroradiol 2003;24:361-365KEY WORDS: Percutaneous intraspinal navigation, vertebrobasilar,endoscopyThe authors of this work have indicated that they will be discussing/presentingan unapproved or investigative use of a7.5 French flexible ureteroscope made by Karl StorzEndoscopy America Inc. for endoscopy of the subarachnoidspace.The authors of this work have indicated the following affiliations/disclosures:Boston Scientific/Target Corporation:Licensing agreement of the percutaneous intraspinal navigationtechnique.Poster 140Intracranial Angioplasty for Symptomatic MiddleCerebral Artery Stenosis: Experience in 33 PatientsYoon, W. · Seo, J. J. · Kim, J. K. · Kim, S. K. · Oh, J. W. ·Han, J. H. · Park, J. G. · Kang, H. K.Chonnam University Medical SchoolGwangju, REPUBLIC OF KOREAPURPOSETo report our 9-year experience with percutaneous transluminalangioplasty for symptomatic middle cerebral arterystenosis.MATERIALS & METHODSThirty-three consecutive patients (mean age, 56 years) withsymptomatic middle cerebral artery stenosis underwentintracranial balloon angioplasty from June 1994 to June2003. The indication for angioplasty was recurrent transientischemic attack in 23 patients and acute ischemic stroke in10 patients. All patients had high grade stenosis more than70% in the middle cerebral artery.RESULTSAngioplasty was effective in reducing the degree of stenosisless than 50% in 30 patients (91%). Minimal asymptomaticdissection was identified on angiographic studies obtainedjust after angioplasty in seven (21%). Transient neurologiccomplications that cleared within 24 hours after angioplastyoccurred in 6 patients (18.2%). One vascular rupture duringballoon dilation resulted in intracranial hemorrhage and
Postersdeath. The risk of disabling stroke or death was 6.1% (2 of33). Of the 23 patients with transient ischemic attack, no oneexperienced further transient ischemic attack except one whohad acute ischemic stroke 6 months after angioplasty. Of the10 patients with acute ischemic stroke, nine patientsimproved clinically after angioplasty and no one had furtherischemic symptoms during follow-up period. Seven patientswere followed up with angiography for at least 15 months,and none showed restenosis.368Poster 142Usefulness of Percutaneous Transluminal Angioplastyfor Acute Middle Cerebral Artery EmbolismHori, Y. 1 · Sagara, Y. 1 · Nagatomi, H. 1 · Kiyosue, H. 2 ·Okahara, M. 2 · Tanoue, S. 2 · Mori, H. 21Nagatomi Neurosurgical Hospital, Oita, JAPAN, 2 OitaUniversity, Oita, JAPANCONCLUSIONIntracranial angioplasty for symptomatic middle cerebralartery stenosis is safe and effective in the management ofboth transient ischemic attack and acute ischemic stroke.KEY WORDS: Middle cerebral artery stenosisPoster 141Diffusion-Weighted MR Imaging Abnormalities afterPTA/Stenting for Intracranial Atherosclerotic DiseaseTsumoto, T.Wakayama Medical UniversityWakayama City, JAPANPURPOSEWe evaluated the frequency of thromboembolic events afterPTA/stenting for intracranial atherosclerotic disease, byusing diffusion-weighted MR imaging.MATERIALS & METHODSSixteen patients with symptomatic stenosis greater than 60%of the intracranial artery were treated with PTA (5 cases)and/or stent placement (11 cases) between January 1995 andApril 2003. Before and after intervention, whole brain diffusion-weightedimaging (DWI) was acquired. According tothe characteristics of new hyperintensities, all cases weredivided into the following three groups: type A, no newhyperintensities; type B, single spot only; type C, multiplespots.RESULTSWe detected 8 type A, 6 type B, and 3 type C lesions. Allhyperintense lesions were less than 5 mm in diameter. Instent group, hyperintense lesions were detected in eight of 11patients. In MCA group treated with PTA only, single spotlesion was detected after the procedure.CONCLUSIONIn PTA/stenting for intracranial atherosclerotic disease, thechance to cause massive thromboembolic stroke detected onDWI is rare. From the viewpoints of embolic complication,PTA/stenting for intracranial atherosclerotic disease is saferthan carotid artery stenting.KEY WORDS: PTA/stenting, diffusion-weighted MR imaging,atherosclerosisPURPOSEAcute middle cerebral artery embolism (MCAE) has beentreated by intraarterial fibrinolysis (LIF), but not all casesshowed recanalization and good outcome. In patients withMCAE, the embolus was often so large as to be resistant tofibrinolysis, and time-consuming fibrinolytic therapy withhigh doses of urokinase may be required, which may resultin hemorrhagic complication. As an alternative option toLIF, percutaneous transluminal angioplasty (PTA) using asingle lumen balloon catheter (STEALTH) with a valve wirehas been performed to treat acute MCAE. However, wefound use of STEALTH with a valve wire could be associatedwith poor maneuverability of a valve wire in some caseswith tortuous access route, which may lead to unsuccessfulprocedure. The purpose of this study was to evaluate thesafety and efficacy of a modified PTA technique usingSTEALTH with a nonvalve wire for acute MCAE.MATERIALS & METHODSTwenty-seven patients (15 men and 12 women; mean age,68.2 years) had acute MCAE. Seven of 27 patients weretreated with a modified PTA technique. STEALTH wasadvanced into the occlusion site with 0.016 inch microguidewire(nonvalve wire). Percutaneous transluminal angioplastywas performed with inflation of balloon with the sameguidewire at 2 to 4 atm for 30-60 seconds. Intraarterial fibrinolysiswas added when distal emboli was observed. FollowupCT was performed within 24 hours and 3-7 days afteronset. Rates of recanalization, complications, and clinicaloutcome assessed by Glasgow outcome scale (GOS) wereevaluated with comparison of control group of patients treatedwith standard PTA (n = 7) and LIF alone (n = 13).RESULTSModified PTA had a higher recanalization ratio (100%), thanstandard PTA (28.6%) and LIF alone (53.8%). In 5 of 7patients, standard PTA failed because the valve wire into theballoon catheter could not pass through the tortuous accessroute. However, modified PTA did not improve the rate ofindependent lifestyle (57%, 14%, 54% in modified PTA,standard PTA, LIF alone, respectively). Symptomatic largehemorrhages occurred in 3 patients (2 in LIF group, 1 inmodified PTA group).CONCLUSIONA modified PTA technique showed the high rate of recanalization,and may be a safe and effective treatment for acuteMCAE.KEY WORDS: Middle cerebral artery embolism, percutaneoustransluminal angioplasty, fibrinolysis
Poster 143MR Venogram of Sinus Thrombosis: When IsEndovascular Intervention Required?369Poster 144Clinical Results of Angioplasty and Stenting forIntracranial Extradural Internal Carotid StenosesNguyen, T. H. · Kostanian, V. J. · Tsai, F. Y.University of California Irvine Medical CenterOrange, CAPURPOSETo present the key features seen on MR venogram and MRimaging of the head that would indicate the need for urgentendovascular intervention (thrombectomy, thrombolysis) inpatients with sinus thrombosis.MATERIALS & METHODSTen consecutive patients with sinus thrombosis were evaluatedby MR venogram [2D time-of-flight (TOF) with maximumintensity projection reconstruction] along with MRimaging of the brain. The above were performed on a standard1.5 T MR scanner. The findings were correlated withcatheter angiography, and subsequent endovascular intervention.Common features found on the MR venogram and MRimaging of the brain that helps to determine the need forendovascular intervention was analyzed to assess significance.Normal anatomical variation also was discussed,along with potential pitfalls.RESULTSSinus thrombosis usually is identified on MR venogram as asegmental area of absent flow, with presence of collaterals inthe region. Paucity of collaterals and/or absence of a venousoutflow on the involved side are significant. Presence of T1-shortening material within the sinus signifies thrombus formationas the immediate underlying cause. Brain edema,infarction, and/or hemorrhage in the territory drained by thethrombosed sinus usually predicate a restricted venous outflow,and need for urgent intervention. Lack of the aboveinsult may simply suggest a sufficient collateral system. But,the urgent need for clot removal and reestablishment ofvenous outflow is still present, especially in symptomaticpatients, so that the later sequela of dural arteriovenous fistulacan be avoided.CONCLUSIONStandard 2D TOF MR venogram usually is performed initiallyto evaluate patients with clinical suspicion of sinusthrombosis. The urgent need and indication for endovascularintervention is dependent on the interpretation of this study.Understanding the key features of sinus thrombosis on MRvenogram and MR imaging of the brain is crucial for appropriatepatient management.KEY WORDS: MR venography, sinus thrombosisTsuura, M. 1 · Terada, T. 2 · Masuo, O. 2 · Matsumoto, H. 2 ·Tsumoto, T. 2 · Yamaga, H. 2 · Nakai, K. 1 · Itakura, T. 21Minami-Wakayama National Hospital, Tanabe City,JAPAN, 2 Wakayama Medical University, Wakayama City,JAPANPURPOSERecently, medically refractory intracranial atheroscleroticstenosis has been treated by angioplasty and stenting. Wereport clinical results and problems of angioplasty or stentingfor intracranial extradural internal carotid artery (ICA)stenoses.MATERIALS & METHODSTotal 51 cases (51 lesions) of intracranial extradural internalcarotid artery stenoses were treated by angioplasty or stentingunder local anesthesia. In 27 lesions located in petrousportion of ICA, 11 and 16 lesions were treated angioplastyalone and stenting, respectively. In 24 lesions of cavernousportion, we performed angioplasty in 9 lesions and stentingin 15 lesions. All lesions have stenotic rate above 60%.RESULTSTechnical success rate was 98%. In 26 cases of angioplastyalone, 69.8% of average stenotic rate reduced to 25.6% afterangioplasty, while 74.2% of average stenotic rate remarkablydecreased to 5.7% in 24 cases of stenting. In patients withpetrous ICA stenosis, average stenotic rate improved from74.7% to 9.9%. On the other hand, average stenotic rate ofcavernous ICA lesion showed 68.7% before and 23.3% afterangioplasty or stenting. Morbidity rate within 30 days afterthe procedures, rate of neurologic deficits which continueover 30 days and mortality rate was 6%, 2%, and 0%, respectively.As a morbidity, TIA due to air embolism during theprocedure occurred in one case and carotid cavernous fistulasdue to ICA laceration, which required coil embolizationlater, showed transient oculomotor and abducens nervepalsies in one case. In one case of permanent neurologicdeficit, stent thrombosis occurred 2 days after the interventionand thrombolysis was required. In 2 of 45 patients(4.4%), restenosis (> 50% stenotic rate) was detected.CONCLUSIONAngioplasty or stenting for intracranial extradural internalcarotid artery stenoses demonstrated low morbidity, lowmortality, and high technical success rate. Long-term followupmay be necessary to detect restenosis, especially in casesof ICA stenosis in cavernous portion, which tend to result inpoor improvement of stenotic rate probably because twothirds of the patients underwent angioplasty alone.KEY WORDS: Intracranial internal carotid stenosis, angioplasty,stentPosters
PostersPoster 145Effect of Distal Balloon Protection Technique for CarotidStenting: Analysis from Consecutive 200 CasesTerada, T. · Tsumoto, T. · Yamaga, H. · Itakura, T.Wakayama Medical UniversityWakayama, JAPANPURPOSEThe effect of distal balloon protection technique for carotidstenting was examined.MATERIALS & METHODSTwo hundred carotid stenosis greater than 60% were treatedby carotid stenting under distal balloon protection technique.Initial 38 cases were treated balloon protection only at thepostdilatation period. Next 78 cases were protected at theperiod predilatation and postdilatation using naviballoon.Recent 84 cases were treated at the period of predilatation,stenting, and postdilatation using PercuSurge. Clinical outcomewas evaluated in all cases and the effect of distal balloonprotection was examined.370intraarterial thrombolysis for acute ischemic stroke involvingthe middle cerebral artery. Site of occlusion, and result ofthrombolysis (no recanalization, recanalization of the superiordivision only, recanalization of the inferior division only,or complete recanalization) were recorded also fromangiograms. Analysis of variance assuming that NIHSSscore is a continuous variable then was used to determinewhether there was a significant difference between thegroups.RESULTSMedian discharge NIHSS scores for those patients who hadno recanalization was 16.5 (range 7-42; n = 14); for thosewith recanalization of the inferior division only it was 10.5(range 7-42; n = 14); for those with recanalization of thesuperior division only it was 7.5 (range 3-15; n = 4) and forthose with complete recanalization it was 3 (range 0 - 22; n= 23). Analysis of variance indicated that there is a statisticallysignificant difference among the recanalization groupsexamined (p = 0.0003). There was a tendency for patientswith recanalization of the superior division only to have betteroutcomes than those with recanalization of the inferiordivision only.RESULTSOne minor stroke appeared after carotid stenting in initial 38cases. One minor stroke, one hyperperfusion syndromeresulted in minor stroke and one nonstroke death wereencountered after stenting in 78 cases. One case with acutestent thrombosis, which was recanalized immediately, resultedin minor stroke in 84 PercuSurge cases. The ischemiccomplication was 1.5% and overall morbid/mortality ratewas 2.5% in consecutive 200 cases treated with distal balloonprotection technique.CONCLUSIONDistal balloon protection technique is effective to preventembolic stroke during carotid stenting.KEY WORDS: Carotid stenting, protection device, clinicaloutcomePoster 146Is There a Difference in Clinical Outcome inRecanalizations Involving the Superior Division vs theInferior Division of the Middle Cerebral Artery?Christoforidis, G. A. · Mohammad, Y. · Slivka, A. · Slone, H.W. · Bourekas, E. · Chakeres, D. W.The Ohio State UniversityColumbus, OHPURPOSETo determine whether clinical outcomes from intraarterialthrombolysis for ischemic stroke involving the middle cerebralartery (MCA) differ depending on whether there isrecanalization of the inferior vs the superior division of theMCA.MATERIALS & METHODSAngiograms, and National Institutes of Health Stroke Scale(NIHSS) scores at the time of discharge from the hospitalwere reviewed retrospectively in 55 patients who underwentCONCLUSIONWhen there is recanalization within only one division of themiddle cerebral artery following intraarterial thrombolysis,recanalization of the superior division branch of the MCAtends to lead to better immediate clinical outcomes relativeto those patients who have recanalization of the inferior divisionof the middle cerebral artery.KEY WORDS: Thrombolysis, angiography, strokeThe authors of this work have indicated that they will be discussing/presentingan unapproved or investigative use of r-tpa made by Genentech for intraarterial thrombolysis.Poster 147Symptomatic Posterior Circulation Stenosis:Endovascular Treatment with StentsMiranda, C. 1,2,3 · Lylyk, P. 1 · Rufenacht, D. 2 · Ferrario, A. 1 ·Romero, R. 1 · Vila, J. 1 · Pabon, B. 11ENERI, Buenos Aires, ARGENTINA, 2 Clínica MédicaBelgrano, Buenos Aires, ARGENTINA, 3 University ofGeneva, Geneva, SWITZERLANDPURPOSETo determine the clinical and angiographic outcome ofpatients with symptomatic intracranial atherosclerosis whofail antithrombotic therapy in which an endovascular treatmentwas performed with the stent implantation.MATERIALS & METHODSBetween June 1996 and May 2003, symptomatic patientswith posterior circulation intracranial stenosis in spite of bettermedical treatment were selected to be treated withintracranial stents. Clinical syndromes were registered, theangiographic stenosis features and occlusion rates were classifiedaccording Mori score in three groups A,B,C. Clinicalbenefits were evaluated in short time and during the followup.Restenosis or thrombosis in stent were documented.
RESULTSFrom 90 intracranial stenosis, 52 (57.7 %) were in the posteriorcirculation. The location was: vertebral 20 (38.5%),basilar 15( 28.8% ), vertebro-basilar junction 13 (25%) andP1 4 (7.7% ). The mean stenosis rate was 72.4 %. One stentwas implanted in 31 patients (59.6%), two or more stentswere deployment in 21 cases. Respect to clinical results,67% improved its symptoms, 26.5% remain stable, and 6.5%revealed poor clinical evolution. In all cases, the stenosisgrade was overall reduced to less than 30%. Clinical followupwas obtained in all patients. Angiographic follow-up waspossible in 33 (63.4%). The restenosis rate was 12.5% andreangioplasty was necessary in 2 cases.CONCLUSIONThe goal of all cerebrovascular interventions is to alleviatesymptoms and prevent complications. Currently, theintravascular stents use for treatment intracranial stenosishas been implemented. Such new approach is feasible andsafe. Posterior studies are being undertaken to evaluate thepotential role of this therapy in intracranial atheroscleroticdisease and expand the field of interventional neuroradiology.371Weight-based (0.25 mg/kg) bolus dose of abciximab wasadministered. Significant preintervention increases in cerebralflow were observed while simultaneously facilitatingguide wire access and intervention. Balloon angioplasty ofthe left intracranial vertebral artery was performed improvingposterior circulation.RESULTSAbciximab has been shown to be an effective adjunct therapyfor the treatment of thromboembolic complications associatedwith neurointerventional procedures (1). Prophylacticadministration appears to enhance artery recanalization,improve perfusion, and facilitate mechanical interventionwhile possibly preventing and/or alleviating downstreamdistal embolization. These case reports appear to demonstratethe beneficial effects of abciximab and its ability todisaggregate platelet-derived thrombus.PostersKEY WORDS: Intracranial stenosis, stents, strokePoster 148Blood Flow Improvement through Critical Stenoses duringIntracranial Angioplasty Procedures with AdjunctiveAbciximab Increases Procedural SafetyAl-Ali, F.Borgess Medical CenterKalamazoo, MIPURPOSETo describe the outcomes of patients administered abciximabprior to neurointerventional angioplasty in an attempt toenhance lumen visualization, significantly increasing thesafety and feasibility of the procedure.MATERIALS & METHODSCase 1. A 68-year-old patient presented with a several-monthhistory of worsening dizziness and vertigo episodes lasting10-20 minutes. The patient reported a 10-year history ofhypertension with a negative cardiac evaluation. Emergencycerebral angiography confirmed the total occlusion of bothintracranial vertebral arteries (Figure a). Abciximab(Centocor, Malvern, PA) was administered preangioplasty asa weight-based bolus dose (0.25 mg/kg) to prevent downstreamdistal embolization typically heightened by mechanicalintervention. Angiography at 55 minutes demonstratedanterograde flow to the basilar artery from the left vertebralartery prior to any percutaneous intervention (Figure b).Angioplasty of the left intracranial vertebral artery for nearcomplete occlusive stenosis was successfully completed.Follow-up angiogram demonstrated significant cerebral flowimprovement as compared to the preprocedure angiogram.Case 2. A 60-year-old patient presented with tinnitus, vertigo,diplopia, and left ear pressure. Conventional cerebralangiography demonstrated an occlusion of the right vertebralartery and critical stenosis (99%) of the left intracranial vertebralartery with minimal blood flow to the basilar artery.CONCLUSIONThe adjunctive use of abciximab therapy during neurointerventionalprocedures appears to be a viable alternative tothrombolytic treatment. The “fibrinolytic-like” properties ofabciximab appear to disaggregate platelet thrombi andincrease cerebral artery perfusion while simultaneouslyfacilitating the use of catheter guide wires.REFERENCES1. Cloft HJ, Samuels OB, Tong FC, Dion JE. Use of Abciximabfor Mediation of Thromboembolic Complications ofEndovascular Therapy. AJNR Am J Neuroradiol2001;22:1764-1767KEY WORDS: Abciximab, angioplasty, safetyThe authors of this work have indicated that they will be discussing/presentingan unapproved or investigative use ofabciximab made by Centocor for neurointerventional use.
PostersPediatrics149-168Poster 149Application of Transcranial Doppler in Children withAcute Neurologic Events Due to Cerebral Vasculitis372Poster 150Age-Dependence of Diffusion-Weighted MR Findings inMaple Syrup Urine Disease EncephalopathySakai, M. 1 · Oba, H. 2 · Ishiguro, A. 1 · Tsukune, Y. 1 · Mitomo,M. 31University Hospital, Mizonokuchi, Teikyo University,Kanagawa, JAPAN, 2 School of Medicine, Teikyo University,Tokyo, JAPAN, 3 Osaka National Hospital, Osaka, JAPANLowe, L. H. · Morello, F. P. · Lasky, A.Children’s Mercy HospitalKansas City, MOPURPOSEThe purpose of this study is to determine if transcranialDoppler (TCD) could be applied to evaluate cerebrovasculardisease in children with acute stroke due to cerebral vasculitis.MATERIALS & METHODSA retrospective review was performed in 3 girls (ages 8, 9,and 13 years) with acute stroke due to cerebral vasculitis, allof whom underwent TCD, MR imaging and catheter angiography.Periodic follow-up with each imaging modality wasperformed (range 6 months to 2.5 years). Correlation of findingson TCD was compared to MR imaging and catheterangiography.RESULTSIn all 3 girls, acute strokes occurred in the left middle cerebralartery distribution. Transcranial Doppler was significantlyabnormal in the distribution of the acute stroke, whereMR imaging and catheter angiography demonstrated vascularstenoses, beading, and irregularity. Peak systolic velocitieswere highest acutely at 340, 191, and 260 cm/sec. Agradual return to normal velocities (< 120 cm/sec) wasobserved on TCD over several months in 2 girls, which correlatedwith eventual return to normal on MR imaging andcatheter angiography. In the last girl, gradual improvementhas occurred at 6-month follow-up (peak systolic velocity
myelin, the areas of the restricted diffusion and the ADCdecrease spread in MSUD encephalopathy. After intensivetreatment, she achieved normal neurologic developmentdespite the difficult infantile course.CONCLUSIONThe patient described here indicates age-dependent changesin DWI findings in MSUD encephalopathy, which appearsascribable to progress of myelination. Diffusion-weightedimaging sensitively detects abnormalities associated withMSUD and may contribute to early diagnosis of MSUDencephalopathy and, consequently, appropriate patient management.KEY WORDS: Maple syrup urine disease, diffusion-weightedMR imaging, metabolicPoster 151Imaging, DTI, and Spectroscopy in IncontinentiaPigmenti (Bloch-Sulzberger Syndrome)373CONCLUSIONThe morphologic changes found in our patient is accordingto the literature and forms a pattern. The DTI measurementsshowed a reduced anisotropy of the parts of the brain concernedcorresponding to the reduction of NAA. The lactatepeak found in the first examination in the course of ourpatient fits well with findings in other patients with focalepilepsies as transient changes as a consequence of seizures.KEY WORDS: Incontinentia pigmenti, DTI, spectroscopyPoster 152Familial Erythrophagocytic Lymphohistiocytosis:Diffusion Imaging Findings and Review of LiteratureVeeramani, M. · Curran, J. · Keating, G. · Kim, F. ·Burrowes, D.Children’s Memorial HospitalChicago, ILPostersBoor, S. · Vucurevic, G. · Boor, R. · Kutschke, G. · Stoeter,P.University of MainzMainz, GERMANYPURPOSEIncontinentia pigmenti (Bloch-Sulzberger Syndrome) is arare, x-linked, dominant neurocutaneous illness (w:m =37:1). There are only few reports about accompanyingchanges in central nervous system (CNS) in particular usingspectroscopic and DTI imaging techniques. The typical signsand symptoms are described, also results of the spectroscopyin the course of the illness.MATERIALS & METHODSA 3.5-year-old girl with typical cutaneous signs of incontinentiapigmentia including microphthalamy came to ourexaminations. In the beginning, the little patient additionallyhad epileptic seizures.RESULTSThe neuroradiologic examinations with MR revealed,according to the literature, changes of the white matter, a lefthemispheric delay of development with enlargement of thelateral ventricle, and a dysplasia of the corpus callosum withmissing rostrum. Spectroscopy in a region, suspected to bethe origin of the seizures out of EEG data, showed a lactatepeak(seizures were noted in the days before). The NAA/creatinequotient was reduced compared to the normal-appearingright side (1.47 to 1.74). A control examination with MRimaging after 1 year showed a normalization of the lactatemeasurements with effective antiepileptic drug therapy andmissing seizures, the NAA reduction did not change. TheDTI images including anisotropy indices showed a considerablereduction of the white matter tracts, the pyramidal tractwas demonstrable with the fiber-tracking technique, but witha significant reduction of the number of tracts.PURPOSETo present the diffusion-weighted imaging (DWI) findingsin two patients with familial erythrophagocytic lymphohistiocytosis(FEL) and to review the imaging findings andpathology.MATERIALS & METHODSTwo patients with bone-marrow biopsy proven diagnosisunderwent multiple imaging studies including CT and MRimaging with DWI. The literature was reviewed for both theneuroradiologic findings and the pathophysiology.RESULTSFamilial erythrophagocytic lymphohistiocytosis is a rare diseaseresulting from the abnormal proliferation and infiltrationof histiocytes in tissues and organs but with no malignancy.Treatment consists mainly of chemotherapy andbone-marrow transplantation. The first patient, a 16-montholdgirl with seizures showed diffuse restricted diffusion inthe cerebral cortex and basal ganglia sparing the cerebralwhite matter and cerebellum on DW MR imaging. StandardMR sequences showed diffuse increased T2 with reduced T1signal in the cerebral white matter and cerebellum, withincreased T1 and T2 signal in the basal ganglia, and postcontrastenhancement in the putamina. Bilateral subduralcollections also were present. The MR findings were notsuggestive of acute ischemia. The patient had recent myeloablationfor bone-marrow transplantation. An extensivesearch of the radiologic literature revealed no reports of similarDWI changes in FEL.
Posters374Poster 153Unusual Diffusion-Weighted Imaging Findings Alongwith Unusual Clinical Presentations in JuvenileMetachromatic LeukodystrophyKarli Oguz, K. 1 · Kocer Gelebek, I. 1 · Anlar, B. 1 · Senbil, N. 2· Cila, A. 11Hacettepe University, Ankara, TURKEY, 2 Dr.Sami UlusChildren’s Hospital, Ankara, TURKEYPURPOSETo display unusual diffusion-weighted imaging (DWI) findingsalong with unusual clinical presentations in 3 childrenwith juvenile type metachromatic leukodystrophy (MLD).Figure: DWI in patient 1The second patient, an 11-year-old girl, with a history ofseizures had no restricted diffusion on DW MR imaging. Thestandard MR sequences showed volume loss with diffusebilateral cerebral white matter and cerebellar hyperintenseT2 signal which improved with therapy. The areas ofenhancement seen on the older scans had resolved. The MRimaging was typical of the disease described in literature.CONCLUSIONThe above DWI findings in FEL are unreported previously.The typical abnormalities on the standard sequences havebeen explained on the basis of lymphocytic and histiocyticinfiltration in the perivascular spaces and the brain substanceitself with resulting demyelination, astrogliosis, necrosis,and cavitation. The cause for the discordant imaging findingsin our two cases is unclear. It is believed at this time thatthe findings in patient 1 were due to an acute diffuse infiltrativeprocess with possible resulting demyelination change.The clinical picture did not favour diffuse infection.Diffusion-weighted imaging may be a useful tool to differentiatethe diffuse acute infiltrative manifestation of FELfrom its usual nonspecific appearance.REFERENCES1. Kollias SS, Ball WS, et al. Familial ErythrophagocyticLymphohistiocytosis: Neuroradiologic Evaluation withPathologic Correlation. Radiology 1994;192:743-7542. Munoz Ruano MM, Castillo M. Brain CT and MR Imaging inFamilial Hemophagocytic Lymphohistiocytosis. AJR Am JRoentgenol 170:8023. Rooms L, Fitzgerald N, McClain KL. HemophagocyticLymphohistiocytosis Masquerading as Child Abuse:Presentation of Three Cases and Review of Central NervousSystem, Findings in Hemophagocytic Lymphohistiocytosis.Pediatrics 2003;111:e636-e640KEY WORDS: Familial erythrophagocytic lymphohistiocytosis,diffusion-weighted imaging, subdural collectionsMATERIALS & METHODSAll 3 cases were diagnosed as MLD by decreased serumactivity of enzyme arylsulfatase A. Case1 (9-year-old boy)and case 2 (6-year-old girl) are 2 siblings of the same family.Case 3 is a 6.5-year-old girl. Diffusion-weighted imagingand conventional MR imaging findings were evaluated foreach case.RESULTSTwo siblings (cases 1 and 2) were healthy until the age of 5at which a recurrent, episodic abdominal pain started. Thesame pattern of the abdominal pain also was present in thefather who was healthy otherwise. Then the children developedclumsy gait, intellectual deterioration, muscular weaknessand elder child was in poorer clinical condition. T2-weighted images showed bilateral increased intensity of thecentrum semiovale and peritrigonal white matter in bothcases. On DWI of the elder sibling, there were symmetricbilateral lines of low ADC value between inner and outerareas of increased ADC values. In younger sibling, there wasa thin line of restricted diffusion in the corpus callosum andin the deep white matter, on DWI. Also some of these linescorresponded to the border zone between demyelinatedwhite matter and normal white matter. Case 3 is a previouslyhealthy 6.5 year old, admitted with diplopia, headache,and vertigo while she was being followed up with a diagnosisof MLD for 1 year. She became unconscious in 12 hours,developed anisocoria with no light reflex on the left side.Cranial MR imaging displayed the pons, red nuclei, andpyramidal tract in the mesencephalon had increased T2 signalintensity and intense contrast enhancement. On DWI,restricted diffusion in the red nuclei and in the white matternot in the deepest, but mostly in the more peripheral areas,some in the marginal site between affected and unaffectedwhite matter. Six weeks later she returned to her baselineclinically and next MR imaging obtained 5 months after herfirst episode revealed new T2 signal hyperintensities in theright thalamus, posterior limb of the internal capsule, andbasal ganglia region. After contrast there was enhancementof posterior limb of the internal capsule on the right.Bilateral red nuclei abnormality observed in previous MRimaging had disappeared, but a unilateral swelling and T2hyperintensity localized to the right cerebral peduncleappeared that time. There was no evidence of reduced ADCon these new lesions, but in a limited area of anteriorperiventricular white matter. These recently formed lesionshad disappeared again when she could walk with help andtalk slowly and had mild left hemiparesis, a coarse tremor,more evident on the left arm.
CONCLUSIONJuvenile type of MLD may present with unusual clinical picturessuch as recurrent abdominal pain and episodic events inaddition to classical symptoms of MLD. Thin segmentallines of restricted diffusion may represent a histologic stagebetween intracellular sulfatide accumulation and myelinbreakdown in this particular disease.KEY WORDS: Metachromatic leukodystrophy, MR imaging,diffusion-weighted imaging375Exceptions were noted among those fetuses being investigatedfor posterior fossa abnormalities. Correlation with invitro studies shows a delay of approximately 3-5 weeks inthe gestational age at which these features are seen.PostersPoster 154MR Imaging of the Fetal Cerebellar Vermis In Utero:Description of Some Useful Anatomical Criteria forNormal DevelopmentRobinson, A. J. 1 · Blaser, S. 1 · Toi, A. 2 · Chitayat, D. 2 · Ryan,G. 2 · Pantazi, S. 2 · Gundogan, M. 2 · Laughlin, S. 11Hospital for Sick Children, Toronto, ON, CANADA,2Mount Sinai Hospital, Toronto, ON, CANADAPURPOSETo define and produce an atlas of easily identifiable andreproducible measurements and markers of normal anatomicaldevelopment of the fetal cerebellar vermis in vivo.Virtually all previous studies of development of the cerebellumhave been performed on fetal specimens, and few invivo studies discuss development of the cerebellar vermisper se.MATERIALS & METHODSRetrospective analysis of the midline sagittal views of thecerebellar vermis was performed in over 130 consecutivefetal MR examinations performed for CNS and non-CNSindications. Analysis included identification of the fastigialpoint and vermian fissures, degree of coverage of the fourthventricle, cerebellar growth and proportions, tegmento-vermianangle, and associated abnormalities of the posteriorfossa, brainstem, and CNS. Fetuses imaged for the specificassessment of abnormalities affecting the posterior fossawere evaluated separately.RESULTSGestational age ranged from 14.9 to 38.6 weeks with a meanof 26.6 weeks. Useful midline sagittal views were obtainedin over 100 studies, with a total of over 230 measurements.Average craniocaudal diameter of the cerebellar vermis followsgrowth approximately predicted by the linear equation:diameter (mm) = 0.73 x gestational age (weeks) -5.62, withan R 2 value of 0.91. Average height above and below thefastigial point also followed a linear progression, with averagepercentages above and below of 48.5% and 51.5%respectively, and no significant change of this ratio with gestationalage. The tegmento-vermian angle was always < 2° innormal fetuses, but was often increased in abnormal fetuses.Coverage of the 4th ventricle should usually have occurredby 17-18 weeks. The declive and primary fissure alwayswere visible in normal fetuses from 17.5 weeks. The othercerebellar vermian fissures were seen at approximately thefollowing gestational ages: secondary (postpyramidal) at 20weeks, prepyramidal at 21 weeks, and preculmenate at 22weeks. The other lobules (besides declive) became visiblefrom 24 weeks and most were visible by 27 weeks.CONCLUSIONUseful anatomical landmarks included identification of thefastigial point, presence of the fissures, vermian growth andproportions, and tegmento-vermian angle. An atlas of thesefeatures of normal development is demonstrated.Part 1 of 2. See abstract 973 for part 2.KEY WORDS: Vermis, fetal MR imaging, Dandy-WalkerPoster 154AMR Imaging of the Fetal Cerebellar Vermis In Utero:Criteria for Abnormal Development, withUltrasonographic and Clinicopathologic CorrelationRobinson, A. J. 1 · Blaser, S. 1 · Toi, A. 2 · Chitayat, D. 2 · Ryan,G. 2 · Pantazi, S. 2 · Gundogan, M. 2 · Laughlin, S. 11Hospital for Sick Children, Toronto, ON, CANADA,2Mount Sinai Hospital, Toronto, ON, CANADAPURPOSEOur previous study produced an atlas of easily identifiableand reproducible measurements and markers of normalanatomical development of the fetal cerebellar vermis invivo from 17.5 weeks gestational age to term. This study isto demonstrate easily identifiable and reproducible measurementsand markers of abnormal development, with ultrasonographicand clinicopathologic correlation where available.Virtually all previous studies of development of thecerebellum have been performed on fetal specimens, andfew in vivo studies discuss development of the cerebellarvemis per se.MATERIAL & METHODSRetrospective analysis of the midline sagittal views of thecerebellar vermis was performed in over 130 consecutivefetal MR examinations performed for CNS and non-CNSindications. Analysis included identification of the fastigial
Posterspoint and vermian fissures, degree of coverage of the fourthventricle, cerebellar growth and proportions, tegmento-vermianangle, and associated abnormalities of the posteriorfossa, brainstem and CNS.RESULTSGestational age ranged from 14.9 to 38.6 weeks with a meanof 26.6 weeks. Useful midline sagittal views were obtainedin over 100 studies. Approximately one quarter of these hadabnormalities affecting the posterior fossa. These includedfetuses with classic Dandy-Walker malformations and otherswithin the Dandy-Walker spectrum which we subdividedaccording to presence of dysplasia or hypoplasia, abnormaltegmento-vermian angle, size of cisterna magna, and associatedCNS abnormalities. Correlation with coronal and axialMR images and ultrasonographic images is demonstrated inaddition to clinicopathologic and genetic diagnoses whereavailable, however the final numbers are few.CONCLUSIONWe demonstrate MR imaging appearances of the normal andabnormal cerebellar vermis and posterior fossa with ultrasonographicand clinicopathologic correlation.Part 2 of 2. See abstract 852 for part 1.376MATERIALS & METHODSNine patients with focal cortical dysplasia (M:F = 3:6, Meanage = 13.6 years) were evaluated by DTI. Fractionalanisotropy (FA) and apparent diffusion coefficient (ADC) ofwhite matter adjacent to FCD was measured by semiquantitativeROI method and compared to the normal contralateralside by t-test. Fiber tractography was obtained in eachpatient around the areas of white matter abnormalities withthe threshold values of fiber tracking termination as FA = 0.2and trajectory angle = 45 o , and their configurations wereinvestigated visually.RESULTSSignificant FA reduction and ADC increase were found intwo patients (p < 0.0001, t-test) who also showed hyperintensityon T2-weighted imaging. One patient who showedincreased signal intensity of occipitotemporal white matteron T2-weighted imaging showed nearly the same FA valuesas the normal contralateral side. The rest 6 patients, whodemonstrated normal signal intensity of white matter adjacentto FCD, did not show significant FA or ADC changes incomparison to the normal contralateral side white matter. Onfiber tractography, all patients showed reduction of subcorticalfibers and connection between subcortex and deep whitematter, even in the cases of normal FA and T2 signal intensityof underlying white matter (Figure).CONCLUSIONDiffusion tensor imaging and fiber tractography is unparalleledby any other imaging techniques in describing alteredfiber connections and white matter changes in the cases ofFCD.KEY WORDS: Cortical dysplasia, MR imaging, diffusion tensorMR imagingKEY WORDS: Vermis, fetal MR, Dandy-WalkerPoster 155Diffusion Tensor MR Imaging and Fiber Tractography inFocal Cortical DysplasiaLee, S. · Kim, D. · Kim, J. · Lee, Y.Yonsei University College of MedicineSeoul, REPUBLIC OF KOREAPURPOSETo evaluate the usefulness of diffusion tensor imaging (DTI)in describing white matter changes and to investigate thepotential use of fiber tractography to detect alterations infiber connectivity in the case of focal cortical dysplasia(FCD).Poster 156Neuroimaging of CraniosynostosisHudkins, M. · Rosel, P.Tulane UniversityNew Orleans, LAPURPOSEThe imaging of craniosynostosis children is well representedin literature. However, very little exists describing the postoperativeappearance and subsequent long-term changes inthe skulls of children with craniosynostosis.MATERIALS & METHODSFrom a series of 75 children of varying age and craniosynostosistypes, we have selected several examples demonstratingthe pre and postoperative changes. Over the last 5years we have accumulated 75 patients with varying formsof craniosynostosis. These 75 patients had corrective surgery
at Tulane University between January of 1998 andSeptember of 2003. The patients were examined by CT with3D reconstructions. From these 75 patients, we chose 6patients in which we display pre and postoperative examinations.An example of a sagittal, coronal, metopic lambdoidal,multisuture, and total suture synostosis are presented.RESULTSStudies obtained between birth and 6 months for preoperativeassessment were of limited value due to the generalpaucity of calcification of the cranium. However, from 6months to 1 year, complete ossification and closure ofsutures was detected easily with the exception of the lambdoidalsuture. Partial closure of this suture was more difficultto detect than complete closure of the suture. Immediatepostoperative studies and follow-up exams subsequentlyshow the appearance of the postoperative skull and the typicalgrowth after repair. CT scanning with 3D reconstructionsshow the suture ossification quite readily and is a goodmodality for a pre and postoperative assessment of thesepatients.CONCLUSIONWe reviewed 75 patients with craniosynostosis. CT scanningwith 3D reconstructions were utilized for preoperative andpostoperative evaluation. The above poster outlines theappearance of the preoperative craniosynostosis patient andtypical follow-up after surgery over a 5-year period.KEY WORDS: CraniosynostosisPoster 157Investigation of Neurovascular Abnormalities in Sturge-Weber Syndrome Using Susceptibility-WeightedImagingSehgal, V. 1 · DelProposto, Z. S. 1 · Hu, J. 1 · Juhasz, C. 2 ·Muzik, O. 2 · Tong, K. A. 3 · Ashwal, S. 3 · Chugani, H. 2 ·Haacke, E. M. 41Wayne State University, Detroit, MI, 2 Children’s Hospital ofMichigan, Detroit, MI, 3 Loma Linda University MedicalCenter, Loma Linda, CA, 4 MRI Institute for BiomedicalResearch, Detroit, MIPURPOSESturge-Weber syndrome (SWS) is an often progressive rareneurocutaneous disease manifesting as facial and leptomeningealvenous angiomas. Neurologic deterioriation issuspected to be incident to abnormal collateral venousdrainage and progressive venous occlusions (1-3).Susceptibility-weighted imaging (SWI) has been found to beparticularly well suited for visualization of venous malformationsand microhemorrhage within the brain (4-6). In thisstudy, we present preliminary data investigating the use ofSWI in SWS.377MATERIALS & METHODSSix patients diagnosed with SWS were imaged at 1.5 T usinga standard Siemens head coil. The imaging protocol consistsof both a conventional T1-weighted fast spin-echo and a susceptibility-weightedsequence. The susceptibility-weightedsequence used is a high-resolution, three-dimensional, fullyvelocity compensated gradient-echo sequence, with postprocessinginvolving combining both the magnitude and phaseimages to increase the conspicuity of the veins and othersources of susceptibility effects. All patients had pre andpostcontrast T1 FSE and postcontrast SWI; a single patientadditionally had precontrast SWI.RESULTSIn the involved cortex, contrast-enhanced (CE) T1 imagesshow leptomeningeal enhancement. Susceptibility-weightedimages clearly show the abnormally large collateral veinsalong with ill-defined areas of T2 shortening that may representcalcification or deoxyhemoglobin. Susceptibilityweightedimages are complementary to T1 images, displayingthe specific location and extent of dysplastic veins comparedto the diffuse enhancement seen with CE T1. Evenwithout the administration of a contrast agent, SWI is able toclearly demonstrate the venous anomalies.CONCLUSIONSusceptibility-weighted imaging enhances the visibility ofvenous abnormalities to a greater extent than conventionalmethods, as it relies upon the BOLD effect of deoxyhemoglobin(4-6). Contrast agent administration improves venousvisibility, especially of small subvoxel veins (5).Susceptibility-weighted imaging in SWS shows the leptomeningealenhancement of CE T1 images, but adds theclear visualization of areas of venous abnormalities, possiblyincluding calcifications. Since regions of venous angiomatosisare associated causally with areas of neuronal degeneration(1-3), early detection may be important for potentialtherapeutic intervention. Susceptibility-weighted imagingmay improve the early detection of vascular pathology inpatients with SWS and contribute to the pathophysiologicunderstanding of its progression.REFERENCES1. Portilla P, Husson B, Lasjaunias P, et al. Sturge-Weber Diseasewith Repercussion on the Prenatal Development of theCerebral Hemisphere. AJNR Am J Neuroradiol 2002;23:490-4922. Aydin A, Cakmakci H, Kovanlikaya A, et al. Sturge-WeberSyndrome without Facial Nevus. Pediatr Neurol 2000;22:400-4023. Cure JK, Holden KR, Van Tassel P. Progressive VenousOcclusion in a Neonate with Sturge-Weber Syndrome:Demonstration with MR Venography. AJNR Am JNeuroradiol 1995;16:1539-15424. Reichenbach JR, Venkatesan R, Schillinger DJ, et al. SmallVessels in the Human Brain: MR Venography withDeoxyhemoglobin as an Intrinsic Contrast Agent. Radiology1997;204:272-2775. Reichenbach JR, Essig M, Haacke EM, et al. High-ResolutionVenography of the Brain Using Magnetic ResonanceImaging. MAGMA 1998;6:62-696. Lin W, Mukherjee P, An H, et al. Improving High-ResolutionMR Bold Venographic Imaging Using a T1 ReducingContrast Agent. J Magn Reson Imag 1999;10:118-123KEY WORDS: Sturge-Weber, Susceptibility-weighted imaging,BOLDPosters
PostersPoster 158Coarctation of the Lateral Ventricles: A Pictorial EssayDecarie, J. C. · Rypens, F. · Lipsich, J.Hopital Ste-JustineMontreal, PQ, CANADAPURPOSETo illustrate the various appearances of coarctation of the lateralventricles, an undiagnosed variant of normal.MATERIALS & METHODSThe case of a patient with coarctation of the ventricles wasstudied longitudinally using the following imaging modalities;fetal ultrasound, fetal MR imaging and neonatal brainultrasound and MR imaging. Other cases are presented tobetter illustrate the features of coarctation of the lateral ventricles.RESULTSCoarctation of the lateral ventricles is a common variant ofnormal that is often misdiagnosed as subependymal cystssecondary to subependymal hemorrhages or periventricularleucomalacia. It is located typically at the same level as thefrontal horns of the lateral ventricles on coronal imageswhereas subependymal cysts are located below that level andperiventricular leucomalacia above it. To our knowledge, ourcase is the first case reported to show the features of coarctationof the lateral ventricles using fetal MR imaging. Wealso present a case with concomitant intraventricular hemorrhagethat demonstrates the absence of communicationbetween the CSF in the coarctation and the CSF in the lateralventricle. The typical appearance of coarctation of the lateralventricles is that of multiple tear-shaped cysts in the typicallocation having a content that is isoechoic to CSF onbrain ultrasound and isointense to CSF in all sequences onbrain MR studies.378Poster 160West Nile Encephalitis in an 11-Year-Old Male withPostinfectious Parkinson’s DiseaseWright, A. · Berger, R. · Desilet-Dobbs, D.University of Kansas School of Medicine WichitaWichita, KSPURPOSEA case report of West Nile Encephalitis with secondary diagnosisof postinfectious Parkinson’s disease in an 11-year-oldpreviously healthy male is reported. The clinical and radiographicfeatures of this case are discussed with a review ofthe literature.MATERIALS & METHODSMultiple imaging studies are obtained including: CT of thehead without contrast, three subsequent MR images of thehead with and without contrast, and MR spectroscopy studyof the brain. Lumbar puncture was performed day of admissionwith multiple laboratory results obtained. The patient’shistory, physical exam, and hospital course are reviewed.RESULTSMR exams show bilateral increased signal within the midbrain,substantia nigra, and posterior aspect of the thalami.The CSF shows leukocytosis with elevated protein and glucose.Cerebral spinal fluid serology confirms elevated IgMantibodies to the West Nile Virus.CONCLUSIONCoarctation of the lateral ventricles is a common variant ofnormal that can be misdiagnosed as subependymal hemorrhagesor periventricular leucomalacia. Its appearance onfetal ultrasond, fetal MR imaging and neonatal neuroimagingstudies is specific and should enable one to make theproper diagnosis.REFERENCES1. Enriquez G, Correa F, Lucaya J, Piqueras J, Aso C, Ortega A.Potential Pitfalls in Cranial Sonography. Pediatr Radiol2003;33(2):110-1172. Rosenfeld DL, Schonfeld SM, Underberg-Davis S. Coarctationof the Lateral Ventricles: An Alternative Explanation forSubependymal Pseudocysts. Pediatr Radiol 1997;27(12):895-897KEY WORDS: Coarctation, lateral, ventriclesCONCLUSIONWest Nile Virus is an arbovirus first seen in the United Statesin a 1999 New York City outbreak. By 2003, this virus hasspread to almost every state. Neurologic symptoms commonlyaffect the elderly and rarely affect children. The incubationperiod is 5-15 days and presents symptomatically as a febrileillness of sudden onset. According to the CDC, the most conclusivediagnostic method to identify persons with West NileVirus infection of the central nervous system is detectingWNV-specific IgM antibody in CSF using ELISA. BecauseIgM antibody does not readily cross the blood-brain barrier,IgM antibody in CSF strongly suggests acute CNS infection.The clinical and radiographic features of this confirmed caseare discussed with an updated review of the literature.KEY WORDS: West, nile, virus
Poster 161Single-Shot Fast Spin-Echo Diffusion MR Imaging of theBrainstem and Cerebellum in Premature NewbornsXu, D. · Mukherjee, P. · Miller, S. P. · Veeraraghavan, S. ·Jin, H. · Lu, Y. · Ferriero, D. M. · Barkovich, A. J. ·Vigneron, D. B.University of California San FranciscoSan Francisco, CAPURPOSEThe utility of single-shot fast spin-echo (SSFSE) diffusiontensor imaging (DTI) for acquiring minimally distortedimages has been established at 1.5 T used for the study ofadult and pediatric brain (1, 2). The purpose of this studywas to improve diffusion tensor MR imaging of the brainstemand cerebellum of preterm newborns using the SSFSEsequence, and thereby accurately measure the rotationallyaveragedapparent diffusion coefficient (Dav) values in theseposterior fossa regions in infants with and without whitematter (WM) injury.MATERIALS & METHODSTwenty-three premature newborns were studied at 27-40weeks of gestational age on a 1.5 T Signa EchoSpeed System(GE Medical Systems, Milwaukee, WI) using an specializedMR compatible incubator and a custom-designed neonatalhead coil (3). Conventional MR imaging was performed toassess the severity of WM injury using a previously establishedscoring system: 0 (normal) to 3 (severely abnormal)(4). Diffusion tensor imaging scans were acquired with 18cm FOV, 5 mm thick, 128 x 128 FreqxPhase, b-value was600 s/mm 2 . Dav-map was generated as the mean of theeigenvalues of the tensor. Dav was calculated in 10 regions:cerebral peduncles, superior colliculi (G1), inferior colliculi(G1), hippocampus (G3), ventral pons (G2), dorsal pons(G1), deep cerebellar WM, cerebellar cortex(G3), ventralmedulla (G2), and dorsal medulla (G1). The hippocampuswas included for comparison purposes. The ROIs weregrouped further into 3 regions: G1 dorsal, G2 ventral, andG3 gray matter group. Differences in Dav across regions,age, and the severity of white matter injury were analyzedusing a mixed random effects model.379Table 1. Dav (x10-3 mm2/s) squares means*, standarderrors** and p-values1 2 3 4 5 6 7 8 9 101180 1114 1130 1317 1295 1129 1253 1350 1304 119818.5 18.5 18.3 18.3 18.1 18.1 18.1 18.1 19.2 18.8Cerebral Peduncles (1) 0.034 0.25
Postersdermal tumor and teratoma in one case each. The primarytumor was responsible for the compression in 12 cases(75%) and metastasis in 4 cases (25%). Symptoms of cordcompression were the presenting clinical feature in 13 cases.A single site of compression was identified in 15 cases. In50% of cases, the initial anatomical origin of the compressionwas paravertebral.CONCLUSIONMalignant cord compression is a rare manifestation of childhoodcancer. In contrast to what is found in the adult population,malignant pediatric cord compression is more oftenthe first manifestation of the malignancy rather than a secondarysign, will be more often secondary to a sarcoma thanto an epithelial metastasis, and will involve the cord at onlyone site. The anatomical origin of the compression is moreoften the paravertebral soft tissues rather the vertebra itself.380RESULTSMR findings: at 38 hours a MR scan showed diffuse remarkablebrain swelling, with no parenchyma T2 signal increase,and generalized ADC reduction in gray matter and myelinated-unmyelinatedwhite matter (Figure 2). A second MRimaging at 200 hours revealed normalization of ADC and noapparent brain anomalies.KEY WORDS: Metastasis, spine, childrenPoster 164Brain Apparent Diffusion Coefficient Decrease duringCorrection of Severe Hypernatremic DehydrationRighini, A. · Ramenghi, L. · Zirpoli, S. · Parazzini, C. ·Bianchini, E. · Mosca, F. · Triulzi, F.Istituti Clinici di PerfezionamentoMilan, ITALYPURPOSETo report brain diffusion MR findings in a neonate withsevere hypernatremic dehydration, undergone too rapid correctionand resulting in intracellular edema (osmotic edema)and in apparent diffusion coefficient (ADC) decrease. Thiscase provides insight about cellular response to osmoticchallenge and it represents a unique accidental human“model” of cytotoxic edema.MATERIALS & METHODSA 20-day-old baby, after prolonged starvation because ofmother’s psychiatric disorder, presented with marked dehydrationand lethargy. At admission (0 hours) serum sodiumlevel was 208 mEq/L. He was slowly hydrated with hypernatremicand glucose i.v. solutions, aiming to reduce serumsodium at a rate of less than 2 mEq/L per hour. Despite thisprocedure, at 9 hours he had repeated generalized seizuresfor about 6 hours. The neurologic status progressively normalizedtogether with serum sodium level (Figure 1). At 4months neurologic exam was normal.CONCLUSIONAnimal models of hypernatremic dehydration (1, 2) stronglysupport the hypothesis that in our case dehydration inducedintracellular accumulation of endogenous osmolytes to protectfrom water shifting from intra to extracellular space.During therapeutic fluid infusion, water molecules shiftedfrom the extra to the intracellular compartment, due to theexcess of intracellular osmolarity. It resulted in cell swellingand extracellular volume reduction. The effect was globalbrain swelling and generalized ADC reduction. The latterwas apparently reversible. The ADC decrease during osmoticcell swelling supports the hypothesis that in acuteischemia cytotoxic cell swelling and extracellular volumereduction are the main causes of ADC decrease. Despite thetotal brain water increase (generalized brain swelling), T2signal did not increase, confirming water in excess beingbound within cells. Repeated ADC measurements duringcorrection of severe osmotic unbalance might help in therapyplanning.REFERENCES1. Trachtman H, Yancey PH, Gullans SR. Cerebral Cell VolumeRegulation during Hypernatremia in Developing Rats. BrainRes 1995;693:155-1622. Ayus JC, Armstrong DL, Arieff AI. Effects of Hypernatraemiain the Central Nervous System and Its Therapy in Rats andRabbits. J Physiol 1996;492:234-255KEY WORDS: Diffusion MR imaging, cytotoxic edema,hypernatremia
Poster 165Normal Maturation of Centrum Semiovale duringChildhood: Diffusion Tensor MR Imaging withSegmentation-Based MeasurementKitahara, S. · Ito, R. · Bun, K. · Murata, K.Shiga University of Medical ScienceOtsu, JAPAN381PostersPURPOSETo characterize the maturational changes of diffusion tensorMR imaging indices within segmented white matter from asupraventricular slab.MATERIALS & METHODSWe performed diffusion tensor MR imaging in 33 children(18 boys and 15 girls; age range, 6days-16 years) with a varietyof clinical symptoms and signs, of which the most commonwere febrile seizure and headache. Significant abnormalitieson conventional MR images and neurologic impairmentas determined by a review of medical records were notfound. Permission for usage of these data for research purposeswas obtained from guardians and this reporting wasapproved by the institutional review board. MR imaging wasperformed on a 1.5 T clinical MR system. For diffusion tensorMR imaging, diffusion-weighted images [single-shotdual spin-echo echo-planar pulse sequence; 7400/102msec(TR/TE); field of view 22 cm; 5 mm thick gapless; scanmatrix 96 x 96] of 17-21 axial locations were obtained.Diffusion sensitizing gradients were applied in six differentdirections with b-value of 700 sec/mm 2 . We generated pixelby-pixelmaps of isotropic apparent diffusion coefficient(ADC) and fractional anisotropy (FA) from the diffusionweightedimages and T2-weighted (b = 0 sec/mm 2 ) images.3D spoiled gradient-echo T1-weighted images [9.2/1.9msec(TR/TE); field of view 22 cm; scan matrix 256 x 128; 1mm thick] were obtained for tissue segmentation. Weresliced the T1-weighted images with the correspondingimaging thickness and location of the T2-weighted imagesand segmented white matter from the resliced images automaticallyusing brain image analysis tool, FSL (the ImageAnalysis Group, FMRIB, Oxford, UK). In each examination,a slab that included three continuous sections starting inferiorlyfrom the top of the lateral ventricles, where the corpuscallosum did not exist, was determined. We obtained meansof isotropic ADC and FA values within the area correspondingto segmented white matter at the supraventricular slabfor each subject. Nonlinear regression analysis was used forevaluating the relationship between the means of isotropicADC and FA values and subject age.RESULTSIn the Figure, scatterplots show mean isotropic ADC (A) andFA (B) values vs age. The data in A and B are fit to a monoexponentialmodel (solid lines) with determination coefficient(R 2 ) of 0.893 and 0.909, respectively. The dotted linesdenote the upper and lower limits of the 95% confidenceinterval s of means ADC and FA values at each age.CONCLUSIONThe diffusion tensor MR imaging indices derived from segmentedwhite matter also can describe the maturationalchanges of cenrum semiovale as the indices by region ofinterest (ROI) placement-based measurement that hasreported (1). The segmentation-based measurement seemseasy to eliminate bias in the placement of ROIs and regionalvariations of diffusion anisotropy in white matter.REFERENCES1. Mukherjee P, Miller JH, Shimony JS, et al. Normal BrainMaturation during Childhood: Developmental TrendsCharacterized with Diffusion-Tensor MR Imaging.Radiology 2001;221:349-358KEY WORDS: Diffusion tensor MR imaging, brain whitematter maturation, childrenPoster 166Fetal MR Imaging in the Diagnosis and Management ofFetal Head and Neck MassesJumper, J. R. · Barkovich, A. J. · Filly, R. A. · Ball, R. ·Glenn, O. A.University of California San FranciscoSan Francisco, CAPURPOSETo determine whether fetal head and neck masses are bettercharacterized with fetal MR imaging than with prenatalultrasound and to evaluate how fetal MR imaging alters familycounseling and treatment decisions regarding fetuseswith head and neck masses.MATERIALS & METHODSWe searched our institution’s imaging data base for fetuseswith head and neck masses. Six patients were identified. Allunderwent prenatal ultrasound and fetal MR imaging at ourinstitution. Fetal MR images were reviewed by two neuroradiologists;all prenatal ultrasounds were reviewed by an
Postersexpert in obstretrical ultrasound. Imaging studies were analyzedbased on the characterization, localization, extent anddifferential diagnosis of the mass lesion. Medical chartswere reviewed to determine if MR imaging findings changedpatient counseling or case management. Parents also wereasked if they made decisions based on the MR results.RESULTSMR imaging did not change or narrow the differential diagnosis.However, it did define more clearly the location of themass and its effects on surrounding structures such as oralcavity, oropharynx, and airway in all cases. Review of clinicalrecords revealed a change in case management or patientcounseling in every case. Four of six families stated that theimaging results did not influence their treatment decisions.One set of parents chose to terminate the pregnancy and oneset of parents made their child “do not resuscitate” based onthe MR results.382RESULTSTwenty-four subjects were studied (12 cases and 12 controls).Median age in the ADHD group was 8.5 years (range,7-11 years; SD = 1.48), and in the control group was 9.0years (range, 7-11 years; SD = 1.29). All children were righthanded,except for two cases and two controls. Analysis ofspectra showed no statistically significant difference in anyparameter between cases and controls. However, analysis ofthe NAA/Cr ratios between two cerebral regions showed astatistically significant reduction of neuronal activity in leftbasal ganglia in comparison with right frontal cortex in childrenaffected with ADHD (p = 0.034).CONCLUSIONMR spectroscopy showed a reduction in the neuronal activityof left basal ganglia in children affected with ADHD andmay prove to be a useful screening test in the diagnosis ofADHD in children.CONCLUSIONWhen a fetal head or neck mass is detected or suspected atUS, fetal MR imaging may better characterize it and demonstrateadditional findings that can alter treatment planningand case management.KEY WORDS: Fetal, MR imaging, neck massThe authors of this work have indicated the following affiliations/disclosures:Acuson: Consultant.Poster 167Utility of MR Spectroscopy for the Diagnosis of AttentionDeficit/Hyperactivity Disorderda Cruz, L. H. 1,2 · Vasconcelos, M. M. 3 · Esteves, L. 3 · Freitas,M. R. 3 · Domingues, R. C. 1,2 · Domingues, R. C. 1,21Multi-Imagem Ressonancia, Rio de Janeiro, BRAZIL,2CDPI Barrashopping, Rio de Janeiro, BRAZIL, 3 HospitalUniversitario Antonio Pedro - UFF, Niteroi, BRAZILPURPOSETo assess the utility of MR spectroscopy (MRS) to establisha diagnosis of attention deficit/hyperactivity disorder(ADHD).MATERIALS & METHODSA group of 12 boys with ADHD were compared with 12healthy boys of similar age. Diagnosis of ADHD was madeaccording to DSM-IV criteria. An informed consent wassigned by the caretaker. After medical screening, MRS wasperformed including three different cerebral areas: right prefrontalcortex, left prefrontal cortex, and left basal ganglia. Acomparison was made of the following MRS parametersbetween cases and controls: N-acetylaspartate(NAA)/creatine(Cr)ratio, choline(Cho)/Cr ratio, myo-inositol (mI)/Crratio, and glutamate peak. A comparison also was made ofthe neuronal activity by calculating the proportion betweenthe NAA/Cr ratios in two given regions, namely, right frontalcortex/left frontal cortex, left basal ganglia/let frontal cortex,and left basal ganglia/right frontal cortex.KEY WORDS: MR spectroscopy, attention deficit disorder,hyperactivity disorderPoster 168Limited Benefit of Gadolinium in Diagnosing Cause ofRadiologically Proven Cerebral Hemorrhages inChildren under Two Years of AgeFoerster, B. · Sundgren, P. C. · Ksar, J. · Jennings, J. ·Smythe, J. · Petrou, M. · Eldevik, P. · Maly, P. V.University of MichiganAnn Arbor, MIPURPOSETo evaluate the benefit of gadolinium in the MR evaluationof known intracranial hemorrhages in children under the ageof 2 years and review the radiologic findings in this population.MATERIALS & METHODSDuring a 7.5-year period (1995-2002), 57 gadoliniumenhancedMR examinations of the brain were performed inchildren less than 2 years old with intracranial hemorrhagesproven or suspected by CT, ultrasound, or previous MRimaging. The medical records, stated indications, and MRfindings were reviewed retrospectively. Thirty-four (60%) ofthe patients were less than 2 weeks old.RESULTSOf the 57 examinations reviewed, 8 (13%) showed pathologiccontrast enhancement. Of the 8, only 2 (4% of allexaminations) revealed an enhancing tumor related to thebleeding: in both patients prior CTs were performed thatindicated a probable mass associated with the hemorrhage.The remaining studies showed findings unlikely to be relatedto the bleeding: 2 patients had enhancing laminar necrosis,3 had enhancing meninges likely secondary to irritationfrom the blood products, and 1 had an enhancing pinealgland probably not related to his right posterior fossa hemorrhage.No pathologic enhancement was appreciated in 49studies. Findings which may be causatively related to thepreviously identified/suspected hemorrhages in these 49cases included probable venous sinus thrombosis (5 cases),possible AVM (1 case), possible mass (1 case), and possible
cavernous hemangioma (1 case). The remaining 41 examsdid not reveal an underlying brain structural abnormality thatmight have been related to the hemorrhage. Altogether, in 47(82%) patients, the MR examinations failed to reveal anyunderlying pathology of the hemorrhages.CONCLUSIONAdministration of gadolinium in children under the age of 2years with radiologically proven/suspected cerebral hemorrhagesto search for underlying pathology was only helpfulin an extremely small percentage of cases.KEY WORDS: Intracranial hemorrhage, gadolinium, MRimaging383CONCLUSIONAn exaggerated thoracic kyphotic angle is common in olderpatients even in the absence of vertebral body abnormalitysuch as height loss or compression. A bimodal distribution ispresent with a subpopulation of older men and women significantlymore affected by progressive kyphosis. Causes ofthis bimodal distribution could include asymmetric diskspace degeneration or innate hypermobility. Elder men andwomen with an exaggerated thoracic kyphotic angle mightidentify a population at risk for future vertebral body compressionfracture, in particular with the development of boneloss and osteoporosis. In addition, the value of vertebralbody height restoration with the vertebroplasty or kyphoplastytechniques must be considered in light of this datawhen treating vertebral compression fractures.PostersSpine169-185Poster 169Severe Thoracic Kyphosis in the Older Patient in theAbsence of Vertebral Fracture: Association of ExtremeCurve with AgeBartynski, W. S. · Heller, M. T. · Grahovac, S. Z. · Rothfus,W. E.University of Pittsburgh, Presbyterian University HospitalPittsburgh, PAPURPOSELimited imaging data are available on the natural history ofthoracic kyphosis in older patients. The purpose of this studywas to determine the distribution of the thoracic kyphoticangle in older patients without vertebral body abnormalitywhen compared to a young population.MATERIALS & METHODSThoracic kyphosis was measured by Cobb angle on standinglateral erect chest X-rays in 52 older patients (age > 65years) and in 63 young patients (age < 35 years). Onlypatients with normal-appearing spines were included andpatients with scoliosis, vertebral compression, vertebralbody angulation, or congenital anomaly were excluded.Results were tabulated, graphically plotted, and analyzed.RESULTSIn older patients (age > 65 years), the average thoracickyphotic angle was 41.7 degrees (s.d. ± 12.6) but the distributionwas bimodal with a lower mode at 29 o and a highermode at 50 o . Both men and women were affected equally. Inolder men, the distribution was bimodal with a lower modeof 29 degrees and an upper mode of 48 degrees (p < 0.05).In older women the lower mode was 29 degrees and theupper mode was 54 degrees (p < 0.05). In young patients,average thoracic kyphotic angle was 26.8 degrees (s.d. ±10.1). Surprisingly, the distribution in young women wasalso bimodal (p < 0.01) with a lower mode of 17 degrees andan upper mode of 38 degrees. The difference in averagekyphotic angle between the older and younger populationwas statistically significant (p < 0.001).KEY WORDS: Thoracic kyphosis, osteoporosis, vertebralfracturePoster 170Choice of MR Sequences in Ankylosing SpondylitisPatientsPeterova, V. · Forejtova, S. · Havelka, S. · Pavelka, K. ·Seidl, Z.Charles UniversityPrague, CZECH REPUBLICPURPOSEAnkylosing spondylitis (AS) is a major representative of thefamily of seronegative spondyloarthritides where spine andjoints are involved with a strong postinflammatory osteoplastictendency. Spinal MR imaging precisely differentiatessignal changes of the soft tissues, bone marrow, and medullaand therefore represents the best method focussing to theAS spinal ligament and bony changes. The aim of the studywas the evaluation of the inner contribution of various MRsequences to AS diagnosis.MATERIALS & METHODSWe prospectively studied 15 patients (5 women + 10 men,age 20-59 years, average age 35.93 years) with verifiedactive AS. All patients were investigated by a rheumatologistand a neurologist. Four patients suffered from II stage, 5from III one, 5 from IV stage and one from V stage of AS.MR investigation of the spine was made in: spin-echo (SE),turbo spin-echo (TSE) short tau inversion recovery (STIR)and combination of SE with gradient-echo (GraSE) in T1-and T2-weighted images on 1.5 T MR scanner without usingcontrast, 3 mm slices in sagittal and tranversal planes weremade.RESULTSPatients with AS quite often showed osteochondrosis (12patients, 80%), anterior longitudinal ligament hypertrophy(6 patients, 40%), yellow ligament hypertrophy (6 patients,40%), and spinal stenosis (5 patients, 33.33%). Vertebralsynostosis and the posterior longitudinal ligament hypertrophywere found only in one patient (6.67%). T1-weightedimaging in SE mode exactly viewed the morphologicalchanges and size of spinal components. Combination of gradient-echoand SE cuts down the investigation time slightly,but has no contribution to the diagnosis.
PostersCONCLUSIONIn our study we observed that in MR T2-weighted imagingin TSE mode represent the best possibilities of imaging ofeither changes in bone marrow or the ligament and soft tissuechanges of patients with ankylosing spondylitis, whilefat saturation can add more precise localization but prolongsthe imaging time. The differences between inflammatory andnoninflammatory changes cannot be differentiated on noncontrastMR scans.KEY WORDS: Ankylosing spondylitis, MR imaging,sequencesPoster 171Diffusion-Weighted MR Imaging of LumbarIntervertebral Disk Disease with Measurement ofApparent Diffusion Coefficient3840.74 +- 0.28 x 10 -3 mm 2 /s, which was significantly lower thanthat of normal volunteers. And the ADC value was lowerthan other normally appearing disks of the same patients. Inthe three patients with diskitis, the disks showed slightlyhigh signal intensity on T2-weighted images. However, theywere low intense on DW SSFSE images and the mean ADCvalue was (1.49 +- 0.32 x 10 -3 mm 2 /s) higher than the valueof other normally appearing disks of the same patients. TheADC values of distilled water (2.46 +- 0.14 x 10 -3 mm 2 /s)were almost the same as the known values. Discussion:Decrease of mean ADC values in the degenerated disk alsois consistent with diminished disk water diffusion in degenerativeintervertebral disk. In diskitis, higher ADC of theaffected disk than normal appearing disk supported an associationof increased disk water diffusion and inflammatorydisease. Apparent diffusion coefficient measurement mightbe helpful to diagnose diskitis if vertebral signal changeswere not remarkable, which were difficult to detect only onconventional MR images.Adachi, Y. · Ookubo, T. · Nakata, Y.University of YamanashiTamaho, JAPANPURPOSETo our knowledge, there have been a few reports about diffusion-weightedMR imaging with echo-planar sequence(DW EP) utilized for spinal lesions. Some of them providedadditional information for differential diagnosis. However,DW EP may fail to demonstrate some spinal lesions due toits unavoidable image distortion from susceptibility artifact,especially in intervertebral disk. Diffusion-weighted MRimaging with single-shot fast spin-echo sequence (DWSSFSE) is expected to improve conspicuousness of lesionsbecause of its lower susceptibility effect. The purpose of thisstudy was to evaluate the feasibility and utility of DWSSFSE in patients with lumbar intervertebral disk diseasewith measurement of apparent diffusion coefficient.MATERIALS & METHODSThe diffusion-weighted imaging with single-shot fast spinechosequence (DW SSFSE) was implemented on a 1.5 TSigna Horizon LX MR imaging system (General ElectricMedical Systems, Milwaukee, WI). A posterior spine coilwas used for RF reception of the NMR signal. All imageswere acquired with slice thickness = 4 mm, FOV = 30 x 18cm, NEX = 4, matrix = 128 x 128. Four images in the onesagittal plane were acquired with diffusion sensitizationalong the three directions with TR = 5002 ms, TE = 70.5 ms,b = 1000 s/mm 2 following an acquisition with b = 0. Thetotal imaging time was 80 s. Lumbar vertebral disk apparentdiffusion coefficients (ADCs) were calculated in regions ofinterest (ROIs) from DW SSFSE images positioned to avoidpartial volume errors from the vertebral body. Fourteen normalvolunteers and 23 patients with lumbar disk degeneration(n = 11), hernia (n = 10) or diskitis (n = 2) were examinedon this study. The mean age was 52 +- 18 years old. Insix patients, a syringe of distilled water was scanned simultaneouslyand the ADCs were calculated as a reference.RESULTSThe mean ADC value of the lumbar vertebral disk in normalvolunteers was 1.62 +- 0.33 x 10 -3 mm 2 /s (mean x 10 -3 mm 2 /s+- standard deviation). The mean ADC value of the lumbarvertebral disk in patients with lumbar degenerated disk wasCONCLUSIONIn conclusion, DW SSFSE is a useful technique for ADCmeasurement of the human lumbar vertebral disk and may bereliable for differentiation of lumbar intervertebral disk disease.KEY WORDS: Diffusion-weighted MR imaging, lumbarintervertebral disk disease, apparent diffusion coefficientPoster 172Benign Conditions Afflicting the Posterior Elements ofthe Pediatric Spine: A Pictorial Essay Emphasizing MRImaging and CTSimon, K. R. · Chaljub, G. · Shah, R. K. · Hernandez, J. A.University of Texas Medical BranchGalveston, TXPURPOSEExtensive work has been reported on imaging of traumaticconditions of the pediatric cervical spine. Our focus is onbenign process affecting the posterior column of the cervicalspine in children.MATERIALS & METHODSWe present typical CT and MR features of osteomyelitis,aneurysmal bone cyst, eosinophilic granuloma and spinabifida with a congenital dermal sinus cyst.RESULTSOur goal is to increase awareness of these benign processesto expedite prompt treatment.CONCLUSIONMore importantly, the correct identification of these benignentities will prevent unnecessary procedures in children.KEY WORDS: MR imaging, spine, posterior elements
Poster 173Spinal Cord Subependymomas: RadiopathologicCorrelationsNespoli, P. · Tampieri, D. · Sirhan, D. · Goulet, B. · Guiot,M. C. · Melanson, D.Montreal Neurological HospitalMontreal, PQ, CANADAPURPOSETo describe two cases of subependymoma of the spinal cord,the MR appearances, the operative, and histopathologic findings.MATERIALS & METHODSWe report two cases of spinal cord subependymomas, onethoracic, and the other in the filum terminalis. Both patientspresented, with a long history of paresthesia and low extremitiesweakness, one patient had bladder dysfunction. In thefirst case, the MR shows a fusiform dilatation of the thoracicspinal cord from the inferior aspect of T7 through the midaspect of T10, multiloculated with high signal intensity onT2-weighted imaging, intermediate signal intensity on T1-weighted imaging and minimal enhancement after gadolinium.In the second case, the MR imaging reveals the presenceof a homogeneous mass, isointense on T1-weighted imaging;slightly hyperintense on T2-weighted imaging andstrongly enhancing postgadolinium injection. The lesion isattached to the filum terminalis. We describe the operativefindings and the complete histopathologic examination,including electron microscopy (EM).RESULTSSubependymomas are rare, benign, slow growing, well circumscribedtumors, corresponding histologically to WHOGrade 1, located most frequently in the fourth ventricle (50-60%), and lateral ventricles (30-40%) (1, 2, 4). They occurvery rarely in the spinal cord: only 42 cases of spinalsubependymomas have been reported in the literature untilnow (1-3). The majority of the tumors are intramedullary, thecervical region being their most common location (3, 4). Incontrast with intracranial subependymomas, spinalsubependymomas are symptomatic because of the limitedspace within the spinal cord. Clinically they present withmotor and sensory deficits of the extremities, with or withoutback pain, similar to other intrinsic spinal cord tumors(1). The spinal subependymoma originates near the centralcanal. They are characterized by clusters of ependymal cellsarranged within a dense glio-fibrillary matrix, occasionallycontaining microcysts (1, 4).CONCLUSIONEven if subependymomas do not have a specific appearanceon imaging, it is very important to differentiate them fromastrocytomas and ependymomas. Subependymomas arebenign lesions, cured by total surgical resection and noradiotherapy is required (1, 5). The hypothesis of subependymomasshould be considered in case of spinal cord tumorsand electron microscopy is mandatory to confirm the diagnosis.385REFERENCES1. Shimada S, Ishizawa K, Horiguchi H, Shimada T, Hirose T.Subependymoma of the Spinal Cord and Review of theLiterature. Patholo Intern 2003;53:1692. Sarkar C, Mukhopadhyay S, Ratle AM, Sharma M, Gupta A,Gaikwad S, et al. Intramedullary Subependymoma of theSpinal Cord: A Case Report and Review of Literature. ClinNeurol Neurosurg 2003;106:64-693. Jallo G, Zagzag D, Epstein F. IntramedullarySubependymoma of the Spinal Cord. Neurosurgery1996;38:251-2574. Dario A, Fachinetti P, Cerati M, Dorizzi A. Subependymoma ofthe Spinal Cord: Case Report and Review of Literature. JClin Neurosci 2001;8:48-505. Hoeffel C, Boukobza M, Polivka M, Lot G, Guichard JP, LafitteF, et al. MR Manifestation of Subependymomas. AJNR Am JNeuroradiol 1995;16:2121-2129KEY WORDS: Spinal cord, tumor, MR imagingPoster 174Cystic Lesions in Lumbar Spinal CanalKhosla, A.Mallinckrodt Institute of Radiology/Veterans’Administration Medical CenterSt. Louis, MOCystic lesions within the lumbar spinal canal are seen infrequently.Different pathologic processes can present as cysticlesions within the lumbar spinal canal. A knowledge of suchlesions will be helpful in narrowing the differential diagnosis.Extramedullary cysts of the lumbar spinal canal mayproduce a slowly progressive myelo-radiculopathy, orradiculopathy. CT myelography and MR imaging haveimproved detection and understanding of these cysts.Currently, MR is the imaging modality of choice for thediagnosis and CT myelography is most helpful in establishingcommunication of the cyst with the subarachnoid space.In the future, CSF flow sensitive MR techniques will beavailable to accurately diagnose the cystic lesions of spinalcanal and to determine their communication with the subarachnoidspace. Surgical resection of symptomatic lesionsusually results in complete cure or significant neurologicimprovement. This work reviews the classification, pathophysiology,clinical presentation, and imaging features oflumbar extramedullary spinal cysts. The significant typesinclude - synovial cysts, ganglion cysts, perineural cyst, cysticprimary and secondary neoplasms, neuroenteric cysts,infectious processes, resolving hematoma, intra andextradural meningeal cysts, occult sacral meningocele, andimaging mimics of cystic lesions.KEY WORDS: Spinal canal, neoplasms, cystsPosters
386Poster 175Poster 176Percutaneous Treatment of Lumbar Facet Joint Synovial Post Lumbar Diskography CT: Angiography CT vsCyst: Technical Approach and Clinical ResultsConventional CTPostersBonaldi, G. 1 · Baruzzi, F. 2 · Agostinis, C. 1 · Facchinetti, A. 2 ·Lunghi, A. 1 · Peroni, F. 11Ospedali Riuniti, Bergamo, ITALY, 2 Ospedale di Circolo,Varese, ITALYPURPOSETo describe technical and procedural features of percutaneoustreatment of lumbar facet joint synovial cysts alongwith its radiologic aspects and to assess the clinical efficacy.MATERIALS & METHODSThe intervention is performed under CT guidance and localanesthesia with the patient in prone position; a 22 gauge needleis positioned either into the articular space or directlyinto the cyst itself. The first approach is preferred since contrastmedium injection following needle placement confirmscommunication of the cyst with the synovial space and thusthe articular nature of the lesion. Subsequently the cyst isfilled with steroids (betamethasone 6 mg/ml) in a variablequantity until rupture of the cyst is achieved. The cyst ruptureis confirmed by diffusion of the contrast material intothe epidural space (Figure). Nine patients have been treatedso far this way.Yang, L. · Parkey, J. · Perez, C. L. · Anderson, J. · Lane, T. ·McAnulty, A. · Bolesta, M. · Chason, D. P.University of Texas Southwestern Medical CenterDallas, TXPURPOSETo evaluate the utility of angiography CT (ACT) vs CT for theevaluation of the disk space following lumbar diskography.MATERIALS & METHODSTen patients underwent provocative lumbar diskography forthe evaluation of diskogenic low back pain on a standardangiography table equipped with rotational 3D imaging.Angiography CT (rotational sequence) was performedimmediately following completion of the study. Routineconventional postdiskography CT was obtained within 1.5hours following the procedure. Angiography CT images ofthe injected disk spaces were reviewed in standard orthogonalplanes (MPR) on a 3D workstation in a bone window andcompared to routine helical CT for the distribution andextent of annular fissuring.RESULTSAngiography CT provided nearly equivalent diagnostic qualityimages of the disk space/nuclear morphology followinglumbar diskography when compared to conventional CT.The restricted axial FOV required additional acquisitions insome cases. Angiography CT had the advantage of beingable to be performed immediately following diskographythereby limiting the dissipation of the injected contrast.Figure: needle placed in the articular space and contrastmedium in the ruptured cyst and diffusing through the ipsilateralforamen.RESULTSIn all cases direct puncture of the cyst or of the synovialspace was obtained as well as, in every case, filling of thecyst with contrast medium and rupture after steroid injection.Clinical results are favorable in a 3- to 18-month follow-up.One patient was retreated with the same technique owing torecurrence of pain 3 months after the first treatment.CONCLUSIONPercutaneous treatment of lumbar facet joint synovial cystsis easy, safe and, in our limited series, effective. This techniquedeserves to be proposed as first choice before a moreaggressive surgical treatment.KEY WORDS: Spine, facet joints, interventional procedure
CONCLUSIONAngiography CT is a promising new technique that has thepotential to obviate the need for conventional postdiskographyCT in the evaluation of the lumbar disk, as well as savingtime, cost, and radiation exposure to the patient.KEY WORDS: Lumbar diskography, CTPoster 177Incorrect Needle Positioning during Lumbar EpiduralSteroid Administration: Inaccuracy of Loss of PressureResistance and Requirement of Fluoroscopy andEpidurography during Needle InsertionBartynski, W. S. 1,2 · Grahovac, S. Z. 2 · Rothfus, W. E. 21University of Pittsburgh, Pittsburgh, PA, 2 PresbyterianUniversity Hospital, Pittsburgh, PAPURPOSEMidline lumbar epidural steroid injections are commonlyperformed blindly without fluoroscopic guidance, using the“loss of resistance” technique (1). The purpose of this studywas to evaluate the need for imaging assistance during midlinelumbar epidural steroid injection (LESI) by establishingthe incidence of inaccurate extracanal needle placement withloss of pressure resistance.387soft tissues occurs in 16% of procedures using a relativelylarge (20 gauge) Tuohy needle. Fluoroscopy and contrastinjection with epidurogram is essential to establish incorrectneedle tip positioning and confirm epidural position whenthe canal is correctly engaged (2).REFERENCES1. Lumbar Epidural Nerve Block. In: Waldman SD. Atlas ofInterventional Pain Management. Philadelphia: WBSaunders;1998:308-3172. Johnson BA, Schellhas KP, Pollei SR. Epidurography andTherapeutic Epidural Injections: Technical Considerationsand Experience with 5334 Cases. AJNR Am J Neuroradiol1999;20:697-705KEY WORDS: Epidural steroid, lumbar, techniquePoster 178Visualization of Percutaneous Vertebroplasty NeedleTracks on Postprocedure CT: Is the Needle Along theIntended Path?Prasad, J. · Nguyen, T. · Miller, W. · Belanger, E. · Goyal, M.· Lum, C.University of OttawaOttawa, ON, CANADAPostersMATERIALS & METHODSA single operator performed 25 consecutive midline LESIprocedures during a 3-month period. After trajectory towardthe posterior lumbar epidural space was determined andlocal anesthetic applied, a 20 gauge Tuohy needle was insertedinto the back soft tissues and connected via a short tube toa standard 3 cc syringe filled with 1.5 cc air and 1.5 cc nonioniccontrast. Needle was advanced to the epidural spaceand intermittent testing with air in the air/contrast syringewas performed to establish persistent positioning in the backsoft tissues. When pressure resistance in the syringe was lost,a small amount of contrast was injected to determine needletip positioning. If the tip remained outside the spinal canaland not in the posterior epidural space, the needle was furtheradvanced with fluoroscopic assistance until the spacewas entered accurately. The incidence of false position of theneedle outside the spinal epidural space was reviewed retrospectivelyand tabulated.RESULTSIn 4 of 25 patients (16%), resistance to syringe air pressurewas lost during needle insertion while the needle tip positionwas still within the back muscles and soft tissues. In oneinstance, tip position was recognized easily as quite far fromthe spinal canal. In 3 patients, the tip position was overlyingthe region of the spino-laminal line and hypertrophic facetssuggesting that the tip position could be correct. Contrastinjection confirmed tip position external to the ligamentumflavum and still in the back soft tissues. When the posteriorepidural space finally was entered, epidurogram with contrastinjection confirmed correct needle tip positioning.CONCLUSIONSimple loss of air pressure resistance is an inadequatemethod of establishing needle tip positioning in the posteriorepidural space. Inaccurate needle tip position in the backPURPOSEPercutaneous vertebroplasty (PV) with polymethylmethacrylate(PMMA) can be via a uni or bipedicularapproach. For the unipedicular approach, a more obliquetranspedicular course is desired to achieve a final midlineposition in the vertebral body. However, during fluoroscopy,the exact transpedicular trajectory of the needle in the axialplane is unknown. The needle track may be seen on CT followingPV and can help verify the operator’s technique. Wedescribe in this presentation our technique for the unipedicularapproach and review the post-PV CT scans to determinethe frequency of an identifiable needle track.MATERIALS & METHODSThe approach angle for a unipedicular injection is determinedfrom the preprocedure CT and the image-intensifier(I-I) is rotated relative to the midline spinous process. The11/13 gauge needle is aligned “down the barrel.” The I-I thenis rotated back to a position where the pedicle is best visualized.The needle is advanced through the pedicle ensuringnot to breech the pedicle’s medial cortex. Twenty consecutivepatients who underwent PV were evaluated. Nineteenpatients had symptomatic (subjectively described to be >7/10 on a pain scale), clinically reproducible pain, fromosteoporotic compression fractures; 1 had PV for metastases.Seventeen patients had post-PV CT scans available andformed the study population. Each CT was reviewed retrospectivelyfor an identifiable needle track by 2 neuroradiologistsexperienced in performing PV. A needle track wasdefined as a contiguous, lucent line, seen through the pedicleand/or vertebral body, with or without associated PMMAalong the tract. Errors in needle placement were defined astracks contiguous with fracture lines from needle placementor breaks in the medial cortical margin of the pedicle. Theadequacy of vertebral body filling with PMMA was judgedsubjectively by distribution and volume to be good or unsat-
Postersisfactory. Clinical follow-up was performed from telephoneinterviews with a significant reduction in pain defined as a 4-point decrease in pain score.RESULTSPercutaneous vertebroplasty was performed at 25 levels (14in the lumbar and 9 in the thoracic spine). Fourteen levelswere treated via a unipedicular approach and 11 via abipedicular approach. Needle tracks were identifiable in 28of 36 (78%) pedicles. One of 36 (3%) had an associated thoracicrib fracture secondary to attempted costotransversepedicularapproach. Good filling of the vertebral body withPMMA was seen in 24 of 25 (96%) levels. Clinical followupwas available in 16 patients, with 12 (75%) reporting significantreduction in pain.388RESULTSThe procedure was technically successful in all cases, withno complications. Specifically, there was no evidence ofmovement of the fragments or worsening of the canal stenosis.No patients developed symptoms related to canal stenosis.CONCLUSIONMR/CT imaging was helpful in evaluating these fracturesand planning treatment. Symptomatic relief was achieved inmany patients, but not at the rate seen in patients with lesssevere fractures.KEY WORDS: Vertebroplasty, stenosisPoster 180Magnetization Transfer Characterization of AxonalChanges Post Spinal Cord Transection in Live LampreySpinal CordCONCLUSIONThe track and trajectory of the needle used for injection ofPMMA in PV is identifiable in a significant proportion ofpatients on postprocedure CT scans. This information can beuseful for those learning PV to judge the adequacy of theirtechnique, so that optimal needle placement can be achieved.KEY WORDS: Vertebroplasty, CT, techniquePoster 179Vertebroplasty of Compression Fractures of the Spinewith Retropulsed Fragments Causing Canal StenosisMiller, D. A.Mayo ClinicJacksonville, FLPURPOSEVertebroplasty is an effective method for treating compressionfractures of the spine. However, the method always hasbeen limited in the case of more severe fractures, particularlythose with fragments of bone retropulsed into the spinalcanal.MATERIALS & METHODSWe have treated an initial series of 10 patients who presentedwith symptoms of debilitating pain from compressionfractures and had large fragments in the canal creatinggreater than 40% canal stenosis. No patients presented withsymptoms related to spinal stenosis. The patients were notconsidered surgical candidates (for a variety of reasons) andwere treated with vertebroplasty alone.Popescu, A. M. 1 · Uematsu, H. 1 · Zhang, G. 1 · Wright, A. C. 1· Wehrli, S. L. 1 · Wehrli, F. W. 1 · Selzer, M. E. 1 · Hackney, D.B. 21University of Pennsylvania, Philadelphia, PA, 2 Beth IsraelDeaconess Medical Center, Harvard Medical School,Boston, MAPURPOSEMagnetization transfer (MT) can enhance tissue contrast andprovide information on neural tissue composition based onthe exchange of 1 H magnetization between pools of relativelyfree water and protons with restricted motion (1, 2). In aprevious study (6) we found that in the normal lampreyspinal cord the calculated magnetization transfer ratios(MTRs) were determined by the membrane density. We usedfeatures of sea lamprey spinal cord, characterized by rapidspontaneous axonal regeneration after injury (3), to determinewhether changes in MTRs may correlate with changesin axon density in response to trauma and repair.MATERIALS & METHODSTwenty-nine larval sea lamprey spinal cords were studied(six excised normal spinal cords, five at 2 and six for each 5,10, and 15 weeks after injury). The excised cords wereplaced in a capillary tube filled with Ringer solution and thenin a home-built solenoid transmit-receive RF coil (1.5 mmdiameter) (4, 5). MT micro-MR imaging was performed ona 400 MHz system. We used a conventional spin-echosequence with and without a presaturation MT block pulseapplied 6500 Hz off water resonance. Two 0.25 mm thicksections were selected, at 2.5 mm rostral and caudal to theinjury site. The in-plane resolution was 23 x 23 microm 2 .Spinal cord viability was maintained by limiting scan timeand keeping coil temperature as low as possible. The ROIswere placed on different regions of the white matter (notethat lamprey lacks myelin and WM is used only as a conventionfor the regions of SC that comprise axons) and MTRcomputed for all the drawn ROIs.RESULTSThe ROIs were placed on the dorsal columns of WM abovethe injury site, containing ascending sensitive fibers and alsoon the ventral columns below the transection site, containing
descending motor fibers. The calculated MTRs in all drawnROIs decreased progressively, reaching their minimum (P
PostersREFERENCES1. Zur Y, Wood ML, Neuringer LJ. Motion-Insensitive, Steady-State Free Precession Imaging. Magn Reson Med1990;16(3):444-4592. Casselman JW, Kuhweide R, Deimling M, et al. ConstructiveInterference in Steady State-3DFT MR Imaging of the InnerEar and Cerebellopontine Angle. AJNR Am J Neuroradiol1993;14(1):47-573. Baskaran V, Pereles FS, Russell EJ, et al. Myelographic MRImaging of the Cervical Spine with a 3D True Fast Imagingwith Steady-State Precession Technique: Initial Experience.Radiology 2003;227(2):585-5924. Ramli N, Cooper A, Jaspan T. High Resolution CISS Imagingof the Spine. Br J Radiol 2001;74(885):862-8735. Gasparotti R, Ferraresi S, Pinelli L, et al. Three-DimensionalMR Myelography of Traumatic Injuries of the BrachialPlexus. AJNR Am J Neuroradiol 1997;18(9):1733-1742KEY WORDS: Cervical spine, 3 T, 3D FIESTA-CPoster 182MR Findings of Epidural Analgesia Mimicking SpinalEpidural AbscessIkushima, I. 1 · Maeda, H. 1 · Hirai, T. 2 · Korogi, Y. 3 ·Yamashita, Y. 2 · Koganemaru, M. 1 · Suga, R. 11Miyakonojo Medical Association Hospital, Miyakonojo,JAPAN, 2 Kumamoto University School of Medicine,Kumamoto, JAPAN, 3 University of Occupational andEnviromental Health, School of Medicine, Kitakyushu,JAPANPURPOSESpinal epidural abscess is one of the major complications ofepidural analgesia for back pain, which MR findings havebeen reported by several authors. However, it is supposedthat the continuous injection via epidural catheter may causethe abnormal MR findings mimicking spinal epiduralabscess even without infection. The purpose of this study isto assess the MR findings of epidural analgesia.MATERIALS & METHODSMR findings of five patients who underwent epidural analgesiawere evaluated retrospectively. The reasons for performingMR imaging included catheter dysfunction in twopatients, and fever, lumbago, and follow-up (no symptom) inone each. Axial and sagittal, T1- and T2-weighted spin-echo(SE) imaging and postcontrast fat suppressed T1-weightedSE were performed. In three patients with catheter dysfunctionor fever, presence of infection was denied microbiologically.Each case was evaluated for MR signal intensity, location,extent, delineation, and enhancement pattern. In threecases with catheter dysfunction or fever, follow-up MRimaging was performed within 5 to 70 days, and the intervalchange of the MR findings also was evaluated.RESULTSIn all five cases, the posterior epidural lesions were identified;the lesion showed iso to hypointense relative to thespinal cord on T1-weighted images, isointense to CSF onT2-weighted images, and homogeneous enhancement onpostcontrast images. The abnormal enhancements extendedfrom two to seven vertebral bodies in length. In three cases,390the enhanced lesion had some mass effect compressing thethecal sac. Follow-up MR imaging demonstrated no intervalchanges in all three cases.CONCLUSIONChronic epidural analgesia may show similar MR findings toepidural abscess.KEY WORDS: Spine, MR imaging, infectious diseasesPoster 183Emerging Role of 16-Row Multidetector CTAngiography in the Diagnosis and Management of AcuteCervical FracturesChoi, M. H. · Ramirez, I. · Lev, S.Nassau University Medical CenterEast Meadow, NYPURPOSEOur objective is to present the emerging role of 16-rowangiography (MDCTA) in the diagnosis and management ofacute traumatic cervical fracture and associated vascularinjuries.MATERIALS & METHODSA 0.5 sec rotation, 16 slice helical CT (Somatom Sensation,Siemens) was used. Image parameters were: single breathacquisition at 120 kVp and 200 mAs, slice width = 2 mm,collimation of 1.5 mm and table speed of 24 mm per gantryrotation. Injection of 120 cc of nonionic contrast mediumwas given at rate of 4 cc/sec through an 18G catheter. Bolustriggering with a threshold of 120 HU was utilized. ThreedimensionalVRT and MIP reformations were generatedfrom axial source images at workstation. Upon identifyingfractures with possible vascular injuries, MDCTA from theaortic arch to the circle of Willis was performed immediately.RESULTSSixteen-row MDCTA has been able to demonstrate a plethoraof vascular injuries such as great vessel transection, dissection,and pseudoaneurysms. It also is useful in assessingtherapeutic neurointerventional procedures. This exhibitdemonstrates 16-row MDCTA of the head and neck, andassociated CT findings of acute cervical fractures. SixteenrowMDCTA allows shorter acquisition times, greater coverage,and superior image resolution often obviating the needfor conventional or digital angiography.
391CONCLUSIONIn the evaluation acute cervical fracture that may involvevascular injury, the use of 16-row MDCTA enables the radiologistto produce timely vascular maps that clearly identifynot only the fracture but also the salient vascular findingsand often obviating the need for conventional or digitalangiography.KEY WORDS: Multidetector CT angiography, cervical fracture,vascular injuryPoster 184Willisian Collateral Circulation Is Not a Determinant ofInfarct Volume or Infarct Topography in MCA StrokeLiebeskind, D. S. · Krezja, J. · Hurst, R. W. · Weigele, J. B.· Melhem, E. R. · Aguirre, G. K.University of PennsylvaniaPhiladelphia, PAPURPOSEWillisian collaterals play a prominent role in the setting ofcarotid stenosis or occlusion. Primary collaterals at the circleof Willis also may sustain perfusion in distal leptomeningealanastomoses during acute ischemia due to middle cerebralartery (MCA) occlusion. We assessed the relationship of vascularpatency in the intracranial circulation with infarct volumeand infarct topography in MCA stroke.MATERIALS & METHODSRetrospective review of simultaneous MR imaging and MRangiography (MRA) studies in 96 cases (median age 65years, range 18-89 years; 54:42 M:F) of MCA stroke.Vascular patency in each segment of the intracranial circulationon MRA was graded as occluded, exhibiting partialflow, or patent. MCA infarct topography and volume calculationswere determined from diffusion-weighted sequences.Multivariate logistic regression analysis determined predictorsof infarct volume and infarct topography based on vascularpatency data.RESULTSMCA territory infarcts (51:45 L:R) were classified as full in15 cases. Partial cortical involvement was noted in 71 cases,with divisional infarcts in 17. Partial subcortical lesions werenoted in 32 cases, with isolated lenticulostriate involvementin 10 cases. Infarct volume (mean 35.2 cm 2 , SD ± 39.5 cm 2 )correlated with lesion topography. MCA patency was predictiveof infarct volume (p = 0.05) and infarct topography.MCA occlusion correlated with lenticulostriate involvement(p = 0.05), although cortical infarction was variable. Internalcarotid artery patency and presence or absence of all componentsof the circle of Willis exhibited no relationship withinfarct volume. Even in cases of MCA occlusion, the presenceof Willisian collaterals were not predictive of infarctvolume or infarct topography.CONCLUSIONWillisian collaterals demonstrated on MRA are not predicitveof infarct volume or infarct topography in MCA stroke.Infarct volume is determined by the degree of vascularocclusion in the proximal MCA. Cortical sparing and theextent of infarction in MCA stroke may be determined byleptomeningeal collaterals, yet the depiction of Willisian collateralson MRA does not reflect such secondary collateralization.REFERENCES1. Liebeskind DS. Collateral Circulation. Stroke 2003;34:2279-22842. Hoksbergen AW, Legemate DA, Csiba L, Csati G, Siro P,Fulesdi B. Absent Collateral Function of the Circle of Willisas Risk Factor for Ischemic Stroke. Cerebrovasc Dis2003;16:191-1983. Hendrikse J, Hartkamp MJ, Hillen B, Mali WP, van der Grond J.Collateral Ability of the Circle of Willis in Patients withUnilateral Internal Carotid Artery Occlusion: Border ZoneInfarcts and Clinical Symptoms. Stroke 2001;32:2768-27734. Hermier M, Nighoghossian N, Adeleine P, et al. Early MagneticResonance Imaging Prediction of Arterial Recanalizationand Late Infarct Volume in Acute Carotid Artery Stroke. JCereb Blood Flow Metab 2003;23:240-248KEY WORDS: Collateral circulation, stroke, MR angiographyPoster 185Quantitative MR Findings in Patients with Mild toModerate Carpal Tunnel SyndromeArcharya, D. · Shewchuk, J. · Heagerty, P. J. · Jarvik, J. G.University of WashingtonSeattle, WAPURPOSETo evaluate quantitative MR findings of the median nerveespecially in relation to clinical symptoms in patients withmild to moderate carpal tunnel syndrome.MATERIALS & METHODSWe performed high resolution MR of the carpal tunnel in 30subjects with mild to moderate carpal tunnel syndrome whowere participants in one of two on-going prospective studies.All subjects had standardized nerve conduction studies, clinicalevaluations, and completed questionnaires that includedthe Carpal Tunnel Syndrome Assessment Questionnaire(CTSAQ), a well validated measure of symptoms (11 questions)and function (8 questions), scored on 1-5 scale with 1being best function/symptoms and 5 worst. High resolutionimages were obtained using phased-array wrist coils: 1.coronal SE, TR = 600, TE minimum, 18 cm FOV, 256 x 192matrix, 4 mm thick, 4 minutes; 2. axial T1-weighted SE, TR= 450, TE minimum, 10 cm FOV, 256 x 256 matrix, 4 mmthick, 1 mm skip, 5.5 minutes; 3. axial fast-STIR, TR =3650, TE = 54, TI = 160, echo train length = 6, 10 cm FOV,256 x 224 matrix, 4 mm thick, 1 mm skip, 5.25 minutes. Tworeaders, blinded to all clinical information, independentlymeasured the median nerve width, height, and area at preselectedanatomically defined points (distal radio-ulnar joint,pisiform, hook of the hamate, and the beginning of the proximalmetacarpals). Measurements also were made where thePosters
Postersnerve was largest in cross-sectional area as where the nervewas 'flattest' in configuration. Carpal tunnel area was measuredat the hook of the hamate and where the nerve was flattest.Finally, the length of median nerve signal abnormalitywas measured. We used bivariate correlation and linear multivariateregression to evaluate the association between MRfindings and symptoms as measured by the CTSAQ. Weanticipate 150 subjects to be enrolled by June, <strong>2004</strong> and alsowill incorporate nerve electrodiagnostic studies into the dataanalysis.392RESULTSThe mean age was 48 years (range 32-69 years), 27 (90%)subjects were female and 26 (87%) were white. Mean symptomscore was 2.92 (0.77 sd) out of 5; the mean functionalstatus score was 2.56, (0.90 sd). Inter-reader reliability wasmoderate to high for the majority of measurements (significantPearson correlations 0.78-0.91) except for the distalradio-ulnar joint and 'flattest' configuration. The nerve areaat its largest point was associated positively with both symptomand functional summary scores, day pain, numbness,and weakness. The extent of abnormal signal was associatedwith symptom and function summary scores, severity ofnighttime and daytime pain, and weakness.CONCLUSIONMR imaging can be used reliably to quantitatively measurethe carpal tunnel and median nerve. Limitations include resolutionat the edge of the coil, which may be responsible forpoorer inter-reader reliability at the proximal metacarpaljoint. The nerve area at its largest point and the length of signalabnormality were associated with symptoms and function.Comparison will be made with electrodiagnostic studies.KEY WORDS: Carpal tunnel, MR imaging, peripheral nerve
Notes:Posters
PostersNotes:
395Scientific Exhibits 1-115Exhibit Hall 4B (Level 4)Monday, June 76:00 PM – 9:00 PMTuesday, June 8 - Thursday, June 106:30 AM - 9:00 PMFriday, June 116:30 AM – 11:45 AMNOTE: eSE = Indicates abstract is part of the electronicExhibit (eSE) Pilot Project and can be viewedin the Computer Exhibit area.A missing Scientific Exhibit number indicates anabstract has been withdrawn.Adult Brain1-66Scientific Exhibit 1Brain Diffusivity in Patients with NeuropsychiatricSystemic Lupus Erythematosus and New AcuteNeurologic SymptomsWelsh, R. C. · Foerster, B. · Jennings, J. E. · Sundgren, P. C.University of Michigan HospitalAnn Arbor, MIPURPOSETo investigate whether diffusion-weighted imaging candepict cerebral abnormalities in patients with acute symptomsof neuropsychiatric systemic lupus erythematosus(NPSLE) and if significant differences in measured ADChistograms between these patients and normal controlsexists.MATERIALS & METHODSConventional MR imaging of the brain and diffusionweightedecho-planar imaging (DWI) were performed on 1.5T scanner (GE Medical Systems) in 11 female NPSLEpatients, aged 35-59 years, mean 44.4 years, and in 11 agedmatchedhealthy controls. Whole brain apparent diffusioncoefficient (ADC) histograms were composed in all patients.To remove noise and CSF explicit cuts were done at 100 x10 -6 mm 2 /sec and 2000 x 10 -6 mm 2 /sec in the ADC values andeach subject’s histogram was normalized to have the sum of1. The mean ADC, the width of the ADC distribution, the leftto right distribution (skewness) and how extended the histogramwas (kurtosis) was evaluated in each subject.Average values and SD was calculated. P-value < 0.05 wasset for statistical significance using Students t-test.RESULTSTen of the eleven patients (90%) had abnormal findings onMR imaging. The most common findings were scattered singleor multifocal foci or patchy areas of increased signal onT2-weighted and FLAIR images in the deep and in theperiventricular white matter without any pathologic contrastenhancement. Other abnormal findings included acute andold infarcts, volume loss or brain atrophy and pathologicmeningeal contrast enhancement. The NPSLE patients had amean ADC value of 1012 x 10 -6 mm 2 /sec and the control hada mean ADC value of 973 x 10 -6 mm 2 /sec. The mean ADCvalues were significantly higher (p < 0.02) in the NPLSEpatients compared to the controls. There were no statisticalsignificant differences in the width, skewness, or kurtosisbetween the two groups.CONCLUSIONADC histogram analysis demonstrated increased general diffusivityin the brain in NPSLE patients with acute symptomsas compared with healthy normal controls. This finding suggeststhat in the brain parenchyma of NPSLE patients a lossof tissue integrity occurs and facilitates motility of freewaterprotons. However larger studies are needed to evaluatethe present method for its value to study disease progression,or its use in treatment control.KEY WORDS: Brain diffusivity, apparent diffusion coefficient,neuropsychiatric systemic lupus erythematosusScientific Exhibit 2Which Exam to Perform in Cerebral VenousThrombosis: MR Imaging or Multislice CT?Marro, B. · Wlachovska, B. · Randoux, B. · Deux, J. F. ·Alamowitch, S. · Andreux, F. · Marsault, C.Tenon HospitalParis, FRANCEPURPOSETo describe direct and indirect signs of cerebral venousthrombosis (CVT) using MR imaging, MR venography(MRV), CT and CT venography (CTV).MATERIALS & METHODSFrom our experience and from literature data, we evaluatedaccuracy of MR imaging (1.5 T, GE and Siemens) and CT(16-slice CT, Siemens) in CVT diagnosis.RESULTSThe presentation contains: a) A brief description of normalcerebral venous anatomy; b) An illustration of direct signs(intraluminal thrombus) and indirect signs (cerebral edema,venous infarction, subarachnoid hemorrhage, subduralhematoma) of CVT; c) A comparison of different MRAsequences ( 3D phase-contrast, 2D time-of-flight, gadolinium-enhanced3D MRV);. d) The contribution of nonenhancedCT and CTV with emphasis on postprocessing (multiplanarreconstruction, volume rendering technique); e) Thepotential pitfalls in CVT diagnosis; f) A comparison of CTVand MRV.Scientific Exhibits
396CONCLUSIONScientific Exhibit 4Both MR imaging and multislice CT are highly accurate forCerebral Sinus Venous Thrombosis: The Challenge inCVT diagnosis. The main advantage of MR imaging is evaluationof parenchymal changes. Conversely cerebral venousDiagnosissystem is better visualized by multislice CT.Poon, C. S. · Chang, J.KEY WORDS: Cerebral venous thrombosis, MR imaging-MRvenography, multislice CT-CT venographyState University of New York Upstate Medical UniversitySyracuse, NYScientific ExhibitsScientific Exhibit 3Dynamic CT Perfusion Imaging with AcetazolamideChallenge for Evaluation of Cerebral Hemodynamics inPatients with Chronic Steno-Occlusive Vascular DiseaseYen, P.Buddhist Tzu Chi Medical CenterHualien, TAIWAN REPUBLIC OF CHINAPURPOSETo investigate the validity of dynamic CT perfusion (CTP)with acetazolamide (ACZ) challenge for the assessment ofcerebral hemodynamic changes in patients with chronicsymptomatic atherosclerotic arterial steno-occlusive disease.MATERIALS & METHODSDynamic CTP with ACZ challenge was performed in 25consecutive patients (mean age 65 years, range 37 to 81years) with unilateral occlusion or severe stenosis of theircerebral arteries. Regional cerebral blood flow (rCBF) of thesame regions of interest before and after ACZ challengewere measured. Regional cerebrovascular reactivity (rCVR)then was calculated.RESULTSFour patterns of hemodynamic change involving the ipsilateralmiddle cerebral and/or anterior cerebral arterial territorieswere identified. There were 4 patients in type 1 (normalrCBF, normal rCVR); 6 patients in type 2 (normal rCBF,decreased rCVR), 10 patients in type 3 (decreased rCBF,decreased rCVR); and 5 patients in type 4 (decreased rCBF,normal rCVR).CONCLUSIONDynamic CTP with ACZ challenge can provide valuablehemodynamic information and depict abnormalities of perfusionin patients with chronic cerebral steno-occlusive disease.REFERENCES1. Ogasawara K, et al. Cerebrovascular Reactivity toAcetazolamide and Outcome in Patient with SymptomaticInternal Carotid or Middle Cerebral Artery Occlusion: AXenon-133 Single-Photon Emission Computed TomographyStudy. Stroke 2002;33:1857-18622. Nabavi DG, et al. CT Assessment of Cerebral Perfusion:Experimental Validation and Initial Clinical Experience.Radiology 1999;213:141-149KEY WORDS: Acetazolamide, CT perfusion, cerebral arteryocclusionPURPOSECerebral venous sinus thrombosis remains an underdiagnoseddisease. The clinical presentation of venous sinusthrombosis is nonspecific. Since the disease is relativelyuncommon, it often is not suspected until the radiologist firstsuggests the diagnosis. When the disease is diagnosed early,effective treatment can be provided promptly. In contrast,delayed diagnosis and treatment can result in severe complications,such as cerebral hemorrhage, infarction or death. Itis therefore paramount for the radiologist to be familiar withthe clinical presentation, as well as the various radiologicfeatures of the disease. The purpose is to review the pathophysiology,clinical presentation, and diagnostic features ofcerebral venous sinus thrombosis.MATERIALS & METHODSA review of the current literature on the diagnosis of cerebralvenous sinus thrombosis is conducted using Medline searchand cross-referencing of the acquired literature. Literature inboth children and adults is included. The results are pooledwith the experience from our own institution.RESULTSWe summarize the risk factors, clinical signs and symptomsof cerebral venous sinus thrombosis. A diagnostic algorithmis outlined. Diagnostic features of the disease on nonenhancedand contrast-enhanced CT, CT venography, MRimaging, MR venography and conventional angiography aredemonstrated using the cases from our institution.CONCLUSIONHigh clinical suspicion and familiarity of the diagnostic featuresof venous sinus thrombosis facilitate its early diagnosis,which can have a significant impact on the clinical outcome.Although MR imaging and MR venography remainthe diagnostic test of choice, it remains important to befamiliar with the diagnostic features on CT as it remains themost common screening study for patients presenting withneurologic complaints.KEY WORDS: Venous, sinus, thrombosis
Scientific Exhibit 5“Penguin Silhouette Sign”: Useful MR Diagnostic Signfor Progressive Supranuclear PalsyOba, H. · Kutomi, K. · Furui, S.Teikyo University School of MedicineTokyo, JAPANPURPOSENeuropathologically, progressive supranuclear palsy (PSP)shows marked atrophy of midbrain tegmentum. Penguinshave small heads and big bodies. “Penguin Silhouette sign”was composed on midsagittal MR images in which midbraintegmentum represents penguin’s small head and pons representspenguin’s big body (especially king penguin). The aimof this study was to establish diagnostic MR criteria andimaging sign (“Penguin Silhouette sign”) for the diagnosis ofPSP.MATERIALS & METHODSMR images of 69 patients with Parkinsonian syndrome [21patients with PSP, 23 patients with Parkinson disease (PD),25 patients with multiple system atrophy, Parkinson type(MSA-P), 17 patients of multiple system atrophy, cerebellartype (MSA-C), three patients of corticobasal degeneration(CBD), five patients of dentatorubropallidoluysian atrophy(DRPLA), three patients of Machado-Joseph disease (MJD)and 20 age-matched normal controls subjects were studied].MR images of 69 patients with Parkinsonian syndrome [21patients with PSP, 23 patients with PD, 25 patients withMSA-P and 20 age-matched normal control subjects werestudied prospectively for measuring the area of midbraintegmentum and pons and the ratio (area of the midbraintegmentum/area of the pons)]. The areas of midbraintegmentum and pons were measured on midsagittal MRimages using display tools of the workstation belonging tothe MR unit. The ratio of the area of midbrain tegmentum tothe area of pons was evaluated also in all Parkinsonian syndromeand normal control subjects. The midsagittal MRimages of all patients and normal control subjects were evaluatedvisually. The shape of midbrain tegmentum and pons(focusing its shape) resembles or does not resemble the penguinsilhouette.RESULTSThe average of the area of midbrain in patients with PSP(56.0 mm 2 ) was significantly smaller than that in patientswith PD (103.0 mm 2 ) or MSA-P (97.2 mm 2 ) and agematchedcontrol group (116.9 mm 2 ). The ratio of the area ofthe midbrain tegmentum to the area of pons in patients withPSP (0.124) was significantly smaller than that in patientswith PD (0.208), MSA-P (0.266), and normal control subjects(0.237). On visual evaluation, all PSP patients, four offive patients of dentatorubropallidoluysian atrophy, and oneof three patients of corticobasal degeneration showed“Penguin Silhouette sign.”397CONCLUSIONThe measurement of the area of the midbrain tegmentum onmidsagittal MR images can be used as a reliable measure todifferentiate PSP from other Parkinsonian syndrome andnormal aging. “Penguin Silhouette sign” also can be a usefuldiagnostic sign for PSP. However, CBD and DRPLA canshow this sign.KEY WORDS: Progressive supranuclear palsy, Parkinsoniansyndrome, MR imagingScientific Exhibit 6Nuclei and Tracts of the Human Medulla: MRMicroscopy at 9.4 TNaidich, T. P. · Tai, A. W. · Delman, B. N. · Delgado, J. E. ·Aguinaldo, J. G. S. · Perl, D. P. · Wolfe, D. E. · Hof, P. R. ·Drayer, B. P.Mount Sinai Medical CenterNew York, NYPURPOSEThe purpose of this study was to explore how well MRmicroscopy (MRM) could display the fine anatomical detailand 3D organization of the nuclei and fiber tracts of thehuman medulla.MATERIALS & METHODSUsing previously reported methods (1), the normal nucleiand tracts of the human medulla were displayed in threeorthogonal planes at a resolution of 60-70 microns (in plane)by 500 microns (slice thickness) using a Brüker Avance 9.4T unit, intermediate-weighted pulse sequences (TR 2000, TE30, 20 NEX, 3-3.5 cm field of view, 512 x 512 matrix) andthree formalin-fixed human medullae from cadavers with noknown neurologic disease. Nissl and Luxol fast blue stainsprovided precise correlation between the MR appearanceand the nuclear and fiber tract anatomy of the very samespecimens.RESULTSMR microscopy convincingly displays the sites, contours,and relationships among the hypoglossal, dorsal vagal, solitary,medial/ inferior vestibular, dorsal/ ventral cochlear, andspinal trigeminal nuclei and their tracts. The gracilus andcuneatus (medial and lateral) are seen to continue throughthe internal arcuate fibers, and then decussate to become themedial lemnisci. The dorsal longitudinal, medial longitudinal,and anterolateral fasciculi are defined clearly in relationto these structures. The inferior, the medial accessory, andthe dorsal accessory olivary nuclei are displayed beautifullyin relation to their encompassing amiculum. The pyramids,external arcuate fibers and nuclei, dorsal and ventral spinocerebellartracts, restiform bodies and medullary striaedefine the surface. Multiple individual fascicles of thehypoglossal nerve easily are traced through the full thicknessof the medulla from their origin in the hypoglossal nucleusdorsally, to course between the inferior and medial olivarynuclei, and then exit ventrally. Cine display permits thephysician to trace individual structures through the length ofthe stem and helps to integrate their 3D relationships into acoherent image of brainstem structure.Scientific Exhibits
CONCLUSIONMR microscopy at 9.4 T greatly advances the anatomicaldetail demonstrable in specimen medullae. Those familiarwith this anatomy may well be able to appreciate fineranatomical features on clinical images obtained with thehigher field 4.7 T, 7 T, and 8 T units now being introduced atselected sites.REFERENCES1. Fatterpekar GM, Naidich TP, Delman BN, et al.Cytoarchitecture of the Human Cerebral Cortex: MRMicroscopy of Excised Specimens at 9.4 Tesla. AJNR Am JNeuroradiol 2002;23:1313-1321398decussate in the superficial medullary velum of the fourthventricle and emerge just lateral to its frenulum. Cine displaypermits the physician to trace individual structures throughthe length of the stem and helps to integrate their 3D relationshipsinto a coherent image of brainstem structure.CONCLUSIONMR microscopy at 9.4 T greatly advances the anatomicaldetail demonstrable in specimen mesencephala. Those familiarwith this anatomy may well be able to appreciate fineranatomical features on clinical images obtained with thehigher field 4.7 T, 7 T, and 8 T units now being introduced atselected sites.Scientific ExhibitsKEY WORDS: Medulla, anatomy brain, MR microscopyScientific Exhibit 7Nuclei and Tracts of the Human Midbrain: MRMicroscopy at 9.4 TNaidich, T. P. · Delgado, J. E. · Delman, B. N. · Tai, A. W. ·Aguinaldo, J. G. S. · Gultekin, H. S. · Perl, D. P. · Hof, P. R.· Delman, B. P.Mount Sinai Medical CenterNew York, NYPURPOSEThe purpose of this study was to explore how well magneticresonance microscopy (MRM) could display the fineanatomical detail and 3D organization of the nuclei and fibertracts of the human mesencephalon.MATERIALS & METHODSUsing previously reported methods (1), the normal nucleiand tracts of the human midbrain were displayed in threeorthogonal planes at a resolution of 60-70 microns (in plane)by 500 microns (slice thickness) using a Brüker Avance 9.4T unit, intermediate-weighted pulse sequences (TR 2000, TE30, 20 NEX, 3-3.5 cm field of view, 512 x 512 matrix) andthree formalin-fixed human mesencephala from cadaverswith no known neurologic disease. Nissl and Luxol fast bluestains provided precise correlation between the MR appearanceand the nuclear and fiber tract anatomy of the verysame specimens.RESULTSMR microscopy convincingly displays the individual grayand white strata of the inferior and superior colliculi, theirdecussations and peduncles; and the intercollicular nuclei.The central gray matter is related to the dorsal and mediallongitudinal fasciculi, the nuclei and tracts of the trochlearnerve, the nuclei and tracts of the mesencephalic trigeminalnerve, and the tectospinal tracts. Surrounding these, concentrically,lie the cuniform and interstitial nuclei, the spinothalamic,dorsal trigeminothalamic and central tegmental tracts,and the anterolateral fasciculi, enclosed by an outer ringformed by the medial lemnisci and red nuclei. The ventralmidline displays the oculomotor and accessory oculomotornuclei, the multiple individual fascicles of the third nerve,and the interpeduncular nuclei. The partes compactae andreticulatae of the substantiae nigrae and the tracts of the cerebralpeduncles lie ventrolaterally. The trochlear nervesREFERENCES1. Fatterpekar GM, Naidich TP, Delman BN et al.Cytoarchitecture of the Human Cerebral Cortex: MRMicroscopy of Excised Specimens at 9.4 Tesla. AJNR Am JNeuroradiol 2002;23:1313-1321KEY WORDS: Midbrain, brain anatomy, MR microscopyScientific Exhibit 8MR Imaging of Hypertrophic Olivary DegenerationPatel, S. R. · Hunter, G.Massachusetts General HospitalBoston, MAPURPOSEHypertrophic olivary degeneration is a form of transsynapticdegeneration which develops as a result of focal lesions ofthe Guillain-Morraret triangle (dentate-rubro-olivary pathway),which is composed of the contralateral dentate nucleus,the ipsilateral red nucleus, and the ipsilateral inferior olivarynucleus. The degeneration is characterized initially byneuronal loss (T2 hyperintense olive of the medullar oblongata)followed by neuronal and glial hypertrophy (enlargedmedullary olive). Clinically, the patients present with palatalmyoclonus and an uncontrollable tremor. Identification of aT2 hyperintense hypertrophic olivary nucleus associatedwith a brainstem tegmental or cerebellar lesion makes otherdiagnoses such as infarction, demyelination related to multiplesclerosis, neoplasms and infectious or inflammatoryprocesses less likely.MATERIALS & METHODSMagnetic resonance (MR) images and clinical presentationof five patients with olivary degeneration caused by cerebellaror brain stem pathology were reviewed.RESULTSClinical presentation and MR findings of five patients withMR findings of hypertrophic olivary degeneration are presented.
CONCLUSIONThe diagnosis of hypertrophic olivary degeneration shouldbe strongly suggested by the presence of an olivary lesion inassociation with another lesion in the contralateral cerebellardentate nucleus, contralateral superior cerebellar peduncle,ipsilateral red nucleus, or ipsilateral pontine tegmentum.KEY WORDS: Olivary degenerationScientific Exhibit 10Role of 3D MR Imaging in Current Treatment ofParkinson’s DiseaseLee, C. · Young, A. B. · Ellis, P. A. · Michaels, S. J. · Given,C. A. · Sanders, MUniversity of KentuckyLexington, KYPURPOSEThe treatment of tremor disorders, particularly Parkinson’sdisease (PD), for those 10% of patients who do not respondto levadopa includes deep brain stimulators (DBS) targetingspecific basal ganglia nuclei, and direct hormone replacementvia MR stereotactic-guided microcatheters into theglobus pallidus. Three most common sites for DBS are theglobus pallidus interna to control rigidity in PD, ventrointermediate(VIM) nucleus of the thalamus to control essentialand rest tremors of PD, and the subthalamic nucleus forimproving not only tremors in PD but also akinesia, bradykinesia,and rigidity. Algorithmic formulas based on constructionof an AC-PC (anterior and posterior commissure) lineand brain atlas measurements exist for all three sites forDBS. However, direct targeting of these foci by the visualizedanatomy is more accurate than the algorithmic formulasdue to variations. Thus definition and recognition of thebasal ganglia anatomy on MR imaging is critical for precisetargeting. This exhibit will review the pertinent basal gangliaanatomy and illustrate how the foci are selected.MATERIALS & METHODSAll patients were imaged on 1.5 T MR with routine sets ofimages as well as 1 mm reformatted T1-weighted MP-RAGE in all three planes with a Leksell head framereviewed on a Leksell imaging workstation from 1999 to2003. Targeting for subthalamic nucleus only dates back to2001. The VIM was targeted in 40 and the bilateral subthalamicnucleus in nine. Additional 2 mm T2-weighted coronalimages were obtained for the subthalamic nucleus patients.The globus pallidus was targeted for 10 patients for microcatheterinsertions. The anterior and posterior commissureswere identified on the 1 mm 3D volume images allowing theAC-PC line to be constructed. Both the algorithmic formulaand direct anatomical visualization of the targeted nucleuswere applied before making a final selection. Intraoperativemicroelectrode monitoring confirmed the targeting by characteristicelectrical patterns.RESULTSThe exact mechanism of DBS is not known, but unlike surgeryDBS is reversible and more precise. Errors of 2-3 mmon initial targeting may require a second craniotomydefect/entry site and the stereotactic device reinserted. Only399one required retargeting after initial successful response. TheT1-weighted MP-RAGE or GRASS 3D MR imaging wasmost accurate for measurements, but does not afford the bestimaging of the basal ganglia. Thin section T2-weightedimages even at 2 mm show enough distortion so they are notas accurate for localization. There was significant improvementin all 10 patients targeted for microcatheters.CONCLUSIONGlobus pallidus interna targeting utilizes the optic tract as atarget point but there are variabilities in its location. Theglobus pallidus usually is seen well on the T1-weightedimages. The VIM is located in the inferior and lateral portionof the thalamus in the anterior half on the sagittal. The subthalamicnucleus on axial is lateral to the midline red nucleiand posterior to the substantia nigra between the two. On thecoronal the subthalamic nucleus is lateral to the massa intermediaand above it, and below the thalamus. Even with T2-weighted images the subthalamic nucleus was often difficultto see.KEY WORDS: Deep brain stimulators, Parkinson’s disease,basal ganglia targetingScientific Exhibit 11Symmetrical Basal Ganglia Abnormalities on MRImaging: Beyond the CalcificationsPatel, S. R. · Roig, Z.Massachusetts General HospitalBoston, MAPURPOSETo demonstrate the broad spectrum of diseases whichinvolve the basal ganglia in a symmetrical fashion.MATERIALS & METHODSWe retrospectively reviewed the internal search engine(FOLIO VIEWS) at our institution since 1998 for MR imagingwith basal ganglia signal abnormalities. Diagnosis wasestablished by clinical findings, laboratory data and/or characteristicimaging findings.RESULTSWe present a poster-based presentation of clinical and MRfindings of disease entities such as Hallervorden-Spatz,Maple Syrup Urine, subacute necrotizing encephalopathy(Leigh disease), hepatolenticular degeneration (Wilson’s disease),Huntington’s, Parkinson’s, carbon monoxide poisoning,anoxia/hypoxia/ischemia, manganese therapy, and hepatocerebraldegeneration which cause symmetrical basal gangliasignal abnormalities.CONCLUSIONA number of disease entities can affect the basal gangliasymmetrically. This exhibit will present the entities, clinicalpresentation, and characteristic MR imaging of patients withthe varied diseases.KEY WORDS: Basal gangliaScientific Exhibits
Scientific ExhibitsScientific Exhibit 12Toxic Leukoencephalopathy Secondary to HeroinInhalation: “Chasing the Dragon”Vertinsky, T. 1 · Medvedev, G. 1 · Keogh, C. 2 · Andrews, G.11University of British Columbia Hospital, Vancouver, BC,CANADA, 2 Wexford General Hospital, Wexford, IRELANDPURPOSETo present a pictorial essay demonstrating the CT, MR imagingand MR spectroscopy findings of toxic leukoencephalopathysecondary to heroin vapor inhalation. Initialpresentation, short-term and intermediate follow-up imagingfindings are described. A brief description and history ofheroin inhalation, also known as “chasing the dragon” as aform of heroin abuse, is provided.MATERIALS & METHODSEight patients who presented within the past 2 years at UBCaffiliated institutions are described. All patients had a historyof drug abuse, including heroin and/or cocaine inhalation.Six of these patients were male and two were female. Mostpatients were of Asian descent. Noncontrast CT was performedin seven of the patients at initial presentation. MRimaging was performed within the first week following presentationin six patients. MR spectroscopy was performed inthree patients. Two patients had follow-up studies at approximately1 year. Three patients had follow-up studies at 10days to 1 month after presentation.RESULTSThe patient presentations were nonspecific, including obtundation,ataxia and a parkinsonian syndrome. All patientsdemonstrated striking symmetric white matter abnormalities,consisting of hypodensity on CT and T2/FLAIR hyperintensityon MR imaging within the cerebellum, peduncles, andposterior limbs of the internal capsules. More extensiveinvolvement was seen in the more severely affected patientswith additional symmetric involvement of the white matterof the parietal and occipital lobes and involvement of thewhite matter tracts of the brainstem. The imaging findings inour patients were typical of changes associated with heroininhalation toxicity described in the literature. Of the twopatients with 12-month follow-up, one demonstrated nochange of initial findings and reported continued heroinabuse. The second patient demonstrated partial reversal ofthe initial CT changes with less prominent and less extensivehypodensity seen within the white matter at 12 months. Thethree patients with short-term follow-up demonstrated progressionof the initial changes, with more marked hypodensityof the white matter and development of cerebral edemaand hydrocephalus, paralleling clinical deterioration. MRspectroscopy showed decreased NAA levels and a lactatepeak, suggesting anaerobic metabolism. Autopsy of onepatient revealed spongiform degeneration of the white matterwith vacuoles in the distribution of imaging abnormalities,findings considered characteristic of heroin inhalationtoxicity.400CONCLUSIONLeukoencephalopathy due to inhalation of heroin pyrolysate,which was first described in the Netherlands in 1982, wasnot recognized at our institution until 2002. Since then, thisentity has presented repeatedly in our patient population,suggesting an increased frequency of heroin administrationby “chasing the dragon” or a new impurity in thecocaine/heroin obtained by drug abusers in this city. To date,a specific impurity responsible for this condition has notbeen identified. Given the unreliability of the patient populationand vague clinical presentations, characteristic imagingfindings are key to diagnosing this condition. Althoughtreatment is mainly supportive, early intervention may helparrest progression of the white matter changes and identificationof affected patients may assist in finding the toxicagent.KEY WORDS: Toxic leukoencephalopathy, heroin, chasingthe dragonScientific Exhibit 13Spectrum of Imaging Features in Wilson’s DiseaseDelman, B. N. · Schilsky, M. · Naidich, T. P. · Velickovic, M.· Fatterpekar, G. M. · Choi, P. S.Mt. Sinai Medical CenterNew York, NYPURPOSEWilson’s disease (WD, hepatolenticular degeneration) is anautosomal recessive disorder of copper transport in whichthere are low levels of the serum transport protein ceruloplasminas well as excessive binding of copper in the liver.After the liver is saturated, abnormally high amounts of copperaccumulate in secondary organs such as the brain, kidneys,and eyes. Patients are imaged frequently to assessdegree of parenchymal disease, but patterns of involvementcan vary widely. This exhibit illustrates the spectrum ofimaging features seen in patients with moderate to advancedWilson’s disease.MATERIALS & METHODSBetween July 2000 and September 2003, eight patients (M:F= 5:3, mean age 22.8 ± 10.7 years) with clinically provenWD presented for MR scans in our department; eight wereimaged once, four twice, and one thrice, yielding a total of13 scans. In addition to routine brain imaging, eight examinationswere performed with more advanced sequences suchas spoiled gradient-echo volumetric imaging, axial high resolutionT2-weighted imaging through the brainstem andbasal ganglia, diffusion tensor, and spectroscopy.RESULTSCommon findings in WD patients most characteristicallyinclude increased T2-weighted signal in the caudates andputamina, the regions also most likely to develop the cavitationthat presumably correlates with necrosis, spongiformdegeneration, and demyelination seen histologically. Thethalami also are involved frequently, although the medialand posterior nuclei may be less involved. There also may bediffusely increased signal in the belly of pons as well as inpyramidal and extrapyramidal tracts in general, but some
certain tracts such as the medial longitudinal fasciculus andmedial lemniscus can be spared. As in other liver disorders,hyperintensity on T1-weighted imaging in the basal gangliamay be related to manganese deposition rather than copperexcess. Generalized atrophy is common with disease progression.Spectroscopic findings include reduced NAA/creatinelevels in the corpora striata, and elevated choline/creatinein the belly of pons. A lactate doublet is noted in some.Changes over time are seen in those patients who underwentmore than one scan. Specifically, the progression of cavitation,changes in NAA and lactate, and development of atrophyare shown.CONCLUSIONTypical and less common imaging features of WD are discussedand the pathophysiology of WD is reviewed.Changes in disease appearance over time are identified also.Understanding of the imaging features in WD can suggestthe diagnosis and characterize disease progression.KEY WORDS: Wilson’s disease, imaging, featuresScientific Exhibit 14Chasing “Chasing the Dragon” with MR Imaging:Leukoencephalopathy in Drug AbuseBartlett, E. S. · Mikulis, D. J.University of Toronto, Toronto Western HospitalToronto, ON, CANADAPURPOSESpongiform leukoencephalopathy is a known rare complicationfrom inhalation of heroin vapor, a practice commonlyreferred to as “chasing the dragon.” The clinical onset of thisdisorder is relatively insidious and the patient histories areoften confusing. However, the MR appearance of this disorderis dramatic and is considered pathognomonic for heroininducedspongiform leukoencephalopathy. Multiple casestudies have been published with various imaging techniquesand proposed mechanisms of this disorder.Nonetheless, this phenomenon remains poorly understood.We present three new cases of leukoencephalopathy in drugabuse, showing that conventional MR findings are notpathognomonic for heroin vapor toxicity. Although one ofour cases mimics the conventional MR findings of heroinvapor toxicity, this patient was a cocaine user, having neverused heroin. We compared these findings with those fromour known heroin-related cases via conventional MR imaging,MR spectroscopy, MR perfusion and MR diffusionweightedimaging. Evaluating spongiform leukoencephalopathyin this setting provided additional clues tounderstanding the pathophysiology of heroin-inducedspongiform leukoencephalopathy.MATERIALS & METHODSTwo of our three patients presented in the subacute phase oftheir encephalopathy and had documented heroin abuse viadrug pyrolysis and inhalation of the heated vapor. The thirdpatient presented with an acute change in consciousness andalthough his MR findings were typical for spongiformleukoencephalopathy, his history and toxicology screen werepositive for cocaine, benzodiazepines, and lidocaine, but not401heroin. Conventional MR imaging, MR spectroscopy, MRperfusion and MR diffusion-weighted imaging were performedin these cases and compared.RESULTSThe conventional MR findings for all three patients weresimilar showing diffuse symmetrical white matter changes.In our heroin patients, MR spectroscopy showed an increasein lactic acid and myoinositol with normal N-acetyl aspartate,choline, and lipids. In our patient with cocaine exposure,MR spectroscopy showed an increase in lactic acid andin lipids. A five-month follow-up MR image was performedin one of our patients with heroin-related disease. He hadprogressive white matter changes and continued to have amarked increase in lactic acid, all in the setting of a normalMR perfusion study and with steady clinical improvement.CONCLUSION1) All three cases have MR findings suggestive of spongiformleukoencephalopathy. However, not all cases of diffuse,symmetric spongiform leukoencephalopathy are heroin-induced.MR spectroscopy may help to differentiatebetween toxicity due to heroin and other illicit substances. 2)In cases of heroin-induced change, the discordance betweenperfusion and spectroscopy (i.e., normal blood flow but elevatedlactic acid) suggests that the disease is due to impairedenergy metabolism at the cellular level. 3) MR findings ofspongiform leukoencephalopathy secondary to heroin canprogress despite abstinence of the drug and during clinicalimprovement. This suggests that the MR changes are an evolutionof existing injury.KEY WORDS: Heroin pyrolysis, spongiform leukoencephalopathy,chasing the dragonScientific Exhibit 15Correlation of MR Findings with PET and SPECTImaging in Intractable EpilepsyGanapathy, S.University of Texas Health Sciences CenterSan Antonio, TXPURPOSEThe purpose of this exhibit is to evaluate the MR findings inpatients with intractable epilepsy in correlation with PETand SPECT images and study the combined efficacy of MRimaging and nuclear studies in detection of lesions.MATERIALS & METHODSMost patients with intractable epilepsy had nuclear imagingstudies performed in addition to the standard MR studies. Aprospective and retrospective study of the imaging findingsof such patients over a 1-year period in our institution wasdone. SPECT imaging in the interictal period and during theictal phase in a few patients was performed. Selectedpatients also had FDG-PET imaging.RESULTSOne of the most common abnormalities noted on MR imagingin patients with intractable epilepsy was mesial temporalsclerosis. Several of the patients also had normal MR stud-Scientific Exhibits
Scientific Exhibitsies. Interictal and ictal SPECT and PET studies performed inthese patients were able to confirm the findings of MR imagingin localization of seizure focus in most cases. The sensitivityand predictive value of MR in these groups of patientswith respect to the activity seen on nuclear studies was doneand the results presented.CONCLUSIONStandard MR imaging done with epilepsy protocol in combinationwith nuclear studies improves the efficacy in detectionof lesions in patients with intractable seizures.KEY WORDS: Intractable epilepsy, MR imaging, PETPaper 15AEpilepsy: The Emerging Role for the NeuroradiologistTurecki, M. B. · Basham, M. C. · Morris, G. L.Aurora HealthcareMilwaukee, WIPURPOSEEpilepsy is a common neurologic affliction of children andadults. It carries an estimated annual incidence of up to 1 per1000, and a prevalence of up to 5 per 1000 children. The past2 decades have seen a major advancement in understandingthe causes of epilepsy that have changed significantly itsmanagement.MATERIALS & METHODSRecords of the neuroimaging exams from a busy epilepsyservice were reviewed. Patients with refractory epilepsywere selected for the study. All exams with identifiable brainlesions were reviewed and correlated with pathology reportswhen available. The images of the most interesting and clinicallysignificant neuroanatomical substrates of epilepsy arepresented and accompanied by an educational review.402RESULTSThis scientific exhibit will elucidate an overview of epilepsyfor the neuroradiologist. The classification of different typesof seizures will be reviewed. Common imitators of epilepsyare listed. A typical diagnostic flow diagram of the evaluationand treatment of epilepsy are displayed. The clinicaldiagnosis of seizures including typical EEG tracing, longtermvideo EEG monitoring, use of implantableelectrode/grids are discussed. Underlying neuroanatomicaletiologies for seizure are demonstrated in the form of multimodalityneuroimaging and photomicrographs. A pictorialreview of etiologies including congenital, focal cortical dysplasia,neuronal migration disorders, gliosis, mesial temporalsclerosis (MTS), dysembryoplastic neuroepithelial tumor,arachnoid cyst, vascular malformations, CVA, brain neoplasms,genetic syndromes (i.e., MELAS, Sturge-Weber) aredemonstrated. Special attention is paid to MTS with its multiplemanifestations, relative distribution, as well as commonmimickers. The anatomy of the limbic system are reviewedusing a combination of anatomical drawings and MRimages. Multiple cases of MTS will be demonstrated toallow the neuroradiologist to gain experience in detectingthis subtle finding. Qualitative and quantitative approachesin detecting MTS are discussed. The primary findings of volumeloss as well as hyperintense signal on long TR imagesof the hippocampus is demonstrated. Secondary findings,including mamillary body/fornix atrophy, ipsilateral dilatationof the temporal horn and atrophy of the temporal lobe isdemonstrated. The diagnosis of mesial temporal sclerosis isimportant, as up to 90% of patients can be cured with surgeryand removal of the eleptogenic focus. The neuroradiologistis involved in evaluating lateralization of normal functionand pathologic lesions prior to surgery. Indications, technique,diagnostic ramifications, and complications of theWADA test are discussed. The WADA intracranial amobarbitaltest is vital in a presurgical workup to evaluate memoryand speech. The expanding role of surgery, including thedifferent types of epilepsy surgery, indications and typicalpostoperative images is emphasized. Potentially new imagingtechniques such as surface coil high-resolution MRimages, FMRI, PET, magnetoencephalography (MEG), andMR spectroscopy are discussed.CONCLUSIONEpilepsy is a serious disorder with long-term consequences.Neuroradiologists have an emerging role to differentiate theunderlying neuroanatomical substrates of epilepsy.Evaluation and lateralization of pathologic lesions as well asnormal function will guide treatment and help predict prognosis.The goal of the neuroradiologist should be to providethis service more accurately and noninvasively in the future.KEY WORDS: Epilepsy, mesial, surgeryScientific Exhibit 16Lesion-Induced Neurovascular Uncoupling Can MimicCortical Reorganization by BOLD Functional MRImagingUlmer, J. L. 1 · Hacein-Bey, L. 1 · Mathews, V. P. 2 · DeYoe, E.A. 1 · Prost, R. W. 1 · Schmainda, K. M. 1 · Mueller, W. M. 1 ·Krouwer, H. G. J. 11Medical College of Wisconsin, Milwaukee, WI, 2 IndianaUniversity Medical Center, Indianapolis, INPURPOSELesion-induced neurovascular uncoupling is a recognizedphenomenon that may impact the accuracy of BOLD functionalMR imaging (fMRI) data. The purpose of this exhibitis twofold: 1) to illustrate how lesion-induced neurovascularuncoupling along with recruitment of homologous brainregions in the contralesional hemisphere may mimic transhemisphericreorganization or dominance, and 2) to show anovel technique utilizing a visual functional field map(FFmap) to characterize neurovascular uncoupling inducedby a variety of cerebral pathologies.MATERIALS & METHODSA retrospective review of 65 recent consecutive clinicalfMRI examinations revealed 7 patients in whom the BOLDfMRI appearance of hemispheric language and motor systemdominance in the contralesional hemisphere was ultimatelyproven to be misleading by alternative localization methods.Pathologies included gliomas (4), AVMs (2) and tumefactiveencephalitis (1). Hemispheric fMRI laterality ratios werecompared to actual hemispheric dominance verified by elec-
trocortical stimulation, WADA testing, posttreatment deficitsand/or lesion-induced deficits. Functional MR imaging activationmaps were generated with cross-correlation (P < 0.01)or t-test (P < 0.01) analysis. For visual system pathologies,FFmaps were generated using coordinates derived fromeccentricity and polar angle mapping, and the retinotopicorganization of visual cortex. These maps spatially correlatediscrete cortical activation areas to corresponding stimuluslocations in the visual fields. By comparing FFmaps to visualfield testing, the extent of neurovascular uncouplingrevealed 12 additional patients with visual system pathologiesincluding hemorrhagic cavernoma, migraines, AVMs,chronic strokes, and an arachnoid cyst.RESULTSReduced fMRI signal in perilesional eloquent cortex associatedwith preserved or increased signal in homologous contralesionalmotor or language cortex suggested functionaldominance opposite the side of the lesion in 7 cases, suggestingpossible lesion-induced transhemispheric corticalreorganization or compensation. In three patients with leftinferior frontal gyrus lesions (2 gliomas, 1 tumefactivemeningoencephalitis), fMRI incorrectly suggested strongright hemispheric speech dominance. Functional MR imagingincorrectly suggested contralesional primary motor dominancein 3 patients (2 gliomas, 1 AVM) and SMA dominancein 1 patient (AVM). Pathophysiologic factors thoughtto have contributed to neurovascular uncoupling are illustratedin this exhibit and included direct tumor infiltration,neovascularity, cerebrovascular inflammation and AVMinducedhemodynamic effects. Of the 12 patients withlesions in the visual system where FFmap-visual field mapcomparisons were made, AVMs showed the greatest extentof neurovascular uncoupling. However, the neurovascularuncoupling induced by AVMs was quite variable from onepatient to another.CONCLUSIONLesion-induced neurovascular uncoupling causing reducedfMRI signal in perilesional eloquent cortex in conjunctionwith normal or increased activity in homologous contralesionalbrain, may simulate hemispheric dominance or lesioninducedcortical reorganization. Quantifying neurovascularuncoupling using a visual system model indicates that AVMsare likely to cause neurovascular uncoupling, but that theeffect is quite variable from one patient to another. Furtherstudies are needed to determine the factors that underlieAVM and tumor-induced neurovascular uncoupling and todevise strategies to improve the accuracy of BOLD fMRI insuch cases.KEY WORDS: Neurovascular coupling, fMRI, brain lesionsThe authors of this work have indicated the following affiliations/disclosures:1. Dana Foundation Clinical HypothesesProgram in Imaging: Financial support; 2. NationalInstitutes of Health (Bethesda, MD) EB00843, EY13801,RR0-0058, National Institutes of Health (Bethesda,MD)/National Cancer Institute CA 82500: Financial support;3. Medical College of Wisconsin Cancer Center:Financial support.403Scientific Exhibit 17Relationship between Cortical Reorganization andWhite Matter Architecture Revealed Preoperatively byFunctional MR Imaging and Diffusion Tensor ImagingUlmer, J. L. · Salvan, C. V. · Hacein-Bey, L. · DeYoe, E. A.· Aralasmak, A. · Prost, R. W. · Mueller, W. M. · Meyer, G.A.Medical College of WisconsinMilwaukee, WIPURPOSETo demonstrate the relationship between altered cortical andwhite matter organization in patients with congenital brainlesions, using functional magnetic resonance imaging(fMRI) and diffusion tensor imaging (DTI). A secondarygoal is to determine how an understanding of these relationshipsmight enhance the prediction of functional networkreorganization preoperatively in such patients.MATERIALS & METHODSBOLD FMRI and DTI data were obtained in 10 patients, 14to 58 years old, with congenital brain lesions being consideredfor surgical management. Gray matter organization wasstudied with fMRI data analyzed using a cross-correlationanalysis and a p < 0.01. White matter structure was studiedusing fractional anisotropy (FA) and direction-sensitivecolor-coded FA maps. Functional assessments were performedusing superselective WADA testing in 6 patients.Lesions included AVMs (7 cases), a schizencephaly, a symptomaticatretic encephalocele, and a cavernoma. Functionalsystems involved that were tested with fMRI included sensori-motor,language, and visual systems.RESULTSIn all 10 patients, the congenital lesions disrupted the normalarchitecture of the subcortical U-fibers. Seven of the 10patients showed fMRI activation patterns within language,sensori-motor or visual cortex that were consistent with corticalreorganization. This was supported, though not proven,by superselective WADA testing in 5 patients. In each of the7 patients with cortical reorganization, altered architecture ofassociation, commissural, and/or projection white matterfasciculi and tracts were demonstrated by DTI. These wererelated functionally to the cortical systems mapped by fMRI.Abnormal fasciculi or tract architecture imaged included thesuperior longitudinal fasciculus (SLF), cingulum, coronaradiata, and internal capsule, optic radiations, inferior occipito-frontalfasciculus, inferior longitudinal fasciculus, andthe corpus callosum and callosal fibers. In one patient, ahematoma associated with a left superior temporal gyrusAVM caused a receptive aphasia and apraxia indicatinginjury to posterior language cortex and the SLF respectively,with near complete recovery. Functional MR imagingshowed right hemispheric language dominance and thinningof the left SLF. In this case, the association between corticalreorganization and abnormal white matter architecture mayhave been from a combination of congenital and acquiredeffects. In two patients, a small precentral sulcus regionAVM and a left middle frontal gyrus/inferior frontal sulcuscavernoma showed no associated cortical reorganization oraltered fasciculi architecture. In four AVM patients, differentiatingbetween altered hemispheric cortical organization andScientific Exhibits
Scientific Exhibitsthe effects of neurovascular uncoupling was not possible,though the altered white matter architecture supported thesuggestion of genuine cortical reorganization.CONCLUSIONThere is a high association between cortical reorganizationdetected with fMRI and altered architecture of major whitematter bundles detected with DTI in patients with congenitalbrain lesions. This association may improve the accuracy offMRI in distinguishing between genuine cortical reorganizationand the effects of neurovascular uncoupling. Also, DTIin particular may be crucial in the preoperative planning ofthese patients, given that white matter is not accessible atmost centers at this point (as is the cortex) to intraoperativemapping.KEY WORDS: fMRI, DTI, brain reorganizationThe authors of this work have indicated the following affiliations/disclosures:1. Dana Foundation Clinical HypothesesProgram in Imaging: Financial support: 2. NationalInstitutes of Health (Bethesda, MD) EB00843, EY13801,RR00058: Financial support.Scientific Exhibit 18Relationship between Contrast Enhancement and BrainTumor Neovascularity Revealed by Blood VolumeFunctional ImagingWagner, M. L. 1 · Ulmer, J. L. 1 · Rand, S. D. 1 · Krouwer, H.G. J. 1 · Schmainda, K. M. 1,21Medical College of Wisconsin, Milwaukee, WI, 2 MarquetteUniversity, Milwaukee, WIPURPOSEThis exhibit will demonstrate the relationship between contrastenhancement and blood volume as indicators of tumorbiology. Contrast enhancement is a common imaging parametershowing the breakdown of the blood-brain-barrier. It isused for presurgical planning, preradiation planning, and toidentify recurrence. Blood volume is also a common imagingparameter that denotes neovascularity, irrespective ofcontrast enhancement. Neovascularity is a reflection oftumor growth. The relationship between these parametershas not been firmly established and could potentially lead toa greater understanding of tumor biology and extent. Ouraim is to demonstrate the extent to which neovascularity ispresent in the absence of contrast enhancement pre and postoperatively.404MATERIALS & METHODSTo date over 300 blood volume imaging studies have beenperformed on patients with brain tumors. Of these, only thehigh-grade glioma cases will be assessed for the purposes ofthis study. We examined the distribution of contrast enhancementand neovascularity in 32 patients with grade III orgrade IV gliomas to determine the relationship between contrastenhancement and blood volume. Blood volume mapsindicate areas of neovascularity and have the potential to beused as a supplemental parameter indicating tumor extent.To obtain the blood volume maps an interleaved gradientecho(GE) and spin-echo (SE) imaging sequence was used.This allowed us to obtain maps of total blood volume (GE),maps primarily sensitive to microvascular blood volume(SE), and maps indicating vessel diameter (ratio).RESULTSAll of the patients were classified by four different patterns:1)Contrast enhancement and neovascularity correspondprecisely, 2) Neovascularity is present in both contrastenhancement and nonenhancement areas, 3) Contrastenhancement and neovascularity do not correspond, and 4)There is no contrast enhancement. Of the 32 patients examinedpre and post operatively, 44% showed neovascularityoutside the region of contrast enhancement. In a minority ofpatients, neovascularity was present with little or no contrastenhancement. In some cases neovascularity was more suggestiveof grade conversion than contrast enhancement.CONCLUSIONOften there is not a good correlation between the area of contrastenhancement and neovascularity. The implications ofthis are that neovascularity may prove to further define theextent of the most active portions of tumor and may be predictiveof recurrence before contrast enhancement is apparent.KEY WORDS: Blood volume, neovascularity, contrastenhancementThe authors of this work have indicated the following affiliations/disclosures:National Institutes of Health (Bethesda,MD)/National Cancer Institute CA082500: Financial support.Scientific Exhibit 19Multifunctional Neuroimaging: A New Approach forAssessing Brain-Related Vision DeficitsDeYoe, E. A. 1 · Ulmer, J. 1 · Ropella, K. 2 · Remler, B. 1 ·Hacein-Bey, L. 1 · Szeder, V. 1 · Maciejewski, M. 1 · Janik, J. 1 ·Brefczynski, J. 11Medical College of Wisconsin, Milwaukee, WI, 2 MarquetteUniversity, Milwaukee, WIPURPOSEFunctional MR imaging (fMRI) provides a unique opportunityto integrate structural and functional data into a comprehensivesystem for the diagnosis and management ofbrain pathology. This exhibit will review recent advances inthe use of fMRI to identify and map visual cortex in patientswith brain-related vision deficits. Such fMRI-based maps ofnormal and impaired visual function in and around a site ofpathology can be helpful in planning surgery or other treatmentalternatives, especially for cases in which treatmentmay involve the risk of further visual impairment. A novelapplication of the technology is to explore potential surgicalscenarios and to simulate expected visual side effects for thepatient. In such applications, the integrated use of structural,functional, and pathophysiologic data can provide a uniqueview of the relationship between a site of focal pathology
and its effect on the function of surrounding brain tissuethereby allowing more informed decisions about treatmentalternatives.MATERIALS & METHODSThe exhibit will review technologic advances in the applicationof fMRI for the assessment of brain-related visionpathologies and will highlight case studies that illustrate theuse of the technology.405Scientific Exhibit 20In Vivo Detection of Apoptotic Processes by 1H MRSpectroscopy in the BrainProst, R. W. · Krouwer, H. G. · Ulmer, J. L.Froedtert HospitalMilwaukee, WIRESULTSTechniques for mapping the cortical representations of thevisual field in human patients were first developed for basicscience research but have been used now with clinicalpatients suffering from a variety of brain pathologies. Ratherthan simply activating visually responsive cortical regions,these techniques provide a detailed mapping of the layout ofvisual space within the brain. In cases of focal brain pathology,such retinotopic maps show the relationship betweenthe site of pathology and the layout of visual space, especiallythe critical representations of foveal vs peripheralvision. Since the exact topography of these maps is unique toeach individual, fMRI makes it possible to map visual functionnear a site of pathology on a patient-by-patient basis. Byidentifying which portions of the visual field are representedadjacent to a site of pathology, it is possible to predict wheresurgical intervention is most likely to affect vision. Since differentlife activities can depend more on foveal than peripheralvision (e.g., reading vs driving), the potential sideeffects of invasive treatment on quality of life also will beunique to each individual (e.g.. librarian vs truck driver).However, the fMRI maps can be used to predict potentialvision loss associated with different surgical scenarios andcan be used to simulate the experience of a predicted scotomafor the patient. To date, fMRI visual field mapping hasbeen used successfully with patients having a variety ofpathologies including stroke, arteriovenous malformations,and tumors.CONCLUSIONThe technology and applications reviewed in this exhibitrepresent an initial “proof of concept” using a physiologicsystem (vision) that is easy to manipulate for purposes ofdevelopment. Though the full clinical utility and prognosticcapabilities of this approach have yet to be established, theconcepts developed here can be extended to other systemsand pathologies.KEY WORDS: fMRI, vision, clinicalThe authors of this work have indicated the following affiliations/disclosures:1. National Institutes of Health(Bethesda, MD) EB00843, EY13801, RR00058: Financialsupport; 2. Dana Foundation: Financial support.PURPOSETo demonstrate the detection of a new resonance in the brain,which may be involved in apoptotic processes. Apoptoticprocesses are one of two pathways of cell death. Unlikenecrosis, apoptosis involves the destruction of the nuclearDNA and a blebbing of the outer cell wall. Apoptosis isknown to occur in neural pruning as part of early braindevelopment, neurodegenerative processes such asHuntington’s disease, and successfully treated brain neoplasms.Staining for progenitors of apoptosis such as BAXand BCL-2 as well as staining for nuclear chromatin, whichresults from the nuclear laddering, demonstrates the apoptoticprocess in cellular culture and in animal models of neurodegenerativedisease. However, apoptosis has not beendetected in vivo by MR imaging nor MRS methods. If amarker of apoptotic processes were to be found, it wouldfacilitate greatly the treatment of neurodegenerative disordersas well as improving therapy monitoring in cerebralneoplasia.MATERIALS & METHODSWe correlated data acquired in the course of clinical MRSstudies on 10 HD patients as well as treated brain neoplasmpatients. In numerous cases, this data demonstrated a resonancewhich is situated between the choline and creatine resonanceat 3.15 ppm. Unwanted and false resonances can becreated by the localization processes used to acquire MRSdata. To determine whether the resonance at 3.15 ppm wasartifactual in nature, we analyzed data from normal volunteersand patients with untreated neoplasms of several differentetiologies. To determine a possible identity for the resonanceat 3.15 ppm, we have tested several candidate modelcompounds which have resonances in the 3.15 ppm region.Further, to investigate the reason as to why this resonancehas not been reported in brain at 1.5 T, we acquired spectrafrom the model compounds at both 1.5 T and 0.5 T.RESULTSOf the model compounds tested, spermine had a resonance at3.15 ppm which was much narrower and more detectable at0.5 T than 1.5 T. Two patients with neoplasms that are wellknown to respond to radiation therapy (oligodendrogliomas)demonstrated high levels of the 3.15 ppm resonance. Both ofthese patients had MRS data acquired in the same locationsprior to therapy, at the time of diagnosis. Neither patientdemonstrated any detectable resonance at 3.15 ppm at thetime of diagnosis. In a series of ten early manifestHuntington’s patients, seven demonstrated the resonance.The spectra were all collected from the putamen of thesepatients in the course of an MRS examination. Spectra fromthe same patients, collected at the same sessions, but in thethalamus, did not show the 3.15 ppm resonance in any of theten.Scientific Exhibits
CONCLUSIONWhile the identification of the resonance at 3.15 ppm asbelonging to spermine is not conclusive yet, it appears thatits appearance in the spectrum correlates with processeswhich are known to be apoptotic in nature. Confirming thelink between this observation and apoptotic activity couldlead to significant improvements in therapy monitoring andtherapies for the neurodegenerative diseases.KEY WORDS: Apoptosis, spermine, neoplasm406the potential risk of hemorrhagic operative complications.MR spectroscopy confirmed the diagnosis of tumor and thelocation and distribution of the regions of highest mitoticactivity or cellular density. Imaging results correlated withthe clinical postsurgical evolution of these patients. Animpact on the risk assessment and/or surgical approach wasmost commonly seen with DTI (13 patients) and fMRI (12patients), followed by rCBV (9 patients) and MRS (9patients). One of the physiologic parameters was importantin the risk assessment and/or surgical approach in all 15cases.Scientific ExhibitsScientific Exhibit 21State of the Art in the Diagnosis and PreoperativePlanning of Brain TumorsSalvan, C. V. · Ulmer, J. L. · Prost, R. W. · Schmainda, K. M.· DeYoe, E. A. · Aralasmak, A. · Wagner, M. L. · Mueller, W.M. · Krouwer, H. G. J.Medical College of WisconsinMilwaukee, WIPURPOSETo determine the impact of integrated physiologic MR imagingtechniques in the diagnosis and preoperative planning ofbrain tumor patients.MATERIALS & METHODSIn addition to standard MR examinations for brain tumors,blood oxygen level dependent (BOLD) functional MR imaging(fMRI) of sensori-motor, language, and/or visual systems,diffusion tensor imaging (DTI), interleaved GE/SE relativecerebral blood volume imaging (rCBV) and MR spectroscopy(MRS) were acquired in 15 brain tumor patients,ranging in age from 20 to 64 years (7 males and 8 females).Cortex and white matter fasciculi were mapped using fMRIand DTI respectively, and correlated to pre and postoperativesigns and symptoms. Tumor angiogenesis was characterizedby rCBV imaging, generating maps of total and microvascularblood volume, and mean vessel diameter. Brain metaboliteswere assessed using MRS and 2D chemical shift imagingmaps were generated to identify the distribution ofmetabolites. All data were integrated for the diagnosis andpreoperative planning of these patients. Diagnosis was confirmedby histology in all cases. The impact of each physiologicparameter separately and together on surgical planningwas determined.RESULTSFunctional MR imaging established the relationship betweenbrain tumor and sensori-motor, language, and/or visual cortex,as well as the lateralization of the specific brain functions.However, lesion-induced neurovascular uncouplingcaused an erroneous appearance of contra-lesional hemisphericdominance in two patients. The displacement,involvement or destruction of specific white matter fasciculi,as observed in FA and color-coded maps, were consideredfor preoperative planning as well. The combination of fMRIand DTI data provided an opportunity to map the gray andwhite matter components of eloquent networks, yieldingpowerful information to neurosurgeons. Total and microvascularrCBV was important for the characterization of tumorangiogenesis, being predictive for tumor grade and showingCONCLUSIONFunctional MR imaging, DTI, rCBV, and MRS are complementaryand integrative in the characterization and preoperativeplanning of brain tumor patients, providing new informationthat can be used to optimize treatments and postoperativeoutcomes. These preliminary results illustrate thevast potential of physiologic imaging techniques for braintumor patients.KEY WORDS: Brain tumors, physiologic MR imaging, preoperativeplanningThe authors of this work have indicated the following affiliations/disclosures:1. Dana Foundation Clinical HypothesesProgram in Imaging: Financial support; 2. NationalInstitutes of Health (Bethesda, MD) EB00843, EY13801,RR00058, NIH/NCI CA82500, GCRC M01-00058:Financial support; 3. Medical College of Wisconsin CancerCenter: Financial support.Scientific Exhibit 22Anatomy, Imaging, and Lesion-Induced FunctionalDisturbances (Part 1) of Association and CommissuralWhite Matter Pathways: Empowering Neuroradiologistsin Clinical ScenariosAralasmak, A. · Ulmer, J. L. · Salvan, C. V. · Prost, R. W. ·Daniels, D. L. · Mark, L. P. · Hacein-Bey, L.Medical College of WisconsinMilwaukee, WIPURPOSEComplex cognitive and behavioral processes are mediatedby wide spread neuronal networks. The ability to identifyand characterize axonal fiber bundles comprising these networksis important for understanding pathologic processesaffecting higher cerebral functions. Diffusion tensor imaging(DTI) is a promising technique that has the potential toassess white matter (WM) structural integrity, directionality,and connectivity in the living human brain. Studies of neuronalconnectivity are tremendously important for interpretingfunctional MR imaging (fMRI) data and establishinghow activated foci are linked together through networks,correlating lesion localization with functional deficits, andestablishing preoperative or pretreatment risks. In clinicalscenarios, interpreting DTI data requires a thorough understandingof lesions effects on network functions. No suchcompendium exists that efficiently provides neuroradiologiststhe clinical understanding of functional disturbances on
a tract-by-tract basis. The aim of this exhibit is to empowerneuroradiologists to fully utilize DTI data in clinical settings.The exhibit illustrates normal DTI anatomy and function ofassociation and commissural WM fibers, and discusses thefunctional significance that has been established by a reviewof over 30 years of literature detailing lesion-inducedinjuries to given WM tracts.MATERIALS & METHODSDiffusion tensor imaging of normal subjects were performedon a 1.5 T scanner (SS-SE EPI, 6000-10000/80-85 msTR/TE, 2 NEX, 240 mm FOV, 5 mm thickness, 25 diffusionencoding directions, b = 1500 sec/mm2). Diffusion tensorimaging data were represented as maps of fractionalanisotropy (FA) and eigenvector orientation. Eigenvectororientation was assigned into red, green, and blue colorchannels, with color intensity modulated by FA. Artistic renditionsand DTI maps were used to detail white matter anatomy,and associate imaging data with functional implicationsof lesion-induced injuries.RESULTSThree types of WM fibers most commonly recognized in thebrain are association, commissural, and projection fibers.Association (intrahemispheric) and commissural (interhemispheric)fibers, which interconnect different cortical areas,make up most of the white matter of the cerebral hemispheres.Projection fibers either arise in the cortex and terminatein the subcortical centers or arise in subcortical centersand terminate in the cortex. Association fibers consist oflong fibers named the superior and inferior longitudinal fasciculus,superior and inferior frontooccipital fasciculus,uncinate fasciculus, cingulum and short fibers which are theprojections traveling from fasciculi into the subcortical WM.Main commissural fibers cross in the corpus callosum, theanterior commissure, and the hippocampal commissure ofthe fornix. Association and commissural tracts play animportant role in cognitive and limbic functions includingcomponents of memory, language, motor planning, attention,and emotions. We obtained detailed DTI maps of associationand commissural WM bundles in agreement withstandard neuroanatomical knowledge. The functional significanceof these imaged white matter tracts is discussed, usingestablished lesion localization data.CONCLUSIONDiffusion tensor imaging has the potential to enhance theinterpretation of functional imaging studies by complementingthe cortical mapping using fMRI, by adding new understandingto studies of functional neuroanatomy, and byimproving our understanding of the effects of white matterstructural changes induced by diseases processes.Neuroradiologists are ideally positioned to implement DTIinto day-to-day clinical practice.Part 1 of 2. See also Abstract 972.KEY WORDS: DTI, association fibers, commissural fibers407Scientific Exhibit 23Proton MR Spectroscopic Assessment of Brain Tumorsvs Nontumorous Brain LesionsWhite, M. L. · Janjua, K. · Zhang, Y. · Smoker, W. R. K.University of Iowa College of MedicineIowa City, IAPURPOSEProton MR spectroscopy provides a chemical signature of alesion rather than the anatomical and morphologic informationobtained with standard MR imaging. The informationfrom MR spectroscopy can be utilized to increase the specificityof a diagnosis and to help determine whether or not alesion is a tumor. This presentation will highlight the spectrumsof a variety of brain tumors and nontumorous brainlesions.MATERIALS & METHODSNinety-six patients including 48 tumor cases preintervention(37 primary intraparenchymal brain tumors, 6 metastases, 5extraaxial tumors), 27 nontumorous lesions (7 ischemic/vasculitiscases, 3 infections, 1 migrational abnormality, 3 mitochondrialdiseases, 4 cases of demyelination, and 9 lesionsconsisting of blood/gliosis/edema) and 22 tumor patients statuspost intervention/treatment were reviewed. All of thesepatients underwent MR proton spectroscopic examinationson a 1.5 T MR unit. Single voxel spectrums were performedon a 1.5 T GE MR with Probe-P technique and a TR = 2000ms and TE = 35 ms. Multivoxel spectrums were obtained ona 1.5 T GE CVMR with Probe-SI technique with TR = 2000ms and TE = 35 ms. The multivoxel spectrums were analyzedon GE’s Advantage Workstation 4.0 using FuncTool.The spectral peaks analyzed included lipid, lactate, N-acetylaspartate (NAA), creatine (Cr), choline (Cho), and myoinositol.The ratios utilized to help differentiate tumor from nontumorouslesions included the Cho/Cr and NAA/Cho. Thefinal diagnosis of the lesions was based upon pathologicanalysis or clinical analysis when appropriate.RESULTSThere are distinctive spectral patterns for brain tumors andnontumorous brain lesions. Our experience with MR spectroscopyfor differentiating brain tumors and nontumorousbrain lesions are illustrated. The likelihood that a lesion is atumor is increased if the Cho:Cr ratio is >1 and/or theNAA:Cho ratio is < 1 when utilizing our MR spectroscopytechnique. We found it difficult to accurately differentiatedemyelinating lesions from tumors with proton MR spectroscopy.The MR spectroscopy findings of gliomatosis cerebriare subtler than those seen in focal brain tumors. MRspectroscopy is useful in the posttreatment evaluation ofbrain tumor patients for assessing for recurrent tumor vsradiation necrosis. Multivoxel spectrums can be used to helpdetermine if a lesion is a primary or secondary intraparenchymaltumor.Scientific Exhibits
408CONCLUSIONScientific Exhibit 25Proton MR spectroscopy provides valuable information forCan In Vivo Imaging of Glutamate Predict Futuredetermining if a lesion is a brain tumor or a nontumorousNeoplasm Invasion?brain lesion. The practicing neuroradiologist should beaware of the characteristics of brain pathologies by MRspectroscopy.Prost, R. W. · Ulmer, J. L. · Mark, L. P. · Krouwer, H. G.Froedtert HospitalKEY WORDS: Spectroscopy, neoplasm, nonneoplasticMilwaukee, WIScientific ExhibitsScientific Exhibit 24Short TE MR Spectroscopy of Intracranial Pathologieswith Elevated GlutamateFleisher, M. A. · Kanamalla, U. S. · Boyko, O. B.Temple University School of MedicinePhiladelphia, PAPURPOSETo demonstrate elevated glutamate and glutamine (Glx) onMR spectroscopy (MRS) in acute intracranial pathologicconditions.MATERIALS & METHODSRetrospective analysis of patients with abnormally elevatedGlx on MRS was performed and compared to 10 normalcontrol subjects. Examinations were performed on a 1.5 Tmagnet at TE values of 30 or 35 msecs and alpha, beta, andgamma GLX were evaluated.RESULTSElevated Glx was found in multiple conditions.Retrospective review found elevated Glx in case of acuteinfarction, tumors, metabolic abnormalities (hepaticencephalopathy), multiple sclerosis, trauma, and infection.CONCLUSION1. MR spectroscopic demonstration of elevated Glx confirmsthe excitotoxic theory of neuronal injury. 2. Correlation ofelevated Glx with MR findings can help diagnosis in certaincases (e.g., elevated Glx helps distinguish meningioma fromother extraaxial lesions). 3. Elevated Glx can help definestage of disease processes, such as in differentiating acutefrom chronic plaques or infarcts. It may help in defining usefullnessof a particular therapy and possibly for follow-up.REFERENCES1. Mark LP, Prost RW, Ulmer JL, et. al. Pictorial Review ofGlutamate Excitotoxicity: Fundamental Concepts forNeuroimaging. AJNR Am J Neuroradiol 2001;22:1813-18242. Pioro EP, Majors AW, Mitsumoto H, Nelson DR. Ng TC H-MRSEvidence of Neurodegeneration and Excess Glutamate +Glutamine in ALS Medulla. Neurology 1999;53:71-79KEY WORDS: MR spectroscopy, glutamate, brainPURPOSEGlutamate, which is the most abundant neurotransmitter inbrain, is increasingly implicated in diversepathologies.While long known to be involved in the destructionof neurons in ischemia, glutamate recently has beenshown to facilitate the spread of neoplastic glia in both neuronalculture and in an animal model. The purpose of thisexhibit is to correlate, In vivo, the distribution of glutamatewith the locations of recurrences in patients with high-gradegliomas.MATERIALS & METHODSA series of 12 patients with GBMs were examined with shortecho time chemical shift proton spectroscopic imaging(2DCSI MRS) preoperatively, and glutamate/glutamine(Glx) maps were generated. Each of these patients subsequentlywere followed with serial gadolinium-enhancedimaging to identify the specific locations of tumor recurrences.RESULTSOf the twelve patients studied, the locations of elevated glutamateconcentrations predicted the locations of future recurrencein 9 of the 12. These recurrences occurred within thefirst year following original diagnosis.CONCLUSIONIn vivo glutamate imaging may predict future recurrence andspread of high-grade gliomas. Imaging of glutamate mayallow the use of adjunct therapies to inhibit the elevated glutamateexocytosis and thus slow the spread of this dread disease.KEY WORDS: Glutamate, MR spectroscopy, gliomaScientific Exhibit 26 (eSE)Imaging of Glutamate In Vivo: PresymptomaticHuntington’s DiseaseProst, R. W. · Reynold, N. C. · Mark, L. P. · Ulmer, J. L.Froedtert HospitalMilwaukee, WIPURPOSEOne of the major theories of the destruction of the striatumin Huntington’s disease involves the excitotoxic glutamateactivity. The excitotoxic activity of glutamate is believed tobe the final common pathway in the destruction of the striatum.The destruction of the medium spiny neurons of theputamen and caudate does not become clinically manifestuntil approximately 75% of this neuronal population is lost.Existing therapies are insufficient due to the fact that theyare not started until the clinical manifestations of the disease
are evident, which is too late for neuron sparing therapies.The detection of elevated glutamate concentrations in vivoby proton MR spectroscopy (1H-MRS) has been poorly documentedand remains controversial. Three factors have led tothis state of confusion. The first is the intrinsic difficulty ofquantifying glutamate in spectra acquired at 1.5 T. With thepotential for 3 T MRS to reveal the glutamate spectrum,there has been resurgence in interest to image this metabolitein neurodegenerative disorders. The second factor is theintrinsically poor magnetic field homogeneity obtainable inthe striatum due to deposits of ferritin. The third is the relativelysmall increase in glutamate concentrations, relative tomore acute processes such as ischemia. The decade-longcourse of the destruction of the striatum suggests that the elevationof glutamate concentration would not be as great as inan acute process such as seizure.MATERIALS & METHODSTwelve presymptomatic Huntington’s patients were examinedusing proton MRSI on a 0.5 T system. These twelvepatients all had genetic testing with CAG repeat lengthsgreater than 35 and a family history of HD. Additionally, tenage-matched healthy controls also were examined. Allexams consisted of scout imaging, sagittal T1 and axial protondensity and T2-weighted imaging. Spectroscopic imagingwas accomplished with a short echo time (TE = 18ms)pulse sequence with a two-dimensional RF pulse whichexcited a circular disk of spins. Individual spectra wereselected out of the resulting grid of spectra for quantitativeanalysis. Spectoscopic images also were created from dataset. The data were compared to spectra obtained using longecho time (press-csi).RESULTSGlutamate concentrations in the putamen were significantly(p < 0.03 left, p < 0.05 right) elevated above that of agematchedhealthy controls. The concentration of NAA wasreduced significantly (p < 0.05 left, p < 0.05 right). Whenexamined using the longer echo time, the changes in glutamateconcentration were not significant, while the NAA concentrationchanges were significant. In the presymptomaticpatients, the greatest increase in glutamate appears to occurin a region centered on the external capsule adjacent to theputamen, extending into the overlying cortex.CONCLUSIONElevated glutamate concentrations in presymptomaticHuntington’s patients can be demonstrated by the use of veryshort echo time MRSI at 0.5 T. The detection of these elevationsshould lead to improved therapies to prevent the excitotoxicdestruction of striatal neurons in HD.KEY WORDS: Glutamate, Huntington’s disease, MR spectroscopy409Scientific Exhibit 27Parcellation of Cerebral Cortex Based on FLAIR SignalIntensityButman, J. A. · Rebmann, A. J.Warren G. Magnuson Clinical Center, National Institutes ofHealthBethesda, MDPURPOSEHeterogeneity of intrinsic gray matter signal intensity can bedemonstrated on some MR sequences, particularly FLAIR.To visualize FLAIR signal heterogeneity across the cortexand to compare this variation across subjects, we mappedFLAIR signal intensity data onto surface models obtainedfrom coregistered T1 datasets.MATERIALS & METHODSSix healthy volunteers (31 ± 7 years) were imaged at 1.5 Tusing a quadrature head coil following informed consentunder an IRB approved protocol. Cortical surfaces wereextracted from two high-resolution 3D IR-GRE T1-weightedimages using FreeSurfer following N3 uniformity correctionand rigid coregistration. High-resolution 2D FLAIRdata were obtained using 2.5 mm slice thickness coveringthe whole brain in 13 minutes. Five FLAIR volumes werecoregistered and averaged for each volunteer. This meanFLAIR volume was rigidly registered and resectioned tomatch the T1 volume. For each node on the T1 surface,FLAIR signal intensity was averaged along a line segmentextending between corresponding nodes on the pial andgray-white surfaces. FLAIR signal intensity was renderedonto the surface using SUMA. Brodmann areas wereassigned by querying the VOTL database with node coordinatestransformed into Talairach space.RESULTSHeterogeneity of cortical both gray and white matter wasclearly evident on axial FLAIR images. Hypointense graymatter with indistinct gray white differentiation was identifiedin the pre and postcentral gyri, Heschl’s gyrus, and alarge portion of the occipital lobe corresponding to primarymotor, primary sensory, primary auditory areas, and motorcortex. Pial surfaces (derived from the T1 dataset) wereassigned a color scale based on FLAIR signal intensity. Thepattern of FLAIR signal intensity is highly consistent acrosssubjects. Borders between regions of differing signal intensitycorrespond to known borders between cortical areas. Forexample there is a sharp transition in signal intensity at theparietooccipital fissure. A consistent profile of differences inFLAIR signal intensity according to Brodmann area also wasidentified across subjects.Scientific ExhibitsCONCLUSIONMapping of FLAIR signal intensity onto surface representationsof the cerebral cortex demonstrates regional differencesin signal intensity across the cortex which are consistentacross subjects. Presumably, this reflects intrinsic differencesin cytoarchitectonic and myeloarchitectonic propertiesof these cortical regions indicating that FLAIR signal intensitycan, to some extent, parcellate the cortex into anatomicallydistinct areas. Because FLAIR combines T1 effects(from inversion), T2 effects from a long TE as well as MT
effects from a long echo train, it is not clear the extent towhich each of these mechanisms contributes to the differencesobserved. These findings motivate further research toidentify the cytoarchitectonic and myeloarchitectonic featureswhich give rise to these variations of FLAIR signalintensity.KEY WORDS: Cytoarchitectonics410RESULTSExperiment 1 - Attention to a Single Target: Attentionalenhancement was found to be strongest at the attended targetlocation but spread weakly to nearby targets as well as toother distant locations in the visual field. When averagedacross subjects, this pattern resembled a gradient model ofattention (2) in which attentional effects gradually diminishas a function of distance from the attended target. However,individual differences suggest that this model does notexplain fully attentional topography in single subjects.Experiment 2 - Attention to Targets at DifferentEccentricities: Again, attentional enhancement tended to bestrongest at each attended target location, though the spreadof effects around the target increased with eccentricity. Thisspatial specificity is contrary to previous findings characterizingattention as broadly diffuse beyond 10 degrees eccentricity(3, 4). Experiment 3 - Split Attention to TwoSeparated Targets. The greatest attentional enhancement wasseen at the two attended target locations with a “gap”between them. Surprisingly, the attentional effects werestronger in the split condition than in the single target experiment.These results support a split or rapidly sweeping spotlightmodel of attention and a variable resource model (5, 6).Scientific ExhibitsScientific Exhibit 28Multifunctional Neuroimaging: Using Functional MRImaging to Map the Neural Basis of Visual, SpatialAttentionBrefczynski-Lewis, J. A. · DeYoe, E. A.Medical College of WisconsinMilwaukee, WIPURPOSEThis exhibit will review recent advances in the use of functionalMR imaging (fMRI) to identify and map neural mechanismsresponsible for visual spatial attention in healthyindividuals and, potentially, in patients with attention-relateddeficits. Specifically, fMRI has been used to identify andmap attention-related activity within occipital visual cortexand other cortical areas of human subjects performing attention-demandingtasks. Through a unique computational technique,the resulting brain activation can be used to visualizethe “window” of attention, as it would appear in the subject’sfield of view. The results of this analysis provide insight intothe topography of attentional selection and the neural mechanismson which it relies.MATERIALS & METHODSPreviously, attentional topography has been inferred frombehavioral experiments or from neuroimaging brain maps(1). This exhibit will review this previous work and thendescribe a new technology for visualizing attentional topographyas a “back-projection” of cortical activation onto a diagramof the observer’s visual field. Functional MR imagingwas used to measure brain activation in subjects who wereverbally cued to attend to one or more targets within a densearray of distracters. The resulting attention-related activationwas then combined with data from fMRI-based visual fieldmapping to create a visual field map of the attentionaleffects.CONCLUSIONThe work reviewed in this exhibit shows that functionalimaging experiments have significantly advanced our understandingof the nature of visual, spatial attention and itsunderlying neural mechanisms. The results of this workestablish a knowledge base and new technology that maysoon be extended to clinical applications for the assessmentof brain-related attentional deficits.REFERENCES1. Brefczynski and DeYoe 19992. Downing and Pinker 19853. Seiple, Clemens, et al. 20024. Slotnick, Hopfinger, et al. 20025. LaBerge and Brown 19866. Awh and Pashler 2000KEY WORDS: fMRI, vision, clinicalThe authors of this work have indicated the following affiliations/disclosures:National Institutes of Health (Bethesda,MD) EB00843, EY13801, RR00058: Financial support.Scientific Exhibit 29Anatomy, Imaging, and Lesion-Induced FunctionalDisturbances (Part 2) of Cerebral Projection andBrainstem White Matter Pathways: EmpoweringNeuroradiologists in Clinical ScenariosAralasmak, A. · Ulmer, J. L. · Salvan, C. V. · Prost, R. W. ·Daniels, D. L. · Mark, L. P. · Hacein-Bey, L.Medical College of WisconsinMilwaukee, WIPURPOSEProjection and brainstem pathways are important in the mostbasic of functions that are necessary for daily living. Theability to identify and characterize the axonal fiber bundlescomprising these pathways is important for understandingpathologic processes affecting neurologic functions andavoiding morbidity associated with medical conditions.Directionally sensitive diffusion tensor imaging (DTI) is apromising technique that has the potential to assess whitematter (WM) structural integrity, directionality, and connectivityin the living human brain. Clinical studies of whitepathways are important for correlating lesion localizationwith functional deficits, and in establishing preoperativerisks. The aim of this exhibit is to enhance the neuroradiologist’sability to fully utilize DTI data in clinical settings,where cerebral projection and brainstem pathways areinvolved by disease. This exhibit efficiently illustrates normalDTI anatomy and function of cerebral projection andbrainstem WM fibers, and discusses the functional signifi-
cance that has been established by a review of over 30 yearsof literature detailing lesion-induced WM injuries. The correlationbetween lesion location and functional deficits isemphasized.MATERIALS & METHODSDiffusion tensor imaging of normal subjects were performedon a 1.5 T scanner (SS-SE EPI, 6000-10000/80-85 msTR/TE, 2 NEX, 240 mm FOV, 5 mm thickness, 25 diffusionencoding directions, b = 1500 sec/mm2). Diffusion tensorimaging data were represented as maps of fractionalanisotropy (FA) and eigenvector orientation. Eigenvectororientation was assigned into red, green, and blue colorchannels, with color intensity modulated by FA. Artistic renditionsand DTI maps were used to detail white matter anatomy,and associate imaging data with functional implicationsof lesion-induced injuries.RESULTSWe obtained detailed WM fiber anatomy maps of normalbrain and brainstem in agreement with standard neuroanatomicalknowledge. Projection fibers of the brain provideconnections between the cortex and subcortical centers,and can be distinguished by DTI. The internal capsule iscomposed of sensory thalamocortical and motor corticofugalprojections within the corona radiata, forming compactanatomical WM areas including the anterior limb, genu, andposterior limb. Acoustic and optic radiations are thalamocorticalsensory pathways that can be visualized and regarded asprojection fibers. Visible WM tracts in the brainstem includethe cerebellar peduncles, medial lemniscus, medial longitudinalfasciculus, tegmental tracts, and corticofugal fibers. Weobtained detailed DTI maps of projection and brainstem WMbundles in agreement with standard neuroanatomical knowledge.The functional significance of these imaged white mattertracts is discussed, using established lesion localizationdata.CONCLUSIONDiffusion tensor imaging is a new technique that enables thewhite matter mapping in living human brain.Complementing the cortical mapping using functional MRimaging (fMRI), it adds new understanding to functionalneuroanatomy studies. The delineation of WM tracts canimprove neurosurgical planning and reduce surgical risk.Depiction of WM tracts may allow the study of tumorgrowth patterns and increase our understanding of factorsthat influence functional recovery. Diffusion tensor imagingalso has been used to show subtle abnormalities in neuropsychiatricand neurodegenerative diseases and couldbecome part of routine clinical protocols for these patients aswell. Neuroradiologists are ideally positioned to implementDTI into day-to-day clinical practice.Part 2 of 2. See also Abstract 971.411Scientific Exhibit 30Analysis of the Discriminatory Power of Perfusion MRImaging and Proton Multivoxel MR SpectroscopyCompared with Conventional MR Imaging in AssessingCerebral TumorsAragao, M. 1 · Silva, L. 2 · Griz, M. 2 · Costa e Silva, I. 2 · Serra,S. 2 · Leao, C. 2 · Tavares, F. 2 · Azevedo Filho, H. 2 · Carneiro,G. 2 · Albuquerque, E. 11Multimagem - Hospital Albert Sabin, Recife, BRAZIL,2Hospital da Restauracao, Recife, BRAZILPURPOSEMR imaging has elevated sensitivity in detecting intracranialpathologies, though poor specificity in characterizing thenature of the abnormal tissue. Tumor, radionecrosis, or postsurgicalalterations may appear similar to the MR images.The association of perfusion [relative cerebral blood volume(rCBV)] and proton multivoxel spectroscopy ( 1 H-MRSI) hasincreased the specificity of MR imaging. To analyze the discriminatorypower of the association rCBV/ 1 H-MRSI, comparedto MR imaging, in the diagnosis of tumors.MATERIALS & METHODSAnalyzed were images of 24 patients with cerebral tumors,in the Multimagem Sabin, from January to August 2003. Allwere examined with 1.5 T MR unit (Signa Infinity GE), 1 H-MRSI (TE = 35) and perfusion (rCBV). The images wereobtained before surgery (14 patients), after treatment (9cases), or on both occasions (1 case).RESULTSThe pretreatment radiologic hypotheses were: glioblastomamultiforme - GBM (5 ® 33.2%), pilocytic astrocytoma (3® 20%), high-grade astrocytoma (2 ® 13.3%), giant cellastrocytoma (1 ® 6.7%), low-grade glioma (1 ® 6.7%),lymphoma or glioblastoma (1 ® 6.7%), hemagioblastoma (1® 6.7%), and meningioma (1 ® 6.7%). The radiologic diagnostichypothesis of 10 cases examined after treatment werecategorized immediately after surgery (examined at the most10 days after surgery), or later after surgery. On patientsimmediately examined postsurgery (5 ® 50%), there wasGBM tumor residue (3 ® 60%) and one grade II astrocytoma(20%). One case (20%), radiologically considered asfree from residual tumor, was classified as a false-negative,according to an anatomopathologic assessment, for driedmargins free from tumor not having been identified. For the5 later cases (50%), the radiologic hypotheses were: recurrenceof high-grade tumor in 2 cases (40%) postradiotherapy;possible recurrent tumor/gliosis in 2 patients (40%), onebeing postradiosurgery and the other postsurgery, besidesone case (20%) of residual/recurrent meningioma.Scientific ExhibitsKEY WORDS: DTI, projection fibers, brainstem tractsCONCLUSIONThe functional MR techniques of spectroscopy and perfusion,evaluating respectively biochemistry and cerebralmicrovasculature, increased the discriminatory power of MRimaging in diagnosing tumors and differentiating betweenrecurrent/radionecrosis.KEY WORDS: Functional imaging, neoplasms
Scientific Exhibits412Scientific Exhibit 31Scientific Exhibit 32 (eSE)Developing a 31P MR Spectroscopy Program: The Mayo Inflammatory Myofibroblastic Tumor of theClinic ExperienceIntracranial, Head and Neck Region: CT and MRFindings in Four CasesPort, J. D. · Blenman, R. M. · Felmlee, J. P.Mayo ClinicSuh, S. I. 1 · Seol, H. Y. 1 · Lee, J. H. 1 · Cha, I. H. 1 · Lee, Y. H. 2Rochester, MN· Lee, N. J. 2 · Kim, J. H. 2 · Lee, H. M. 1 · Lee, J. 11Korea University Guro Hospital, Seoul, REPUBLIC OFPURPOSEKOREA, 2Korea University Anam Hospital, Seoul,To discuss the problems and pitfalls of developing a 31P MR REPUBLIC OF KOREAspectroscopy (MRS) program at a major medical institution.MATERIALS & METHODSOver the past 2 years, we have attempted to get our commercialmultinuclear spectroscopy package working on oneof our clinical MR scanners.RESULTSWe encountered numerous problems with our “turnkey” system.Our initial dual-tuned proton-phosphorus head coil hadserious problems with the proton signal-to-noise ratio(SNR); as a result, we had to purchase a usable coil from outside.When we used the proton decoupler to improve phosphorusSNR, the SNR dropped ten-fold (rather than increaseas expected); we had to install a specially designed notch filterdirectly into the TR switch to alleviate this problem. Thesystem was calibrated by our service personnel to meet thevendor’s specifications; however, we were unable to adequatelyachieve a 90-degree flip angle. We therefore begancarefully adjusting various attenuators on the RF hardware,eventually generating enough RF power to achieve a 90-degree flip angle. These problems have lead to the developmentof a phosphorus MRS Quality Assurance program atour institution which is used routinely now to monitor scannerperformance.CONCLUSIONDespite commercially available software and coils, clinical31P MRS remains technically challenging. Developing asuccessful 31P MRS program is a major undertaking, andrequires extensive teamwork among clinicians, physicists,service personnel, and equipment vendors in order to obtaingood quality, reliable spectra in a reasonable amount of time.PURPOSEThe purpose of this exhibit is to demonstrate CT (n = 2) andCT with MR (n = 2) findings of each case of inflammatorymyofibroblastic tumors of the intracranial, head and neckregion correlated with pathologic findings and review itsclinical aspect.MATERIALS & METHODSInflammatory myofibroblastic tumors (IMTs) generally havebeen termed as inflammatory pseudotumor, plasma cellgranuloma, and pseudosarcomatous myofibroblastic lesion.The lesion, comprises myofibroblastic spindle cells withacute and chronic inflammatory cells, is an unusual, benignsolid mass that mimics a neoplastic process. IMTs commonlyaffect the lung and orbit but are more rare in the head andneck, and they are encountered rarely in the paranasal sinus,larynx, oral cavity, thyroid gland, and skull base.RESULTSBecause they mimic malignant tumors both radiologicallyand clinically, the radiologist should be familiar with theirimaging features and help avoid unnecessary surgical procedurewhen possible.CONCLUSIONWe are going to introduce the pathologically proven fourIMTs of the intracranial, head and neck regions. They werelocated in the orbit (n = 1), maxillary sinus (n = 1), supraglotticairway (n = 1), and intracranial meninges (n = 1).KEY WORDS: Inflammatory myofibroblastic tumor, meninx,head and neckKEY WORDS: MR spectroscopy, phosphorus, techniqueScientific Exhibit 33Differential Diagnosis of Herpes Simplex Encephalitisfrom Its Mimics on MR ImagingTsuchiya, K. · Honya, K. · Nakajima, M. · Fujikawa, A.Kyorin UniversityTokyo, JAPANPURPOSEMR imaging plays an important role in the diagnosis of herpessimplex encephalitis (HSE), which frequently showslesions in the medial temporal lobe and cingulate gyrus showinghypointensity on T1-weighted images and hyperintensityon T2-weighted images. This exhibit illustrates the spectrumof diseases that present similar MR imaging findings placingemphasis on the differential diagnosis from HSE.
413MATERIALS & METHODSFrom a database of MR imaging at our institution for an 8-year period, we collected cases whose differential diagnosisincluded HSE and reviewed their images. MR examinationsin these cases included T2-weighted, FLAIR, pre and postcontrastT1-weighted imaging at 1.5 T or 0.5 T. Mostpatients underwent diffusion-weighted imaging as well. Incases with suspected cerebrovascular disease, 3D or 2Dtime-of-flight MR angiography also was obtained.RESULTSCases collected included those of neoplasms (six patientswith glioma, lymphoma, or brain metastasis), cerebralinfarction (two patients with venous infarction due to thrombosisof the transverse sinus), head trauma (seven patientswith contusion and edema), demyelinating diseases (twopatients with acute disseminated encephalomyelitis), radiationnecrosis (two patients), and status postepilepticus (threepatients). Neoplasms and radiation necrosis in the temporallobe resembled on precontrast images. However, they couldbe differentiated based on difference in patterns of contrastenhancement. Venous infarction necessitated MR venographyto establish the diagnosis. Head trauma could be differentiatedrather easily on the basis of clinical history as wellas its cortex-dominant location. Although some lesions ofacute disseminated encephalomyelitis were similar to thoseof HSE, lesions in other sites were a clue to the diagnosis.Lesions of status postepilepticus show hyperintensity on diffusion-weightedimages in common with HSE but they arenot restricted to the medial temporal lobe.CONCLUSIONThere are disorders that show similar MR imaging findingsas well as clinical findings including consciousness disturbancelike that in HSE. But careful image interpretation canlead to the correct diagnosis of HSE.KEY WORDS: Herpes simplex encephalitis, MR imagingScientific Exhibit 34MR Imaging of Cerebral VasculitisKim, H. · Kim, S. · Suh, D. · Lee, J. · Choi, C. · Lee, H. ·Lee, D.Asan Medical CenterSeoul, REPUBLIC OF KOREAPURPOSEVasculitis affecting the intracranial circulation is rare. Itsdiagnosis is challenging, not only because of its rarity, butalso because of the lack of uniform diagnostic criteria andthe difficulty in obtaining pathologic specimens from theCNS. MR imaging is considered to be an excellent screeningtool for CNS vasculitis because of its reportedly high sensitivity.In this exhibit, we will illustrate various MR imagingfeatures of cerebral vasculitis.MATERIALS & METHODSMR images of 12 patients with angiographically demonstratedand/or biopsy-proven cerebral vasculitis (9 women and 3men, age 11- 57 years), were reviewed retrospectively.RESULTSRevealed causative pathologies of 12 cerebral vasculitispatients were fibromuscular dysplasia (1), primary angiitisof CNS (1), SLE (1), CADASIL (1), antiphopholipid antibodysyndrome (1), drug (2), and idiopathic (5). The clinicalpresentations were motor and sensory change, blindness,dizziness, headache, change of mental status, and seizure.On MR imaging, four patients had cortical and subcorticallesions mimicking territorial infarction. Four patients hadhyperintense foci at the cortex, subcortical and deep whitematter, basal ganglia, and brain stem with or without adjacentmeningeal thickening and enhancement. Four patientshad parenchymal hemorrhage.CONCLUSIONMR findings of cerebral vasculitis are various but theyshowed some patterns. We illustrate those MR imaging patternsof cerebral vasculitis with various etiologies.KEY WORDS: Vasculitis, brain, inflammation, brain, MRimagingScientific Exhibit 35 (eSE)Diffusion-Weighted Imaging Findings of IntracranialTumors: Relationship between T2 and DiffusibilityHiwatashi, A. · Moritani, T. · Wang, H. Z. · Ketonen, L. ·Ekholm, S. E. · Westesson, P.University of Rochester Medical CenterRochester, NYPURPOSEDiffusion-weighted (DW) imaging can provide valuableinformation, such as tumor cellularity and grade. However, itis controversial whether DW imaging can detect tumor infiltrationor differentiate the tumor type. The purpose of thisexhibit is to demonstrate the findings of DW imaging inintracranial tumors.MATERIALS & METHODSMR examinations including DW imaging acquired in thisinstitution from 2000 to the present were reviewed and weidentified more than 500 cases of intracranial tumors.Imaging sequences evaluated were DW imaging, the apparentdiffusion coefficient (ADC) maps, T2-weighted images,and postcontrast T1-weighted images. In DW imaging, amotion-probing gradient was applied in three orthogonal orientationswith a b-value of 1000 sec/mm 2 .RESULTSWe identified a variety of intracranial tumors including lowandhigh-grade astrocystomas, oligodendroglioma, ependymoma,choroid plexus papilloma, ganglioglioma, dysembryoplasticneuroepithelial tumor, central neurocytoma, primitiveectodermal tumor, meningioma, hemangiopericytoma,malignant lymphoma, germ cell tumor, neurofibromatosis,craniopharyngioma, and metastases. This exhibit willdemonstrate the DW appearance of these tumors comparingthe effects of ADC and T2. The relationship among tumorcellularity, tumor grade, necrosis, and hemorrhage on DWimaging will be discussed also.Scientific Exhibits
Scientific ExhibitsCONCLUSIONThe interpretation of DW images requires correlation withADC maps and T2-weighted images to understand thepathophysiologic conditions. DW imaging can provide valuableinformation about tumor cellularity and help in the characterizationand grading of tumors of the brain. However, theability of specific tumor differentiation and determination oftumor infiltration is difficult in most situations.KEY WORDS: Diffusion, neoplasm, MR imagingScientific Exhibit 36Physiologic Assessment of Brain Tumor Hemodynamicswith Measurements of Blood Flow and Transit TimeHeterogeneityQuarles, C. C. · Ulmer, J. L. · Rand, S. D. · Krouwer, H. G.· Wagner, M. L. · Schmainda, K. M.Medical College of WisconsinMilwaukee, WIPURPOSEThe purpose of this exhibit is to demonstrate the potential ofdynamic susceptibility contrast (DSC) MR imaging to assessthe functional and morphologic changes in brain tissue vasculatureinduced by tumor angiogenesis. Unlike other bloodvolume techniques, which measures neovascular morphology,this project is focused on the measurement of brain tumorhemodynamics with measurements of blood flow and transittime in addition to CBV.MATERIALS & METHODSIn addition to conceptualizing the hemodynamic propertiesof brain tumors, the exhibit outlines the basis of perfusionweightedMR imaging using susceptibility contrast agents innormal brain and tumor tissue. Postprocessing techniques tocorrect for contrast agent leakage and compute blood flow,blood volume, mean transit time, mean vessel diameter, andintravoxel transit time distributions are presented. The relationshipbetween the perfusion parameters and tumor angiogenesisis characterized. The potential of this approach toimprove diagnosis and aid in the optimization of treatmentstrategies is illustrated with clinical examples.RESULTSOver 200 clinical DSC MR imaging perfusion studies havebeen performed to date and the perfusion analysis on 28 ofthese has been completed. Despite the heterogeneity oftumor types, locations, classifications, and treatment protocolsacross the subjects several consistent features regardingthe tumor perfusion have been observed. Both within andaround the contrast-enhancing regions, areas of short meantransit time (MTT), high cerebral blood flow (CBF) and volume(CBV), as compared to normal brain tissue, are commonlymeasured. However, as you approach the center of theprimary tumor mass the MTT increases while the CBFdecreases. The edematous regions typically demonstratedecreased CBF and CBV but normal MTTs. In addition tothe observed spatial consistencies across tumors a significantcorrelation between mean tumor CBF and tumor grade wasfound.414CONCLUSIONDynamic susceptibility contrast MR imaging perfusionparameters have the potential to provide new insights intobrain tumor hemodynamics. The spatial heterogeneity of thetumor perfusion parameters exemplify their sensitivity toangiogenic-induced hemodynamic abnormalities. The additionalprocessing time required to compute the functionalparameters (blood flow and transit time) is minimal and possiblyallows the detection of regions of highest metabolicactivity. This exhibit will demonstrate the clinical potentialof these hemodynamic parameters for the evaluation oftumor angiogenesis and the optimization of treatment strategies.KEY WORDS: Dynamic susceptibility contrast, tumor hemodynamics,therapy responseThe authors of this work have indicated the following affiliations/disclosures:National Institutes of Health (Bethesda,MD)/National Cancer Institute CA082500: Financial support.Scientific Exhibit 37 (eSE)MR Appearance of Reconstructive Flaps and Grafts inthe Cranial BaseParekh, N. N. · Perlow, A. · Urban, J. L. · Marentette, L. J. ·Mukherji, S. K.University of Michigan Health SystemAnn Arbor, MIPURPOSEThe objective of this exhibit is to promote understanding ofthe normal postoperative MR findings following reconstructionof the anterior and middle cranial fossa, and to highlightfeatures differentiating these findings from recurrent tumor.MATERIALS & METHODSPre and postoperative MR examinations of patients followedin the otolaryngology department after resection and reconstructionof cranial base neoplasms were reviewed retrospectivelyto determine a pattern in the MR characteristics ofcommonly used flaps and grafts. These include abdominalfat graft, skin graft, pericranial flap, temporalis muscle flap,scapular osteocutaneous flap, radial forearm fasciocutaneousflap, and rectus abdominis flap. Findings were correlatedwith postsurgical outcome, specifically recurrence.RESULTSMR characteristics were determined that allowed differentiationof flaps from grafts, evaluation of the change in flapand graft appearance over time, and discrimination of reconstructivematerials from neoplasm. These patterns wereinfluenced by the use of contrast and fat-suppression on T1-weighted images, the vascularity of components within theflap or graft, the use of reconstructive materials in additionto the flap or graft, and the enhancing characteristics of neoplasmif present. Certain normal changes were identified.Portions of a flap that are fully vascularized, such as a pericranialflap, a fasciocutaneous flap, and the muscular componentof a free muscular flap, will enhance on T1-weightedimages with gadolinium regardless of the use of fat satura-
tion. However, if a fatty component is not vascularized, theuse of fat-saturation after contrast enhancement will suppressthe signal in this component. It was noted also that fatgrafts, and nonvascularized fatty components of a muscularflap resolved over time. Additionally, the muscular componentof a muscular flap showed eventual atrophy. Patternsdifferentiating reconstructive procedures and recurrenttumor were noticed. Recurrent neoplasm can be differentiatedfrom the fatty, nonenhancing portion of a graft by comparisonof noncontrast T1-weighted images with imagespostgadolinium administration and fat suppression. Thesesequences can show increased signal in the fatty componentin the precontrast images alongside tumor, and suppressedfat alongside enhancing tumor in the postcontrast sequence.However, other postoperative complications such as fatnecrosis may mimic tumor in these characteristics.CONCLUSIONMR evaluation of the reconstructive procedures followingresection of anterior skull base tumors often is confusing.However, in addition to clinical correlation and understandingof the resection techniques, knowledge of 1) the type offlap or graft used in reconstruction and their normal patternsof signal intensity, 2) the enhancing characteristics of theneoplasm, and 3) proper utilization of T1-weighted MRsequences can aid in evaluating reconstructive materials inthe cranial base, and appropriately raising suspicion for complicationor recurrence.KEY WORDS: Cranial base, reconstruction, MR imaging415traumatic disease: edematous or hemorrhagic foci of axonalinjury; infectious disease: HIV encephalopathy; tumoral disease:high-grade gliomas, glioblastoma multiforme and lymphomaand psiquiatric disease: we found some morphologicchanges in schizophrenia and affective disorders. The characteristicsand location of lesions varied with the differentetiologies.CONCLUSIONWe find that lesions of the corpus callosum may be veryimportant to orient the differential diagnosis. It is not a frequentlocation of any pathologic process. Even when it is notpathognomonic, the affection of the corpus callosum maysuggest some etiologies upon others, depending on the characteristicsof the lesion (lesions). MR images conjointly withthe clinical context and other complementary tests may helpto assess the diagnosis.KEY WORDS: Corpus callosum, differential diagnosisScientific Exhibit 39Contrast-Enhanced MR Angiography: Usefulness inEvaluation of the Tumor-Associated VesselsJung, S. L. · Kim, B. · Ahn, K. J.Kangnam St. Mary’s Hospital, The Catholic University ofKoreaSeoul, REPUBLIC OF KOREAScientific ExhibitsScientific Exhibit 38Differential Diagnosis of Lesions Affecting the CorpusCallosumBesada, C. H. 1 · Fraticola, G. A. N. 21Hospital Francés, Buenos Aires, ARGENTINA, 2 HospitalInterzonal de Agudos Dr Diego Paroissien, Buenos Aires,ARGENTINAPURPOSETo show the spectrum of pathologies that may affect the corpuscallosum and how this topography could help to includeor exclude entities from the differential diagnosis.MATERIALS & METHODSWe reviewed case reports from about 50 patients with affectionof the corpus callosum. They had undergone CT and/orMR imaging. Some patients were referred for consultationby colleagues from other centers.RESULTSWe found the following pathologic processes affecting thecorpus callosum in our records: congenital malformations:agenesia or hypoplasia isolated or associated to many syndromes:Chiari II, lissencephaly, holoprosencephaly; vasculardisease: acute or chronic ischemic lesions and hemorrhagiclesions; demyelination or inflammatory diseases:multiple sclerosis and acute disseminated encephalomyelitis(ADEM); toxic lesions: Marchiafava-Bignami disease(MBD) and antiepileptic drugs toxicity; vascular malformations:arteriovenous malformations and cavernous angioma;PURPOSETo evaluate the usefulness of the contrast-enhanced MRangiography in evaluation of the vessels supplying and/orsurrounding the tumor.MATERIALS & METHODSContrast-enhanced MR angiography (MRA) was performedin 10 patients with meningiomas of the frontal cranial fossaand the parasagittal convexity, meningioma involving thecerebellopontine angle extending to the parapharyngealspace and retropharyngeal space through the jugular foramen,and paraganglioma of the jugular foramen and cerebellopontineangle. MRA was performed with 1.5 T MRmachine (Signa Twinspeed, GE Medical Systems,Milwaukee, WI). Scan parameter of MRA included TR/TE =5.5/1.5/Fr. 320 x 320 of matrix. FOV is 22 x 22. Total scantime is about 2 minutes 22 seconds. Autotrigering systemwas used and located in the internal carotid artery of the cavernoussinus or common carotid artery with 1 second delay.MRA was compared with postcontrast MR scans.RESULTSTumor vascularity (hypervascular or hypovascular) andtumor-associated vessels such as the arteries supplying thetumor, veins draining the tumor, and adjacent compressedvessels were observed simultaneously in single examinationin nine cases. These vessels were distinctly enhanced and therelationship between vessels and tumor were well demarcated.
Scientific ExhibitsCONCLUSIONContrast-enhanced MR angiography is noninvasive methodand is useful for simultaneous evaluation of the vessels surroundingand/or supplying the tumor as well as tumor vascularity.Therefore this examination is of help to surgeon.KEY WORDS: MR angiography, neoplasmScientific Exhibit 40Diagnostic Value of Contrast-Enhanced Fluid-Attenuated Inversion Recovery Sequence in CranialLesionsTokgoz, N. · Öner, A. · Gultekin, S. · Celik, H. · Erbas, G. ·Tali, T.Gazi University School of MedicineAnkara, TURKEYPURPOSEFluid-attenuated inversion recovery (FLAIR) imaging of thebrain has been reported to be an efficacious method for thediagnosis of several lesions including subarachnoid hemorrhage,meningoencephalitis, leptomeningeal and cranialnerve metastases, primary and metastatic parenchymaltumors, meningiomas and postoperative changes. The purposeof this exhibit is to describe and illustrate the diagnosticvalue of postcontrast FLAIR imaging in several craniallesions and to compare this sequence with postcontrast T1-weighted images.MATERIALS & METHODSIllustrative cranial lesions including subarachnoid hemorrhage,meningoencephalitis, leptomeningeal and cranialnerve metastases, meningiomas, glial tumors, parenchymalmetastases, and postoperative changes were included. AxialFLAIR and spin-echo T1-weighted imaging were obtainedbefore and after intravenous administration of 0.1 mmol/kggadopentetate dimeglumine in all cases. Postcontrast FLAIRimages were compared with postcontrast T1-weightedimages for conspicuity, contrast enhancement degree and thenumber of lesions. In addition, extension of the lesions wereassessed also.416RESULTSIn most of the extraaxial lesions (including subarachnoidhemorrhage, meningoencephalitis, leptomeningeal and cranialnerve metastases) postcontrast FLAIR sequence wassuperior to postcontrast T1weighted imaging in the number,conspicuity, and contrast enhancement degree of the lesions.Postcontrast FLAIR imaging detected a peripheral enhancementin most of the meningiomas, but was not found to besuperior to T1-weighted imaging in the number, conspicuity,and contrast enhancement degree. For cerebral gliomas,postcontrast FLAIR was superior in delineating tumor extension,otherwise it did not offer any information that was notavailable on postcontrast T1-weighted imaging. ContrastenhancedT1-weighted imaging was found to be superior inthe number, conspicuity, and contrast enhancement degree inparenchymal metastases compared to FLAIR. PostcontrastFLAIR was found to be superior in the depiction of postoperativechanges, and comparable in the delineation of residualenhancing lesions compared to contrast-enhanced T1-weighted imaging.CONCLUSIONPostcontrast FLAIR sequence is a valuable adjunct to thepostcontrast T1-weighted imaging. The use of FLAIR imagingroutinely before and after the administration of contrastmaterial is very efficacious in the delineation of various craniallesions.KEY WORDS: MR imaging, FLAIR, contrastScientific Exhibit 41Comparison of Dynamic Contrast-EnhancementPatterns between Intraaxial and Extraaxial TumorsChristoforidis, G. A. · Yang, M. · Varakis, L.The Ohio State UniversityColumbus, OHPURPOSETo determine whether perfusion patterns differ betweenintraaxial and extraaxial tumors.MATERIALS & METHODSWe reviewed dynamic contrast MR studies in 77 patientswith intracranial tumors (40 intraaxial and 37 extraaxial).This included 25 primary brain tumors, 15 metastatic braintumors, 28 patients with meningiomas, 2 patients withextraaxial lymphoma, 2 patients with paraganglioma and 5patients with schwannoma. These patients all underwentecho-planar T2 dynamic contrast-enhanced 1.5 T MR imagingusing spin-echo multiphase EPI (11 interleaved sliceswith TE = 80, a TR = 1900, FOV = 30, NEX = 1). Adequateintravenous access was obtained using a 21 gauge needle andcontrast was injected at 5 cc/sec using a mechanical injectorfor a total volume of 0.2 mmol/kg and a maximal dose of 20ml contrast. Acquisition time was 40 seconds with a 15 secondinjection delay. Relative cerebral blood volume mapswere generated with the limited integration method usingcommercially available software. Time vs signal intensitycurves were generated for each tumor and compared to normalgray matter in each patient. The overall shapes of thecurves were reviewed and compared to that of gray matter. Apattern which corresponded to extraaxial tumors was identified.Two observers then reviewed the curves without lookingat the images in order to differentiate intraaxial fromextraaxial tumors.RESULTSIntraaxial tumors were found to consistently have a narrowercurve than extraaxial tumors. Excellent agreementbetween the two observers for curve pattern was found. Theextraaxial pattern was identified consistently in 26 of 28meningiomas, 2 extraaxial lymphomas, two paragangliomas.Four of 5 patients with schwannoma displayed an intraaxialpattern of perfusion. All patients with primary tumors displayedan intraaxial pattern. Fourteen of 15 patients withmetastases displayed a pattern consistent with intraaxialtumor.
417CONCLUSIONDynamic contrast-enhanced imaging may help differentiateintraaxial from extraaxial tumors in most cases.KEY WORDS: Neoplasm, perfusion, dynamic contrast MRimagingScientific Exhibit 42Characterization of Brain Tumor Neovascularity withMeasurements of Total and Microvascular Blood Volumeand Mean Vessel Diameter: Implications for TumorBiology and Surgical ManagementSchmainda, K. M. · Rand, S. D. · Ulmer, J. L. · Ward, B. D.· Joseph, A. M. · Mueller, W. M. · Meyer, G. A. · Krouwer,H. G. J.Medical College of WisconsinMilwaukee, WIPURPOSETotal tumor blood volume has been shown to correlate withtumor grade (1). Here we demonstrate a multiparameterapproach to simultaneously obtain information about totalrelative cerebral blood volume (rCBV), as well as microvascularrCBV and mean vessel diameter (mVD) in patientswith brain tumors. Given that tumor vessels progress from astage of an increased number of microvessels to fewer butlarger, dilated vessels (2), this combined information shouldprovide a more comprehensive assessment of tumor biologyat its various stages of growth. Consistent with this hypothesis,the parameters obtained are predictive of tumor grade,provide information about tumor recurrence and progression,and through its ability to detect and localize the presenceof large vessels, aid in the optimization of the surgicalapproach.MATERIALS & METHODSA simultaneous GE/SE echo planar imaging (EPI) sequencewas used to obtain images during bolus injection (0.25mmole/kg) of a gadolinium contrast agent. In order to diminishand correct for confounding effects from contrast agentextravasation, a preload of contrast (0.05 mmole/kg) wasadministered prior to the GE/SE study and a postprocessingcorrection algorithm applied (3). Image maps of “total” (GE)and “microvascular” (SE) rCBV are determined along withmVD, which is calculated from a ratio of GE and SE relaxationrate changes. A Spearman Rank correlation test isapplied to determine the strength of the relationship betweenthese parameters and tumor grade. Case reports are presentedto demonstrate the potential of these methods to predictprogression and aid in the optimization of surgical approach.RESULTSTo date, over 300 studies using the GE/SE protocol havebeen performed. Of these, 45 patients with tissue confirmationof glioma, have been analyzed. When considering wholetumor, significant correlations were found between totalrCBV and grade (p = 0.001) and mVD and grade (p =0.0009), but not between microvascular rCBV ( p = 0.27 )and grade. Only when “hot spots” of microvascular rCBVare analyzed does a correlation with grade emerge. This isconsistent with the standard histologic method of performingmicrovessel counts from areas of vascular hot spots only. Inseveral studies, increases in blood volume were predictive oftumor recurrence and/or grade conversion. Whether increasesin total or microvascular blood volume, or both, tookplace seemed to be dependent on tumor stage and treatmenthistory. Finally, maps depicting the location of large tumorvessels correspond to those observed intraoperatively.CONCLUSIONMultiparameter blood volume imaging provides a wealth ofinformation about the tumor neovasculature, which is notobtained with standard postcontrast MR imaging or eitherGE (total rCBV) and SE (microvascular rCBV) methodsalone. Thus, this multiparameter approach may have a significantimpact on preoperative and postoperative assessmentof brain tumor biology.REFERENCES1. Law M, et al. AJNR Am J Neuroradiol 2003;024:1989-19982. Holash, et al. Science 1999;284:1994-19983. Donahue, et al. Magn Reson Med 2000;43:845-853KEY WORDS: Brain tumor, physiologic imaging, functionalimagingThe authors of this work have indicated the followingaffiliations/disclosures: 1. National Institutes of Health(Bethesda, MD)/NCI RO1 CA082500: Financial support;2. GCRC M01-00058: Financial support.Scientific Exhibit 43Radiologic Evaluation of HydrocephalusRovira-Cañellas, A. 1 · Rovira-Gols, A. 2 · Vázquez, E. 1 ·Rovira-Cañellas, M. 3 · Grivé, E. 1 · Carvajal, A. 21Hospital Vall d’Hebron, Barcelona, SPAIN, 2 UDIAT-CDCorporació Parc Tauli, Sabadell, SPAIN, 3 C.R.C., Barcelona,SPAINPURPOSETo describe the physiology of intracranial cerebral spinalfluid (CSF) circulation and the physiopathology of the differenttypes of hydrocephalus together with the pertinentradiologic findings.MATERIALS & METHODSThe physiologic mechanisms involved in the formation,resorption, and circulation of CSF within the cranium arerevised together with the normal neuroimaging findings. Thephysiopathologic mechanism of different types of hydrocephalusis described and illustrated through a selection ofrepresentative cases studied with different neuroradiologicmodalities (US, CT, and different MR techniques).RESULTSAdvances in neuroimaging techniques have brought about abetter understanding of the anatomy and physiology ofhydrocephalus, which allows it to be classified according toits etiology, with evident implications for therapy and prognosis.There are essentially two main types of hydrocephalus:A) those caused by overproduction of CSF (papillomasof the coroid plexus), and B) those caused by alter-Scientific Exhibits
Scientific Exhibitsations in CSF circulation. This latter group can be furthersubdivided into 1) noncommunicating hydrocephalus, inwhich the causal lesion is intraventricular or due to compressionfrom an intra or extraparenchymatous lesion, and 2)communicating hydrocephalus resulting from extraventricularobstruction secondary to a CSF resorption disorder.CONCLUSIONNeuroimaging techniques such as CT, US in pediatricpatients, and MR imaging (including cardiac-gated phasecontrastMR imaging, which are sensitive to the pulsatilemovement of CSF circulation) play a vital role in the diagnosisand follow-up of hydrocephalus. The goal of neuroimagingin this context, apart from differentiating hydrocephalusfrom other causes of ventricular dilatation, shouldbe to define the type and cause of hydrocephalus, as thesewill have important implications for prognosis and therapy.Moreover, it is essential for neuroimaging findings to beinterpreted in light of the clinical history and neurologicfindings.KEY WORDS: Hydrocephalus, CT, MR imagingScientific Exhibit 44Radiologic Evaluation in Follow-up and Managementafter Surgical Treatment of HydrocephalusRovira-Gols, A. 1 · Rovira-Cañellas, A. 2 · Sánchez, E. 2 ·Rovira-Cañellas, M. 3 · Martín, C. 1 · Zauner, M. 11UDIAT-CD Corporació Sanitària Parc Taulí, Sabadell,SPAIN, 2 Hospital Vall d’Hebron, Barcelona, SPAIN,3C.R.C., Barcelona, SPAINPURPOSETo illustrate the neuroimaging findings in the postsurgicalfollow-up of hydrocephalus, emphasizing the complicationsthat can present in association with external drainage andinternal shunting.MATERIALS & METHODSThe different surgical procedures (drainage systems, shuntingdevices, and ventriculostomy) used to treat hydrocephalusare described together with the radiologic techniques(US, CT, and MR imaging) used to evaluate the successof the treatment and its complications. Representativecases showing different complications occurring both withinand outside the cranium are presented and analyzed bymeans of the relevant neuroimaging findings.RESULTSCommon complications of surgical treatment of hydrocephalusinclude: a) those directly related to surgical manipulation(intracranial hemorrhage, pneumocephalus, andinfections); b) those involving valvular malfunction due toobstruction or inadequate placement of the shunting device;and c) those occurring secondary to overdrainage of CSF(subdural hematomas/hygromas, intracranial hypotension,and the ventricular collapse syndrome). Other, more rarecomplications include those occurring in the abdomen inventriculoperitoneal shunts and those occurring secondary tothe dissemination of tumorous or infectious processesthrough the shunting device.418CONCLUSIONHydrocephalus continues to pose a challenge in modern neurosurgery;its high incidence and rate of complications makereliable neuroimaging studies essential in the managementand follow-up of this entity. The combined analysis of CT,US, and MR findings (including cardiac-gated phase-contrastMR imaging) gives an accurate assessment of theresponse to ventricular shunt placement or endoscopic proceduresand is invaluable in the evaluation of complicationsarising after surgical treatment.KEY WORDS: Hydrocephalus, ventricular drainage, complicationsScientific Exhibit 45Many Faces of MeningiomaDelshad, A. · Kim, P. E. · Zee, C. S.Los Angeles County/University of Southern CaliforniaMedical CenterLos Angeles, CAPURPOSETo present the various unusual and rare MR imaging findingsof meningioma with pathologic correlation.MATERIALS & METHODSA review of our surgical pathologic record for the past 10years revealed 328 cases of intracranial meningioma. A significantnumber (approximately 15%) of the cases had atypicalor unusual imaging findings.RESULTSA total of 49 cases of meningioma was found to have atypicalor unusual features, including lack of contrast enhancement,cystic/necrotic changes, intratumoral hemorrhage, twodistinct areas of different signal intensity within one tumor,lytic changes of the skull with extracranial extension of thetumor, intraosseous meningioma.CONCLUSIONAtypical and unusual MR imaging features of intracranialmeningiomas are presented with pathologic correlation.KEY WORDS: Meningioma, extraaxial tumor, brain tumorScientific Exhibit 46 (eSE)Meningioma with Meningioangiomatosis: Regrowthafter Partial ResectionMallesh, A. · Wilson, J. · Wang, A.William Beaumont HospitalRoyal Oak, MIPURPOSEThis paper presents two cases of meningioangiomatosis withassociated meningioma. Radiologically and microscopicallythe main differential is to distinguish it from meningiomaand invasive meningioma. We present the imaging and
pathologic features of these two cases. To illustrate in onecase there was partial regrowth which has not been reportedin this entity.419selection of the slices, ROIs were semiautomatically placedon the tracts and FA and ADC within the ROIs were calculated.MATERIALS & METHODSA review of the clinical presentation, the CT, MR imagingcharacteristics and follow-up after surgery was done. An assesmentof the role of radiology in aiding diagnosis wasmade.RESULTSDiscussion of the differentials of meningioangiomatosis andthe clinical presentation, imaging findings, and pathologiccorrelation. There was no significant characteristic to differentiatemeningioangioma based on imaging findings alone.CONCLUSIONThe diagnosis of meningeal angiomatosis associated withmeningioma is important because it is a benign lesion andthe prognosis is excellent. There are no reported cases ofrecurrence; one of the cases presented showed partialregrowth following incomplete resection.KEY WORDS: Meningioangiomatosis, regrowth, differentialScientific Exhibit 47Segmentation and Quantitative Analysis of the WhiteMatter Tracts by Diffusion TensorImaging/TractographyAoki, S. · Masutani, Y. · Iwata, N. · Abe, O. · Yamada, H. ·Kabasawa, H. · Masumoto, T. · Mori, H. · Hayashi, N.University of TokyoTokyo, JAPANPURPOSEWith diffusion tensor imaging and its tractography (DTT),we can segment and quantitatively evaluate the white mattertracts. With DTT, we can visualize and segment major whitematter tracts. When we put the regions of interest on the segmentedtracts, we can calculate diffusion tensor scalar metricssuch as fractional anisotropy. Diffusion tensor anisotropicindices were reported to be useful in evaluation of the normalappearing white matter of the patients with neurodegenerative/psychiatricdisorders. Those reports, however, didnot use DTT for anatomical landmark in setting ROIs. Wedemonstrate early clinical experiences of this combinedtechnique with validation of this method.MATERIALS & METHODSForty patients with neurodegenerative/psychiatric disorders(amyotropic lateral sclerosis: ALS and schizophrenia) andage-matched 40 volunteers were studied. Diffusion tensorimaging (TR/TE 6000/78 ms, MPG 13 axes, b-value 1000s/mm2, 128 x 128 Matrix, 2 NEX, 5 mm thickness/interleave,acquisition time 5.5 min) was performed by 1.5 T MRimager. Diffusion tensor tractography (DTT) of pyramidaltract, corticobulbar tract, fornix, cinglum and other whitematter tracts were visualized by the dTV and VOLUME-ONE software (Free software by Masutani Y). After manualRESULTSMean FAs of ALS patients in the ROIs along the pyramidaltract (bulbar-onset: 0.595, limb-onset: 0.587) were significantlylower than that of controls (CST: 0.639) (p < 0.05).Mean FA of CBT of bulbar-onset type (0.509) was significantlylower than that of limb-onset type (0.549) and that ofvolunteers (0.552). Mean FA of patients with schizophreniain the ROIs along the affected tracts were significantly lowerthan that of controls.CONCLUSIONThere are several methods for evaluation of diffusion tensorscalar metrics. Manual ROI analysis is usually more sensitivethan normalization, but it is subjective and lacks reproductivity.Our method, using the tract by DT tractography,may be an objective method for evaluation of diffusionparameters of the specific tracts. Using diffusion tensor tractographyfor segmentation of the white matter tracts, meanFA of the affected white matter tracts could differentiate thesubtle changes between the patients and the volunteers andpatient clinical subtypes.KEY WORDS: Diffusion tensor imaging, white matter, diffusiontensor tractographyThe authors of this work have indicated the following affiliations/disclosures:General Electric Company: Researchfund.Scientific Exhibit 48Clinical Experience with Susceptibility-WeightedNeuroimagingDelProposto, Z. S. 1 · Sehgal, V. 1 · Haddar, D. 2 · Haacke, E.M. 2 · Tong, K. A. 3 · Sloan, A. 1 · Zamarano, L. J. 11Wayne State University, Detroit, MI, 2 MRI Institute forBiomedical Research, Detroit, MI, 3 Loma Linda UniversityMedical Center, Loma Linda, CAPURPOSETo summarize the current clinical experience with susceptibility-weightedimaging (SWI) in the evaluation of brainmasses, CVA, trauma, and occult vascular disease.MATERIALS & METHODSSusceptibility-weighted imaging is a high-resolution, threedimensional,fully velocity compensated gradient-echosequence. Postprocessing is applied using both magnitudeand phase images to increase the conspicuity of the veins andother sources of susceptibility effects (1). This sequence,used at multiple centers nationwide, has been applied to over44 patients with brain masses, 7 pediatric patients with trauma(2), and multiple patients with CVA and occult vascularlesions such as AVMs and capillary telangiectasis.Comparison to conventional imaging sequences (T1, T1postcontrast, T2, proton density, FLAIR and/or diffusionweightedimaging) was made for all cases.Scientific Exhibits
Scientific ExhibitsRESULTSThe identification of local changes in blood volume, venousdrainage and hemorrhage all affect the interpretation of brainlesions in MR imaging. Susceptibility-weighted imaging issuited uniquely for the visualization of blood products, withconsequent relevance for the detection of hemorrhage intrauma and CVA. Susceptibility-weighted imaging providescomplementary information to conventional imagingsequences for the analysis of internal composition of brainmasses, and is superior to other sequences for the visualizationof small venous structures both within masses and vascularmalformations.CONCLUSIONSusceptibility-weighted imaging is a vital adjunct forimproving the diagnosis and characterization of brain masses,trauma, occult vascular malformations, and hemorrhagicCVA, by virtue of its ability to show venous vasculature andblood products better than any other sequence.REFERENCES1. Reichenbach JR, Venkatesan R, Schillinger DJ, Kido DK,Haacke EM. Small Vessels in the Human Brain: MRVenography with Deoxyhemoglobin as an Intrinsic ContrastAgent. Radiology 1997; 204:272-2772. Tong KA, Ashwal S, Holshouser BA, Shutter LA, Herigault G,Haacke EM, Kido DK. Hemorrhagic Shearing Lesions inChildren and Adolescents with Posttraumatic DiffuseAxonal Injury: Improved Detection and Initial Results.Radiology 2003;227:332-339KEY WORDS: Susceptibility-weighted imaging, BOLD,reviewScientific Exhibit 50Evaluation of Cavernous Sinus Lesions with Sixteen-Row Multidetector CTStecher, R. P. · Lev, S.Nassau University Medical CenterEast Meadow, NYPURPOSETo review the anatomy and radiographic spectrum of cavernoussinus lesions, emphasizing an approach, radiologicmimics, and key differentiating points. We stress the utilityand emerging role of 16-row multidetector CT in the diagnosisand management of cavernous sinus pathology.MATERIALS & METHODSA 0.5 second rotation 16-slice helical CT (SomatomSensation, Siemens) was used. Three-dimensional reconstructionsand two-dimensional reformatted images weregenerated from the axial images at the workstation. Wereviewed the imaging studies and clinical features of patientswho presented with cavernous sinus lesions. Correlationwith MR imaging/angiography, with FLAIR and diffusionweightedimaging, as well as conventional angiography, wasperformed when applicable.420RESULTSCavernous sinus lesions may be related to inherent neuraland vascular structures, arise within the cavernous sinusitself, or result from extension of local or distant diseaseprocesses. Neoplastic entities include cranial nerve schwannoma,meningioma, hematogenous extracranial metastasis,parasellar dermoid, and local contiguous invasion by aggressivepituitary macroadenoma or chordoma. Vascular lesionsare aneurysms of the cavernous portion of the internalcarotid artery, carotid-cavernous fistula and dural AVF, andvenous thrombosis. Infectious entities, such as invasiveaspergillosis, inflammatory and granulomatous processes,such as sarcoid, may involve the cranial nerves, or they mayextend from the basilar cisterns (meningitis) and the sphenoidsinus.CONCLUSIONSixteen-row multidetector CT can improve viualization andunderstanding of cavernous sinus pathology. Awareness ofthe normal anatomy of the cavernous sinus and familiaritywith distinguishing imaging features of assorted lesions canhelp the radiologist achieve a prompt and accurate diagnosis.KEY WORDS: Multidetector CT, cavernous sinusScientific Exhibit 51Three-Dimensional Digital Angiography and FusionDigital Subtraction Angiography: Two NewReconstruction Algorithms for Simultaneous Three-Dimensional Rendering of Osseous and VascularInformation Obtained during Rotational Angiography.Technical Aspect and Clinical ApplicationGailloud, P. 1 · Oishi, S. 2 · Carpenter, J. 1 · Murphy, K. 11The Johns Hopkins Medical Institutions, Baltimore, MD,2Toshiba Medical Systems Research and DevelopmentCenter, Tochigi, JAPANPURPOSETo describe and illustrate the clinical value of two reconstructionalgorithms providing simultaneous three-dimensionalimaging of bone and blood vessels.MATERIALS & METHODSTwo algorithms that can build three-dimensional vascularand osseous data sets from standard catheter rotationalangiograms are described: (1) Three-dimensional digitalangiography (3D DA) reconstructs a nonsubtractedangiogram in a single three-dimensional representation ofthe blood vessels and surrounding bony structures; (2)Three-dimensional fusion digital angiography (3D FDSA) isbased on separate reconstructions of the mask and contrastsequences of the rotational acquisition. The two independentthree-dimensional data sets (3D bone and 3D DSA) are thenfused in a single three-dimensional representation. Bothalgorithms use a modification of the Feldkamp method thatcompensate for the signal inhomogeneity inherent to thereconstruction of nonsubtracted rotational acquisitions. Thethree-dimensional data set is postprocessed using a commerciallyavailable computer workstation. The rotational datasets were obtained as part of routine diagnostic cerebralangiography. The parameters used for rotational angiogra-
phy were as follows: tube rotation 200 degrees at 40degrees/sec, frame rate 30 frames/sec. The contrast volumes(in ml) and rates (in ml/sec) were as follows: vertebral artery(18/3), common carotid artery (24/4), internal carotid artery(18/3). For each patient, 3D DA and/or 3D FDSA wasobtained in addition to standard 3D DSA using the samerotational data set. Three-dimensional digital angiography isillustrated with three clinical cases (posterior fossa arteriovenousmalformation, skull base arteriovenous fistula,intrasellar aneurysm). Three-dimensional digital angiographyis illustrated with three clinical cases (giant skull baseaneurysm, suboccipital venous varix and neuralgia, and lessersphenoid wing meningioma).RESULTSBoth algorithms successfully build three-dimensional datasets that combine vascular and osseous information. Threedimensionaldigital angiography allows evaluating the topographicrelationships between the blood vessels and theirbony surroundings. However, since 3D DA is based on thereconstruction of a single nonsubtracted rotational data set, itcannot avoid an artifactual loss of image quality whenosseous and vascular structures are immediately adjacent,such as at the skull base. Three-dimensional fusion digitalangiography separately reconstructs the osseous and vascularinformation obtained from the rotational angiogram,keeping optimal angiographic resolution and offering precisetopographic analysis even when vessels are in contact withbone. The additional information brought by 3D DA and 3DFDSA was useful for: 1) the establishment of a topographicdiagnosis (e.g., suboccipital varix and neuralgia), 2) the documentationof unsuspected lesion extension (e.g., skull baseaneurysm eroding into the posterior fossa), 3) the planningof surgical intervention (e.g., lesser sphenoid wing meningioma).Three-dimensional fusion digital angiography wassuperior to 3D DA in the analysis of skull base lesions,where it could show fine topographic relationships betweenthe blood vessels and the adjacent bone without the artifactsand loss of image quality seen with 3D DA.CONCLUSIONWe report two reconstruction algorithms that offer simultaneousthree-dimensional display of the osseous and vascularinformation obtained by rotational catheter angiography.Both 3D DA and 3D FDSA provide clinically useful topographicinformation through simultaneous three-dimensionalrepresentation of vascular and osseous structures. Threedimensionalfusion digital angiography is superior to 3D DAfor the imaging of skull base vascular lesions.KEY WORDS: Three-dimensional angiography, cerebrovasculardiseasesThe authors of this work have indicated the following affiliations/disclosures:Toshiba Medical Systems: Employee.421Scientific Exhibit 52Near-Infrared Monitoring of Tissue Oxygenation duringDiagnostic and Interventional Cerebral AngiographyOkubo, T. · Nakata, Y. · Adachi, Y. · Hori, M. · Araki, T.University of YamanashiYamanashi, JAPANPURPOSENear-infrared spectroscopy (NIRS) is a technique that iscapable of noninvasive and continuous monitoring of thestate of oxygenated hemoglobin (OHb) and deoxygenatedhemoglobin (DHb) in tissue in vivo. The aim of this exhibitwas to demonstrate temporary changes of cerebral oxygenationduring diagnostic cerebral angiography and internalcarotid artery balloon occlusion test by NIRS.MATERIALS & METHODSThe optrodes of a near-infrared spectrometer (NoninvasiveOxygenation Monitor OM-200, Shimadzu, Japan) werepositioned on the lateral frontal surface of the patient’s forehead.Near-infrared spectroscopy measurements of OHb,DHb, and THb were made during the ipsilateral internalcarotid artery balloon occlusion of 15 minutes. The sensitivevolume of the NIRS detector was situated within about 4centimeters depth from the surface. The sampling time foreach photon count was 1 to 5 seconds. The relative percentagechanges of OHb, DHb, and THb concentrations werecalculated. One hundred three measurements were performedduring the ipsilateral internal or common carotiddiagnostic angiography using nonionic contrast media. Theinjection of the nonionic contrast media ranged from 6 to 11ml in volume and 2 to 7 ml/sec in injection speed. Next, 18patients were examined with temporary balloon test occlusionof the internal carotid artery and NIRS for preoperativeevaluation of adequate collateral circulation. In 15 of the 18patients, brain SPECT during the balloon test occlusion wasemployed also and compared with NIRS. 99mTc-HMPAOwas injected intravenously after the balloon occlusion of 3minutes.RESULTSIn 102 of the 103 measurements during the diagnosticangiography, OHb and THb decreased temporarily and DHbincreased during the transition of contrast media. In onemeasurement, no significant changes could be detected dueto very high cerebral blood flows induced from the largefrontal AVM. Each maximum relative change of OHb, DHb,THb, and SdO2 (= DHb/THb%) were -16.46% +/- 11.43,3.71% +/- 3.67, -11.35% +/- 7.69, and -6.50% +/- 6.55(mean +/- SD%). In two patients of the 18 with the testocclusion, neurologic deficits were presented and the testwas stopped. In 16 patients, no neurologic deficits were presentedduring the test occlusion. In 14 of the 16 patients,NIRS demonstrated a transient decrease in OHb and anincrease in DHb, indicating the absence of severe hypoxia inthe ipsilateral hemisphere from inadequate collateral circulation.The relative changes of OHb and DHb were -22.05 and17.22 (mean) %, respectively. Brain SPECT showeddecrease of regional cerebral blood flow (rCBF) of frontallobe, but the degree was under 15% in comparison with theopposite side. In the other two patients, NIRS showed noScientific Exhibits
Scientific Exhibitsdecrease in OHb. The relative changes of OHb and DHbwere 1.87 and 2.12 (mean) %, respectively. Brain SPECTshowed no significant decrease of rCBF.CONCLUSIONNear-infrared spectroscopy was able to monitor the temporarychanges of cerebral oxygenation during diagnostic andinterventional cerebral angiography. Further study of thisprocedure may provide more information with respect toregional cerebral blood flow and tissue oxygenation.KEY WORDS: Near-infrared monitoring, cerebral angiography,interventionalScientific Exhibit 53Diffusion-Weighted Imaging of Acute Excitotoxic BrainInjuryMoritani, T. · Hiwatashi, A. · Wang, H. · Ketonen, L. ·Ekholm, S. · Westesson, P.University of RochesterRochester, NYPURPOSETo demonstrate diffusion-weighted (DW) imaging of acuteexcitotoxic brain injury and its pathophysiology. Transsynapticinjury via excitotoxic amines such as glutamate is aspecific type of injury in the peripheral and central nervoussystem. Recent studies show that receptors related to excitotoxicmechanisms are distributed widely in the brain, notonly in the gray matter (neurons) but also in the white matter(astrocytes and oligodendrocytes). Excitotoxic braininjury is presumed to be related to any pathologic conditionthat causes cytotoxic edema, resulting in decreased ADC.MATERIALS & METHODSWe reviewed over 200 cases that include infarction, hypoxicischemic encephalopathy (HIE), the early phase of wallerianand transneuronal degeneration, status epilepticus, corpuscallosum lesion related to seizures or antiepileptic drugs, diffuseaxonal injury, cortical contusion, shaken baby syndrome,the acute phase of multiple sclerosis, toxic and metabolicleukoencephalopathy, osmotic myelinolysis, andCreutzfeldt-Jakob disease (CJD).422is seen in organic acid disorders which also cause excitotoxicinjury. Receptor dysfunction occurs in some metabolic(phenylketonuria) and degenerative diseases (CJD), resultingin excitotoxic brain injury.CONCLUSIONDiffusion-weighted imaging is useful in evaluating cytotoxicedema due to excitotoxic brain injury. The severity(reversibility) and distribution are different in various diseases(cell types, initial insults, and their mechanisms) and inpatient’s age (distribution of receptors, maturity of bloodbrainbarrier). Glutamate receptor antagonists will offerattractive possibilities for future therapy as a neuroprotectantsin these diseases.REFERENCES1. Hassel B, Boudingh KA, Narvesen C, et al. GlutamateTransport, Glutamine Synthase and Phosphate-ActivatedGlutaminase in Rat CNS White Matter. A QuantitativeStudy. J Neurochem 2003;87:230-2372. Lipton SA, Rosenberg PA. Excitatory Amino Acids as a FinalCommon Pathway for Neurologic Disorders. N Engl J Med1994;330:613-6223. Mark LP, Prost RW, Ulmer JL, et al. Pictorial Review ofGlutamate Excitotoxicity: Fundamental Concepts forNeuroimaging. AJNR Am J Neuroradiol 2001;22:1813-1824KEY WORDS: Diffusion-weighted imaging, MR imaging,excitotoxicScientific Exhibit 54Can Multislice CT Angiography Contribute to theDiagnosis and Evaluation of Dissected CraniocervicalArteries?Goldsher, D. · Abrantes, Y. · Daitzchman, M. · Eran, A. ·Schreiber, R.Rambam Medical CenterHaifa, ISRAELPURPOSETo evaluate the ability of multislice CT angiography(MCTA) to detect and diagnose dissection of carotid andvertebral arteries.RESULTSEnergy failure is an initial insult in infarction or HIE, andimpaired reuptake of glutamate usually causing severe excitotoxicbrain injury, mostly resulting in necrosis and atrophy.Distribution of HIE and secondary degeneration fromischemia could be related to excitotoxic circuits via synapsesor axons. Excessive release of glutamate can cause cytotoxicedema in seizure, infection, demyelination, or toxicmetabolic disease. Such cytotoxic edema is due to excitotoxicinjury with less energy failure, and could be reversible.In status epilepticus, the distribution of DW abnormalities inthe hippocampi, thalami, and cerebral cortices could be relatedto that of NMDA receptors. Leakage of glutamate cancause traumatic brain injury. The severity and distribution inHIE, shaken baby syndrome, and neonatal herpes encephalitisseems to be related to the vulnerability to excitotoxicinjury in neonates and infants. Structurally similar substanceMATERIALS & METHODSTwelve dissected craniocervical arteries were diagnosed in11 of 204 consecutive patients who underwent multisliceCTA of the craniocervical arteries in our department. Therewere 6 males and 5 females, 8-74 years of age. Indicationsfor MCTA were as follows: penetrating cervical trauma (5),acute spontaneous SAH (2), CVA (3), and suspected aorticdissection (1). The imaged volume extended from the aorticarch level to a level above the circle of Willis. Diagnosis wasconfirmed with MR imaging, DSA or surgery. MR studieswere performed on a 0.5 T Gyrex MR imaging system(Elscint) and 1.5 T Echospeed system (GE). DSA studieswere performed with a Multistar system (Siemens).
RESULTSSeven dissections of the carotid arteries were found in sixpatients. In three patients, the dissection was located at thecervical segment of the internal carotid artery (ICA); in twopatients it was at the carotid siphon and, in the sixth patient,bilateral dissections of the common carotid arteries weredemonstrated. Dissected vertebral arteries were diagnosed infour patients: at C1-2 level in two, at C3 level in one, and atthe intracranial segment in the fourth. A dissecting aneurysmof the right PICA was demonstrated in one patient. In 10patients, the diagnosis was confirmed by DSA, MR imagingor at surgery. In all cases, MCTA demonstrated the narrowedarterial lumen and pointed to the exact location of the dissection.Intramural hematomas indicating extension of thedissected segment were demonstrated only in affectedcarotid arteries and could not be seen in dissected vertebralarteries.CONCLUSIONMultislice CT angiography may be a valuable tool for thedetection and evaluation of dissected carotid and vertebralarteries. It is more informative in carotid dissections andmay contribute to diagnostic and therapeutic cerebralangiogram planning, as well as for treatment decision-makingin these patients.KEY WORDS: Arterial dissection, CT angiography, craniocervicalarteriesScientific Exhibit 55Subtraction Three-Dimensional CT Angiography UsingMultidetector Row CT with Controlled-Orbit HelicalScanning: Application to the Evaluation of PostoperativeIntracranial AneurysmsImakita, S. · Onishi, Y. · Yamada, M. · Tanaka, R. · Higashi,M. · Naito, H. · Iihara, K. · Miyamoto, S.National Cardiovascular CenterSuita, JAPANPURPOSEOur goal was to evaluate the utility of subtraction threedimensional(3D) CT angiography using multidetector rowCT with newly devised controlled-orbit helical scanning inthe postoperative intracranial aneurysms.423ml/body weight kg. The 0.5 mm-thick axial images werereconstructed at every 0.2 mm interval. The 3D reconstructionwas performed using volume-rendering method on aworkstation (Zio M900 Quadra, Ziosoft Inc., Japan).Subtraction 3D CT angiograms were compared with 3D CTangiograms for their characterization of postoperativeintracranial aneurysms.RESULTSThree-dimensional CT angiograms could depict the postoperativestate of intracranial aneurysms with titanium clips tosome extent. Three-dimensional CT angiograms could notdepict the postoperative state of intracranial aneurysms withcobalt clips due to their severe artifacts. Subtraction 3D CTangiograms with fusion of clips could clearly depict the relationbetween the clips and neck of aneurysms in all intracranialaneurysms with clips except 8 cases with poor subtractionimages due to severe motion artifact. Subtraction 3D CTangiograms were superior to 3D CT angiograms in thedepiction of postoperative state of all intracranial aneurysms.Subtraction 3D CT angiograms could clearly depict 6 remnantnecks of aneurysms and 6 residual aneurysms. In thefollow-up examinations of a partially thrombosed giantaneurysm after clipping operation, subtraction 3D CTangiograms with fusion of clips and thrombus clearly coulddepict complete thrombosis and volume loss of aneurysm.CONCLUSIONSubtraction 3D CT angiography using multidetector row CTwith controlled-orbit helical scanning was effective in thedepiction of postoperative state of intracranial aneurysms.KEY WORDS: Multidetector row CT, CT angiography,intracranial aneurysmScientific Exhibit 56Evolution of Radiosurgical Planning for Treatment ofCerebral Arteriovenous Malformation: CurrentExperience with Multimodal Target CharacterizationBased on CT Angiography and Digital SubtractionAngiographyKim, P. E. · Yuhan, J. · Go, J. L. · Yu, C. · Gianotta, S. L.University of Southern California Keck School of MedicineLos Angeles, CAScientific ExhibitsMATERIALS & METHODSOne hundred twenty patients (136 aneurysms) performed aclipping operation for aneurysms and were examined usingmultidetector row CT with controlled-orbit helical scanning.Multidetector row CT scanner was Aquilion Multi (4-detectorrows and 16-detector rows, Toshiba, Japan). The scanparameters in 4-detector rows CT scanner were as follows:high voltage 120 kV, tube current 300 mA, slice collimation4 x 0.5 mm, rotation time 0.75 sec, CT pitch factor 0.75:1(helical pitch 3:4). The scan parameters in 16-detector rowsCT scanner were as follows: high voltage 120 kV, tube current300 mA, slice collimation 16 x 0.5 mm, rotation time1.0 sec, CT pitch factor 0.6875:1 (helical pitch 11:16). Thecontrast medium (Iohexol 350 mgI/ml) was injected viaantecubital vein at the rate of 1.5-2.0 ml/sec with powerinjector. The total volume of contrast medium was 1.2-1.5PURPOSETo review the history of imaging in target characterizationfor radiosurgical treatment of cerebral arteriovenous malformations(AVM), and to describe a methodology currentlyused at our institution.MATERIALS & METHODSThe history and evolution of radiosurgical planning is discussedthrough a review of the literature and clinical experienceat University of Southern California over the past twodecades.RESULTSThe precise three-dimensional definition of the nidus of acerebral AVM in space has been problematic since the inceptionof radiosurgical techniques for treatment. The pitfalls
Scientific Exhibitsthat limit the effectiveness of all techniques employed todate for this purpose for the most part fall into one of threecategories: inaccurate 3D characterization of the lesion;magnification distortion of cut film and digital subtractionangiograms (DSA); and absence of hemodynamic informationwith rotational 3D DSA, MR imaging, MRA, and CTA.Some of the various methods that have been devised to compensatefor these shortcomings are reviewed, all of whichinvolve some degree of compromise from an idealized targetvolume characterization. Most methods involve the use ofmultiple imaging modalities that complement one another.The development of rapid multislice CT scanners capable ofacquisitions with near-isotropic voxel parameters allows theacquisitions of highly spatially detailed CT angiograms thatcan be used in conjunction with the Cyberknife R radiosurgerysystem. Our early experience with the combined useof CT angiography and DSA for Cyberknife R treatment planningof cerebral AVM is described.CONCLUSIONOptimal radiosurgical planning for treatment of cerebralAVM is challenging due to limitations of current imagingmethodologies. However, advancements in imaging technologies,particularly when used in combination, have atleast partially overcome many of the obstacles to accuratelesion characterization. We describe our early experiencewith a multimodality approach using CT angiography andDSA with the Cyberknife R radiosurgery system.KEY WORDS: Arteriovenous malformation, radiosurgery,Cyberknife424to false-positive results than 2D TOF and 2D PC. ContrastenhancedMRV also is superior to these other techniques fordepicting complete and partial dural venous-sinus thrombosis,arteriovenous malformations, and infarction.CONCLUSIONContrast-enhanced MR venography is likely to become thenew MR imaging-based “gold standard” for evaluation ofthe dural sinuses and veins of the brain.KEY WORDS: MR venography, dural venous sinusesScientific Exhibit 58Variabilities of Cerebral Arteries: Normal Variant andAnomalous VesselsYoo, W. · Lee, K. · Lee, H.Holy Family Hospital, The Catholic University of KoreaBucheon City, Kyunggi-do, REPUBLIC OF KOREAPURPOSETo demonstrate variable angiographic findings of normalvariants and anomalous vessels on cerebral angiographywith reference to origin and clinical significance.MATERIALS & METHODSWe retrospectively reviewed 920 cases with digital subtractioncerebral angiography who underwent cerebral angiographyfor various causes of cerebral ischemia, subarachnoidhemorrhage, AVMs, and brain tumors.Scientific Exhibit 57Contrast-Enhanced MR Venography of the BrainCampeau, N. G. J. · McGough, P. F. · Miller, G. M. ·DeLone, D. RMayo ClinicRochester, MNPURPOSETo illustrate the advantages of bolus gadolinium contrastenhancedMR venography (CE MRV) of the brain.MATERIALS & METHODSA bolus gadolinium MRV pulse sequence using elliptic centricphase-encoding order was implemented for use on both1.5 T and 3.0 T clinical MR imaging units. ContrastenhancedMRV studies were obtained in 75 patients referredfor imaging of suspected venous pathology. Most patientsalso underwent conventional MRV using 2D TOF and/or 2DPC MRV at the same imaging session.RESULTSContrast-enhanced MRV is a robust technique which may beimplemented readily on a clinical MR imaging unit.Contrast-enhanced MRV acquisitions are shorter than conventional2D TOF MRV, and cine PC MRV, with the additionaladvantage of providing entire brain coverage.Contrast-enhanced MRV allows depiction of very smallvenous structures which are usually beyond resolution availablewith our current 2D TOF and 2D PC protocols.Contrast-enhanced MRV is significantly (p< 0.05) less proneRESULTSThis exhibit includes: 1) fenestration of supraclinoid portionof ICA, vertebral artery, basilar artery, and ACA: 2) accessoryand duplicated MCA: 3) cerebellar artery originating fromthe ICA: 4) duplicated posterior communicating artery (variantterritory of anterior choroidal artery): 5) cortical variationsof ACA ( azygos artery variants, triplicated artery,accessory ACA or median artery of corpus callosum, andbihemispheric type of ACA) : 6) variable branching patternsof MCA (a single trunk with no main division, bifurcation,trifurcation, and quadrifurcation): 7) variables in the posteriorcirculation (duplicated SCA, SCA originate from P1 ofPCA, duplicated AICA, triplicated AICA, common trunk ofAICA and PICA, parieto-occipital and calcarine artery fromACA, and extracranial PICA): 8) a nonbifurcating cervicalcarotid artery.CONCLUSIONFamiliarity with these anomalous vessels of cerebral arterialsystem is essential to the proper surgical treatment of cerebralaneurysm, understanding the collateral blood supply incerebral ischemia, and to endovascular approach to cerebralAVMs.KEY WORDS: Cerebral artery, normal variant, anomalousvessel
Scientific Exhibit 59 (eSE)Diffusion-Weighted Imaging Findings of IntracranialHemorrhage425Scientific Exhibit 60Imaging Studies in the Evaluation of Carotid CavernousSinus FistulasHiwatashi, A. · Moritani, T. · Wang, H. Z. · Ketonen, L. ·Ekholm, S. E. · Westesson, P.University of Rochester Medical CenterRochester, NYPURPOSEDiffusion-weighted (DW) imaging is often of limited valuefor diagnosis and staging of intracranial hemorrhages; however,understandings of DW imaging characteristics areimportant to avoid misinterpretations. The purpose of thisexhibit is to demonstrate the appearance of hematomas andto discuss the effects of T2, magnetic susceptibility, and diffusibilityon DW images.MATERIALS & METHODSMR examinations acquired in this institution from 2000 tothe present were reviewed and we identified more than 200cases of intracranial hematomas. Imaging sequences evaluatedwere DW imaging, the apparent diffusion coefficient(ADC) maps, T1- and T2-weighted images. Additionally,gradient-echo sequences alsowere obtained. In DW imaging,a motion-probing gradient was applied in three orthogonalorientations with a b-value of 1000 sec/mm 2 .RESULTSIntracranial hemorrhages are often characterized as to theirlocation, such as intraparenchymal, subarachnoid, subdural,epidural and intraventricular hemorrhages. The etiology ofthese hemorrhages includes a variety of heterogenous conditionssuch as trauma, hypertension, infarction, infection,neoplasm, vascular malformations, vasculitis, vasculopathy,coagulopathy, and drugs. This exhibit will illustrate DWimaging characteristics of intracranial hemorrhages in relationto their location, etiology, and evolutionary stage.CONCLUSIONApparent diffusion coefficient measurements of intracranialhemorrhages might be problematic and are only possible inthe hyperacute stage which contains diamagnetic oxy-hemoglobinand in the late subacute phase which contains extracellularmet-hemoglobin whose paramagnetic susceptibilityartifacts were diminished by the dilution of the fluid. CT androutine MR imaging continue to be the mainstay in diagnosingand characterizing intracranial hemorrhages. However,understandings of DW imaging characteristics are importantin order to avoid inaccurate conclusions.KEY WORDS: Diffusion, hemorrhage, MR imagingChen, C. C. C. 1 , 2 · Chang, P. 1 · Shy,C.G. · Chen,W.S. ·Yang,M.S. · Hung,H.C. · Lee,T.1Taichung Veterans General Hospital, Taichung, TAIWANREPUBLIC OF CHINA, 2 Chungtai Institute of HealthScience and Technology, Taichung, TAIWAN REPUBLICOF CHINAPURPOSECarotid cavernous sinus fistulas (CCF) may arise from theICA itself or meningeal branches of both ICA and ECA. It isclassified as direct and indirect type CCF according to thecommunication of fistula. Since CCF is a diverse and oftencomplex group of vascular disorders, complete and accurateimaging study is essential for the strategy of treatment. Inthis study, we will discuss the pathology of CCF and thevalue of both CT angiography (CTA) and MR angiography(MRA), comparing with the digital subtraction angiography(DSA), in the evaluation of arteriovenous communication offistula, venous drainage, and other vascular condition.MATERIALS & METHODSSixty-seven patients, 16 to 71 years old, with clinical manifestationsof pulsatile exophthalmos, chemosis, and bruitwere enrolled in this study. The pre and postcontrastenhancedCT were done in all patients, and CTA was performedin 54 cases (46 direct, 8 indirect). The spin-echo T1and T2 MR imaging and 3D TOF MRA were done in 64patients (43 direct, 21 indirect) and contrast-enhanced MRA(CE MRA), 54 cases (33 direct, 21 indirect). These findingsthen were correlated to DSA (46 direct, 21 indirect) and wereused as guide to treatment. The findings of concern included:the feeding arteries of fistula, size and location of fistulatract, cavernous sinus pattern, dilatation of ophthalmic vein,pattern of venous sinus drainage, engorged pial-cortical veinand/or deep vein drainage, venous aneurysm and/or venoussinus varix formation, arteries dissection.RESULTSDirect CCF was diagnosed in 46 patients and indirect CCFwas diagnosed in 21 patients. In direct CCFs, the ICAs wereobscured rapidly by the dilated cavernous sinus in both CTAand MRA, while in indirect CCFs, ICAs can be detectedonly in MRA with mild obliteration. In both direct and indirectCCFs, the dilated cavernous sinus, venous drainage, andvenous aneurysm formation were demonstrated readily byCTA and MRA studies (80-96%). From the source imagingof CTA and MRA in direct CCFs, the location and size ofconnecting fistula tracts between ICA and engorged cavernoussinuses could be identified (81-91%) and were furtherconfirmed by DSA procedure(93%). In the indirect CCFs,the feeding arteries can be found in more than half of casesby the MRA. The venous aneurysms were found about 15-17% in direct CCF patient by all imaging studies.Scientific Exhibits
426Scientific ExhibitsCONCLUSIONBoth CTA and MRA images are helpful in the diagnosis ofdirect CCFs, whereas MRA is more useful in the detection ofindirect CCFs. The venous drainage and aneurysm formationare demonstrated in all imaging studies. Moreover, thesource image of CTA and 3D TOF MRA are valuable toolsin the identification of size and location of fistula shuntwhich is crucial in the preembolization assessment, with theCTA imaging somewhat superior.REFERENCES1. Ouanounou S, et al. Cavernous Sinus and Inferior PetrosalSinus Flow Signal on 3D TOF MR Angiography. AJNR Am JNeuroradiol 1999;202. Chen JC, et al. Suspected Dural Arteriovenous Fistula:Results of Screening MR Angiography in Seven Patients.Radiology 1992;183KEY WORDS: Carotid cavernous sinus fistula, CT angiography,MR angiographyScientific Exhibit 61CT Angiography in the Evaluation of SubarachnoidHemorrhage: Before, After or in Lieu of CatheterAngiography?Gusdorff, J. M. · Fountain, A. J. · Hudgins, P. A.Emory University School of MedicineAtlanta, GAPURPOSECerebral catheter angiography (CCA) is still considered tobe the “gold standard” in the evaluation of nontraumatic subarachnoidhemorrhage (NTSAH). However, the increasingavailability of multislice CT scanners and refinement ofimaging protocols has made cerebral CT angiography(CCTA) a reasonable alternative, and in some institutions,has replaced CCA in the initial evaluation of NTSAH.Additionally, because CT allows for evaluation of extraluminalstructures, pathology detection is not limited to the flowof contrast within the lumen and the likelihood of demonstratingpathology adjacent to a vessel is increased. To determinethe role of CCTA in the initial evaluation of patientspresenting with NTSAH and whether or not it can temporize,complement or even replace CCA in certain clinical situations.MATERIALS & METHODSA number of patients were selected retrospectively andprospectively, all having undergone CCTA and CCA within1 week of presentation. Each examination was screened bytwo attending neuroradiologists and a neuroradiology fellow.The CCTA was deemed successful when the results concurredwith those of the CCA, and superior when findingswere made only on the CCTA.RESULTSCerebral CT angiography uncovered pathology not demonstratedon the CCA in a number of patients, particularly inthe setting of aneurysm thrombosis and back-wallaneurysms.CONCLUSIONIn the evaluation of NTSAH, CCTA is a valuable tool and areasonable alternative to CCA. In some instances, particularlywhen a three-dimensional angiography suite is not available,it can uncover pathology not demonstrated on CCA.KEY WORDS: CT angiography, subarachnoid hemorrhage,aneurysmScientific Exhibit 62Choroid Plexus: A Pictorial Essay from Normal Anatomyto PathologyMatias, S.Garcia de Orta HospitalAlmada, PORTUGALPURPOSETo review the embryology and normal anatomy of thechoroid plexus with special attention paid to their vascularanatomy. The authors also illustrate the imaging appearanceand discuss the differential diagnosis of choroid plexuspathologic processes.MATERIALS & METHODSNormal anatomy of the choroid plexus was reviewed fromanatomical dissections of human cadavers and imaging studies(DSA and MR imaging). Normal variants and pathologicprocesses of the choroid plexus, especially tumors and vascularmalformations, were analyzed based on the embryologyand normal anatomy.RESULTSChoroid plexus are extremely vascularized structures with avital role in the cerebrospinal fluid dynamics.CONCLUSIONChoroid plexus anatomy and embryology knowledge facilitatesthe understanding of the variants and pathology of thesestructures.KEY WORDS: Choroid plexus, choroid arteries, anatomyScientific Exhibit 63 (eSE)MR Imaging and MR Angiography of the HypoglossalArterySilbergleit, R. · Mallesh, A. · Kazmierczak, C. · Wang, A. ·Noujaim, S. E.William Beaumont HospitalRoyal Oak, MIPURPOSETo demonstrate the imaging findings of the hypoglossalartery on MR imaging and MR angiography (MRA) and tounderstand the embryology of persistent carotid-vertebralfetal connections.
427MATERIALS & METHODSMR imaging and MRA studies in five patients with ahypoglossal artery are reviewed to demonstrate the typicalanatomical findings. Correlation is made with embryology,anatomical drawings, and imaging studies of cases of persistenttrigeminal artery, otic artery, and proatlantal intersegmentalartery.RESULTSThe presence of the hypoglossal artery is identified on bothbrain MRA and head and neck MRA. Depending on the fieldof view chosen, identification of the entire course mayrequire both brain and head and neck MRA.CONCLUSIONThe hypoglossal artery can be identified on MRA studies ofboth the brain and of the head and neck. Complete visualizationoften requires both studies. Routine brain MR imagesoccasionally demonstrate the hypoglossal artery. Thehypoglossal artery can be differentiated from other fetalcarotid-vertebral connections.KEY WORDS: Vascular variants, persistent fetal connections,hypoglossal arteryScientific Exhibit 64Vascular Lesions of the Temporal Bone: AvoidingMisdiagnosisFriend, C. · Fukui, M. B. · Williams, R. L. · Ku, A. · Chen,D. · Arriaga, M.Allegheny General HospitalPittsburgh, PAPURPOSEVascular temporal bone lesions are uncommon, but of criticalimportance to the surgeon. We present a spectrum of vascularlesions involving the temporal bone on CT or MRimaging in order to enhance recognition of these abnormalitiesand discuss entities with which these lesions may beconfused.MATERIALS & METHODSA series of cases of vascular lesions involving the temporalbones was collected over several years. Patients were evaluatedwith CT, MR imaging, or catheter angiography.RESULTSWe present a spectrum of vascular lesions of the temporalbone, including aberrant carotid artery, persistent stapedialartery, glomus tympanicum, dehiscent jugular bulb, duralarteriovenous fistula (AVF), hemangioma, and anterior inferiorcerebellar artery aneurysm. We discuss the imaging featuresof these lesions, and compare and contrast their imagingfindings with those of lesions commonly confused withvascular lesions.CONCLUSIONVascular lesions of the temporal bone are unusual, butextremely important entities to recognize in order to avertserious morbidity.REFERENCES1. Benton C, Bellet PS. Imaging of Congenital Anomalies of theTemporal Bone. Neuroimag Clin N Am 2000;10:35-532. Thiers FA, Sakai O, Poe DS, Curtin HD. Persistent StapedialArtery: CT Findings. AJNR Am J Neuroradiol 2000;21:1551-15543. Curtin HD, Jensen JE, Barnes L Jr, May M. “Ossifying”Hemangiomas of the Temporal Bone: Evaluation with CT.Radiology 1987;164:831-8354. Zager E, Shaver E, Hurst R, Flamm E. Distal Anterior InferiorCerebeller Artery Aneurysms: Report of Four Cases. JNeurosurg 2002;97:692-696KEY WORDS: Vascular, temporal boneScientific Exhibit 65Anatomical Variations of the Superficial MiddleCerebral Vein; Embryologic Aspects of the RegressedEmbryonic Tentorial Sinus: Preliminary ResultsChung, J.Hae Jeong HospitalSeoul, REPUBLIC OF KOREAPURPOSEThe embryonic tentorial sinus usually regressed during postnataldevelopment; however, its typical prenatal drainagepatterns and intradural anastomoses can be depicted as variousdevelopmental phenotypic representations. Here, wetried to clarify the variant types of the superficial middlecerebral vein (SMCV) upon the relationship with embryonictentorial sinus.MATERIALS & METHODSTotal 41 patients and 82 hemispheres were included in thisstudy. CT angiography was performed in all patients for thescreening methods of cerebrovascular disease or otherintracranial disorders. Separate workstation and 3D softwarewere used to evaluate the cranial venous systems with 3Dvolume-rendering techniques, thin-slice MIP images, andMPR techniques for the analysis of its complicated angioarchitecture.Variations of the SMCV were classified accordingto the developmental alterations of embryonic tentorialsinus, including sphenoparietal sinus (cranial remnant of tentorialsinus), basal sinus (floor of middle cranial fossa), petrosaldiploic, and caudal remnant of the transverse sinus.Secondary intradural anastomoses of cavernous and superiorpetrosal sinuses were evaluated also for the efferent pathways.RESULTSThe most frequent type of remnant tentorial sinus,sphenoparietal sinus was present in 49% (40/82) of examinedhemispheres. Other regressed patterns of embryonictentorial sinus were identified also in 38% (31/82); 9 caudalremnant type around the transverse sinus, 10 petrosal diploicand caudal type, 2 petrosal diploic type, 1 basal type, unclassified5 (2 of them have the efferent toward medial and lateraltentorial sinus), and any combination of above lists werefound in 4 cases. Secondary intradural, cavernous sinusanastomosis was seen in 44% (36/82); however, more prevalentpattern was no anastomosis (46/82) with cavernousScientific Exhibits
Scientific Exhibitssinus. Only one case of superior petrosal sinus anastomosiswas found in this series associated with basal type (formerlydescribed as “sphenotemporal sinus” by Padget DH).CONCLUSIONAnatomical variations of SMCV can be demonstrated clearlywith embryologic aspects of the tentorial sinus accordingto its developmental regression and postnatal secondaryadaptations of cerebral venous drainage.KEY WORDS: Embryonic tentorial sinus, superficial middlecerebral vein, cerebral venous systemScientific Exhibit 66Anatomical Variations of the Deep Cerebral Veins,Tributaries of Basal Vein of Rosenthal; EmbryologicAspects of the Regressed Embryonic Tentorial Sinus:Preliminary ResultsChung, J.Hae Jeong HospitalSeoul, REPUBLIC OF KOREAPURPOSEEmbryonic tentorial sinus regresses at the 60-80 mm embryologicstage and most of deep venous channels constitute thebasal vein of Rosenthal (BVR). Persistent remnants ofembryonic tentorial sinus can be seen in adult configurationof BVR. We tried to explain the anatomical representationsof the BVR associated with the remnant embryonic tentorialsinus.MATERIALS & METHODSTotal 41 patients and 82 hemispheres were included in thisstudy. CT angiography was performed in all patients for thescreening methods of cerebrovascular disease or otherintracranial disorders. Separate workstation and 3D softwarewere used to evaluate the cranial deep venous systems with3D volume-rendering techniques, thin-slice MIP images, andMPR techniques for the analysis of complicated angioarchitecture.Variations of the BVR were classified according tothe developmental alterations of efferent pathways into 4groups; telencephalic group (A) included tributaries of uncalvein, inferior frontal vein, anterior communicating vein, andinferior striatal vein, diencephalic group (B) of interior ventricularvein and peduncular vein, tegmental bridging group(C) of longitudinal LMV anastomosis, tectal group (D) ofsuperior vermian vein and internal occipital vein relation tothe Galenic connection. The BVR constituted from embryonictentorial sinus was also assessed and the developmentalaspects were reviewed.RESULTSRemnant embryonic tentorial sinus was visualized in 12%(10/82) of hemispheres, all of them invariably connectedwith telencephalic (A) and diencephalic (B) groups. Most ofthose connections (9/10) to basal venous tributaries wereoriginated from medial tentorial sinus except one case fromlateral tentorial sinus. No Galenic connections of the BVRwere identified in 10% (8/82). Various tributaries of the BVRwere classified as: Telencephalic group (A) 43% (35/82),Diencephalic group (B) 35% (29/82), Bridging group (C)42811% (9/82), and Tectal group (D) 6% (5/82). Three of cases(4%) were nonclassified and then revealed only small basaltributaries of BVR without connection to the great vein ofGalen.CONCLUSIONAnatomical variations of the BVR connected with persistedembryonic tentorial sinus often could be demonstrated inadult configurations considering the embryologic aspects ofdevelopmental regression and secondary cerebral venousadaptations.KEY WORDS: Embryonic tentorial sinus, basal vein ofRosenthal, cerebral venous systemHead & Neck67-84Scientific Exhibit 67Ligaments of the Cranio-Vertebral JunctionBatchu, C. S. · Jain, R. · Patel, S. C.Henry Ford HospitalDetroit, MIPURPOSEThe purpose of this exhibit is to discuss the ligamentousanatomy of the cranio-vertebral junction from a neuroradiologist’sperspective and to demonstrate the various ligamentswith different imaging modalities. Thin section CT and highresolutionMR studies allow visualization of most of theseligaments.MATERIALS & METHODSWe will demonstrate the normal cranio-vertebral ligamentsusing sketch diagrams, and MR and CT images from normalsubjects. Imaging of patients with cranio-vertebral junctionabnormalities will be incorporated also from our imagingdatabase to enhance the description.RESULTSComplex sets of ligaments connect skull base, atlas and axisvertebrae. They are broadly classified as follows: 1.Articulation of the Atlas with the Occipital Bone - a)Capsular Ligaments: Two capsular ligaments connect theoccipital condyles with the superior articular process of theatlas. b) Anterior Atlanto-Occipital Ligament: It extends as abroad band of densely woven fibers, connecting the anteriorinferior margin of the foramin magnum to the upper borderof the anterior atlantal arch. c) Posterior atlanto-OccipitalLigament: It connects the posterior margin of the foraminmagnum to the upper border of the posterior atlantal arch. d)Lateral Atlanto-Occipital Ligaments: They extend from thejugular tubercle of the occipital bone to the bases of thetransverse process of the atlas. 2. Articulation of the Atlaswith the Axis - a) Capsular Ligaments: Connects the lateralmass of the atlas to the superior facet of the axis. b) AnteriorAtlanto-Axial Ligament: It connects the inferior border ofthe anterior arch of atlas to the ventral surface of the body of
the axis and later continues as the anterior longitudinal ligament.c) Posterior Atlanto-Axial Ligament: It is a thin membraneattached to the inferior border of the posterior arch ofthe atlas to the superior edge of the lamina of the axis. d)Transverse Ligament: Thick strong ligament retains the densin contact with the anterior arch of the atlas and is attachedon either side to small tubercles on the medial surface of thelateral mass of the atlas. e) Cruciform Ligament: Superiorand the inferior crus of the transverse ligament extend superiorlyand inferiorly in the midline and form the cruciate ligaments.The superior crus is attached to the basiocciput andthe inferior crus is attached to the posterior surface of thebody of the axis. 3. Ligaments Connecting the Axis with theOccipital Bone - a) Tectorial Membrane: Strong band of ligamentinside the vertebral canal connects the dorsal surfaceof the axis to the basilar groove of the occipital bone. b) AlarLigaments: They are two strong round cord-like structuresextending obliquely from the cranial part of the dens to therough depressions on the medial aspect of the occipital bone.c) Apical Ligament: It extends from the tip of the odontoidprocess to the anterior margin of foramin magnum.CONCLUSIONWe present an overview of the normal ligamentous anatomyof the cranio-vertebral junction with the goal of improvingdetection of the abnormalities involving these significant“stabilizing forces.”KEY WORDS: Cranio- vertebral junction, ligamentsScientific Exhibit 68CT and MR Imaging Findings of Kimura Disease in theHead and NeckPark, S. 1 · Kim, H. 1 · Sung, K. 2 · Lee, H. 3 · Na, D. 41College of Medicine, Inha University, Incheon, REPUBLICOF KOREA, 2Wonju College of Medicine, YonseiUniversity, Wonju, REPUBLIC OF KOREA, 3 Asan MedicalCenter, College of Medicine, University of Ulsan, Seoul,REPUBLIC OF KOREA, 4College of Medicine,Sungkyunkwan University, Seoul, REPUBLIC OF KOREAPURPOSETo evaluate CT and MR imaging findings of Kimura diseasein the head and neck.429RESULTSCT and MR images demonstrated multiple lesions in 19patients and solitary lesion in the remaining three patients.The periparotid region was the most common head and necklocation involved by Kimura disease seen in 16 patients.Other sites of involvement in decreasing order were theparotid gland (n = 9), temple (n = 2), submental space (n =2), lacrimal gland (n = 2), buccal space (n = 1), and scalp (n= 1). Thirteen patients had cervical lymphadenopathy, whichaccompanied the main lesion(s) in 12 patients. In the remainingone patient, lymphadenopathy was the isolated abnormalityon imaging. The greatest diameter of the lesionsmeasured 1-8 cm with a mean of 3.3 cm. The lesions werewell demarcated in nine patients and poorly demarcated insix patients. In seven patients, the coexistent well and poorlydemarcated lesions were noted on CT and MR images. Alllesions enhanced well on contrast-enhanced CT and MRimages. MR imaging obtained in six patients showed varioussignal intensity of the lesions, reflecting varied amounts offibrosis and vascular stroma contained in the individuallesion at histologic examination. Compared to the cerebralgray matter, the lesions were hyperintense in two patientsand hypointense in four patients on T1-weighted imaging,and hyperintense in three patients, isointense in two patients,and hyperintense in one patient on T2-weighted imaging.CONCLUSIONMultiple, well enhancing masses located at the periparotid orintraparotid region with or without lymphadenopathy werethe most common CT and MR imaging findings of Kimuradisease in the head and neck. MR imaging also showed varioussignal intensity of the lesions, which correlated histologicallyto varied amounts of fibrosis and vascular stroma.KEY WORDS: Kimura disease, head and neck, MR imaging,CTScientific Exhibit 69Spectrum of Imaging Findings of the Parotid Tumorsand Tumor-Like LesionsOkahara, M. · Kiyosue, H. · Hori, Y. · Uchida, D. ·Matsumoto, S. · Mori, H. · Kondo, Y.Oita UniversityOita, JAPANScientific ExhibitsMATERIALS & METHODSCT (n = 18) and MR (n = 6) images obtained in 22 patients(18 men and 4 women; mean age, 36 years; age range, 9-62years) with histologically proved Kimura disease in the headand neck were reviewed retrospectively. All patients presentedwith a palpable mass(es) in the head and neck with aduration ranging from 2 months to 25 years (mean, 7.6years). Diagnosis was confirmed by excisional biopsyincluding partial parotidectomy in 21 patients and fine needleaspiration biopsy in one patient. Two patients had anothermass in the forearm, which also proved to be Kimura disease.We analyzed the imaging findings with particular attentionto the multiplicity, location, size, margin, and enhancementpattern of the lesion. The signal intensity of the lesionseen on MR images as well as the presence or absence oflymphadenopathy were recorded also.PURPOSEParotid tumors are uncommon neoplasms that account forabout 3% of all head and neck tumors. The imaging featuresof parotid tumors have been reported. However, only a fewreports exist in which the imaging-pathologic correlation isdescribed in detail. The purpose of this study is to describethe imaging findings of parotid tumors with pathologic correlation.Furthermore we illustrate imaging findings ofparotid tumor-like lesions in the differential diagnosis.MATERIALS & METHODSWe reviewed 140 cases of the parotid tumors and tumor-likelesions collected between January 1992 and December 2003from our pathology consultation files. All tumors were surgicallyresected and histologically verified. Sufficient imag-
Scientific Exhibitsing was available in 113 patients with 134 parotid lesions (27malignant tumors and 106 benign tumors or tumor-likelesions).RESULTSMost of pleomorphic adenomas were characterized by brightsignal intensity (SI) on T2-weighted imaging and markedenhancement at around 120-150 seconds. Those areas correspondedto fibromyxoid stroma pathologically. Solid componentof Warthin’s tumors (adenolymphoma) showed rapidenhancement/washout pattern on dynamic study. SometimesWarthin’s tumors were seen as almost cystic lesion. Largecystic area was seen in lymphoepithelial cysts, Warthin’stumors (cystic type), and degenerative change in othertumors including basal cell adenomas and pleomorphic adenoma.Multiple lesions and/or bilateral lesions were highlysuspected Warthin’s tumor or malignant lymphoma. 99 mTcscintigram was useful to differentiate Warthin’s tumor andoncocytoma from other tumors or tumor-like lesions. 67Gascintigram showed high accumulation in the tumors ofmalignant lymphoma, carcinomas, pleomorphic adenomaand inflammatory diseases, which could not differentiatebetween the benign and malignant lesions. High-grademalignant tumors had infiltrative margins with lower SI thannormal parotid gland on T2-weighted imaging. In contrast,low-grade malignant tumors had the smooth margin. Thecharacteristic low-grade mucoepidermoid carcinomas hadmultiple high SI areas on both T1-weighted and T2-weightedimages. These areas corresponded to mucinous cystspathologically. The low-grade adenoid cystic carcinomawere characterized by high SI on T2-weighted imaging andmarked enhancement. These findings corresponded to cribriformarrangement containing mucinous fluid.CONCLUSIONMR images and 99mTc scintigrams are helpful in differentiatingbenign and malignant tumors of the parotid gland, andcan provide important clues in the diagnosis of their histologies.KEY WORDS: Parotid gland, MR imaging, neoplasm430MATERIALS & METHODSWe illustrate the radiologic findings of 12 patients withpathologically proven ACC in the head and neck for 10years. They were six males and six females (ages: 5-75years, mean 36 years) who underwent CT (n = 10) and CTwith MR imaging (n = 2).RESULTSThe locations of the tumor were the parotid gland (n = 9),parapharyngeal space (n = 1), submandibular gland (n = 1),and palate (n = 1). The CT findings of the tumor were solidmass (n = 7), cystic mass (n = 3) and cystic mass with muralnodule (n = 2). The parotid tumors were solid (n = 7), cystic(n = 1), and cystic mass with mural nodule (n = 1). A parapharyngeallesion was cystic mass with mural nodule and asubmandibular and a palate tumors were cystic lesions. Allsolid masses in parotid gland (n = 7) included focal lowattenuating portions on CT, which were microcyst, hemorrhage,or necrosis on pathologic examination. The MR findingsof two lesions were cystic mass with mural nodule andsolid and cystic mass, respectively and showed internal hemorrhage,which was not discernible on the CT image. Therewas no evidence of lymph node metastases on pathologicexamination.CONCLUSIONAlthough acinic cell carcinoma is a rare and challengingtumor to radiologist and pathologist due to its nonspecificimaging findings and variable pathologic findings, familiaritywith imaging findings of acinic cell carcinoma can behelpful for differential diagnosis of the salivary gland orhead and neck tumors.KEY WORDS: Acinic cell carcinoma, salivary gland, CT andMR imagingScientific Exhibit 71 (eSE)Spectrum of Metastatic Renal Cell Carcinoma to theHead and NeckScientific Exhibit 70 (eSE)Acinic Cell Carcinoma of the Head and Neck: ImagingFindings with Pathologic CorrelationSuh, S. I. 1 · Seol, H. Y. 1 · Cha, I. H. 1 · Kim, T. 2 · Lee, N. J. 3 ·Kim, J. H. 3 · Kim, I. S. 11Korea University Guro Hospital, Seoul, REPUBLIC OFKOREA, 2Korea University Ansan Hospital, Seoul,REPUBLIC OF KOREA, 3Korea University AnamHospital, Seoul, REPUBLIC OF KOREAPURPOSEAcinic cell carcinoma (ACC) is a rare salivary gland tumoraccounting for 2.5-5% of all parotid epithelial neoplasms.Furthermore, the report of imaging findings of the ACCinvolving other sites of the head and neck is extremely rare.The purpose of this exhibit is to describe the CT and MRimaging features and pathologic correlation of the ACC inthe head and neck.Herman, B. A. · Michals, E.University of Chicago HospitalsChicago, ILPURPOSETo demonstrate the spectrum of renal cell carcinoma (RCC)metastases to the head and neck, ranging from the commonsites in the brain parenchyma and spine to the less commonsites such as pituitary gland, choroid plexus, paranasal sinuses,and thyroid.MATERIALS & METHODSA group of 139 patients with the diagnosis of RCC who hadimaging of the head and neck with either CT or MR imagingbetween 2000 and the present (2003) were reviewed.Approximately 30% of patients had metastatic disease to thehead and neck—8% to the neck, 19% to the brain, and 3% tothe head (not to brain parenchyma). Ten cases were selectedfrom these 30% of patients with metastatic RCC to illustratethe range of presentations of head and neck spread of tumor.
431RESULTSTen cases with CT and/or MR imaging are presented, allwith known metastatic RCC. Cases include metastases to theparanasal sinuses, nasal cavity, choroid plexus, pituitarygland, sella with cavernous sinus invasion, scalp, thyroid,supraclavicular lymph nodes, cervical spine, and brainparenchyma with intraventricular bleed due to hemorrhagicmetastasis.CONCLUSIONRenal cell carcinoma accounts for approximately 3% of visceralmalignancies and has a propensity for metastaticspread, most commonly to infraclavicular sites such as lung,liver, regional lymph nodes, and bone. Supraclavicularspread of tumor occurs less commonly, reported to occur inup to 8-15% of patients with RCC. Of infraclavicular primarymalignancies, only lung and breast cancers spreadmore often above the level of the clavicles. It is estimatedthat about 8% of patients with RCC will present initiallywith symptomatic head and neck metastases before the primarytumor is discovered. Our case reports demonstrate therecognized tendency of RCC to go to the sinonasal regionand thyroid and the tendency toward hemorrhagic metastases.Additional cases present less frequently described sitesof spread of RCC, such as to the pituitary. These cases areintended to serve as a reminder that when tumor is identifiedin the head and neck, while both supra and infraclavicularprimary tumors will be considered, that RCC is among theleading infraclavicular tumors to spread to this region.REFERENCES1. Gottlieb MD, Roland JT. Paradoxical Spread of Renal CellCarcinoma to the Head and Neck. Laryngoscope1998;108:1301-13052. Navarro F, Vicente J, Villanueva MJ, et al. Metastatic RenalCell Carcinoma to the Head and Neck Area. Tumori2000;86:88-903. Sabo R, Sela M, Sabo G, et al. Metastatic Hypernephroma tothe Head and Neck: Unusual Case Reports and Review ofthe Literature. J Otolaryngol 2001;30(3):140-1444. Simo R, Sykes AJ, Hargreaves SP, et al. Metastatic Renal CellCarcinoma to the Nose and Paranasal Sinuses. Head Neck2000;22: 722-7275. Som PM, Norton KI, Shugar JMA, et al. MetastaticHypernephroma to the Head and Neck. AJNR Am JNeuroradiol 1987;8(6):1103-1106KEY WORDS: Renal cell carcinoma, metastases, headScientific Exhibit 72Clival Chordoma: A Radiologic Survey of Atypical Casesand MimicsLev, S. · Demidenko, A. · Chen, Y. H.Nassau University Medical CenterEast Meadow, NYPURPOSETo illustrate the diverse radiologic spectrum of clival chordoma,emphasizing its unusual radiologic appearances.Mimics and key distinguishing differential features are discussed.MATERIALS & METHODSWe retrospectively reviewed the CT and MR imaging studiesof patients with biopsy-proven chordoma performed duringthe past 9 years at our institution. We evaluated bothatypical skull base chordomas presenting as other entities aswell as lesions which simulated clival chordomas.RESULTSChordomas that extend primarily anterior to the clivus maymasquerade as nasopharyngeal lesions. One case we presentwas considered initially to be squamous cell carcinoma.Chordomas with posterior spread, on the other hand, mayinvade the basilar cisterns. We demonstrate an unusualexample of a chordoma encasing the basilar artery, mimickingan epidermoid tumor. A wide array of tumors and tumorlikeconditions, as well as inflammatory processes whichinvolve the clivus and paraclival structures, can resemblechordomas. Tumors of the skull base include both primaryneoplasms, such as meningiomas and chondrosarcomas, andmetastases. We illustrate a rare case of clival hamartoma.Infections and inflammatory processes encompass bacterialosteomyelitis and erosive invasive fungal sinus disease.Medial petrous apicitis, associated with Gradenigo’s syndrome,atypically can produce clival erosion. Rheumatoidpannus formation also may alter the normal clival appearance.Sellar lesions invading the skull base include aggressivepituitary macroadenoma.CONCLUSIONClival chordomas may have uncommon presentations. Anawareness of helpful distinguishing characteristics, such ascentral location, bone destruction and calcification, may helpalert the radiologist to the possibility of this uncommon neoplasmeven if it occurs in an improbable location.KEY WORDS: Chordoma, clivusScientific Exhibit 73It’s Not Always Salt and Pepper: A ComprehensiveReview of Typical and Atypical Paragangliomas andtheir MimicsGoh, J. P. N. 1,2 · Smoker, W. R. K. 1 · Gentry, L. R. 3 · Reede,D. L. 41University of Iowa Hospitals and Clinics, Iowa City, IA,2Tan Tock Seng Hospital, Singapore, SINGAPORE,3University of Wisconsin Madison, Madison, WI, 4 LongIsland College Hospital, Brooklyn, NYPURPOSEParagangliomas are uncommon, highly vascular tumors thatarise from the paraganglion cells of the parasympatheticnervous system.MATERIALS & METHODSThese tumors typically demonstrate characteristic features,including flow voids and a “salt-and-pepper” appearance onMR imaging, although the latter is not always seen. Theymay be found in typical locations such as the parapharyngealspace (glomus vagale), the skull base and middle ear (glomusjugulare, tympanicum, and jugulotympanicum), and inthe region of the carotid bulb (carotid body tumors). WhenScientific Exhibits
found in these locations, with specific imaging characteristics,the diagnosis is usually not in question. However, inectopic locations, or if atypical features are present, theselesions may present a diagnostic challenge.RESULTSTo date we have identified six nonfamilial paragangliomas inseveral ectopic locations. These include two lesions withinthe parasellar region, one in the pterygopalatine fossa, twowithin the nasal cavity, and a paraganglioma of the facialnerve.432MATERIALS & METHODSFor the purposes of this exhibit, these lesions can be classified,based upon their natural history and histology, as follows:Primary Lesions: 1. hemangiomas; 2. vascular malformations- a. capillary, b. venous - cavernous malformationsand orbital varix, c. lymphatic - capillary and cavernous, d.arteriovenous - AVM, including Wyburn-Mason syndrome;3. aneurysms of the ophthalmic artery; 4. tumors - hemangioblastomas,hemangioendotheliomas, hemangiopericytomasand metastases. Secondary Lesions: 1. carotid cavernousfistulas - a. direct type, b. indirect type.Scientific ExhibitsCONCLUSIONIn this exhibit, we review the clinical and imaging findingsfrom our large collection of paragangliomas in “classic”locations on CT, MR imaging, CTA, MRA, and catheterangiography, and present our six paragangliomas arising inectopic locations. Mimics that may cause diagnostic confusionwhen evaluating either “classic” or “ectopic” paragangliomas(e.g. nasal cavity haemangiomas/schwannomas,skull base metastases, carotid space neurogenic tumors,pterygopalatine fossa juvenile angiofibromas, etc.) areincluded.KEY WORDS: Paragangliomas, typical, atypicalScientific Exhibit 74Ear, Nose, and Throat Pathology in AIDSZidon, M. 1 ·Destian, S. Reede, D1St. Vincent’s Hospital, New York, NY, 2 New York MedicalCollege, New York, NYWith the development of new and more effective medicationregimens, the incidence of routine paranasal sinus infectionin patients with AIDS has decreased. The purpose of thisexhibit is to present a spectrum of other pathology that canoccur in the head and neck in the setting of AIDS. Theseinclude fungal infections, TB and MAI, lymphoma, Kaposisarcoma, parotid lesions, and infections of the temporalbone. The radiologic appearance, pathologic features, andclinical presentation will be described.KEY WORDS: AIDS, ENT, pathologyScientific Exhibit 75Vascular Lesions of the Orbit: More than Meets the EyeYee, N. K. 1 · Smoker, W. R. K. 1 · Gentry, L. R. 2 · Reede, D.L. 3 · Nerad, J. A. 11University of Iowa Hospitals and Clinics, Iowa City, IA,2University of Wisconsin Madison, Madison, WI, 3 LongIsland College Hospital, Brooklyn, NYPURPOSEAs a group, vascular lesions of the orbit are uncommon, andsome are rare. There is confusion regarding their nature andcontroversy regarding their nomenclature and classification.Therefore, when encountered, they often present a diagnosticdilemma.RESULTSWe have accumulated multiple examples of the abovelesions from a review of the teaching files at several institutions.CONCLUSIONIn this exhibit, we present the clinical findings, natural history,imaging features (CT, MR imaging and angiography),and histopathology of these uncommon and rare lesions. Keyfindings that help differentiate these lesions from one anotherare highlighted (the utility of delayed imaging in confirmingthe diagnosis of cavernous vascular malformations, usefulnessof various provocative maneuvers in demonstratingorbital varices, etc.).KEY WORDS: Orbit, vascular, lesionsScientific Exhibit 76Brachial Plexus: Anatomy, Pathology, and OptimalImagingMeagher, S. · Hoeffner, E. G. · Shah, G. V.University of MichiganAnn Arbor, MIPURPOSEThe brachial plexus arises from the lower cervical and upperthoracic spinal nerve roots, coursing between the anteriorand middle scalene muscles and adjacent to the subclavianartery. Clinical features of brachial plexopathy are commonlynonlocalizing, often vague, and frequently nonspecific.Patients vary in their presentation depending upon theextent, degree, and duration of injury. Symptoms includemotor, sensory, and sometimes, autonomic disturbances ofthe supraclavicular region, shoulder, and upper extremity.These symptoms may be exacerbated by certain arm andshoulder positions. Occasionally, these findings also may beassociated with tenderness or with a palpable abnormalityabove the clavicle. Traumatic injuries and involvement bytumors account for the majority of etiologies responsible forthese plexopathies, but inflammatory/infectious processesalso can involve the brachial plexus.MATERIALS & METHODSThe data base of medical imaging procedures at theUniversity of Michigan was searched to identify all brachialplexus MR and CT myelographic examinations performedbetween June 2000 and December 2003. The results of thissearch then were reviewed and stratified into traumatic, neo-
plastic, and infectious/inflammatory processes. Multiple representativeimages from each category then were identifiedand photographed.RESULTSThe course of the brachial plexus can be identified withknowledge of certain anatomical landmarks which are seenreadily on cross-sectional imaging studies. The supraclavicularplexus (roots, trunks) is located between the anterior andmiddle scalene muscles, while the retroclavicular (divisions)and infraclavicular (cords) course adjacent to the subclavianartery. The plexus may be visualized with both MR imagingand CT myelography, each modality having distinct advantagesfor the evaluation of specific lesions. CT myelographyis the modality of choice for evaluating patients with posttraumaticplexopathy, while MR imaging should be performedin patients with neoplastic or inflammatory/infectiousetiologies. In particular, coronal and sagittal MRsequences can be extremely helpful in characterizingbrachial plexus pathology and aiding surgeons with theirpreoperative planning.CONCLUSIONThe brachial plexus can be imaged successfully with bothMR and CT myelography. While MR excels in the evaluationof neoplastic and inflammatory/infectious etiologies,CT myelography is the modality of choice for the evaluationof posttraumatic injuries.KEY WORDS: Brachial plexusScientific Exhibit 78 (eSE)Unusual Imaging Manifestations of Thyroid-AssociatedOrbitopathy and Its Mimics433lesions that we encountered include lung carcinoma, squamouscell carcinoma, and carcinoid. If the belly and tendonare both involved, pseudotumor is favored. Infectious andgranulomatous myositis also can enlarge the extraocularmuscles.CONCLUSIONThyroid-associated orbitopathy can have unusual manifestationsand can be mimicked by a variety of different lesionsincluding metastasis, lymphoma, plasmacytoma, pseudotumor,and infectious or granulomatous myositis.KEY WORDS: Ophthalmopathy, thyroid associated orbitopathy,extraocular musclesScientific Exhibit 79 Moved to POSTER 100AIntraorbital Vascular Anomalies: A Pictorial ReviewBarry, K. A. · Noujaim, S. · Mallesh, A. · Sanders, W. ·Wang, A.William Beaumont HospitalRoyal Oak, MIPURPOSETo provide a pictoral review of the most common anduncommon intraorbital vascular lesions.MATERIALS & METHODSA review of the imaging characteristics of a large number ofintraorbital vascular lesions, as they relate to the anatomyand pathology of the particular entity. The cases have beencollected over the past several years at our two major affiliatedhospitals at William Beaumont.Scientific ExhibitsLee, J. S. 1 · Vibhute, P. G. 1 · Smoker, W. R. K. 2 · Som, P. M. 11The Mount Sinai School of Medicine of New YorkUniversity, New York, NY, 2 University of Iowa Hospitalsand Clinics, Iowa City, IAPURPOSETo illustrate both usual and unusual manifestations of thyroid-associatedorbitopathy (TAO) as well as other lesions ofthe extraocular muscles that mimic TAO.MATERIALS & METHODSWe performed a retrospective analysis of all lesions thatenlarged the extraocular muscles on CT and MR imagingduring the past 2 years at our institution. We correlated imagingcharacteristics to clinical and pathologic findings.RESULTSDiscussion of multiple intraorbital vascular lesions includesbut is not limited to retinal angioma, lymphangioma, capillaryhemangioma, hemangioma of infancy, venous varix,superior ophthalmic vein thrombosis, carotid cavernous fistula,and hemangiopericytoma.CONCLUSIONInformation provided through this presentation will enablethe reader to recognize and easily diagnose vascular lesionsof the orbit.KEY WORDS: Orbit, vascular lesionsRESULTSThyroid-associated orbitopathy (TAO) has well describedeffects on the four rectus muscles. However, TAO also canuncommonly affect the levator palpebrae superioris, and thesuperior and inferior oblique muscles. The various methodsof assessing enlarged extraocular muscles on CT, MR imaging,and ultrasound are reviewed briefly. Quantitative analysisis limited greatly by the wide range of normal measurements.The enlarged extraocular muscle bellies in TAO canbe mimicked by metastatic lesions, lymphoma, and raretumors such as extramedullary plasmacytoma. Metastatic
Scientific Exhibits434Scientific Exhibit 80Scientific Exhibit 81Perineural Invasion of Xth Cranial Nerve by Squamous Multicystic EncephalomalaciaCell Cancers of Oral Cavity/Oropharynx: Review ofThree CasesGandhi, D. · Gujar, S. · Mukherji, S. K.University of Michigan HospitalAnn Arbor, MIPURPOSEPerineural spread is observed most commonly with adenoidcystic carcinomas and squamous cell cancers of head andneck, although a number of other malignant and benignlesions also can spread through this route. Recognition ofthis process is important for appropriate management and toavoid delayed recurrence. Maxillary and mandibular branchesof the trigeminal nerve and the facial nerve are involvedmost commonly by perineural cancer spread. To the best ofour knowledge, imaging features of perineural spread alongXth nerve have not been reported previously. In this exhibit,we will present representative cases of histologically proveninfiltration of the Xth nerve.MATERIALS & METHODSThree cases of histologically confirmed perineural infiltrationof Xth cranial nerve were found in the teaching databaseof one of the authors (SKM). The clinical and imaging featuresof these cases were reviewed.RESULTSAll three patients had recurrent oral cavity/oropharyngealcancers. None of the patients exhibited signs or symptoms ofcranial nerve X dysfunction. On imaging, perineural infiltrationwas seen as tumor extending along the carotid sheath.Partial or complete encasement of internal carotid artery wasseen in all patients. In all cases, the perineural spread was notsuspected on the initial imaging study and was diagnosed onsurgery/histologic examination.CONCLUSIONCranial nerve X infiltration can be seen with oralcavity/oropharyngeal cancers. On cross-sectional imagingstudies, tumor can be seen extending along the carotid sheathwith partial or complete encasement of internal carotidartery. Therefore, patients exhibiting this finding should besuspected of having perineural spread along the cranial nerveX. Entire course of Xth nerve should be examined in thesepatients, preferably with MR imaging.Dieguez, S. · Torres, M. · Herraiz, L. · Pérez, E. · Marín, M.A. · Gonzalez de la Aleja, J.Hospital UniversitarioMadrid, SPAINPURPOSETo evaluate the various neuroradiologic appearances of multicysticencephalomalacia (MEM). To analyze theetiopathology and the neurologic outcome.MATERIALS & METHODSWe retrospectively analyzed 58 children diagnosed withMEM in our hospital between 1982-2003. Ultrasound (43cases),CT (37 cases), and MR imaging (17 cases) were theimaging techniques utilized.RESULTSThe imaging findings vary depending on the time passedbetween the ischemic insult and the date of the examination.Edema that progressed to multicystic parenchymal transformationis the rule. In the late stages there is ex vacuo lateralventricles dilatation and enlargement of the extraaxial compartment.In some cases, a complete absence of brain mantelis present, like in hydranencephaly. Thalami and infratentorialstructures frequently are preserved. Etiologic factors: in23 cases there were multiple pregnancies with intrautero cotwindeath; 13 cases meningitis/sepsis; 9 acute fetal distress;6 multietiologic shock; 2 thrombotic cerebrovascular accident;5 unknown. Neurologic outcome depended on thenecrosis extension and/or the location of the affected area.CONCLUSIONMulticystic encephalomalacia is an infrequent pediatric entity.The brain tissues suffer variable, often extensive,ischemic destructive damage preferentially at supratentorialcompartment. Subcortical gray and white matter necrosisand substitution by cystic cavities separated from one anotherby glial septations are the rule. The insult frequentlyoccurs at perinatal period. Cranial follow-up ultrasounddemonstrates a high reliability in the detection of MEM,demonstrating, better than CT, the edema and the cystic cavitiesand septatios. MR imaging is a valuable complementarytool on appropriate extension and prognostic neurologicoutcome definition, but its major drawback is mobilizationand anesthesia requirements to perform it.KEY WORDS: Perineural spread, vagus nerve, MR imagingREFERENCES1. Naidich TP, Chakera TM. Multicystic Encephalomalacia: CTAppearance and Pathological Correlation. J Comput AssistTomogr 1984; 8(4):631-6362. Smith RR, Savolaine ER. Computed Tomography Evolutionof Multicystic Encephalomalacia. J Comput Assist Tomogr1986;10(3):249-2543. Orejón G, Mateos F, Simón R, Miralles M. MulticysticEncephalomalacia. Review of 19 Cases. An Esp Ped1997;46:33-39KEY WORDS: Multicystic encephalomalacia, ultrasound,destructive brain disease
Scientific Exhibit 82Doctor! What Is This “Thing” in My Nose? ImagingCharacteristics of Nasal MassesGodelman, A. 1 · Reede, D. L. 1 · Smoker, W. R. K. 2 · Gentry,L. R. 3 · Holliday, R. A. 41Long Island College Hospital, Brooklyn, NY, 2 University ofIowa Hospitals and Clinics, Iowa City, IA, 3 University ofWisconsin Madison, Madison, WI, 4 New York Eye and EarInfirmary, New York, NYPURPOSEThe purpose of this exhibit is to review the normal anatomyof the nasal cavity and the salient imaging characteristics oflesions encountered in this region. This will enable the radiologistto localize a lesion and provide a reasonable differentialdiagnosis based on location and imaging characteristics.Objectives: 1. Learn the normal nasal anatomy; 2. Learnthe imaging characteristics of common intranasal masses; 3.Review the patterns of disease spread associated with nasallesions.MATERIALS & METHODSWe reviewed 106 cases of intranasal lesions from threemajor medical institutions.RESULTSThe lesions encountered were congenital (5), squamous cellcarcinoma (12), minor salivary gland tumors (6), neuraltumors (8), inverting papillomas (14), sarcomas (3), lymphoma(10), metastatic disease (5), osseous lesions (8), vascularlesions (10), granulomatous disease (5), nongranulomatousinflammatory processes (15), and miscellaneouslesions (5). These lesions were analyzed with respect to location,effect on adjacent osseous structures, CT and MRappearance and pattern of disease spread.435PURPOSELabyrinthitis ossificans consists of abnormal bone formationthat fills the normally patent cochlear and vestibular lumenas an end-stage sequel to various pathologies affecting themembranous labyrinth. Bacterial infections resulting in suppurativelabyrinthitis are the most common cause for ossificationbut this also can occur following viral infections, traumaand in otosclerosis. Clinical presentation is with sensorineuralhearing loss. CT has been the most widely usedimaging test in detection of this disease but it can underestimatethe extent of involvement of cochlea and vestibularsystem.MATERIALS & METHODSMR imaging can help detect the disease missed on CT andcan better show the entire extent of abnormality. This informationmay be helpful in the management. In patients withmoderate to severe ossification of cochlea, drilling via facialrecess approach may become necessary during cochlearimplantation. If the implantation via conventional approachis unsuccessful, a circumodiolar trough for the electrode maybe created via an extended transtympanic approach.RESULTSThe importance of MR imaging in the diagnosis and treatmentplanning of this entity has not been addressed sufficientlyin the literature. At our institution, MR imaging isoften used as a complementary test or as a problem-solvingtool in the presence of discrepant CT and clinical findings.CONCLUSIONWe collected and reviewed several cases of labyrinthitisossificans from the teaching files in our department. Usingthis exhibit, we will present the imaging features oflabyrinthitis ossificans and highlight the importance of MRimaging in the imaging evaluation of this entity.KEY WORDS: Labyrinthitis ossificans, MR imaging, managementScientific Exhibit 84Aplasia or Hypoplasia of the Vestibulocochlear NerveScientific ExhibitsCONCLUSIONIntranasal masses may originate in the nasal cavity or adjacentstructures. Imaging plays an important role in the identificationand assessment of tumor extent. Knowledge of theanatomy and imaging characteristics of lesions in this locationis crucial.KEY WORDS: Nasal masses, imaging characteristicsScientific Exhibit 83Imaging Features of Labyrinthitis Ossificans andImportance of MR Imaging in Its Management PlanningGandhi, D. 1 · Gujar, S. 1 · Jain, R. 2 · Mukherji, S. K. 11University of Michigan Hospital, Ann Arbor, MI, 2 HenryFord Health System, Detroit, MIKodama, T. · Yano, T. · Miyata, Y. · Tamura, S.Miyazaki Medical CollegeMiyazaki, JAPANPURPOSECochlear implantation has become an accepted treatment forsevere to profound deafness and can be applied to patientswith congenital sensorineural hearing loss.MATERIALS & METHODSBecause the absolute requirements for cochlear implantationare the presence of a cochlea and of a cochlear nerve, imagingplays an important part in the work-up of cochlearimplant candidates. For evaluating these structures, high-resolution(sub-millimeter) heavily T2-weighted MR imagingprovides excellent information. Embryologic developmentof the vestibulocochlear nerve, inner ear (labyrinthine) andinternal auditory canal (IAC) is complex. Anomalies of theinner ear and IAC (atresia, stenosis, or duplication) are associatedoften but not always with aplasia or hypoplasia of thevestibulocochlear nerve.
Scientific ExhibitsRESULTSThough it can be difficult to distinguish the facial nerve andthe three branches of the vestibulocochlear nerve inside thestenotic IAC, facial and vestibulocochlear nerves always canbe evaluated in the cerebellopontine angle cistern. Aplasia orhypoplasia of the vestibulocochlear nerves can be foundwithout any other anomalies. In this case, only the cochlearnerve usually is involved. In some patients, the canalbetween the fundus of ICA and the modiolus is stenotic. Inthis exhibit, we present imaging findings of several types ofaplasia or hypoplasia of the vestibulocochlear nerve.CONCLUSIONRadiologists will assume an expanding role in evaluatingcandidates of cochlear implantation and must be familiarwith imaging findings that contraindicate implantation.KEY WORDS: Cochlear nerve, inner ear anomaly, internalauditory canalInterventional85-94Scientific Exhibit 85Endovascular Treatment of Cerebral Aneurysms:Atypical Scenarios and Management StrategiesHacein-Bey, L. · Ulmer, J. L. · Lemke, D. M. · Varelas, P. N.· Daniels, D. L. · Cusick, J. F.Medical College of WisconsinMilwaukee, WIPURPOSEEndovascular management of cerebral aneurysms, both rupturedor unruptured, is becoming increasingly the first lineoption. Although there has been significant progress inrecent years in the technical aspects of aneurysm treatment(1-3), some situations create unusual challenges, due to variousfactors, including aneurysm geometry, clinical presentation,or management plan.436without CT demonstrable stroke nor brainstem evokedpotentials alteration, and the other to venous hemorrhage inthe fourth ventricle causing a combination of mass effect andhydrocephalus. In fenestration-associated aneurysms, properidentification of the aneurysm limb is required for adequateaneurysm obliteration, and sparing of normal surroundingarterial branches (4). Dissecting aneurysms involve a circumferentialarterial tear which repair involves either stentassistedreconstruction or parent vessel occlusion. Distalbroad-based basilar aneurysm, whether lateral wall or apicalpose specific challenges (perforator ischemia, mass effect,hydrocephalus) due to the compact nature and the importanceof surrounding anatomical structures. Distal convexityartery aneurysms may require parent vessel occlusion andsubsequent physiologic hemodynamic manipulation. Lastly,some aneurysms may require treatment not for fear of hemorrhage,but for stroke prevention from intraaneurysmalthrombus migration.CONCLUSIONThere continues to be significant advances in endovascularaneurysm therapy. However some situations, whether due tounusual anatomical configurations, clinical presentations, ormanagement challenges, require planning that does not relysolely on technical solutions.REFERENCES1. Debrun GM, Aletich VA, Kehrli P, Misra M, Ausman JI, CharbelF. Selection of Cerebral Aneurysms for Treatment UsingGuglielmi Detachable Coils: The Preliminary University ofIllinois at Chicago Experience. Neurosurgery1998;43(6):1281-1295; discussion 1296-12972. Aletich VA, Debrun GM, Misra M, Charbel F, Ausman JI. TheRemodeling Technique of Balloon-Assisted GuglielmiDetachable Coil Placement in Wide-Necked Aneurysms:Experience at the University of Illinois at Chicago. JNeurosurg 2000;93(3):388-3963. Broadbent LP, Moran CJ, Cross DT 3rd, Derdeyn CP.Management of Neuroform Stent Dislodgement andMisplacement. AJNR Am J Neuroradiol 2003;24(9):1819-18224. Hacein-Bey L, Muszynski CA, Varelas PN. SaccularAneurysm Associated with Posterior Cerebral ArteryFenestration Manifesting as a Subarachnoid Hemorrhage ina Child. AJNR Am J Neuroradiol 2002;23(8):1291-1294KEY WORDS: Aneurysm, endovascular therapy, unusualMATERIALS & METHODSWe reviewed retrospectively the last 100 aneurysms treatedby endovascular means in our institution. Twelve aneurysmsin 12 patients, (12%) all but one involving the posterior circulation(3 vertebrobasilar fenestration-associatedaneurysms, 3 vertebrobasilar dissecting aneurysms, 2 distallateral basilar apex region, 1 broad-based basilar apex, 1multilobed basilar apex, 1 distal PICA and 1 posterior communicatingartery) were identified as atypical with regard toaneurysm configuration, clinical features, or managementstrategy. Six aneurysms had ruptured, and six were unruptured.RESULTSOut of these 12 patients, 2 died, and 10 had good to excellentoutcomes. The two deaths were from unusual mechanisms,one attributed to reticular activating system infarctionScientific Exhibit 86 (eSE)Endovascular Treatment of Dural Cavernous SinusFistulas Using Transvenous Occlusion in Forty-FivePatientsBenndorf, G. 1 · Mounayer, C. 2 · Piotin, M. 2 · Spelle, L. 2 ·Moret, J. 21Baylor College of Medicine, Houston, TX, 2 FondationRothschild, Paris, FRANCEPURPOSEEndovascular therapy, using transarterial or transvenousapproaches, has evolved as the most important treatmentmodality for patients with dural cavernous sinus fistulas(DCSFs). For endovenous catheterization of the cavernous
sinus various anatomical routes exist of which the mostimportant are: the inferior petrosal sinus (IPS), the superiorpetrosal sinus (SPS), and the superior ophthalmic vein(SOV). We report on anatomical results and clinical outcomeof 45 patients treated by transvenous embolization using variousroutes to the cavernous sinus.MATERIALS & METHODSForty-five patients (32-90 years, f/m: 32/13) presentedsymptoms typical for DCSFs such as eye redness, exophthalmus,chemosis, diplopia or retroorbital pain. There wasno intracranial hemorrhage and no focal neurologic deficit.Fistula types included type D (41), type B (3), and Type C(1). In 8 patients a bilateral fistula and in 9 patients a corticalvenous drainage was found. For transvenous catheterizationof the cavernous sinus, various approaches were usedincluding the IPS (37), the SOV (13), the SPS (4) the frontalvein (1) and the Sylvian vein (1). Catheter navigation to thefistula site was performed from a contralateral approach in 8patients and using a direct puncture of the internal jugularvein in 3 patients. For occlusion of the AV shunt in all butone patient platinum detachable coils were used and combinedin few cases with additional fibered coils (n = 7) or liquidadhesives (n = 3). One patient was treated with transvenousinjection of NBCA only.RESULTSAnatomical cure, confirmed by angiography, was obtained in42/45 patients (FU in 3 patients pending), in a single sessionin 35 patients and as an initial result in 28 patients. In 41patients complete clinical recovery was observed (FU in 4patients pending). There was no permanent major or minordeficit. One patient developed a transient sixth nerve palsy(2.2%), in another patient a venous rupture remained clinicallysilent.CONCLUSIONBiplane angiographic systems and currently availableendovascular tools and devices have significantly improvedthe technical success rate of TVO. This has lead to anincreasing rate of anatomical and clinical cure of patientswith DCSF while lowering the complication rate at the sametime, and establishes TVO as the treatment method ofchoice. The consistent use of all possible anatomical routesto the CS allows for treatment of almost all patients withDCSFs, and “intractable fistulas” have become the exception.KEY WORDS: Dural cavernous sinus fistula, transvenousocclusion437Scientific Exhibit 87Spinal Arteriography: A Pictorial ReviewShah, B.University of VirginiaCharlottesville, VAPURPOSEThe purpose of this exhibit is to present a detailed review ofspinal cord and column vascular anatomy and discuss theangiographic differential diagnosis of common vascular andneoplastic lesions that affect the spinal cord and column.MATERIALS & METHODSA retrospective review of 25 cases was performed over thelast 5 years of experiences at the section of neuroradiologyat University of Virginia medical center. All these patientshad undergone selective catheter angiographic evaluation forwork-up of neoplastic or vascular pathology including spinalarteriovenous malformations, spinal dural arteriovenousmalformations, metastatic lesions, schwannoma, meningioma,Cobb’ , s syndrome (metameric disease), vertebralartery to epidural vein fistula and V-V fistula. A case-baseddiscussion of the basic anatomy, angioarchitecture, and thedifferential diagnosis of these cases is included. Whereappropriate cross-sectional images are used to highlight theangiographic findings. The issues relevant to endovasculartherapy will be discussed also.RESULTSOut of the 25 cases reviewed, 7 were neoplastic lesions, 8dural avms, 2 perimedullary avms, 1 cobb syndrome, 1 vertebralartery to epidural vein fistula, 2 V-V fistulas.Threewere negative and in one case the final diagnosis could notbe established.CONCLUSIONWhile cross-sectional imaging does have a role to play in thediagnosis of spinal vascular lesions selective catheterangiography remains the gold standard for diagnosis ofspinal vascular lesions. Recognition of the dural, intradural,and radiculomedullary vessels is of paramount importance;particularly for those requiring endovascular managementwhich is only possible with a selective catheter study. Tumorlesions and dural AVMs constituted the bulk of casesreferred for spinal angiography at our institution.KEY WORDS: Angiography, spinal, arteriovenous malformationScientific Exhibits
Scientific Exhibits438Scientific Exhibit 88 (eSE)Scientific Exhibit 89Preliminary Experience on the Use of a New Generation Pudendal Nerve Blocksof Intracranial Stents (Neuroform) for CerebralAneurysmsWestesson, P. · Howard, F. M. · Hiwatashi, A. · Moritani, T.Perlow, A. 1 · Linfante, I. 1 · Wakhloo, A. K. 1 · Berlet, M. H. 2 ·Rodriquez, R. 31University of Miami, Miami, FL, 2 St. Joseph’s BaptistHospital, Tampa, FL, 3 University of Puerto Rico, San Juan,Puerto RicoPURPOSETo review our experience on the use of Neuroform stents inthe treatment of intracranial aneurysms, to identify pitfalls,and avoid complications.MATERIALS & METHODSA retrospective review of all patients previously treated withNeuroform stents was performed. Clinical and angiographicfollow-up was performed.RESULTSThirteen stents were placed in 13 patients with 17 attempts(11 female patients, average age of 49 years). Four stentswere not deployed due to device failure. Five patients presentedwith subarachnoid hemorrhage, 3 patients hadheadaches, and the remainder were asymptomatic. Fifteenaneurysms were treated with aneurysm locations: 4 paraopthalmic;3 posterior communicating; 1 superior hypophyseal;1 vertebro-basilar junction; 1 dissecting vertebralartery; 1 posterior ICA wall, and 4 para/supraclinoid (onepatient had 3 aneuryms). Eleven patients had excellentresults, one patient suffered an ICH while on heparin, aspirinand GP IIa/IIB inhibitors due to development of nonocclusivethrombus on the stent, and one suffered a TIA within 24hours of stent placement (PTT < 30 seconds). Angiographicfollow-up in four patients showed excellent results.CONCLUSIONIntracranial stenting is a feasible option of wide-neckedaneurysm treatment. Technical knowledge on stent characteristicsand deployment are essential before use. The first 24hours postdeployment is the most critical for complications.Long-term follow-up is warranted for evaluation of this newdevice.University of Rochester Medical CenterRochester, NYPURPOSEPudendal neuralgia is difficult to diagnose and thereforeoften misdiagnosed. It is a debilitating disorder with severeburning pain in the perineum, vagina, vulva, penis and scrotum.The differential diagnoses include vulvodynia, tumors,spine disease, dermatologic conditions, prostatitis, vestibulitis,chronic vaginitides and psychosomatic disorders. Nerveblocks are often diagnostic and are sometimes therapeutic.The purpose of this exhibit is to demonstrate the techniqueand discuss the benefits of pudendal nerve blocks.MATERIALS & METHODSThe pudendal nerve arises from the sacral plexus (S2-S4)and courses through the pelvis around the ischial spinebetween the sacral spinous and sacral tuberous ligaments. Itsplits up into the anal, perineal, and clitoral/penile branches.It turns anteriorly through the lower sciatic foramen underneaththe surface of the levator muscle into Alcock’s canalwhere the nerve flattens out between the double fascia.RESULTSPudendal nerve block is done under CT guidance using 22-gauge spinal needle placed next to the ischial spine or intothe Alcock’s canal where long-acting local anesthetic isinjected. The procedure can be repeated with a placebo toconfirm the source of the symptoms. If the block is positive,steroid injection, botulinum toxin injections or surgicalrelease of the nerve may result in permanent relief.CONCLUSIONPudendal nerve blocks are performed readily on an outpatientbasis with low risk of complications. The results arevery helpful in confirming the diagnosis and if not therapeutic,steroid or botulinum toxin injections, or surgical release,may yield longer term relief.KEY WORDS: Pudendal nerveKEY WORDS: Aneurysms, Neuroform, intracranial stentThe authors of this work have indicated the following affiliations/disclosures:Boston Scientific Co.: Consultant.Scientific Exhibit 90 (eSE)Thermo Reversible Liquid Embolic Agent for theTreatment of Vascular DiseaseTakao, H. 1 · Murayama, Y. 1 · Ishibashi, T. 1 · Ebara, M. 1 · Irie,K. 1 · Saguchi, T. 1 · Mori, Y. 2 · Abe, T. 1 · Vinuela, F. 31The Jikei University School of Medicine, Tokyo, JAPAN,2Waseda University, Tokyo, JAPAN, 3University ofCalifornia Los Angeles, Los Angeles, CAPURPOSEWe developed a new embolic agent, thermo-reversible gelationpolymer (TGP). This polymer owns unique characteristicsthat can be solidified by body temperature. We evaluatedangiographic and histopathologic findings of this new liquidembolic agent.
439MATERIALS & METHODSThermo-reversible gelation polymer has a sol-gel transitiontemperature (TT). It becomes a liquid state at a temperaturelower than the sol-gel transition temperature and becomesgel state above TT. It can also slowly deliver biologicallyactive substance such as growth factor or chemotherapydrugs. The polymer was mixed with radiopaque materialwithout solvent. Two different TGPs were evaluated. Type Asolidifies at 15 o C and Type B solidifies at 20 o C. Because bothTGPs have lower TT than body temperature, they solidify inthe body lumen. Ten renal arteries of seven swine wereemboli zed with TGPs (Type A: n = 5, Type B: n = 5).Angiographic follow-up was performed at day 14.Subsequently, animals were sacrificed. Histopathologicevaluation was performed.RESULTSAll renal arteries were embolized successfully with TGP.The polymer was delivered like GDC coil in the vascularlumen. Type A required stronger injection pressure than TypeB due to high viscosity. Angiographic follow-up was performed2 weeks after embolization. Although some degreeof recanalization was observed, histopathologic findingsdemonstrated tissue necrosis of the embolized area.CONCLUSIONThis new thermo-reversible liquid embolic agent can be usedeffectively for embolization of kidney arteries in swine.Further modifications such as mechanical stability would bemandatory prior to clinical application.KEY WORDS: new liquid embolic agentScientific Exhibit 91Balloon Test Occlusion with Perfusion CT ImagingUtilizing Intraarterial Contrast InjectionEbara, M. 1 · Murayama, Y. 1 · Saguchi, T. 1 · Ishibashi, T. 1 ·Irie, K. 1 · Takao, H. 1 · Sadaoka, S. 1 · Klotz, E. 2 · Abe, T. 11The Jikei University School of Medicine, Tokyo, JAPAN,2Siemens Medical Solutions, Forchheim, GERMANYPURPOSETherapeutic occlusion of the unilateral internal carotid artery(ICA) is sometimes inevitable in the treatment of large orgiant cerebral aneurysms or skull base tumors. Balloon testocclusion (BTO) is performed to evaluate the collateral flowwhen a permanent ICA occlusion is planed. BTO with neurologicevaluation alone, however, has a rather high falsenegativerate. In order to improve the sensitivity, severalmodalities such as xenon-enhanced computed tomography(CT), single photon emission CT (SPECT) or positron emissiontomography (PET) have been combined with BTO.Perfusion CT (PCT) is another emerging modality that isused mainly for the diagnosis of acute stroke. Our institutionhas an angio suite equipped with a multidetector CT. Itenables us to perform BTO and PCT without transferring thepatient. We performed a preliminary study to evaluate theefficacy and the safety of the BTO combined with PCT withinone procedure.MATERIALS & METHODSFrom July 2003 to December 2003, five patients (all female)underwent BTO with PCT in our institution. Four of themhad wide-necked or giant aneurysms. The fifth one previouslyhad undergone aneurysm surgery that ended in proximalocclusion. She had another aneurysm on the contralateralside and PCT was performed to evaluate the vascularreserve. All of the procedures were performed in theangio/CT combination suite (Miyabi; Siemens, Erlangen,Germany). Bilateral femoral arteries were punctured andfemoral sheathes were placed. BTO was performed in theusual fashion, inflating the balloon in the cervical ICA for 30minutes with neurologic examination every 5 minutes. Whenthe patient passed the 30-minute BTO clinically, PCT wasperformed subsequently. The balloon was kept inflated, andcontrast material was injected from a pigtail catheter, the tipof which was placed in the ascending aorta. The dataobtained were transferred to a workstation and perfusionmaps of CBF, cerebral blood volume (CBV), and time topeak (TTP) were generated using software (Perfusion CTsoftware; Siemens).RESULTSAlthough all of the patients had passed the BTO clinically,the CBF and the CBV maps of two patients revealed significantdecrease in the occluded hemisphere. One of these twopatients underwent a SPECT study during BTO that alsoshowed reduced CBF in the occluded hemisphere. The firstthree patients were scanned for 40s after injecting 30 ml contrastmaterial at a rate of 8 ml/s. As we found that less contrastwas sufficient to obtain a sharp arterial input function,we injected only 10 ml at 5 ml/s for the last two patients andreduced the scan time to 30 seconds. There was no procedure-relatedmorbidity.CONCLUSIONPCT using intraarterial contrast injection during BTO wasperformed successfully and safely. Intraarterial injectionallowed us to obtain excellent time-attenuation curves by utilizingless contrast material and less radiation. This techniqueseems promising; however, further studies are necessaryas the number of patients was limited and quantitativeresults should be validated against those of other modalities.KEY WORDS: Perfusion, balloon occlusion, CTThe authors of this work have indicated the following affiliations/disclosures:Siemens Medical Solutions: Senior scientist.Scientific Exhibits
Scientific Exhibit 92 (eSE)Indication for Endovascular Improvement of LateralSinus Circulation in Case of Idiopathic IntracranialHypertensionMironov, A.Kantonsspital AarauAarau, SWITZERLAND440produce an idiopathic intracranial hypertension or pseudotumorcerebri, especially in obese women. In both cases, withmedical treatment only and clinical presentation of an idiopathicintracranial hypertension, a central venous pressureelevation had been found across the lateral sinuses withoutany relevant pressure gradients. This indicates that in particularcases of idiopathic intracranial hypertension a distinctvenous outflow obstruction might have a causal relation andconsequently might promote the clinical progress of this disease.Scientific ExhibitsPURPOSEThe significance of perturbed venous efflux for generation ofintracranial hypertension in many pathologic conditions[e.g., arteriovenous malformation (AVM), dural arteriovenousangioma, dural sinus thrombosis] has been recognizedalready. In cases of idiopathic intracranial hypertension orpseudotumor cerebri the venous hypertension has been suggestedalso to have a pathogenetic influence, but the etiologyof pathophysiologic mechanism in such conditionsremains unknown. The goal of this study is to document theclinical response to an endovascular improvement of lateralsinus circulation in cases with refractory idiopathic intracranialhypertension without apparent sinus obstruction.MATERIALS & METHODSThree obese women and one man (16, 18, 25, and 26 yearsold) were referred with history of progressive headache andvisual disturbance and of initial change of personality. Theyunderwent MR imaging, conventional cerebral angiographieswith cerebral venography, and manometry of duralsinuses. Percutaneous angioplasty of dural sinuses with compliedballoons were obtained in two cases.RESULTSMR images were normal in all four patients. Lumbar cerebrospinalfluid pressure had been elevated in all patientsbetween 30 cm 80 cm H20. MR venography demonstratednormal dural venous sinuses. The conventional cerebralvenous phase showed questionable irregularities of lateralsinuses in all patients. The direct transfemoral dural sinusvenography revealed decent stenotic lesions in the junctionof transverse sinus to the sigmoid sinus in identical fashionof all patients. The manometry of dural sinuses revealedpressure gradients by 50 mm Hg in the first patient (torculapressure 66 mm Hg, jugular pressure 16 mm Hg), by 20 mmHg in the second patient (torcula pressure 36 mm Hg, jugularpressure 16 mm Hg), by 4 mm Hg in the third patient (torculapressure 20 mm Hg, jugular pressure 16 mm Hg), andby 4 mm Hg in the fourth patient (torcula pressure 16 mmHg, jugular pressure 12 mm Hg). Angioplasty of lateral duralsinuses had been performed in both the first and secondcases. The venographies showed only decent regression ofstenotic lesions; but the clinical course in both patients, afew days later, underwent a dramatic improvement with resolutionof papilledema and headache.The third and fourthpatients underwent medical therapy only.CONCLUSIONWe were able to document a dramatic improvement in symptomsin two cases with idiopathic intracranial hypertensionwith a consequent reduction of pressure gradients across thelateral sinuses after angioplasty of dural sinuses. Obviously,the latent elevated pressure gradients across the lateral sinuseven in cases with only distinct stenotic sinus lesions canKEY WORDS: Idiopathic intracranial hypertension, duralsinus angioplastyScientific Exhibit 93Pitfalls in Gamma Knife Treatment of Tic Doloreaux onStereotatic 3D MR Imaging: Morphologic ChangesAffecting TargetingLee, C. · Young, A. B. · Michaels, S. J. · Ellis, P. A. · Given,C. A.University of KentuckyLexington, KYPURPOSEThe treatment of tic doloreaux has evolved from the moremorbid chemical, thermal, and electrical rhizotomies of thetrigeminal nerve to the more precise gamma knife radiosurgery.Identifying the nerve root at the pons on stereotacticMR imaging to select the treatment focus was not so simplea chore because of encountered morphologic changes. Thisexhibit will present our experience in targeting 131 patientsfor tic doloreaux by gamma knife, emphasizing how thesemorphologic changes could affect targeting, and whetherthey played a role in treatment failure.MATERIALS & METHODSAll patients were imaged on a 1.5 T MR imager with routinesets of images as well as 1 mm reformatted T1-weightedMP-RAGE in all three planes with a Leksell head framereviewed on Siemen’s PACS and Leksell imaging workstations.A focus was selected along the visualized course of thenerve precisely in the center of it on the axial one mm MP-RAGE images so the 50% isodose line did not or just barelytouched the pons, and its location confirmed in the other twoplanes. Cine function was applied to the MP-RAGE imagesto reduce partial volume averages of tortuous nerves to selectthe thickest portion of the nerve to measure for asymmetriesin size to the contralateral nerve.RESULTSThe affected nerve (92 right/49 left) was most commonlysmaller than the opposite nerve (44% equally right and left)ranging from 1-2 mm difference in measured axial diameterto one so shrunken that it was difficult to visualize even onall three planes. It was also the most common finding in 42patients requiring a second treatment (20 right/22 left). Thenext most common finding was a normal nerve withoutasymmetry in size (23%). Vascular compression by an ectaticbasilar artery was also seen (21%) with visible compressionof the nerve which was also smaller, as was abnormal
thickening of the nerve (12%) all equally right and left.Failure rate was higher with left (45%) compared to right(21%).CONCLUSIONDifficulty in outlining the nerve due to atrophy or a nervethat is flattened against the pons, presents a targeting challenge.In such situations we triangulate the more distalcourse of the nerve from Meckel’s cave, along a line directedposterior and perpendicular to the cave. Atrophy mayreflect chronicity with nerve shrinkage. The fact that anatrophic nerve was the most common finding suggests thattreatment failure may be related to poor definition of the target.Basilar artery compression deflects and compresses thenerve making it difficult to target, and often is associatedwith nerve atrophy. This finding of vascular compressionwas also the next most common morphologic changeencountered in the group requiring a second treatment.Nerve thickening probably represents local scar or arachnoidthickening. Recognition of these problems may still be of nohelp since the limiting factor is good anatomical definition.Careful targeting of the nerve in all three planes using cinefunction should reduce treatment failures.KEY WORDS: Tic doloreaux, gamma knife surgery, radiosurgicaltrigeminal rhizotomies441MATERIALS & METHODSDuring the past 6 years, there were 260 cases of vascularlesions of the head and neck region who accepted angioplastyand stenting in our hospital. The vascular disorders wereclassified into three categories: atherosclerotic arterial disease,nonatherosclerotic arterial disease, and venous sinusdisorders. The technical considerations for angioplasty andstenting of atherosclerotic arterial disease include the verytortuose aortic arch, a predilatation test for very high-gradecarotid stenosis (> 99%), ulcerated carotid plaques, largeeccentric carotid plaques, very tortuous carotid artery andsubclavian artery, and intracranial carotid stenosis. The technicalconsideration for angioplasty and stenting of nonatheroscleroticarterial diseases include radiation-induced carotidand subclavian artery stenosis, dissection of carotid and vertebralartery, fibromuscular dysplasia of carotid artery,intracranial carotid aneurysm, carotid pseudoaneurysm, andforeign body of carotid artery. In venous sinus disorders, weshowed a double-wire method for stenting of transversesinus stenosis, and combined angioplasty and thrombolytictherapy for venous sinus thrombosis.RESULTSThe technical success rate of atherosclerotic carotid stenosiswas about 98.9%. The embolic complication of carotidangioplasty and stenting is about 4.8%. No embolic complicationwas noted in the nonatherosclerotic arterial diseasesof the head and neck region. Some technical complicationswere noted in this study. They included vascular dissection,extravasation during the manipulation, and dislodgement ofthe stent.CONCLUSIONAngioplasty and stenting is an effective management withhigh technically successful rate for the vascular disorders ofthe head and neck region. The embolic complication rate ofatherosclerotic carotid stenosis obviously can be reduced byprotection devices. The nonembolic complications, commonlyseen in the newcomers of this field, need to be avoidedby meticulous practice and careful treatment planning.Scientific ExhibitsScientific Exhibit 94Angioplasty and Stenting of Vascular Diseases of theHead and Neck Region: A Technical ApproachChang, F. · Lring, J. · Luo, C. · Wu, H. · Guo, W. · Teng, M.· Chang, C.Taipei Veteran’s General HospitalTaipei, TAIWAN REPUBLIC OF CHINAPURPOSEAngioplasty and stenting has been applied widely in atheroscleroticcarotid stenosis for many years. The technical successfulrate is more than 98% to 99%. However, the causesof technical difficulty and the application of stenting innonatherosclerotic vascular diseases were not discussedwidely. There are two purposes of this technical exhibition:(1) To review the technical difficulty and the ways of resolutionof atherosclerotic disease of the head and neck region,(2) To extend the technical application of angioplasty andstenting in nonatherosclerotic vascular diseases of the headand neck region.KEY WORDS: Stenting, vessels, head and neckPediatrics95-107Scientific Exhibit 95Transcranial Doppler in Children: Applications inNonsickle Cell PatientsLowe, L. H. 1,2 · Formen, C. C. 2,3 · Bulas, D. I. 4,51Children's Mercy Hospital, Kansas City, MO, 2 Universityof Missouri-Kansas City, Kansas City, MO, 3 St. Luke'sHospital, Kansas City, MO, 4 Children's National MedicalCenter, Washington, DC, 5 George Washington University,Washington, DCPURPOSEThe purpose of this scientific exhibit is to review the keyimaging findings of various clinical conditions in whichtranscranial Doppler (TCD) may be applied other than sicklecell disease.MATERIALS & METHODSIn children with sickle cell disease, TCD has become widelyaccepted as the modality of choice for screening cerebrovasculardisease due to the fact that it is noninvasive, requiresno radiation, is portable, repeatable, and provides velocitymeasurements of major intracranial vessels that otherwisemay be unavailable.
442RESULTSScientific Exhibit 97Because of these attributes, in recent years TCD has beenapplied to a growing list of pathologic processes that involveMR Imaging of the Fetus In Utero II: ..... and the Restthe major intracranial vessels.(non-CNS)Scientific ExhibitsCONCLUSIONSpecific topics of discussion will include distinguishing subduralvs subarachnoid spaces, hydrocephalus, vascultis,hypoxic/anoxic brain injury, and brain death. Potential pitfallsin the interpretation of TCD will be discussed also.KEY WORDS: Pediatric, transcranial, DopplerScientific Exhibit 96MR Imaging of the Fetus In Utero I: A Practical Guide toSystematic Analysis of the Central Nervous SystemRobinson, A. J. 1 · Blaser, S. 1 · Toi, A. 2 · Chitayat, D. 2 · Ryan,G. 2 · Pantazi, S. 2 · Gundogan, M. 2 · Laughlin, S. 11Hospital for Sick Children, Toronto, ON, CANADA,2Mount Sinai Hospital, Toronto, ON, CANADAPURPOSEWell established protocols exist for the sonographic examinationof the fetus, encompassing differing levels of detaildepending on the overall risk of the individual pregnancy(i.e., from a routine screening examination up to a tertiaryleveldetailed assessment of a high-risk pregnancy). No suchprotocols are established yet for fetal MR imaging. In ourinstitution we have attempted to establish a protocol forreporting fetal MR examinations, in order that a systematicand methodical approach is adopted by our radiologists,including those who are not used to reading these examinations,and to avoid missing important anatomical abnormalities.MATERIALS & METHODSRetrospective analysis was performed in over 130 consecutivefetal MR examinations performed for CNS and non-CNS indications.RESULTSAnalysis included, but was not limited to, biometry, includingbiparietal diameter, transcerebellar diameter, ventricularatrial width, craniocaudal diameter of the cerebellar vermis,the presence of the cavum septum pellucidum and corpuscallosum and other midline and lateral structures, corticaldevelopment and appearance of sulci and major fissures.CONCLUSIONWe would like to demonstrate a practical guide to analysis ofthe central nervous system of the fetus in utero, includinghow to perform the biometric measurements, and examplesof normal and abnormal biometry and development.(Part 1 of 2. See abstract 851 for part 2.)KEY WORDS: Fetal MR imaging, developmentRobinson, A. J. 1 · Blaser, S. 1 · Toi, A. 2 · Chitayat, D. 2 · Ryan,G. 2 · Pantazi, S. 2 · Gundogan, M. 2 · Laughlin, S. 11Hospital for Sick Children, Toronto, ON, CANADA,2Mount Sinai Hospital, Toronto, ON, CANADAPURPOSEWell established protocols exist for the sonographic examinationof the fetus, encompassing differing levels of detaildepending on the overall risk of the individual pregnancy(i.e., from a routine screening examination up to a tertiaryleveldetailed assessment of a high-risk pregnancy). No suchprotocols are yet established for fetal MR imaging. In ourinstitution we have attempted to establish a protocol forreporting fetal MR examinations, in order that a systematicand methodical approach is adopted by our radiologists,including those who are not used to reading these examinations,and to avoid missing important anatomical abnormalities.Additionally, most of our examinations are performedfor CNS indications, with which most neuroradiologistsshould feel comfortable. However they invariably alsoinclude non-CNS anatomy with which neuroradiologistsmight feel less comfortable, but which should be reviewedroutinely also, and not simply glossed over or even worseignored.MATERIALS & METHODSRetrospective analysis of was performed in over 130 consecutivefetal MR examinations performed for CNS and non-CNS indications.RESULTSAnalysis included, but was not limited to, evaluation of thoracicand abdominal situs, lung parenchyma, diaphragms,liver and gallbladder, stomach, kidneys (including biometry),bladder, cord insertion, cord vessels, placental site andmorphology, and amniotic fluid volume.CONCLUSIONWe would like to demonstrate a practical guide for neuroradiologistsfor the analysis of the rest of the fetus (non-CNS),including how to perform the biometric measurements, andexamples of normal and abnormal development.Part 2 of 2. See abstract 750 for part 1.KEY WORDS: Fetal MR imaging, development
Scientific Exhibit 98Holoprosencephaly: A Review of Cranial Cleavage andDiverticulation DisordersPrasad, R. S. · Kwon, J. K. · Zicherman, J. · Verma, A. ·Fitzpatrick, M.New Jersey Medical School/University of Medicine andDentistry of New Jersey - Robert Wood Johnson UniversityHospitalNew Brunswick, NJPURPOSETo examine the spectrum of congenital cranial diverticulationdisorders, including clinical manifestations and radiographicpresentation using CT, MR imaging, and ultrasonography.MATERIALS & METHODSA pictorial review of holoprosenchephaly including the alobar,lobar, and semilobar subtypes, a discussion of septoopticdysplasia, and a review of embryologic processes ofcranial cleavage and diverticulation is presented. Cross-sectionalimages were obtained on high-speed multidetector CTscanners and 1.5 T MR scanners at a level I trauma centerand a children’s hospital specializing in neonatology.RESULTSThe classification of this disorder is demonstrated with characteristicimaging findings on CT, MR imaging, and ultrasound.Associated clinical disorders including midline facialdefects, neuronal migrational disorders, trisomies, andextracranial manifestations are illustrated.CONCLUSIONA pictorial essay of the various subtypes of holoprosencephalyand a discussion on classification based on characteristicMR imaging, CT, and sonographic findings providean overview of this important category of congenital cranialmalformations.KEY WORDS: Holoprosencephaly, congenital malformations,diverticulation disordersScientific Exhibit 99Isolated Hypothalamic Fusion: Holoprosencephaly?Curtin, J. 1 · Palasis, S. 2 · Grattan-Smith, D. 21Emory University Hospital, Atlanta, GA, 2 Children’sHealthcare of Atlanta at Scottish Rite, Atlanta, GAPURPOSEThe holoprosencephalies are a group of phenotypically variablegenetic forebrain malformations defined by failure ofnormal differentiation and cleavage of the prosencephalon.The three classic subcategories of alobar, semilobar, andlobar holoprosencephaly are well known. A holoprosencephalicvariant of middle interhemisperic fusion has beendescribed recentl . We have identified three cases of a verysubtle form of midline fusion involving only the hypothalamus.The purpose of this exhibit is to present our series of443isolated hypothalamic fusion along with a pictorial review ofthe embryogenesis and imaging characteristics of holoprosencephaly.MATERIALS & METHODSThe MR examinations and clinical findings of children withholoprosencephaly or midline facial malformations since2000 were reviewed.RESULTSThree cases of isolated hypothalamic fusion were identified.One case was accompanied by an ectopic neurohypophysis.All three cases demonstrated varying degrees of developmentaldelay, seizures, and/or midline craniofacial abnormalities.CONCLUSIONOur three cases of isolated fusion of the hypothalamus, astructure believed to belong to the diencephalon, underscoresthe heterogeneity of the “holoprosencephalies.” Thisform of midline fusion is subtle but important to recognizebecause of the clinical implications it carries.KEY WORDS: Holoprosencephaly, diencephalic fusion,hypothalamusScientific Exhibit 100 (eSE)Congenital Malformations of the Ear in PediatricPatients: CT and MR Imaging EvaluationFonda, C. 1 · Mortilla, M. 1 · Antonello, M. 1 · Moretti, M. 1 ·Scarane, P. 2 · Casagrande, I. 2 · Bigozzi, M. 21Meyer Children’s University Hospital, Florence, ITALY,2University of Florence, Florence, ITALYPURPOSETo analyze features of the congenital deformities of the earthrough CT and MR imaging and to evaluate the normal andpathologic range diameters of inner ear structures in neurosensoryhearing loss. The congenital malformation of theear includes abnormalities of the bony structure (20%) andof the membranous labyrinth (80%). Abnormalities of theinner ear typically give rise to sensorineural hearing loss orvestibular symptoms. Such abnormalities usually are bestevaluated with dedicated high resolution MR imaging, usinghigh resolution CT as an adjunct to define associated bonyabnormalities. MR imaging is a useful adjunct in evaluatingcentral involvement in congenital neurosensory loss.MATERIALS & METHODSSeventy-one children (including 31 males and 30 females;age range 1-18 years) affected with moderate to severe sensorineuralhearing loss underwent CT and/or MR scan.Twenty-seven patients were scanned with CT only, while 44underwent both techniques on the same day. Not collaboratingchildren (38 children under 6 years) were sedated withlaryngeal mask. Among the 71 patients, 17 resulted having adefined genetic disorder. We have analyzed 22 normal earsbelonging to children affected with monolateral flogisticphenomenon. Axial CT scans were performed from the superiororbitomeatal line to the top of petrous bone. Coronal CTscans were performed parallel to the posterior wall of maxillarysinus, from posterior margin of temporomandibularScientific Exhibits
Scientific Exhibitsjoint to the posterior and lateral side of petrous bone. 1 mmthickness acquisitions were obtained for each plan. MR studieshave been carried out using 3D axial FSE T2-weighted(TE 119 ms, TR 5000 ms, FOV 190 mm, Flip angle 90°,NSA 1, thk 0.8 mm, matrix 256 x 256) and oblique coronal(perpendicular to VIII cranial nerve) T2-weighted sequencesat a 1.5 T scanner (Marconi-Philips).RESULTSTwenty-seven patients with abnormalities were found. Thefollowing abnormalities were detected: coclear abnormalities(12 cases); internal auditory canal abnormalities (5cases); auditory ossicle abnormalities (8 cases); externalauditory deformities (7 cases); dilatation of vestibular aqueduct(14 cases); VIII nerve hypoplasia (8 cases). In 9 casesthe abnormalities were unilateral while in 18 cases they werebilateral.CONCLUSIONCT and MR imaging demonstrate accurately pattern, extent,and associated changes of congenital deformities of the ear.The pathologic features are better defined when the techniquesare combined since MR imaging can analyze only thecoclear component of the VIII nerve. An early characterizationof the ear abnormalities and their precise analysis madethrough CT and MR imaging are necessary to give an indicationfor the eventual audiological treatment.Measurements of cochlear, vestibular, and IAC structures,compared to the normal values, may reveal subtle abnormalitiesotherwise misdiagnosed. MR imaging always should beperformed when associated encephalic malformations aresuspected.444(MRS), diffusion tension image (DTI), and fractionalanisotropy (FA). The first three pulse sequences werefocused on the tubers in subependymal region, corticalregion, and white matter. The last three were focused in thewhite matter next to a certain cortical tuber.RESULTSIn the subependymal tubers, the T1-weighted imagesrevealed low signal intensity (SI) in 1 case, intermediate SIin 6 cases, high SI in 4 cases. On FLAIR images, low SI withhigh SI rim was shown in 6 cases, intermediate SI in 3 cases,and high SI in 2 cases. Only 4 cases had abnormal contrastenhancement in the subependymal tubers. In the corticaltubers, the T1-weighted images revealed isointense on 11cases with focal thickening. On FLAIR images, 9 cases hadhyperintense and 2 cases had intermediate intensity. No casehad abnormal enhancement after contrast administration. Inwhite matter tubers, T1-weighted images revealed blurredgray-white matter junction in 10 cases, and all cases were inlow SI. On the FLAIR, all of them became bright SI, andonly 2 cases had abnormal enhancement. All the cases hadabnormal DTI in the region next to the cortical tubers butonly 9 cases revealed abnormal FA. On MRS study, therewas no significant difference between the white matter nextto the tubers and the one in contralateral control side.CONCLUSIONThe imaging finding in the tuberous sclerosis is best shownby T1-weighted image, FLAIR and DTI. The images changein the cortical, subependymal, and white matter tubers arenot exactly the same. Their underlying pathology should beconsidered.REFERENCES1. Westerhof JP, Rademaker J, et al. Congenital Malformations ofthe Inner Ear and the Vestibulocochlear Nerve in Childrenwith Sensorineural Hearing Loss: Evaluation with CT andMRI. JCAT 2001;25(5):719-7262. Sennaroglu L, Saatci I. A New Classification forCochleovestibular Malformation. Laryngoscope2002;112(12):2230-22413. Glastonbury CM, Davidson HC, et al. Imaging Findings ofCochlear Nerve Deficiency. AJNR Am J Neuroradiol2002;23(4):635-643KEY WORDS: Petrous bone malformation, inner ear imaging,petrous bone CTScientific Exhibit 101 (eSE)Imaging Spectrum of Tuberous SclerosisLiu, H. · Tsai, Y. · Tseng, W. · Peng, S.National Taiwan University HospitalTaipei, TAIWAN REPUBLIC OF CHINAPURPOSETo demonstrate the imaging finding of patient with tuberoussclerosis.MATERIALS & METHODSEleven cases of tuberous sclerosis were included. The imagingstudy included T1-weighted image, FLAIR image, contrast-enhancedT1-weighted image, MR spectroscopyKEY WORDS: Tuberous sclerosis, image, diffusionScientific Exhibit 102Bilambdoid Craniosynostosis: A Case Presentation andReview of the LiteratureMiller-Thomas, M. M. · Hochhauser, L.The University of Texas Health Science CenterHouston, TXPURPOSETo present the high spatial-resolution CT images of a case ofbilambdoid craniosynostosis. To review the incidence andclinical presentation of this rare form of craniosynostosis. Todiscuss the current CT imaging techniques for craniosynostosis.MATERIALS & METHODSThin-slice axial CT images with three-dimensional surfacereconstructions of a child presenting to our institution withbrachycephaly are presented. The radiologic and surgical literatureis reviewed focusing on the incidence, clinical presentation,and imaging of nonsyndromic bilambdoid craniosynostosis.RESULTSAxial CT images and three-dimensional surface reconstructionsof the skull of our patient demonstrate closure of bothlambdoid sutures and the posterior portion of the sagittal
suture. Review of the literature yielded 47 cases of bilambdoidcraniosynostosis confirmed by either CT imaging orpathologic evaluation of the resected cranial sutures. Themajority of the children were neurologically normal and presentedwith brachycephaly. Complications most commonlyincluded hydrocephalus and increased intracranial pressure.High spatial-resolution CT with three-dimensional renderingis superior to plain radiographs at diagnosing craniosynostosisand assisting surgical planning.445into 3 main groups. Group I consisted of those neonates whohad positive findings on DW images (31 neonates). Group IIcomprised those patients who had negative DW images, nolactate on MR spectroscopy and no suspicious findings forHIE on conventional MR sequences (17 neonates). Group IIIconsisted of those patients who had equivocal findings forHIE on conventional sequences, negative DW images and nolactate on MR spectrsocopy; these patients were excludedfor statistical analysis.CONCLUSIONBilambdoid craniosynostosis is a rare form of craniosynostosispresenting with brachycephaly, a high occiput, frontalbossing, and low-set ears. Our case illustrates the value ofhigh spatial-resolution CT combined with three-dimensionalrendering in the diagnosis of bilambdoid craniosynostosis.REFERENCES1. Moore MH, Abbott AH, Netherway DJ, Menard R, Hanieh A.Bilambdoid and Posterior Sagittal Synostosis: The MercedesBenz Syndrome. J Craniofac Surg 1998;9:417-4222. Leboucq N, Montoya P, Martinez Y, Castan P, Bourbotte G.Lambdoid Craniosynostosis. A 3D-ComputerizedTomographic Approach. J Neuroradiol 1993;20:24-333. Medina LS. Three-Dimensional CT Maximum IntensityProjections of the Calvaria: A New Approach for Diagnosisof Craniosynostosis and Fractures. AJNR Am J Neuroradiol2000;21:1951-1954KEY WORDS: Craniosynostosis, lambdoid sutureScientific Exhibit 103Hypoxic-Ischemic Encephalopathy: A ProspectiveComparison of “State-of-the-Art Ultrasound” and MRImaging: Can Ultrasound Compete with MR Imaging?Epelman, M. · Daneman, A. · Kellenberger, C. J. · Aziz, A. ·Konen, O. · Whyte, H. · Jarrin, J. · Shroff, M. · Blaser, S. I.Hospital for Sick ChildrenToronto, ON, CANADAPURPOSETo prospectively characterize the range of abnormalitiesfound in hypoxic-ischemic encephalopathy (HIE) using highresolution ultrasound (HR US) and Doppler techniques andto compare these to MR findings.MATERIALS & METHODSUltrasound was performed in 65 neonates (16 preterm and49 term) within 2 hours of clinically indicated MR imaging.Informed consent and ethics approval were obtained. MRimaging included routine T1 and FSET2 sequences, as wellas diffusion-weighted (DW) imaging and MR spectroscopy.The US studies were performed with state of the art USmachines, optimizing images by using high-resolution transducersand Doppler techniques. Ultrasound was performedby three different pediatric radiology fellows or one US technologist,and reported with staff radiologists. The physiciansand technologist were blinded to the MR findings.Ultrasound findings were compared and correlated with theMR images in consultation with two neuroradiologists. Weused MR imaging as a gold standard and divided our cohortRESULTSFour specific features were evaluated on US. These included:peripheral and central gray scale HR US echogenicity,resistive indices, peak systolic and end diastolic velocitymeasurements, and the presence or absence of hyperemia.All 31 patients in group I, showed at least 1 US abnormalityand 3 patients in group II showed abnormal peripheral findings.Our data demonstrate that while MR imaging revealsadditional findings, HR US provides information that ismore encouraging than previously suggested. We willdemonstrate specific HR US features, such as dense sulci,juxta-cortical hyperechogenicity, hyperemia, and instabilityof resistive indices, that were particularly helpful in the evaluationof neonatal HIE related damage.CONCLUSIONOur preliminary data show that US performed by payingmeticulous attention to the US technique can show subtleabnormalities suggestive of HIE. In this way US may helptriage infants for further imaging studies with MR imaging.They may be used also to follow the clinical status of infantswho may be too unstable to transport to MR imaging or whomay be supported with equipment (ECMO) which is notcompatible with MR imaging.KEY WORDS: Ultrasound, hypoxic ischemic encephalopathyScientific Exhibit 104 (eSE)Neonatal Cranial Ultrasound: A Practical Review andPictorial EssayArch, M. E. 1 · Broderick, D. F. 1 · Zaleski, C. G. 2 · McGraw,E. M. 21Mayo Clinic, Jacksonville, FL, 2 Nemours Children’s Clinic,Jacksonville, FLPURPOSEDespite the increasing utilization of CT and MR imaging,ultrasound remains the initial diagnostic examination forevaluation of the neonatal brain. The purpose of this exhibitis to review the technique of and indications for neonatal cranialultrasound. Representative images from normal andabnormal examinations will be presented.MATERIALS & METHODSA normal examination emphasizing the requisite anatomynecessary for a complete ultrasound evaluation of the neonatalhead will be provided. Representative images of normaland abnormal examinations from current clinical cases andteaching files were selected to demonstrate important points.Scientific Exhibits
Scientific ExhibitsRESULTSTwo of the more common conditions visualized with neonatalcranial ultrasound are germinal matrix hemorrhage andperiventricular leukomalacia. Representative examples ofthe four grades of germinal matrix hemorrhage will be provided;examples of periventricular leukomalacia also will bepresented. In a tertiary hospital setting, less common abnormalitiesare frequently encountered. Examples of Vein ofGalen malformation, congenital absence of the corpus callosum,mineralizing angiopathy, Dandy-Walker malformation,holoprosenchephaly, coarctation of the lateral ventricles,venous sinus thrombosis, arachnoid cyst of the temporallobe, intrauterine infection, temporal lobe hemorrhages,abscess and a resolving hematoma are shown. Correlativeimaging with CT and MR is provided when available.CONCLUSIONThis exhibit presents a practical and concise review ofneonatal cranial ultrasound, addressing exam technique andindications, normal anatomy and representative examples ofboth common and uncommon abnormalities encountered inthe neonate.KEY WORDS: Pediatric brain, neonatal cranial ultrasoundScientific Exhibit 105Hypoxic-Ischemic and Hypoglycemic Encephalopathy:Characteristic Patterns of InjurySiepmann, D. B. · Eskey, C. J.Dartmouth Hitchcock Medical CenterLebanon, NHPURPOSEDiffuse cerebral hypoxia, ischemia and hypoglycemia leadto characteristic patterns of brain injury. This exhibit reviewsthe causes of such brain injury, the imaging findings, and thefactors which determine the pattern of injury.MATERIALS & METHODSA retrospective review of cases from several affiliated institutionswas performed and relevant scientific literaturereviewed.RESULTSNeuronal and glial injury occur rapidly when the brain isdeprived of oxygen and nutrients. The extent and patterns ofinjury are affected by the nature of nutrient deprivation (e.g.,hypoxia, hypoglycemia, ischemia), the severity and durationof the insult, and the age-dependent regional susceptibility ofneural tissue to this deprivation. Accordingly, there is substantialvariability in the pattern of injury. However, in someclinical settings, the imaging picture is distinctive and providesimportant insight into the nature of the cerebral insultand into the patient’s prognosis. We review the literatureavailable on this topic, discuss the role of imaging and thevalue of specific imaging techniques, and show illustrativeimaging examples in both pediatric and adult patients. Thesecases include perinatal asphyxia, carbon monoxide poisoning,inborn errors of metabolism, insulin overdose, drowning,and cardiac arrest.446CONCLUSIONCharacteristic patterns of hypoxic-ischemic and hypoglycemicencephalopathy reflect the type of insult and tissuesusceptibility. An understanding of these patterns allows theappropriate evaluation of such patients for prognosis andmanagement decisions.KEY WORDS: HIE, hypoxia, hypoglycemiaScientific Exhibit 106“Tumors Don’t Always Read the Textbook”:Confounding Appearances of Pediatric Posterior FossaTumorsPomerantz, S. R. 1 · Schaefer, P. W. 1 · Young-Poussaint, T. 2 ·Grant, P. E. 11Massachusetts General Hospital, Boston, MA, 2 Children’sHospital Boston, Boston, MAPURPOSEThe more common pediatric posterior fossa neoplasms,including juvenile pilocytic astrocytoma, ependymoma, andprimitive neuroectodermal tumor (medulloblastoma), oftendemonstrate characteristic imaging appearances.MATERIALS & METHODSA juvenile pilocytic astrocytoma within the posterior fossafrequently presents as a “cyst and enhancing mural nodule”within a cerebellar hemisphere. The typical medulloblastomais a midline hyperdense homogeneously enhancingmass effacing the fourth ventricle. An ependymoma commonlydemonstrates signal heterogeneity and a propensity toexpand the fourth ventricle and extend through the foraminaof Luschka and Magendie. Though not entirely sensitive orspecific, these distinguishing features, when present, allowfor a presumptive diagnosis. The presumptive diagnosisguides further evaluation and management until a definitivediagnosis is accomplished. Occasionally, an alternativetumor type may mimic one of these classic appearances, thusconfounding the differential diagnosis.RESULTSWe will review examples of pediatric posterior fossa tumorswhose imaging best exemplifies the features of their finaldiagnosis as well as several cases in which those features aremimicked by other tumors.CONCLUSIONThe imaging of these mimics will be analyzed to highlightadditional characteristics which may provide clues to thecorrect diagnosis in such challenging cases.KEY WORDS: Medulloblastoma, juvenile pilocytic astroctyoma,ependymoma
Scientific Exhibit 107Neurologic Compromise in ExtramedullaryHematopoiesisOrtiz, C. L. · Haidar, S. · Shelef, I. · Hitzler, J. K. · Olivieri,N. F. · Shroff, M. M. · Gilday, D. · Blaser, S.Hospital for Sick ChildrenToronto, ON, CANADAPURPOSEPictorial demonstration of the intracranial and intraspinalneuroimaging of involvement by extramedullaryhematopoesis.MATERIALS & METHODSThree patients were identified from the hospital radiologydata base system with CNS extramedullary hematopoesis.One patient had intracranial and paraspinal involvement and2 had para and intraspinal involvement without intracranialinvolvement. Other associated findings such as pulmonaryhemosiderosis, calcified spleen, and bony changes werepresent. Multiple diagnosis modalities such as plain film, 3DCT scan, ultrasound, MR imaging and Technetium 99 sulfurcolloid scan will be shown.RESULTSPatient 1 is an eight and a half-year-old female with myelofibrosiswho initially presented with anemia and has since thenprogressed to pancytopenia. She presented for cranial imagingdue to headaches. She is on a regular red cell transfusionprogram. CT and MR imaging as well as sulfur colloid scanwere positive for intracranial involvement of extramedullaryhematopoiesis. The other two patients had imaging documentationof intraspinal deposits of extramedullaryhematopoiesis.CONCLUSIONIntracranial extramedullary hematopoesis is rare but hasbeen reported in multiple etiologies. We show one case anddemonstrate paraspinal involvement in that case andintraspinal involvement in 2 other patients. We demonstrateCNS features and in addition, extra CNS features which maysuggest the diagnosis or confirm it.KEY WORDS: Extramedullary hematopoiesis, intracranial,intraspinal447Scientific Exhibit 108Imaging of Nerve Roots: A Pictorial EssayIfthikharuddin, S. F.Rochester General HospitalRochester, NYSpine108-115PURPOSETo review the normal anatomy and provide an overview ofthe pathologic processes affecting the nerve roots.MATERIALS & METHODSThe normal anatomy and spectrum of diseases of the nerveroots will be reviewed with the help of myelograms, 16detector CT images, and MR images. The spectrum of pathologicprocesses that affect the nerve roots will be demonstrated.RESULTSSeveral pathologic processes including inflammatory, traumatic,neoplastic, and congenital conditions afflict the nerveroots. Examples presented include arachnoiditis, metastases,neurofibromatosis, pseudomeningocele due to avulsion,charcot marie tooth disease.CONCLUSIONA practical discussion of the nerve roots can benefit the practicingradiologist in formulating a reasonable differentialdiagnosis.KEY WORDS: Spine, nerve rootsScientific Exhibit 109Nonglial Tumors and Tumor-Like Lesions of the SpinalCord: MR Features with Intraoperative and PathologicCorrelationColosimo, C. 1 · Caulo, M. 1 · Cerase, A. 2 · Di Lella, G. M. 3 ·Di Rocco, C. 3 · Maira, G. 31Institute of Radiology, Chieti, ITALY, 2 Azienda OspedalieraUniversitaria Senese, Siena, ITALY, 3 UCSC, Policlinico,Rome, ITALYScientific ExhibitsPURPOSEThe purposes of this scientific exhibit are to increase theknowledge of magnetic resonance (MR) imaging features ofnonglial tumors and tumor-like lesions of the spinal cord(including hemangioblastomas, dysembriogenetic tumors,intramedullary schwannomas, melanocytic tumors,intramedullary spinal cord metastases, cavernous malformations,and other tumors), that constitute about 40% of allspinal cord tumors and neoplasms, as well as to underscorethe possibility of a reliable presurgical diagnosis in most of
Scientific Exhibitsnonglial tumors and tumor-like lesions of the spinal cord,when MR features are correlated with clinical, and epidemiologicdata.MATERIALS & METHODSFrom a review of 140 patients with spinal cord neoplasmswith definite histologic diagnosis examined by MR imagingsince 1988, clinical and MR imaging features of 70 patientswith nonglial tumors and tumor-like lesions are presented.Eleven patients had hemangioblastomas, 14 patients had 16cavernous malformations, 20 patients had intramedullaryspinal cord metastases, 18 patients had dysembriogenetictumors, 2 patients had intramedullary schwannomas, 2patients had melanocytic tumors, and three patients withother tumors. Fifty-eight patients had been operated in thesame neurosurgical institution. In 69 patients, presurgicalgadolinium-enhanced MR imaging was available. The durationof clinical and radiologic postoperative follow-upranged from 9 months to 14 years (mean, 7.2 years).RESULTSIn the patients of hemangioblastomas, cavernous malformations,and dysembriogenetic tumors, MR features allowed areliable, and correct diagnosis. In the patients withintramedullary spinal cord metastases, only the knowledgeof the primary neoplastic lesion could allow the correct diagnosis,although the localization in the conus/epiconus wascharacteristic.CONCLUSIONIn the patients with less common tumors and tumor-likelesions, the possibility of presurgical MR diagnosis has beenless achievable.KEY WORDS: Spinal cord tumors, nonglial tumors andtumor-like lesions, MR imaging448congestion from dural AVF (n = 3), hemorrhage related toepidural catheter (n = 3), sarcoidosis (n = 2). Neoplasmsgroup (n = 28): ependymoma (n = 10), astrocytoma (n = 2),anaplastic astrocytoma (n = 1), glioblastoma multiforme (n =1), oliogodendroglioma (n = 1), metastasis (n = 11), lipoma(n = 2).CONCLUSIONNeuroimaging, particularly spine MR imaging provides preciselocalization and characterization of the spinal cordintramedullary lesions and leads to successful patient’s management.The location and neuroimaging pattern of eachgroup’s patients and clinical as well as neuropathologic findingswill be presented in this exhibit.KEY WORDS: Spine, intramedullary, lesionsScientific Exhibit 111MR Imaging of Inflammatory DemyelinatingPolyneuropathyWada, A. 1 · Imaoka, I. 1 · Matsuo, M. 1 · Kitagaki, H. 21Tenri Hospital, Tenri City Nara, JAPAN, 2 ShimaneUniversity, Izumo City, Shimane, JAPANPURPOSEGuillain-Barre syndrome (GBS) and chronic inflammatorydemyelinating polyneuropathy (CIDP) are classified inautoimmune inflammatory polyradiculoneuritis which causedemyelination of the peripheral nerves. Clinically, GBSshows transient progress, while CIDP shows chronicprogress including repeated aggravation and improvement.We present MR findings of these diseases, and the relation ofclinical symptom/therapeutic effect and image changes.Scientific Exhibit 110Spinal Cord Lesions: Neuroimaging Spectrum withClinical/Neuropathology CorrelationWang, A. · Mallesh, A. · Wilson, J. · Silbergleit, R. ·Noujaim, S.William Beaumont HospitalRoyal Oak, MIPURPOSETo assess the neuroimaging findings of a wide variety ofintramedullary spinal cord lesions and correlate with clinicaldiagnosis/neuropathology.MATERIALS & METHODSOne hundred six patients with neuroimaging findings ofintramedullary spinal cord lesions were included in thisstudy. The neuroimaging studies including spine MR imagingwith and without contrast, spine CT scan, and spinal arteriogram.RESULTSNonneoplasms group (n = 78): multiple sclerosis (n = 40),syringohydromyelia (n = 20), acute disseminatedencephalomyelitis (n = 5), ischemia/infarct (n = 5), venousMATERIALS & METHODSSpinal MR imaging was performed in 8 GBS cases (6 maleand 2 female; age range, 3-70 years) and 11CIDP cases (6male and 5 female; age range 15-76 years) with 1.5 T MRunit (Siemens, Magnetom Vision/Symphony). We collatedMR findings with clinical symptoms and electrophysiologicfindings.RESULTSSwelling and enhancement of cauda equina were commonimage findings of GBS (7/8) and CIDP (7/11). Nerve rootenhancement was recognized with ventral predominance ordiffuse, and which localization reflected motor or sensorydisturbance. This MR finding showed different progress inGBS and CIDP. After symptom improvement, nerve rootenhancement disappeared in GBS, but remained in CIDP. Ininitial MR imaging of CIDP, weak swelling and diffuse T2high signal intensity extending along the affected brachialand lumbar plexus was characteristic (10/11). This findingwas not recognized in any GBS (0/8). Especially, in CIDPpatient with long affection period, nerve plexus/peripheralnerve showed nodular swelling and reflected regression.Nodular swelling seemed to reflect chronic change (remyelination).These MR findings remained after symptomimprovement and were not valuable for evaluation of therapeuticeffect. On nerve conduction velocity study (NCVS),improvement of conduction block and conduction velocity
drop related to the symptom improvement. For evaluation oftherapeutic effect in CIDP, NCVS was more useful than MRimaging.CONCLUSIONClinically, GBS and CIDP may show similar clinical symptomsat their early stage. MR imaging shows characteristicfinding in these diseases, and is a useful tool to distinguishGBS from CIDP at early stage.KEY WORDS: Polyneuropathy, Guillain-Barre syndrome,CIDPScientific Exhibit 112Spinal Cord PseudoneoplasmsAnaya, C. A. 1 · Falcone, S. 2 · Rossi, P. 11Jackson Memorial Hospital/University of Miami, Miami,FL, 2 University of Miami MRI Center, Miami, FLWhen evaluating the MR images of a patient with a spinalcord lesion differentiation between neoplasms and tumoralmimics is not always easy. A wide variety of spinal cordlesions (demyelinating diseases, infections, inflammatorydiseases, infarctions, vascular malformations, toxic/metabolicdisorders) may simulate a cord neoplasm. It is the primaryrole of the radiologist to narrow the differential diagnosisguided by the patient history and the imaging features of thelesion. Pseudoneoplasms are those nonneoplastic conditionsthat may lead to enlargement, abnormal signal, or enhancementin the spinal cord. Lack of cord enlargement usuallyexcludes a neoplasm. The distinction between neoplasm andpseudoneoplasm is more difficult when cord enlargement ispresent. Additional imaging such as brain MR imaging isoften helpful in narrowing the differential diagnosis, andselected cases may benefit from spinal MR angiography toidentify abnormal intradural vessels. In this exhibit we presentseveral cases with nonneoplastic cord lesions that simulatecord tumors and we highlight the ancillary imaging findingsthat may contribute in making the distinction449MATERIALS & METHODSTwenty-three patients with 34 vertebral compression fracturesdue to osteoporosis, and 3 patients with 3 metastaticcompression fractures were studied. The areas with vertebrallesions were classified into 4 patterns based on MR findings:1) diffuse contrast-enhancing (CE) area (edema or inflammation);2) cleft sign; 3) nonenhancing (NE) area (probablydue to osteonecrosis); 4) metastatic tumors. Based on MRfindings, 34 osteoporotic fractures were divided into 4 types:Type1: CE area only; Type 2: CE area + cleft; Type 3: CEarea + NE area; Type 4: CE area + NE area + cleft. The distributionof injected cement was classified into 3 patternsbased on post-PVP CT and plain radiographs: 1) trabecularpattern; 2) solid pattern; 3) mixed pattern (trabecular andsolid patterns mix). MR findings were correlated with distributionpatterns of injected cement.RESULTSAll of type 1 fractures showed the trabecular pattern. All oftype 2, type 3, and type 4 fractures showed the solid ormixed patterns, except for one type 2 fracture. All metastaticfractures showed the solid or mixed patterns. One patientwho had type 3 fracture at Th12 showed only moderate painimprovement after injection of cement into CE area on firstPVP procedure. Additional cement injection within the NEarea on second procedure made remarkable improvement.CONCLUSIONCement distribution patterns on PVP can be predicted fromMR findings. Contrast-enhanced MR in addition to T1- andT2-weighted imaging is important to detect cleft orosteonecrosis, in which cement fills in a similar solid distributionpattern. Sufficient filling of those portions may beimportant for optimal pain control.KEY WORDS: Vertebroplasty, MR imaging, cementScientific Exhibit 114Complications of Anterior Neck Surgery/Instrumentation for Cervical Disks and SpondylosisScientific ExhibitsKEY WORDS: Cord, pseudoneoplasm, neoplasmScientific Exhibit 113MR Findings of Acute Vertebral Compression Fractures:Correlation with Cement Distribution Patterns onPercutaneous VertebroplastyOka, M. · Matsusako, M. · Kobayashi, N. · Uemura, A. ·Numaguchi, Y.St. Luke International HospitalTokyo, JAPANPURPOSEWe described MR findings of acute vertebral compressionfractures and correlated those with the distribution patternsof injected cement on percutaneous vertebroplasty (PVP).We performed contrast-enhanced MR imaging in addition toT1- and T2-weighted imaging to classify the vertebrallesions.Lee, B. C. · Naidich, T. P. · Som, P. S. · Delman, B. N. ·Choudhri, T. · Jenkins, A. L.Mount Sinai Medical CenterNew York, NYPURPOSEThe purpose of this study was to evaluate the incidence, clinicalcourse, and imaging appearance of complications ofanterior neck surgery for cervical spondylosis and disk disease.MATERIALS & METHODSRetrospective review of the anterior cervical surgeries performedduring the period 2001-2003 disclosed 30 patientswith major or minor postoperative difficulties affecting thespine and anterior neck. The clinical courses and imagingstudies (CT and MR imaging) of these patients formed thestudy material.
RESULTSThe 30 patients represent approximately 8% of the anteriorcervical surgeries performed during the study period. Thedifficulties observed included suboptimal placement ofscrews and plates (7), migrated screws and plates (5),migrated cages and strut grafts (5), infection of the spine (2),infection of the anterior neck (2), hematomas (2), dysphagia(3), esophygeal perforation (1), and vocal cord paralyses (3).This experience led to a protocol for evaluating the recentlyoperated and the remotely operated patient, and has given usan improved understanding of the imaging manifestations ofthese complications.450Scientific ExhibitsCONCLUSIONComplications of anterior cervical surgery for spondylosisand disk disease are relatively frequent. Imaging studies helpto detect and characterize them, particularly when patientsare followed by established protocols.KEY WORDS: Spinal surgery complications, spine cervical,spinal instrumentation cervicalScientific Exhibit 115Angiography CT vs Conventional CT in the Evaluationof Cervical Spine TraumaParkey, J. · Yang, L. · Perez, C. L. · Anderson, J. · Lane, T. ·McAnulty, A. · Chason, D. P.University of Texas Southwestern Medical CenterDallas, TXPURPOSETo demonstrate the clinical utility of angiography CT (ACT)for the evaluation of the bony cervical spine in the traumapatient.MATERIALS & METHODSAngiography CT scans of the cervical spine were acquired inmultitrauma patients undergoing emergent cerebral/cervicalangiography using rotational angiography sequences with orwithout contrast. Postprocessing and review of the cervicalspine in standard orthogonal planes was performed on a 3Dworkstation. Comparison was made with conventional CTincluding sagittal and coronal reconstructions.RESULTSAngiography CT demonstrates fractures of the cervical spineequal to that of conventional CT. Although the evaluation ofthe soft tissues is limited, the ability of ACT to be acquiredduring angiography may obviate the need for conventionalCT in patients with multiple traumatic injuries who requireemergent angiography.CONCLUSIONAngiography CT provides a fast, accurate, and novel way toassess bony cervical spine pathology in a multitraumaticpatient and may preclude the need for conventional CT incertain clinical situations.KEY WORDS: Cervical spine, trauma, CT
Computer AssistedExhibits 1-40Exhibit Hall 4B (Level 4)Monday, June 76:00 PM – 9:00 PMTuesday, June 8 - Thursday, June 106:30 AM - 9:00 PMFriday, June 116:30 AM – 11:45 AMNOTE: Unless otherwise indicated, all ComputerAssisted Exhibits can be viewed from any computer.A missing Computer Assisted Exhibit number indicatesan astract has been withdrawn.Adult Brain1-15Computer Assisted Exhibit 1Physiology of Cerebral Perfusion AutoregulatoryMechanisms and their Evaluation with State-of-the-ArtNeuroradiologic ImagingRadaideh, M. M. 1 · Walker, M. T. 1 · Curtin, K. R. 1 · Carroll,T. J. 1 · Shaibani, A. S. 1 · Derdeyn, C. P. 2 · Russell, E. J. 11Northwestern University, Chicago, IL, 2 MallinckrodtInstitute of Radiology, St. Louis, MOPURPOSEThe purpose of this computer-assisted educational exhibit is:1) To discuss the physiology of cerebral perfusion autoregulatorymechanisms and demonstrate how they are independentand not interchangeable. 2) To discuss the responses ofthe brain to altered cerebral perfusion and explore the changethat occurs in acute and chronic steno-occlusive cerebrovasculardisease. 3) To examine the different physiologic rationalesfor current state-of-the-art imaging of cerebral hemodynamicsand to review some of the literature correlatingthese methods. 4) To critically examine the association ofthese different manifestations of hemodynamic impairmentwith stroke risk. 5) To demonstrate current clinical applicationsof MR perfusion (MRP) and CT perfusion (CTP) in thesetting of acute and chronic steno-occlusive disease.MATERIALS & METHODSPhysiologic imaging tools have provided an in vivo windowfor the study of central nervous system perfusion andautoregulation, particularly in the areas of acute and chroniccerebral steno-occlusive disease. A variety of imaging techniqueshave been developed for the indirect assessment ofcerebral hemodynamic status. Understanding the principlesof cerebral perfusion and autoregulation are critical for the451accurate interpretation of MRP and CTP studies. In thisexhibit we will review normal cerebral perfusion, the differentphysiologic arms of cerebral hemodynamic autoregulatorymechanisms and describe the changes that occur in acuteand chronic steno-occlusive disease. We will use illustrationsand flowcharts to streamline the understanding of these principles.This knowledge then will be applied to describe andunderstand MRP, CTP, and diamox stress perfusion studies.Clinical MRP and CTP cases will be used to demonstratesome of these aspects.RESULTSBy the end of this exhibit the reader should understand normalcerebral perfusion and will be familiar with the threearms of cerebral perfusion and autoregulation: the vasodilatorymechanism, the capillary capacitance mechanism, andO2 extraction regulation. The user also will understand theindependence of these factors and how they are manifestedin acute and chronic steno-occlusive cerebrovascular disease.Examples of altered cerebral perfusion, employingimaging modalities including MRP and CTP, illustrate theseprinciples.CONCLUSIONImportant dynamic physiologic processes involving thecerebrovascular system can be studied using a variety ofnoninvasive imaging tools including MRP and CTP. Thesetools have broadened our understanding of the pathophysiologyof disorders of the central nervous system, particularlyischemia. Armed with this new understanding, novel diagnosticand therapeutic algorithms are evolving that integratethese powerful tools and improve patient care.REFERENCES1. Barnett HJM. Hemodynamic Cerebral Ischemia: An Appealfor Systematic Data Gathering Prior to a New EC/IC Trial.Stroke 1997;28:1857-18602. Powers WJ. Cerebral Hemodynamics in IschemicCerebrovascular Disease. Ann Neurol 1991;29:231-2403. Derdeyn CP, Grubb Jr RL, Powers WJ. CerebralHemodynamic Impairment: Methods of Measurement andAssociation with Stroke Risk. Neurology 1999;251-259KEY WORDS: Cerebral autoregulation, cerebral hemodynamics,brainComputer Assisted Exhibit 2 Moved to POSTER 13AFeasibility for Population-Based MR AngiographyScreening for Unruptured Intracranial Aneurysms:Initial Results from the Northern Manhattan StudyDumitriu, D. · Lin, E. · Chao, K. · Lignelli, A. · DeLaPaz,R. · Brown, T. · Sacco, R. · Pile-Spellman, J.Columbia UniversityNew York, NYPURPOSETo assess the prevalence of unruptured intracranialaneurysms (UIAs) in the population by MR angiography(MRA) screening in a prospective, randomly derived communitypopulation. Although the prevalence of UIAs isunknown, estimates in the general population range from0.2% to 5%. Estimates for UIAs in the elderly populationComputer Assisted Exhibits
452based on prospective, randomly derived screening do not Computer Assisted Exhibit 3exist. Such a screening has not been undertaken as of today,owing to its inherent challenges, especially in the form ofProgressive Venous Sinus Thrombosis Demonstratedvarious threats to validity. True incidence of UIA is needed with Auto-Triggered Elliptic Centric-Ordered MRfor planning of clinical trials for UIA treatment.VenographyComputer Assisted ExhibitsMATERIALS & METHODSParticipants in the Northern Manhattan Study, a prospective,randomly derived, population-based community cohort,received an MRA using a 1.5 T scanner (pulse sequenceacquisition of 3DI-MRA, TE/TR 2.7/20 ms, FOV 150 x 150,flip 25º, resolution 228/512). Source images were postprocessedin an Easy Vision (Philips Medical System) andviewed as 3D MIPs. Two radiologists read each MRA independentlyand their findings are compared. For eachaneurysm found, the location and size was documented. Inaddition, the reviewer rated the likelihood of having diagnosedthe aneurysm correctly according to the followingscale: low likelihood (likely infundibulum, possiblyaneurysm), moderate likelihood (likely aneurysm, less likelyinfundibulum), high likelihood (very likely aneurysm) anddefinite aneurysm.RESULTSOne hundred twenty-four subjects have received an MRA todate. (Approximately 1400 subjects are projected to beimaged over the next 5 years). The 84 MRAs that were readby two independent reviewers were performed on subjectsranging between 57 and 97 years of age (mean 73, median73) of which 42 (50%) were males; 26 (31%) subjects identifiedthemselves as white, 30 (36%) as black, 21 (25%) asHispanic, and 7 (8%) as other. The crude prevalence of anypossible UIA was 11% for reviewer 1 and 12% for reviewer2. Reviewer 1 found 5 (6%) UIAs rated low likelihood and 4(5%) UIAs rated moderate likelihood. Reviewer 2 found 8(10%) UIAs rated low likelihood and 2 (2%) UIAs ratedmoderate likelihood. All documented UIAs were less than orequal to 4 mm and no aneurysms were rated high likelihoodor definite. Interrater agreement was 23% as determined bykappa test.CONCLUSIONAccording to our preliminary findings, the prevalence ofUIAs in the general population is somewhat higher than previouslyreported. However, confidence in assessing ananeurysm below 5 mm appears to be limited using MRA, asreflected both by the reviewers’ self-reported likelihood ofdiagnosis and the low interrater agreement. Strategies arebeing explored to increase interrater agreement.KEY WORDS: Aneurysm, MR angiography, screeningSouza, M. P. S. · Farb, R. I. · Wennberg, R. · Wu, R. · Agid,R.University of TorontoToronto, ON, CANADAPURPOSEAuto-triggered elliptic centric-ordered MR venography(ATECO MRV) has been shown to be superior for visualizationof the intracranial venous system. We present a case ofdural venous sinus thrombosis in a 28-year-old male withBehçet’s disease. The progression of the intracranial venousthrombosis is seen clearly in multiple subsequent ATECOMRV studies. Three-dimensional tools available in this MRtechnique were extremely important in helping to visualizethese abnormalities.MATERIALS & METHODSThe ATECO MRV performed on admission showed anextensive thrombus within the superior sagittal sinus andboth transverse sinuses. Part of this thrombus appeared to beacute, and part subacute. Intravenous anticoagulation(heparin) was initiated. A second ATECO MRV was performedafter the occurrence of a seizure, and it showed theprogression of the clot in the left sigmoid sinus (acute extensionof the clot). The third ATECO MRV performed afterclinical deterioration despite medical therapy showed progressionof sinovenous thrombosis with occlusion of the petrosaland straight sinuses and retrograde flow throughenlarged superior ophthalmic veins (SOV). MR imaging ofthe brain at this time also showed venous congestiveencephalopathy. Heparin-induced thrombocytopenia (HIT)was diagnosed eventually and alternative anticoagulant therapywas established. The fourth MR examination includingATECO MRV demonstrated improvement in the appearanceof the brain as well as diminished retrograde flow throughthe SOV.RESULTSIn this patient, the progression and regression of the duralsinus thrombosis were demonstrated with details, helping todetect complications and to choose an adequate management.CONCLUSIONThe ATECO MRV is a precise noninvasive diagnosticmethod that helps to visualize the intracranial dural sinuses.KEY WORDS: Dural venous sinus, thrombosis, MR imaging
Computer Assisted Exhibit 4StrokeCheck: A Community Education and ScreeningProgram. Results from 2001-<strong>2004</strong>Agran, S. D.Sun City ImagingScottsdale, AZ453CONCLUSIONDiffusion-weighted MR imaging can predict successfully theevolutive course of brain edema at acute setting in thesepatients. Our findings indicate that brain edema is vasogenic,thus supporting cerebral microvascular dilatation as the principalpathophysiologic mechanism of brain edema ineclampsia/severe preeclampsia. Ischemic/cytotoxic edemacould be observed less commonly, however.This video and audio presentation will take you step-by-stepthrough what a StrokeCheck education and screening programentails, and how you can host a StrokeCheck programin your hospital. A videoclip of an actual StrokeCheckscreening will be viewedKEY WORDS: StrokeCheck, education, strokeComputer Assisted Exhibit 5Diffusion Imaging: A New Clinical Tool in EclampsiaLoureiro, R. C. S. 1 · Cartaxo, H. Q. 1 · Kahhale, K. 2 · Leite,C. C. 2 · Alves, E. A. 2 · Borba, P. 2 · Zugaib, M. 21Real Hospital Portugues em Pernambuco, Recife,Pernambuco, BRAZIL, 2 University of Sao Paulo MedicalSchool, Sao Paulo, BRAZILPURPOSETo validate diffusion-weighted MR imaging in predicting theevolutive course of brain edema, and to establish its pathophysiologyin patients with eclampsia/severe preeclampsia.MATERIALS & METHODSTwenty-seven patients with clinical diagnosis of eclampsia/severepreeclampsia and T2 hyperintense brain lesions atroutine MR imaging were evaluated at hospital admissionand 8 weeks later either on a per patient and per anatomicallocation basis.RESULTSFor per patient analysis, the sensitivity, specificity, positiveand negative predictive values, and accuracy of diffusionweightedMR imaging were 100% (95% CI: 82%, 100%),60% (95% CI: 17%, 93%), 92% (95% CI: 72%, 99%), 100%(95% CI: 83%, 100%), and 93% (95% CI: 74%, 99%),respectively. For per anatomical location analysis, the sensitivity,specificity, positive and negative predictive values,and accuracy of diffusion-weighted MR imaging were 100%(95% CI: 95%, 100%), 67% (95% CI: 24%, 94%), 98%(95% CI: 91%, 100%), 100% (95% CI: 95%, 100%), and98% (95% CI: 92%, 100%), respectively. There was closeagreement between diffusion-weighted MR imaging and follow-upMR imaging in the prediction of reversible brainlesion either on a per patient (k value, 0.71) and per anatomicallocation basis (k value, 0.79). Diffusion-weighted MRimaging demonstrated significant increase of water mobilityin abnormal regions when compared to normal appearingbrain in patients of reversible group (1.34 ± 0.10 vs 0.79 ±0.08 mm 2/s ˘ 10-3 ; P < 0.001). In the irreversible group, therewas restricted water diffusion, consistent with cytotoxicedema and early brain infarction in three of five patients.KEY WORDS: Diffusion, eclampsia, MR imagingComputer Assisted Exhibit 6Functional Anatomy of the Basal GangliaSalamon, N. · Salamon, G. M.David Geffen School of Medicine at the University ofCalifornia Los AngelesLos Angeles, CAPURPOSEThis is a learning tool for the anatomy of the basal ganglia tounderstand morphology of the basal ganglia and the connectionto the different parts of the cortex.MATERIALS & METHODSThe presentation is divided into three parts. Part one presentsthe morphologic and functional anatomy of the basal ganglia.Axial, coronal, and sagittal MR images are demonstratedcompared to the anatomical specimen. Part two is the vascularanatomy of the basal ganglia. Part three shows clinicalcases of the basal ganglia. The variety of disease seen inbasal ganglia is presented, including tumor, ischemia, hemorrhage,infection, metabolic or degenerative disease includingWilson’s disease, mitochondrial disease, and multisystematrophy. Clinical symptoms of each case and MR findingswill be correlated.RESULTSThe interactive program helps the viewer to understand notonly the morphology and vascularization of these structures,but also the functional connection of the basal ganglia.CONCLUSIONThis presentation will be a useful tool to understand theanatomy and functional connection of the basal ganglia.KEY WORDS: Anatomy, basal gangliaComputer Assisted Exhibits
Computer Assisted Exhibits454Computer Assisted Exhibit 7Computer Assisted Exhibit 8High-Resolution Structural Findings, with Global and Separate Quantification of Lactate and Lipid inRegional Spectroscopic and Diffusion Tensor Imaging Treatment-Naive High-Grade Gliomas Using Three-Changes, in Pretransplant Hepatic Encephalopathy: A 3 Dimensional MR SpectroscopyT MR StudySadarangani, P. A. · Li, X. · Cha, S. · Nelson, S. J.O’Tuama, L. A. · Fatouros, P. · Stringer, W. · Baykal, A. ·Halvorsen, R. A.Virginia Commonwealth University Health System/MedicalCollege of Virginia HospitalsRichmond, VAPURPOSETo evaluate structural and functional brain changes in prehepatictransplant patients, and consider how they relate todisease pathogenesis.MATERIALS & METHODSa) MR imaging - A 3 T study, to include pre and postcontrastaxial and coronal T1, fast spin-echo (FSE) T2, fast fluidattenuatedinversion-recovery (FLAIR) (TR = 6000 ms, TI =1800 ms) and diffusion tensor imaging (DTI), providing fulltensor mapping. b) MR spectroscopy - Single voxel and multivoxelregions of interest (ROI) were placed on normalappearing white matter (WM) within corona radiata in leftparietal lobe, and abutting left cingulate gyrus.RESULTSMR imaging: focal T1- and T2-weighted hyperintensities,involving bilateral globus pallidus, and subthalamic nuclei,were demonstrated; in difffusion-weighted imaging no grossabnormalities were observed. Quantitative global DTI data:ADC increased = (10 - 3 mm 2 /s): 0.85 vs 0.77 ± 0.2 for normal.FA decreased = 0.20 vs 0.24 ± 0.01 for normal; similarchanges were obtained from ROI analysis in the globus pallidus(GP). MR spectroscopy: Subcortical WM voxel placedin left parietal lobe, and abutting left cingulate gyrus:myoinositol = absent; choline decreased; glutamate plus glutamineincreased.CONCLUSIONThe present study combines high-field MR imaging withMR spectroscopy and diffusion tensor imaging data to show:1. Generalized and regional structural and functional abnormalities.Structural changes include basal ganglia SI changesas described previously. 2. ADC data indicate both regionaland global increases reflecting cerebral edema. 3. FA dataindicate both regional and global decreases consistent withfiber destruction. 4. MR spectroscopy changes indicatemarked, selective changes in neurometabolites, occurring instructurally normal appearing WM brain parenchyma consistentwith expected hyperammonemia and resulting osmolaritychanges, or related neurometabolic defects. Furtherstudy is planned a) to characterize these changes in an additionalsample of hepatic encephalopathy patients; b) to evaluatetheir evolution correlated with posttreatment outcome.KEY WORDS: Hepatic encephalopathy, neurometabolic, 3 TUniversity of California San FranciscoSan Francisco, CAPURPOSELactate and lipid are thought to be sensitive markers of tissuehypoxia and necrosis, respectively, and may thereforeaid in assessing tumor grade and response to radiation therapyin gliomas. However, separate identification and quantificationof lactate and lipid using proton (1H) MR spectroscopic(MRS) imaging has been difficult due to their closeresonance. The purpose of this study was to use a new 1HMRS method to separately quantify levels of lactate andlipid in newly diagnosed glioma patients.MATERIALS & METHODSFourteen untreated glioma patients (6 grade IIIs and 8 gradeIVs) were studied prior to surgery. All patients underwenteither subtotal or gross total resection. The protocol consistedof conventional MR imaging followed by 3D J-differencelactate-edited MRS using a point resolved spectral selection(PRESS) volume selection technique that incorporated atwo-cycle band selective inversion with gradient dephasing(BASING) pulse previously developed in our laboratory (1).Levels of lipid (lip) and lactate (lac) were quantified automaticallyusing software developed in-house (2). Twoparameters were used to compare between grades: maximumlip/lac (as given by the peak heights), and the number of voxelswith significant levels of lip/lac (denoted lip+ or lac+voxels). Only peaks with a height greater than four times thestandard deviation of noise were considered significant.Nonparametric Wilcoxon rank tests were performed with asignificance threshold of p < 0.05 to test differences betweengrades.RESULTSLipid: All grade IVs and 3/6 grade IIIs showed lipid. Themaximum lip ranged from 3.16 to 9.24 in grade IIIs and from7.08 to 42.97 in grade IVs, with median values of 4.73 and15.14, respectively. The number of lip+ voxels ranged from0 to 11 in grade IIIs and from 5 to 64 in grade IVs, withmedian values of 0.5 and 19, respectively. The differencebetween grades in both parameters was significant (p =0.0127 and p = 0.0078, respectively). Lactate: All grade IVsand 5/6 grade IIIs showed lacate. The maximum lac rangedfrom 3.88 to 51.54 in grade IIIs and from 4.73 to 19.37 ingrade IVs, with median values of 4.94 and 11.32, respectively.The number of lac+ voxels ranged from 0 to 26 ingrade IIIs and from 4 to 53 in grade IVs, with median valuesof 4.5 and 14.5, respectively.CONCLUSIONOur preliminary data suggest that mobile lipid may reliablydifferentiate grade IV from grade III gliomas. Although lactatewas present in both grades, the amount was significantlyhigher in grade IVs. Future studies will investigatewhether quantitative analysis of lipid and lactate can predicttumor grading and assess response to radiation therapy.
455REFERENCES1. Star-Lack J, Spielman, et al. In vivo Lactate Editing withSimultaneous Detection of Choline, Creatine, NAA, andLipid Singlets at 1.5 T Using PRESS Excitation withApplications to the Study of Brain and Head and NeckTumors. J Magn Reson 1998;133:243-2542. Nelson, SJ. Analysis of Volume MRI and MR SpectroscopicImaging Data for the Evaluation of Patients with BrainTumors. Magn Reson Med 2001;46(2):228-239KEY WORDS: Proton spectroscopy, glioma, lactateComputer Assisted Exhibit 9Review of Rim-Enhancing LesionsMallesh, A. 1 · Wang, A. 1 · Silbergheit, R. 2 · Noujaim, S. E. 21William Beaumont Hospital, Royal Oak, MI, 2 WilliamBeaumont Hospital, Troy, MI.PURPOSETo discuss and compare the various etiologies of rimenhancinglesions on CT and MR imaging.MATERIALS & METHODSFifteen patients studied underwent pre and postcontrastimaging and MR imaging with conventional T1- and T2-weighted spin-echo and gadolinium-enhanced T1-weightedand susceptibility-sensitive gradient-echo (GRE) sequences.The results were biopsy/autopsy proven.RESULTSA spectrum of pathology including metastatic lesions,abscesses, cryptococcosis, chronic hematoma, lymphoma,vascular malformations, and granulomatous diseases likeTB, demyelinating diseases like MS, show rim enhancement,a few of them showing a predilection for specific locations.CONCLUSIONRim enhancement is seen in a variety of pathologic conditionsand it is important to know the differential diagnosis.KEY WORDS: Rim enhancement, metastatic lesions, infectionComputer Assisted Exhibit 10Registration Engine: Integrating AutomatedCoregistration of Serial MR Imaging into the ClinicalWorkflowButman, J. A. 1 · Solomon, J. 21Warren G. Magnuson Clinical Center, National Institutes ofHealth, Bethesda, MD, 2 Sensor Systems Inc., Sterling, VAPURPOSEComparison of serial MR studies is facilitated when the studiesare coregistered. We demonstrate an automated systemfor performing coregistration on 3D volumetric data so thatcoregistered studies are available for review on PACS in aclinically timely manner.MATERIALS & METHODSThree-dimensional postcontrast T1-weighted images of thebrain were obtained at 1.5 T using a quadrature head coil.Sequence parameters were components of the registrationengine and include: 1) Unix workstation, 2) MEDx software,3) Brain template and local archive of prior studies, and 4)Network interface to scanners and PACS archive.RESULTSA brief description of the system configuration is as follows.Briefly, MEDx acts as a DICOM catcher on the workstation.A shell script polls for incoming data. Arrival of a new studytriggers the engine to search for prior brain volumes on thatpatient. If a prior study is identified, MEDx invokes an automatedregistration algorithm (FLIRT) to coregister andresection the new data to match the prior. These resectioneddata are stored on the local archive. In addition, the resectioneddata are given a new study description and sent as anew DICOM study to PACS where it is available for clinicalreview. No user interaction is required. If no prior scan isavailable on a patient, the initial study is sectioned to matcha template atlas brain to standardize viewing planes forfuture studies.CONCLUSIONIt is clear that coregistration of brain data facilitates the interpretationof serial studies, particularly in identifying intervalchange in tumor size. Here we demonstrate the feasibility ofa fully automated “registration engine” which generatedcoregistered data sets for review on clinical workstations.Not only does this facilitate clinical interpretation, but it providesa reliable foundation for performing tumor measurementsin clinical protocols and a database for the developmentfor more sophisticated analyses such as tumor volumetryand 4D segmentation.KEY WORDS: Registration, neoplasm, segmentationThe authors of this work have indicated the following affiliations/disclosures:Sensor Systems, Inc.: Employee.Computer Assisted Exhibit 12 (view only at Computer 21)Two- and Three-Dimensional Atlas of Brain AnatomyNowinski, W. L. · Thirunavuukarasuu, A.Institute for Infocomm ResearchSingapore, SINGAPOREPURPOSEThe purpose of this work is to develop a computer applicationfor efficient neuroanatomical education. Today’s neuroanatomicaleducation is mainly two-dimensional (2D).There are also several tools which provide three-dimensional(3D) anatomical models. Using either of these approachesalone is effective. Suitable tools are necessary that combineboth 2D and 3D images and/or models, and use them simultaneouslyto study neuroanatomy.MATERIALS & METHODSAn electronic 2D brain atlas was constructed based on theTalairach-Tournoux print brain atlas (4) [as demonstrated byus at <strong>ASNR</strong> 2001 (2)]. The original material was enhancedComputer Assisted Exhibits
Computer Assisted Exhibitsand extended, and the electronic atlas was fully color-codedand labeled with subcortical structures, gyri, andBrodmann’s areas. The 2D atlas was registered with a highresolutionMR dataset and a user-friendly tool was built previouslyfor 2D atlas exploration (3). A 3D brain atlas wasconstructed (1) derived from the 2D electronic Talairach-Tournoux atlas. Both 2D and 3D atlases are put in spatialregistration. An interactive computer application is developedfor navigation between the 2D axial, coronal, and sagittalatlas-MR imaging and 3D atlas. Interactive labeling of2D and 3D cerebral structures is provided.RESULTSA user-friendly application has been developed for explorationof anatomical structures in 2D and 3D. It contains onemain and three reference windows to explore the data andatlas on the orthogonal triplanar and in 3D. The applicationis developed using Macromedia as an authoring tool and itruns on a standard personal computer. Tools for interactivemanipulation of anatomical structures have been developedincluding rotation, zooming, panning, animation, and structureselection. In addition, tools for interactive querying ofstructures in the 2D and 3D images or alternatively in theanatomical index are provided. The 3D image also can belabeled interactively with numerous names placed permanentlyin the image and the labeled image can be saved in anexternal file. The application operates in two modes: 2D and3D. In the 2D mode, the user can explore the atlas imagessimultaneously on axial, coronal, and sagittal plane, and theselected structure of interest is displayed in 3D. In the 3Dmode, the 3D structures are explored with an additional displayof a 2D orthogonal plane crossing the 3D cerebral models.CONCLUSIONThis application facilitates the study and exploration of 2Dcerebral structures in correlation to 3D cerebral structures. Italso allows the user to explore 3D structures individually aswell as to browse 2D cerebral structures on the triplanarformed by axial, coronal, and sagittal orientations. This userfriendlyand affordable application is useful for both medicalstudents to study neuroanatomy and educators to prepareteaching materials.REFERENCES1. Nowinski WL, et al. Multiple Brain Atlas Database and Atlas-Based Neuroimaging System. Comput Aided Surg1997;2(1):42-662. Nowinski WL, et al Web-Based Atlas for Neuroradiology.<strong>ASNR</strong> <strong>Proceedings</strong> 2001:5003. Nowinski WL, Thirunavuukarasuu A, Bryan RN. The CerefyAtlas of Brain Anatomy. Thieme, 20024. Talairach J, Tournoux P. Co-Planar Stereotactic Atlas of theHuman Brain. Thieme, 1988456Computer Assisted Exhibit 13 (view only at Computer 21)Three-Dimensional Atlas of Brain Anatomy andVasculatureNowinski, W. L. · Thirunavuukarasuu, A. · Baimouratov, R.· Volkov, I. · Huang, S.Institute for Infocomm ResearchSingapore, SINGAPOREPURPOSEThe purpose of this work is to develop an application runningon a standard personal computer which will facilitateunderstanding of three-dimensional (3D) spatial relationshipsbetween cerebral vasculature and anatomical structures.An additional objective is to study and rapidly exploreindividual anatomical structures and/or vascular segments in3D.MATERIALS & METHODSA deformable 3D anatomical brain atlas with subcorticalstructures (1) was constructed from a two-dimensional (2D)electronic brain atlas. The 2D electronic brain atlas [whoseweb-based version was demonstrated at the <strong>ASNR</strong> 2001 (2,3)] is fully segmented and labeled. It was derived from theTalairach-Tournoux print brain atlas (4) by its digitization,enhancements, and extensions. An anatomical index is constructedand all 3D structures are labeled with their anatomicalnames. A deformable vascular atlas of cerebral arterieshas been constructed from MR angiography (MRA). A new,efficient vascular modeling technique has been developed toprovide smooth 3D display and efficient manipulation ofvessels. A vascular index is constructed based onTerminologia Anatomica and all vascular segments arelabeled with their names. The anatomical and vascularatlases have been coregistered spatially.RESULTSA user-friendly application has been developed for explorationof the combined anatomical-vascular atlas. The applicationis developed using Macromedia as an authoring tooland it runs on a standard personal computer. Tools for interactivemanipulation of anatomical structures and vascularsegments have been developed including rotation, zooming,panning, animation, and structure selection (of all or individualstructures/segments). In addition, tools for interactivequerying of structures and vessels in the 3D image or, alternatively,in the anatomical and vascular indices are provided.The 3D image also can be labeled interactively with numerousnames placed permanently in the image and the labeledimage can be saved in an external file.KEY WORDS: Brain atlas, MR imaging, 3D
CONCLUSIONThe 3D anatomical-vascular brain atlas is a user-friendly andaffordable tool facilitating to understand 3D cerebral vasculaturein correlation to 3D anatomical structures. It also facilitatesstudying and rapidly exploring of individual anatomicalstructures and vascular segments. This user-friendly andaffordable atlas is suitable for both medical students andeducators.457inlet boundary condition, a typical pulsatile blood velocity ofmiddle cerebral artery (mean: 60 cm/s) measured with transcranialDoppler was used in all aneurysms. The magnitudeand distribution of wall shear stress (WSS) were obtainedfrom the calculated data, and compared between aneurysmwall and normal wall. The flow structure in and around theaneurysms was visualized to recognize how the blood flowacts on the aneurysm wall.REFERENCES1. Nowinski WL, et al. Multiple Brain Atlas Database and Atlas-Based Neuroimaging System. Comput Aided Surg1997;2(1):42-662. Nowinski WL, et al. Web-Based Atlas for Neuroradiology.<strong>Proceedings</strong> <strong>ASNR</strong> 2001:5003. Nowinski WL, Belov D. The Cerefy Neuroradiology Atlas: ATalairach-Tournoux Atlas-Based Tool for Analysis ofNeuroimages Available over the Internet. NeuroImage2003;20(1);50-574. Talairach J, Tournoux P. Co-Planar Stereotactic Atlas of theHuman Brain. Thieme, Stuttgart - New York;1988KEY WORDS: Electronic brain atlas, vascular atlas, anatomicalatlasComputer Assisted Exhibit 14Hemodynamic Imaging of Cerebral AneurysmsShojima, M. 1 · Takagi, K. 2 · Oshima, M. 1 · Morita, A. 1 ·Kirino, T. 11The University of Tokyo, Tokyo, JAPAN, 2TeikyoUniversity, Tokyo, JAPANPURPOSEHemodynamic forces play an important factor in the initiation,progression, and rupture of cerebral aneurysms.Recently, visualization of hemodynamic forces on cerebralaneurysms has been achieved via computational fluiddynamics (CFD) method, but technical difficulties in creating3D aneurysm models and postprocessing the calculateddata is preventing analyzing multiple cases. We developedan efficient system to creating image-based 3D aneurysmmodels and accessing the calculated data, and present ourmethods and results.WithdrawnMATERIALS & METHODSAmong 42 middle cerebral aneurysms detected by 3D CTangiography, 20 aneurysms with high image quality wereselected for this study. Rough 3D models were first constructedusing Fly-through mode of Alatoview (Toshiba,Japan). These data were exported from Alatoview with an inhousesoftware, and the models were refined with our inhousesmoothing application based on the Taubin’s meshsmoothing algorithm and the Garland’s mesh simplificationalgorithm. After refining and trimming of a model, an intersectingplane between normal wall and aneurysm wall wasmade with a 3D CG software. This procedure alleviates thepostprocessing the calculated data. Computational fluiddynamics simulations were performed by using our in-housefinite element solver under governing equations of mass conservationand Navie-Stokes. Blood was supposed asNewtonian fluid with dynamic viscosity of 0.04 m2/s. Vesselwall was assumed as a rigid wall with no slip condition. ForRESULTSIt was the systolic phase that WSS acted maximally onaneurysm and normal wall. Maximal WSS in the calculatedregion that was averaged in 20 aneurysms was 143.9 ± 62.1dyne/cm2, which was about 4 times higher than averagedWSS on normal wall. Maximal WSS appeared at theimpingement area or acutely narrowing area (like just afterthe aneurysmal dilatation). The mean WSS on aneurysmwall at systolic phase was significantly lower than that onnormal wall (16.4 ± 11.6 dyne/cm2 vs 36.4 ± 12.5 dyne/cm2,p < 0.05). The magnitude of WSS was influenced largely bythe aneurysm shape. Between the Aspect ratio (Dome/Neck)and WSS, a significant negative correlation was recognized(r = 0.67, p = 0.0027). Flow structure analysis of ananeurysm with high Aspect ratio showed a secondary sluggishflow in the aneurysm. In contrast, blood flowed inorderly fashion in aneurysms with low Aspect ratio.WithdrawnCONCLUSIONWe showed hemodynamic study for a number of cerebralaneurysms was possible with a properly organized applicationsystem. High WSS is important in the initiation phase ofcerebral aneurysm. But in our 20 middle cerebral aneurysms,WSS action on aneurysm wall was very low. Wall shearstress acts differently in the progression phase of cerebralaneurysms.KEY WORDS: Cerebral aneurysm, hemodynamics, wall shearstressComputer Assisted Exhibit 15Imaging of Developmental Venous Anomalies withAtypical FeaturesCastillo, M. · Matheus, G. · Smith, J. K.University of North Carolina School of MedicineChapel Hill, NCPURPOSEDevelopmental venous anomalies (DVAs, also called venousangiomas) are the most common cerebral vascular malformationand generally have a typical appearance that allowsone to make the diagnosis in most cases. Our purpose is toreview the MR imaging of DVAs that presented with atypicalfeatures.MATERIALS & METHODSDuring a 4-year period we collected a total of nine DVAs thathad atypical MR imaging features. Location of the DVAswas not considered in this study. We review the MR studiesin these nine patients.Computer Assisted Exhibits
458Computer Assisted ExhibitsRESULTSFour DVAs presented in combination with closely relatedcavernous angiomas that were believed to be secondary toimpaired venous drainage from the malformations. TwoDVAs presented with associated infarctions that were presumablydue to thrombosis of a part of the malformation.One DVA presented with a large acute bleed and since MRvenography showed a stenosis of the main draining vein webelieve that the hemorrhage was due to increased venouspressure. One did not have a “Medussa head” configurationbut involved the cerebral white matter in “fan-like” fashionand drained into an enlarged vein of Galen. The last DVAhad multiple pial veins in the cerebellar fissures giving riseto enhancement simulating disease in the subarachnoidalspace.CONCLUSIONDevelopmental venous anomalies are common and althoughthe diagnosis is straightforward in most cases, atypical featuresare not uncommon and should be recognized.KEY WORDS: MR imaging, venous angioma, vascular malformationsHead and Neck17-22Computer Assisted Exhibit 17Interactive Tutorial of Brachial Plexus ImagingDelman, B. N. · Som, P. M. · Fatterpekar, G. M. · Lee, J. S.· Naidich, T. P.Mt. Sinai Medical CenterNew York, NYPURPOSEThis computer-based brachial plexus tutorial covers: a)schematic architecture of the brachial plexus; b) typicalimaging protocols; c) MR appearance of the normal plexus;d) identification of key surrounding structures; e) diseasecategories and specific processes; and f) guides to generatinga differential diagnosis.MATERIALS & METHODSMR imaging of the brachial plexus was performed on 195patients between June 1997 and October 2003. Typical imagingprotocol covered both brachial plexi and included: largeFOV Axial T1- and T2-weighted imaging; smaller FOVsagittal and coronal T1-, T2-, and T1-weighted imaging withfat-saturation. Exported images are included in an interactiveshell, which allows the user to navigate through a variety ofoptions from any given screen. Movies were generated fromsequential images as well as from surface renderings to providea greater understanding of three-dimensional structurethan that offered by single images.RESULTSIn this tutorial images of normal brachial plexi are displayedas static images and stacked movies, allowing for a threedimensionalunderstanding of plexus anatomy. Examples ofnormal anatomy were selected to illustrate the normal neuralelements, branching pattern, and key surrounding structures.Pathology includes intrinsic neurogenic tumors (schwannoma,neurofibroma), axillary nodal disease, contiguous spreadof nonnodal tumor such as Pancoast tumor, congenital anddegenerative cysts, fibrous lesions (fibroma, desmoid, andfibromatosis), muscle atrophy, inflammatory processes withinand around the plexus, and posttraumatic lesions.Interactive links allow correlation of structures withschematic diagrams. The user may view a spectrum ofabnormal cases by disease category, location and imagingappearance, with interactive links providing contrastingrelated or similar-appearing diseases. A quiz mode challengesthe user to identify findings and produce a diagnosis.CONCLUSIONThis interactive tutorial allows the user to identify the normalstructure and imaging appearance of the brachial plexus,to review differential diagnosis of numerous varieties ofcases, and to challenge himself with unknown cases.KEY WORDS: Brachial, plexus, interactiveComputer Assisted Exhibit 20Nasolacrimal Duct System: Anatomy, Physiology ofDrainage, and Pathologic CorrelationRadaideh, M. M. · Zeifer, B.Northwestern UniversityChicago, ILPURPOSEIn this computer-assisted exhibit we will discuss the nasolacrimalsystem anatomy, physiology, and pathology.Anatomy will be described and diagrammatically illustrated.A range of adult pathology will be demonstrated using multimodalityimaging techniques. Neoplastic and inflammatorydiseases with their unique imaging features will be presentedand correlated with their pathologic features. A rangeof postsurgical changes will be demonstrated. Specialemphasis will be placed on the usefulness of CT, MR imaging,contrast dacryocystography, dacryoscintigraphy andcombined CT/dacryocystography in diagnosis of nasolacrimalsystem disease. The reader will be introduced alsoto the technique, indications, and pitfalls of these diagnostictools.WithdrawnMATERIALS & METHODSThis computer exhibit will use multilinkage powerpoint format.Netter diagrams will be utilized for anatomical delineation.The various pathologic entities shown are all found inpatients presenting to the ophthalmologist with epiphora.RESULTSEpiphora is a common ophthalmologic complaint for whicha number of imaging modalities are available. With a properindex of suspicion causal conditions arising within the nasolacrimalduct and lacrimal sac can be demonstrated successfullyusing a variety of techniques. Diseases of this system
including stenoses, calculi, neoplastic conditions, and morphologicabnormalities such as diverticulae can be diagnosed.CONCLUSIONThis computer-assisted exhibit covers evolving concepts inlacrimal outflow obstruction. It is important to understandthe anatomy and physiology of the lacrimal drainage systemas well as the range of pathologic processes developing inthis area.WithdrawnREFERENCES1. Mandeville JT, Woog JJ. Obstruction of the LacrimalDrainage System. Curr Opin Ophthalmol 2002;13(5):303-309.Review2. Paulsen F. The Human Nasolacrimal Ducts. Adv Anat EmbryolCell Biol 2003;170:III-XI,1-106. Review3. Weil D, Aldecoa JP, Heidenreich AM. Diseases of the LacrimalDrainage System. Curr Opin Ophthalmol 2001;12(5):352-356.Review4. Som PM, Curtin HD. Head and Neck Imaging. LacrimalApparatus. Chapter 10. 4th ed.Copyright 2003 by Mosby, Inc.KEY WORDS: Nasolacrimal drainage, EpiphoraComputer Assisted Exhibit 21Virtual MR Endoscopy of the Middle EarLane, J. I. · Camp, J. · Witte, R. · Driscoll, C. · Robb, R.Mayo ClinicRochester, MNAn understanding of the 3-dimensional relationships ofanatomical structures that make up the tympanic space iscritical for radiologists and otolaryngologists to adequatelyinterpret imaging studies in the clinical environment.Three-dimensional reconstructions of the middle ear fromclinical imaging studies suffer from limited resolution andrelatively large fields of view. We have taken advantage ofexisting technology employed in the field of MRmicroscopy to construct a computer-based learning moduleof middle ear anatomy. Images of a cadaver temporal bonespecimen scanned at 9 T after opacification of the middleear space with dilute gadolinium solution were used to constructthe 3-dimensional environment. We have emphasizedthe spatial orientation of the auditory ossicles, oval window,round window, cochlear promontory, pyramidal eminence,stapedius and tensor tympani muscles, tympanicsegment of the facial nerve canal, tympanic recess andfacial recess in order to facilitate image interpretation andsurgical planning from 2-dimensional imagesKEY WORDS: Middle ear, anatomy, temporal bone459Computer Assisted Exhibit 22Congenital Aural Dysplasia: What the Clinician Needs toKnowBenoza, E. · Kim, P. E. · Zee, C. S. · Becker, T. · Go, J. L.University of Southern CaliforniaLos Angeles, CAPURPOSEThe purpose of this exhibit is to describe the radiologic findingsof congenital aural dysplasia with emphasis on presurgicalassessment.MATERIALS & METHODSCT scans from the teaching files of two head and neck radiologistsat the University of Southern California will be utilizedto demonstrate the radiologic findings of congenitalaural dysplasia.RESULTSDetermination of surgical correction of congenital aural dysplasiarequires assessment of the atresia plate, relative sizeand appearance of the middle ear cavity and ossicles, theappearance of the oval and round window, the position of thevertical segment of the facial nerve, and an assessment of thecochlea, vestibule and semicircular canals. In addition, therelative position of the adjacent vascular structures, and surroundingbony structures including the temporal mandibularjoint are required.CONCLUSIONThis exhibit will review the pertinent radiologic featuresseen in congenital aural dysplasia and educate the attendeeas to what should be conveyed to the referring physician fortreatment.KEY WORDS: EAC atresia, temporal bone, congenitalInterventional24-31Computer Assisted Exhibit 24Elastase-Induced Saccular Aneurysms in Rabbits:Instructions “For the Rest of Us”Miskolczi, L. · Gounis, M. J. · Anaya, C. · Onizuka, M. ·Cesar, L. · Lieber, B. B. · Wakhloo, A. K.University of MiamiMiami, FLComputer Assisted ExhibitsPURPOSEAlthough the creation of elastase-induced saccularaneurysms can be quick and easy, for many who have followedinstructions from existing publications and word-ofmouthit has been a nerve-wracking struggle with poor outcomes.Details on the survival rate of rabbits and theaneurysms’ neck-to-dome ratio have yet to be published
until now. We hereby detail the finer points of creating elastase-inducedsaccular aneurysms in rabbits, making thismodel easier to reproduce.460level of stenosis. Patients underwent color and spectralDoppler 24 hours, 1 month, 3 month, 6 months, and/or 1 yearfollowing the stenting procedure.Computer Assisted ExhibitsMATERIALS & METHODSThe step-by-step procedure will be simulated by using computerinterface, and will provide angiographic feedback atevery decision-making node. We also will provide instructionson how to evaluate contrast washout, a reliable immediatepredictor of successful treatment.RESULTSWe created over 100 elastase-induced saccular aneurysms inrabbits during the past 2 years. Our initial outcome wasbelow 40%, but improved to 96% as we eliminated most ofthe pitfalls. Our difficulties were related to the followingissues: poor quality rabbit supplier, poor infection prophylaxis,improper anesthesia and recovery procedures, impropercatheters, effect of catheter and balloon position on outcome,effect of elastase quality and quantity on outcome, andeffect of elastase injection method and rate on outcome.CONCLUSIONWe believe that elastase-induced aneurysms in rabbits havefeatures that make them a better model for certain applicationsthan the surgical model created in dogs or pigs. It isimportant to make the method reproducible, thus widelyavailable to all interested researchers.KEY WORDS: Aneurysm, elastase, rabbitComputer Assisted Exhibit 27Immediate Evaluation of Angioplasty and StentingResults in Supraaortic Arteries Using Doppler-TippedGuide WireGhosh, N. · Tampieri, D. · Melançon, D.Montreal Neurological Institute, McGill UniversityMontreal, ON, CANADAPURPOSETo determine whether intraarterial Doppler (IAD) can beused safely for immediate evaluation of carotid artery stenosisand to evaluate the relationship between blood flowvelocities measured with intraarterial and duplex Dopplerand degree of stenosis measured angiographically.MATERIALS & METHODSThe IAD system used consists of a 0.014” Doppler-tippedguide wire (Flowire by Cardiometrics, California) with apiezoelectric transducer operating at 12 MHz mounted at itsdistal end. The proximal end of the wire is connected to aspectral wave analyzer that displays the pulsed Doppler signal.Sixteen patients (9 men and 7 women) with symptomaticcarotid stenosis as shown by an external duplex colorDoppler device were examined. When the symptomaticstenotic vessel was entered using the regular femoralapproach, an angiographic study was performed and theFlowire was navigated in the catheter to the site of stenosis.Blood flow velocities were recorded proximal to, distal to,and at level of stenosis. Following angioplasty and stenting,the Flowire was reinserted to obtain flow measurements atWithdrawnRESULTSFor four of sixteen subjects, it was not possible to advancethe Doppler-tipped guide wire past the level of the stenosisand velocity measurements with IAD could not be taken. Inone patient, the angioplasty procedure was not performeddue to induction of a severe vasovagal response. In theremaining subjects, the immediate prestent and immediatepoststent peak systolic velocities (PSVs) were recordedusing the IAD system. The prestent peak systolic velocitiesobtained using IAD were significantly greater compared tothe peak systolic velocities obtained following stenting withan average difference of approximately 120cm/s. Similarly,prestent measurement of PSV was recorded using conventionalduplex Doppler on the same day of the procedure in 8patients, while same-day poststent duplex Doppler PSVswere recorded in 14 patients. As with IAD, the prestentvelocities recorded using duplex Doppler were significantlygreater than those recorded after the stenting procedure.When comparing IAD and duplex Doppler results, there is agood correlation between PSV measurements obtained followingstenting (R = 0.70 p < = 0.01). Both methods showresolution of PSV to “normal” values in 9 patients (56%) followingstenting. In all 10 cases, the poststent angiographicresults indicate resolution of stenosis to moderate (30-69%)or low (< 30%) grade levels stenosis following the angioplastyand stenting procedure. However, below about 54%stenosis achieved poststent, PSV achieved using IAD andduplex Doppler did not improve considerably. This observationsuggests that dilatation of the stent above a certain pointdoes not result in any significant increase in blood flow.During the procedures there were no neurologic complications.WithdrawnCONCLUSIONIn this study, intraarterial Doppler confirmed hemodynamicimprovement immediately following stent placement andcorrelated well with post-CAS duplex Doppler results. Thus,IAD can be incorporated feasibly into CAS procedures forhemodynamic evaluation and complement anatomical informationprovided by angiography.KEY WORDS: Intraarterial Doppler, angioplasty and stenting,carotid stenosisComputer Assisted Exhibit 28Carotid Stenting for Carotid Stenosis: The Differencebetween SMART Stent and Easy WallstentTakayama, K. 1 · Nakagawa, H. 2 · Kichikawa, K. 2 · Wada, T. 2· Myouchin, K. 2 · Sakamoto, M. 2 · Taoka, T. 2 · Iwasaki, S. 2· Kurokawa, S. 11Ishinkai Yao General Hospital, Yao City, Osaka Prefecture,JAPAN, 2 Nara Medical University, Kashihara City, NaraPrefecture, JAPANPURPOSEWe evaluated the difference between SMART stent and EasyWallstent of carotid stenting for carotid stenosis.
MATERIALS & METHODSIn a retrospective study among 39 carotid stent procedureswe did, 19 carotid stent procedures in 18 patients (17 men, 1woman; mean age, 72 years; age range, 56-79 years) couldobtain follow-up DSA with stenosis. Eighteen (NACET >60%) were evaluated to assess the peri-postprocedural complication,the expansion of vascular lumen, the embedmentof the stent, new stroke after stenting of the differencebetween SMART stents (n = 11) and Easy Wallstents (n = 7).461Computer Assisted Exhibit 30 (view on Computer 20)Model-Based Optimal Path Guidance and RemoteOperation System for Interventional NeuroradiologyProceduresMa, X. · Zhao, L. · Zheng, W. · Wieslaw, N.Biomedical Imaging LabSingapore, SINGAPORERESULTSIn the peri-procedural complication: two cases of symptomatichypotension were observed in the SMART stentgroup, but no cases were observed in the Easy Wallstentsgroup. The other complications were not observed in eithergroup. During follow-up (median, 14 months; range 1-44months) one high-grade restenosis, one ipsilateral stroke,and three dehiscence of stent and vessel wall (42.7%) wereobserved in the Easy Wallstents group, but no high-graderestenosis, no ipsilateral stroke were observed and all stentswere embedded in the vessel wall in the SMART stent group.CONCLUSIONWe think SMART stent is suitable for carotid stenosis ascompared with Easy Wallstent, but further controlled followupstudies of larger samples are required.KEY WORDS: Carotid stent, SMART, Easy WallstentComputer Assisted Exhibit 29Computer Animation of Catheter Maneuvering inSelective Angiography of Cephalic ArteriesKrol, G. S. · Lis, E.Memorial Sloan-Kettering Cancer CenterNew York City, NYExpertise in catheter handling is an important factor intimely and successful performance of cerebral angiography.Such expertise is achieved by practice. However, it isessential that the rationale for use of different catheter typesand mechanics of manipulation and progression within thelumen of the vessel are understood in advance. Consecutivemaneuvers of four basic catheter configurations(Headhunter, Cobra, Mani, Simmons) during selectivecatheterization are projected within the 3D model of aorticarch and proximal cephalic vessels, using computer animationart. Interactive DVD format makes for easy viewerparticipation and learning. This teaching exhibit isaddressed primarily to neuroradiology fellows who want tolearn or improve their skills of basic techniques of catheternavigation during selective neuroangiographyKEY WORDS: Selective neuroangiography, technique, computeranimationPURPOSEIn traditional interventional radiology procedures, how toguide the IR devices in the complex vascular tree to the targetpositions is a big challenge for the radiologists and needslong time training and good experience. The purpose of thiswork is to develop a solution that can indicate the optimalmanipulation path for the IR device and add-on remote operationsystem. All the technologies and components are helpfulfor guiding IR devices in an easier, clearer, and safer way.MATERIALS & METHODSThe main view provided to the radiologists will be the accurate3D vascular model based on patient specific data. In preoperationprocedure, the radiologists can do preplanning andmanfully or automatically plan the optimal motion path ofthe IR tools. In intraoperation, the position and the orientationof the IR tools inserted into the body are navigated bytwo projections of angiography images or magnetic trackingsystem, and displayed on the 3D vascular model. With themotion tracking information, the system will provide realtimeguidance for the manipulation of the IR tools so that thetools can reach the target quickly and easily. The remoteoperation system will provide another option for the radiologistto complete the procedures remotely through theintranet/internet/direct cable connection.RESULTSAs the first prototype, a vascular phantom is used to provethe method. Using corresponding MR data of the phantom,the 3D digital model is generated and used as the interfacefor the implementation. An AHB is used by the doctor tonavigate the manipulation of the radiologist on the IRdevice. The motion information is transferred to patient sidethrough cable connection and an AB drives another IRdevice into the phantom. The tip of the device is tracked. Thetracking information then is integrated with the device simulationresult so that the position and the orientation of thedevice can be displayed in the 3D digital model. Accordingto the path planning result, the model will indicate the optimalmotion direction to help radiologist to decide followingmanipulation.Computer Assisted Exhibits
CONCLUSIONThe system can provide advantages that the procedure isguided by 3D vascular model so that it is possible that thetime of taking radiation image can be reduced; the modelbasedoptimal path guidance technology provides a betterway for the radiologist to reach the target in an easier andfaster way; the remote operation system provides anotheroption for the radiologist to complete the procedure inremote through the intranet/internet so that the harm causedby frequent radiation can be minimized. The method is firstproved by using a vascular phantom. Future work includesmore completed validation such as system testing on smallanimal and real patient.KEY WORDS: Interventional neuroradiology, remote operation,optimal path462edema and/or hemorrhage. Anticoagulation may be used totreat the clinical symptoms but not recanalization of duralsinus but just improving the collateral. MR imaging may beused to identify the timing for thrombolytic treatment. Thedural AV fistula may occur after incomplete treatment. Thus,we believe that thrombolytic treatment either from mechanicalor liquid lysis may be essential for prevention of this difficultsequelae.KEY WORDS: Venous, thrombosis, thrombolysisPediatrics32-33Computer Assisted ExhibitsComputer Assisted Exhibit 31Autocoagulation May Not Be the Treatment of Choice forSinus and Venous ThrombosisTsai, F. Y. 1 · Kostanian, V. J. 1 · Lee, K. W. 2 · Chen, C. C. 3 ·Nguyen, T. H. 11University of California Irvine, Orange, CA, 2 Chung HwaChristian Hospital, Chung Hwa, Taiwan, TAIWANREPUBLIC OF CHINA, 3 Taichung Veterans GeneralHospital, Taichung, Taiwan, TAIWAN REPUBLIC OFCHINAPURPOSEDespite numerous reports about direct thrombolytic treatmentfor acute dural sinus thrombosis, there is still somecontroversy about the guidelines for the treatment. Muchprevious neurologic literature dictated that anticoagulation isthe choice of treatment. The purpose of this investigation isto determine the need and when for thrombolytic treatment.MATERIALS & METHODSFrom January 2001 to December 2003 we have collected 18patients who suffered acute dural sinus thrombus. Among 12of these 18 patients who had either edema and/or parenchymahemorrhage. After a period of heparinization, interventionaltreatment then was used to salvage the complication.We used thrombolytic treatment of tpa 10 - 15 mg and/or ballooncatheters to remove that acute thrombus. Male:female =7:11. Age: ranging from 34 to 66 years.RESULTSAll 12 patients recovered completely without deficit exceptone required surgical removal of a huge intracerebralhematoma. Five patients who had no imaging changesreceived heparin only, with complete clinical recovery.Follow-up MR venography did show increased collateralsbut no definite reopening of dural sinus. One patient developeddural sinus AV fistula after incomplete treatment ofthrombosis. Heparin treatment may lead to further hemorrhageor edema if no recanalization of dural sinus, thrombolytictreatment is required.CONCLUSIONAcute dural sinus venous thrombosis may require thrombolyticand/or mechanical disruption of thrombus to relievevenous congestion to avoid severe consequence such asComputer Assisted Exhibit 32Diffusion Tensor Imaging Analysis of the Growth Patternof an Intraaxial Tumor at the Cervicomedullary JunctionPhillips, N. S. 1 , 2 · Helton, K. 1 , 2 · Sanford, R. A. 2 , 3 · Gajjar, A. 1· Tekautz, T. 1 · Zou, P. 1 · Langston, J. W. 1 · Ogg, R. 11St. Jude’s Children’s Research Hospital, Memphis, TN,2University of Tennessee Health Science Center, Memphis,TN, 3 Semmes-Murphy Clinic, Memphis, TNPURPOSEBrain-stem gliomas are a heterogeneous group of tumors thataccount for 15% of all pediatric CNS tumors. We report thefirst case in which diffusion tensor imaging (DTI) was usedto investigate the Epstein and Farmer hypothesis regardingthe effects of normal brainstem architecture on the growthpattern of low-grade potentially malignant cervicomedullarybrain-stem gliomas, and guide surgical planning (1, 3).MATERIALS & METHODSPreoperative imaging was obtained on a 1.5 T Symphony(Siemens Medical Systems, Erlangen). Diffusion-weighted,echo-planar images were acquired using a flexible quadraturesurface coil placed around the base of the skull for optimalimaging of the cervicomedullary junction. Diffusiontensors were calculated using the SPM diffusion toolboxdeveloped for SPM99 (Wellcome Institute of Neurology,London).RESULTSPreoperative DTI imaging demonstrated that caudal growthof the tumor was cylindrical and projected well below thenormally positioned pyramidal decussation, to the level ofC2 (1). Cephalic growth was bounded superiorly by thedecussation of the medial lemnisci and projected dorsallytoward the obex . Lateral growth followed the course of thespinal thalamic tracts and pial fibers, and thus was limited togrowth into the cerebellar peduncles.CONCLUSIONOur finding corroborated the Epstein and Farmer hypothesisthat the growth patterns of low-grade potential malignantcervicomedullary gliomas are influenced strongly byanatomical barriers in the brain stem(1, 2). This case high-
lights the potential of DTI to demonstrate the tumor’s relationshipto normal brainstem architecture and enhance thesurgical management of brain stem lesions.REFERENCES1. Epstein F, Farmer J. Brain-Stem Glioma Growth Patterns. JNeurosurg 1993;78:408-4122. Epstein F, Wisoff J. Intra-Axial Tumors of theCervicomedullary Junction. J Neurosurg 1987;67:483-4873. Robertson PL, et al. Cervicomedullary Tumors in Children: ADistinct Subset of Brainstem Gliomas. Neurology1994;44:1798-1803KEY WORDS: Brain-stem glioma, diffusion tensor imaging,cervicomedullary junction tumor463REFERENCES1. Witte RJ, Lane IJ, et al. Pediatric and Adult CochlearImplantation. Radiographics 2003;23:1185-12002. Shinji N, Tokiko K, et al. MR Cisternography of theCerebellopontine Angle: Comparison of Three-DimensionalFast Asymmetrical Spin-Echo and Three-DimensionalConstructive Interference in the Steady-State Sequences.AJNR Am J Neuroradiol 2001;22:1179-1185KEY WORDS: 3D FIESTA, MR imaging, inner ear, cerebellopontineangleSocioeconomics34Computer Assisted Exhibit 33Three-Dimensional FIESTA MR Imaging of theCerebellopontine Angle and the Inner Ear in ChildrenVeeramani, M. · Curran, J. · Burrowes, D. · Kim, F.Children’s Memorial HospitalChicago, ILPURPOSETo present the normal anatomy of inner ear and cerebellopontineangle (CPA) structures in the pediatric age group,utilizing 3-dimensional fast imaging employing steady-stateacquisition (3D-FIESTA) MR imaging. Selected pathologyalso is demonstrated.MATERIALS & METHODSThree-dimensional-FIESTA is a heavily T2-weightedsequence for high spatial resolution, high contrast MR imagingthat results in excellent visualization of soft tissue structurescoursing through cerebrospinal fluid (CSF) and similarfluids. Therefore it is particularly advantageous in the depictionof the fine structures of the CPA and inner ear. Thin sectiondirect axial and oblique sagittal images were obtained.The majority of the patients imaged were candidates forcochlear implant because of sensory neural hearing loss.RESULTSThe CPA MR cisternogram provides excellent delineation ofthe configuration and course of the facial and vestibulocochlearnerves in both their cisternal and canalicular portions.The membranous labyrinth structures including terminationof the eighth nerve are well demonstrated. Pathologiccases include absence of the lateral semicircular canal withabnormal vestibule, cochlear malformations, aplasia of thenerves with inner ear malformations, vestibular aqueductsyndrome and labyrinthitis ossificans. Schwannoma andtraumatic avulsion of the seventh nerve also are shown.Computed tomography (CT) correlation is provided for severalcases. The advantages and disadvantages of thesequence are discussed including banding susceptibility artifact.CONCLUSIONThree-dimensional-FIESTA is excellent for delineation ofnormal anatomical structures of the internal auditory canaland membranous labyrinth and evaluation of variouspathologies affecting these structures.Computer Assisted Exhibit 34MIRIP: An Online Neuroradiology Electronic TeachingFileLim, C. 1 · Yang, G. 2 · Nowinski, W. 2 · Hui, F. 11National Neuroscience Institute, Singapore, SINGAPORE,2Institute of Infocomm Research, Singapore, SINGAPOREMIRC (Medical Image Resource Center) is a new internetrepository developed by RSNA that defines standards fordata exchange between institutes worldwide. We built acomputer server that retrieves DICOM images from PACSand creates a disease database, including ACR code indexes.Electronic teaching file (ETF) cases from the PACS caseloadof the National Neuroscience Institute in Singapore wereselected and 200 neurologic cases, comprising CT, MR andangiographic images were created. Many of the cases areuncommon and form a distinctive patient population thatmay be useful for future research. We developed a WorldWide Web site that could be seamlessly connected with theRSNA MIRC site storage and query functions, thus linkingour ETF to the RSNA search engine. Our system enablesDICOM PACS users to create MIRC compliant ETF andshares them with the worldwide neuroradiology community.Neuroradiology images are suited particularly to electronicCME as CT and MR images are natively digitalKEY WORDS: Medical image repository center, neuroradiology,educationComputer Assisted Exhibits
464Computer Assisted ExhibitsSpine35-40Computer Assisted Exhibit 35Percutaneous Sacroplasty: Indications, Technique, andResultsRadaideh, M. M. · Shaibani, A. S. · Walker, M. T. · Curtin,K. · El-Sibai, M. S. · Russell, E. J.Northwestern UniversityChicago, ILPURPOSESacroplasty is a variation of the vertebroplasty technique fortreatment of a sacral insufficiency fracture. This computerassistedexhibit will describe the nature of sacral insufficiencyfractures, their etiology and imaging features. It willexplore the different treatment strategies includingsacroplasty. The indications and technique of sacroplastywill be described in detail including our experience andresults with this new novel procedure. The procedure providedsymptom relief and resulted in no serious complications.MATERIALS & METHODSAlthough relatively common, sacral insufficiency fractureswere described only recently by Lourie in 1982.Osteoporosis is the leading cause, most often afflicting elderlywomen; other causes include chronic steroid use andradiation exposure. Patients complain of lower back painthat is often acute and may be associated with minimal trauma.In this exhibit we will lay out an introduction to the clinicaland pathologic data about sacral insufficiency fractures.We will use illustrations to explain the nature of this fracture.Static radiographic images and movies will be used to showthe reader the details of percutaneous sacroplasty procedureand equipments used. Indications, contraindications, andpossible complication of the procedure will be discussed.RESULTSPercutaneous sacroplasty is a new but successful techniquefor painmanagement and consolidation of sacral insufficiencyfractures. The pain relief obtained with this technique isnot correlated with the volume of cement injected but ratherwith adequate filling of the entire fracture cavity. The mostcritical elements for successful sacroplasty areproper patientselection, correct needle placement, good timing of cementinjection, strict fluoroscopic control of injection, and operator’sexperience.CONCLUSIONThe long-term results of sacroplasty are not known, but thepatients who receive this kind of treatment report significantrelief of symptoms, and the procedure appears to improvetheir quality of life dramatically. Early results suggest thatsacroplasty may be an alternative therapy for sacral insufficiencyfractures that warrants further investigation.REFERENCES1. Pommersheim W, Huang-Hellinger F, Baker M, Morris P.Sacroplasty: A Treatment for Sacral Insufficiency Fractures.AJNR Am J Neuroradiol 2003;24(5):1003-10072. Garant M. Sacroplasty: A New Treatment for SacralInsufficiency Fracture. J Vasc Interv Radiol 2002;13(12):1265-1267KEY WORDS: Sacroplasty, sacral insufficiency fracturesComputer Assisted Exhibit 36Cystic Lesions in Lumbar Spinal CanalKhosla, A.Mallinckrodt Institute of Radiology/Veterans’Administration Medical CenterSt. Louis, MOCystic lesions within the lumbar spinal canal are seen infrequently.Different pathologic processes can present as cysticlesions within the lumbar spinal canal. A knowledge ofsuch lesions will be helpful in narrowing the differentialdiagnosis. Extramedullary cysts of the lumbar spinal canalmay produce a slowly progressive myelo-radiculopathy, orradiculopathy. CT myelography and MR imaging haveimproved detection and understanding of these cysts.Currently, MR imaging is the imaging modality of choicefor the diagnosis and CT myelography is most helpful inestablishing communication of the cyst with the subarachnoidspace. In the future, CSF flow-sensitive MR techniqueswill be available to accurately diagnose the cysticlesions of spinal canal and to determine their communicationwith the subarachnoid space. Surgical resection ofsymptomatic lesions usually results in complete cure or significantneurologic improvement. This essay reviews theclassification, pathophysiology, clinical presentation, andimaging features of lumbar extramedullary spinal cysts.The significant type include - synovial cysts, ganglioncysts, perineural cyst, cystic primary and secondary neoplasms,neuroenteric cysts, infectious processes, resolvinghematoma, intra and extradural meningeal cysts, occultsacral meningocele and imaging mimics of cystic lesionsKEY WORDS: Spinal canal, neoplasms, cystsComputer Assisted Exhibit 37Compression Fractures of Adjacent Levels PostComplicated Vertebroplasty: Disk SpacePolymethylmethacrylate as a Cause of VertebralCompression FractureEvans, A. J. 1 · Sims, J. T. 2 · Murphy, K. P. J. 31Tampa Bay Radiology Consultants, Tampa, FL, 2 Universityof South Florida, College of Medicine, Tampa, FL, 3 TheJohns Hopkins Hospital, Baltimore, MDPURPOSEStudies have shown the occurrence of local leaks of polymethylmethacrylate(PMMA) to be common with vertebroplasty,especially into the intervertebral disk space. In a 1997
study, local complications occurred in 29 of the 40 procedureswith intervertebral disk extravasation occurring in 8 ofthose 29. These leaks were deemed to have no clinicalimportance (1). We reevaluate this statement by presentingfive patients who experienced vertebral compression fractures(VCFs) shortly after undergoing vertebroplasty thatresulted in intervertebral disk extravasation. All of theseVCFs occurred in the end plate adjacent to the extrudedPMMA. The appearance and timing of these fractures leadus to speculate that disk space extravasation may contributeto VCFs at adjacent levels.465Computer Assisted Exhibit 38Prospective Assessment of Pain and Functional Statusafter Vertebroplasty for Treatment of VertebralCompression FracturesEvans, A. J. 1 · Kip, K. E. 2 · Boutin, S. M. 11Tampa Bay Radiology Consultants, Tampa, FL, 2 GraduateSchool of Public Health, University of Pittsburgh,Pittsburgh, PAMATERIALS & METHODSA retrospective review of patient records of over 510 vertebroplastiesin a 28-month period revealed five patients inwhom the investigators suspected that disk space extravasationwas associated with adjacent level VCF. The images andclinical history were reviewed in each case, and clinical follow-upperformed for each patient for 8-24 months (mean 18months).RESULTSThe age range of the patients was 71-97 years with a meanof 79 years. The initial levels of vertebroplasty were T7,T12, L1, L2, and L3. The time to next fracture ranged from1 day to 79 days with a mean of 25 days. The disk spaceextravasation that occurred in each case resulted in filling ofthe disk through at least one half of the disk space toward thenormal vertebral body above or below. In three cases theextravasation occurred in the superior disk space and in twocases the inferior. The adjacent fracture involved the endplate of the adjacent level in each instance.CONCLUSIONPrevious papers describe no adverse effects after PMMAextravasation into the intervertebral disk space. In our experiencewith over 510 vertebroplasties performed, there is nopain associated with this local complication. This paperdescribes five patients in whom VCFs occurred in the adjacentvertebral body within 2 months of a vertebroplasty complicatedby intervertebral disk extravasation of PMMA. Webelieve these cases indicate that disk space extravasation is acomplication with the potential for side effects.REFERENCES1. Cotton A, Dewatre F, Cortet B, Assaker R, Leblond D,Duquesnoy B, et al. Percutaneous Vertebroplasty forOsteolytic Metastases and Myeloma: Effects of thePercentage of Lesion Filling and the Leakage ofMethylmethacrylate at Clinical Follow-Up. Radiology1996;200:525-530KEY WORDS: Vertebroplasty, complications, disk spaceextravasationPURPOSERecent literature suggests that percutaneous vertebroplasty,when used in the setting of osteoporotic compression fractures,results in substantial and immediate pain relief,improved functional status, and minimal short-term complications.To date there has been no prospective evaluation ofvertebroplasty using a validated instrument. We describe thepain and functional status of 72 patients before and after vertebroplasty,as prospectively reported by patient completionof a validated Vertebral Compression Fracture Pain andFunctional Disability Questionnaire.MATERIALS & METHODSPatient Population. Following an IRB approved protocol, aseries of 161 consecutive patients during the period August1999 to September 2001 were invited to enroll in the studywhich consisted of completion of the Vertebral CompressionFracture Pain and Functional Disability Questionnaire. Of161 consecutive patients, 72 consented to participate in thestudy and self-completed the Vertebral CompressionFracture Pain and Functional Disability Questionnaire priorto undergoing vertebroplasty. Statistical Analysis.Differences in patient self-reported pain and distress beforeand after vertebroplasty, and between the first and secondfollow-up intervals, were evaluated by Student’s t-tests.Mean scores for each of the 24 ADLs (based on the 1 to 5scale) were plotted at the baseline and first and second follow-upintervals.RESULTSThe mean age of the 72 patients was 74 years (+ 10 years)80% were female. Prior to vertebroplasty, 13% of patientscould not ambulate at all and 59% could not ambulate morethan one block. In addition, 15% of patients used a wheelchairand 7% were bedridden. No patients suffered symptomaticcomplications. Asymptomatic leakage of PMMA intoadjacent soft tissues (veins or the disk spaces) was observedin 9%. On the 0 (no pain) to 10 (pain as bad as it could be)visual analog pain scale patients reported significantly morepain, on average, before undergoing vertebroplasty than atthe first follow-up interval (mean 5.8 vs 3.5, P < 0.001).Importantly, the substantial reduction in reported pain followingvertebroplasty persisted at the second follow-up onboth the visual analog and adjectival pain scales. The abilityto perform each of the 24 ADLs without pain was substantiallygreater at both follow-up intervals compared to beforeundergoing vertebroplasty. Among the 24 ADLs, between25% to 69% of patients reported a mean improvement(between the baseline and first follow-up interval) of at leastone level on the 5-point ADL scale, and between 14% to55% reported a mean improvement of at least two levels.The reported worsening of ability to perform ADLs betweenthe first and second follow-up intervals ranged from 0% toComputer Assisted Exhibits
36% of patients for at least one level, and from 0% to 14%of patients for at least two levels. Thus, the majority of thesubstantial improvement in reported functional status followingvertebroplasty was sustained at the second follow-upinterval.466CONCLUSIONThe course in its entirety provides a novel approach forlearning spinal imaging.KEY WORDS: Spine, imaging, courseComputer Assisted ExhibitsCONCLUSIONIn this prospective nonrandomized trial, PV resulted in substantial,lasting reduction in pain and improvement in abilityto perform ADLs.KEY WORDS: Vertebroplasty, pain, vertebral compressionfracturesComputer Assisted Exhibit 39The Keck School of Medicine of the University ofSouthern California Comprehensive Spinal ImagingCourseRothman, S. L. G.Keck School of Medicine of the University of SouthernCaliforniaLos Angeles, CAPURPOSEWe live in a period of super specialization in radiology.Radiology residents and fellows migrate from section to sectionlearning MR imaging, CT, and invasive neuroradiology.It is unusual for there to be an opportunity for the trainee tobe in the position of seeing the entire picture of spine disease.Furthermore, the radiologist tends to be isolated fromthe clinicians who care for the patients. During the last 2years a comprehensive 10-hour, interactive, course in diagnosticimaging of the spine has been created including plainX-ray, videoflouroscopy, CT and MR imaging. The course isdesigned to present the spine in its totality, as an entity withthree functions, supporting the head and body, allowingmobility, and protecting the spinal cord. The purpose of thiscomputer exhibit is to demonstrate several segments of theinteractive CD-based course in spine radiology. It is intendedto weave a total picture of spinal anatomy, biomechanics,and physiology. It is designed to teach basic concepts ratherthan the details of rare entities. Symptom correlation withobserved abnormalities is stressed.MATERIALS & METHODSSeveral PowerPoint lectures on various aspects of cervicaland lumbar spine anatomy and physiology will be read fromCDs. Imbedded in these presentations is a combination oftext, voice, and video used to challenge the trainee’s powersof observation and deduction. There are many quiz questionsabout the images pervading the lectures.RESULTSA portion of the University of Southern California radiologycourse will teach the radiographic anatomy and physiologyin a most unusual way.Computer Assisted Exhibit 40Comprehensive Diagnostic Evaluation of Cervical SpineTraumaGentry, L. R. · Hartman, M. J. · Pulfer, K. A.University of WisconsinMadison, WIPURPOSEThis scientific exhibit reviews the current state-of-the-artsfor diagnostic imaging of cervical spine trauma using multipleimaging modalities. The mechanisms of injury, typicalpatterns of fracture, common complications of cervical spinefractures are reviewed. The clinical features of traumapatients that dictate which should be imaged and what imagingmodality should be used are discussed. An algorithmicapproach is presented for guiding the diagnostic evaluation.Diagnostic pitfalls are presented. The results of this study arepresented in an interactive multimedia format (audio, video).MATERIALS & METHODSThe diagnostic images (conventional radiographs, CT, 3DCT, MR imaging, MR angiography, CT angiography, flexion-extensionradiographs) of 174 consecutive patients withcervical spine fractures were reviewed retrospectively andthe diagnostic studies analyzed.RESULTSA wide array of probable fracture mechanisms was identified(hyperflexion, hyperextension, lateral hyperflexion, axialloading, shearing, complex). The major complications thatwere observed included (cord contusion-transection, vertebralartery injury, intraspinal hematoma, spinal cordhematoma, dural tear, nerve root and brachial plexus avulsion,traumatic disk herniation, ligamentous injury, cervicaldislocation).CONCLUSIONMultiple imaging modalities often are required to identifyand classify cervical fractures and to assess for the myriad ofcomplications resulting from these fractures. The use of MRimaging and occasionally flexion-extension radiographs areessential for assessment of ligamentous injury that may bemissed on CT imaging. Multislice thin-section CT is of paramountimportance for identification of fractures and 3D CTmay be helpful for surgical planning. MR angiography andCT angiography are essential for assessing for potential vascularinjury.KEY WORDS: Trauma, cervical spine, imaging
467Index of Program ParticipantsNumbers refer to session and presentation numbers, not to page numbers.Index Key: C = Computer Assisted Exhibit; I = Invited Speaker; O = Oral Paper; P = Poster; S = Scientific ExhibitAAagaard-Kienitz, B. O-299, O-378,P-137, P-114Abduljalil, A. O-60, O-169, O-271,O-196Abe, H. O-374Abe, O. P-67, S-47Abe, T. S-90, S-91Abe, Y. P-80Abrantes, Y. S-54Abruzzo, T. A. O-253, O-343Acharya, D. P-185Adachi, Y. P-69, P-171, S-52Adzick, N. S. O-83Agid, R. C-3Agostinis, C. P-175Agran, S. D. C-4, O-287Aguinaldo, J. G. S. O-2, O-6, S-6, S-7Aguirre, G. K. P-184Ahn, K. J. S-39Akpek, S. O-297, O-305, P-88Aksoy, U. P-53Al-Ali, F. P-148Alamowitch, S. S-2Alavi, A. O-223Albayram, S. O-127, O-176, P-102Albers, G. W. O-364Albuquerque, E. S-30Alexander, A. L. O-269, O-273Allison, J. D. O-217, O-218Al-Okaili, R. O-72, O-235Alonso, J. P-23Alsop, D. O-320Altman, N. R. I-9cAlves, E. A. C-5Amiridze, N. P-76Ammash, N. M. O-144Anaya, C. C-24Anaya, C. A. P-112, S-112Ances, B. M. O-223, O-286, O-296, P-6Anderson, D. O-306, P-121Anderson, J. P-176, S-115Andreux, F. S-2Andrews, G. S-12Angulo-Suarez, M. O-141Anik, I. O-130Anik, Y. O-130Anixter, Y. O-133Anlar, B. P-153Antonello, M. S-100Anzai, Y. I-20a, O-168Anzalone, N. O-148Aoki, S. P-2, P-67, P-69, S-47Appignani, B. O-191, O-320, P-59Arabi, B. P-76Aragao, M. S-30Arakawa, H. O-202Araki, T. P-69, S-52Aralasmak, A. S-17, S-21, S-22, S-29Arat, A. O-305Arch, M. E. S-104Arimura, H. O-374Arisako, T. P-79Armstrong, D. O-122Arriaga, M. S-64Arslan, A. O-130Asakura, T. P-29Asavaphatiboon, S. P-36Ashwal, S. P-157Asis, M. P-90Assaf, B. O-94Astor, B. O-372Auler, M. O-235Aviv, R. I. O-122Aygun, N. P-99Aylward, S. R. O-310Aymerich, X. P-23Azevedo Filho, H. S-30Aziz, A. S-103Azzini, C. P-84BBabb, J. O-268Babiarz, L. S. O-68, O-372Badie, B. O-215, O-269Badjatia, N. O-342Bagla, S. O-307Bagley, L. J. O-366Bagnato, F. O-291Baik, S. P-78Bailey, D. M. O-102Baimouratov, R. C-13Bainbridge, A. P-17Baker, K. B. O-160, P-132Baker, M. O-232Baker, M. D. O-209Balan, A. O-217Baldwin, R. O-69Balériaux, D. L. F. O-216, O-344, P-54,P-89Balivada, S. O-350Ball, R. P-166Ball, Jr. W. S, O-118Bamji, N. O-89Bammer, R. P-37Bandak, F. A. I-3bBannigan, J. G. O-375Barbut, D. O-256Barker, P. B. O-11, O-127, O-180, P-57Barkovich, A. J. I-40e, O-36, O-40,O-41, O-46, O-88, O-181, P-161,P-166Barnes, P. D. I-3cBarnewolt, C. E. O-24Barr, J. D. I-62aBarragàn, H. P-109Barragan-Campos, H. M. P-120, O-201Barry, K. A. S-79Barshop, B. O-82Barth, R. F. O-170Bartlett, E. S. S-14Bartling, S. O-27Bartsch, P. O-102Bartumeus, F. P-49Bartynski, W. S. O-207, P-86, P-169,P-177Barutca, H. O-176Baruzzi, F. P-175Basham, M. C. S-15ABassett, S. S. O-346Basso, G. P-57Bassuk, A, O-92Batchu, C. S. S-67Bauknecht, H. C. P-12Bautista, I. P-45Baykal, A. C-7Beason-Held, L. O-158Beck, M. R. O-250Becker, H. O-61Becker, K. O-194Becker, T. C-22Becker, W. O-251Becker, W. P. O-67Belanger, E. O-211, O-248, P-178Belden, C. I-33b, O-307Belkoff, S. M. I-57eBendok, B. O-152Benndorf, G. O-297, O-305, S-86Bennett, K. M. O-48Benoza, E. C-22Benseler, S. M. O-122Ben-Zeev, B. O-133Berding, G. O-61, O-65Berger, K. L. O-321Berger, M. S. O-53Berger, R. P-160Berlet, M. H. S-88Berman, J. I. O-46, O-177Bernstein, R. A. O-330Bert, R. J. O-5, O-106, O-135Besada, Sr., C. H. S-38Besenski, N. P-11Bhadelia, R. A. O-116, O-135Bharija, A. P-15, P-38Bhatia, R. G. O-245Bhatti, T. O-75Bianchessi, D. O-50Bianchini, E. P-164Bigozzi, M. S-100Bilaniuk, L. T. O-83, O-182Bilker, W. O-68Bink, A. O-7Biondi, A. O-258, P-109Bisdas, S. O-61, O-65Bissola, L. O-50Bittoun, J. O-162Black, S. O-15Program Participants
Program Participants468Blackmore, C. I-51bBlaicher, W. O-37Blaser, S. I. O-39, P-154, P-154A, S-96,S-97, S-103, S-107Blenman, R. M. S-31Blumenthal, D. O-261Bluml, S. O-42, O-43Bobinski, M. O-308Boch, A. L. O-258, P-109Boesiger, P. O-4, O-212Bogdahn, U. O-327Bohner, G. O-315, P-12Boldorini, R. O-275Bolesta, M. P-176Bonaldi, G. P-175Bonamini, M. O-199, O-292Bonfante, E. P-24Bonneville, F. O-258Boop, F. A. O-3Boor, R. P-151Boor, S. O-265, P-151Booth, T. N. O-26, O-119Borba, P. C-5Borras, C. P-23Borrelli, M. P-84Boulos, A. S. O-307Bourdette, D. O-197Bourekas, E. C. O-153, P-146, O-365Bourne, M. O-139Boutin, S. M. C-38Bowden, J. O-334Boxerman, J. L. O-51Boyko, O. B. S-24Bozzao, III, A. O-174, O-178, O-199,O-292Bracard, S. P-120Bradley, Jr. W. G. O-104Brady, T. O-27Branco, F. C, O-348Brand, N. O-133Branstetter, IV, B. F. O-33, O-34, O-115Brant-Zawadzki, M. N. O-172, O-242Brat, D. J. O-188Brefczynski-Lewis, J. A. S-19, S-28Brennan, P. O-249, O-334, O-375Brenner, C. O-131, O-132Brenski, A. O-26Brew, S. O-339Britton, J. W. O-98Britz, G. O-367Broderick, D. F. O-281, S-104Brotchi, J. O-344, P-89Brown, K. O-224Brown, Jr., R. D. O-144Brown, T. C-2Brown, W. R. O-209Bruce, J. O-311Brugger, P. C. O-37, O-87Brum, J. M. O-131, O-132Bruzzone, M. G. O-50Bryan, R.N. I-36bBudisavljevic, M. P-11Bulakbasi, N. P-47Bun, K. O-184, P-165Buonanno, F. P-4Burdette, J. H. I-63aBurger, P. O-127Burnet, N. G. P-56Burns, A. O-69Burrowes, D. M. C-33, O-92, P-152Burton, P. C. O-351Buswell, H. O-239, O-240Butman, J. A. C-10, O-29, O-291, P-70,S-27Butowski, N. O-262Buvat, I. O-162CCacayorin, E. D. P-24Cacciarelli, A. P-94, P-100Cadioli, M. O-148Caetano-Barros, A. O-348, O-349Caffo, B. S. O-346Calado, E. O-93Calhoun, V. D. O-213, O-214Cama, A. O-84Camp, J. C-21Campbell, B. H. P-135Campeau, N. G. J. O-98, P-21Campi, A. O-4Cantolo, A. C. P. P-20Carballido-Gamio, J. O-40Care, M. M. O-118Carlos, R. O-32, O-238Carneiro, G. S-30Carpenter, A. P-56Carpenter, J. O-356, S-51Carr, J. O-143Carrel, C. E. P-100Carriero, A. O-275Carroll, T. J. C-1, O-143, O-330, P-31Carson, B. O-127Cartaxo, H. Q. C-5, O-348, O-349Carter, B. S. O-342Cartes-Zumelzu, F. W. O-198Caruso, P. O-27, O-30Carvajal, A. S-43Casagrande, I. S-100Casey, S. O. P-90Cashen, T. A. O-330Cassady, C. O-123Cassell, M. P-129Cassot, F. O-298Castaño, C. P-49Castillo, M. C-15, O-198, P-35Caulo, M. O-126, O-352, S-109Cawley, III, C. M. O-253, O-343Cebi, D. P-102Cecil, K. M. I-19b, O-118Celik, H. P-48, S-40Cerase, A. O-276, S-109Ceruti, S. P-84Cesar, L. C-24, O-255, O-301, O-360,P-112Cevasco, F. I. O-77Cha, I. H. S-32, S-70Cha, S. C-8, I-19c, O-53, O-56, O-262,O-264Chakeres, D. W. O-60, O-153, O-170,O-271, P-146Chaljub, G. P-172Challa, V. R. O-209Chaloupka, J. C. O-250, O-259, O-340,P-129Chalubinski, K. O-37Champagne, M. P-162Chan, J. K. O-76, O-109Chan, R. O-233Chandra, P. S. O-95, O-96Chang, C. Y. P-123, S-94Chang, F. C. P-123, S-94Chang, J. P-55Chang, J. K. S-4Chang, P. S-60Chang, S. O-53Chao, C. P. O-281Chao, K. C-2Chao, S. D. O-88Chappel, P. P-87Charlton, N. O-181Chason, D. P. O-318, P-176, S-115Chaudhury, A. O-170, O-271Chaumoitre, K. O-38Chen, C. C. C-31, S-60Chen, C-J. O-371Chen, C-Y. O-78Chen, C-y. P-83Chen, D. S-64Chen, H. J. P-77Chen, J. J. O-34Chen, M. Y. P-3Chen, W. S. S-60Chen, X. O-47, P-74Chen, Y. O-358Chen, Y. H. S-72Chenevert, T. L. P-33Chepeha, D. B. O-32Chia, J. O-119Chiang, A. P-111Chieregato, A. P-84Chin, C. O-224Chin, S. O-78, P-95Chiras, J. O-258, O-201, P-109, P-120Chitayat, D. O-39, P-154, P-154A,S-96, S-97Choi, C. G. O-64, S-34Choi, M. H. P-183Choi, P. S. S-13Choi, Y. P-1Choksi, V. R. O-238, O-241, O-314Chong, J. P-40Choudhri, T. S-114Christ, S. O-102Christofferson, J. O-239Numbers refer to session and presentation numbers, not to page numbers.Index Key: C = Computer Assisted Exhibit; I = Invited Speaker; O = Oral Paper; P = Poster; S = Scientific Exhibit
469Christoforidis, G. A. O-60, O-153,O-169, O-170, O-271, O-365, P-55,P-146, S-41Chugani, H. P-157Chugh, M. P-126Chung, E. P-68Chung, J. S-65, S-66Church, D. G. O-121Cifaratti, A. O-126, O-352Cila, A. P-153Cloft, H. J. O-300, P-117, P-130Cohen, K. O-127Cohen, W. A. O-194Cohen-Gadol, A. A. O-98Colangelo, V. P-14Coleman, C. O-362Colleoni, M. L. O-219Colosimo, C. O-126, O-139, O-276,O-352, P-63, S-109Comi, A. O-180Confort-Gouny, S. O-38Connolly, D. J. A. O-44Connolly, H. M. O-144Connor, S. E. J. O-192Connors, III, J. J. I-58cConrad, L. K. O-342Consigny, D. O-299, P-114Conturo, T. E. I-17cConvit, A. J. P-13Cool, D. W. O-310Cooper, S. O-160Cormier, E. O-201Corona-Cedillo, R. O-189Cortes, M. D.P O-117Costa e Silva, I. S-30Costa Neto, A. O-348Coutts, S. O-15Coutts, S. B. O-195Covarrubias, D. J. P-81Cozzone, P. O-38Craddock, D. C. P-3Craig, E. O-306, P-121Crandall, M. L. O-73Crawford, F. W. O-53Crawley, A. I-34d, O-120Cristinzio, C. O-346Cross, B. J. O-279, P-93Cross, D. J. O-168Cross, III, D. T. O-335Crummy, T. A. O-73Cullen, S. P. O-56, O-285Curran, J. C-33, P-152Curtin, H. O-27, O-30Curtin, J. S-99Curtin, K. R. C-1, C-35, O-152,O-330,P-31Curtis, L. O-202Cusick, J. F. O-66, S-85Czernin, J. G. O-129Dda Cruz, Jr. L. C. H. P-20, P-52, P-167Dai, D. P-117Dai, J. P-108Dailey, A. T. O-239, O-240Daitzchman, M. S-54Dalley, R. W. I-33cDamaerel, P. O-139Daneman, A. S-103Daniels, D. L. O-377, P-135, S-22, S-29, S-85Danielson, M. A. P-117Dansie, D. M. O-205Darwish, R. P-76David, P. O-216, P-89Davidson, H. C. I-33aDavidson, K. O-156De Juan, M. P-49de Leon, M. J. O-308, P-13De Nicola, A. O-352De Santi, S. O-308, P-13De Simone, T. O-50De Witte, O. P-54Dean, C. O-75Debus, J. O-316Decarie, J. P-158, P-162De Ipolyi, A. O-41DeLano, M. C. O-321DeLaPaz, R. C-2Delgado, J. E. O-2, O-6, S-6, S-7Dellani, P. R. O-265, O-329Delman, B. N. C-17, O-2, O-6, S-6, S-7,S-13, S-114Delman, B. P. S-7DelProposto, Z. S. P-51, P-157, S-48Delshad, A. S-45DeLuca, F. O-89Demchuk, A. M. O-15, O-195Demidenko, A. S-72Demirci, A. O-130Dempsey, R. J. O-149Denolin, V. O-216, O-344Derdeyn, C. P. C-1, I-36a, I-58a, O-335,P-5Deshaies, E. M. O-307Desilet-Dobbs, D. P-160Despretz, D. O-359Destian, S. S-74Detre, J. A. O-52Deux, J. F. S-2DeVeber, G. O-122Deveikis, J. O-72DeYoe, E. A. O-157, O-347, S-16, S-17,S-19, S-21, S-28Di Lella, G. M. O-276, P-63, S-109Di Rocco, C. S-109Dieguez, Jr., S. S-81Dietrich, R. B. O-82, O-275Dillon, W. P. O-13, O-20, O-21, O-53,O-56, O-264Ding, S. O-221Ding, Y. O-333, P-117Dion, J. E. I-52b, O-253, O-343Do, H. M. I-43e, O-202, O-304, O-363,O-364Doelker, E. O-303Doerfler, A. R. O-67, O-251, O-302,O-337Doi, K. O-374Domingues, Rob. C. P-20, , P-52, P-167Domingues, Rome. C. P-20, P-52, P-167Domingues, Romu. C. P-52Dong, Q. P-33Donnerstag, F. G. F. O-61, O-65Donovan-Post, Jr., J. O-245Doroszuk, G. O-256, P-115Douville, C. O-194Dowd, C. F. I-52cDraganski, B. O-327Drake, J. O-185Drayer, B. P. O-2, O-6, S-6Driscoll, C. C-21, O-31Duckwiler, G. R. I-67a, O-124, P-77Ducreux, D. F. O-162, O-225Dudeck, O. O-303Dumitriu, D. C-2Duncan, I. D. O-273Dunn, D. O-125Dutton, K. P-7Dydak, U. I-48d, O-212, O-324Dymora, M. O-49EEbara, M. S-90, S-91Edmister, W. B. P-21Eisenhuber, E. O-198, O-309Ekholm, S. E. O-12, O-97, O-99, O-295,O-312, P-60, S-35, S-53, S-59Eldevik, P. O-90, O-136, P-168El-Dieb, A. O-346, P-99Ellis, P. A. S-10, S-93Elrington, G. O-283El-Sibai, M. S. C-35Emamian, S. O-111, O-140Emery, C. J. O-274, P-34Emovon, O. P-11Endo, S. P-122Endo, Y. P-13Engelhorn, T. O-67Enochs, W. S. O-77, O-159Eoli, M. O-50Epelman, M. S-103Eran, A., S-54Erbas, G. P-44, P-48, P-88, S-40Erberich, S. G. O-42, O-43Erdogan, C. P-39, P-42Ergin, N. P-39, P-53Ervine, S. L. M O-154Escobar, W. O-361Eskey, C. J. S-105Eskridge, J. M. O-367Esposito, G. O-158Essig, M. O-316, P-58, P-62Program ParticipantsNumbers refer to session and presentation numbers, not to page numbers.Index Key: C = Computer Assisted Exhibit; I = Invited Speaker; O = Oral Paper; P = Poster; S = Scientific Exhibit
Program Participants470Esteves, L. P-167Estroff, J. O-24Etus, V. O-130Evans, A. J. C-37, C-38FFacchinetti, A. P-175Facha, M. O-141, O-189Facon, D. O-225Faibel, M. O-133Fainardi, E. P-84Falcone, S. S-112Fanning, N. F. O-249, O-334Fantozzi, L. M. O-174, O-199, O-292Farb, R. I. C-3, I-47c, P-92Faro, S. H. O-94Fasoli, F. O-174, O-199Fatouros, P. C-7Fatterpekar, G. M. C-17, S-13Felix, R. O-303Felmlee, J. P. S-31Fernandes, A. L. O-93Ferone, E. O-178Ferrante, M. O-199, O-292Ferrari, P. O-355Ferrario, A., O-256, P-147, P-115,P-116, P-118Ferraro, G. R. O-89Ferreira, F. B. P-20Ferretti, A. O-126Ferrier, M. C. P-70Ferriero, D. M. O-46, P-161Feske, S. K. O-151Fetko, N. O-365Feygin, T. O-182Fick, J. R. O-217, O-218Fiebach, J. B. O-16Fiehler, J. O-18, O-19Field, A. S. O-215, O-269, O-273Figueredo, T. O-169, O-271Filippi, M. I-43dFillard, P. O-225Filler, A. G. O-71, O-229Filly, R. A. P-166Finlayson, A. P-66Finnegan, M. O-55Finocchi, V. O-174, O-199Finocchiaro, G. O-50Fiorella, D. O-326Firat, A. K. P-7Fischbein, N. J. I-4c, O-13Fischer, S. O-331, O-332, O-339Fishman, S. O-24Fiskum, G. P-76Fitz, C. R. O-142Fitzpatrick, M. S-98Flagg, E. O-355Flanders, A. E .A. O-159Fleisher, M. A. S-24Fleming, J. O. O-273Flexman, J. A. O-168Flohr, T. O-27Florio, S. O-14Floris, R. O-178, P-14Foerster, B. P-168, S-1Fonda, C. S-100Forejtova, S. P-170Formen, C. C. S-95Forsting, M. O-67, O-251, O-302,O-337Fountain, A. J. S-61Fox, A. J. O-15Foxed, D. O-220Foy, P. P-128Frank, J. A. O-291Fraticola, Sr., G. A. N. S-38Freddo, T. O-106Freitas, M. R. P-167Frid, D. P-13Friedlich, P. O-42, O-43Friedman, A. P-73Friend, C. S-64Frisch, H. O-87Fujikawa, A. O-317, O-325, S-33Fujimoto, H. O-55Fujimoto, T. O-55Fukui, M. B. I-10a, S-64Fur, Y. O-38Furui, S. S-5Futterer, S. F. O-143, O-152, O-246GGaa, J. O-7Gage, N. O-355Gaikwad, S. B. O-95, O-96, O-100,O-254, O-260, P-110, P-126Gailloud, P. O-257, O-356, S-51Gajjar, A. C-32Ganapathy, S. S. S-15Gandhi, C. D. P-113Gandhi, D. O-32, S-80, S-83Garaci, F. G. O-178, P-14Garcia-Morales, F. O-312Garg, A. O-95, O-96, O-100, O-254,O-260, P-110, P-126Garitey, V. O-298Gasparotti, R. O-14, O-219Gaudiello, F. P-14Gauvrit, J. O-359Gavin, C. G. O-375Gawehn, J. O-150, O-265Ge, Y. O-200Gean, A. D. O-10Geniets, C. O-313Gentry, L. R. C-40, S-73, S-75, S-82Gentzsch, S. P-85Georgy, B. A. O-208, O-210Germin, B. O-295Ghodke, B. V. O-367, O-338Ghosh, N. C-27Giampietro, A. O-275Gianotta, S. L. S-56Giesel, F. O-316Gilday, D. S-107Giles, B. P. P-7, P-138, P-139Gillard, J. H. P-56Gilles, F. O-43Girard, N. J. O-38Gispert, S. O-103Given, II, C. A. S-10, S-93Gkogkas, C. O-151Glaser, M. O-329Glasier, C. M. O-9, O-187Glastonbury, C. M. O-10Glenn, O. A. O-36, O-46, P-166Go, J. L. C-22, O-230, O-243, S-56Gobuty, S. O-88Goddard, III, J. K. O-335Godelman, A. S-82Goebels, N. O-4Goericke, S. L. O-67, O-251, O-302,O-337Goh, J. P. N. S-73Golan, H. P-73Goldman, R. O-185Goldsher, D. S-54Goldstein, R. B. O-36Golski, S. O-158Gomez, F. O-361Gomez-Hassan, D. O-164Gonzalez, G. R. O-63, O-341, O-195,O-45, O-196, O-285, O-17, P-4, P-81Gonzalez de la Aleja, Jr., J. S-81Gorgoglione, A. O-126Gorniak, R. J. T. P-82Goulao, A. O-146Goulet, B. P-173Gounis, M. J. C-24, O-255, O-301,P-112Goyal, M. O-15, O-211, O-248, O-288,P-178Goyal, N. O-159Grahovac, S. Z. O-207, P-169, P-177Grant, P. E. I-17b, O-45, S-106Grasruck, M. O-27Grattan-Smith, D. O-128, S-99Graybeal, D. F. P-7Green, H. A.L P-56Griffiths, P. D. O-23, O-85, O-86, O-91,O-179, O-274, P-8, P-34Grivé, E. O-103, S-43Griz, M. S-30Grooff, P. O-242Grossman, R. I. O-200, I-37cGruber, A. P-85Grunet, P. O-329Gu, T. O-167Guàrdia, E. P-49Guilbert, F. O-336Guillevin, R. P-120Guiot, M. C. P-173Gujar, S. S-80, S-83Gulsen, F. O-176Gultekin, H. S. O-6, S-7Numbers refer to session and presentation numbers, not to page numbers.Index Key: C = Computer Assisted Exhibit; I = Invited Speaker; O = Oral Paper; P = Poster; S = Scientific Exhibit
471Gultekin, S. P-48, S-40Gundogan, M. O-39, P-154, P-154A, S-96, S-97Gunny, R. O-192Guo, W. P-16, S-94Gupta, A. O-100Gupta, A. S. O-113Gupta, R. O-27Gupta, S. O-291Gupta, S. N. P-70Gupta, V. O-95, O-96, O-100, O-254,O-260, P-110, P-126Gusdorff, J. M. S-61Guvenc, I. P-47HHaacke, E. M. P-51, P-157, S-48Haas, R. H. O-82Hacein-Bey, L. O-59, O-66, O-166,O-347,O-377, P-135,S-16, S-17, S-19,S-22, S-29, S-85Hackney, D. B. O-175, O-224, O-294,O-320, P-180Haddar, D. P-51, S-48Haidar, S. S-107Haig, A. J. O-238, O-241Hakyemez, B. P-39, P-42, P-53Halbach, V. V. O-56Halgren, E. O-220Hall, C. D. O-310, P-35Hall, M. O-121, O-306, O-362Hallam, D. K. O-73Halvorsen, Jr., R. A. C-7Hamberg, L. M. P-4Hamburger, M. O-193Hammoud, D. A, P-57Hamner, L. P-66Hampton, T. J. O-192Han, J. H. P-140Harada, M. O-270Harder, D. R. O-59, O-66Hardy, S. M. O-28Harlin, D. C. P-135Harnsberger, H. R. I-28b, O-58A ,O-107, O-113Haroon, H. A. O-293Harrigal, C. L. O-115Hartman, M. J. C-40, O-215Hartmann, M. O-190Hasso, A. N. I-20cHatabu, H. P-29Hatfield, L. O-180Haughton, V. M. I-40a, I-40c, O-156,O-167, O-186, O-215, O-277, O-278Havelka, S. P-170Hayashi, N. P-67, S-47Hayashida, Y. O-105, P-41He, J. O-285Heagerty, P. J. P-185Heaney, C. J. O-98, P-21Heck, D. O-356Heimberger, K. P-85Heise, M. O-303Heller, M. T. P-169Helton, K. J. C-32, O-3Henderson, G. V. O-151Henkes, H. O-339, O-331, O-332Henry, R. G. O-40, O-41, O-46, O-177,O-181Henson, J. W. P-81Herbert, J. O-200Herman, B. A. S-71Hernandez, J. A. P-172Herraiz, Jr., L. S-81Herrera-Mora, P. O-141Hesselink, J. O-319Hetts, S. W. O-88Heverhagen, J. T. O-60, O-169, O-170Higano, S. P-72Higashi, M. S-55Higashida, R. T. O-20Hill, A. O-128AHimel, A. O-89Hirai, T. O-105, O-374, P-41, P-79,P-182Hirohashi, S. P-64Hirsch, J. A. O-341, O-342Hitzler, J. K. S-107Hiwatashi, A. O-12, O-97, O-99, O-295,O-312, P-60, S-35, S-53, S-59, S-89Hochhauser, L. S-102Hoeffner, E. G. O-314, S-76Hoelscher, T. O-327Hof, P. R. O-2, O-6, S-6, S-7Hoffmann, C. O-133Hoffmann, K. T. O-303Hogan, M. O-15Hoghooghi, D. O-56Hogstrom, B. O-139Hoh, B. L. O-342Hoit, D. A. P-75Holliday, R. A. S-82Hollingworth, W. O-73Holodny, A. I. I-63bHoneycutt, N. A. O-346Hong, X. O-47Honya, K. O-317, O-325, S-33Hori, M. P-69, S-52Hori, Y. P-124, P-142, S-69Horii, K. A. O-121Horsley, W. O-57Hourani, R. O-127House, M. O-116Howard, Jr., F. M. S-89Hoxworth, J. M. O-262Hseih, J. O-328Hsieh, H. O-358Hsu, H. O-371Hsu, S. O-221Hsu, S-W. O-250, O-259, O-340, P-129Hu, J. P-157Huang, S. C-13Hudgins, P. A. O-110, S-61, I-37bHudgins, R. J. O-128Hudkins, M. P-156Hui, F. C-34Hund-Georgiadis, M. P-22Hung, H. C. S-60Hunter, G. J. P-4, S-8Hunter, J. V. I-48b, O-123Hurst, R. W. O-279, O-286, O-366,O-370, P-6, P-184Huston, III, J. O-144, O-368Hyde, J. S. O-48Hynan, L. S. P-7IIadanza, A. O-148Ibaraki, M. P-2Ifthikharuddin, S. F. O-284, S-108Iihara, K. S-55Ikeda, R. O-374Ikushima, I. P-182Ilik, S. P-88Imai, K. P-131, P-133Imai, M. P-96Imakita, S. S-55Imaoka, I. S-111Imbesi, S. G. O-165, O-222, O-354Inagawa, S. O-147, P-96Irie, K. S-90, S-91Ishibashi, T. S-90, S-91Ishigame, K. P-2Ishiguro, A. P-150Ishii, M. O-58Isik, I. P-42Iskandar, B. O-186, O-277, O-278Islak, C. O-176, P-102Isoda, H. O-147, P-96Isogai, S. O-147Ison, C. O-119Itakura, T. P-98, P-144, P-145Ito, H. O-137Ito, R. O-184, P-165Itoh, D. P-67Ivanovic, V. O-80Iwasaki, IV, S. C-28Iwasaki, S. P-64Iwata, N. S-47Izumoto, H. P-131, P-133JJack, C. R. O-98Jackson, A. O-69, O-173, O-293Jackson, E. F. O-351Jackson, H. A. O-129Jaermann, T. O-4, O-226Jahan, R. P-77Jain, R. S-67, S-83Jakacki, R. I. O-142James, B. D. O-208Janik, J. O-347, S-19Janjua, K. S-23Jaramillo, D. O-114Program ParticipantsNumbers refer to session and presentation numbers, not to page numbers.Index Key: C = Computer Assisted Exhibit; I = Invited Speaker; O = Oral Paper; P = Poster; S = Scientific Exhibit
Program Participants472Jarrin, J. S-103Jarvik, J. G. O-73, P-185Jatrow, U. O-8Jawad, A. F. O-224Jayakumar, P. N. O-350Jayaraman, M. V. O-202, O-304Jean, B. O-258, O-201, P-109, P-120Jeffries, S. O-69Jellison, B. J. O-269Jenkins, III, A. L. S-114Jennings, J. E. O-90, O-136, P-168, S-1Jennings, R. O-24Jensen, T. R. O-157Jess, S. J. R O-58AJewells, V. L. O-28Jin, H. O-41, P-161Jin, Y. P-104Jinkins, J. R. I-57bJohn, C. O-271Johnson, D. P. O-12AJohnson, D. M. P-113Johnson, G. O-264, O-193, O-200,O-268, O-323Johnson, M. C. O-340Johnson, M. P. O-83Jones, J. G. O-187Jones, J. O. O-283Jones, R. O-128Jones, W. O-57Jordan, O. O-303Joseph, A. M. S-42Joshi, A. O-92Judy, K. D. O-52Juhasz, C. P-157Jumper, J. R. P-166Jung, S. L. S-39KKabasawa, H. S-47Kado, H. P-30Kahhale, K. C-5Kalapos, P. O-15Kallenberg, K. O-8, O-102Kallmes, D. F. O-205, O-333, O-368,P-117, P-130Kalnin, A. O-125Kampangtip, A, P-36Kan, W. K. O-76, O-109Kanamalla, U. S. S-24Kang, H. K. P-140Kanne, J. P. O-73Kanodia, A. K. O-95, O-96. O-100Kappos, L. P-27Karagianis, A. O-246Karamchandani, R. O-32Karli Oguz, K. P-153Karmonik, C. O-297Kasprian, G. O-37Kassab, M. Y. P-7Kassner, A. I-34d, O-120, O-266,O-289, A. P-92Kato, R. O-203, O-231Katsuragawa, S. O-374Kauczor, H. P-62Kaufer, D. P-73Kaufmann, T. J. O-368Kawamura, Y. O-137Kazmierczak, C. S-63Keating, G. P-152Keating, R. O-140Keiper, M. D. O-57Kellenberger, C. J. S-103Keller, A. O-163, O-266, P-18Keogh, B. P. O-161Keogh, C. S-12Ketonen, L. O-12, O-97, O-99, O-295,O-312, P-60, S-35, S-53, S-59Khaled, K. J. O-94Khan, A. M. P-100Khan, R. B. O-3Khawar, S. A. O-330, P-31Khosla, A. C-36, P-107, P-174Khwaja, A. B. O-12AKichikawa, IV, K. C-28, P-64Kidwell, C. P-77Kieffer, S. P-90Kilic, E. P-39, P-42Kilpadikar, A. A. O-187Kim, B. S-39Kim, D. P-155, P-1Kim, E. Y. P-50, P-97Kim, F. C-33, P-152Kim, H. S-34Kim, H. J. O-64, P-1Kim, H-J. S-68Kim, I. S. S-70Kim, J. P-155Kim, J. H. S-32, S-70Kim, J. K. O-154, P-140Kim, M. S. P-10Kim, P. E. C-22, O-230, O-243, S-45,S-56Kim, S. J. O-64, S-34Kim, S. K. P-140Kim, S. S. P-50, P-97Kim, T. S-70Kimura, H. P-30King, D. W. O-218Kingsley, P. B. O-353Kini, S. P-11Kip, K. E. C-38Kirby, P. A. O-267Kirchin, M. O-139, P-58, P-62Kirsch, C. O-283Kirsch, E. C. P-27Kirsch, R. O-315Kiryu, S. O-175Kitagaki, H. S-111Kitahara, S. O-184, P-165Kitajima, M. O-105, P-79Kitzler, H. O-49Kiyosue, H. P-124, P-142, S-69Klingebiel, R. O-315, P-12Klotz, E. O-16, O-190, S-91Klucznic, R. P. O-297, O-305, O-357Klufas, R. A. O-151, O-246Knacke, S. O-220Knauth, M. O-8, O-102Knight, T. E. O-321Knopp, E. O-193, O-323Knopp, M. V. O-60, O-169, O-170, P-58Knosp, E. O-198, P-85Ko, N. U. O-13, O-21Kobayashi, N. O-203, O-231, S-113Kocer, N. O-176, P-102Kocer Gelebek, I. P-153Koch, B. L. I-27c, I-27dKodama, T. P-61, S-84Koeller, K. O-261Koenigsberg, R. O-280Kofler, J. I-51dKoganemaru, M. P-182Kogut, M. O-365Kollias, S. S. I-47b, O-226, O-227,O-272Kondo, Y. S-69Konen, O. S-103Koopmans, S. O-82Kopell, B. O-160Koren, A. P-73Korf, B. R. O-114Korogi, Y. O-105, O-374, P-41, P-79,P-182Koroshetz, W. J. O-17, O-195, O-196,P-4Kostanian, V. J. C-31, P-143Kosugi, T. O-147Kotsenas, A. L. O-281Koyama, M. O-58Kranz, P. O-28Kraut, M. A. O-158Krecke, K. N. O-368Krezja, J. P-184Krishnamoorthy, K. S. O-45Krishnan, A. R. O-110Krol, G. S. C-29Kronenberger, W. O-125Krouwer, H. G. J. O-51, O-54, O-166,O-263, P-46, S-16, S-18, S-20, S-21,S-25, S-36, S-42Krupinski, E. O-152Krupinski, El. O-152, O-373, O-376Ksar, J. O-90, O-136, P-168Ku, A. S-64Kubo, H. O-270Kubo, M. P-122Kucinski, T. O-18, O-19Kuehne, D. O-331, O-332Kuhl, C. K. I-48cKühne, D. O-339Kumar, A. P-110Kupsky, W. J. P-51Kurokawa, IV, S. C-28Kusevic, I. O-346Kushnir, T. O-133Numbers refer to session and presentation numbers, not to page numbers.Index Key: C = Computer Assisted Exhibit; I = Invited Speaker; O = Oral Paper; P = Poster; S = Scientific Exhibit
473Kutomi, K. S-5Kutschke, G. P-151Kuwayama, N. P-122, P-125Kwiecinski, S. O-226, O-227, O-272Kwon, J. K. S-98LLacout, Jr., A. A. P-105Lai, A. O-264Lai, P. O-221Lai, S. O-159Lall, A. O-142Lane, J. I. C-21, O-31, O-205, P-21,P-181Lane, T. P-176, S-115Lanfermann, H. O-7, O-62Langston, J. W. C-32Lankhkar, B. P-15, P-38Laothamatas, J. P-36Larsen, M. O-92Larson, T. L. I-28aLasjaunias, P. O-162, O-225Laskas, J. O-159Lasky, A. P-149Lau, K. Y. O-76, O-109Lauer, K. K. O-59, O-66Laughlin, S. P-154ALaundre, B. J. O-269Lavin, T. B. O-217Law, M. O-193, O-200, O-268, O-323Le, T. H. O-177Leao, C. S-30Leclerc, X. O-359Ledezma, C. J. O-17, O-63Lee, A. O-109Lee, A. W. M. O-76, O-109Lee, B. C. S-114Lee, C. S-10, S-93Lee, D. H. O-64, S-34Lee, D. W. P-111Lee, H. G. S-58Lee, H. M. S-32Lee, H. K. O-64, S-34, S-68Lee, J. O-266Lee, J. H. S-32Lee, J-H. O-64, S-34Lee, J-Hu. S-32Lee, J. J. P-5Lee, J. S. C-17, S-78Lee, J. Y. P-10Lee, K. C-31Lee, K. W. S-58Lee, M. R. O-218Lee, M. S, P-10Lee, N. J. S-32, S-70Lee, S. K. O-250, O-259, O-340, P-129Lee, Seu-K. P-1, P-155Lee, T, S-60Lee, T-Y. O-15Lee, T-H. O-371Lee, T-K. P-1Lee, Y. H, P-10, S-32Lee, Y. J. P-155Lee, Y. Z, O-28Leeds, N. E. I-40bLefranc, F. P-89Lefton, D. R, O-282Le-Huu, M. P-62Leimig, C. O-348Leite, C. C. C-5, P-32Lejeune, J. O-359Lemke, D. M. O-66, O-377, P-135, S-85Lenkinski, R. O-191, O-320, P-59Lenkinski, R. E. O-294Leprini, E. O-112Lev, M. H. I-34b, O-17, O-63, O-195,O-196, O-285, O-341, P-81Lev, S. P-183, S-50, S-72Levine, D. O-24Levivier, M. O-344, P-54, P-89Levrier, O. O-298Lewandowski, R. J. O-244, P-43Lewis, D. O-194Lewis, D. A. P-117Li, J. O-308Li, K. L. O-293Li, K. O-221Li, Q. O-374Li, T. O-125Li, X. C-8, O-262Liang, L. O-322Lieber, B. B. C-24, O-255, O-301, P-112Liebeskind, D. S. O-223, O-279, O-286,O-296, O-366, O-370, P-6, P-93, P-184Liebig, T. O-331, O-332, O-339Lignelli, A. C-2Lim, C. C-34Lim, K. O-161Lin, D. O-180Lin, E. C-2Lin, Q. P-108Lin, W. O-28, O-310, P-35Lindell, P. E. P-181Lindquist, D. M. O-9Linfante, I. P-119, S-88Linnell, G. P-136Lipsich, J. P-158Lirng, J. F. P-16, P-123Lis, E. C-29Liserre, R. O-14, O-219Lister, J. P-86Litzau, D. W. O-261Liu, H. O-358, P-9, P-16, S-101Liu, J. P-104Lo, D. O-201Lodemann, K. P-58, P-62Loevner, L. A. I-40d, O-70Lohmann, G. P-22Longridge, N. S. O-117Lopez, C. J. O-45Loureiro, R. C. S. C-5, O-348Lovera, J. O-197Lowe, L. H. O-121, P-149, S-95Lowe, M. J. O-160Lring, J. S-94Lu, Y. O-41, P-161Lubicz, B. O-359Lucato, L. T. P-32Luciano, J. M. O-370Ludovici, A. P-14Luetmer, P. H. O-205Lufkin, R. B. I-4bLum, C. O-211, O-288, P-178Lunghi, A. P-175Luo, C. B. P-123, S-94Lupo, J. M. O-53, O-56Lutzker, S. L. P-24Lylyk, P. O-256, P-26, P-115, P-116,P-118, P-147MMa, X. C-30Maas, L. C. O-40Maccagnano, C. O-50Maciejewski, M. O-347, S-19Madi, S. O-159Madison, M. T. O-204Maeda, H. P-182Maes, M. O-237, O-313Magoni, M. O-14Mahankali, S. O-351Maira, G. O-276, S-109Makoroff, K. L. O-118Malek, A. P-75Mallesh, A. C-9, S-46, S-63, S-79,S-110Maly, P. V. O-90, O-136, O-164, P-168Mamourian, A. C. O-12AManenti, G. O-178Manfrè, L. I-57aManley, G. T. O-177Manninger, S. O-197Mannon, L. O-200Mantha, A. O-297Maqsood, M. O-196Maravilla, K. R. O-161, O-168Marcellus, M. L. O-364, O-363Mardighian, D. O-14, O-219Marentette, L, J, S-37Marín, M. A. S-81Mariushi, W. M. O-331, O-339Mark, L. P. S-22, S-25, S-26, S-29Markham, J. P-5Marks, M. P. O-202, O-304, O-363,O-364Marlow, T. J. O-107Maroon, J. C. O-115Marquis, Jr., R. O-294Marro, B. S-2Marsault, C. S-2Marsh, R. W. O-98Marshall, A. F. O-28Marsot-Dupuch, K. F. P-101, P-105,P-106Program ParticipantsNumbers refer to session and presentation numbers, not to page numbers.Index Key: C = Computer Assisted Exhibit; I = Invited Speaker; O = Oral Paper; P = Poster; S = Scientific Exhibit
Program Participants474Martin, A. J. O-20Martin, R. C. O-351Martín, C. S-44Martinez-Lopez, M. O-141Martín-Landrove, M. P-45Martinovic, E. P-92Martins, C. E. S. O-131, O-132Maruyama, K. P-67Marziali, S. P-14Massager, N. O-344Massand, M. G. O-228Masumoto, T. P-67, S-47Masuo, O. P-98, P-144Masutani, Y. P-2, P-67, S-47Mater, A. O-185Mathern, G. W. O-134Matheus, G. C-15Mathews, V. P. O-125, S-16Mathis, J. M. O-233Matias, S. S-62Matsuda, K. M. O-45Matsumoto, H. P-98, P-144Matsumoto, S. P-124, S-69Matsuo, M. S-111Matsusako, M. O-203, O-231, O-234,S-113Matula, C. O-198Mawad, M. E. O-297, O-305, O-357May, H. O-55McAnulty, A. P-176, S-115McCandliss, B. I-9a, I-9bMcCarthy, R. O-143McClay, J. O-26McCurdy, J. O-266McDonald, B. C. O-12AMcFadden, K. A. O-142McFarland, H. F. O-291McFarland, W. R. O-55McGough, P. F. S-57McGraw, E. M. S-104McGregor, J. O-271, P-55McKinney, A. P-90McQuillen, P. O-46Meagher, S. S-76Medow, J. E. O-328Medvedev, G. S-12Meglio, M. O-276Meier, H. T. O-59Melançon, D. C-27, P-136, P-173Melhem, E. R. O-127, O-52, O-223,O-286, P-6, P-184Meli, F. P-26Mello, W. D. O-132Mendelsohn, D. B. O-318Mendland, M. F. O-264Menold, E. O-102Merchant, S. O-30Mermuys, K. P. P-87Metcalfe, R. O-297Metens, T. O-216, P-89Metzger, G. J. P-134Meves, S. O-327Meyer, G. A. O-166, S-17, S-42Meyer, R. O-303Meyohas, Sr., M. M. P-101Michaels, S. J. S-10, S-93Michals, E. S-71Mikhelashvili-Browner, N. O-213,O-214Mikulis, D. J. I-34d, O-120, O-162,O-289, P-18, P-92, S-14Miller, D. A. P-179Miller, D. H. P-17Miller, G. M. S-57Miller, S. O-55Miller, S. P. O-40, O-41, O-46, O-181,P-161Miller, S. L. P-138, P-139Miller, W. O-288, P-178Miller-Thomas, M. M. S-102Miloslavski, E. O-339, O-332Minoshima, S. O-168Miranda, C. O-256, P-115, P-116, P-118, P-147Mironov, A. S-92Mishra, N. K. O-95, O-96, O-100,O-254, O-260, P-110, P-126Miskolczi, L. C-24, O-252, O-255,O-301, O-360, P-112Mistretta, C. A. O-167, O-328Mitchell, C. C. O-149Mitomo, M. P-150Mittermayer, C. O-37Miyamoto, S. S-55Miyata, Y. P-61, S-84Miyoshi, S. O-168Modic, M. T. O-242Moghrabi, A. P-162Mohamed, F. O-94Mohamed, M. A. O-213, O-214, O-346,O-372Mohammad, Y. O-60, O-153, O-365,P-146Mohr, A. O-102Molet, J. P-49Monajati, A. O-284Monstadt, H. O-251Montalban, X. O-103, P-23Mont’Alverne, F. O-201, P-120Moody, D. M. O-209Moon, W. P-68Moonis, G. O-223Moore, C. O-356Moore, K. R. O-239, O-240Moran, C. J. O-335Morello, F. P. P-149Moret, J. S-86Moretti, M. S-100Mori, H. P-67, P-124, P-142, S-47, S-69Mori, T. P-131, P-133Mori, Y. S-90Moritani, T. O-12, O-97, O-99, O-295,O-312, P-60, S-35, S-53, S-59, S-89Moritz, C. O-156, O-215Moroi, J. P-2Moron, F. E. O-357Moron, IV, F. E. O-123Morris, G. L. S-15AMorris, J. M. P-181Morris, P. P. O-209, O-232Morrow, T. J. O-168Mortilla, M. S-100Morton, D. W. O-161Mosca, F. P-164Mosier, K. O-125Mosier, K. M. O-108Mounayer, C. S-86Mucha, D. O-49Mueller, W. M. S-16, S-17, S-21, S-42Mugikura, S. P-72Mugler, III, J. P. O-7Mukherjee, P. I-17d, O-40, O-41, O-177,O-181, P-161Mukherji, S. K. S-37, I-27a, I-27b, I-4a,O-32, P-32, P-33, S-80, S-83Muldoon, L. O-197Mullins, M. E. O-196, O-285Munden, M. O-123Murata, K. O-184, P-165Murata, Y. O-105, P-41Murayama, Y. I-62c, P-111, S-90, S-91Murillo, T. O-197Murphy, E. K. O-195Murphy, K. P. J. C-37, I-52a, O-257,O-356, S-51Murray, M. O-224Murtagh, F. R. I-47a , O-10Muzik, O. P-157Myers, E. N. O-34Myers, M. E. O-204Myers, T. V. O-204Myouchin, III, K. C-28NNa, D. G. P-50, P-97Na, D. K. S-68Nabangchang, C. O-82Nael, K. O-101Nagahata, M. P-80Nagaoka, R. P-79Nagatomi, H. P-142Nahser, H. C. P-128Naidich, T. P. C-17, O-2, O-6, S-6, S-7,S-13, S-114Naito, H. S-55Nakagawa, IV, H. C-28, P-64Nakai, K. P-144Nakajima, M. O-325, S-33Nakata, Y. P-69, P-171, S-52Nakayama, M. O-132Nalwa, S. S. P-135Nan, B. O-164Napolitano, L. O-112Nathens, A. B, O-73Neary, D. O-69Numbers refer to session and presentation numbers, not to page numbers.Index Key: C = Computer Assisted Exhibit; I = Invited Speaker; O = Oral Paper; P = Poster; S = Scientific Exhibit
475Nelson, S. J. C-8, O-53, O-262Nelson, Jr., M. D. O-42, O-43, O-124Nesbit, G. O-197Nespoli, P. P-173Neugroschl, C. S. O-216, O-344, P-89Neumann-Haefelin, T. O-62Neuwelt, E. A. O-197Newberg, A. B. O-223Newton, H. O-271Ng, W. O-76Nguyen, P. H. O-92Nguyen, T. B. O-211, O-288, P-178Nguyen, T. H. C-31, P-143Nicosia, M. O-278Niemann, D. B. O-299, O-378, P-137Niinami, C. O-234Niku, S. O-165, O-354Nishimura, I. P-111Nishino, K. O-147Nishitani, H. O-270Niven, S. P-128Nixon, R. O-197Nixon, T. P-128Nogueira, R. G. O-341, P-81Nopper, A. J. O-121Norton, M. E. O-36Nos, C. O-103Nose, V. O-25Noto, J. O-89Noto, R. O-89Noujaim, S. E. C-9, P-94, P-100, S-63,S-79, S-110Nowinski, W. L. C-12, C-13, C-30, C-34Nugent, R. A. O-117Numa, W. O-30Numaguchi, Y. O-203, O-231, O-234,S-113Nunez, D. B. I-51aNyenhuis, J. A. P-132OOba, H. P-150, S-5Obuchowski, N. O-242O’Callaghan, M. G. A O-116, O-135O’Connell, A. O-375O’Dwyer, H. O-334Ogg, R. C-32, O-3Ogilvy, C. S. O-341, O-342O’Gorman, R. L. O-192Oh, J. W. O-22, P-140Oh, S. O-268, O-323Ohayon, J. M. O-291Ohta, M. O-298Oishi, S. O-257, S-51Oka, M. O-203, O-231, O-234, S-113Okahara, M. P-124, P-142, S-69Okoh, J. O-127Okubo, T. P-69, S-52Olivieri, N. F. S-107Önal, B. P-88Öner, A. P-44, P-48, P-88, S-40Onishi, Y. S-55Onizuka, M. C-24, O-255, O-301,O-360, P-112Ono, S. P-80Ookubo, T. P-171Oram, J. O-355Orbach, D. O-323Ordidge, R. J. P-17Origitano, T. O-306, P-121O’Rourke, D. M. O-52Ortiz, C. L. O-362, S-107Ortiz, Y. O-135Osborn, A. G. O-261Oschatz, E. O-311Ossiani, M. O-106Otaduy, M. C. G. P-32O’Tuama, L. A. C-7Ozgen, B. O-24, B. O-25, O-138Özsarlak, O. O-237, O-313PPabon, B. P-115, P-147Padma, M. V. O-95, O-96, O-100Pal, P. K. O-350Palasis, S. O-128, O-188, S-99Pan, H. O-221Panigrahy, A. O-42, O-43, O-124,O-129Pantazi, S. O-39, P-154A, P-154B, S-96,S-97Parazzini, C. P-164Parekh, N. N. S-37Parés, P. P-49Parizel, P. M. O-237, O-313Park, J. G. P-140Park, S. S-68Parkey, J. P-176, S-115Parrish, T. O-373, O-376, P-31Partridge, S. C. O-40, O-41, O-46,O-181Patankar, T. A. F. O-69, O-293Patel, A. B. P-113Patel, K. P-40Patel, S. C. S-67Patel, S. G. O-108Patel, S. R. S-8, S-11Patz, S. O-106Pavelka, Jr., K. P-170Pavia, M. O-14Pekar, J. J. I-63dPellicanò, G. O-112Pena, A. P-56Peng, S. S-101Perez, C. L. O-318, P-176, S-115Pérez, E. S-81Pericot, I. O-103Perl, D. P. O-2, O-6, S-6, S-7Perlow, A. S-37, O-314, O-255, O-301,P-119, S-88Perneczky, A. O-329Peroni, F. P-175Peterova, V. P-170Petrou, M. O-90, O-136, P-168Phadke, R. P-91Philip, J. V. P-4Phillips, C. I-20bPhillips, D. P-66Phillips, M. D. O-160, P-132Phillips, N. S. C-32, O-3Phuttharak, W. O-319Piatelli, G. O-84Pickard, J. D. P-56Pierot, L. P-120Pilatus, U. O-62Pile-Spellman, J. C-2Pillai, J. J. O-217, O-218Pinelli, L. O-14Pinto, R. S. O-282Piotin, M. S-86Pirotte, B. O-344, P-89Pirovano, G. O-139, P-58Pisarello, J. P-26Pitt, A. O-145Plunkett, J. I-3aPodrabsky, P. O-303Politi, L. S. O-148Pollo, B. O-50Pollock, A. N. O-182Pomerantz, S. R. S-106Pomper, M. G. O-11, P-57Poon, C. S. S-4Popescu, A. M. P-180Porcel, J. P-23Port, J. D. O-1, P-65, S-31Poser, S. O-8Poskitt, K. J. O-128APost, M. J.D O-311Poster, T. O-327Potchen, M. J. O-321Potter, J. M. O-209Poussaint, T. Y. I-19a, O-114Powell, N. P-91Powers, W. J. P-5Pozniak, M. A. O-149Prasad, J. O-288, P-178Prasad, R. S. S-98Prayer, D. O-37, O-87Press, G. O-82Preul, C. P-22Price, S. J. P-56Pronk, J. C. O-131, O-132Prost, R. W. O-157, O-166, P-46, S-16,S-17, S-20, S-21, S-22, S-25, S-26,S-29Provenzale, J. M. I-34c, I-36c, I-40f,O-322Pruvo, J. O-359Pryor, J. C. O-341, O-342Przuntek, H. O-327Pulfer, K. A. C-40Purdy, P. D. O-55, P-134, P-138, P-139Program ParticipantsNumbers refer to session and presentation numbers, not to page numbers.Index Key: C = Computer Assisted Exhibit; I = Invited Speaker; O = Oral Paper; P = Poster; S = Scientific Exhibit
Program Participants476QQi, J. P-104Quarles, C. C. O-54, O-263, S-36Quigley, M. O-186, O-277, O-278Quillard, Sr., J. M. P-101Quint, D. O-238, O-241Quint, J. O-133Quirico, C. O-275Quist, M. O-13, O-21Quon, A. O-129RRabinov, J. D. O-341, O-342Radaideh, M. M. C-1, C-20, C-35, O-247Radü, E. W. P-27Rafee, B. O-176Rahbar, R. O-24, O-25Ramanathan, K. P-117Ramchandren, S. P-93Ramenghi, L. P-164Ramirez, I. P-183Rand, S. D. O-48, O-51, O-54, O-263,P-46, S-18, S-36, S-42Randoux, B. S-2Ranjeva, J. P. O-38Rao, V. O-77Rapp, J. H. O-369Rappard, G. P-7, P-134Rappe, A. O-299, P-114Rastogi, S. O-370Ravegnani, M. O-84Rawluk, D. O-375Raybaud, C. O-87Raymond, J. O-336Rebmann, A. J. S-27Reede, D. L. S-73, S-75, S-82Reedy, M. L. O-232Regel, J. O-302Regini, C. O-219Rehani, B. P-15, P-38Reisner, A. O-128Remler, B. F. O-347, S-19Replogle, R. E. P-138, P-139Resnick, S. M. O-158Reynold, N. C. S-26Rezai, A. R. O-160, P-132Richert, N. D. O-291Rickert, K. L. P-46Riedl, S. O-87Rieger, A. O-309Rieu, R. O-298Righi, C. O-148Righini, A. P-164Ringel, K. O-150Rintoul, N. O-83Robb, R. C-21Roberts, D. O-72Roberts, T. P. L I-48a, O-120, O-163,O-212, O-266, O-289, O-324, O-355,P-18Roberts, W. O-355Robertson, K. R. O-310, P-35Robinson, A. J. O-39, P-154, P-154A,S-96, S-97Robson, C. D. O-24, O-25, O-138Roccatagliata, L. O-17, O-63, O-195,O-341Rodriquez, R. S-88Roh, H. G. P-97Roig, Z. M. S-11Roland, E. O-128ARoland, P. O-26Roldan-Valadez, E. O-141, O-189Rollins, N. K. O-26, O-119Roman, R. J. O-59, O-66Romano, IV, A. O-174, O-292Romero, R. P-147Ropella, K. S-19Rordorf, G. A. O-341Rose, M. O-201Rosel, P. P-156Ross, J. S. O-242Rossi, A. O-84Rossi, P. S-112Rother, J. O-18, O-19Rothfus, W. E. O-207, P-169, P-177Rothman, S. L. G. C-39, O-230, O-243Roukens, R. O-102Rovira-Cañellas, A. O-103, P-23, S-43,S-44Rovira-Cañellas, M. S-43, S-44Rovira-Gols, A. S-43, S-44Rowan, S. O-120Rowley, H. A. I-34a, O-156, O-167,O-212, O-215, O-324Roy, D. O-336Ruefenacht, D. A. O-298, O-303, P-147Rumboldt, Z. O-72, O-235, P-11, P-66Ruscalleda, J. P-49Rusinek, H. P-13Russell, Jr., E. J. C-1, C-35, O-152,O-247, O-373, O-376Russo, M. P-84Ryan, G. O-39, P-154A, P-154B, S-96,S-97Ryoo, J. W. P-50, P-97Rypens, F. P-158SSacchetti, E. O-219Sacco, A. O-32Sacco, R. C-2Sadaoka, S. S-91Sadarangani, P. A. C-8, O-53, O-262Safar, F. O-104Safriel, Y. O-171Sagara, Y. P-124, P-142Saguchi, T. S-90, S-91Sahlas, D. O-15Sahni, H. O-350Sakahara, H. O-147, P-96Sakai, M. P-150Sakaie, K. E. O-330, P-31Sakamoto, III, M. C-28, P-64Salamon, G. M. C-6Salamon, N. C-6, O-101, O-124, O-134Saletti, A. P-84Saloner, D. O-369Salvan, C. V. S-17, S-21, S-22, S-29Salzman, K. L. O-113, O-261, O-58ASan Román, L. P-49Sánchez, E. O-103, S-44Sandalcioglu, E. O-337Sanders, M. S-10Sanders, W. S-79Sanford, A. O-3Sanford, R. A. C-32Santos, G. B. O-349Santos-Filho, P. B. O-348, O-349Sargent, M. A. O-128ASartor, K. O-16, O-190Saver, J. P-77Sawlani, V. P-91Saykin, A. J. O-12ASayre, J. W. O-366, P-111Scarane, P. S-100Scaravilli, F. P-17Schaefer, P. W. O-17, O-63, O-195,O-285, S-106Scheffler, K. P-27Schellhas, K. P. I-57dSchellinger, P. D. O-16Schellingerhout, D. O-155Schilsky, M. S-13Schivalocchi, R. P-84Schlosser, M. P-57Schmainda, K. M. O-48, O-51, O-54,O-157, O-263, S-16, S-18, S-21, S-36,S-42Schmalbrock, P. O-169, O-170Schmalfuss, I. M. O-75Schmied, B. O-309Schmierer, K. P-17Schmitt, M. O-7Schnyder, P. O-21Schoenberger, E. A. O-353Schramm, P. O-16, O-190Schreiber, R. S-54Schroeder, P. O-311Schueler, B. P-130Schuind, F. O-216Schulz, D. I. O-321Schulz-Schaeffer, W. J. O-8Schwamm, L. O-63, O-195, O-196Schwartz, E. D. O-224Schwartz, L. O-280Schwartz, R. B. O-151, P-82Sciubba, J. J. P-99Scott, M. O-173Scotti, G. O-148Seelagan, D. P-94Segal, S. P-13Sehgal, V. P-51, P-157, S-48Sehizadeh, M. O-236Numbers refer to session and presentation numbers, not to page numbers.Index Key: C = Computer Assisted Exhibit; I = Invited Speaker; O = Oral Paper; P = Poster; S = Scientific Exhibit
477Seidl, Z. P-170Selcuk, D. P-102Selcuk, H. O-176, P-102Selvarajah, D. O-274, P-34Selzer, M. E. P-180Senbil, N. P-153Seo, J. J. P-140Seol, H. Y. S-32, S-70Seri, I. O-42, O-43Serqueira, O. E. P-26Serra, S. S-30Shah, B. S-87Shah, G. V. O-314, S-76Shah, R. O-365Shah, R. K. P-172Shaibani, A. S. C-1, C-35, O-152, O-330,O-373, O-376, P-31Sharma, M. C. O-95, O-96, O-100Sharp, M. J. O-377Shaw, D. P-128Shaw, P. J. O-274, P-34Shebert, R. T. O-245Sheikh, S. O-171Shekhara, R. P-71Shelef, I. P-73, S-107Shellock, F. P-132Shelton, C. O-113Shen, T. O-47, P-74Sherman, D. O-25Sherman, P. M. O-70, O-74Sherr, E. H. O-88Shewchuk, J. P-185Shibata, D. K. O-290, O-345Shimony, J. S. O-236, P-5Shimosegawa, E. P-2Shin, W. O-330, P-31Shon, C. P-78Shownkeen, H. O-306, O-362, P-121Shroff, M. M. O-185, P-73, S-103, S-107Shumsky, J. S. O-224Shy, C. G. S-60Siegal, J. A. O-194Siegel, B. O-355Siepmann, D. B. S-105Silber, J. I-57cSilbergleit, R. C-9, P-100, S-63, S-110Silva, L. S-30Silvani, A. O-50Silver, F. O-289Silverman, E. D. O-122Simon, E. M. O-83, O-182Simon, K. R. P-172Simonetti, G. O-178, P-14Sims, J. T. C-37Singer, O. O-62Singh, S. P-71Singhal, A. B. O-342Sinson, G. P-46Sirhan, D. P-173Sistrom, C. O-75Sitartchouk, I. O-266Sitton, C. W. P-24Skaggs, J. D. O-28Slivka, A. P. O-153, O-365, P-146Sloan, A. E. P-51, S-48Slone, H. W. O-153, P-146Slone, W. O-365Smith, D. R. O-294Smith, J. K. C-15, O-310Smith, J. S. O-322Smith, J. R. O-218Smith, J. K. P-35Smith, W. S. O-13, O-21Smoker, W. R. K. I-28c, O-267, P-103,S-23, S-73, S-75, S-78, S-82Smythe, J. O-90, O-136, P-168Snyderman, C. H. O-115Solomon, J. C-10Solorzano-Morales, S. O-189Som, P. M. C-17, S-78, S-114Somuncu, I. P-47Sonne, D. C. O-10Sorensen, A. G. O-45, O-49Soreq, H. P-73Sourour, N. O-258Sousa, M. B. O. O-132Souza, M. P. S C-3Soylu, N. P-102Speck, U. O-67Spelle, L. S-86Spitzer, E. M. P-31Srinivasan, A. O-248, O-288Stadie, A. O-329Stadler, A. O-309Staempfli, P. O-4, O-226Stambuk, H. E. O-108Starkman, S. P-77Stavrou, I. O-198Stecco, A. O-275Stecher, R. P. S-50Steinberg, G. K. O-364, O-304Steiner, T. O-102Steinmeier, R. O-49Stengel, A. O-62Stewart, J. E. O-1, P-65Stiepani, H. P-12Stieristorfer, K. O-27Stoeter, P. O-150, O-265, O-329Stolke, D. O-302, O-337Stone, J. A. I-51cStone, R. D. O-291Strange, M. G. O-188Strigel, R. M. O-215Stringer, W. C-7Stroman, P. W. I-43cStrother, C. M. I-40a, I-40c, O-297,O-305, O-357, P-114Stufflebeam, S. M. I-63c, O-220Stump, D. A. O-209Su, H. S. O-20Suga, R. P-182Suh, D. O-64, S-34Suh, S. I. S-32, S-70Summers, P. O-4, O-226, O-227, O-272Sundgren, P. C. O-90, O-136, O-164,O-309, P-33, P-168, S-1Sung, K. S-68Sunmonu, A. N. O-175Susac, J. O. O-10Sussman, M. O-163Sutton, L. N. O-83Suzuki, A. P-2Suzuki, K. O-203Suzuki, S. O-101Swamy, G. O-211Sze, G. K. I-43b, O-171Sze, W. M. O-76, O-109Szeder, V. O-347, S-19TTai, A. W. O-2, O-6, S-6, S-7Tai, M. P-9Taing, B. O-11Taing, B. G. O-79Tajik, A. J. O-144Takahashi, M. O-175, P-29Takahashi, S. P-72Takao, H. S-90, S-91Takayama, III, K. C-28Takeda, S. O-147Takhtani, D. L. O-74, O-79Tali, T. P-44, P-48, P-88, S-40Tamarozzi, R. P-84Tampieri, D. C-27, P-173, P-136Tamura, H. P-72Tamura, S. P-61, S-84Tanaka, R. S-55Tanenbaum, L. N. I-43aTanoue, S. P-142Taoka, III, T. C-28, P-64Tartaglione, T. P-58Tartaro, A. O-126, O-276, O-352, P-58Taschner, C. A. P-27Tate, K. R. O-128Tavares, F. S-30Tayfun, C. P-47Taylor, K. O-289Tejada, A. O-153Tejada, J. G. O-250, O-259, O-340Tekautz, T. C-32Tekes, A. O-213, O-214Teksam, M. P-90Teng, M. M. H. O-35, P-16, P-123, S-94Tenner, M. O-89Terada, T. P-98, P-144, P-145terBrugge, K. O-162, P-92Tesfaye, S. O-274, P-34Tesoriero, L. O-42, O-43Tessler, A. O-224Thacker, N. O-173Thiede, S. G. O-239, O-240Thielen, K. R. O-205Thirunavuukarasuu, A. C-12, C-13Thomalla, G. O-18Thomasson, D. P-70Program ParticipantsNumbers refer to session and presentation numbers, not to page numbers.Index Key: C = Computer Assisted Exhibit; I = Invited Speaker; O = Oral Paper; P = Poster; S = Scientific Exhibit
Program Participants478Thore, C. R. O-209Thornton, J. O-249, O-334, O-375Thurnher, M. M. O-198, O-309, O-311,P-37Tihan, T. P-57Timoshin, A. O-89Tintera, J. O-150Tintoré, M. O-103Tirpakova, B. P-63Tkach, J. A. O-160, P-132Toi, A. O-39, P-154, P-154A, S-96,S-97Tokgoz, N. P-44, P-48, P-88, S-40Tolakalahani, R. O-328Tomkin, O. P-73Tomsick, T. A. I-67cTong, D. C. O-364Tong, F. C. O-253, O-343Tong, K. A. P-157, S-48Torbey, M. T. O-66Torres, Jr., M. S-81Torriero, N. O-352Tortori-Donati, P. O-84Toyoshima, H. P-2Tracy, J. I. O-159Triola, C. O-365Tripathi, M. O-95, O-96, O-100Triulzi, F. P-164Tronnier, V. O-190Tropine, A. O-265, O-329Truwit, C. L. P-90Tsai, F. Y. C-31, P-143Tsai, J. O-152, O-373, O-376Tsai, J. G. P-138, P-139Tsai, Y. S-101Tsang, L. M. O-122Tseng, Q. P-9Tseng, S. P-9Tseng, W. S-101Tseng, Y. O-371Tsuchiya, K. O-317, O-325, S-33Tsui, W. P-13Tsukahara, H. O-137Tsukune, Y. P-150Tsumoto, T. P-98, P-141, P-144, P-145Tsuruda, J. S. O-71, O-229Tsuura, M. P-144Turecki, M. B. S-15ATurjman, F. P-120Turk, III, A. S. O-167, O-277, O-328,O-378, P-137Turski, P. A. O-167, P-137Tyrrell, P. M. O-122Tyszka, J. M. O-212, O-324Tzung, B. S. O-152, O-373, O-376UUchida, D. P-124, S-69Ucoz, T. P-47Uematsu, H. P-29, P-180Uemura, A. O-203, O-231, O-234,S-113Ugurel, M. S. O-250, O-259, O-340Uhrbrock, D. H. O-145Ulmer, J. L. O-157, O-166, O-347,O-377, P-135, S-16, S-17, S-18, S-19,S-20, S-21, S-22, S-25, S-26, S-29,S-36, S-42, S-85Umetsu, A. P-2Unal, B. P-47Urban, J. L. S-37Uysal, S. P-39, P-53Uzun, M. P-44VVaid, R. R. O-369Vakil, N. O-280Valavanis, A. O-4Valente, K. D. P-32Vallee, J. O-201, P-120van der Knaap, M. S. O-131, O-132Van Goethem, J. W. M. O-237, O-313Van Hoe, L. P-87Van Holder, C. O-216Vandesteene, A. P-54Vanhoenacker, P. K. P-87Varakis, L. S-41Varelas, P. N. O-66, S-85Vargas, S. O. O-138, O-361Varma, A. O-69Vartanian, T. K. O-175Vasconcelos, M. M. P-167Vaughan, K. G. O-142Vázquez, E. S-43Veeramani, M. C-33, P-152Veeraraghavan, S. O-40, O-181, P-161Velickovic, M. S-13Venables, G. S. P-8Venkatesh, S. K. P-40Verma, A. S-98Versnick, E. J. O-304, O-363Vertinsky, T. S-12Vezina, G. O-111, O-140Vibhute, P. G. S-78Videen, T. O. P-5Vigneron, D. B. O-40, O-41, O-46,O-181, O-262, P-161Vila, J. F. O-256, P-26, P-147Vilela, P. F. O-146Villablanca, J. P. I-67b, O-101, O-124Villari, N. O-112Villasante, F. P-116, P-118Vinogradov, E. O-294Vinters, H. V. O-101, O-134, P-111Vinuela, F. O-124, P-77, P-111, S-90Viola, A. O-38Viout, P. O-38Vivas-Bonilla, I. O-141Voit, H. O-327Volkov, I. C-13von Cramon, D. Y. P-22von Kummer, R. O-49Voordecker, P. O-216, O-344Vucurevic, G. V. O-265, O-329, P-151WWackym, P. A. P-135Wada, A. S-111Wada, III, T. C-28Wagner, A. L. O-206Wagner, M. L. O-166, O-263, S-18,S-21, S-36Wakhloo, A. K. C-24, I-47d, I-62b,O-252, O-255, O-301, O-360, P-112,P-119, S-88Wald, J. T. O-205Waldron, B. O-159Walker, M. T. C-1, C-35, O-152, O-246,O-247, O-330, O-373, O-376, P-31Wallace, E. W. O-154Wallace, R. C. O-228Wang, A. C-9, O-244, P-43, P-100,S-46, S-79, S-63, S-110Wang, C. O-135Wang, D. O-47Wang, E. Y. O-193, O-268Wang, H. Z. O-12, O-97, O-99, O-295,P-60, S-35, S-53, S-59Wang, J. O-52Wang, M. C. O-73Wang, Y. O-125Wang, Y-H. O-358Wanke, I. O-251, O-302, O-337Ward, B. D. O-54, O-263, S-42Ward, H. A. P-181Ware, M. O-177Warnes, C. A. O-144Wasserman, B. A. O-68, O-372Watanabe, A. O-210Watanabe, K. O-58, O-137Watanabe, M. P-131, P-133Watson, Jr., R. E. O-80, O-98Weatherall, P. T. P-134Weber, W. O-339, O-331, O-332Wehrli, F. W. P-29, P-180Wehrli, S. L. O-224, P-29, P-180Weigele, J. B. O-279, O-286, O-366,O-370, P-6, P-184Weill, A. O-336Weiller, C. O-18, O-19Weindling, S. M. O-281Weiner, M. W. I-17aWeingart, J. O-127Weissenborn, K. O-61Welsh, R. C. P-33, S-1Wennberg, R. C-3Werner, A. O-49Westesson, P. O-312, O-12, O-97, O-99,O-295, P-60, S-53, S-35, S-59, S-89Weybright, P. N. O-164, P-33Whang, K. P-10White, M. L. O-103, O-267, S-23Numbers refer to session and presentation numbers, not to page numbers.Index Key: C = Computer Assisted Exhibit; I = Invited Speaker; O = Oral Paper; P = Poster; S = Scientific Exhibit
479Whitham, R. O-197Whyte, H. S-103Widjaja, E. O-179, P-8Wieser, J. A. O-347Wiggins, R. H. O-107, O-113Wikler, D. O-344, P-54, P-89Wilber, K. O-310, P-35Wilkening, W. O-327Wilkinson, I. D. O-274, P-34Wille, P. R. O-329Williams, III, D. W. I-10b, P-3Williams, K. O-347Williams, M. O-94Williams, R. L. S-64Williams, V. B. O-71Willinsky, R. P-92Wilson, J. S-46, S-110Wintermark, M. O-13, O-21Wise, S. O-110Wishart, H. A. O-12AWitt, M. O-61Witte, R. J. C-21, O-31, O-98, P-21,P-181Wixom, C. O-319Wlachovska, B. S-2Wojak, J. C. I-58bWoldenberg, R. F. O-353Wolf, R. L. O-52Wolfe, D. E. O-2, S-6Wong, E. T. O-191, O-320, P-59Wong, S. J. O-377, P-135Wong, W. O-210Woo, S. P-78Wood, D. A. O-215Worthington, T. O-187Wottrich, S. O-245Wright, A. P-160Wright, A. C. P-180Wu, C. O-323Wu, H. S-94Wu, Ji. O-47Wu, Ju. O-191, O-320, P-59Wu, R. C-3Wu, Y. O-273XXu, D. O-181, P-161YYagmurlu, B. O-214Yakes, W. F. O-260A, O-260BYamada, H. P-67, S-47Yamada, M. S-55Yamaga, H. P-98, P-144,Yamakawa, K. O-238, O-241Yamashita, Y. O-105, P-41, P-79, P-182Yamura, M. O-105, P-41Yang, G. L. C-34Yang, Li. P-176, S-115Yang, Lu. O-264Yang, M. S. S-60Yang, M. O-60, O-169, O-170, O-271,P-55, S-41Yang, W. O-170Yano, T. P-61, S-84Yassa, M. A. O-346Yau, T. K. O-76, O-109Yazeji, M. S. O-94Yee, N. K. S-75Yen, P. S-3Yeung, R. O-109Yih-Lin, N. P-111Yildiz, H. P-53Yilmaz, H. O-176Yoo, W. S-58Yoon, W. P-140Young, A. B. S-10, S-93Young-Poussaint, T. S-106Yousem, D. M. I-10c, O-68, O-70,O-213, O-214, O-346, P-99Yousry, T. A. P-17Yu, C. S-56Yu, E. P-18Yu, I. P-1Yu, III, L. O-177AYuhan, J. S-56Yuki, I. P-111ZZacharia, T. T. O-114Zagzag, D. O-193, O-268Zaharchuk, G. O-20Zaleski, C. G. . S-104Zamarano, L. J. P-51, S-48Zanella, F. E. O-7, O-62Zarnow, D. M. O-83Zauner, M. S-44Zdanski, C. O-28Zee, C. S. C-22, O-230, O-243, S-45Zeifer, B. C-20Zerr, I. O-8Zeumer, H. O-18, O-19Zhang, G. P-180Zhang, X. H. P-104Zhang, Y. O-267, P-103, S-23Zhang, Z. O-266Zhao, L. C-30Zheng, W. C-30Zhong, J. O-345Zhu, X. P-74Zhu, X. P. O-293Zicherman, J. M. S-98Zidon, M. S-74Zimmerman, D. L. O-282Zimmerman, R. A. O-182Zinreich, S. J. P-99Zirpoli, S. P-164Zou, P. C-32Zugaib, M. C-5Additional AuthorsMerchant, T. E. I-15cPollock. J. R. I-37dRasey, J. S. I-5, I-22Roeke, L. B. I-15eProgram ParticipantsNumbers refer to session and presentation numbers, not to page numbers.Index Key: C = Computer Assisted Exhibit; I = Invited Speaker; O = Oral Paper; P = Poster; S = Scientific Exhibit
Program ParticipantsNotesNumbers refer to session and presentation numbers, not to page numbers.Index Key: C = Computer Assisted Exhibit; I = Invited Speaker; O = Oral Paper; P = Poster; S = Scientific Exhibit
Wednesday Afternoon1:00 PM - 2:30 PMBallroom 6 A(43A) NeuroNews:Developing Researchand Emerging TrendsModerator: Robert Koenigsberg, MDmulticentral studies for a larger number of patients are stillrequired. The advantages offered are: Short treatment time.Low treatment cost. Short inpatient stay. Thus, cuthealthcare costs.Key Words: Radiofrequency, ablation, chordomasPaper 43A-2 Starting at 1:09 PM, Ending at 1:18 PMFerumoxtran-10 for Intraoperative NavigationNeuwelt, E. A. · Hunt, M.Oregon Health & Science UniversityPortland, ORPaper 43A-1 Starting at 1:00 PM, Ending at 1:09 PMThe Use of Radiofrequency for the PalliativeTreatment of Sacral ChordomasNassar, A. N. · Nohra, C. · Khoneisser, A.Lebanese Hospital, GeitawiBeirut, LEBANONComplete radical surgical resection of sacral chordomas isdifficult to achieve in most of the cases due to the highlyassociated morbidity and the presence of adjacentimportant structures including the sciatic nerves.In addition, chordomas are known to be radio-resistant.Only 8% of patients show a disease-free survival rate.In spite of almost a 100% recurrence rate, surgery is stillused aimed at radical resection. However, in the presenceof aggressive recurrences, palliative treatment should beproposed. A single case report is published in the literaturein the American Journal of Radiology in November 2002describing the use of radiofrequency in the treatment ofsacral chordoma. We present two cases of sacralchordomas that underwent repeated surgeries andradiotherapy to no avail. These patients underwentradiofrequency for palliative control of mass effect and anattempt at pain relief, with immediate and excellentresponse. Patients were pain free in the 24 hours followingthe procedure. Total procedure time of around 1 hour wasaverage. No complications occurred. The advantagesoffered by the radiofrequency method which consist ofshort hospital stay (average 1 day), low cost, lowmorbidity and very low complication rate (none in ourcases and in the reported case) when compared topalliative surgery, would indicate its use as a primarypalliative method for the control of pain and mass effect.Although we have very short follow-up periods (14months), the rapid and dramatic response to therapy in ourpatients’ conditions supports the proposed suggestion.However, the reports in the literature are still few andPurposeFerumoxtran is a paramagnetic, dextran-coated iron oxideparticle that can be used as a MR contrast agent. Needingonly to be give once, 24 hours prior to surgery,ferumoxtran can be used for stereotactic guidance as wellas intraoperative MR imaging, and remains long enoughfor postoperative MR imaging. Intraoperative MR imaginghas advantages over conventional framed and framelesstechniques. However, intraoperstive MR imaging doeshave some drawbacks, especially related to interpretationof gadolinium-enhanced intraoperative imaging resultingfrom surgically induced blood-brain barrier injury,vascular changes and hemorrhage. Ultra-smallparamagnetic iron (USPIO) particles like ferumoxtran-10have a long plasma half-life and are trapped by reactivecells within the tumor. These trapped particles provide amethod to demonstrate enhancing lesions without theartifact of repeat gadolinium administration in the face ofblood-brain barrier and vascular injury, especially forintraoperative MR imaging and postoperative MRimaging.Materials & MethodsWe present five patients who underwent surgery usingconventional frameless sterotactic guidance as well as withintraoperative MR imaging with ferumoxtran-10 and areview of the literature.ResultsUltra-small paramagnetic iron particles represent a methodto demonstrate enhancing intrinsic brain tumors withoutthe drawbacks of intraoperative gadolinium enhancement.These lesions appear even on low-field strengthintraoperative MR imaging. Ferumoxtran-10, administeredpreoperatively, provides a stable imaging marker, evenafter surgical manipulation of the brain.1
ConclusionFermumoxtran-10 provides a way to lessen artifactualenhancement during intraoperative MR imaging related tothe administration of gadolinium, and may be beneficial inpostoperative MR imaging as well.Key Words: Image, guided, surgeryThe authors of this work have indicatedthat they will be discussing/presentingan unapproved or investigative use ofCombidex (ferumoxtran-10) made byAdvanced Magnetics, Inc. .for use as animaging agent.Paper 43A-3 Starting at 1:18 PM, Ending at 1:27 PMVery High-Resolution Contrast-Enhanced MRAngiography of the Carotid Arteries UsingFerumoxytol in HumansMeyer, J. R. · Mai, V. M. · Li, W. · Pierchala, L. · Tutton,S. · Ankenbrandt, W. · Edelman, R.Northwestern University Medical SchoolEvanston, ILPurposeTo study the feasibility of very high-resolution contrastenhanced3D MR angiography (CE-3DMRA) of theextracranial CA using ferumoxytol.Materials & MethodsFerumoxytol (Advanced Magnetics Inc., Boston, MA), aniron oxide blood-pool contrast agent with a plasma halflifeof 14 hours, was used to obtain very high-resolutionMRA of the extracranial CA. Studies were performed withIRB approval and informed, written consent. A dosage of 4mg/kg diluted to 7.5 mg/ml was infused at 2 cc/sec. Allstudies were performed on a 1.5 T system (GE MedicalSystems, Milwaukee, WI) equipped with TwinSpeedgradients and a 4-channel neurovascular coil. A series of 8subjects (3 volunteers and 5 patients, 4 male/4 female,average age of 56.6 years) were studied. First-passimaging was performed using either a fluoroscopicallytriggered 3D MRA or a temporally resolved TRICKSacquisition. This was followed by an optimized very highresolution3DMRA sequence using the followingparameters: TR/TE of 4.9 msec/1.4 msec, sampling BW of83 kHz, FOV 26 cm, matrix size of 512 x 512, 1 NEX, andinterpolated partition thickness of 0.8 mm. The in-planespatial resolution was 0.5 x 0.5 mm. An axial 3D volumeof 128 partitions covering the circle of Willis through theextracranial carotid bifurcation was acquired inapproximately 5.5 min. In addition, a 3DMRA with lowerin-plane resolution (256 x 256) as well as a precontrastaxial 2D TOF MRA were acquired. Multiplanar andmaximum intensity reconstructions were performed. Imagequality was assessed on a 5-point scale; SNR and CNRwere measured in the source images.2ResultsNo adverse events occurred. Very high-resolution MRangiograms showed improved delineation of the CAcompared with first-pass images, steady-state imagesacquired at 256 x 256, and 2D TOF MRA. Obliquemultiplanar reconstructions eliminated venous overlap andprovided excellent delineation of the carotid bifurcations.ConclusionCurrent first-pass methods for CE-3DMRA of the CAsuffer from limited spatial resolution. This problem can beovercome using nearly isotropic, very high-resolutionMRA with ferumoxytol. The method has the potential toimprove the accuracy and precision of measurements ofcarotid artery disease compared with current MRAmethods.Key Words: MRA, contrast, carotidPaper 43A-4 Starting at 1:27 PM, Ending at 1:36 PMSuperiority of Propeller FSE FLAIR to ConventionalFSE FLAIR for 8-Channel Phased-Array BrainImaging in Clinical PracticeTanenbaum, L. N. 1 · Pipe, J. 2 · Gaddapati, A. 3 · Hartley, M. 3· Debbins, J. 3 · Eshkar, N. 11 NJ Neuroscience Institute - EIA, Edison, NJ, 2 BarrowNeurological Institute, Phoenix, AZ,3 GE MedicalSystems, Waukesha, WIPurposeTo evaluate the performance of propeller FSE FLAIR withrespect to FSE FLAIR using 8-channel phased-array coilsin the evaluation of patients presenting for brain imagingin clinical practice.Materials & MethodsConsecutive patients referred for MR imaging withsymptoms suggesting neurological disease were evaluatedwith fast FSE FLAIR acquisitions performed withconventional and precommercial prototype propellerreconstruction techniques using commercially available 8-channel brain or neurovascular coils. Studies werecompared with respect to ghosting and motion artifact bytwo blinded reviewers. A quantitative comparison of SNRwas also performed. PROPELLER MR imaging (1) uses anovel approach to measure spatial frequencies. After eachexcitation (each shot), PROPELLER measures spatialfrequencies along a strip, or blade, which goes through thecentral region of k-space. This usually is done by using allthe echoes from a single, central shot of a multishot FSEreadout. For each subsequent shot, the blade is rotated,until all the necessary spatial frequencies to form acomplete image are measured. As seen the data from eachblade (each TR) can be used to form an image whichcontains all of the low frequency information inside of that
circle plus limited high frequency information. The datafrom these blades can be combined in k-space to form acomplete image. This resampling of the low spatialfrequencies every shot is a key element of PROPELLER.Since the image formed from these data should lookidentical, one can look for inconsistencies from shot toshot, and correct the data accordingly. Reconstructions canbe developed which can thus correct for in-plane motion(translation and rotation), correct for phase inconsistenciessuch as those introduced with diffusion lobes, and rejectuncorrelated data (such as bulk through-plane motion).ResultsStudies obtained with propeller reconstructions weresuperior to those obtained with conventionalreconstruction techniques with respect to ghosting, motionartifact, and SNR.ConclusionPropeller FSE techniques are superior to conventionaltechniques offering superior SNR as well as resistance tomotion artifacts and ghosting. Propeller FSE will likelyreplace conventional acquisitions for routine use in theclinical setting.References1. Pipe JG. Motion Correction with PROPELLERMRI: Application to Head Motion and Free-BreathingCardiac Imaging. Magn Reson Med 1999;42:963-969Key Words: PROPELLER, FLAIR, 8 channelThe authors of this work have indicatedthe following affiliations/disclosures:GE Medical Systems: Speaker, EmployeesPaper 43A-5 Starting at 1:36 PM, Ending at 1:45 PMNeuroform Stent-Assisted Coiling in the Managementof a Ruptured Pericallosal-Callosomarginal AneurysmKoenigsberg, R. · Vakil, N. · Schwartz, L.Drexel University College of Medicine (formerly MCPHahnemann), Philadelphia, PAPurposeThere are few reports describing the successfulendovascular treatment of aneurysms arising at thebifurcation of the pericallosal and callosomarginal arteries.We present the case of a ruptured bilobed pericallosalaneurysm successfully treated with coil embolizationthrough a Neuroform stent (Boston Scientific/Target,Fremont, CA.). We believe this is the first such casereported in the literature.Materials & MethodsA 48-year-old male presented with subarachnoidhemorrhage following rupture of an aneurysm arising atthe bifurcation of the pericallosal and callosomarginal3arteries, Hunt and Hess Grade V. Past medical history issignificant for malignant hypertension and previoussurgical clipping of same aneurysm 2 years earlier. Thepatient was referred for angiography post-imaging studiesand ventriculostomy.ResultsDiagnostic angiography revealed a persistent leftpericallosal-callosomarginal aneurysm with an adjacentsurgical clip. An initial attempt was performed to embolizethe aneurysm with a detachable coil. This wasunsuccessful due to the wide neck. A 4 x 15 Neuroformstent then was deployed uneventfully across the aneurysmneck followed by successful coil embolization with sixdetachable coils. The bilobed aneurysm was subsequentlycompletely packed, without angiographic residua.ConclusionThis case demonstrates the successful use of theNeuroform stent to assist in wide-neck aneurysm coiling ofa pericallosal-callosomarginal aneurysm. It is presentedwith a brief review of the technique and literature.References1. Menovsky T, van Rooij WJ, Sluzewski M, Wijnalda D.Coiling of Ruptured Pericallosal Artery Aneurysms.Neurosurgery 2002;50(1):11-152.Fiorella D, Alburquerque F, Hans P, McDougall C.Preliminary Experience Using the Neuroform Stent forthe Treatment of Cerebral Aneurysms. Neurosurgery<strong>2004</strong>;54(1):6-173.Howington JU, Hanel RA, Harrigan MR, et al. TheNeuroform Stent, the First Microcatheter-DeliveredStent for Use in Intracranial Circulation. Neurosurgery.54(1);<strong>2004</strong>:2-5.Key Words: Neuroform, pericallosal, coilingPaper 43A-6 Starting at 1:45 PM, Ending at 1:54 PMEarly Clinical Trial Experience with a New Self-Expanding Stent System (Wingspan TM ) in TreatingIntracranial Vertebro-Basilar Atherosclerotic DiseaseChang, F. 1,2 · Teng, M. 2,2 · Bose, A. 3 · Luo, C. 4,2 · Lirng, J. 2,41 Taipei Veterans General Hospital, Taipei, TAIWANREPUBLIC OF CHINA, 2 National Yang Ming University,School of Medicine, Taipei, TAIWAN REPUBLIC OFCHINA,3 Neurointerventional Service, New YorkUniversity School of Medicine, New York, NY,4 Department of Radiology, Taipei Veterans GeneralHospital, Taipei, TAIWAN REPUBLIC OF CHINAPurposeMedically refractory stenosis of intracranial arteries carriesa high risk of stroke. Angioplasty and stenting ofintracranial arteries by balloon expandable stents havebeen reported. However, these balloon mounted stentsoften have difficulty in accessing the tortuous intracranial
circulation and can cause vascular injury duringendovascular navigation and during high pressure ballooninflation for stent deployment. These risks are accentuatedin the fragile vasculature of the vertebro-basilar system.We report our initial experience using the BostonScientific self-expanding Wingspan TM Stent SystemMaterials & MethodsCase 1. A 76-year-old male suffered recurrent righthemiparesis despite antiplatelet and anticoagulant therapy.Small pontine and occipital infarcts were evident on MRimaging. Angiography demonstrated a segmental stenosiscompromising 75% of the vascular lumen in the midbasilarartery. Angioplasty and stenting of the basilarartery stenosis was performed over a 0.014” Choice PTmicro-guidewire. The diameter of the prestenotic basilarartery was measured to be 3 mm, and predilatation of thestenotic segment was performed with a 2.5 mm Gatewaymicroballoon at 6 atm. The stenosis was reduced to 60%after a single inflation. Subsequently, a 3 mm x 15 mmself-expanding nitinol stent (Wingspan TM ) was deployedover the stenotic segment. Postprocedure controlangiography demonstrated a residual stenosis of 36%. Thepatient was discharged home with no neurologicsymptoms. Case 2. A 73-year-old male suffered transientischemic attacks and recurrent dizziness in recent months.Angiography showed 80% stenosis in the left distalvertebral artery measuring 4 mm in prestenotic luminaldiameter. Over a 0.014” Transcend microguidewire thestenosis was predilated with a 3.5 mm Gatewaymicroballoon to 6 atm which resulted in a residual stenosisof 42%. Subsequently, a 4 mm x 20 mm Wingspan TM stentwas deployed. Control angiography revealed a residualstenosis of 25%. The patient was discharged home free ofneurologic symptoms.ResultsBoth patients showed successful angioplasty and stentingof intracranial vertebro-basilar stenosis withoutcomplication. The residual stenosis after angioplasty wasfurther reduced acutely by the positive remodeling force ofthe self-expanding Wingspan TM stent.ConclusionIn the treatment of intracranial vertebro-basilar stenosis,the Wingspan TM self-expanding stent and microcatheterbaseddelivery system demonstrated good trackability andcould navigate tortuous intracranial vasculature withoutdifficulty. Under-sizing the angioplasty balloon withrespect to the normal diameter of the parent vessel duringpredilatation of the stenotic lesion avoided unnecessaryvascular injury to the parent vessel lumen such asdissection or rupture. The positive remodeling force of aself-expanding nitinol stent can further dilate a residualstenosis after angioplasty. Early experience suggests thatangioplasty and stenting of intracranial arterial stenosiswith the Wingspan TM self-expanding stent may be a safeand feasible option for stroke prevention. Enrollment andlong-term follow-up is ongoing.Key Words: Stent, basivertebral stenosisPaper 43A-7 Starting at 1:54 PM, Ending at 2:03 PMA New Generation of Self-Expanding NitinolIntracranial Stent System in Symptomatic, High GradeIntracranial Atherosclerotic Stenosis: Strategy for Predilationof the Lesions and Stent Deloyment toMinimize Vessel TraumaHartmann, M. 1 · Ringleb, P. · Bose, A. 1 · Berez, A. 2 · Sit,S. 31 University of Heidelberg Medical School, Heidelberg,GERMANY, 2 New York University School of Medicine,New York, NY, 3 Boston Scientific Neurovascular, SanLeandro, CAThe Wingspan TM (WST) is a new generation of selfexpandingstents specifically designed for the treatment ofintracranial (IC) atherosclerotic disease. It is made of ultrathinnitinol, low profile and highly flexible. The WST stentsystem consisted of a 3.5 F delivery catheter with innerthrough-lumen with the stent preloaded for deployment.The system also contained a Gateway PTA ballooncatheter with the intended use of predilating the lesions,followed by WST self-deployment with sufficient radialforce to remodel severely stenosed vessels without theneed for postdilation. To minimize trauma, the size of thePTA balloon is under-sized to 80% of parent vesseldiameter with slow inflation to no more than nominalpressure. Described herein are initial experiences with theWST system in patients with severe symptomatic stenosiswho have failed antithrombotic therapy. Major entrycriteria are recurrent stroke attributed to target lesions 2 -4.5 mm in diameter with stenosis > 50% and < 14 mm inlength, failed medical therapy, and a Modified Rankinscore (MRS) of < 3. Three patients with symptomaticatherosclerotic stenosis, mean age 69 years, with vesselsizes ranging from 2.0-3.6 mm, lesion lengths from 1.9 to6.8 mm in the petrous ICA, carotid-T and M1 were treated.The degree of stenosis according to the WASID methodwas reduced from a median of 89% to 35% after balloonangioplasty and to 21% after WST placement. Postdilationwas not required. The trackability of the WST deliverycatheter through tortuous vasculature was very good andthere was more than sufficient wall apposition to remodelall lesions without the need for postdilation. All 3 patientssuccessfully completed the PTA and stenting proceduresand discharged neurologically intact. No complication,vessel dissection/rupture, or thromboembolic eventsoccurred. No stroke or death occurred at 30-day follow-up;the status of all patients was stable with relief of symptomsand no restenosis was revealed by transcranial Doppler at30 days. These results indicate that the Boston Scientificself-expanding WingspanTM Stent System withGatewayTM PTA Balloon Catheter may be a safetreatment of atherosclerotic intracranial lesions.Undersizing of PTA balloon and self-expansion of WSTmay minimize trauma to the parent vessel while providingfor good wall apposition. Enrollment and long-termfollow-up are ongoing.4
Key Words: Stent, intracranial, stenosisThe authors of this work have indicatedthat they will be discussing/presentingan unapproved or investigative use ofWingspan TM made by Boston ScientificNeurovascular for use as self-expanding stentsspecifically designed for the treatment of intracranial (IC)atherosclerotic disease.The authors of this work have indicatedthe following affiliations/disclosures:Boston Scientific: Paid Consultant,EmployeesPaper 43A-8 Starting at 2:03 PM, Ending at 2:12 PMIn Vitro Labelling of Mouse Neural Stem Cells withSuperparamagnetic Iron Oxide Particles and Initial InVivo Tracking Study after Intravenous Injection inMice Affected by Experimental AutoimmuneEncephalomyelitisPoliti, L. S. 1 · Pluchino, S. 1 · Bacigaluppi, M. 1 · Cadioli,M. 1,2 · Anzalone, N. 1 · Falini, A. 1 · Martino, G 1 · Scotti, G. 11 Ospedale San Raffaele, Milano, ITALY, 2 Philips MedicalSystems, Milan, ITALYPurposeWe have recently shown that intravenously injected adultundifferentiated mouse neural stem cells (aNSC) promotemultifocal remyelination and functional recovery in miceaffected by a chronic form of experimental autoimmuneencephalomyelitis (EAE). Here we performed a feasibilitystudy of labelling aNSC with different superparamagneticiron oxide particles (SPIO) with or without poli-L-lysine(PLL), a transfection agent, and evaluated the possibilityof tracking them in vivo by serial MR scans along theposttransplantation follow-up.Materials & MethodsANSC were labelled with increasing concentrations of Fe(0.01, 0.02, 0.06, 0.1, 0.2, 0.8 mg) of two different SPIOcontrast media (Endorem, Guebert; Resovist, Schering) byincubation with or without PLL for 72 hours. Cellviability, proliferation and differentiation were tested at 8days. Iron uptake and dismission also were assessed bymicroscopy. Agarose phantoms containing dispersedunlabelled and labelled cells or free SPIO were preparedand signal change with routinely used sequences and T2relaxometry were measured at 1.5 with a 23 mm surfacecoil. Six C57BL/6 mice were immunized with MOG35-55in CFA and - at the onset of clinical signs suggestive ofCNS demyelination - underwent intravenous injection of10 6 aNSC labeled in vitro for 72 hours with 0.1 mg/ml ofSPIO (Endorem, Guebert) plus PLL. Longitudinal MRscans (at day 1, 5 and 10 from the transplantation) wereperformed. Neuropathological analysis (Prussian blue) ofthe CNS of transplanted EAE mice also was performed atsacrifice.5ResultsIn vitro uptake of all SPIOs was much higher when aNSCswere incubated with both PLL and iron nanoparticles. Cellviability, proliferation and differentiation were not affectedup to a concentration of 0.2 mg of iron, and slight celltoxicity was found when cells were incubated with 0.8mg/ml Fe. The decrease of MR imaging signal was muchhigher when PLL was used. Of the two SPIO used,Endorem showed the highest signal decrease. Onceintravenously injected, magnetically labelled aNSCs wereidentified as small hypointense spots within the whitematter lesions as early as 1 day after the iv injection butprogressively faded out at either 5 or 10 daysposttransplantaion. Neuropathology confirmed thepresence of iron-labeled transplanted cells within areas ofdemyelination and axonal damage.ConclusionANSCs can be succesfully labelled in vitro with SPIOs,without compromising cell viability and proliferation. AllMR imaging parameters are singificantly affected by thepresence of these SPIO particles within cell bodies andincrease linearly with the iron cell concentration. Earlytemporal and spatial migration of intravenouslyadministered SPIO-labelled aNSC can be monitored byMR imaging. SPIOs tracers may represent a helpful toolfor tracking transplanted neural stem cells in eitherpreclinical or clinical studies in both animal models andhumans.Key Words: Neural stem cells, SPIO labelling,demyelinating disordersThe authors of this work have indicatedthe following affiliations/disclosures:Philips Medical Systems, EmployeePaper 43A-9 Starting at 2:12 PM, Ending at 2:21 PMReal-Time MR Imaging-Guided NeurovascularInterventionPile-Spellman, J. 1 · Feng, L. 1 · Lin, E. 1 · Gupta, G. 1 ·Dashnaw, S. 1 · Zhang, H. 1 · Oklu, R. 1 · Baytion, M. 1 ·Dumoulin,C. 21 Columbia University, New York, NY, 2 General Electric,Schenectady, NY.PurposeCompared to conventional fluoroscopy, real-time MRimaging guidance offers many advantages for diagnosticand interventional neurovascular procedures. Continuousintraprocedural assessment of tissue viability and brainfunction with diffusion-weighted imaging, perfusionweightedimaging, and functional MR imaging providesnew dimensions for the treatment of cerebrovasculardiseases, particularly ischemic stroke. Visualization ofneurovascular anatomy is available with multiplanar MRA
images and 3D reconstructions. MR imaging-guidedendovascular procedures are safer to patients and operatorsdue to the lack of ionizing radiation. Furthermore,gadolinium-based contrast agents exhibit lowernephrotoxicity and allergic potential than iodinatedcontrast agents. We performed a pilot animal study toassess feasibility of performing interventionalneurovascular procedures under real-time MR imagingguidance.Fig. 3 a. IA contrast-enhanced MRA of left carotid artery.b. Occlusion of ascending pharyngeal artery.c . Recanalization after thrombolysis.Materials & MethodsAfter obtaining percutaneous vascular access to thefemoral artery on the MR table, transfemoralcatheterization of the carotid arteries was performed in 10pigs using active MR-tracking catheters and guidewires.Intraarterial (IA) contrast-enhanced MRA confirmedcatheter position and evaluated the distal vascularanatomy. Carotid stenting was performed in five animals.The carotid and subclavian arteries were occluded withballoons to create stroke models in five animals andintraarterial thrombolysis was carried out in two animals.Necropsy was performed on all animals to assess theintervention and presence of unintended vascular injury.ResultsThe carotid arteries were catheterized minutes afterobtaining vascular road maps. Ten nitinol stents weresuccessfully placed into the bilateral carotid arteries in allfive animals (Figure 1). The stent positions wereconfirmed by necropsy with no unintended vascular injury.In separate experiments, all target vessels were occludedsuccessfully with balloons (Figure 2). After the carotidartery branches were occluded intentionally with bloodclots in two animals, we infused IA rtPA, which resulted inrecannulization of these vessels (Figure 3).ConclusionCarotid stenting, embolization, and thrombolyticprocedures were performed successfully in a swine modelusing active MR-tracking, suggesting neurovascularintervention may be feasible under real-time MR imagingguidance.Fig. 1. Active-tracking catheterization. Catheterization ofbrachiocephalic artery with active-tracking devices. (A,aorta; BCA, brachiocephalic artery; LSCA: left subclavianartery; CCA: common carotid artery).b. Catheterization of the common carotid arteries withactive-tracking devices.Fig. 2. Stents in bilateral carotid arteries.a. A coronal FSPGR image with T1 weightingdemonstrates hyperintense blood in the carotid lumens.The stents are identified by the susceptibility artifacts ofnitinol. The inferior margin of the left stent is intentionallymatched with the superior edge of the right stent.b. Necropsy reveals the stents in the same positions asshown on MRI. Both common carotid arteries have shinyadventitia without evidence of perforation or muralhematoma formation.6Key Words: Real-time MR imaging-guidance,interventional neuroradiologyThe authors of this work have indicatedthe following affiliations/disclosures:General Electric, EmployeePaper 43A-10 Starting at 2:21 PM, Ending at 2:30 PMThree-Dimensional and Dynamic Sequences in FetalMR ImagingPrayer, D. · Brugger, P. C. · Kasprian, G. · Mittermayer, C.· Krampl, E. · Herold, C.Medical University ViennaVienna, AUSTRIA.PurposeTo demonstrate the ability of 3D and dynamic sequencesto add information to fetal CNS-MR studies.Material & MethodsIn 15 consecutive fetal MR images, done because ofsuspect CNS/extra CNS abnormalities, between the 19thand 32nd gestational week (GW), SSFSE - (20-40 mmslab), and dynamic TFE sequences (8-50 mm thickness, 4frames/second) were added to the routine fetal-MRimaging protocol [including T2, T1, FLAIR, diffusionweightedimaging, and steady state free precessionsequences (1)]. Indications consisted of twin-to-twintransfusion syndrome (3), ventricular asymmetry (1),suspect choroid plexus cyst (1), intrauterine growthrestriction (2), Chiari II malformation (1), cardiac tumor(1), facial cleft (2), diaphragmatic hernia (3), dwarfism (1)and polyhydramnios (2). On 3D images gyration, body
surface, shape of extremities, thickness of soft-tissue, andconfiguration/course of the umbilical cord were evaluated.Dynamic sequences were screened for the proof of normalgeneral movements (2), and in case of spinal pathologyespecially for all qualities of leg movements, handmovements, and swallowing.ResultsThree-dimensional sequences showed normal conditions in13/18 cases, pathology detected/confirmed by 3D imagingconsisted of: abnormalities of face/skull relation (3),extremities (2), and soft-tissue thickness (2). In 12/18fetuses general movements/leg-movements were observedat least once during the examination time (30-40 minutes),hand movements in 8/18, and swallowing in 6/10 in whomthis movement was especially looked for.ConclusionThree-dimensional and especially dynamic fetal imagingadd functional information that allows a more accurateestimation of pathologic conditions than the use of routinesequences only. In addition, this sort of “clinical”information introduces a new dimension to fetal MRimaging.References1.Prayer D, Brugger PC, Prayer L. Fetal MRI:Techniques and Protocols. Ped Radiol <strong>2004</strong>, in press2. Prechtl HFR. Qualitative Changes of SpontaneousMovements in Fetus and Preterm Infant Are a Markerof Neurological Dysfunction. Early Hum Dev1990;23:151-158Key Words: Fetal magnetic resonance, dynamic imaging,fetal movements7
LEARN!Anytime.Anywhere.<strong>ASNR</strong> eCMEhttp://foundation.asnr.org/onlinecmeWhen you’re ready to enhance your knowledge, <strong>ASNR</strong> eCME is there.View dozens of online lectures from neuroradiology’s top educators. Free to <strong>ASNR</strong> members.Sponsored by the Neuroradiology Education and Research Foundation
PLATINUM LEVELBERLEX IMAGINGAn educational grant in support of NER Foundation Symposium <strong>2004</strong>:Integration of Imaging Strategies in Neuroradiology programming;Berlex/NER Foundation Fellowship in Basic Sciences Research Award;Berlex Best Paper Award in General NeuroradiologyGOLD LEVELSILVER LEVELTMPHILIPS MEDICAL SYSTEMSBOSTON SCIENTIFICTOSHIBA AMERICA MEDICAL SYSTEMS, INC.MICROVENTION, INC.GE HEALTHCAREAn educational grant to support, in part,the Annual Meeting printed <strong>Proceedings</strong> and Meeting GuideSIEMENS MEDICAL SYSTEMS, INC.BRACCO DIAGNOSTICS, INC.VITAL IMAGES, INC.Program Contributors