MOL GROUP
MOL GROUP
MOL GROUP

Create successful ePaper yourself
Turn your PDF publications into a flip-book with our unique Google optimized e-Paper software.
<strong>MOL</strong> <strong>GROUP</strong>Investor Day 2012
KEY CHALLENGES AND ACTIONSJózsef MolnárChief Executive Officer of <strong>MOL</strong> Group<strong>MOL</strong> Group Investor Day15 November 2012, Budapest1
SIX CHALLENGES <strong>MOL</strong> FACES# 1 – MATURING PORTFOLIO, DECLINING PRODUCTION# 2 – NEED OF CONTINUOUS EXPLORATION PORTFOLIO RENEWAL# 3 – MONETIZE COMPANY MAKER STORY IN KURDISTAN# 4 – CHANGED EXTERNAL ENVIRONMENT IN DOWNSTREAM# 5 – LONG-LASTING ECONOMIC CRISIS# 6 – MANAGING A COMPLEX INTERNATIONAL, INTEGRATED COMPANY2
ACTION # 1 – DE-RISK 1.6 BBOE RESOURCE POTENTIALTo reach 180 thboepd production by 2018Expected production*, 2012-2020• Plateau around 170-180 mboepd7-8%CAGRExplorationupside (risked)UndevelopedDeveloped* Without any Syrian contribution*Entitlement based production forecast, excluding Syrian contribution on the whole time horizon.3
DiscoveryACTION # 2 – MORE ACTIVE PORTFOLIO MANAGEMENT TO RENEW THE ASSET MIXAdd new high impact elements and potential early harvestsValue creation over volumesGrow in core, experienced regions as operator and take minority shares in new frontierregions”High risk – high reward” projects (e.g. Oman, Kazakhstan)Aiming to add offshore licenses to the portfolioKSP TRDDevelopmentSP AKZAppraisalAZMBKAR OMaturityOCEREThe majority of value creation happens in exploration phasehowever the risk is also higher.NKOMKeeping the balance between the cash in (revenue) and cash out (investment) cyclePotential early value realization after exploration/appraisalPotential (partial) farm outs to share risk and costs4
ACTION # 3 – REACH EXP. PEAK PRODUCTION AROUND 55-62 MBOEPD BY 2017Intensified appraisal & early development program<strong>MOL</strong> present in 2+2 blocksTotal recoverable resourcepotential 725 MMboeAkri Bijeel: 3 appraisal wells inthe next 9 months, earlyproduction to start in 2013commercial production in 2017Shaikan: DoC submitted,commercial production to start in2014Oil pipelineGas pipelinePlanned Oil pipelinePlanned Gas pipelineDevelopmentDiscoveryProductionSurf Expl/DrillingKRG oil export to reach 1MMboepd by 2015 and 2MMboepd by 2019*Pearl: Self financing projectwith huge upside*Dr. Ashti Hawrami, Minister for Natural Resources, KRG(27th March 2011 - “Oil & Gas Year” launch)5
ACTION # 4 – REACH 500-550 MN EFFICIENCY IMPROVEMENT BY 2014Initiation of New Downstream ProgramRegain top quartile position in Europe by increasing the efficiency andprofitability of <strong>MOL</strong> Group Downstream$ 500-550 million EBITDA improvement* TARGETCost decreaseUSD 370-400 mnRevenue increaseUSD 130-150 mnEnergy management30%29%Petrochemicalssales strategyMaintenance management21%42%R&M and Retailsales strategyProduction flexibility improvement21%Stock and loss managementOrganizational review andgeneral cost reduction15%13%29%SCM-drivenimprovement* Based on 2011 premises6
ACTION # 5 – BALANCING CASH FLOW AND CAPITAL EXPENDITUREAs solid balance sheet has top priority1) In general CAPEX should be financedfrom operating cash flow3,532,521,512,0EBITDA (in bn USD)Net debt to EBITDA2,22,5Limit of net debt to EBITDA3,02,40,52) Keep Net Debt to EBITDA below 2.0x,net gearing around 30%60002008 2009 2010 2011 Q3 2012rolling*3) Diversified funding sources, averagematurity around 3 years45030015002007 2008 2009 2010 2011 Q1-3 2012CAPEX - acq Pearl Operating Cash Flowacq INA* rolling EBITDA of the last 12 months7
ACTION # 6 – REORGANIZE <strong>GROUP</strong> AND FLAGSHIP OPERATIONCreate a more international headquarters with flexible decision-makingSeparate tasks and responsibilities between the group andthe local levelsNew international HQ focusing on strategic decisions andoverall control.Flagship companies like INA, IES, Slovnaft and <strong>MOL</strong> makeoperative decisions with greater authority.Clearer roles and responsibilitiesFaster decision-makingLess bureaucracyMore central focus on strategy and growthMore international HQ in line with Upstream driven strategyGreater responsibility and better stakeholder management forthe flagships8
UPSTREAM PORTFOLIO OVERVIEWMID- AND LONG-TERM OUTLOOKJózsef MolnárChief Executive Officer of <strong>MOL</strong> Group<strong>MOL</strong> Group Investor Day15 November 2012, Budapest1
UPSTREAM PORTFOLIO IN A SNAPSHOTGood basis for increasing mid-term EBITDA generationStrong pillarof the Group<strong>MOL</strong> IS AN UPSTREAM DRIVEN COMPANYGrowth over the last years: Increased EBITDA leveland investmentsAttractive, improving profitabilty compared to peersGood bases for sizable long-term growthChallengingnext yearsCREATING BASIS OF LONG TERM GROWTHExisting gap in the portfolio results transition yearsMitigate decline rate and accelerate developmentLower 2013 production: ~110 mboepd, but slightincrease in 2014-2015Production in 7 countries, Explorationin 12 countriesProduction: 116 mboepd in 2012 //Reserves: 682 MMboe (2P, 2011) //RRP: 1.6 BnboeSignificant long termgrowth potentialREACH 170-180 MBOEPD PRODUCTION BY 2017-2020Good reserve base, but even greater potentials: 1.6 Bnboe resource potentialAccelerate key international projects to derisk upsideUp to $1-1.5 Bn CAPEX per year to finance the growthStrong CEE base, expanding in CIS and Kurdistan:sources of sustainable growthMore active portfolio management with explorationledfocus7-8% production growth (CAGR) in 2012-2018 horizon2
<strong>MOL</strong> IS AN UPSTREAM DRIVEN COMPANYWith increasing capital expenditureEBITDA generationCAPEX breakdownAdditional sharepurchase in INA(an upstreamdriven company)Bn HUFBn HUFUpstream Downstream Gas MidstreamUpstreamGas MidstreamDownstreamCorporate & Other3
IMPROVING PROFITABILITY OVER THE YEARS…even compared to peersUpstream unit EBITDA, USD/boeEBITDA generation change4
EXPLORATION SUCCESSES ARE THE BASIS OF LONG-TERM GROWTHOutstanding, over 60% exploration success rate in the last 3 yearsSeveral billionbarrel Shaikandiscovery (20%) –2009 and successfulappraisal programBijell-1 oil discoveryin Akri Bijeel block(80%) - 2010Oil discoveries inMatjushkinsky blockand (latest in 2011)sizeable reserveadditions, – 63MMboe (2011)mainly BaituganFedorovskoye gascondensate discovery– (2008) and reservebooking – 37 MMboe(2011)Several smalldiscoveries inHungary and Croatiawith ~5 mboepdaggregated resultjust in Q1-3 20126 discoveries in a rowin TAL block (10%)Makori East-1 oil-gasdiscovery - 2010Tolanj-X-1 gasdiscovery - 2011Oil discovery in Karakblock - 20115
PRODUCTION COULD REACH 170-180 MBOEPD BY 2017-2020Sustain production level from existing reserve base and step further on hugeexploration upsideExpected long-term production*• Plateau around 170-180 mboepd• Lower, ~110 mboepdproduction in 2013• Only gradual increase in2014/15Explorationupside (risked)UndevelopedDeveloped*Entitlement based production forecast, excluding Syrian contribution on the whole time horizon.6
TRANSITION YEARS TO COME DUE TO A GAP IN OUR PORTFOLIOMitigate decline rate and accelerate developmentLife-cycle based mixed portfolio:Challenge:MATURING CEE REGION7-10% natural decline of CEE-onshoreproduction in the last yearSevere impact of natural decline andwater cut on Adriatic offshoreFalling contribution of ZMB in RussiaPressure on Unit production cost+HIGH POTENTIAL FIELDS STEP IN ONLY MID-TERMSlower than expected increase fromMatjushkinsky and Baitex blocks is RussiaDevelopment phase just started inKazakhstan and appraisal/earlydevelopment in Kurdistan Region of IraqAction:EOR projects and new discoveries improvedecline rate to below 5%Production from recent Croatian oildiscoveries and first EOR projectsCroatian offshore gas production expectedto be stabilized around 10-12 mboepdIncrease internal efficiency, especially inthe CEE regionGradual production increase in Russiadue to accelerated field developmentIncreasing production from new unit inPakistanFirst contributions from KurdistanRegion of Iraq already in 2013/14 due toquick developmentAccelerated exploration anddevelopment create the basis growth7
SLIGHT PRODUCTION DECLINE CONTINUES IN 2013 TO ~110 MBOEPD…but gradual increase thereafter: 110-120 mboepd in 2014/15Production outlook*~115mboepd~110mboepdOtherPakistanRussiamboepdCroatiaHungary*excluding Syrian contribution8
GOOD RESERVE BASE, BUT EVEN GREATER POTENTIALSResource potential could be the basis of 100% reserve replacement in 3y average800700600Proved and probable reserves1.6Bn boeWorking interestbased unriskedrecoverableresource potentialMM Boe5004003002000.7bn boereserves: 10 yearsproved reserves toproduction ratio10002007 2011 2012 FCExpected production Probable ProvedProved ReservesKurdistan Region of IraqRussiaPakistanProbable ReservesCEEKazakhstanOman and Other9
ACCELERATE KEY INTERNATIONAL PROJECTS TO DERISK UPSIDE…Key project timeline till 2018Exploration Appraisal Development ProductionCountry Assets W.I. 2012 2013 2014 2015 2016 2017 2018UnriskedRRPMMboePOSKurdistan Regionof IraqKurdistan Regionof IraqAkri-Bijeel 80%Shaikan 20%725High100%Kazakhstan Federovsky 27.5% 15 HighKazakhstan North Karpovsky 49% 120 LowRussiaMatjushkinsky&Baitex100% Parallel activity of exp./app/dev./production 140LowMidPakistanTAL&Karak10%40%55LowMid-MidOman Oman-66 100% 200 LowProbability of success (POS): Low: 10-25% // Low-Mid: 25-40% // Mid: 40-60% // High: 60-100%10
…SIZEABLE RESOURCE POTENTIAL WILL ALREADY BE TESTED IN 2013Operational milestones in Q4 2012 and 2013Q4 2012Start up 10 production wells in the Matjushkinsky block in RussiaQ1 2013Q2 2013Q3 2013Testing of Bakrman and Gulak exploration wells in Akri-Bijeel block, KurdistanRegion of IraqTesting the 1st exploration well in North-Karpovsky block (KAZ)Start up of Extended well test at Akri-Bijeel blockStart up of upgraded early production capacity on ShaikanSpud of Mardhan-Khel exploration well in PakistanTesting of 2 exploration wells in RussiaTesting of the 2nd exploration well in North-Karpovsky block (KAZ)Q4 2013Start up of new Gas Processing Facility in Pakistan (+25% capacity)11
UP TO USD 1-1.5 BN CAPEX PER YEAR WITH INTERNATIONAL FOCUS…to finance reserve booking and growing productionCAPEX (2013-2015)Major International Upstream projects and theirexpected resource allocation80Bubble size represents CAPEX allocation for 2013-15HungaryRussiaKazakhstanCroatiaKurdistan Region of IraqPakistanPeak production - mboepd604020Oman-66North KarpovskyPakistanKurdistan Regionof IraqRussian exploration & field developmentFederovskoye00 200 400 600 800 10002P reserve and Recoverable resource potential - MMboeExplorationDevelopment12
HUNGARY REMAINS A CORE COUNTRYOur aim is to mitigate the natural decline rate to below 5%HUNGARY (171 MMboe reserve)75 years E&P experience with more than 40years EOR/EGR technological knowledgeExtensive surface infrastructureLow production and exploration costsFast development provides quick cash flowmboepd504030201002013 2015 2018Unrisked exploration upsidePOSlow-midProductionWORK PROGRAM – PRODUCTION OUTLOOK6-8 exploration wells annuallyAiming to renew exploration acreage positionand add 2-5 MMboe reserves annuallyDecline rate: from 10-15% to below 5% (EOR,new exploration, field development)Production 2012Q1-3: 45 mboepd II Reserves(SPE 2P-2011): 171 MMboe II Recoverable resource potential (unrisked, WI based): 120 MMboe13
CROATIA: CONTINUING RECENT EXPLORATION SUCCESSESAiming to maintain production on 2013 level in the coming yearsCROATIA (234 MMboe)Three oil discoveries in 2011-2012 proved ourgood geological knowledgeEnhanced Oil/Gas Recovery projects andremaining offshore exploration potentialCommitted to harvest offshore exploration andproduction experiences on new areasmboepd504030201002013 2015 2018Unrisked exploration upsidePOSlow-midProductionWORK PROGRAM – PRODUCTION OUTLOOK4-6 exploration wells annuallyOngoing EOR project implementation in the next 3years (~30 MMboe incremental production)Offshore gas production exp. to be stabilizedaround 10-12 mboepdMinimize decline rate (~3-4%) of producing assetswith EOR and utilize new exploration successesProduction 2012Q1-3: 43 mboepd II Reserves(SPE 2P-2011): 234 MMboe14
RUSSIA: CONTINUOUS PRODUCTION INCREASE TO ~40 MBOEPDReserves and sizeable exploration upside create mid-/long-term growth potentialRUSSIA (186 MMboe)Diversified Russian portfolioGood reserve base to boost production230 MMboe undrilled exploration upsidemboepd504030201002013 2015 2018Unrisked exploration upsidePOSmidProductionWORK PROGRAM – PRODUCTION OUTLOOKIntensified drilling campaign: 40-80 newproduction wells annuallyAnnually testing 1-2 hydrocarbon prospects10-15% annual production growth is expectedfrom Baitex and MatjushinkskyProduction 2012Q1-3: 18 mboepd II Reserves(SPE 2P-2011): 186 MMboe II Recoverable resource potential (unrisked, WI based): 140 MMboe15
PAKISTAN: HIGHER PROFIT FROM OIL/CONDENSATE DISCOVERIESGradual production growth to 12-14 mboepdPAKISTAN (11 MMboe)Operatorship experience: major project withca. 100.000 boe daily production potential(100%)Ongoing capacity extention to handleincreasing condensate productionOil-condensate discoveries could boost profitmboepd16141210864202013 2015 2018Unrisked exploration upsidePOSlow-mid-midProductionWORK PROGRAM – PRODUCTION OUTLOOKDeveloping previously discovered 6 gas and gascondensatefieldsReserve booking is expected in 2012~10% annual production growth in the next 5yDerisk potential of blocks with higher WI (e.g.Karak)Production 2012Q1-3: 6 mboepd II Reserves(SPE 2P-2011): 11 MMboe II Recoverable resource potential (unrisked, WI based): 55 MMboe II Peakproduction: 2019, 15 mboepd16
KAZAKHSTAN: NEW CORE COUNTRY FOR MID-TERM GROWTHFederovskoye peak production is expected to be around 12-13 MMboeKAZAKHSTAN (37 Mmboe)Significant discovery in recent years (grossfield size ~ 200 Mmboe reserves)New block acquired (49%) in 2012 in thevicinity with significant recoverable resourcepotential (120 MMboe)mboepd4035302520151050POSlow2013 2015 2018 2020Unrisked exp. upside (NKarp) Production (Fed)WORK PROGRAM – PRODUCTION OUTLOOKContinuing the intensified appraisal and earlyproduction development (Fed)Start production: end-2015Plateau: 2019-2023 with further explorationupsideProduction 2012Q1-3: 0 mboepd II Reserves(SPE 2P-2011): 37 MMboe II Recoverable resource potential (unrisked, WI based): 135 MMboe17
KURDISTAN REGION OF IRAQ: KEY SOURCE OF GROWTHPromising test results from Bakrman exploration well underline upside potentialKURDISTAN REGION OF IRAQTwo successful discoveries (Bijell, Shaikan) +one well with very promising results (Bakrman)Derisk 725 MMboe recoverable resourcepotential (WI) in the next yearsReserve bookings in the next two years fromtwo blocksmboepd6050403020100POShigh2013 2015 2017 (peak) 2018Unrisked exploration upsideProductionWORK PROGRAM (SH/AB) – PRODUCTION OUTL.2010-12/2012-14 – Exploration and appraisalprogram2013-14/2015 – 16 Field development2014/2017 – Start of commercial productionPlateau production: 55-62 mboepdRecoverable resource potential (unrisked, Working Interests based): 725 MMboe18
DiscoveryMORE ACTIVE PORTFOLIO MANAGEMENT TO RENEW THE ASSET MIXExploration-led focus: add new high impact elements and potential early harvestsRenew, extendexploration portfolioHigh risk high rewardprojects (e.g Oman, KAZ)RDSP TKS DevelopmentKZAppraisalP AKA R OAZMBMaturityPotential early valuerealizations – after valuecreation withexploration/appraisalIncrease off-shorepresenceCautious with reserveacquisitionCERENKOMThe majority of value creation happens in explorationphase however the risk is also higher.OFarm(partial) out to sharerisks and optimize projectfinancingFocus on value creation over volumesActive management of the portfolio: geographically and life-cycle-basedProduction profile is highly dependent on portfolio managementGrow in core, experienced regions as operator and take minority shares in new frontierregionsEnhancing the exploration portfolio with ”high risk – high reward” elementsAiming to add offshore licenses to the portfolioKeeping the balance between cash in (revenue) and cash out (investment) cycle19
KURDISTAN REGION OF IRAQ COULD BE THE COMPANY-MAKERStrong CEE base, expanding in CIS and Kurdistan: sources of sustainable growthRelatively stable unit profitability based on current premisesExpected long term production*Kurdistan (unrisked upside)7-8%CAGRMiddle East and AfricaCIS and PakistanCEE*Entitlement based production forecast, excluding Syrian contribution on the whole time horizon.20
OPERATIONAL UPDATE OF OUR PROJECTSIN KURDISTAN REGION OF IRAQAttila Fogarasi, PhDHead of International Asset ManagementMiddle East and Africa Region<strong>MOL</strong> Group Investor Day15 November 2012, Budapest1
AGENDAABOUT KURDISTAN IN GENERALINTRODUCTION OF THE AKRI-BIJEEL BLOCKSHAIKAN BLOCK OVERVIEWPEARL PROJECT2
KURDISTAN REGIONAhot spot in the North-Eastern part of Iraq3
REGIONAL TECTONICS OF KURDISTAN REGION OF IRAQKRI is part of the Zagros chain formed by a series of collisionsZagros was formed due to NE drift andcollision of Arabian Plate with EurasiaFirst compressive movement was inthe Cretaceous, second started inEocene with the total closure of theoceanKurdistan Region suffered maincompression to southwestwards in theLate Miocene-Recent (10 Maonwards).Major folds assisted by thrust faults(inverted earlier normal faults) wereformed due to this late compression.The simply folded zone on the NE edgeof the Arabian Plate is the hub ofmajor petroleum depositsSource: de Vera, Gines, Oehlers, McClay, Doski: Structure of the Zagros fold and thrust belt in the Kurdistan Region, northern Iraq (2009)4
GENERAL STRATIGRAPHY OF ZAGROSAll elements are present for hydrocarbon formationAfter Paleozoic carbonates and a Permian riftingepisode a new carbonate platform is established -dolomitized shallow carbonates are reservoir rocksMultiple source rock - Basin sediments of Triassic,Middle-Late Jurassic age provide world-class sourcerocks; Cretaceous and Paleogene platform carbonatesmay be source rocks as wellSeveral evaporitic episodes occurred in the LateTriassic, Middle and Late Jurassic - these provideexcellent sealsEustatic sea level movements caused alternation ofplatform and basin sediments in our target area – trapformationLate Cretaceous abduction generated a gap insedimentation and a new carbonate platform-basinassemblage was generated.Thickest deposits are siliciclastic shallow water-fluvialforeland sediments of Middle Miocene-Pliocene age -these provide the burial necessary for hydrocarbongeneration.Favourable timing - Foreland sedimentation andmaturity was synchronous to fold (trap) formation.5
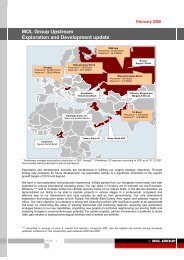
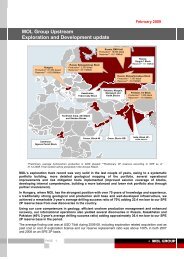
WORLD CLASS DISCOVERIES IN ROWAlready in the spotlight of majorsOil reserves potential around45 Bboe*Gas and associated gasreserves potential up to 200Tcf (36 Bboe)*Production Sharing Contractsawarded for 42 licences**High (over 70%) discovery rateExxon, Total, Gazprom andChevron entered the regionOil pipelineGas pipelinePlanned Oil pipelinePlanned Gas pipelineDevelopmentDiscoveryKRG oil export to reach1 MMboepd by 2015 and2 MMboepd by 2019*ProductionSurf Expl/Drilling*Dr. Ashti Hawrami, Minister for Natural Resources, KRG(27th March 2011 - “Oil & Gas Year” launch)**KRG website6
MAJOR PIPELINE PROJECTS IN THE PIPE1 million boepd export capacity targeted in the short run412”With open support fromAnkara, Kurdistan has plans tobegin exporting its oil along a new1 million bpd pipeline to theTurkish border by August 2013.”(KRG website, Sep 10, 2012) (1)New oil pipeline with capacityof around 400 thboepd from Taq-Taq to Khurmala already underconstruction (2)3Khor-Mor – Khurmala gaspipeline (24’’) already operating(3) – to be built further toFishkaburOil pipelineGas pipelinePlanned Oil pipelinePlanned Gas pipelineIraq – Turkey (Kirkuk –Ceyhan) pipeline system alreadyoperating with nameplate capacityof 1.6 MMboepd (4)7
OVERVIEW OF <strong>MOL</strong>’S ASSETS IN KURDISTANentered in 2007Block Working Interest Fully diluted WI Operator Other partnerAkri-Bijeel 80% 51.2% <strong>MOL</strong> GKP (20%)Shaikan 20% 13.6% GKP (75%) <strong>MOL</strong>, TKI (5%)Khor Mor 10% 10%Chemchemal 10% 10%Pearl PetroleumDana Gas, CresentPetroleum, <strong>MOL</strong>, OMV8
INTRODUCTION OF THE AKRI-BIJEEL BLOCK9
ONE SUCCESSFUL DISCOVERYTwo exploration wells under drilling target further upsideLocated N of Erbil, total Block area:889 km 2Consists of two different terrains:lowlands covered by thick Tertiary;mountains with exposed Cretaceous1 successful oil and gas discovery – Bijell-13D seismic acquisition ongoing over BijellEWT facility under construction on Bijell-1 site,production to start in 2013 Q2Bakrman-1 well with very promising shows – ontrend with Atrush discoveryTwo other wells under drilling-testing: Bijell-3 andGulak-110
WORK PROGRAM 2012 – 2014to derisk the significant petroleum original oil in placeE - expected spud - expected well test * Conditional, not fixed yet11
BIJELL-1 DISCOVERYJurassic showed commercial discovery with high permeability and flow ratesSThick NeogeneMain kitchenAll reservoirspresent4 way closedburiedanticlineBijell-1NProductive zoneshavehighpermeability and allof them naturallyfracturedTests showed flowingoil with productionrate of up to 3,743boepd with 32/64”chokeJurassic - Commercial hydrocarbon discovery with 13-18 API heavy oilOil windows between 3,646 and 3,967 meters + some water productionTriassic: High prospectivity for hydrocarbon system with gas, condensate and light oil – not tested yet12
BIJELL APPRAISAL PROGRAMExtensive appraisal acreage with several potentially linked compartments6 wells - 3 firm and 3contingent1 drilled, tested (Bijell-1)1 drilled, under testing(Bijell-3)3 under preparationDe-mining on 3D area finished_Appraisal Area3D Surv ey in 20123D seismic acquisition on 490km2 under shootingExtended well test of Bijell -1due in 2Q 201313
THREE FURTHER APPRAISAL WELLS IN THE NEXT 9 MONTHSBIJELL-2Targeting the mid-pointBIJELL-7Targeting the SE edgeBIJELL-5Targeting a new compartmentTD: 5330mAppraisal of BijellJurrasic package,with a secondaryTriassic targetSpud: Q4 2012TD: 4650mAppraisal of BijellJurrasic packageSpud: Q1 2013TD: 3200mAppraisal of BijellJurrasic package inupdip satellitestructureSpud: Q1 201314
HOW TO HANDLE HEAVY OILS AND H 2 S?Good chance to blend from own sourcesDensity of liquid petroleum products (API)>55 Condensates38-55 Light crude oil22-38 Medium crude oil10-22 Heavy crude oil10 Water0-10 Extra heavyViscosity of common materials* (centiStokes)1 Water84 Olive oil125 Motor oil SAE 20220 Tomato juice540 Motor oil SAE 5010000 Honey*at room temperatureHeavy-sour oil findings have to be handledBlending to reach Kirkuk crude quality – densityand viscosity improves in a non linear wayLocal or purchased condensateLight oils of Bijell Triassic, ShaikanChemical treatmentRefinery buildings in the regionHeavy oil pipelineH 2 StreatmentFlairing in early phaseInjection or Clauz unit in longer run15
FACILITY DEVELOPMENT PROGRAMEarly production to start in Q2 2013, export quality in 2014EWT Phase IEWT UpgradeCommercial phaseTotal gross capacityTotal storage capacity10 thboepd30 thboepd10 thboepd30 thboepdDepending on fielddevelopment resultsKey dataStart of operationDelivery mode2013 Q2Truck2014 Q2Truck2017PipeQualityFor domestic saleExport qualityExport quality16
BAKRMAN – VERY PROMISING SHOWSGood permeability and possibly lighter oilsStructure is on trend with GEP Atrushdiscovery with lighter oilsWell drilled deeper than planned to TriassicUpper unit: Good mud gas shows and heavyoil on shakers in Cretaceous Sarmord andLower Jurassic Butmah/Sarki FmLower unit: good mud gas shows and heavy oilon shakers from Lower Jurassic repeatedsection.Total losses occurred in Kurrachine Fm implyexcellent permeabilitySide track and testing in Kurrachine section inprogressExpected time of PIIP estimate: H1 2013In case of success, appraisal drillings couldstart in 201417
GULAKCautiously optimistic view at the momentGulak-1 under drillingGood mud gas shows in Jurassic reservoir section of the Upper unit (same as Bekhme)Good mud gas shows in the repeated Jurassic reservoir section of the Lower unit (same as Bijell)NEBekhme-1Gulak-1SWEocene dolomite/limestoneCretaceous marlCretaceous dolomite/limestoneJurassicTriassic18
TARGETING TRIASSIC SYSTEMChances for light oil and condensatesTriassic systems may contain light oil and condensate with API > 40 along with natural gasNo quality discount and/or good for blending with heavy oilsAll three prospects have Triassic targetsBakrman is our first real Triassic testingGulak exploration well also has Triassic targetsBijell-2 appraisal well to start in Q1 201319
EXPECTED TIME SCHEDULE AND PRODUCTION OUTLOOKBy 2014 – Exploration and appraisal program2013 Q2 - Start up of early production, EWT facility with 10 thboepd gross capacityMid 2014 – Reserve bookingBijellMid 2014 – Declaration of Commerciality2014 – EWT surface facility upgrade to reach export quality2015 – 2016 Field development program2017 – Start of commercial productionBakrman2013 – 3D seismicsFrom 2014 - Appraisal drillings (in case of success)20
SHAIKAN BLOCK OVERVIEWSource: GKP21
COMMERCIALITY DECLAREDDevelopment program due by FebruaryLocated NW of ErbilTotal Block area: 283 km 2 22Successful discovery and completion of five well appraisal program, crude from 16 to 52 APIDeclaration of Commerciality submitted in August 2012Possible reserve booking already in FY 2012EPF in operation since 2010, capacity increasing ongoing to gross 40 thboepd
SHAIKAN EXPLORATION – APPRAISAL STRATEGYSeveral discoveries in one major anticlineOne major anticline with Cretaceous exposed inthe coreDiscovery of heavy oil in several Jurassic reservoirs;discovery of light oil and gas-condensate in severalTriassic reservoirs.All reservoirs are fractured carbonates; all sealedby thick anhydrite bedsSuccessive appraisal wells tested both flanks and E-W limits of the anticline.Hydrostatic pressure in Jurassic reservoirs;increasing overpressure in Triassic reservoirs.Fresh (karstic) water in Jurassic reservoirs;increasing salinity brine in Triassic reservoirs, waterdrive possibleDrilling of SH-8 production well ongoingJurassicTriassicAppraisal report and development plan are beingprepared.23
TIME SCHEDULE AND PRODUCTION OUTLOOK2013 Q1 – Submitting Development plan2013 Q1 – Finishing construction of two early production facilities on SH2 and SH1-3 wellsShaikan2013 – spud of SH-7 targeting deeper zones of deeper Triassic and Permian2013-15: Facility and pipeline developments2014 – start of commercial production24
PEARL PROJECT25
SELF FINANCING OPERATION WITH HUGE UPSIDE POTENTIALOperator reported 10 Tcf 1P natural gas with condensate reservesDana Gas 40%Crescent Petroleum: 40%OMV 10%<strong>MOL</strong> 10%Khor Mor (299 km 2 ):6 existing production wellsGas production at 340 Mcfpd, condensateproduction at 15 thboepdTwo train gas processing (LPG) plant withcapacity of 300 MMcfpd/boe in operation175 km 24’’ gas pipeline to two PPssupplying 4 mn peopleGas transferred at zero price, condensatehas market pricingChemchemal (1,169 km 2 ): 2Dseismics, not operatingChemchemal discovered in 1930Khor Mor discovered in 1953Further development efforts would target localgas customers and export26
APPENDIX27
STRUCTURE OF OUR PRODUCTION SHARING AGREEMENTSSchematic of Production sharing at Akri-Bijeel BlockSchematic of Production sharing at Shaikan BlockOil producedOil producedRoyalty Oil10% of total Crude oilRoyalty Oil10% of total Crude oil43% Available crude Oil40%Available crude OilCost oilRecovery oil(Op, expl. And appr. Costs)Total Profit OilBased on ”R” factorCost oilRecovery oil(Op, expl. And appr. Costs)Total Profit OilBased on ”R” factorContractor’s profit oil shareGovernmentContractor’s profit oilshareGovernmentContractor’s shareContractor’s share<strong>MOL</strong>51.2%GKP12.8%Third Party16.0%KRG20.0%GKP51.0%<strong>MOL</strong>13.6%TKI3.4%Third Party12.0%KRG20.0%RfactorContractor’s shareRfactorContractor’s shareR < 1 32%R < 1 30%1 < R 216%1 < R 215%R =Cumulative Revenues actually received by the ContractorCumulative Costs actually incurred by the Contractor28
INCOME AND COST DEVELOPMENT OF A TYPICAL PSA12001000800600400200Profit OilCost OilProductionWI3025Majority of CAPEX 1-2 yearsbefore start of commercial20 production15Early cost recovery right afterstarting commercial production10Followed by years of high profit5ratio0Y1 Y3 Y5 Y7 Y9 Y11 Y13 Y15 Y17 Y19 Y21 Y23 Y25 Y27 Y29 Y31 Y33450400350300250OPEX200CAPEX150100500Y1 Y3 Y5 Y7 Y9 Y11 Y13 Y15 Y17 Y19 Y21 Y23 Y25 Y27 Y29 Y31 Y330At the end of the lifecycle stableOPEX and falling profitability parallelwith declining productionMajor determinants ofentitlement:Crude oil priceUnit CapexUnit Opex29
NEW DOWNSTREAM PROGRAM2012 – 2014Ferenc HorváthExecutive Vice President of <strong>MOL</strong> Group Downstream<strong>MOL</strong> Group Investor Day15 November 2012, Budapest1
NEW DOWNSTREAM PROGRAM TO REGAIN TOP QUARTILE POSITION IN EUROPEChanged, challenging external enviromentDramatic change in industry’s profitability compared to ‘golden ages’Zero based revision of business processes, costs and paradigmshifts in operation are needed$ 500-550 million efficiency improvement in NewDownstream Program to regain top quartile positionReview the entire Downstream value chainFocusing on key cost elements – 10% decrease of total costs($370 - 400 million )Continuous delivery with proportional contribution at the 7 unitsRegular tracking of achieved results3-3.5 USD/bbl improvement makes DS a strong profitcontributor even in depressed external environment2
CHANGED, CHALLENGING DOWNSTREAM ENVIRONMENTPetchem margin Refinery spread Brent Ural spread Brent priceUSD/bbl15010050USD/bbl118520USD/bbl64202005 2012Brent DTD crude…Brent-Ural spread2005 Brent - Ural spread 2012Refinery margins-120052012URL-MED Refinery marginEUR/t6005004003002002005 20122007-2011 Ch.+53%-23%-63%-44%Increased overall energy costs, especially costs on ownconsumption & lossHigh product prices – decreasing product demandPressure on sales marginsDecreased and fluctuating light-heavy crudedifferentialsLower, volatile refinery marginsShrinked advantage of complex assetsDramatic change in petrochemical business1. Increasing operational costs2. Decreasing product demands3. Significant European refining overcapacity4. Poor profitability5. Refinery shutdowns3
EUROPEAN REFINERIES COMPETE FOR SURVIVALFawley 80Teeside 117Gonfreville 100Recently closed European refineriesCoryton 175Dunkirk 137Reichstett 81Wilhelmshafen 260Harburg 101Paramo 20Porto Marghera 106Nadvornaja 50Drogobych 82Lisichansk 175140012001000800OECD Refinery capacity closureEuropeNorth AmericaPacificths barrel/dayCremona 90Falconara 83Arpechim 66Odessa 56600Year of closure20132012201120102009Refinery kbpdBerre l’Etang 105Rome 92Gela 50Source: <strong>MOL</strong> Strategy Research40020002009 2010 2011 2012Source: Wood Mackenzie, IEA2012: more than 50% of capacity closures take place in EuropeSince 2009 7% of total European refining capacity closed... and there is still 15% overcapacity4
<strong>MOL</strong> <strong>GROUP</strong> DOWNSTREAM PROFITABILITY UNDER PRESSURE AS WELLEBITDA effect on <strong>MOL</strong> Group DS – 2007 vs. 2011higher oil pricelow refinery margindecreased gasoline demanddepressed petchem marginshrinked Brent-Ural spreadca. $ -550 millionca. $ -250 millionca. $ -50 millionca. $ -350 millionca. $ -90 millionCa. 6-7 USD/bbl negativeeffect on DS margin121086420-2-4Clean CCS-based DS* unit EBITDA (USD/bbl)FY 2007 FY 2008 FY 2009 FY 2010 FY 2011 H1 2012peer group range<strong>MOL</strong> excl. INA<strong>MOL</strong> GroupSource: Company flash reports, <strong>MOL</strong> Strategy ResearchNote: <strong>MOL</strong> Group figures include INA data from Q3 2009*excluding PetchemStill among the bests with our two key assets, but no clear leadingposition and less efficient units around or below break even5
INITIATION OF THE NEW DOWNSTREAM PROGRAMRegain top quartile position in Europeby increasing the efficiency and profitability of<strong>MOL</strong> Group Downstream$ 500-550 million EBITDA improvement* TARGET$ 370-400 mncost savings$ 130-150 mnrevenue increse*based on 2011 premises6
PROGRAM COVERS THE ENTIRE DOWNSTREAM VALUE CHAINMore than 500 individualprojects in 19 main groups ofinitiativesPrinciples:Paradigm shift was needed inoperationZero based revision of businessprocesses and costsValue chainoptimizationMarketmanagementAssetManagementResource andprocessefficiencyOptINA 2Crude Supply Refining Logistics Petchem Wholesale RetailReal Crude SelectionOn demand production optimizationQuality givawaysMake or buy (Own production vs. Local purchase)Wholesale - Retail synergiesInventory managementGlobal product line & local Country marketing strategiesPolymer salesMonomer & Chemical salesEnergy managementMaintenance managementHydrocarbon loss managementOrganic business developmentProduction flexibility & yield improvementLOG AssetoptimizationPetchem portfoliooptimizationOrganizational and cost review - short termWaste elimination (Lean pilot) - long termINA R&M and Retail efficiency improvement actions7
10% COST SAVINGS BY TARGETING ALL THE KEY COST ELEMENTS1Energy cost(own cons.)Energy cost(purchased)MaintenancePersonnelcostOther costsCost structure* of<strong>MOL</strong> GroupDownstream$ 3.7 billion* 2011; excluding raw material costEnergy costVolumetric reductionOptimization of energy sources andproceduresContract managementNew Downstream Program target:10% reductionMaintenance costTarget Q1 efficiencyTechnical scope revisionExtend TA periodsNew Downstream Program target:20% reductionPersonnel costStreamline operationOrganizational restructuringProductivity review & FTE reductionNew Downstream Program target:10% reductionNew Downstream Program target:8% other cost reduction23Target:$ 370 - 400millioncost savingcompared to 20118
TARGETED 10% DECREASE IN TOTAL ENERGY COSTSEnergy Intensity IndexSolomon EII ®(<strong>MOL</strong> Group vs. Western Europe Trend Group)SisakRijekaQ4Q3Q2Q1MantovaDanubeBratislavaAiming to reach Q1 performance inSolomon index for DR, BRAiming to increase CRO refineriesOver 200 actionsCa. USD 150 million CAPEX need (by 2014)1Energy EfficiencyVolumetric reductionEnergy OptimizationOptimization of energysources and proceduresContract ManagementImprove energy supply conditions(gas; H2; nitrogen; electricity; steam; etc)$ 120 million annual volumeand process saving+$ 70 million price benefit9
ENERGY EFFICIENCY PROJECTS1CAPEX (M USD)12963-Bubble size represents targeted EBITDA improvement (M USD, 2014 vs. 2011)More efficient steamproduction by modernisationof quench coolers at TVKBenefit: 4.3 M USDStart: 2013 Q1Enhanced optimisation ofheat management atSlovnaft PetrochemicalsBenefit: 5.6 M USDStart: 2014 Q10 1 2 3 4Payback ratio (years)Flare gas recovery by a newrecompression station atSisak RefineryBenefit: 3.75 M USDStart: 2013 Q1Flare gas recovery atDanube RefineryBenefit: 2.5 M USDStart: 2014 Q3Installation of steamcondensate recovery systemat Sisak RefineryBenefit: 4.2 M USDStart: 2014 Q1Optimised electricityproduction by utilizingsynergies between SlovnaftRefinery and power plantBenefit: 2.6 M USDStart: 2012 Q4+ 28.1 M USD benefit from zero-CAPEX projects (optimisation)
KEEP TIGHT MAINTENANCE SPENDINGSMaintenance Efficiency Index(EURO)Solomon MEI ® (Western Europe Trend Group)3002502001501005002006 2008 2010Q4Q3Q2Q1MantovaSisakBratislavaRijekaDanubeComplex Maintenance Spending (CMS):Ca. USD 400 million in 2011,including USD 120 million CAPEXAiming to reach Q1 efficiency in maintenancespendingDecrease CMS by 20% by 20142Efficiency improvements withwell known, but unutilizedprincipalsKey source ofreductionReductions of technical scopeAsset policy revisionAutonomous MaintenanceContract revisionsTime norms revisionImprovement of planning andschedulingUSD70 million10%5% 3%5% 12%25%40%Minor CAPEX reductionReschedulingOPEX reductionAsset out of orderAuton. Maint.ContractingOtherDelayed or cancelled withacceptable riskTaking unutilized assets out ofservice (e.g. storage tanks,loading arms, production units,etc) decrease maintenancecosts11
OTHER SIGNIFICANT COST AND CASH FLOW RELATED NEWDOWNSTREAM INITIATIVESInventorymanagementHydrocarbon lossmanagementCa. 10% stockholdingreduction target:Release 110-120 ktproduct and raw materialUSD 90 millionworking capital savingHydrocarbon loss in 2011: 0.9%Ca. USD 110-120 millionSet non-tolerable loss limits and act todecrease loss.Target: 0.5% loss by 2014Ca. USD 45 million loss decrease12
REORGANIZATION AND RESOURCE PRODUCTIVITY IMPROVEMENT1. Review of our businessprocesses andorganizational structure:Wind up silo operationExploit synergy potentialsCease functional duplications and activityoverlappingImprove communication in the organizationDownstreamR&M Petchem Retail SCMPRODLOGSALESDEVPRODLOGSALESDEVSCMSALESNETWORKDEVELOP.Old DS structureSCM32. Separation of groupand local level:Matrix operationLow headcount of efficientgroup-level managementGroup and local level decisionmakingand responsibilitiesStricter control and consequencemanagementFaster, more efficientLocal DSoperationProductionPRODLocalProductionDownstreamSupply & SalesSALESRetailSALESDSDevelopmentLOGNETWORK DEVDEVELOP.LocalLog.Group levelLocal levelLocalSalesLocalRetailLocalDevelopm.To increase our Human Resources efficiencyNew DS structureSCMSCMLocal SCM13
<strong>GROUP</strong> LEVEL EFFECT OF DOWNSTREAM REORGANIZATION3OrganizationsGroup-level Downstream organizationsdecreased by 60%HeadcountGroup-level headcount reductionfrom 520 to 165 peopleManagerial headcount reduction by 30%New/remaininggroup-levelorganizations4159Terminatinggroup-levelorganizationsGroup-levelpositions165355Terminatinggroup-levelpositionsRevision of group-level activities andresponsibilitiesReassessment of group-level positionsSelection of managers and experts byrecruitmentGroup & Local-level FTE reduction altogether:more than 1000 FTEReduction procedure started, first phases:Ca. -10% in HungaryCa. -10% in Slovakia14
SALES PORTFOLIO REVISION TO INCREASE MARGIN REVENUEFuel Sales - LogisticsIncrease/maintain strong market leader position ondomestic marketsMarket optimization on core export marketsIncrease own supply in Romania by ca. 300 ktStrengthen market position in Serbia viacompetitive supplyMake or buy : flexible sales portfolioby optimizing export sales and supplypositionsLogistics networkdevelopments, debottleneckingC4 fractionIncrease marketable volume,quality and value of C4 fraction byproduction optimization2 – 2.5 times more C4 to fulfillwholesale demandIncrease and rationalize Retail market presenceGrowth in Czech Rep., Romania, Serbia, SloveniaKeep leading position in Hungary and SlovakiaConsolidation in Croatia and Bosnia and HerzegovinaExploit synergies betweenWholesale and RetailTarget 200 White pumper FSs inSouth countriesDevelop the regional LPGmarket presence with a totalsales increase of ca. 15%Increase distributor role and end-user sales(160 new auto gas installations)Infrastructure and quality developmentUSD 130-150 million revenue increase until 2014RetailLPG15
FEW ‘BIG THINGS’ AND HUNDREDS OF SMALL ACTIONScumulative2014 savings400TotalSome mid-scale projects and hundreds of smallactions within the more than 500 projects80% of total EBITDA increase will result from 17%of actions80% 20000 100 200 300 400 500number of17% = 87 actionsactionsFour main areas deliver more than 50% of totalbenefitEnergy managementMaintenance managementOrganizational and cost reviewHC loss managementAdditional individual key projects such as:Stretch rail logistics constraint at RijekaIncrease flexibility of naphthadesulphurization unit at Danube RefineryRomanian sales and distribution expansionPrimary attention on top actions result 80% of total benefit16
CONTINUOUS DELIVERYcostrevenue500-550mn USD500-550mn USD500400400mn USDbenefit [mn USD]300200100130mn USD02012 2013 2014 2014 vs 2011Majority of the benefit should be realized till end of 2013Proportional contribution of key flagship companies17
STRICT TRACKING AND MONITORING OF THE PROGRAMAction level reportingFiltering outexternal effectsDownstream levelFinancial verificationCalculate progress and benefitthrough physical and financial KPIs.Action level performance monitoringby 175 action ownersKPI based calculation ofPlanned benefitActual benefitActual benefit w/o external effectsIdentify reasons and responsibilitiesbehind differencesComparing calculated and achievedEBITDA impactFiltering out external effectDownstream level EBITDAimprovement evaluationSuitable for verifying accountedfinancial impact of programsMonthly follow-up & execution monitoringQuarterly measurement of results internallyYearly update about achieved benefits to the capital market18
ON TRACK RESULTS OF NEW DOWNSTREAM PROGRAM IN 2012 Q1-Q3Results are determined:External factors (e.g. refining & petrochemical margins; demand)Internal efficiency Improvement ProgramOther internal factors (e.g. unplanned shutdowns)New Downstream Program actions resulted in$ 114 million in 2012 Q1 – Q3 period150100$ 114 million88%$ 130 million5002012 Q1 - Q3 result 2012 target19
SUMMARY - NEW DOWNSTREAM PROGRAM 2012-2014Return to the European top quartile$ 500-550 million efficiency improvement on 2011 basis, equal to 3 - 3.5 USD/bbl increaseCovering the entire Downstream value chain with more than 500 individual projectsContinuous delivery with proportional contribution at the 7 unitsRegular, close tracking of achieved resultsCost decrease$ 370-400 mnRevenue increase$ 130-150 mnEnergy management30%29%Petrochemicalssales strategyMaintenance managementProduction flexibility improvement21%21%73%27%42%R&M and Retailsales strategyStock and loss managementOrganizational review andgeneral cost reduction15%13%29%SCM-drivenimprovementPlus continuously evaluate all the options for profitableoperation of small, less efficient assets20
CONSERVATIVE POLICY TO KEEPFINANCIAL STABILITY EVEN IN HARD TIMESJózsef SimolaChief Financial Officer of <strong>MOL</strong> Group<strong>MOL</strong> Group Investor Day15 November 2012, Budapest1
KEY FINANCIAL PRINCIPLES – SOLID BALANCE SHEET HAS TOP PRIORITYKeep key covenant and gearing ratio in the safety zoneAround 2.0 Net Debt to EBITDA and 30% gearing ratioAdjust CAPEX if external environment requiresIn general CAPEX should be financed from Operating Cash FlowFurther diversification of debt structure and maintain averagematurity around 3 year2
CONTINUOUSLY STRENGTHENING FINANCIAL POSITION…CovenantsGearing (%)3,53Limit of net debt to EBITDAEBITDA (in bn USD)Net debt to EBITDA 3,0403633312,522,02,22,52,4302824(%)201,51100,502008 2009 2010 2011 Q3 2012rolling*02008 2009 2010 2011 Q1-Q3 2012Keep covenants in the safety zone – improving gearing positionImproving indebtedness indicators despite lack of Syrian revenue in the last 12months* rolling EBITDA of the last 12 months3
…SUPPORTED BY OUR CONSERVATIVE, PROVED POLICY:In general CAPEX should be financed from operating cashflow600450bn HUF30015002007 2008 2009 2010 2011 Q1-3 2012CAPEX - acq INA acq Pearl Operating Cash Flow4
UP TO USD 2.0 BN CAPEX PER ANNUM IN THE NEXT 3 YEARSCAPEX 2013-2015UpstreamKurdistan Region of Iraq:appraisal and acceleratedfield developmentCEE field developmentand explorationRussia and Kazakhstan –parallel exploration anddevelopment52%up to2.0 bnUSD/year28%3%17%Contingency,C&ODownstreamControl sustain-type CAPEXProfitable growth projects(cca. 50%)Efficiency improvement ofNew DS ProgramRetail, Logistics and Petchem(e.g Butadiene)Gas MidstreamMainly sustain CAPEXStrong focus on Upstream in line with growth opportunities5
MAINTAINING BALANCED FUNDING PORTFOLIOMid- and long-term committed funding portfoliobased on facilities as of 30 September 2012Further steps made towardsdiversification in 201210%10%2%10%New USD 500 mn dollar bond issuedwith 7 year maturity - Sep 201226%35%+ 1 year extension for more than halfof EUR 1 bn revolving credit facilitywith unchanged margin levels – June2012Syndicated / club loans drawnUSD bondHybrid7%Syndicated / club loans undrawnOther bondsMultilateralsUSD 150 mn EBRD amortizing loan –July 2012Other bilateralSource: <strong>MOL</strong>6
MORE THAN EUR 2.8 BN AVAILABLE LIQUIDITYMaturity profile as of 30 September 2012EUR M180016001400120010008006004002000Term deposits 2012 2013 2014 2015 2016 2017 2018 2019DepositsOutstanding short-term loans Medium-term loans Bonds PEX Long-term loans (multilaterals)Undrown facilitiesBBB-BB+by Fitch Ratingsby Standard&Poor’sAverage debt maturity is 3.2years*Both ratings affirmed with stable outlookCredit rating above country rating at Fitch<strong>MOL</strong> has sufficient liquidity even in hard times*as of 30. 09. 20127
FX MIX OF OPERATION SERVES AS A NATURAL HEDGE FOR OUR DEBTUSD and EUR denominated business mix, balanced FX exposure with the debt portfolioRevenue generation by divisions, Q1-Q3 2012Debt by currencies, 31 Sep 2012Corporate &Gasother; 3%Midstream;7%Upstream;13%HUF; 3%USD; 27%Downstream;77%EUR; 70% More than 50% of the EBITDA generated outside of Hungary As product sales pricing is USD/EUR based, operating and investment cash flows are USD/EUR driven Group is short in local currencies (HUF, HRK, RUB) due to operative costs at local operations EUR and USD based indebtedness matches the operational long FX positions8
SUMMARY – KEY TAKEAWAYS3bn USD EBITDA generation in 2011>70% from Upstream, >50% from international operation1.6Bboe Recoverable Resource Potential (WI) in 11 countries682 Mmboe 2P reserves at the end of 2011170-180mboepd Group level production target by 2018o/w 55-62 mboepd to come from Kurditan Region of Iraq500-550mn USD efficiency improvement target with New DownstreamProgram by 2014around2Net debt / EBITDA ratio & around 30% gearing targetsCAPEX should be fully financed by operating cash-flowup to2 bnCAPEX spending per annum in 2013-2015 period with strongUpstream focus10