
You also want an ePaper? Increase the reach of your titles
YUMPU automatically turns print PDFs into web optimized ePapers that Google loves.
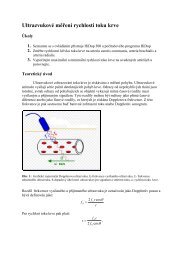
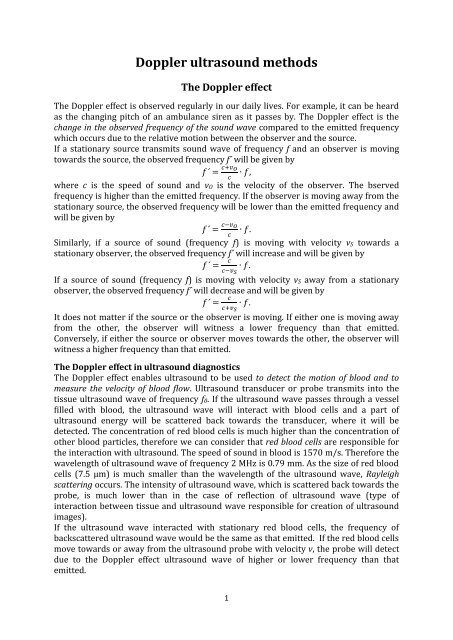
<strong>Doppler</strong> <strong>ultrasound</strong> <strong>methods</strong>The <strong>Doppler</strong> effectThe <strong>Doppler</strong> effect is observed regularly in our daily lives. For example, it can be heardas the changing pitch of an ambulance siren as it passes by. The <strong>Doppler</strong> effect is thechange in the observed frequency of the sound wave compared to the emitted frequencywhich occurs due to the relative motion between the observer and the source.If a stationary source transmits sound wave of frequency f and an observer is movingtowards the source, the observed frequency f´ will be given by´ ,where c is the speed of sound and vO is the velocity of the observer. The bservedfrequency is higher than the emitted frequency. If the observer is moving away from thestationary source, the observed frequency will be lower than the emitted frequency andwill be given by´ .Similarly, if a source of sound (frequency f) is moving with velocity vS towards astationary observer, the observed frequency f´ will increase and will be given by´ .If a source of sound (frequency f) is moving with velocity vS away from a stationaryobserver, the observed frequency f´ will decrease and will be given by´ .It does not matter if the source or the observer is moving. If either one is moving awayfrom the other, the observer will witness a lower frequency than that emitted.Conversely, if either the source or observer moves towards the other, the observer willwitness a higher frequency than that emitted.The <strong>Doppler</strong> effect in <strong>ultrasound</strong> diagnosticsThe <strong>Doppler</strong> effect enables <strong>ultrasound</strong> to be used to detect the motion of blood and tomeasure the velocity of blood flow. Ultrasound transducer or probe transmits into thetissue <strong>ultrasound</strong> wave of frequency f0. If the <strong>ultrasound</strong> wave passes through a vesselfilled with blood, the <strong>ultrasound</strong> wave will interact with blood cells and a part of<strong>ultrasound</strong> energy will be scattered back towards the transducer, where it will bedetected. The concentration of red blood cells is much higher than the concentration ofother blood particles, therefore we can consider that red blood cells are responsible forthe interaction with <strong>ultrasound</strong>. The speed of sound in blood is 1570 m/s. Therefore thewavelength of <strong>ultrasound</strong> wave of frequency 2 MHz is 0.79 mm. As the size of red bloodcells (7.5 µm) is much smaller than the wavelength of the <strong>ultrasound</strong> wave, Rayleighscattering occurs. The intensity of <strong>ultrasound</strong> wave, which is scattered back towards theprobe, is much lower than in the case of reflection of <strong>ultrasound</strong> wave (type ofinteraction between tissue and <strong>ultrasound</strong> wave responsible for creation of <strong>ultrasound</strong>images).If the <strong>ultrasound</strong> wave interacted with stationary red blood cells, the frequency ofbackscattered <strong>ultrasound</strong> wave would be the same as that emitted. If the red blood cellsmove towards or away from the <strong>ultrasound</strong> probe with velocity v, the probe will detectdue to the <strong>Doppler</strong> effect <strong>ultrasound</strong> wave of higher or lower frequency than thatemitted.1
Let us consider red blood cells that are moving with velocity v towards the <strong>ultrasound</strong>probe.The <strong>ultrasound</strong> probe transmits <strong>ultrasound</strong> wave of frequency f0. Red blood cell can beconsidered as a detector of <strong>ultrasound</strong> that will due to its movement witness thefrequency f´, given by´ .As the red blood cell scatters the <strong>ultrasound</strong> wave, it now acts as a source of <strong>ultrasound</strong>of frequency f´, which is moving at velocity v towards a stationary detector (<strong>ultrasound</strong>probe).Frequency f´´ detected by the probe is thus given by.As the velocity of red blood cells in human body v is much lower than the speed of soundin blood c, we can rearrange the previous equation as followswhere can v 2 /c 2 be considered as negligibly small and therefore can be ignored. Thedetected frequency is then given by´´ .We can see that for v much lower than c, the change of frequency is the same as in thecase of stationary source and moving detector. We can substitute in this equation for f´and we have´´ ,v 2 /c 2 can be again ignored. The <strong>Doppler</strong> shift or <strong>Doppler</strong> frequency fD is the differencebetween transmitted and received frequency. It can be thus calculated as follows.If the red blood cells move with velocity v away from the <strong>ultrasound</strong> probe, the <strong>Doppler</strong>frequency can be analogically calculated using equation.These equations can be used only in the case that the direction of blood movement isparallel to the direction of <strong>ultrasound</strong> wave propagation. If the direction of blood2,
movement is other, the <strong>Doppler</strong> shift will be given by the velocity component parallel tothe <strong>ultrasound</strong> path v‖, which is given by,where angle α is known as the angle of insonation or <strong>Doppler</strong> angle.The general relationship between the <strong>Doppler</strong> frequency and red blood cells velocity(known as <strong>Doppler</strong> equation) is therefore.If the <strong>Doppler</strong> angle is known, it is possible to use the measured <strong>Doppler</strong> frequency toestimate the velocity of red blood cells (the velocity of blood flow) using <strong>Doppler</strong>equation.There are two main display modes used in modern <strong>Doppler</strong> systems – spectral <strong>Doppler</strong>measurements and 2D colour flow imaging.Spectral <strong>Doppler</strong> measurements of blood flowThis display mode is used to detect the blood velocity information from a single locationwithin the blood vessel (the sensitive region is known as the sample volume). Thevelocity information is displayed in the form of <strong>Doppler</strong> spectrum.<strong>Doppler</strong> spectrum displays time along the horizontal axis and the measured <strong>Doppler</strong>frequency shift or calculated velocity along the vertical axis. Conventionally, positive<strong>Doppler</strong> frequencies and velocities (blood flowing towards the probe) are plotted abovethe baseline and negative <strong>Doppler</strong> frequencies and velocities (blood flowing away fromthe probe or reverse flow) are plotted below the baseline. The brightness of the displayindicates the amplitude of each of the <strong>Doppler</strong> frequency components present, i.e. therelative proportion of the blood travelling with a particular velocity. We can see that the<strong>Doppler</strong> <strong>ultrasound</strong> signal from a blood vessel contains a range of <strong>Doppler</strong> frequenciesat any particular point in time. This means that all red blood cells within the samplevolume are not travelling with the same velocity. Typically, the velocity is highest in thecentre of the vessel and lowest near the vessel wall. This variation of blood velocityacross the vessel is called the velocity profile.3
Parabolic flow profile is observed in a smooth, rigid tube with slow continuous laminarflow. Liquid in the centre of the tube moves with maximal velocity, but the velocitydecreases towards the tube wall due to the viscous drug exerted by the walls. The fluidat the wall remains stationary. The flow velocity v in the distance r from the tube centreis given bywhere R is the tube radius and vMAX is the velocity in the centre of the tube. The <strong>Doppler</strong>spectrum contains all the velocities between 0 and vMAX. The average velocity is equal tothe half of the maximum velocity. In contrast, in the case of the plug flow profile, nearlyall the fluid across the lumen moves within a narrow range of high velocities. Thevelocity at the wall is still zero, but velocity increases more rapidly away from the wall.The <strong>Doppler</strong> spectrum then contains only a narrow range of nonzero signal and so calledspectral window (zero signal for lower velocities).,The flow in arteries is in fact pulsatile and therefore the velocity profile across an arteryvaries over time.Typically, the measured <strong>Doppler</strong> frequencies are in the order of hundreds andthousands of Hz. Therefore, the <strong>Doppler</strong> signal can be converted to acoustic signal andacoustic output is second way of presenting the velocity information.<strong>Doppler</strong> systems for spectral <strong>Doppler</strong> measurements can be divided into two groups –continuous wave systems and pulsed wave systems.Continuous wave systems – CW <strong>Doppler</strong> – transmit and receive continuously<strong>ultrasound</strong> waves. Therefore, the probe must contain two elements – one fortransmission and one for reception of <strong>ultrasound</strong>. The region from which <strong>Doppler</strong>signals are obtained (the sample volume) is determined by the overlap of the transmitand receive <strong>ultrasound</strong> beams. The position and the size of the sample volume cannot bechanged – this is the main disadvantage of these systems.Pulsed wave systems – PW <strong>Doppler</strong> – transmit short pulses of <strong>ultrasound</strong> and <strong>Doppler</strong>signals can be acquired from a known depth. In order to detect the signal from a specificdepth in the tissue, a “range gate” is used. This enables the system to only receive thereturning signal at a given time after the pulse has been transmitted, and then for alimited period of time. In the probe only one element is needed, serving both thetransmit and receive functions.4
Today, pulsed <strong>Doppler</strong> systems for spectral <strong>Doppler</strong> measurements are usually used inconjunction with <strong>ultrasound</strong> B-mode imaging - this combination is known as duplex<strong>ultrasound</strong>. Duplex <strong>ultrasound</strong> enables precise location of the <strong>Doppler</strong> sample volume.It is also possible to estimate the angle of insonation using the angle correction cursor,enabling the velocity of the blood to be calculated using the <strong>Doppler</strong> equation. Modernduplex scanners use arrays of elements to produce both the B-mode image the <strong>Doppler</strong>spectrum.Spectral <strong>Doppler</strong> controlsTransmit powerTransmit power determines the amplitude of the <strong>ultrasound</strong> transmitted into the tissue.Increasing the output power will increase the amplitude of returning <strong>Doppler</strong> shiftedsignal, but it will also increase the patient’s exposure to <strong>ultrasound</strong>. Therefore, thetransmit power should only be increased after other controls, such as gain, have beenoptimised to obtain the best possible <strong>Doppler</strong> spectrum.GainAs the received backscattered signal from blood is small it will need to be amplifiedbefore it can be analysed. Increasing the spectral gain increases the brightness of thespectrum on the screen. However, the gain control increases the amplitude of not onlythe <strong>Doppler</strong> signal but also the background noise.Transmit frequencyAs high-frequency <strong>ultrasound</strong> is attenuated more than low-frequency <strong>ultrasound</strong>, theappropriate <strong>Doppler</strong> transmit frequency needs to be selected to ensure adequatepenetration of <strong>ultrasound</strong>. Most modern <strong>ultrasound</strong> systems use broadband transducertechnology, which means it is possible to operate the transducer over a range ofdifferent frequencies without too much loss in efficiency.Pulse repetition frequency - scale (PW <strong>Doppler</strong>)When using PW <strong>Doppler</strong>, the <strong>Doppler</strong> frequency is derived from samples of signalobtained over several transmitted pulses. The transmitted pulses are sent at a ratecalled the pulse repetition frequency. It is known that there must be at least two sampleswithin one cycle of the <strong>Doppler</strong> signal to unambiguously determine the <strong>Doppler</strong>frequency. That is, at least two samples are required to know that the amplitude hasoscillated above and below zero within the time of one period. This is known as theNyquist limit. The maximum frequency that may be unambiguously is equal to the half ofthe pulse repetition frequency. Therefore, increasing of pulse repetition frequencyincreases the range of measurable <strong>Doppler</strong> frequencies (velocities). In contrast, there isnot any upper limit of measurable <strong>Doppler</strong> frequency in CW <strong>Doppler</strong> systems.5
BaselineThe baseline represents the zero <strong>Doppler</strong> frequency shift. The position of the baselinecan be changed by the operator to allow optimum use of all the spectral display,depending on the relative size of the forward and reverse flow velocities present.Inversion of the spectrumThis control enables to display positive velocities below the baseline and negativevelocities above the baseline. Conventionally, arterial flow is plotted above the baselineand venous flow below the baseline.Wall filterThe wall filter is used to remove high-amplitude low-frequency <strong>Doppler</strong> shifts caused byreflection from the slowly moving vessel wall. The wall filter acts as the high-pass filter,which removes frequencies lower than the set threshold value. As some of the truespectral information on flow is removed by the filter, there will be some error in theaverage velocity calculation. The wall filter should be always set to a minimumfrequency compatible with its purpose of eliminating unwanted wall echoes.Sample volume size and position (PW <strong>Doppler</strong>)The size and position of the sample volume or the range gate can by selected by theoperator when using PW <strong>Doppler</strong>. The precise location of sample volume is possiblewhen using duplex systems. The sample volume length may affect the appearance of the<strong>Doppler</strong> spectrum and therefore may affect the results of spectral <strong>Doppler</strong>measurements – if the operator locates a short sample volume near the centre of thevessel, low velocities that occur near the vessel wall will not be detected.<strong>Doppler</strong> angle cursorIn order to calculate the velocity of blood from the measured <strong>Doppler</strong> shift frequencies,the angle of insonation between the <strong>Doppler</strong> beam and the direction of flow must beknown. Duplex scanners have the facility to allow the operator to line up an angle cursorwith the vessel wall as seen in the B-mode image. The scanner can then convert the<strong>Doppler</strong> frequencies to velocities and velocity scale will be seen alongside the spectraldisplay. Errors in the alignment of the angle correction cursor can lead to significanterrors in velocity measurements.Focal depthIn many systems the <strong>Doppler</strong> beam is focused. This may be fixed or adjustable,depending on the <strong>ultrasound</strong> system. In some systems the <strong>Doppler</strong> beam focal depthautomatically follows the sample volume, when the operator moves it.Spectral <strong>Doppler</strong> measurementsMeasurements of blood velocities are often used to quantify diseases of thecardiovascular system. If the <strong>Doppler</strong> angle α is known the <strong>Doppler</strong> equation can be usedto estimate the velocity of the blood from the measured <strong>Doppler</strong> frequency fD.There is usually a spread of velocities within the sample volume. The maximum velocityat peak systole is often used to quantify the carotid artery disease. The <strong>ultrasound</strong>system can calculate the average or mean <strong>Doppler</strong> frequency (velocity) by finding theaverage of all the frequencies in the spectrum at a given instant in time. Many<strong>ultrasound</strong> systems are also capable of providing velocity measurements averaged overtime. One such measurement is the mean velocity averaged over a number of completecardiac cycles, usually known as time average velocity TAV. This can be used to estimatevolume flow. Volume flow is measured using duplex <strong>ultrasound</strong>. Flow can be calculatedby multiplying the TAV by the cross-sectional area A of the vessel. One method of6
estimating the cross-sectional area is to measure the diameter of the vessel d. Thevolume flow can be then calculated using equationSeveral indices for quantitative evaluation of <strong>Doppler</strong> waveform shape were introduced.These indices can be calculated even if <strong>Doppler</strong> angle is unknown. The value of theseindices is calculated using peak systolic velocity S (peak systolic <strong>Doppler</strong> frequency),end-diastolic velocity D (end-diastolic <strong>Doppler</strong> frequency) and mean value of maximumvelocity over complete cardiac cycle M (mean value of maximum <strong>Doppler</strong> frequencyover complete cardiac cycle)..The pulsality index is defined asThe resistance index, which describes the peripheral resistance to flow seen by the arteryat the site of measurement, is defined as.This index is low for arteries with low-resistance flow (cerebral and renal arteries, limbarteries during exercise) and high for arteries with high-resistance flow (limb arteries inrest). Last example of quantitative indices is systolic-diastolic ratio defined as.ArtefactsTo be able to correctly interpret <strong>Doppler</strong> spectra and <strong>Doppler</strong> waveforms, it is necessaryto know the common artefacts which can occur during spectral <strong>Doppler</strong> measurements.Aliasing can occur due to the undersampling of the <strong>Doppler</strong> signal when using PW<strong>Doppler</strong> systems. If the pulse repetition frequency is set to low the <strong>Doppler</strong> signal withfrequency higher than Nyquist limit will be incorrectly displayed in the reverse channel..AliasingAliasing can be removed by increasing the pulse repetition frequency or by the change ofbaseline position. Inverted image of <strong>Doppler</strong> spectrum (the same <strong>Doppler</strong> spectrum7
above and below the baseline) can occur if the gain is set to high or if the <strong>Doppler</strong> angleis near 90°.Inverted image of <strong>Doppler</strong> spectrumSimilar <strong>Doppler</strong> spectrum can be observed also in the case of turbulent flow when theblood really moves with positive as well as negative velocity. It is necessary todistinguish these two situations. Mirror artefact can be removed by decreasing the gainor by changing the <strong>Doppler</strong> angle, but in the case of turbulent flow, positive as well asnegative velocities remain in the <strong>Doppler</strong> spectrum after the change of theseparameters. The <strong>Doppler</strong> shift frequencies detected are dependent on the <strong>Doppler</strong> angle(<strong>Doppler</strong> frequencies decrease with increasing <strong>Doppler</strong> angle). The <strong>Doppler</strong> angleshould be kept as small as possible and should never exceed 60°. Accurate estimation of<strong>Doppler</strong> angle is necessary for accurate velocity measurements. Complete and uniforminsonaion of the vessel lumen is necessary for accurate measurements of the mean oraverage velocity. When the <strong>Doppler</strong> signal is detected only from the central part of thevessel, low velocities that occur near the vessel wall will not be detected, which leads tooverestimation of the true average velocity. Similar consequences can be observed if thewall filter is set to high.Colour flow imagingIn the case of colour flow imaging, the blood velocity information is colour coded andsuperimposed on the B-mode image. Production of a 2D colour flow image includeselements of B-mode image formation and pulsed <strong>Doppler</strong> techniques. As in B-modeimage formation, the image consists of individual lines. The image lines are created bytransmitting ultrasonic pulses and processing the sequence of returned echoes.However, unlike B-mode image formation in which echo amplitude information isprocessed to form the image, the echoes are used to measure the <strong>Doppler</strong> frequencyshifts. In the pulsed wave spectral <strong>Doppler</strong> systems, the <strong>Doppler</strong> information wasobtained from only a single sample volume. In colour flow systems, each line of theimage is made up of multiple adjacent sample volumes. The <strong>Doppler</strong> shift informationfor each line is obtained from several transmission pulses, the B-mode image can beobtained from only one transmission pulse. Therefore the frame rate of colour image islower than the frame rate of B-mode image (for comparable number of scan lines).However, the colour coded flow information is usually displayed only in a limited regionof interest called the colour box within the displayed B-mode image. The lower numberof image lines leads to the increase of the frame rate. The width and depth of the colourbox are under operator control. Unlike the spectral <strong>Doppler</strong> display mode, it is notpossible to display the complete blood velocity information in the colour image. Colour<strong>Doppler</strong> mode displays the mean or average velocity of the flow in each pixel of thecolour box. Conventionally, the flow towards the probe is coded with red colour andflow away from the probe is coded with blue colour. The brightness of the colourdetermines the flow velocity.8
Color <strong>Doppler</strong>Power <strong>Doppler</strong> mode displays the power of the <strong>Doppler</strong> signal backscattered from bloodin each pixel of the colour box. This mode thus does not provide blood velocityinformation, but rather information about the total number of moving red blood cells.This mode is usually used to display the flow in small vessels.Power <strong>Doppler</strong>Although colour flow imaging does not provide complete blood velocity information, it isvery useful. It allows rapid visualisation of the flow pattern in vessels, allowing highvelocityjets in arteries and in cardiac chambers to be seen. In addition, it facilitates theplacement of the <strong>Doppler</strong> sample volume in spectral <strong>Doppler</strong> investigation, hencereducing scanning time. Modern <strong>ultrasound</strong> systems can operate in so-called triplexmode, which combines Colour flow imaging (B-mode image + colour box) and spectral<strong>Doppler</strong> measurements.Colour flow imaging controlsMost controls – transmit power, gain, transmit frequency, pulse repetition frequency,baseline and wall filter – have the same function as in the case of spectral <strong>Doppler</strong>measurements of blood flow. In colour flow imaging it is not possible to set the value ofthe <strong>Doppler</strong> angle and therefore it is not possible to measure accurate values of velocity.Persistence (frame averaging)Persistence refers to the averaging of <strong>Doppler</strong> shift estimates from current and previousframes. Increasing of the persistence will lead to decreasing of the noise in the colourimage, but rapidly changing flow patterns will not be properly visualised.9
Flow sensitivityThis parameter determines the number of pulses used to generate each colour line.Increasing the number of pulses per image line increases the sensitivity to slow flows,but decreases the frame rate.Colour versus echo priorityThe colour coded flow information is usually superimposed only over dark B-modepixels (the blood is generally anechogenic which means that in B-mode image will bedisplayed as black). Colour versus echo priority enables to set the threshold pixel valuewhich determines if the colour information will be displayed or not. If the priority is setto low the colour coded information will not be superimposed over the vessel wall,however the information about the flow in small vessels can be lost (the lumen of verysmall vessels is not black in the B-mode image).ArtefactsAliasing will be displayed in the colour image as a transition from maximum brightnessof one colour to maximum brightness of second colour which corresponds to the flow inthe opposite direction. Similarly as in the PW <strong>Doppler</strong>, aliasing can be removed byincreasing the pulse repetition frequency or by the change of baseline position.AliasingIf the <strong>Doppler</strong> angle is near 90° the ambiguity of the flow direction can be observed – inone part of the vessel the blood flows towards the probe, in other part of the vessel theblood flows away from the probe and where the <strong>Doppler</strong> angle is equal to 90° no flow isdetected.Ambiguity of the flow directionIn the presence of a strongly reflecting surface, multiple reflections may occur, leading tothe appearance that <strong>Doppler</strong> signals are detected outside the vessel. This will affect boththe spectral <strong>Doppler</strong> and the colour flow image. This is known as a mirror image.10
Instruction for practical tutorialTask1) Using the colour flow imaging display the flow in tubes of inner diameter 8 and4 mm.2) Using spectral <strong>Doppler</strong> flow measurements measure the maximum and averagevelocity in tubes of inner diameter 8 and 4 mm. Calculate the volume flow in thesetubes.3) Compare the character of velocity spectrum and maximum and average velocities inprestenotic and poststenotic region.Diagnostic <strong>ultrasound</strong> system TITANDiagnostic <strong>ultrasound</strong> system TITAN is equipped with convex probe C15.Be extremely careful when using the <strong>ultrasound</strong> system and especiallythe probe! Basic control of the <strong>ultrasound</strong> system is described below.1 Power turn on/offA gain applied to the near field of the imageB gain applied to the far field of the image2 Gain overall gain applied to the whole imageC gain applied to the active mode (Color,<strong>Doppler</strong>)3 Depth adjusts the imaging depth in 2D11
4 Caliper activates measurements using cursor5 Calcs activates calculations6 Freeze „freezing“ of the image7 Touchpad moving and selection of objects on the screen8 Select confirmation of the selection9 Save saves the image to the memory10control of parameters displayed on thebottom bar of the screen (see below)11 Patient access to patient information12 Update toggles between display modes13 <strong>Doppler</strong> activates spectral <strong>Doppler</strong> measurements14 Color activates colour flow imaging15 2D activates B-mode imagingAdjustable controls of colour flow imaging (bottom bar of the screen)Flow sensitivityScale (pulse repetition frequency)Wall FilterInvert (inversion of colour map)Adjustable controls of spectral <strong>Doppler</strong> measurements (bottom bar of the screen)<strong>Doppler</strong> angle cursorSample volume size (gate range)Scale (pulse repetition frequency)Line (change of the baseline position)Invert (inversion of the <strong>Doppler</strong> spectrum)Volume (audio output)Wall FilterSweep speedTrace (calculation and display of average velocity)12
Blood vessel phantomThe blood vessel phantom is composed of a plastic box filled with agar-based materialwhose acoustic parameters are similar to acoustic parameters of human soft tissues.One tube of inner diameter 4 mm and two tubes of inner diameter 8 mm are embeddedin the agar-based material. These tubes replace the function of blood vessels and arefilled with a fluid whose acoustic parameters are the same as the acoustic parameters ofhuman blood. Using a three-way valve, it is possible to select which tube will the fluidflow through. The fluid is driven by an electrical pump. The pump can you turn on/offusing the red switch. The pump should be turned on only during the measurement. Turnoff the pump when you finish the measurement. Be extremely careful whenusing the blood vessel phantom (especially during the placing of theprobe on the surface of the phantom)! In case you are not sure, contact yourprofessor assistant.Instructions1) Familiarize yourself with handling of the diagnostic <strong>ultrasound</strong> system TITAN andwith handling of the pump.2) Turn the <strong>ultrasound</strong> system on and press the „Patient“ key. Select „New“ from thebottom bar of the screen and fill in your first name and surname. Select „Abdomen(Abd)“ as the exam type and confirm the selection by pressing „Done“ on the bottombar of the screen.3) Set the three-way valve in such a way that the fluid flows through the tube No. 1(inner diameter of 8 mm). The red lever of the three-way valve indicates the tube,whose inlet will be stopped. The valve should be always rotated counterclockwise.4) Apply a layer of the gel on the surface of the probe. Place the probe on the surface ofthe vessel phantom – at the distance of 1/3 from the right edge of the phantom in thepoint where the tube No. 1 passes through the agar-based material.5) Move the probe along the phantom surface (be careful!) until you find the tube in theB-mode image. Using the „Gain“ knob, set the gain to the lowest level (the lumen of13
the tube has to be dark). Using the „Depth“ keys, select an appropriate imaging depth– select lowest depth which allows you to view the tube.6) Start to pump the fluid – turn on the pump using the red switch.7) Press the „Color“ key. A colour box will be displayed on the screen. Using thetouchpad or the arrow keys on the keyboard, you can change the position of thecolour box. When you press the „Select“ key, you can change the size of the colourbox using the touchpad or the arrow keys on the keyboard. The new size of the boxcan be saved by pressing the „Select“ key. The position and size of the colour boxshould be set in such a way that the tube passes through its centre.8) Using the control displayed on the bottom bar of the screen, set the flow sensitivityto „Low“ and set the wall filter to „Low“.9) Using the „Gain“ knob, set an appropriate gain level - if the gain is set to high, thecolour information is displayed outside the tube; if the gain is set to low, the colourinformation disappears from the tube lumen.10) Using the control on the bottom bar of the screen, set an appropriate pulserepetition frequency – the measured signal should cover the widest possible rangeof colours without the presence of aliasing. Fill in the optimum value of the pulserepetition frequency into the protocol.11) Check, that the aliasing appears in the colour image if the pulse repetition frequencyis set to low. Fill in into the protocol in which part of the tube the aliasing appears.12) Press the „2D“ key. The B-mode image is displayed.13) Press the „<strong>Doppler</strong>“ key. A <strong>Doppler</strong> line with the sample volume will be displayed onthe screen. The position of the sample volume can be changed using touchpad –place the sample volume into the centre of the tube.14) Using the control displayed on the bottom bar of the screen, select approximatevalue of <strong>Doppler</strong> angle; set the sample volume size to maximum value (5 mm).15) Press the „Select“ key and set the true value of <strong>Doppler</strong> angle using the touchpad orthe arrow keys on the keyboard. The <strong>Doppler</strong> angle cursor should be parallel to thetube wall. Confirm the new position of <strong>Doppler</strong> Angle cursor by pressing the „Select“key.16) Press the „Update“ key. The <strong>Doppler</strong> spectrum will be displayed in the lower part ofthe screen.17) Using the „Gain“ knob, set an appropriate gain level – the appropriate gain levelmaximizes the signal amplitude without the presence of noise.18) Using the control on the bottom bar of the screen, set an appropriate pulserepetition frequency – the measured signal should cover the widest possible rangeof spectrum without the presence of aliasing. Set the wall filter to „Low“.19) Check, that the aliasing appears in the <strong>Doppler</strong> spectrum if the pulse repetitionfrequency is set to low. Check, that the mirror image appears in the spectrum if thegain level is set to high.20) Select „Page 2…“ from the bottom bar of the screen and then select „Trace“. A yellowline will be displayed in the spectrum. The yellow line corresponds to the averageflow velocity.21) Optimize the parameters of the <strong>ultrasound</strong> system to obtain the best possible<strong>Doppler</strong> spectrum. Press the „Freeze“ key and measure the value of the maximumand average velocity. Press the „Caliper“ key. A cursor will be displayed in the<strong>Doppler</strong> spectrum. The value of velocity corresponding to actual position of thecursor is displayed below the spectrum. Measure the value of maximum and averagevelocity in three different points in time. Measured values fill in into the protocol.14
22) Using the same procedure measure the value of maximum and average velocity inthe tube No. 3 (inner diameter of 4mm).23) Calculate the volume flow in the tubes No. 1 and 3 (use the value of average velocityand inner diameter of the tube). Compare the measured values of velocity andcalculated values of volume flow in the tubes No. 1 and 3.24) Set the three-way valve in such a way that the fluid flows through the tube No. 2(inner diameter of 8 mm, stenosis in the middle of the tube).25) Using the spectral <strong>Doppler</strong> measurements, determine the differences between theflow in prestenotic and poststenotic region. The velocity in the prestenotic regionshould be measured at the distance of 1/3 from the left edge of the phantom; thevelocity in the poststenotic region should be measured at the distance of 1/3 fromthe right edge of the phantom. Compare the measured values of maximum andaverage velocities in prestenotic and poststenotic region.26) When you finish your work, turn off the pump. Remove the remainders of the gelform the probe and from the surface of the phantom. Cover the phantom by theplastic lid to prevent its drying.15