You also want an ePaper? Increase the reach of your titles
YUMPU automatically turns print PDFs into web optimized ePapers that Google loves.
Magazine for Surveying, Mapping & GIS Professionals1January/February2 0 1 3Volume 16UAV Special Augmented Reality Markup Language 2.0<strong>3D</strong> <strong>City</strong> <strong>Modeling</strong> Bentley Be Inspired Awards
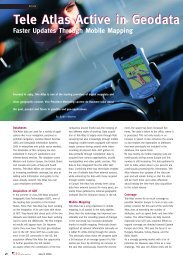
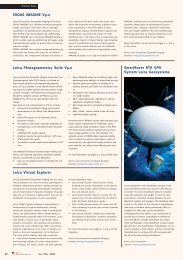
A r t i c l eData Capture, Maintenance and Applications<strong>3D</strong> <strong>City</strong> <strong>Modeling</strong><strong>3D</strong> <strong>City</strong> models are now common inside and outside the geospatial industry. An expert in the city mo -deling field, Prof. em. Dr. Armin Gruen discusses some current <strong>3D</strong> modeling issues. Special attention ispaid to quality control and data maintenance. In addition, he makes a plea for multiple uses of data,updating city models with real-time data feeds and foresees many new business opportunities in bothdata acquisition hardware and software related to <strong>3D</strong> modeling practices, based on fieldwork in Asia.By Eric van ReesFigure 1. Research modules of the SEC-FCL project in Singapore. The Simulation Platform models information in terms of stocks and flows andassembles and produces data needed by the other modules for storage, processing, analysis, visualization, animation.IntroductionA few years ago, reality-based <strong>3D</strong> city modelsstarted to become popular at a rapid pace.Initially, they were often created to show theuniqueness of a city to the rest of the world.Today, their usefulness is becoming more andmore diverse. The same goes for generic modelingand, what is even more significant, isthat the two can be combined. An exampleof this is happening at the moment inSingapore, where five international scienceresearch centers are involved in various programs.One of them is the Singapore-ETHCentre for Global Environmental Sustainability(SEC). It started with the establishment of ahighly trans-disciplinary project, the FutureCities Laboratory (FCL), which rapidly evolvesinto a global think tank and develops newmethods for better understanding the evergrowing amounts of urban data. Additionally,it will make this knowledge available to decisionmakers, stakeholders and urban planners.Different research modules have beendefined and their data needs are combinedand treated on a simulation platform. Thisplatform includes expertise and software forGIS, remote sensing, photogrammetry, visualization,simulation and animation, whichhelp in modeling cities as metabolic objects.These can be understood as dynamic systemsand can be read in terms ofstocks and flows. Geomatics ispart of these research packages.For example, there’s realitybasedcity modeling where satellite,airborne and terrestrialimagery and laser scans areused to develop new methodsand software for realistic realitybasedmodeling of cities. Thistask is being undertaken by Prof.em. Dr. Armin Gruen, Institute ofConservation and BuildingResearch, ETH Zurich, Switzer -land. Here, he talks about cityArmin Gruenmodeling in current times, as well as newapplications for city modeling, new datacapture methods and the challenges of modelingtoday, most notably with UAV’s.Data maintenance and qualitycontrolWhen discussing a city model, a question thatcomes up sooner or later is how to make a dis-Figure 2. <strong>3D</strong> city model of Punggol, a new residential area in Northeast Singapore.Produced by Cyber<strong>City</strong> Modeler from a WorldView-2 stereo model.6January/February 2013
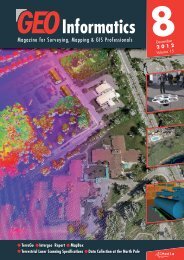
A r t i c l eFigure 3. The Falcon-8 octocopter ready fortake-off in front of a satellite image receptionantenna on NUS (National University ofSingapore) campus.tinction between a good or bad reality-basedcity model. Gruen is very clear about this: “agood city model is one that is maintained, updatedand actual. People discuss how to producea city model, but don’t discuss how to maintainit.” What is necessary is a procedure to maintainor update a city model. What is applicablefor maps is also applicable for city models:“everybody is happy if he has a dataset, butfive years later it’s outdated more than everbefore.” Updating <strong>3D</strong> models with real-timedata feeds is very promising and provides manyopportunities, but there’s not much discussiongoing on in the community about doing so, saysGruen: “occasionally, people mention it but Isee no concrete development here. People arestill presenting their first work, which I call a virgindataset.”Creating this ‘virgin dataset’ is hard enough,especially if there’s a deadline to be met for aclient. <strong>City</strong> modeling is almost always done inmanual measurement mode or in a semi-automatedmanner at most. Especially quality checksrequire much manual work. And this takes time,says Gruen: “it’s quite an important issue that acustomer very often wants the result in no time,and this is not possible in Europe, but in Chinait is. In Europe, you typically have three to fivepeople working on a project, but in China thereare 100 people who can work in parallel, sothat you can fulfill almost any deadline.”“Here we should clearly point out how wedefine a <strong>3D</strong> city model. This is a model whereobjects like, buildings or other man-made structures,vegetation, water surfaces, DTM, etc. aredistinguished from each other. Very often a digitalsurface model (DSM) is presented as citymodel, with the claim it was produced automatically.This is not the domain we are discussinghere”.The work of amateurs through crowdsourcing isnot something that could solve this Europeancapacity problem, says Gruen: “I’m deeply convincedwe should leave modeling to professionals.Because, who gives you a guarantee ifsomething is correct or not correct? You see it inGoogle Earth very often, that there are funnyhouses which do not exist in this form in reality.Or the digital terrain models are crossly wrong.There’s the issue of quality control, making surethat specifications are fulfilled so that the productis reliable. This is what we are used to andthis is what we should expect in the future.”“A major problem in this context is that thereare no standards available for <strong>3D</strong> city models.<strong>City</strong>GML is more a data standard, (a commoninformation model for the representation of setsof <strong>3D</strong> urban objects – as Wikipedia puts it) andnot a specification for content. In 2D mappingwe know exactly what a map at a particularscale should contain. There is even a list ofobjects to be mapped and represented. This isnot yet available for city models and this makesit difficult to deal with the issue.”Applications for reality-based <strong>3D</strong>city modelsTraditionally, there have been a number ofapplications for reality-based <strong>3D</strong> city modelsproduced, for example, for the planning ofbuildings, roads and location as well as architecture,monument preservation, tou rism andenvironmental monitoring. New applicationsare for smart homes, <strong>3D</strong> car navigation, trafficand crowd control, and finally, <strong>3D</strong> cadasters.The usefulness of city models for cadastersdepends on the taxation, says Gruen: “the traditionaldefinition of cadaster is 2D so youwould need a new definition of cadaster to doit in <strong>3D</strong>. In Switzerland they introduced the thirddimension in the cadaster some years ago, butonly as far as terrain is concerned - they’re notlooking into using it for houses. You only needthe third dimension if there’s a country whichconsiders the height of a house for taxation.”Multiple use of a dataset is the key point whenit comes to making a business in city model-Latest News? Visit www.geoinformatics.com January/February 20137
A r t i c l ecases does not prove the opposite. Andindeed, for satellite image processing we didthat already in Singapore, with IKONOS andWorldView-2 imagery. We also used Cyber -<strong>City</strong> Modeler for <strong>3D</strong> modeling, the same softwareas we use with UAV images.”Figure 4. A small 4x4 images subblock of an UAV flight over the NUS campus.ing these days, says Gruen: “the problem todate was that you always had only one customerfor a dataset. One should have a businessmodel where you can sell the dataset atall times and have different users. The needsof users are not that different, and you canmake a low-resolution model out of a high-resolutionmodel if necessary.”Generic modelingGeneric modeling has also found its way intothe GIS area, most notably through the acquisitionof <strong>City</strong>Engine by Esri in 2011. The packageis also used by Gruen and his colleaguesfor the modeling of future cities design scenarios.Procedural modeling tools are used fordesigning, visualizing and analyzing futuredesign scenarios. The resulting fancy-lookingmodels are also being used outside of thegeospatial world, for example, for the entertainmentindustry, which has been the biggestcustomer for these models so far.Gruen notices a convergence happeningbetween reality-based and generic modeling:“people now try to make generic models moreand more realistic by using maps or footprintsand build the height of a building generically.Or, they use satellite imagery and extract thefootprints from satellite imagery and then buildgeneric models on top of this. So, it’s a combinationof things. Even more, we are doingfirst successful tests to combine reality-basedand generic <strong>3D</strong> modeling. We use genericmodeling for the refinement of reality-basedmodels.”UAV imagery can also play a role here, sincethere’s technically no difference between usingUAV images or images taken from airplanesor satellites. Gruen: “there are small variationsas far as the sensor model is concerned, butthe rest is all the same and you could puteverything into one package. The fact thatcommercial software cannot handle all thoseNew applicationsAfter using the UAV systems for the first timein Singapore, local authorities now see manynew applications for its use, in addition to itscommon applications such as <strong>3D</strong> base mappingand DSM generation. The NationalEnvironment Agency, for example, wants touse it for real-time detection and the trackingof oil spills, as well as detection and <strong>3D</strong> measurementsof water pools where Dengue fevermosquitos reside. Gruen: “oil-spill tracking isbeing done with satellite images now but theresults come with a huge delay, because satelliteimages are not available in real-time. Youmay have clouds, and especially in Singaporeyou don’t get a good image maybe for half ayear. So this is a good example where UAV’scan fly under the clouds easily and you cando data transfer and processing in real-time.”UAV’s have the advantage that on-site workcan continue while data is captured from theair. A problem that Gruen encountered acrossall industries which require quality controlusing photogrammetry, (for example to measurean object that is coming from the manufacturingprocess), is that he was asked for asystem that would work fully automatically andwithout people walking around. There’s anarea in the south of Singapore where they areputting up new residential buildings and anew business district. Gruen: “they want touse UAV for the control of the construction site,because otherwise people have no overviewof what’s going on. With the use of UAV, workcan continue there. Or there are activitiestowards flying large plantations in Indonesiaonce a week for monitoring of the crop status.In such cases the requirement is that theuser should be able to operate the UAV byhimself. “Positive past experiences in the field havehelped Gruen and his team to get permissionto fly now: “the first time we were all alone. Imean, the National Research Foundation wasour partner, but there was no other partner,neither private companies nor governmentagencies. But now we have contact with theagencies, which probably makes our pointmore effectively.”Future Cities Laboratory (FCL):www.futurecities.ethz.chFigure 5. A building (Yusof Ishak House) as example of the very high resolution <strong>3D</strong> NUS campus model (UAV image footprint 5 cm).8January/February 2013
THE FORCE THATTDRIVES SMARTERDECISIONSWelcome to Intergraph Geospatial 2013WE ARE UNITED. Whether it’s by desktop,server, web,orcloud – our integrated geospatial portfolio delivers what youneed, where you need it.Less hassle.Complete workflow.One partner.WE ARE MODERN.Our fresh and intuitive interfaces andautomated technology transform the way you see and shareyour data. This world has new challenges.Combat them witha smarter design.WE ARE DYNAMIC.Leverage our single integrated, dynamicenvironment for spatial modeling.Our core geospatial toolsenable you to exploit the wealth of information found in datafrom any source.GEOSPATIAL.INTERGRAPH.COM/2013RAPH.COM/2013TEAM GEO-FORCEINTERGRAPH GEOSPATIAL 2013Experience the force that’s driving smarterdecisions at a road show near you.© 2013 Intergraph Corporation. All rights reserved. Intergraph is part of Hexagon.Intergraph and the Intergraph logoare registered trademarks of Intergraph Corporation or its subsidiaries intheUnited Statesandinothercountries.
A r t i c l eUsing GeoEye-1 Stereo Data in Mining ApplicationAutomatic DEM GenerationThis article describes how high resolution satellite data can be used to extract accurate digitalelevation model (DEM) for a mining application in the Amazon region. The resulting vertical accuracycan be within RMS error of 1.5m when using a minimum number of ground control points.By Waldir Renato Paradella and Philip ChengFigure 1: GeoEye-1 multispectral colorcomposite with main active openpit mines.Digital Elevation Model (DEM) representsthe elevation of the top surfaceof vegetation cover and other features(building, manmade structures, etc.) abovethe bare earth. It is a very important layerfor many types of applications such as topographicmapping, three dimensional GIS,environmental monitoring, geo-spatial analysis,among others. In addition, continuousgrowth in the telecommunication and engineeringindustries has created even greaterdemand for DEM data. This data allows engineersto plan and manage infrastructuregrowth with the high accuracy required bynew spatial applications. However, for mostareas, DEMs suffer from a few common problems;they are unavailable, outdated, oravailable only in low resolution (such as theSRTM DEMs, with 1 to 3 arc second spacing– or 30/90m postings). DEMs generatedfrom satellite stereo-pair images can beused for the applications mentioned above,and also can address the common problemscustomers face when working with existing(or missing) elevation data. Obtaining DEMsfrom satellite images is possible through twomain methods: along-track stereoscopy fromthe same orbit, using fore and aft images,and across-track stereoscopy from two adjacentorbits. The simultaneous acquisition ofalong-track stereo data has a strong advantagein terms of radiometric variation versusthe multi-date acquisition of across-trackstereo data. The across-track approach hasbeen applied frequently since 1980, firstwith Landsat TM from two adjacent orbits,then with SPOT using across-track steeringcapabilities, and finally with IRS-1 C/D by“rolling” the satellite. Nevertheless, alongtrackstereoscopy has recently gainedrenewed popularity. Along-track stereoscopyis applicable to a large number of satellites,including JERS-1’s Optical Sensor (OPS),German Modular Opto-Electronic Multi-Spectral Stereo Scanner (MOMS), ASTER,IKONOS, QuickBird, OrbitView, SPOT-5,Formosat II, CartoSat, and the latest additionFigure 2: GeoEye-1 full resolution panchromatic image of the westernsector of N4E mine.of WorldView, GeoEye-1 and Pleiades satellites.In this article, we will show an exampleof using GeoEye-1 stereo data to extractDEM for a mining application in Brazil.Amazon ForestThe Amazon forest is a moist broadleaf forestthat covers most of the Amazon Basin ofSouth America. This basin encompassesseven million square kilometers (1.7 billionacres), of which five and a half millionsquare kilometers (1.4 billion acres) are coveredby the rainforest. This region includesterritory belonging to nine nations.Approximately, 60% of the Amazon forestlies in Brazil. In this region, with a continentaldimension (almost 5,500,000 km2 of thenational territory), due to adverse environmentalconditions (rain, cloud and densevegetation), difficult access and large size,the topographic knowledge is still poor, withonly 15% of the region covered by maps atdetailed scale (1:50,000). In addition, theavailable information for the remainder ofthe region was mainly produced in the1960’s and 1980’s, and is in desperateneed of updating or needs to be remapped.This area also includes, under an apparentlyhomogeneous physiognomy, an enormousvariability in forests, rivers and lakes, soils,geology, climate, plants and animal. Thelack of reliable terrain information impairsthe ability of the government to formulatepolicies, establish priorities and performessential activities like regulate colonizationand exploitation of natural resources in ecologicallysensitive areas.DEMs are a primary source of input for topographicmapping. The classification of topographicmaps in Brazil should be performedin accordance with the NationalCartographic Accuracy Standard (PEC inPortuguese), established by the BrazilianCartographic Commission. PEC is a statisticalindicator (90% of probability) for planialtimetricaccuracy, corresponding to 1, 6449times the Root Mean Square Error (RMSE)10January/February 2013
A r t i c l eFigure 3: DEM extracted of the entire image(PEC = 1.6449 x RMSE). For a 1:25,000and 1:10,000 scales A Class map, the altimetricRMSE corresponds to 3.33m and 1.66m, respectively (1/3 of the equidistance ofcontour lines on the map scale). A preliminaryevaluation of the altimetric quality of aDEM extracted from a GeoEye panchromaticstereo pair was conducted for a mountainousregion of the Carajás Mineral Province. Theresults show a promising alternative for a productionand updated detailed topographicmapping in the Amazon region, where thiskind of terrain information is lacking or is currentlyonly available in poor quality.The Carajás Mineral Province is located onthe easternmost border of the AmazonFigure 4a: Resampled image at 2m spacingregion. The Province, with an area of120,000 square kilometers, is marked bymountainous terrains, characterized by a setof hills and plateaus (altitudes from 500 to900m) surrounded by southern and northernlowlands (altitudes around 200m), deepchemical weathering which produces thickoxisols (latosols) and few outcrops.Vegetation cover is typical of the Up-LandOmbrophilous Equatorial forest communitieswith complex and multilevel canopies andnumerous species. Since 1967, when theiron deposits were discovered, a remarkablegeobotanical control given by the iron-mineralizedlaterites and specific vegetationtypes has been recognized. The deposits areFigure 4b: Extracted DEM at 2m spacingcovered by thick, hard iron-crusts (lateriticduricrusts) developed over volcanic rocksand ironstones. Specific low-density savanna-typevegetation (campus rupestres) isassociated with the deposits, and shows astrong contrast (clearing) with the denseequatorial forest.Fully owned by Vale mining company, theworld’s second largest mining company,leader in iron-ore production and secondbiggest nickel producer, Carajás Provincecontains known reserves of the order of 18billion tons with an average grade of 65.4%Fe content. Following these discoveries,numerous other metalliferous deposits havebeen identified including manganese, alumina,nickel, tin, gold, platinum group elementsand copper. More recently, the area hasbeen recognized as a major copper-goldprovince, after the discovery of a number ofworld-class iron oxide, copper-gold deposits,and an emerging nickel laterite district, makingCarajás an important and underexploredmetallogenic province. The ironmining activities in the Province are concentratedon two main ore bodies: the N4(mines N4E and N4WN) and N5 (minesN5W and N5E). The reserves of both bodiestotaled 1.4 billion tons of ore with 65%of Fe content. Mining is carried out by conventionalopen-pit methods. In addition, animportant manganese deposit (Azul) wasalso discovered in 1971, with reserves of 65million tons of manganese with manganesedioxide content of over 75%.INPE and Vale initiated a research project inCarajás that investigates the applicability oforbital Synthetic Aperture Radar Inter -ferometry (InSAR) to determine surface deformationsinduced by open pit and miningoperations. Implementing differential interferometryapproaches (DInSAR) for monitoringof mining deformations could provide better,continuous coverage. As a consequence, thisshould lead to determination of more precisedeformation models of rock strata andincrease the safety margins of mining opera-Latest News? Visit www.geoinformatics.com January/February 201311
A r t i c l etions. Monitoring of pit depths and deformations,highlight areas that require real-timemonitoring (e.g. with ground based radar),identify faults/fractures controlling deformationin and around pits, heights of stockpilesand waste dumps, and levels of tailingdumps, may provide additional importantproduction data.The key-element in any interferometric analysisis the phase value of each radar imagepixel. Phase values of a single SAR imagedepend on distinct factors, particularly thecontribution of topography. If a detailed DEMis available, the topographic component canbe known and used in the interferometric process.Thus, the production of a high-resolutionDEM was fundamental in the DInSAR projectin Carajás, not only as input for theAdvanced DInSAR approaches (PSInSAR,SqueeSAR), but also for the production oforthoimages (panchromatic and multispectralGeoEye, StripMap TerraSAR-X, etc.), whichare used as geospatial reference basis for thevalidation of surface displacements.A research project was carried out throughsupport from FAPESP-Vale-INPE (FAPESP process2010/51267-9). Special thanks toCNPq for a research grant (first author) andto PCI´s representative Threetek for helpingin the GeoEye data acquisition.The GeoEye-1 SatelliteThe GeoEye-1 Satellite sensor was developedby GeoEye Inc and features the mostsophisticated technology ever used for acommercial remote sensing system. GeoEye-1 is capable of acquiring image data at0.41 meter panchromatic and 1.65 metermultispectral resolution in 15.2 km swaths. Italso features a revisit time of less than threedays, as well as the ability to locate anobject within just three meters of its physicallocation. The newly developed sensor is optimizedfor large projects, as it can collectFigure 5: Perspective view of imagegenerated with the extracted DEMover 350,000 square kilometers every day.The spacecraft is intended for a sun-synchronousorbit at an altitude of 681 km andan inclination of 98 degrees, with a 10:30a.m. equator crossing time. GeoEye-1 canimage up to 60 degrees off nadir. It is operatedout of Herndon, Virginia and was builtin Arizona by General Dynamics AdvancedInformation Systems.GeoEye-1 Stereo DataIn this article we will test the vertical accuracyof automatic DEM extraction using astereo pair of GeoEye-1 panchromatic data.The data was standard geometrically correctedat 0.5m resolution with rational polynomialcoefficients (RPCs) provided.Panchromatic and multispectral in-trackstereo pairs were acquired over Carajás onJuly 1st, 2012 at 13:42 GMT with 39.81and 51.59 degrees of Sun azimuth and elevation.The first scene was collected withnominal collection azimuth and elevation of29.4 degrees and 82.4 degrees, respectively.The second scene was collected with nominalcollection azimuth and elevation of187.42 and 62.20 degrees, respectively.Figure 1 shows the GeoEye-1 overviewimage of the study area and Figure 2 showsa full resolution of a sector of N4E mine.Geometric Model and SoftwareA geometric modeling method is required inorder to extract the DEM from the stereo data.The Rational Function Method (RFM) has beenthe most popular geometric modeling methodin the past decade. This method uses theRaster Polynomial Coefficients (RPCs) providedwith the satellite data to compute themodel. Since biases or errors still exist in theRPCs, the results can be post-processed witha polynomial adjustment and several accurateground control points (GCPs). More detailsabout the RFM can be found in the paper writtenby Grodecki and Dial (2003). Since theGeoEye-1 data is provided with RPCs, theRFM can be used to as the geometric model.The 2013 version of PCI Geomatics’OrthoEngine software was used for this testing.This software supports reading of thedata, manual or automatic GCP/tie point collection,geometric modeling of different satellitesusing RFM or Toutin’s rigorous model,automatic DEM generation and editing,orthorectification, and either manual or automaticmosaicking.Two stereo Differential GPS (DGPS) GCPswere collected on the stereo panchromaticimages. The RMS residuals when using twoGCPs were 0.4m and 0.1m in X and Y,respectively. When using only one GCP, theRMS errors of the check points were 0.4m and0.3m in X and Y, respectively. When bothGCPs were changed into check points, theRMS errors of the check points were 3.1m inX and 0.8m in Y, respectively. This means it ispossible to achieve an accurate geometricmodel within 0.5m horizontal accuracy withonly a minimum of one accurate GCP. Evenwithout GCPs a horizontal accuracy within 3mis still useful for areas where accurate GCPscannot be obtained.DEM Extraction ResultsDEMs were extracted at 2m spacing usingzero, one and two GCPs, respectively. Theresults were compared with seven well-definedaccurate vertical check points. The RMS andmaximum errors when using two GCPs, oneGCP, and no GCP are 1.4m and 2.2m, 1.2mand 1.6m, and 1.1m and 2.4m, respectively.Figure 3 shows the extracted DEM using twoGCPs of the entire image and figure 4a and4b show the resampled image and DEM at2m spacing, respectively. Figure 5 shows theperspective view of the image generatedtogether with the extracted DEM.SummaryHigh accuracy DEMs can be extracted usingthe GeoEye-1 stereo data. Only a minimum ofone accurate GCP is required to achieve a horizontalaccuracy within RMS error of 0.5m.The extracted DEM has a vertical accuracywithin RMS error of 1.5m when comparing towell-defined vertical check points. These resultsshowed that the planimetric and altimetric qualityof the GeoEye DEM fulfilled the BrazilianMap Accuracy Standards requirements for1:10,000 A class map.Dr. Waldir Renato Paradella is a senior researcher at INPE (BrazilianNational Institute for Space Research). He can be reached atwaldir@dsr.inpe.br. Dr. Philip Cheng is a senior scientist at PCIGeomatics. He can be reached at cheng@pcigeomatics.com.12January/February 2013
A r t i c l eProducing a Thermal OrthophotoA Russian Airborne SurveyingIn 2012 an airborne survey, which included airborne laser scanning, visible spectrum imagery andthermal survey was undertaken at the Sayan Mountains in Russia. The most interesting challenge ofthis project was the production of a thermal orthophoto. This article describes the data acquisition process,as well as data processing and data control methods and concludes with a reflection on the experienceof implementing thermal airborne photography using a “non-metric” thermal camera.By Natalia KovachHeat leakage at a pipeline (thermal imaging, visible range photography and their composition).IntroductionAirborne thermal photography occupies a special place amongst themany methods of remote earth sensing. This method of aerial photographyis not new and is primarily used for the study of urban areas,pipelines and large engineering facilities (factories, industrial sites).Thermal surveys allow the identification of objects requiring servicing(roofs, heating, main thermal insulation and power transmission linesetc.) and should enable the prediction of possible accident risk withindomestic and industrial buildings, with particular regard to differentthermal and electrical equipment. They also allow the identificationof defects with regard to enclosing constructions, heat leakagesand moisture condensation places.An Airborne Surveying Project in RussiaThis article describes the experience of implementing thermal airbornephotography using a “non- metric” thermal camera. In 2012 an airbornesurvey including airborne laser scanning, visible spectrumimagery and thermal survey was undertaken at the Sayan Mountainsin Russia. A total of 345 square kilometers were surveyed. The widthof the survey strip was 1000 meters. The most interesting challenge ofthis project was the production of a thermal orthophoto.Accomplishing this task was complicated by the absence of geometricalsettings of the lens (distortion coefficients) and a lack of exactparameters for the internal camera orientation (principal point, focallength coordinates). Derivation of parameters was conducted duringthe process of imagery (aero photography and thermal) management.Equipment usedA Riegl LMS-Q680i airborne laser scanner, DigiCam 60 Mp digitalcamera and FLIR SC7700 thermal camera were used for airbornelaser scanning and imagery acquisition. The thermal camera is a partof the airborne survey equipment and is located inside a special containeron one hard platform together with the laser scanner and theaerophotocamera. The visor axis of this system was orientated thesame way – in nadir, so that the systems’ visual fields coincidedapproximately in the direction perpendicular to the flight. For eachsystem the external orientation parameters are determined by thePOS/AV IGI DigiControl exact positioning and orientation system,which is part of the Q680i scanner and works by synchronizing alldata into a single time scale. GPS-time was introduced into the framestructure with help of the IRIG-B standard in order to synchronize thethermal data with other systems of the complex. The time each framewas received was determined exactly down to 10 mks GMT.The equipment was installed on the AN-2 aircraft. After the installationand the calculation of the equipment offset-component parametershad been completed, a calibration flight for shooting a test object(usually a rectangular building) was performed. After processing thecalibration flight using special software, the correction factors werecalculated and added to the trip computer. Data processing of thecalibration flight completed the preparatory stage of the aerial survey.During the flight, data was collected simultaneously in different ways:laser scanning, photography and a thermal imaging survey of theunderlying surface. Each element of this data was strictly synchronizedprecisely. Thermal data was recorded in the internal format ofthe program to control the camera and, after treatment, was convertedto bitmaps or video formats. A thermal imaging survey was carriedout at 25 frames/sec. For further processing the frames wereautomatically thinned out on the basis of compliance with the longitudinal(60%) and lateral (30%) overlap.14January/February 2013
A r t i c l eProjectThermal survey parameters:height AGL (above ground level)GroundspeedFrame rateInterruption time (frame acquisition time)thermal camera GSD*the estimated size of the frame on the surface800 m150 km/h25 Hz1 ms1 mEstimated longitudinal overlap 95%Estimated lateral overlap 30%*GSD - ground sample distance640 m х 512 mDigital terrain model and orthophoto were created after completionof aerial photography and airborne laser scanning (precision of1:1000 to the scale of topographic maps).To obtain a thermal orthophoto in the project coordinate system thefollowing set of input data was used:• Thermal data in internal camera format.• Combined GNSS and inertial data trajectories.• Timestamps for each thermal strip.• Orthophotomosaic (scale 1:000) created from the airborne photographydata in the visible scale.• Offset values of the thermal camera’s position in relation to theGNSS–antenna.• Thermal camera passport data: frame size, focus distance etc.Data processing was organized in the following sequence:• Converting thermal video to frames (thermogram).• EO computing using trajectories and timestamps for each thermogram.• Thermal camera calibration (derivation of lens distortion and principalpoint coordinates).Airborne survey methods (Laser Scanning, Aero photography, Thermal imaging)• Aerial triangulation — creation and adjustment of a photogrammetricnetwork with the purpose of exterior orientation improvement.Visible range orthophoto was used as a control and checkpoint source for air triangulation.• Transformation for the DTM. Producing thermal mosaic.• Thermal orthophoto accuracy was checked with field-surveyedcheckpoints.Orthophoto creationThe creation of a thermal orthophoto was conducted for specificareas (urban territories, industrial grounds, artificial structures). Asnoted above, thermal camera, visible range camera and laser scannerwith built-in precision positioning (INS\GPS) were firmly fixedonto one platform during the aerial survey. Thus obtained inertialnavigation measurements are equally applicable to all acquired data(laser scanning, aerial photography and thermal imaging mode).Using GPS-tags, i.e. the size of the frame, the original value of thefocal length and offset parameters of the thermal camera, the thermalimages were synchronized with the trajectory of aerial frames,previously revised in the project coordinate system. As a result, theinitial values of thermal elements of interior orientation frame werecalculated for the calibration object. Using the previously createdorthophoto 1:1000 scale, the calibration facility value of the thermalinterior orientation and lens distortion was calculated.During the next stage of processing the triangulation process wasperformed. To do this, at least five tie points on each image wererecruited online in the areas of overlapping of thermal images. Usingorthophoto, 1:1000 scale reference points were identified andchipped in the areas of longitudinal and transverse overlap. Elementsof interior orientation of thermal images were obtained as a resultof improved values. Thermalimages were made using calculatedelements of exterior andinterior orientation and theorthotransformation of theseimages on the resulting DTMpoints of classified laser reflectionswas completed. As a resultof this transformation, thermaldigital orthophotos with a GSD1.0 m in the project coordinatesystem were received.Control of the received thermalorthophoto was conducted asLatest News? Visit www.geoinformatics.com January/February 201315
A r t i c l ethe final step. For this purpose additionalnoticeable points (no less than 1 point per10 images) were identified on visible rangeorthophotos and were used as checkpoints.RMS error of resulting discrepancies wasapproximately 1m while maximum errorwas about 3 meters.ConclusionsWe may draw the following conclusionsfrom the above-described:• The FLIR SC7700 thermal camera optimallyintegrates with the Riegl LMS-Q680iALS and DigiCam 60Mp digital photographiccamera.• The FLIR SC7700 can be involved in carryingout the aerial survey without additionalinstallation labour costs and financialinvestments.• The thermal imagery obtained with a FLIRSC7700 camera can be processed viausual photogrammetric methods (centralprojection).• When combining aerial photography orairborne laser scanning with thermal surveyingthe internal thermal camera orientationvalues and geometrical parameterAirborne survey methods (Laser Scanning, Aero photography, Thermal imaging)of the lens can be calculated with a sufficientaccuracy.• The accuracy of thermal orthophoto is suitablefor further analysis at this locationusing large scales.• Unlike thermal camera video footage, theuse of geo-referenced data opens up newpossibilities for accomplishing a widerange of tasks (simultaneous interpretationand positioning of objects, vectorization,downloads and interactive use of the datain the GIS).Natalia Kovach, Head of Geoinformation Technology DivisionNIPIStroyTEK, LLC, Research, Development and Design Institute forConstruction and Operation of Fuel and Energy Sector Enterprises
A r t i c l eAR In a Geospatial ContextAugmented Reality MarkupAugmented Reality (AR), overlaying the real world around a user with computer-generated information,has been a topic of great popular interest over the past few years. To ensure that users will havethe choice of platforms and applications they wish to use for AR, and to also ensure publishers of contentthat they will be able to reach large target AR-enabled user audiences, standards are necessary.An example is ARML (Augmented Reality Markup Language) 2.0, which has recently been developedwithin the Open Geospatial Consortium (OGC).By Martin LechnerIntroductionAs the AR industry grew significantly from theend of the past decade, various mobile ARapplications have been developed. The twotypes of AR most commonly found today are:• Geospatial AR, meaning that georeferencedinformation about points of interestis projected onto the screen according tothe device’s current location, orientationand field of vision.• Computer Vision-based AR that analyzesthe stream of images from the camera,detects patterns known by the system (suchas colors, edges and other unique featuresof the real world, markers or referenceimages) and projects (superimposes) informationassigned by an AR content publisheronto the pattern.There are currently thousands of bespokeapplications with AR features that permit usersto experience the information about the realworld. The most widely used type of applicationsfor AR are so called AR Browsers. Asopposed to AR applications for a particularuse case, AR Browsers enable developers toaddress a variety of use cases by providinga content management and publishing platform.The feature set of the most popular ARBrowsers is similar, however, the absence ofstandards for data format and programminginterface for publishing AR content has meantthat, for maximum reach, developers mustprepare content and separately publish experiencesthat comply with the proprietary formatsand interfaces of each AR Browser. Thisis precisely the same situation that existedwith Web browsers before the standardizationof HTML.ARML 2.0 – A brief IntroductionARML 2.0 is an OGC standard developed ina joint effort of AR Browser vendors and ARFigure 1: A QR Code(Quick Response Code)is the trademark fora popular type of twodimensionalbarcode.content developers to bridge the gap betweenthe data formats of different AR Browsers andto allow content for AR to be accessible andused by multiple AR Browsers and AR implementations.It is an eXtensible MarkupLanguage (XML) grammar that enables adeveloper to describe virtual objects, theirappearance and their behavior in an ARscene. The standard targets both types of ARdescribed above, and builds upon a genericobject model, ensuring that future versions willbe able to support other types of AR (audiobased,haptic etc.).ARML 2.0’s predecessor, ARML 1.0, is a proprietarydata format developed by the creatorsof the Wikitude World Browser. ARML1.0 concepts served as a starting point forARML 2.0, but ARML 2.0 is not backwardscompatible with ARML 1.0.The real world objects that are observed usinggeospatial methods (GPS and compass) or inthe camera and augmented in the AR sceneare called Features. Features have one orFigure 2: The OGC Logo used as a reference image. As soon as thelogo appears in the camera, it is recognized, tracked and used asAnchor for the Feature.more Anchors that locate them in an AR scene.The following types of Anchors can be usedin ARML 2.0:• (Geo-) spatial Anchors describe the locationof a Feature using fixed coordinatessuch as the WGS84 latitude/longitudecoordinates provided by a GPS. Points,Lines and Polygons are allowed.• Trackables describe the location of aFeature using tracked targets (unique characteristicsof a reference image, a QRcode, marker, <strong>3D</strong> model etc.). As soon asthe referenced Trackable is detected in thevideo stream delivered by the camera, theTrackable becomes the location of theFeature in the AR scene. Two typical examplesof Trackables are shown in Figure 1and Figure 2• RelativeTo Anchors describe locations relativeto other Anchors or Trackables alreadylocated in the AR scene. This allows anentire scene to be constructed based solelyon the location of one particular object.While Anchors describe the location,VisualAssets describe how the Featureappears in the AR scene. ARML 2.0 allowsboth 2D (HTML, Plain Text, Images etc.) and<strong>3D</strong> VisualAssets to represent an object in theAR scene.ARML 2.0 also defines ECMAScript bindingsto interact with objects in the AR scene andreact on user triggered events, such as clicksetc. In the remaining sections of this article,we focus on the geospatial components ofARML 2.0 as well as areas where conceptsof geospatial formats are adopted for usecases other than geospatial.Representing GeospatialInformationWhen we (the OGC ARML StandardsWorking Group) developed ARML 2.0, wehad one clear use case in mind that was com-18January/February 2013
A r t i c l eLanguage 2.0Figure 3: A QR code (10x10 centimeters) on atable top is used to track the table outlinemon to every major AR Browser used. Peoplewanted to augment a particular fixed locationon the earth. Typically, the content developerswould compile or download a long list of georeferencedPoints of Interest (POIs), for exampleall major tourist sights in a city, then uploadthe list via the content management system ofan AR Browser and expect the AR Browser torender a visual representation of these featureson the screen as soon as this particular positionwas in the user’s field of vision. The OGCKML Standard, the standard used in GoogleMaps and Google Earth, appeared to be agood start for this use case, as its major usecase was visualizing points on a map, whichis somewhat similar to the use case we had inmind. During our analysis of this standard,however, we discovered that KML was too tiedto map-based applications and the EarthBrowser use case, and did not allow enoughflexibility to meet the requirements of AR experiences.Luckily, KML uses the geometry modelof the ISO 19107 standard to representgeospatial information, which is the samegeometry model the OGC Geo graphy MarkupLanguage (GML) Encoding Standard uses.GML focusses on describing geometries, ratherthan using them in a certain context. So weanalyzed GML and decided to adopt the GMLgeometry representation.Types of GeometriesThe current version of GML, GML 3.3,describes a wide variety of geometry elements,from 0-dimensional and 1-dimensionalto 2-dimensional, with multiple concrete representationsof those high level geometries.We decided that the high number of geometrieswould be too verbose in an AR context.A typical AR developer is not likely to requirethe complex geometries that are required incomplex Geographic Infor ma tion System(GIS) applications using the latest GMLimprovements. In our analysis of existing ARenabledapplications, every application’sgeospatial use cases required only Points,Lines and Polygons (the major geometry typesin GML 1 and GML 2, as well as KML). Thisresulted in the following geometries being providedin ARML 2.0:• Point: specifies a position by a single coordinatetuple• LineString: is defined by two or more coordinatetuples, with linear interpolationbetween them.• Polygon: a planar object defined by anouter boundary and 0 or more innerboundaries. The boundaries are specifiedusing the exterior and interior elements.The boundaries, in turn, are defined byLinearRings (i.e. closed LineStrings).The default coordinate system used in ARML2.0 is WGS84, as it is by far the most commonlyused coordinate system in AR Browsers.However, if required, other coordinate systemscan be used by specifying the EPSG code orOGC WKT (Well Known Text) to reference thecoordinate system. As indoor location coordinatesystems for AR become established, thisflexibility will be important.In ARML 2.0 terms, the above geometriesdescribe the Anchors that are then augmentedwith VisualAssets. A detailed explanationof VisualAsset types can be found in the ARMLSpecification in the url below.Geometries to describe RelativeLocationsIn ARML 2.0, geometries are not only used todescribe geospatial constructs referenced inan absolute coordinate system; they are alsoused to describe locations relative to otherobjects.In AR, a physical object, like a printed markeror logo, might serve as a trigger to somethinglarger. A printed marker resting on atable, for example, might not just be used toput a virtual object on top of the marker.Instead, it could be used to construct an entirevirtual scene based just on the location of theparticular marker in the real world.Figure 3 shows an example of relative locations.The marker on the table is located in afixed place on the table and is 10 centimeterswide and high. The dimensions of the tableare 1.5 meters long and 85 centimeters wide.The application will track the geometrical centerof the marker (the intersection of the twodiagonals) whenever the marker is visible.Instead of projecting VisualAssets onto themarker, the marker is used to augment theLatest News? Visit www.geoinformatics.com January/February 201319
A r t i c l etable top boundaries for example. To achievethis, a LineString is defined relative to themarker’s center, running all around the tabletop:0.05 -0.05 0 -0.8 -0.05 0 -0.8 1.45 0 0.05 1.45 0 0.05 -0.050The coordinates are specified in meters, withrespect to the coordinate system defined bythe marker. The origin of the coordinate systemis the center of the marker, the x-axis ispointing right, the y-axis is pointing towardsthe top of the marker and the z-axis is pointingup (out of the marker).The LineString starts at the bottom right cornerof the marker (0.05 meters to the right, 0.05centimeters towards the bottom and 0 metersabove the marker’s center), continues to thebottom left corner (0.8 meters left of the marker’scenter), top left, top right and finally backto the bottom right corner.In the same way, the marker could be used toplace virtual objects on and even beyond thetable. For example, to reference the center ofthe table, the following snippet can be used:-0.375 0.7 0In this way, an entire scene with multipleobjects can be constructed by using just onemarker that serves as a referent for many relativelocations.OutlookARML 2.0 is currently an OGC CandidateStandard. After comments received during thepublic comment phase, concluded December2 2012, have been addressed, the OGCmembership will vote to determine the adoptionof the standard as an official OGC standard.Both Wikitude and the Georgia Instituteof Technology, the vendors of two ARBrowsers, the Wikitude World Browser andthe Argon Browser, played a vital role in thespecification phase of ARML 2.0, whichensures that the standard will be adopted intheir applications. Others are expected to followsoon thereafter.Building on existing OGC standards, however,has provided ARML 2.0 with somethingmuch more important than rapid developmentand multiple early implementations:Scalability. OGC standards span the full spectrumof geospatial technologies and applicationdomains, a scope that includes everythingfrom sensor webs, text message encoded location,aviation information systems, and hydrologyto GIS and Earth imaging. In addition,OGC standards are widely deployed throughoutthe global geospatial technology industry.This means that AR applications will be ableto link easily to existing National Spatial DataInfrastructures, customer databases, crowdsourcedstreet databases, cloud-based geoprocessingservices and hundreds of otherresources. ARML 2.0 is positioned to be thekey infrastructure element in the next, veryexciting, phase of AR growth.Martin Lechner, Chief Technology Officer, Wikitude and Chair,ARML 2.0 Standards Working Group.For more information, have a look at:www.opengeospatial.org/projects/groups/arml2.0swg
A r t i c l eData Collecting using iPad and iPhoneRevisiting the North CarolinaThis article examines the post-industrial landscape of Rutherford County, North Carolina, primarilythrough artefacts connected to the Gold Rush of 1804 - 1828. Data was collected using an iPad, iPhone,Hedcam and DSLR camera. The examples outlined were captured with the Third Industrial Revolutionin mind (see GeoInformatics 7, Vol. 15: pp 32-34).By Adam P. Spring360º panorama of the mine entrance produced in poor light using an iPhone and the free Photosynth app.Rutherford County and RutherfordtonAmerica’s first Gold Rush occurred in North Carolina following thediscovery of a 17 pound nugget near Charlotte in 1799. From thatpoint, the Old North State remained at the centre of US gold productionup to the start of the mining boom in California in 1849(see GeoInformatics 8, Vol. 13: pp 28 - 30). Rutherford County andCharlotte became the main areas where mining took place throughoutthis period - to the extent that evidence of stream panning andhard rock mining still show up as cultural and material artefacts onthe landscape. The town of Rutherfordton even monumentalised thisperiod of its history through the Bechtler Museum and Bechtler Mine,places that are maintained in order to pay homage to the maker ofthe first US $1 gold coin.Quality assuranceA jeweller and clock maker born in Germany, Christopher Bechtlermoved to North Carolina in 1830 from Philadelphia. He immediatelyopened the Bechtler Private Mint in 1831 and capitalised on theneed for a gold standard in a region where gold was in plentifulsupply. Bechtler coins soon became the currency used for commercein North Carolina, with regular inspections from the US Governmentin Philadelphia ensuring that Bechtler himself maintained this standardtoo. After a Government Mint opened in Charlotte (1835) theprivate mint eventually closed in 1850, though its demise still cameafter Bechtler himself died from suspected mercury poisoning in1841. A Bechtler $1 coin is currently worth $3000. The pistol discussedlater in this article has been valued at $50,000.The Bechtler Pistol was reproduced from 32 images.Digital care in the communityThe workflow adopted over a four day period focused on publicengagement. A series of presentations were given outlining previousmid-range TLS, photogrammetric and image based examples. Theseacted as a visual means through which basic principle of capturecould be taught, low cost ways of obtaining <strong>3D</strong> information withconsumer products introduced and concepts promoting data retrievalin the long term instilled. Though ideas pertaining to multidimensionality,Empirical Provenance and modes of production were included,everyday examples were used to translate them to a generalaudience.22January/February 2013
A r t i c l eGold RushIf a glossy black is included to track theequidistance light source, raking light canshow so much more.was looking for. In this case, a Polynomial Texture Map (PTM) wasproduced to additionally highlight key surface information.The first $1 gold coin produced in the US is now worth $3000 per coin.Translated examplesSpindale Family Medical Practice and Biscuit the dog were used asthe translated examples. The first provided a real world scenario forconducting a basic building survey with an iPad equipped withHunter Theodolite Pro - in part this was aided by damage to thefacade caused by Hurricane Sandy. Hedcam equipped Biscuit, onthe other hand, happily demonstrated how digital workflows arechallenging notions of perspective. Though the latter exercise addeda cuddly dimension to teaching, Hedcam creator, Carl Long, subsequentlypointed out the compact and durable HD camera is beingused on security dogs as part of surveillance strategies. The Spindalecomponent of the fieldwork informed the 360º panoramas andGNSS mapping work carried out at the Bechtler Mine - a rareinstance of workings being close enough to the surface to actuallyget a GPS signal.Digital prospection exerciseAll Bechtler artefacts were documented using a camera based workflow.Hardware included an iPhone, iPad, Canon 60D DSLR cameraand an imaging rig that comprised of patio furniture, a surgicallamp, snooker ball and a $30 dollar tripod. Software was a mix ofopen source and proprietary programs that included Photosynth,PTGui, 12<strong>3D</strong>Catch, Adam Technology <strong>3D</strong>M Analyst Suite, RTIBuilderand RTIViewer. Data capture was focused around the production of360º panoramas, <strong>3D</strong> Imaging through photogrammetry and the collectionof surface reflectance information.Bechtler PistolThe Bechtler Pistol was reproduced with rapid prototyping in mind.Normally under lock and key in a bank vault, the $50,000 artefactnow provides a rare physical insight into what the Bechtler familydid after the private mint closed. Currently under the guardianshipof North Carolina historian, Robin Lattimore, previous attempts atreproducing the pistol included a suggested trip to China, a processthat would have involved it being disassembled, copied, reassembledand sent back. A <strong>3D</strong> replica based off the point cloud andmesh generated will now act as the affordable solution the museumInteractive relightingTom Malzbender and Dan Gelb of HP Vista Labs had refined thePTM process by 2001. Originally developed as an extension to texturemapping in computer graphic led processes like <strong>3D</strong> video gaming,the technique is now used in animations produced by studioslike Pixar. Developed by Disney Pixar’s Ed Catmull in the 1970s,texture maps contain colour information collected independently oflighting, so often, when relighting texture maps, the results are notconvincing. A PTM denotes colour and intensity changes on a surfaceas a function of lighting direction.Application and camera calibrationAlong with the reflective properties of a surface, Polynomial TextureMaps require the light conditions of the surrounding environment tobe considered. Application includes a camera left in a fixed position(this includes fixed focus of the camera lens), as well as multipleimage captures with a moving, even domed distribution of light usingan external light source. Both are crucial to producing good results.It is important to calibrate the camera’s light settings to be totallydependent on the external light source - minimising the amount ofdiffuse or scattered light taken in a photo. In addition to creating amean light value for the PTM, reduction of scattered light allows forspecular or refined light to be extracted, thus giving an additionalsurface value that is mirror perfect, enhancing features not visible tothe human eye.SummaryThe use of consumer based products was vital to the data captureprocess. It allowed extra work to be achieved in a small window oftime and taught the Rutherfordton community how to think abouttheir surroundings digitally. They ended up being able to considerheritage as part of digital geodetic processes. Smart technologiesare reaching a stage where they can be used for applications wherethe parameters of use are more rigidly defined. Results were generatedthat will be used to enhance and support future work.Links:http://video.unctv.org/program/gold-fever-and-bechtler-mintwww.hedcamz.comhttp://photosynth.netwww.ptgui.comwww.adamtech.com.auhttp://culturalheritageimaging.org/What_We_Offer/DownloadsLatest News? Visit www.geoinformatics.com January/February 201323
A r t i c l eWhat to use…GNSS UpdateAfter years of delay it is finally happening; the start of the operational phase of Galileo. On October 12thanother two Galileo In Orbit Validation satellites were successfully launched from Kourou (French Guyana).In December they were declared operational. These two satellites are transmitting on the E1, E5 and E6signals. The E1 (open) signal is, however, different from the previous In Orbit Validation satellites.By Huibert-Jan LekkerkerkLaunch of two Galileo IOV satellites (source: www.esa.int)RV Belgica used for Egnos and Galileo testing (source: www.esa.int)With this launch, users can start testingtheir Galileo receivers, eventhough it will be for just a few shortmoments when all four are in view. This meansthat users are still a long way from using Galileoon a daily basis. With three dual launchesplanned for 2013, plus two dual launches andone four-satellite launch for 2014, a minimumof 18 satellites could be feasible by 2014.Whether this is realistic remains to be seen. AnEC official has already stated that operationalcapability is considering having 12 satellites forthe civil Open Service in 2014 (over Europe).CompassAnother two BeiDou-2 / Compass satellites werelaunched on September 18th. This brings thetotal number of satellites to 11; only three shy ofregional operations. This should be good newsfor Chinese GNSS users. Western users willmost likely start to profit from Compass at a laterdate. They will probably have to buy Chineseequipment to make full use of Compass as, todate, no complete Interface Control Document(ICD) has been made public outside China. Thismakes it difficult for system developers outsideof China to create fully compatible devices.In 2007 researchers from Stanford Universityreverse engineered the Compass signals andpublished their results. On December 27th 2011Galileo IOV satellites on theAriane rocket (source:a ‘Test Version’ of theICD was released bythe Chinese Govern -ment giving very little further information thanthat which was already available. EarlyDecember there was an unofficial rumour statingthat the document would be released beforethe end of December 2012. At the time of goingto press the ICD had still not been released.All in all the Chinese government has not beenvery forthcoming with information regardingCompass. The only result seen to date is the disputebetween the EU and China over the use ofthe frequency spectrum. The dispute was supposedlydiscussed during a broad EU-Chinasummit in September and then discussed againin December 2012. To date there is no furtherinformation on the outcome of that discussion.GPSOn October 4th the third IIF satellite waslaunched. All the satellite’s frequencies wereswitched on a week later. The satellite itself wasset to ‘unhealthy’ until it reached its final slot (1of Plane A) on December 5th. The launch of thissatellite means that a third satellite with the newcivilian L5 signal is available. For full use, however,a minimum of four satellites will be requiredat any one time. Based on the current launchrate (3 satellites in 2 years), this situation willprobably not be realized for a fewyears.The third GPS generation (GPS III) isonce again one (small) step closerwith the completion of the vacuumtesting for the navigation payload ofthe so-called Non-Flight SatelliteTestbed (GNST). Although the namesounds impressive, this is still just aprototype that will never see the(near) vacuum of outer space.Augmentation SystemsOn December 13th the second Russian SBASsatellite (Luchs-5B) arrived at its geostationaryposition. The satellite is part of the RussianSystem for Differential Correction andMonitoring (SDCM) which sends corrections forGPS measurements in a similar fashion toWAAS for the USA and EGNOS for Europe.These SBAS systems are primarily developedfor the safety of aircraft navigation but are alsoused, for example, for car navigation. Shippinghas, to date, used dedicated beacons in theMedium Frequency (MF) band set up near harbours.These so-called IALA beacons requiretheir own maintenance. Earlier this year a testwith the Belgian research vessel ‘Belgica’ wasperformed to examine the usability of EGNOSfor vessel navigation. In addition to EGNOSsignals, the use of Galileo signals was also tested.During the tests the effect of multi-path, fromboth the sea as well as from harbour structuresand radar systems, was researched.Huibert-Jan Lekkerkerk hlekkerkerk@geoinformatics.com is a freelancewriter and trainer in the fields of positioning and hydrography.Latest News? Visit www.geoinformatics.com25January/February 2013
A r t i c l eWith Particular Reference to the U.K.Commercial Operation of LightweightOver the last few years, the commercial operation of lightweight UAVs has become firmly establishedin the U.K. This article first outlines the regulatory and operational environment that has allowed thisdevelopment to take place. It then goes on to describe the different types of platform and camera thatare being used in the U.K. for a variety of imaging and mapping tasks based on the use of aerialphotography acquired by UAVs. After a discussion of the various photogrammetric approaches thathave been implemented to handle and process this type of photography in the U.K., the articleconcludes with a description of the imaging and mapping activities that are currently being under -taken by a representative group of UAV service providers in the U.K..By Gordon PetrieFig. 1 – A Schiebel Camcopter UAV fitted with a belly pod containing a RIEGL VQ-820-GU bathymetriclaser scanning system. (Source: RIEGL)I – IntroductionIt has been very interesting to observe the large number of paperson imaging and mapping from unmanned aerial vehicle (UAV) platformsthat have been published recently in conference proceedingsand academic journals. For many academic researchers, it is currentlyregarded as a “hot” topic. However, in the opinion of the presentauthor, what appears to be missing from many of these publicationsand presentations is any reference to the existing routinecommercial operation of UAVs for aerial imaging and mapping,Which is all the more unusual, given that there has been a very substantialactivity in this field for quite a number of years in several ofthe more highly developed countries in Europe.Fig. 2 – A SwissDrones Waran TC-1235 UAV fitted with a Leica Geosystems RCD30 medium-format digitalcamera system. (Source: Leica Geosystems)By contrast with the situation in the U.S.A. - where there has beenuntil now an almost complete embargo by the Federal AviationAuthority (FAA) on authorizing commercial UAV flights – the situationin certain European countries is rather different, with a substantialcooperation between (i) the constructors and commercialoperators of UAVs on the one hand; and (ii) the appropriate civilaviation regulatory authorities that are responsible for the civilianuse of airspace. This has resulted in the formation of policies andthe development of regulations that permit the commercial operationof UAVs for the acquisition of aerial photography, albeit under astrictly controlled regime. These regulations vary somewhat betweenthe different European countries. This article limits itself to consideringthe situation within the U.K. in the context of lightweight (under7 kg) non-military UAVs. The precise definition of “lightweight” willof course differ from one country to another; current European proposalsare to define it as being under 5 kg.II – Operational EnvironmentThe overall policy of the U.K.’s Civil Aviation Authority(CAA) governing the operation of lightweight UAVs is set outin a paper by Haddon and Whittaker which can bedownloaded from the Internet using the following URL –www.caa.co.uk/docs/1995/srg_str_00002-01-180604.pdf. A furtherdocument entitled “Unmanned Aircraft SystemOperations in UK Airspace” [CAP 722] provides generalguidance to the certification and operation of UAVs in the UK’sairspace. This document is available at www.caa.co.uk/docs/33/CAP722.pdf(a) Regulation of UAV FlightsWithin the U.K., the detailed regulation of flights by lightweight UAVsthat are being undertaken for commercial aerial photography and theactual permission to fly is given by the Civil Aviation Authority(CAA) in Articles 166(5) and 167(1) of the UK’s Air NavigationOrder [CAP 393] that was published in 2009. These set out in detailthe specific conditions under which these flights can be made. In verybroad terms, permission for flights is granted subject to the UAV notbeing flown (i) at altitudes greater than 400 feet (120 m) above groundlevel; (ii) beyond a maximum range of 500 m or out of visual range;and (iii) over or within 150m of an organised open-air assembly ofmore than 1,000 people. (iv) Besides which, the UAV must not beflown over or within 50m of any person not having knowledge of ornot having been warned of the UAV flight. This is reduced to 30m forthe take-off and landing of the aircraft. (v) Needless to say, no opera-28January/February 2013
A r t i c l eUAVs for Aerial Imaging & MappingFig. 4 – The SmartOne flying-wingUAV. (Source: SmartPlanes)tor is allowed to fly a UAV in various restricted areas without havingfirst obtained permission from the CAA. (vi) Furthermore UAV flightsover congested (e.g. urban) areas are very highly restricted and alsorequire prior permission to be obtained from the CAA. The full text ofthe Air Navigation Order [CAP 393} is available from the CAA Website using the following URL – www.caa.co.uk/docs/33/CAP393.pdf.The specific Articles 166 and 167 that apply to small unmanned aircraftare contained on pages 5 and 6 of Section 1, Part 22 of thisextensive (480 page) document.(b) UAV AirworthinessWithin the U.K., the “Light UAS Scheme” (LUASS) – where UASis an acronym for Unmanned Aerial Systems – covers (i) the design,construction (including the functionality of embedded FCS software),airworthiness and operation of UAVs; (ii) pilot/crew qualifications;and (iii) an exemption or permission to operate a UAV in the UK’sairspace. For detailed information, copies of the LUASS Guide canbe downloaded from the Web site of the European UnmannedSystems Centre (EuroUSC) – which is the organisation that isauthorized by the CAA to issue “Design & Construction Certificates(of Airworthiness)” for those lightweight UAVs that are being flownFig. 3 – The swinglet CAM flying-wing UAV, together with its carrying case and the laptop computer that isused to control the flight operations of the UAV and to process the acquired data. (Source: senseFly)in the U.K. and in those territories that fall under the remit of theU.K.’s CAA. See the following document that is available via theInternet - http://eurousc.com/documents/LUASS_Brochure_2010_web_lck.pdf.(c) Pilot & Crew QualificationsThe EuroUSC organisation also manages and offers courses andexaminations for the award of the generic Basic National UASCertificate (BNUC), which is the CAA’s approved Pilot/CrewQualification for operating lightweight UAVs. There are two levelsof this certificate. (i) The BNUC-S (Level 1), which was introducedin April 2010, is aimed at the operation of lightweight UAV aircraftbelow 20 kg. (ii) The BNUC (Level 2), which was introduced in2008, is aimed at the operation of larger UAVs between 20 and150 kg in weight. In practice, if a commercial operator of UAVs islooking for insurance then, almost certainly, there will be the prerequisitesof (i) obtaining a permit to fly; then (ii) ensuring that theUAV aircraft has been certified; and (iii) that a pilot with the appropriateBNUC qualification is being employed to fly the aircraft.(d) Commercial Operators of UAVsNotwithstanding the various regulatory requirements and restrictionsthat have been outlined above, numerous commercial operators oflightweight powered UAVs are already offering aerial photographicand imaging services in the U.K. These can conveniently be dividedinto (i) those operating fixed-wing UAVs; and (ii) those utilizingrotary-wing UAVs. There are at least 19 companies in the U.K.operating commercial airborne imaging services using fixed-wingUAVs and more than 50 companies operating rotary-wing (mini-helicopter)UAVs. Links to the Web sites of all of these individual U.K.companies are given within my Web Links Database –<strong>Geoinformatics</strong>. Please see the links that are given within theappropriate categories – (i) www.weblinks.spakka.net/db/100for the fixed-wing UAV operators; and (ii) www.weblinks.spakka.net/db/127 for the rotary-wing UAV operators. Of course, there maywell be still more companies that are operating UAVs on a commercialbasis in the U.K. that are not known to the present author.III – UAV PlatformsIn very broad terms, and leaving aside powered airships, blimpsand parafoils and un-powered tethered kites and balloons then, asLatest News? Visit www.geoinformatics.com January/February 201329
A r t i c l e[a][b]Fig. 5 – (a) An early model in the series of Quest Manta 300 UAV flying wing aircraft with the fins (vertical control surfaces) mounted part-way along the wings.(b) A production batch of the later models of the Quest UAVaircraft with the elevons mounted at the wing tips. Nigel King, the head of QuestUAV Ltd., is the person in the white shirt at the far right of this photo. (Source: QuestUAV).noted above, powered UAV platforms based on airframes can besub-divided into two main categories – (a) fixed-wing; and (b) rotarywing.(a) Fixed-Wing PlatformsFixed-wing UAVs are very familiar from media reports on thevaried activities of large military drones such as the Predator andGlobal Hawk that are equipped with powerful engines. However,very lightweight UAVs lie at the other end of the UAV spectrum interms of their size and power. Viewing them purely from the mappingstandpoint, electrically-powered fixed-wing UAVs are the typethat is of most interest. They provide reasonably stable platformsand modern examples are relatively easy to control during theautonomous flights that need to be undertaken to cover the terrainin a systematic manner for mapping purposes. However they doneed to fly forward continuously in order to generate enough lift totake off and to remain in flight and they need space in which to turnand to land.(b) Rotary-wing PlatformsBy contrast, rotary-wing aircraft are much less stable and areoften more difficult to control during flight. However they can hoverover a fixed position and at a given height and they can fly vertically– which is essential in certain types of monitoring activity and inthe acquisition of panoramic photographic coverage of an areaaround a given position. Furthermore they can take-off and land ina very small space and at a very specific location. Indeed a numberof UAV systems using rotary-wing aircraft have been developedspecifically for mapping purposes by partnerships comprising anaircraft manufacturer and a mapping systems supplier.An example is the Schiebel Camcopter S-100 UAV with its rotaryengine, which has been equipped witha RIEGL CP-820-GU bathymetric laserscanner [Fig. 1] and (quite separately)with the Quest Innovations Condor-1000 MS5 multi-spectral camera.Another example is the AeroscoutScout B1-100 UAV using an aircooledgasoline engine which hasbeen fitted with a RIEGL LMS-Q160laser scanner. Still another example isthe SwissDrones Waran TC-1235UAV with its twin boxer motor, whichhas been equipped with a LeicaFig. 6 – An example of the MAVinci Sirius UAV. (Source: Grupoacre)Geosystems RCD30 medium-format digital camera [Fig. 2].However, these are comparatively large UAVs driven by mechanicalmotors, which, together with their sensors, weigh 130 kg (Schiebel),60 kg (Aeroscout) and 50 kg (SwissDrones) respectively. Thus theydo not fall into the very lightweight category that is being discussedhere. Furthermore, in terms of cost, they also fall into a quite differentcategory as compared with the lightweight UAVs and systemsthat are being covered in this article. None of these much largersystems are in current commercial operation within the U.K.IIIA – Lightweight Fixed-Wing UAVsWith regard to those fixed-wing aircraft that do fall into the class oflightweight UAVs, there are essentially two main types of airframeto be considered – (a) those with a flying wing design with notail; and (b) those with a more conventional design comprising afuselage, wings, a fin and a tail plane, similar to that of a conventionalcommercial aircraft, but hugely scaled-down in size.(a) Flying Wing DesignsThis type of UAV aircraft has come into fairly widespread use forcommercial airborne imaging and mapping within Europe in theform of the Trimble Gatewing X100 (from Belgium); the senseFlyswinglet CAM (from Switzerland) [Fig. 3]; and the SmartPlanesSmartOne (from Sweden) [Fig. 4]. Each of these electrically-poweredaircraft features a flying wing with a very small fin (or evelon)at each end of the wing. The wing spans of these three examplesare 80 cm (swinglet CAM); 1 m (Gatewing X100); and 1.2 m(SmartOne) respectively. [N.B. The senseFly company announced atIntergeo 2012 that it will introduce its new eBee flying-wing UAVwith a 1m wing span at the beginning of 2013.]. Examples of allthree of these flying wing aircraft are in operation in the U.K. Theyinclude several examples of the senseFly swinglet CAM. These arebeing used in the commercial mappingoperations that are being carried outby Bluesky International Ltd.; TheGeoinformation Group; McKenzieGeospatial Surveys; Digital Mapping& Survey; exeGesIS Spatial DataManagement Ltd.; Six-West Ltd.;Walker Ellis Associates; and the largeCostain engineering and constructioncompany – as well as the presentauthor’s own University department!A short minimal fuselage is incorporatedinto the wings of all of these vari-30January/February 2013
A r t i c l eFig. 9 – Very tall telescopic masts (up to 100 ft[30 m] in height) equipped with pan-and-tiltcameras can be mounted on a trailer that, in thiscase, is being towed by a four-wheel drive vehicle.(Source: Cloud 9 Photography)Fig. 7 – A LLEO Maja UAV that has been fitted with visible & IR cameras. (Source: G2way)ous flying wing aircraft in order to accommodate the electric motor,battery, camera, radio link and GPS/IMU and/or autopilot unit. Allthree of those flying-wing aircraft mentioned above use electro-motorsdriving a pusher propeller for their forward flight. However the payloadsof these three UAVs are relatively limited. In order to carry anincreased payload such as a second camera, some of the UAV operatorsin the U.K. have designed and built their own flying wing UAVaircraft. Examples are the Quest 100, 200 and 300 UAV aircraft[Fig. 5] that have been constructed by QuestUAV Ltd. with wingspans of 1.5 m and 2.1 m. Another example is the G2 UAV aircraftof Callen-Lenz [Fig. 24 (a)] with a wing span of 2.0 m and a payloadof 2 kg. In this respect, these aircraft are considerably largerin size than the designs from the three non-U.K. European suppliersmentioned above. So far, the Quest flying wing aircraft have mainlybeen purchased by various universities and research agencies, bothin the U.K. (including Northumbria, Newcastle, Leeds, Exeter andStirling Universities) and in Europe (in Austria and Finland). TheCallen-Lenz G2 aircraft have been used mainly to carry out in-houseprojects.(b) Conventional Fuselage DesignsThree representative examples of this alternative type of fixed-wingdesign that are being used for airborne imaging and mapping inEurope are the MAVinci Sirius (from Germany); the TriggerComposites Pteryx (from Poland); and the CropCam UAV (fromCanada) with wing spans of 1.6 m; 2.8 m and 2.4 m respectivelyand fuselage lengths of 1.2 m, 1.4 m and 1.2 m respectively. TheCropCam aircraft is essentially a powered version of a modelFig. 8 – A Mikado Logo 600SE single-rotor UAV with its Photoship One three-axes stabilized camera mountthat is being operated by sUAVe Aerial Photographers. (Source: Jed Servo)sailplane. However, there areonly a very few examples ofthese aircraft that are operationalin the U.K. Those that areknown to the present writerinclude a single MAVinci Siriusaircraft [Fig. 6] and a singleCropCam. However, again various other similar aircraft have beenproduced in-house by service providers in the U.K. An example isthe LLEO Maja UAV [Fig. 7] built by the G2way company, whichis based in Nottingham in the East Midlands of England. Again themotivation for this development is to be able to carry a greater payloadsuch as the multiple cameras that are required for multi-spectralphotography.III B – Lightweight Rotary-Wing UAVsThere are a large number of lightweight rotary-wing UAVs in use inthe U.K. (a) Quite a number of these are of the single-rotor type,similar to, but heavily scaled-down models of conventional helicopters.In this account, they will be grouped together with thosehaving coaxial-rotors featuring two contra-rotating rotors that aremounted one above the other on the same axis. (b) However manyof those rotary-wing UAVs that are being used in the area of imagingand mapping in the U.K. are of the multi-rotor helicopter typefeaturing three or more rotors mounted on separate axes.(a) Single-Rotor & Coaxial-Rotor UAVsIn general terms, at least within the U.K, these types of UAV are invery widespread use, but mostly for aerobatics and other recreationalactivities, flown by radio-controlled model helicopter hobbyists.However a number are in use for the acquisition of aerial photography.Those single-rotor helicopter UAVs that appear to get most usein the airborne imaging area within the U.K. are the Joker modelsthat are manufactured by the German Minicopter company andvarious models from Mikado [Fig. 8] and Vario, also based inGermany. There are further examples of the single-rotor UAVs thathave been built by Align-Trex in Hong Kong, Taiwan and Chinaand are being used for airborne digital data acquisition in the U.K.Almost all of these lightweight single-rotor UAV aircraft are poweredby electric motors. However one or two are powered by petrolengines. Usually these are being employed to carry the heavierequipment required for professional filming operations rather thanthe digital cameras that are being used to acquire the “still” frameimages required for mapping purposes.The majority of the single-rotor UAVs that are being utilized for theacquisition of oblique and panoramic aerial photography in the U.K.are doing so for publicity, marketing & public relation purposes; forcoverage of sports events; and for use by estate and commercialproperty agents and by building contractors (to assess progress oncontracts). For these applications, the hovering capability of the helicopteris really useful. However it is interesting to note that a numberof the companies in the U.K. that are engaged in this type ofactivity with their UAVs also operate ground-based pole camerasequipped with telescopic masts that are mounted on vehicles, trail-Latest News? Visit www.geoinformatics.com January/February 201331
A r t i c l eFig. 12 – A Canon IXUScamera mounted on aswinglet CAM UAV – thesilver box at the nose ofthe aircraft is the lithiumpolymer battery.(Source: senseFly)Fig. 10 – An Ascending Technologies Falcon-8 multi-rotor UAV equipped with a Panasonic Lumix camera.(Source: Cyberhawk Innovations)ers [Fig. 9] or tripods for use in those areas where the use of UAVsis either forbidden or impractical. There are over 100 commercialoperators of pole cameras in the U.K. Only a certain relatively smallnumber of these operate both a UAV and a pole camera.(b) Multi-Rotor Helicopter UAVsBy contrast with the single-rotor type, a multi-rotor mini-helicopterUAV requires no cyclic or collective pitch control. Thus it can havesimpler control mechanisms and it supplements these with the additionalelectronic stability augmentation components that are requiredfor stable flight. The aircraft will still be highly manoeuvrable withthe potential to hover and to take off, fly, and land in small areas.Because of these characteristics and their capability to accommodateheavier payloads, multi-rotor UAVs are being used ever morewidely by commercial companies in the U.K. for imaging purposes.Nevertheless many of them are still being used mainly to acquireoblique aerial photos for pictorial purposes – again for use by realestate and property marketing companies and for environmentalmonitoring purposes – but also for infrastructure, industrial or buildinginspection, rather than mapping applications. However thereare a small number that are equipped with GPS/IMU sub-systemsand suitable autopilots that are capable of autonomous flights in thegrid pattern that is required to cover the ground in a systematic mannerso that the resulting aerial photography can be used for mappingapplications.The commonly used examples of those multi-rotor UAVs that arebeing used in the imaging and mapping field in the U.K. again comemainly from German suppliers – from the Aibotix, AirRobot,Ascending Technologies; HiSystems (MikroKopter) andMicrodrones companies. For example, Microdrones MD4 (fourrotor)UAVs are in use by the Bonnington Aerial Surveys, MW PowerSystems, Skydrones and Skylens companies. The larger Falcon-8octocopter [Fig. 10] from Ascending Technologies is in use by theCyberhawk Innovations, Flying Scotscam and Skylens companies.Also the Draganfly company from Canada and the DJIInnovations and XAircraft companies from Hong Kong andSouth China have supplied multi-rotor (six- and eight-rotor) UAVs tovarious operating companies here in the U.K. So has theDroidworx company from New Zealand – though this supply oftentakes the form of the main airframe, the stabilized camera mountand the booms that support the electric motors and rotors: the aircraftelectronics appear to come mainly from MikroKopter [Fig. 11].Yet another supplier is Freefly Systems from the U.S.A. with itsCinestar-8 UAV. Within this overall class of lightweight UAVs that isthe subject of this article, quite a number of these eight-rotor UAVsare often classified as being “heavy-lift” UAVs – meaning that theycan carry payloads of 2.5 to 4 kg, rather than the 1 to 1.5 kg whichis typical of the four-rotor models!IV – CamerasThere are very many issues regarding the digital frame camerasthat can be deployed on lightweight UAVs. They include (i)those of the camera weight relative to the available UAV payload;(ii) the very small formats of the camera images; (iii) the numerousnon-metric characteristics of the cameras; (iv) the need for very shortexposure times to help combat the effects of platform instability; and(v) the requirements for high framing rates arising from the speed ofthe UAV platform over the ground from a very low altitude and thevery large longitudinal and lateral overlaps that need to be employedfor mapping purposes; etc. So much so, that a complete paper couldbe devoted to addressing these issues. However, sticking to the subjectof this article that is concerned with commercial usage of UAVswithin the U.K., the cameras that are currently in use range fromlightweight consumer models (weighing as little as 150 grams andFig. 11 – A Droidworx octocopter UAV equipped with a gyro-stabilized camera mount and camera.(Source: Flying Eye UK)Fig. 13 – A Canon EOS 5D camera mounted underneath a rotary-wing UAV (Source: Eyera)32January/February 2013
A r t i c l eStarting with the consumer-level cameras, in the case of thosethat are in use in the fixed-wing UAV aircraft mentioned above,both the swinglet Cam and Smart One flying-wing aircraft utilizecertain models in the Canon IXUS range as standard [Fig. 12]. Theyare equipped with lenses having a focal length of circa f = 25mmand generate colour images that are 10 to 12 Megapixels in size.The Gatewing X-100 utilizes the Ricoh GRD IV compact camerawhich has a quite similar specification. In the case of many of thelightweight rotary-wing UAVs that are operational in the U.K,the GoPro Hero 2 camera with its 12 Megapixel format is inwidespread use, as are various models in the Panasonic Lumixrange, again generating images with similar (10 to 12 Megapixel)format sizes. Going to the other end of the price and weight scale,the most commonly used professional-level camera on UAVs inthe U.K. appears to be the Canon EOS 5D [Fig. 13] in its variousMk I (12 Megapixel), Mk II (21.1 Megapixel) and Mk III (22.3Megapixel) forms. Examples of these are in use with the Arc-Video;Flying Fern Films; Flying Video/ Skylens; Helicam Media; High Spy;Horizon AP; Microdrones (U.K.); sUAVe Aerial Photographers andUpper Cut Productions companies. Some other users employ theSony NEX-7 (with its 24.3 Megapixel image). At the intermediate-level,the Canon EOS 7D and 550D models and the SonyNEX-5N appear to be in fairly widespread use. It goes without sayingthat there are many other similar cameras from other manufacturersthat are being used in smaller numbers.Fig. 14 – A FLIR Tau 320 thermal-IR camera mounted on a Draganflyer X4 UAV.(Source: Draganfly Innovations]costing £200) at the low end of the cost scale to the much moreexpensive (£2,000+), more capable and much heavier professionalsmall-format cameras that are already familiar to the photogrammetricmapping community from their use on manned light aircraft.Besides these standard digital frame cameras that are generatingcolour or false-colour images, consideration needs to be given toother more specialized types of airborne camera. An inhibiting factorin the case of thermal-IR cameras is that, given the embargoon UAVs being operated over urban areas in the U.K., they cannotbe used for urban heat loss surveys. Nevertheless there are a fewoperators of UAV aircraft in the U.K. who are utilizing thermal-IRcameras on other applications. An example is that flown byOvershoot Photos which utilizes a FLIR Tau 320 model mounted ona Draganflyer X4 UAV [Fig. 14] that is generating images that are320 x 256 pixels in size. Similarly there are also a few operatorsof multi-spectral cameras in the U.K. In the case of QuestUAV,the company can operate a twin camera unit on its Quest 300 flying-wingaircraft with both cameras exposing their images simultaneously.The one camera produces a colour RGB image, while theother generates an image in the near-IR (NIR) part of the spectrum.To obtain four-channel data, the separate images from the red, greenand blue channels of the first camera are combined with the imagedata from the near-IR camera. From this data, the NormalizedDifference Vegetation Index (NDVI) values can be derived forthe vegetated areas that are present on the ground. QuestUAV hasalso fitted a Tetracam six-channel Mini-MCA (Multi-Camera Array)multi-spectral camera [Fig. 15 (a)] to one of its Quest 300 UAV aircraft.Other operators have also fitted this camera to their multi-rotorUAVs [Fig. 15 (b)].V – Photogrammetric Data ProcessingIn broad terms, the well-known and well-established digital photogrammetricworkstations (DPWs) from the mainstream photogrammetricsystem suppliers such as the Hexagon group of companies– Leica Geosystems, Intergraph and ERDAS – (with their LPS& ImageStation systems), BAE Systems (with its SOCET GXP product)and Trimble/INPHO are well able to handle the multiple frameimages acquired by UAVs. Within this particular context, and givingthe viewpoint of another of these major system suppliers, it is interestingto note the remarks accompanying the recently introducedversion of the well-established PHOTOMOD DPW software from theRussian Racurs company. In this account, the company has[a][b]Fig. 15 – (a) This Quest 300 flying-wing UAV is shown together with its Tetracam Mini-MCA six-channel multi-spectral camera. (Source: QuestUAV Ltd.)(b) This Tetracam Mini-MCA camera is mounted on a Microdrones MD4-1000 quadcopter UAV. (Source: Microdrones)Latest News? Visit www.geoinformatics.com January/February 201333
A r t i c l eFig. 20 – (a) A Maxi Swift flying-wingUAV that is being operated by FlyingScotscam.(b) An aerial photo of a “Henge” monumentforming a small part of the archaeologicalsite at Forteviot, Scotland that isbeing investigated by the StrathearnEnvirons and Royal Forteviot (SERF)Project of the University of Glasgow.(Source: Flying Scotscam)vice is available either on a subscription basis or on a pay-as-yougobasis. The Pix4D software can handle the data acquired by mostfixed-wing and rotary-wing UAVs. So this service has been utilizedby several of the U.K. commercial operators of UAVs and by variousU.K. universities that are operating UAVs for research mappingpurposes.Another software company that offers a comparable alternative solutionof a processing service or licensed software is the FinnishPIEneering (Parallel Image Engineering) company with itsRapidStation (software) and RapidCluster (service) products. Stillother similar suppliers of alternative software or service products arethe Icaros company based in Israel with the special UAV version ofits IPS3.0 photogrammetric software and DroneMapper based inColorado.Yet another player in this photogrammetric software development isthe Agisoft company, which is based in St.Petersburg, Russia, andis already well known in the area of terrestrial close-range photogrammetry.It has developed its Photoscan software suite whichis available (i) in a standard edition (costing $179); and (ii) a professionaledition (costing $3,499). The standard edition simply generatesthe <strong>3D</strong> point cloud from overlapping photographs and thenforms the <strong>3D</strong> model of the terrain. The professional edition allows thegeneration of the terrain model data in the <strong>3D</strong> coordinate referencesystem using airborne and ground control data and the generationof an orthophoto based on this terrain model data. The suite can alsobe supplemented (i) by the Agisoft StereoScan tool that can beused to create textured perspective <strong>3D</strong> models from stereo imagepairs [Fig. 18]; and (ii) by the so-called Agisoft Lens, which is anautomatic lens calibration software tool that uses an LCD screen as acalibration target. Severalof the U.K. companies thatoperate in the commercialUAV aerial photographic business, including Cyberhawk Innovations;QuestUAV; Sky-Futures; and sUAVe Aerial Photographers, are usersof these Agisoft photogrammetric software products.Yet another approach that has been adopted by some UAV aerialphotographic service providers in the U.K. is to use the open-sourcesoftware and services that are offered by the University ofWashington (Bundler-PMVS); Microsoft (Photosynth); Autodesk (12<strong>3D</strong>Catch); and the University of Louvain (ARC <strong>3D</strong>). These organisationsoffer a Web-based service that allows the user to upload multipleoverlapping photos acquired by the UAV to the cloud-based serversthat are operated by each of these organisations. These servers thenreconstruct a <strong>3D</strong> point cloud or a set of mesh data from the multiplephotos in a highly automated manner and supply the user with a <strong>3D</strong>model, which can then be exported for use in other applications.However the use of such a service means that the users may have toshare their images publicly on the Web – which, as far as U.K. usersare concerned, may not be an acceptable solution, either on commercialor on privacy grounds. Furthermore the procedure may notbe wholly rigorous and may not produce the geometric accuraciesthat are required by the client. Nevertheless, for some other users,the results of using the software and service that are offered are quiteacceptable for visualization purposes. This is especially so in the casewhen, for example, a large object such as an individual building,monument or bridge has been photographed from the UAV from severaldifferent positions and directions, e.g. in an arc or circle aroundthe object [Fig. 19].[a][b]Fig. 21 – (a) A Mikado Logo 600SE single-rotor UAV being operated on the survey of Monmouth Beach forming part of the Jurassic Coast in southern England. (b) An aerial photo of an excavation being conducted overEddisbury Hill Fort. This is an Iron Age monument situated near Delamere in Cheshire that is thought to have been built in the 3rd century BC. (Source: sUAVe Aerial Photographers)Latest News? Visit www.geoinformatics.com January/February 201335
A r t i c l e[a][b]Fig. 22 – (a) This Quest flying-wing UAV is being hand launched.(b) A Digital Elevation Model (DEM) of the area around the Roman Fort at Birdoswald, Cumbria. (Source: QuestUAV)It should also be mentioned that, in some cases, simple imagematching and stitching software is being used by certain U.K.operators to produce UAV image mosaics. Needless to say, the resultingimages might be visually pleasing and “map-like”, but they stillcontain substantial geometric displacements and distortions. Thusthey are not orthophotos. So they will not fit the corresponding mapor GIS data and cannot be used for accurate measurements of position,distance, angle, area or volume. By contrast, all the variousphotogrammetric packages mentioned above have the required geometricbasis and components that allow them to fully rectify the UAVimages into orthophotos and orthomosaics using a digital elevationmodel (DEM) within the rectification process. Thus the resulting productsare free from the geometric displacements caused by tilts andby terrain relief in those areas with elevation variations. If suitableground control points (GCPs) are also utilised in the process, thenvery high accuracy orthophotos and orthomosaics will be generatedfrom the UAV photography – which can then be used in the mostdemanding topographic mapping applications, e.g. in cadastralprojects and those underpinning large engineering projects.VI – Service ProvidersIn this section, the aerial imaging and mapping services that arebeing offered and some of the work that has been undertaken by anumber of representative companies in the U.K. will be outlined.They include both small and large service providers operating quitedifferent types of UAV aircraft and cameras on a great variety ofprojects in different parts of the U.K. Hopefully they form a representativecross-section of the industry as it currently exists in the U.K.(a) Flying ScotscamThis is a small company based in the town of Kirriemuir, near the cityof Dundee, Scotland. It mainly utilizes an Asctec Falcon-8 octocopter,in this case equipped with either Pentax or Panasonic cameras, forits image data acquisition. However the company has also used anexample of the Maxi Swift flying-wing aircraft [Fig. 20 (a)] built byMS Composit in the Czech Republic. Much of the company’s work isconcerned with the surveys associated with archaeological investigations[Fig. 20 (b)] and with surveys of historic buildings and theirassociated historic landscapes that are being executed on behalf ofofficial government agencies (especially Historic Scotland) and localarchaeological societies. Other survey and mapping work is beingcarried out for local government and national environmental agenciesand universities, including the mapping of coastal erosion. Thecompany also carries out basic inspection services for various industrialand infrastructure organisations. Flying Scotscam mainly outsourcesits data processing, making use of the facilities, software (LPS,PhotoModeler) and expertise provided by McCreadie Associates(located near Edinburgh) to produce the orthophotos, DTMs, <strong>3D</strong> perspectiveviews, etc. that are required by its clients.(b) sUAVe Aerial PhtographersThis is another small company that, in this case, is based in Wigan,located near the city of Manchester in north-west England. By contrastwith the other exemplar companies, the sUAVe company operatesa single-rotor UAV. Originally an Align-Trex model (built inTaiwan) was used. However currently the company operates aGerman-built Mikado Logo 600SE model equipped with a Canon[a][b]Fig. 23 – (a) A MAVinci Sirius UAV that is being operated by Cyberhawk Innovations.(b) A contoured orthophoto of the large Five Sisters “bing”, located near Livingston, Scotland, that has been produced fromUAV photography. This huge “bing” contains the waste material from the processing of oil shale that took place in this area during the late 19th and early 20th Centuries. (Source: Cyberhawk Innovations)36January/February 2013
A r t i c l e[a][b]Fig. 24 – (a) A Callen-Lenz G2 flying-wing UAV. (Source:Callen-Lenz)(b) A near-IR (NIR) image showing areas of crop stress in Lady Rosetta potatoes that have been captured by the G2 UAV. (Source: Project Ursula)5D small-format (21 Mpix) camera which is mounted on a stabilizedgimbal mount that has been supplied by the Photoship One companyfrom the U.S.A. [Figs. 8 & 21 (a)] The final photogrammetric dataprocessing has either been outsourced or it has been carried out byclients such as English Heritage who already possess the requiredsoftware and expertize. However the Agisoft Photoscan softwarehas also been used in-house whenever required, especially for theinitial verification of the aerial data. A great variety of imaging andmapping projects have been undertaken. They include numeroussurveys of archaeological sites [Fig. 21 (b)] and historic buildings.The latter include the Roman Amphitheatre and Walls in the city ofChester and Clifford’s Tower (originally built by William theConqueror) in the city of York [Fig. 18]. Other projects have involvedsurveys carried out in connection with engineering and constructionactivities, including flood alleviation projects; the remediation ofindustrial land and river frontages; and, not least, a survey of theroof and the campus surrounding Manchester <strong>City</strong>’s Etihad footballstadium. A research-oriented mapping project has been the baselinesurvey of the wave-cut platforms that form part of the JurassicCoast, a major UNESCO World Heritage Site on the south coast ofEngland [Fig. 21 (a)].(c) QuestUAV Ltd.As mentioned above, QuestUAV Ltd. manufactures its own flyingwingUAV aircraft [Figs. 5 & 15 (a)], which it sells mainly to universitiesand research agencies. However the company also operatesas a service provider, formerly under the separate title of Blue RiverStudios. The two arms of the now single consolidated company[a](since September 2011) are both based in Amble, a small townlocated in Northumbria on the north-east coast of England. The company’saerial mapping services are conducted in a conventionalmanner using its own Quest flying-wing UAV aircraft with the airbornedata acquisition underpinned by a network of signalized andmeasured ground control points (GCPs) if the accuracy specificationrequires it. This is followed by automated aerial triangulation, thegeneration of a DTM and the production of orthophotos and orthomosaicsusing the Agisoft Photoscan software – for which theQuestUAV Ltd. company is now a re-seller. The company also operatesa multi-rotor UAV for use on those projects that require a hoveringcapability. Many of QuestUAV’s mapping projects are researchrelated, including (i) a survey of Exmoor’s rare peatlands located inthe south-west of England [Fig. 22 (a)]; (ii) the survey of a NationalTrust peatland site in the Yorkshire Dales National Park; (iii) coverageof a upland area in Bulgaria, located east of the capital, Sofia,for archaeological prospection, using both multi-spectral and nearinfra-red(NIR) cameras; and (iv) many archaeological and historicsites in England [Fig. 22 (b)]. Indeed, in May 2012, Nigel King,the head of QuestUAV Ltd., was presented with the Fox Talbot Awardfor 2011 for his professional work by the British Institute ofProfessional Photographers (BIPP). Besides which, the RutherfordAppleton Laboratory (RAL) – which is one of QuestUAV’sresearch customers for its flying-wing UAV – has carried out surveysof an area in the Atacama Desert in Chile that is being used to testrobotic rover vehicles that are planned to be used on the surface ofthe planet Mars. A DTM of this test area has been produced basedon the imagery acquired by two Quest flying-wing aircraft.[b]Fig. 25 – (a) This LLEO Maja UAV, equipped with two cameras, is about to be launched using a catapult and ramp. (Source: Low Level Earth Observation (LLEO))(b) A sample orthophoto mosaic of a golf course. (Source: Bluesky International)Latest News? Visit www.geoinformatics.com January/February 201337
A r t i c l e[a][b]Fig. 26 – (a) This SmartOne UAV that is being operated by Blom is being hand-launched. (Source: SmartPlanes)(b) An orthophoto of a gullied area in County Durham in the north-east of England that has been derived from UAV aerial photography. (Source: Germatics)(d) Cyberhawk Innovations Ltd.This company is located in the town of Livingston, near Edinburgh,Scotland. It utilizes its fleet of UAVs (i) to carry out the inspection ofindustrial facilities; and (ii) to execute mapping projects. In the caseof the former, it specializes in the inspection of operational facilitiesin the oil, gas and chemical industries both onshore and offshore inthe U.K. and abroad using its fleet of Falcon-8 multi-rotor UAVs fromAscending Technologies. These activities include the inspection ofcooling towers, chimneys, live flares, wind turbines and structuressuch as the buildings, storage tanks, gantries and walkways inrefineries and offshore platforms. For its aerial mapping work,Cyberhawk utilizes a fixed-wing MAVinci Sirius UAV [Figs. 6 & 23(a)] for the data acquisition with in-house photogrammetric processingof the acquired data using the Agisoft Photoscan software mentionedabove and the LSS software from McCarthy Taylor for thegeneration of DTMs and <strong>3D</strong> visualization products. Many of the surveyshave been carried out over potential wind farm sites. Otherprojects involve repeated surveys of quarries for volume determination,management and safety purposes [Fig. 23 (b)]. Still other mappingprojects have been carried out for the state forestry service andfor cultural landscape and heritage sites. A typical project covers anarea of 200 to 300 ha, but the mapping of larger areas of up to 1to 2 sq km has also been undertaken.(e) Project URSULAProject URSULA (UAS Remote Sensing for Use in Land Appli ca -tions).is a two-year research and development programme that isusing small unmanned aircraft to explore the potential of imaging inland applications, primarily high input arable farming – which isbeing supported by the Welsh Assembly Government. The project isbased in Aberystwyth, a town on the west coast of Wales, and isdeveloping various agronomy products and services related to agricultureand precision farming, based on the image data that is beingcaptured from UAV aircraft. The project is being implementedthrough a close collaboration between two commercial companies –Environmental Systems Ltd. and Callen-Lenz Associates. The Callen-Lenz company provides technical consultancy in aviation. The company’soperational arm is the Gubua Group, which operates boththe in-house developed G2 flying-wing aircraft [Fig. 24 (a)] alreadymentioned above, and a G6 multi-rotor UAV with a 1.5 kg payload.While DEMs and orthophotos are being generated from the resultingimagery in the conventional manner, the final products are orientedtowards forestry, agriculture and environmental applications.Thus, depending on the specific application, the UAVs are equippedwith either colour, colour infra-red (CIR) or thermal-IR cameras forimage data capture [Fig. 24 (b)]. These include the ADC and MCAcameras manufactured by Tetracam. The Environmental Systemspart of the partnership is concerned primarily with the analysis ofthe acquired image and map data and their applications to the environmental,agricultural and land use sectors.(f) Bluesky InternationalBluesky International is a major supplier of conventional large-formataerial photography and mapping products within the U.K. Thecompany is based in Coalville, Leicestershire in the East Midlandsof England. In addition to its well established aerial photographicservice and products, it is now offering a UAV imaging and mappingservice, which is aimed at the production of detailed and accurateaerial surveys of small areas (up to 5 sq km). For the aerialimaging part of these surveys, Bluesky uses the services of the UAVsthat are being operated by other smaller specialist companies.However it carries out the subsequent photogrammetric processingin-house, including the geo-rectification and ortho-rectification of theimagery. This is executed using conventional DPWs, using the proceduresthat are provided by the Intergraph/ERDAS ORIMA softwareand various Trimble/INPHO software packages. Applicationshave included small-area surveys of golf courses [Fig. 25 (b)]; saltmarshes (for the National Trust); sporting estates; construction sites;and areas of high-value agricultural crops.(g) Blom UKThe Blom Group is of course one of the largest companies engagedin aerial surveys and mapping within Europe with offices in almostevery European country. These include the Blom UK company, whichis based in Cheddar, Somerset in south-west England. In July 2011,Blom UK announced that the services of the Personal AerialMapping System (PAMS) that Blom Germany and its daughtercompany, Germatics, have developed in cooperation withSmartPlanes AB from Sweden would be available in the U.K. Severalpapers giving details of the system and of Blom’s extensive experienceswith its 12 operational PAMS systems in Germany,Scandinavia, the Netherlands & the U.K. have been published byDr. Werner Mayr of Blom Germany and Dr. Ralf Schroth of BlomRomania. As mentioned above, the SmartOne flying-wing UAV [Figs.4 & 26 (a)] that forms the aerial component of the PAMS system isproduced by SmartPlanes. As utilized by Blom, it carries calibrated38January/February 2013
A r t i c l ecameras producing images in the range 7 to 10 Megapixels in size,which are acquired in rectangular blocks with 80% longitudinal andlateral overlaps. Rapid image processing and the production of asimple rectified mosaic can be undertaken on-site for checking purposes.Thereafter the data is uploaded via the Internet to Blom’soffice where the final processing, including the production of thefinal DTMs, orthophotos and visualization products, takes place. Thenumerous projects undertaken by Blom include surveys of golf courses,railway infrastructure, quarries, waste dumps, landslide monitoring,as well as mapping for agricultural, forestry and environmentalpurposes [Fig. 26 (b)].The latest development is that Dr. Mayr and the staff of Germaticsconcerned with UAV imaging and mapping have all left the companyand are now working for a new independent company, calledGerMAP. Besides undertaking UAV aerial photography, theGerMAP company is also offering a data processing service for UAVimagery.VII – ConclusionFrom the account given above, it is obvious that commercial imagingand mapping from lightweight UAV aircraft is already fully operationalin the U.K. On the one hand, where this activity is based onthe use of fixed-wing UAVs, the procedures largely follow thewell-known and well-established methodologies of airborne photographyand photogrammetric mapping that are used in the aerial surveysthat are carried out with manned aircraft. However this developmentwith fixed-wing UAVs has taken place in the U.K. withoutreally competing with the established commercial aerial mappingindustry. Instead it largely supplements the established industry, havingopened up a new niche market of mapping small areas such as(i) archaeological and historic sites; (ii) individual quarries, wastedumps, construction sites and agricultural farms; (iii) wind farm andelectricity sub-station sites; and (iv) small areas of interest to forestersand field scientists. Previously these areas would have been deemedtoo small to be considered for mapping using aerial photogrammetricprocedures – mainly due to the fixed overhead costs and themobilization costs that were involved. By contrast, rotary-wingUAVs have (i) opened up a completely new and very different marketin the area of close-range industrial and infrastructure inspection,while, (ii) at the same time, offering stiff competition to the largeand well-established aerial photographic industry in the U.K. thatacquires mainly oblique imagery for marketing and pictorial purposes– mostly, until now, using manned light (e.g. Cessna 172) aircraftand pole cameras mounted on telescopic masts.Gordon Petrie is Emeritus Professor of Topographic Science in the School of Geographical & Earth Sciences ofthe University of Glasgow, Scotland, U.K. E-mail – Gordon.Petrie@glasgow.ac.uk ; Web Site –http://web2.ges.gla.ac.uk/~gpetrie
C o l u m nGreen SurveyingIng. Léon van der Poel is director at LEOP,a company which combines surveying andtraining of surveyors www.leop-bv.nl.C O L U M NNot long ago I was asked during an interview, for a big surveyingproject, about the way my company looks at sustainable entrepreneurship.Iinterpreted this question to mean ‘how green isyour survey company?’ The answer whichimmediately came to mind was: not as greenas I would like it to be. Ideally, I would like to travelto the site on my bicycle, but equipment andtools are often too heavy or big to be transportedby bicycle. Does this mean that my company isorange or even red instead of green?Substantial companies dosometimes look at the combinationof profit, the effecton the planet (environment)and the people (social).The study of these threefactors is generally knownas the triple bottom line ortriple p and it is commonlyaccepted that these threeelements should be in somekind of balance. This isdone by capturing valuesand using criteria for measuringsuccess; economicalas well as ecological andsocial. As is often the case,there is a standard for this.In this particular instance itis the ISO 26000, but thisstandard is not intended or appropriate for certificationpurposes (www.iso.org).Other certifications clearly state, however, thatthey are based on the ISO 26000, which makesthe difference between guideline and certificationvery small.“We are making a significantcontribution, but we still don’t40have any certification.In general, for smallercompanies certifications onlycost money and time.”So what often happens is that bigger companiestend to get official certification to prove that theyare doing something with the triple p bottom line.For smaller companies this is not so easy. In mostcases it is difficult and expensive to get certification.But what is this sort of certification worth?A good example is the ISO 9000. For most constructioncompanies they insist on yearly calibrationof the tools including the surveying tools. Thisresults in an impressive sticker on the side coverof the instrument which tells the user when theinstrument should be calibrated and sometimeswhen the last calibration took place. So when youhave an instrument with such a sticker on the sidecover, which states it should be calibrated in, forexample, July 2013 and you ask the user of thisinstrument if this instrumentis ok, in most cases the userwill say the instrument is ok.If, however, the stickerwould say the instrumentshould have been calibratedin July 2012, the customeris normally not sosure if the instrument is okor not. I often pose thesesorts of dilemmas toemployees during training.When I tell them that theinstrument was transportedfrom the supplier to the constructionsite by parcel service,they are even morehesitant as to whether theinstrument is still ok, even ifthe sticker on the side coverstates that it doesn’t need tobe calibrated until July 2013. Surely it would bebetter to write in the requirements that the usershould check the instrument before using it. Theuser is actually more important than the certification.How green is my own company? We recyclepaper, the ballpoints are made of compostablematerial instead of plastic, and we do not use thestandby, but turn off the computers when we gohome. We are making a significant contribution,but we still don’t have any certification. In general,for smaller companies certifications only costmoney and time.January/February 2013
E v e n tInformation MobilityBe Inspired Awards 2012At Bentley’s ‘Be Inspired: Innovations in Infrastructure’ conference in Amsterdam, the featured keynotespeaker was not an engineer or an IT guru. He was a journalist. Wired magazine’s executive editor,Greg Williams, intelligently matched his vision with that of Bentley’s industrial apps for mobile devices.By Remco TakkenThese mobile Apps had been presentedthe day before, which made Williams’thoughts on ‘mobile’ most appropriate.For instance, in his keynote Williams mentionedthe great efforts of the Open StreetMap team right after the March 2011 tsunamiin Japan. Most people working in a CAD,construction, or GIS environment are new toinnovations like Arduino, the open-sourceelectronics prototyping platform based onflexible, easy-to-use hardware and softwarethat Williams discussed. He also showedsome mind-boggling inventions, mostly madeby hobbyists and creative artists. For a sample,check out the Arduino-based ‘EnoughAlready’ product designed to block or cancelannoying celebrity voices on your TV set!Winner Innovation inGovernmentDuring the main part of the conference, some‘usual suspects’ popped up. It wasn’t the firsttime representatives of the London Crossrailproject had attended a Bentley event to talkabout GIS and asset models. Still, the project’sInnovations in Government. From left to right: Richard Zambuni,Global Marketing DirectorGeospatial and Utilities at Bentley Systems, Daniel Irwin, GIS Technical Analyst at Crossrailand Ton de Vries, Solutions Executive, Government at Bentley Systemsefficient information flow, data management,information accessibility, and data interoperabilitydeserve and gain respect – enough tobecome a winner in the category ‘Innovationin Government.’ Crossrail is being built undercentral London to link network rail lines to theeast and west of the United Kingdom capital.The project includes 21 kilometers of twin tunnelsand multiple below-ground stations. Theproject demonstrates a federated dataapproach that links systems and 2D/<strong>3D</strong> datarepositories. Crossrail’s strategy incorporatesa combination of standards, methods, andprocedures as well as software, tools, andhardware. To ensure integrated data managementthroughout all phases of the project,Crossrail integrated MicroStation, Pro ject -Wise, Bentley Map, Bentley Geo WebPublisher, gINT, Hevacomp, Bentley RailTrack,and STAAD.Pro.Finalist Innovation inGovernmentIn New Zealand, Napier <strong>City</strong> Council dealtwith water issues and a proprietary GIS history.Moving forward, during Napier’s GISrenewal, it reviewed ‘everything’, replacedthe old software as well as model data anddata migration. Napier <strong>City</strong> Council consolidatedits infrastructure asset managementsystems, known as WorkIT, to create a singleauthoritative data source for surveying,CAD, GIS, and asset management applications.Standardizing on one technology platformallowed data to be reused withoutbeing reworked. The new data flow beginswith the existing CAD drawings and thenmoves to survey data of the actual as-builtsituation, into GIS, AMS, and finally theOracle database for storage. Bentley’sEnterprise License Subscription saved theCouncil money since it no longer neededseparate GIS licenses. WorkIT II hasimproved workflow and data flow whilemaintaining data accuracy. For city watersupply services, Bentley Map has replacedthe existing GIS product; Bentley Water providestools for enforcing business rules; andan Oracle database tracks data changes.Winner of Rail and TransitThe Hallandsas ‘Live BIM’ Railway Projectis a Swedish <strong>3D</strong> object library/BIM platformthat notably includes a tunnel section. Thistunnel section will increase capacity fromfour to 24 trains per hour as well as allowthe weight of the freight trains to be doubled.The Swedish Transport Administrationmanages and provides template and controlfiles that support building information modeling(BIM), which was implemented to createvalue during several stages of the project.Sweco used MicroStation, InRoads,Bentley Rail Track, ProjectWise, and BentleyNavigator as the BIM platform for the railwayfrom Förslöv to Båstad, Sweden.Environmental studiesAlso worthy of note is Quigg EngineeringInc., whose project submission in the Railand Transit category for its work on theChicago-St.Louis high-speed rail project was42January/February 2013
E v e n tThe tunnel section of Hallandsas ‘Live BIM’Railway Project, a Swedish <strong>3D</strong> objectlibrary/BIM platform.named a finalist. For its extensive environmentalstudies conducted to help minimizethe project’s footprint, Quigg used lots ofmaps to help visualize the situation. Withnatural resources preservation a conditionfor construction, Quigg Engineering performedenvironmental studies along 35.24miles of mainline track to locate sensitiveareas, endangered species, and wetlandswithin 100 feet of the centerline. Micro -Station and GEOPAK enabled the team toproduce aerial plan sheets for field work,associate correct plane coordinates withDGN files, attach GIS shape files to correctlocations, and identify natural features onaerial plan sheets for the environmentalassessment.Winner Water and WastewaterTreatment PlantsAnother winner in the Be Inspired competitionwas ‘A 4D Giant’ project by CarolloEngineers in Denver, Colo., USA. Basically,4D is a <strong>3D</strong> model with the addition of timeas the fourth dimension. Carollo Engineershad been reviewing a contractor’s constructionschedule in the South SecondaryImprovements Project, a wastewater projectinitiated by The Metro Wastewater Recla -mation District in Denver, Colo. The Districtis modifying and upgrading the SouthSecondary Treatment facilities to treat 114million gallons of wastewater per day. Theproject had to be completed within the statemandatedcompliance schedule, requiringthe contractor to place approximately75,000 cubic yards of concrete and installthe major electrical, mechanical, and instrumentationequipment in the first 2.5 years.4D has been used as a tool for risk mitigation,detailed review, and identification ofissues in a schedule. Within the 4D modelthe start of a new activity turns the new itemgreen within the model. After ‘finish activity,’it turns it to the standard model color.Some of the ‘information mobility’ implicationsinclude the risk of not working with theright version of a document. Also, peopleare bringing their own devices to the workspace. In logistics, cost and time are animportant factor. In review, mark-up captureshould be clear and accurate. Lastly, synchronizationis important for feedback to theworking team. Carollo Engineers usedMicroStation, Bentley Navigator, Project -Wise, and InRoads to link 12,154 activitiesfrom the contractor’s Primavera P6 baselineschedule with the <strong>3D</strong> model to create the 4Dvisualization. The detailed 4D model aidedthe project team in evaluating whether theaccelerated schedule was achievable.Bentley Utilities DesignerOne of the technology previews at BeInspired 2012 was the V8i (SELECTseries 3)release of Bentley’s Utilities Designer. Thebiggest announcement: Bentley UtilitiesDesigner is now ‘completely GIS agnostic,’meaning that it does not require replacementof your existing GIS. Furthermore, it is a ‘single-install’product, with all the necessaryMicroStation functionalities right in it. Thismight seem a very logical thing to the enduser, but Bentley watchers might see it as asign: the ‘free’ functionality of ‘classic’Bentley (and/or former Haestad) productsare gradually becoming a commodity.Bentley and TrimbleDuring the 2012 edition of Bentley Systems’annual Be Inspired event, Bentley SystemsCEO Greg Greg Bentley noted the recentstrategic alliance with Trimble. He explainedthat geospatial coordinates, as measured bythe surveying equipment of Trimble, providea simulation of real-world conditions thatserves as a “dial tone” through which onecan connect back to information about thereal world using information modeling.For its extensive environmental studies conducted to help minimize the project’s footprint, Quigg associated correct plane coordinates with DGNfiles, attached GIS shape files to correct locations, and identified natural features on aerial plan sheets for the environmental assessment.This alliance between Bentley and Trimbleis meant to enhance construction and operationsquality, efficiency, and safety.Employing advanced information mobilityinnovations, the exchange of physical andvirtual data can be more easily leveragedby engineers and contractors to reduce projectrisk while increasing overall productivi-Latest News? Visit www.geoinformatics.com43January/February 2013
E v e n tdevices, and, later on in 2013, will supportiOS. This tool is meant for field workers,who might be non-GIS users. Data is comingin via connected webservices; whenworking on a disconnected SQL-databaseon a mobile device, Bentley’s i-model conceptis being called upon. Being able towork disconnected with Bentley Map Mobileon portable devices is essential, for instancein the case of crises or outages.During the Be Inspired event, a ‘please touch’ environment was set up with many examples of devices running Bentley’s new industrial apps.ty, according to both parties. In the resultingenvironment, physical and virtual informationcan be used to improve and validateon-site construction processes. The seamlessexchange of information between the virtualand physical can be achieved by utilizingTrimble’s field positioning technologies,such as robotic total stations, <strong>3D</strong> laser scanners,and global navigation satellite system(GNSS) positioning solutions, and Bentley’sinformation modeling software—with worksharing and dynamic feedback being managedin ProjectWise.Greg Bentley said: “Through the intrinsic‘geo-coordination’ in Bentley’s applicationsand ProjectWise geospatial services, almostevery project’s information modeling contentis virtually positioned with engineering precisionin the ‘project space.’ Intelligent positioningnow enables these engineering modelsto be real-time and real-place referenced,from and into mobile devices in the field,through immersive environments from bothBentley and Trimble. Users piloting the integrationof physical positioning from Trimblewith virtual positioning from Bentley, facilitatedby information mobility innovations,have identified significant savings of timeand money, and continue to uncover newbenefit cases.”Industrial AppsWhen Greg Bentley talked about ‘informationmobility,’ he was not only referring tofield surveyors deploying GPS and sendingdata back and forth to the office. Lately,Bentley has been watching the huge growthin iStore apps available on the market, andrecognises the opportunities for Micro -Station users: “Having more apps is good!”Bentley stated. He doesn’t feel challengedby the fact that consumer apps are practicallygiven away, and only make a profitafter a million downloads or so. Looking atthe installed base of Bentley users, heremarked: “Essentially, we have been a subscriptioncompany from the start.”Within Bentley’s own industrial apps alignment,licensed users are entitled to a ‘passport’to get their apps, which are mostlydesigned for one specific purpose. One ofthose new apps is the Microsoft Sur -face/Windows 8: ProjectWise Server.Bentley Map Mobile supports AndroidPlease touchDuring the Be Inspired event, a ‘pleasetouch’ environment was set up with manyexamples of devices running the new industrialapps. Attendees could try them out forthemselves, with competent assistance ofcourse. Bentley Vice President ProductManagement Robert Mankowski showed alive demo of the Android version of BentleyMap. While most apps currently supportAndroid, one of Mankowski’s app demoswas already running on Apple iOS:ProjectWise Explorer was shown in actionon an iPad. Features like <strong>3D</strong> visualisationsand redlining popped up, and it appearedthat the app was also running fine in ‘disconnected’mode. Deploying its EnterpriseLicense Subscription to the max, Crossrail inLondon is one of the first users with its ownApp Store containing Bentley iWare. Someof the industrial apps used by Crossrailinclude Structural Synchronizer, NavigatorPano Viewer, and ProjectWise Explorer.Next issueBentley Systems COO Malcolm Walter convincinglyadvocated the idea that the venueof this year’s Be Inspired Awards celebration,the beautiful 19 th century HotelKrasnapolsky in Amsterdam, would havebeen a sure winner of at least three awardsfor its deployment of several building, electrical,and architectural innovations of itstime. If only the Be Inspired Awards hadexisted one hundred years ago…. In 2013,the Be Inspired event and awards ceremonywill not be taking place in Amsterdam,though its new location has not yet beenrevealed.For more information, have a look at:www.bentley.com/en-US/Corporate/Be+Inspired+Awards+EventCarollo Engineers used MicroStation,Bentley Navigator, ProjectWise, andInRoads to link 12,154 activitiesfrom the contractor’s PrimaveraP6 baseline schedule with the <strong>3D</strong>model to create the 4D visualization.44January/February 2013
N e w s l e t t e rThe Outcome of the 2012 CLGE Students’Contest heralds the 2013 edition!On 10 October 2012, CLGE presented its first Students’ Contest Award during the CLGE Students’ meetingat INTERGEO. In this issue we have produced the abstracts of the two winning papers. The full versionsas well as the other contending papers are available on www.clge.eu. Moreover, the regulationsfor the 2013 edition are also available on our website. As well as Students, Young Surveyors maynow take part in the third category entitled “Students and Youngsters engagement”.Winner in category “Geodesy, Topography”.Geodetic Works In Research And DevelopmentPlan For Remediation Of Landslides Kostanjek.Diana Bečirević, Daria Dragčević, Jakov Maganić,Kristina Opatić, Ljerka Županović (Croatia)Omar-Pierre Soubra, Trimble, Addresses the Croatian winning team in the category “Geodesy – Topography”The modern surveyor can play an important role in the field of disasterrisk management, although in most cases, the activities willtake place as part of multidisciplinary task forces.In this student paper, the results of the student’s field workshop onthe Kostanjek Landslide were presented.The whole idea was realised in 2011 and 2012 within the frame ofa scientific Japanese/Croatian project and will continue. The entirework is important for further implementation of this international projectwhich is being implemented in three Croatian universities.According to the data from the existing investigation, the KostanjekLandslide is the largest landslide ever to occur in Croatia and sinceit’s activation in 1963, has caused substantial damage to infrastructure.The topic has been increasingly important for local administrationwhich has implemented a plan for recovery after landslides in2001.Student workshops, which include the application of different methodsof geodetic surveying in the research of landslides, were implementedin several phases. Each phase, survey method and therequired accuracy was adjusted to the needs of further research.The application of different surveying methods shows the importantrole of geodetic science in the management of high-risk areas suchas landslides.The work is unique because of the multidisciplinary approach to solvingthe problems of rehabilitating the largest landslides in Croatia.Winner in category “GIS and Mapping”.Impact of Persistent Organic Pollutants on humanhealth and analysis of the damage caused bythem using GIS tools.Constantin Gisca (Moldova)The main purpose of this projectis to research the damagecaused by persistent organicpollutants on the environmentand public health• namely causes for the in -creas ed number of cancer diseasecases• using Geographic InformationSystem (GIS) tools.The lack of an adequateinfrastructure for appropriatelylocating, storing and managingdangerous householdwaste, i.e. the problem ofPersistent Organic Pollutants(POPs), is regarded as one ofthe most pressing environmentalproblems. OrganicConstatin Gisca from Moldova presents his winning paperin the category “GIS and Mapping”pollutants have a negative influence on human health. One of thenegative consequences of POP is the mortality rate increase causedby cancer.This paper shows the analysis of POP warehouses in Moldova. Highriskindex warehouses were selected, but also included were thoselocated close to populated areas. They were surveyed to determinethe adverse effects of POP on human health, namely how it increasesthe number of cancer diseases.The following results were achieved:• the surface of soil contaminated by persistent organic pollutantsconstitutes approximately 4500 ha. Most of these soils have thequality index of over 65;• in the districts with the greatest number of cancer diseases, a largenumber of warehouses with persistent organic pollutants storedwere identified, 30-50% of these warehouses are located close topopulated areas and 30% have a high risk index;• districts reporting an increase of cancer diseases have a significantnumber of warehouses with POPs and the rate of warehouseslocated close to human settlements constitutes 30%.The results analysed show that persistent organic pollutants presenta great danger for public health and quick intervention is requiredto remove them.46January/February 2013
N e w s l e t t e rApply for Edition 2013!We are inviting all European Bachelor and Master Students to join theCLGE Students’ Contest 2013. The full rules can be found on our websitewww.clge.eu (questions: contest@clge.eu).Interesting prizes are on offer. You can win a €1000 award, which willinclude participation in a major European or Worldwide event organizedby one of our main sponsors.Two academic categories are available:• Geodesy and Topography• GIS, Mapping and Cadastre (thus this category was opened forpapers about the Cadastre).The third category concerns Students’ engagement or Youngsters’ attractionto the profession (2010 – 2013).In this category both students and young surveyors may apply. The competitionis open to anyone who will be younger than 36 years old on31st December 2013.In this category, there will also an award of €1000. Additionally, thewinner will be appointed as a special board member of CLGE, in chargeof implementing the project that he or she has designed.The XXII Nordic Surveyors Congress. Oslo,September 19-22, 2012.Yet another smart tradition from the North: the Nordic Surveyors Congress has been held since 1920,generally every four years. At this year’s XXII Nordic Surveyors Congress in Oslo, the participantsexperienced a comprehensive and extensive program, both academically and socially.On Wednesday 19th September participantswere received by Mayor FabianStang for a reception in the <strong>City</strong> Hall,before the formal opening took place onThursday 20th September. The opening wasattended by representatives from the Ministry ofEnvironment, Norwegian Courts Administration,Norwegian Mapping Authority, and the presidentof CLGE.The opening ceremony underlined the importanceof good land administration in modernsocieties, and that higher education and competenceare essential for the land surveyor tofulfill the role in society. Key note speaker at thecongress was Ed Parsons, GeospatialTechnologist at Google. He presented his viewson our technological future. While in formertimes the main user of geoinformation has beenthe “hardhats”, that means the military and peoplein the construction industry, it is now the “hipsters”who are increasingly using maps and spatialdata in all possible contexts. Ed Parsonssuggested that this trend will continue in thefuture.The Congress was based on Nordic presentationsin four sessions focusing on a) modernmapping techniques b) <strong>3D</strong> and BIM c) infrastructurein the underground and d) the land surveyor’srole in conflict prevention/resolution.Modern mapping techniques: National digitalelevation models are established in severalNordic countries. The Swedish elevation modelis established by airborne laser scanning andhas a resolution of 0.5 -1 points per m 2 . Thereis great emphasis on quality assurance systems,developed in collaboration with the supplier -Blom. Accuracy is 3-5 cm in open areas, whenscanning is performed at an altitude of 2000meters. Also presented in this session was themajor trend with respect to the use of drones(UAS) for mapping. In the U.S. there are nowReception at the Oslo <strong>City</strong> Hall.more UAS pilots than regular pilots in the U.S.military. Drone mapping is used for the mappingand monitoring of smaller areas/infrastructureprojects. Mobile mapping from road vehiclesis also a technology that is developingrapidly, using kinematic laser scanners rotating360 degrees. The result is a point cloud whichprovides an image of the surface. One advantageof this is that the field work can be donerapidly, with high accuracy and with low risk ofinjury for the surveyor. In Denmark surveys ofprotected natural areas are now conducted byLatest News? Visit www.geoinformatics.com January/February 201347
N e w s l e t t e rfieldwork and aerial photography to collectinformation about the natural areas’ character,animal and plant life and conditions etc. A newWebGIS system has been developed for the project;if irregularities are found, the area must bechecked in the field. New methods for theassessment of forests have been developed bythe Norwegian researcher Erik Nesset. LaserScanning is used as a method for creating a terrainmodel and colour aerial photography isused for classification. The methods are in usein several countries in Europe, mostly inScandinavia and Finland.<strong>3D</strong> and BIM: In connection with the renovationof the National Theatre in Oslo, Statsbygginitially wanted a <strong>3D</strong> laser scanning model ofthe facades, and later this was extended to allinside building elements. This resulted in largesavings and did away with huge paper stacks.An open question is: how will the point cloudbe used in the future. In Sweden it is now legalto register <strong>3D</strong> properties. <strong>3D</strong> properties followthe same rules as all other properties. The boundariesmust be described and documented anda <strong>3D</strong> survey must be performed exactly as aregular survey. There is still no <strong>3D</strong> cadastre inSweden. The session ended with a presentationabout free geographic data in Finland. Therehas been pressure on the Land Survey for 20years to release their data; this pressure hadincreased over the last 2 years. After becominga political issue, all data has now been releasedand is open to the public. This means that alllaser data, orthophoto and topographic data,are now available free of charge! After only 3months, the use of this data has increased 50fold.Underground infrastructure: All Nordiccountries have extensive challenges with undergroundfacilities. The underground infrastructuresrepresent great value. Questions aboutcompensation for losses that occur, how toimprove the legislation, conditions to put cablesin the underground, need to be answered. Thecadastral surveyor in Sweden can establish aright for pipelines in a survey. In Finland themajor impact of more extreme weather, causingdamage to the pipelines and blackouts forlonger periods in the affected areas was anissue. Good overviews in the form of maps andrecords are essential to prevent and managecritical situations. Another key question is howthe underground infrastructure can be affectedby deformation from buildings and structures onthe surface. Also presented was howCopenhagen has established a system for realtimemeasurement and monitoring of deformationsduring construction of the new Metro. Largeamounts of data will be collected and all deformationsmapped. In Norway there are effortsKristin Andreasson from Sweden presenting the Swedish surveyor taking a decision when there is a disputeto create good cooperation forums betweeninstitutions, to create more effective interfacesand data exchange.The land surveyor’s role in conflictprevention/resolution: This session wasdevoted to one of the land surveyors more fundamentaltasks; conflict prevention and conflictresolution. The Danish chartered surveyorprovides a thorough description of boundariesto public records and, thereby, contributes toconflict prevention and possible future conflicts.A land owner cannot go directly to courtwith a boundary dispute in Denmark, as priorto the court case a survey must be conductedby a chartered surveyor. Approximately 70disputes are handled by the chartered surveyorsevery year, with an average of 12% goingto court. The majority of these conflicts areabout adverse possession. In Sweden thecadastral surveyor is a state or local governmentofficer. Generally the surveyor is a bacheloror master within the field of surveying,but nowadays lawyers can also becomecadastral surveyors.Boundaries and rights are handled in the surveyand the Swedish surveyor has the authorityto make decisions. Normally surveys arebased on mutual agreements by the parties,but if there is a dispute the surveyor will makea decision. In Finland the situation is generallythe same as in Sweden for cadastral surveying.The Land Court is an old institutionfrom the 1700s, and handles all appealsabout cadastral surveys. Since 2010, the LandCourt has also handled land registrationappeals. In Norway there is a special situationcompared to the other Nordic countries.Local authorities are responsible for ordinarycadastral surveys, but cannot make decisionsif there are disputes. The Norwegian land consolidationcourts solve problems and makedecisions in land disputes, and have land surveyors.There is no link between local authoritiesand the land consolidation court. Thereare many conflicts about boundaries andrights in Norway.In addition to the four sessions with Nordicspeakers, there were several plenary speakers.Lyn Wilson from Historic Scotland presentedhow historians have worked with technicalspecialists in the terrestrial scanning ofRosslyn Chapel. David Powell from Englandexplained how resolving border disputes arepossible even in a country that does not haveaccurate surveying and mapping of propertyboundaries. Line Langkaas and Per-ErikOpseth from The Norwegian MappingAuthority presented plans for the constructionof a new geodetic observatory on Svalbard.The new observatory will map the movementsof the Earth, the Earth’s rotation and its preciselocation in space and provide basis foraccurate climate monitoring of the Arcticregion. Torbjørn Tveiten from Via Nova presentedthe use of <strong>3D</strong> and BIM for infrastructurein model-based design and practical usein the construction phase of Ring 3 at Økern,a major development project in Oslo. Thecongress ended with a technical and socialtour visiting the Økern project and the oldObservatory. This observatory was an astronomicalobservatory for 100 years from1833, and is the foundation for institutions likethe Norwegian Mapping Authority, NorwegianMetrology Survey and the NorwegianMeteorological Institute. Accompanying personsvisited the Munch Museum and HolmenkollenSki Museum, and there were the traditionalhome visits. At the gala dinner, congress prizesfor excellent work were awarded to young surveyors,Cecilia Rogvall and Camilla Backmanfrom Sweden, Eivind H. Ramsjord from Norwayand Karin Kolis from Finland.Read more on the website about the XXII Nordic Congress surveyor here:http://kongress2012.njkf.no.Leiv Bjarte Mjøs, Chair of the Organizing Committee and CLGE vice-president48January/February 2013
C a l e n d a r 2 0 1 3 /A d v e r t i s e r s I n d e xFebruari14-15 February IV International Conference“Geodesy, Mine Survey and Aerial Photography.At the turn of the centuries”Novotel-Hotel, Moscow, RussiaInternet: http://con-fig.ru/?r=indexen19-20 February MapInfo Professional FoundationLevel Training CourseCDR Group, Hope, Derbyshire, U.K.E-mail: sales@cdrgroup.co.ukInternet: www.cdrgroup.co.uk/train_mi2info.htm26-28 February Munich Navigation SatelliteSummitThe Residenz München, Munich, GermanyInternet: www.munich-satellite-navigationsummit.org/Summit200927-28 February International Workshop “The Roleof Geomatics in Hydrogeological Risk”Padua, ItalyInternet: www.cirgeo.unipd.it/geomatics4riskMarch04-05 March Powered by INSPIRE/ Safety,Mobility, Sustainability and more...Brussels, BelgiumInternet: www.poweredbyinspire.eu05-06 March MapInfo Professional AdvancedLevel Training CourseCDR Group, Hope, Derbyshire, U.K.E-mail: sales@cdrgroup.co.ukInternet: www.cdrgroup.co.uk/train_mi3info.htm06-08 March GeoViz_Hamburg 2013: InteractiveMaps That Help People ThinkHamburg, GermanyE-mail: geoviz@geomatik-hamburg.deInternet: www.geomatik-hamburg.de/geoviz07 March GEO-NorthReebok Stadium, Bolton, U.K.Internet: www.pvpubs.com/events.php07-08 March EUROGI Conference 201<strong>3D</strong>ublin, IrelandInternet: www.eurogi.org/conference-2013.html11-13 March “Wavelength 2013”Glasgow, U.K.E-mail: andy@rspsoc-wavelength.org.ukInternet: www.rspsoc-wavelength.org.uk/wavelength201319-20 March MapInfo Professional FoundationLevel Training CourseCDR Group, Hope, Derbyshire, U.K.E-mail: sales@cdrgroup.co.ukInternet: www.cdrgroup.co.uk/train_mi2info.htm19-20 March 12. Internationales <strong>3D</strong>-Forum LindauLindau, GermanyInternet: www.3d-forum.li24-28 March ASPRS 2013 Annual ConferenceBaltimore Marriott Waterfront Hotel, Baltimore, MD,U.S.A.Internet: www.asprs.org/Conferences/Baltimore2013April03-07 April 11th Vespucci Institute “SynthesizingPopulation, Health, and Place”Catalina Island, CA, U.S.A.E-mail: info@vespucci.orgInternet: www.vespucci.org08-10 April 8th EARSeL IMAGING SPECTROSCOPY WORK-SHOPNantes, FranceInternet: www.sciences.univ-nantes.fr/lpgnantes/earsel-is-201315-17 April 19th Annual CalGIS ConferenceWestin Long Beach, CA, U.S.A.Internet: www.calgis.org16-17 April MapInfo Professional FoundationLevel Training CourseCDR Group, Hope, Derbyshire, U.K.E-mail: sales@cdrgroup.co.ukInternet: www.cdrgroup.co.uk/train_mi2info.htm17-19 April International Forum “IntegratedGeospatial Solutions - the Future of InformationTechnologies”Moscow, RussiaInternet: www.sovzondconference.ru/2013/eng18 April FMEdays 201<strong>3D</strong>ublin, IrelandE-mail: fme@conterra.deInternet: www.fmedays.de/index_en.shtm21-23 April Joint Urban Remote Sensing Event(JURSE 2013)Sao Paulo, BrazilInternet: www.inpe.br/jurse201323-25 April ENC 2013 ‘The European NavigationConference’Vienna, AustriaInternet: www.enc2013.org25-26 April <strong>3D</strong> Documentation ConferenceMarina Mandarin Hotel, SingaporeInternet: www.3d-documentation-conference-2013.comMay01-02 May GEO-SouthHoliday Inn, Elstree, U.K.Internet: www.pvpubs.com/events.php13-16 May Geospatial World ForumBeurs/World Trade Center, Rotterdam, The NetherlandsE-mail: info@geospatialworldforum.orgInternet: www.geospatialworldforum.org14 May FMEdays 2013Milan, ItalyE-mail: fme@conterra.deInternet: www.fmedays.de/index_en.shtm14-15 May MapInfo Professional Foundation LevelTraining CourseCDR Group, Hope, Derbyshire, U.K.E-mail: sales@cdrgroup.co.ukInternet: www.cdrgroup.co.uk/train_mi2info.htm15-17 May The fourth China Satellite NavigationConference (CSNC 2013)Wuhan, ChinaInternet: www.beidou.org/english/news.asp21-22 May Location Intelligence + Oracle Spatialand Graph User Conferences 2013Ronald Reagan Building and International Trade Center,Washington, D.C.Internet: www.oracle.com21-24 May ISPRS Workshop “High-ResolutionEarth Imaging for Geospatioal Information”Hannover, GermanyInternet: www.ipi.uni-hannover.de/isprs_hannover2013.html22-24 May FOSS4G North America 2013Marriott <strong>City</strong> Center, Minneapolis, MN, U.S.A.Internet: http://foss4g-na.org23 May FMEdays 2013Fribourg, SwitzerlandE-mail: fme@conterra.deInternet: www.fmedays.de/index_en.shtm28 May FMEdays 2013Brussels, BelgiumE-mail: fme@conterra.deInternet: www.fmedays.de/index_en.shtm29-31 May UDMS 2013, 29TH Urban DataManagement SymposiumUniversity College London, London, U.K.E-mail: info@udms.netInternet: www.udms.net30 May FMEdays 2013Malmo, SwedenE-mail: fme@conterra.deInternet: www.fmedays.de/index_en.shtmJune03-06 June Hexagon 2013 (ERDAS, Intergraph,Leica, Metrology)Las Vegas, NV, U.S.A.Internet: http://2012.hexagonconference.com03-07 June 11th Vespucci Institute “Ontologiesand models for integrated assessments of multiple-scaleprocesses”Fiesole, ItalyE-mail: info@vespucci.orgInternet: www.vespucci.org04 June FMEdays 2013Barcelona, SpainE-mail: fme@conterra.deInternet: www.fmedays.de/index_en.shtm06 June FMEdays 2013Madrid, SpainE-mail: fme@conterra.deInternet: www.fmedays.de/index_en.shtm11-12 June MapInfo Professional Advanced LevelTraining CourseCDR Group, Hope, Derbyshire, U.K.E-mail: sales@cdrgroup.co.ukInternet: www.cdrgroup.co.uk/train_mi3info.htmPlease feel free to e-mail your calendar notices to: calendar@geoinformatics.comAdvertisers IndexDATEM www.datem.com 16ERDAS www.erdas.com 9Esri www.esri.com 52FOIF www.foif.com.cn 41Geneq www.geneq.com 20GEO-North/GEO-South www.pvpubs.com 26GIS Research UK 2013 http://liverpool.gisruk.org 39International Forum www.sovzondconference.ru 45Leica Geosystems www.leica-geosystems.com 2Microsoft UltraCam www.iFlyUltraCam.com 13Optech www.optech.com 51Pacific Crest www.pacificcrest.com/adl 17Riegl www.riegl.com 24SPAR www.sparpointgroup.com 27SuperMap www.supermap.com 49Topcon www.topcon.eu 2150January/February 2013