Ce l l u l a r r e s p o n s e s t o d e s i c c at i o nCultivation studiesDiscs (~ 5 mm diameter) were cut out of desiccated colonies andplaced on MEA for revival studies. These experiments were carriedout in triplicate.TEM and SEM studiesColonies were fixed in 4 % (v/v) glutaraldehyde in 0.1 M sodiumpotassium-phosphatebuffer (pH 7.2) for 2 h at room temperatureand post-fixed in 2 % (w/v) OsO 4overnight. An ethanol solutionsseries (v/v) of 30 % for 30 min, twice 50 % for 30 min, 70 % for 30min, overnight at 80 %, 1 h at 90 % 1 h and absolute ethanol 30 minwas used for dehydration. Spurr resin was used for embedding,sections were cut with an ultra-microtome. Uranyl acetate and leadcitrate were used to enhance contrast (Reynolds 1963). Cryo-SEM(Hitachi S-320M, Tokyo, Japan equipped with an Oxford CT 1500Cryostation, Oxford Instruments, U.K.) was used to examine thecolonies in their native status with undisturbed extracellular matrix.Lipid analysisColonies were homogenised and extracted at room temperaturewith chloroform / methanol (1:2) (Bligh & Dyer 1959). Lipidswere fractionated on a silica-gel column eluted with chloroform,acetone, and methanol (Kates 1972). High-performance thin-layerchromatography (HPTLC) was conducted on pre-coated silicagel 60 plates (Merck, Darmstadt, Germany). Phospholipids wereanalysed by two-dimensional HPTLC according to the method ofVaskovsky & Terekhova (1979) using chloroform / methanol / toluene/ 28 % ammonia (65:30:10:6) and chloroform / methanol / toluene/ acetone / acetic acid / water (70:30:10:5:4:1) in the first and thesecond dimensions, respectively. Neutral lipids were separated byone-dimensional HPTLC. Toluene / hexane / formic acid (140:60:1)and hexane / diethyl ether / formic acid (60:40:1) mixtures wereused sequentially as the mobile phases. The lipid spots werevisualized by spraying with 5 % sulphuric acid in methanol. Thecontents of the individual classes of phospholipids and neutrallipids were determined by estimating phosphorus (Vaskovsky etal. 1975) and carbon (Kabara & Chen 1976), respectively. Four<strong>fungal</strong> replicates were prepared and each was sampled threetimes. Fatty acids were extracted using a method recommendedfor the Sherlock Microbial Identification System (MIDI Inc., Newark,Delaware, U.S.A.) which involves saponification of cellular lipdsin hot NaOH / methanol, methylation of fatty acids with hot HCl /methanol, and extraction with hexane – methyl –tert-butyl ether. Themethylated fatty acids were analysed by gas chromatography (GC6890 Agilent Technologies, Santa Clara, CA, U.S.A.) and identifiedin comparison with bacterial acid methyl esters mix (Sigma-Aldrich47080-U, St. Louis, MO, U.S.A.).Carotenoid analysisMethanolic extracts were separated by HPLC using a mixture ofacetonitrile / tetrahydrofuran / water (5:3:1, v/v/v) at a flow rate of1 mL / min using a C18 column (Nucleosil 100 RP 18 5 μm; 4,8 x250 mm; Varian, Palo Alto, Ca, U.S.A.) and a diode-array detector.Carotenoids were identified by comparisons of retention times andspectral characteristics to those of pure compounds and literaturedata. Quantitative spectrophotometric analyses were performed onmethanolic extracts that were re-extracted with hexane. Phytoenewww.studiesinmycology.orgconcentrations were calculated by using its specific extinctioncoefficient E 1 % = 1100 (Foppen 1971). Carotenoids that absorb1cmvisible radiation (red carotenoids) were quantified by using E 1 % = 1cm3240 for torulene (Foppen 1971).RESULTSWater lossIn colonies subjected to fast desiccation (FD), constant weight(corresponding to the complete loss of free water) was reached in2 to 3 h. In contrast, colonies left to dry on agar (slow desiccation –SD), more than 80 h was necessary to achieve the same result. Asa consequence, <strong>fungal</strong> metabolic activities were rapidly terminatedin the first treatment (FD), but only slowly declined in the latter (SD).After 7 d, all colonies were completely desiccated and this statuswas maintained for 8 wks under both FD and SD conditions.MorphologyColonies of control samples consisted of mostly grossly deformedand highly-stressed cells that contained only a limited number oflipid globules. Nevertheless, the intracellular membranes werepreserved and the cytoplasm remained granular. An overwhelmingmajority of desiccated cells had lost turgor, contained an increasednumber of lipid globules (Fig. 1B). Nuclei and intracellularmembranous structures were not always visible, the cytoplasmwas not evident and mostly replaced by lipid inclusions (abundantcoalescing lipid droplets as shown in Fig. 1B). Although the shapeof the cells was restored in rehydrated colonies, intracellularstructures were not always re-formed and only some cells showedfully functional granular cytoplasm and intracellular membranes(Fig. 1C,D). Budding cells were observed in rehydrated colonies(Fig. 2). Nevertheless, lipid inclusions were the most obviousfeature of dehydrated cells subjected to FD and SD.Colonies of A95 were examined by cryo-SEM to reveal extracellularslime (Fig. 3). Following rehydration, external layers of thecell walls were remarkably swollen (Figs 1C,D), showing that theextra-cellular matrix of A95 was capable of rapidly absorbing largeamounts of water.Lipid compositionThe lipid fraction comprised of monoacylglycerols, 1,2- and1,3,-diacylglycerols, triacylglycerols, phosphotidincholine,phosphatidlethanolamine, phosphatidylinositole, phosphatidicacids and sterols (both sterol esters and free fatty acids). Fattyacids were mostly unsaturated C16:0, and C18:0 althoughsome C18:2 were present. These lipids play strikingly differentphysiological roles including in membranes [phosphatidylcholine(PC), phosphatidylethanolamine (PE), sterols (S)] and as reservesor neutral lipids [diacyl- and triacyl-glycerols, sterol ethers (SE) andfree fatty acids (FA)].Lipid contents varied significantly between samples that weresubjected to fast- or slow-desiccation (cf. Figs 4, 5). Colonies thatwere desiccated slowly lost the major part of their sterols duringdrying (Fig. 4A), whereas those that dried rapidly maintained astable level of membrane lipids (Fig. 4B). The different rehydrationregimes only magnified these differences: major membranelipids like phosphatidylcholine and phosphatidylethanolamine93
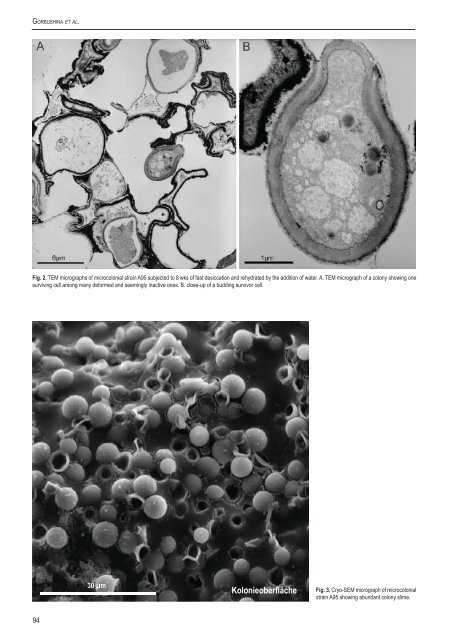
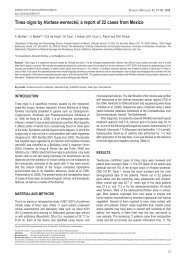
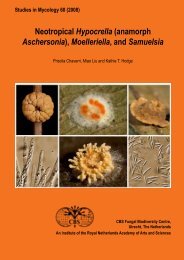
Go r b u s h i n a e t a l.Fig. 2. TEM micrographs of microcolonial strain A95 subjected to 8 wks of fast desiccation and rehydrated by the addition of water. A. TEM micrograph of a colony showing onesurviving cell among many deformed and seemingly inactive ones. B. close-up of a budding survivor cell.30 µmKolonieoberflächeFig. 3. Cryo-SEM micrograph of microcolonialstrain A95 showing abundant colony slime.94