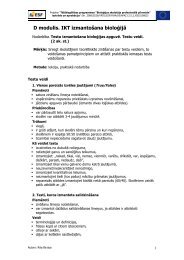
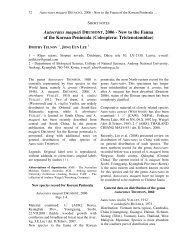
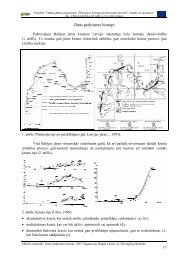
304 L. Davies et al. / Environmental Pollution 146 (2007) 299e310Fig. 3. CCA results. Lichen <strong>and</strong> bryophyte distribution <strong>in</strong> relation <strong>to</strong> environmental variables. Nitrophytes are largely associated with transport pollutants <strong>and</strong> acidophyteswith bark pH (designation after van Herk, 2002).species (lichens <strong>and</strong> two mosses, 76 species) <strong>in</strong> each class <strong>and</strong>the number <strong>of</strong> first records (the first time a species was recorded)<strong>in</strong> each class (Fig. 4). There was a significant <strong>in</strong>verserelationship between NO x <strong>and</strong> diversity (r ¼ 0.80, p < 0.001,n ¼ 15) <strong>and</strong> first records with<strong>in</strong> each class (r ¼ 0.85,p < 0.05, n ¼ 6), (Fig. 4). <strong>Diversity</strong> was highest (60 species)<strong>in</strong> the first two classes (50e69 mg m ÿ3 ) <strong>and</strong> then decl<strong>in</strong>edwith just fourteen species rema<strong>in</strong><strong>in</strong>g above 200 mg m ÿ3 . Firstrecords were also highest at lowest concentrations, decl<strong>in</strong><strong>in</strong>g<strong>to</strong> 3e5 species <strong>in</strong> each class up <strong>to</strong> concentrations <strong>of</strong>110 mg m ÿ3 , after which there were no further first records.There was a significant positive relationship (r ¼ 0.85,p < 0.001, n ¼ 76) between abundance (number <strong>of</strong> treescolonised cover) <strong>and</strong> the highest concentration at which specieswere recorded (Fig. 4), show<strong>in</strong>g that the most NO x <strong>to</strong>lerantspecies are widely distributed <strong>and</strong> abundant. New records<strong>and</strong> rare species were generally conf<strong>in</strong>ed <strong>to</strong> areas <strong>of</strong> low NO xwhere the ratio <strong>of</strong> NO <strong>to</strong> NO x is generally at its lowest (Fig. 1).However, there were a few notable exceptions. Species <strong>to</strong>lerant<strong>of</strong> NO x , but with low abundance <strong>and</strong> not recorded <strong>in</strong> areas<strong>of</strong> low NO x were: Phaeophyscia nigricans, R<strong>in</strong>od<strong>in</strong>a gennarii,R. subexigua, Lecanora barkmaniana <strong>and</strong> L. compallens. Thelatter two were recently described from the Netherl<strong>and</strong>s <strong>and</strong>associated with roadside trees (Aptroot <strong>and</strong> van Herk, 1999;van Herk <strong>and</strong> Aptroot, 1999). R. gennarii is designateda ‘‘nitrophyte’’ <strong>in</strong> the Dutch scale for ammonia (van Herk,2002). R<strong>in</strong>od<strong>in</strong>a exigua was also recorded with a high meanNO x value. These results suggest these species may be stimulatedby high NO x concentrations. However, such environmentsare generally also characterised by high levels <strong>of</strong>ammonia <strong>and</strong> particulate matter (dusts).3.2.2. NO 2Species were grouped <strong>in</strong><strong>to</strong> classes <strong>of</strong> equal size (5 mg m ÿ3<strong>in</strong>tervals) <strong>and</strong> plotted aga<strong>in</strong>st the number <strong>of</strong> species (lichens<strong>and</strong> two mosses) <strong>in</strong> each class <strong>and</strong> the number <strong>of</strong> first records<strong>in</strong> each class (Fig. 4). Biodiversity was highest (59 species)<strong>in</strong> the second class (35e39 mg m ÿ3 ) <strong>and</strong> then decl<strong>in</strong>ed with seventeenspecies rema<strong>in</strong><strong>in</strong>g <strong>in</strong> the highest class (60e64 mg m ÿ3 ).There was a significant <strong>in</strong>verse relationship between NO 2<strong>and</strong> first records (r ¼ 0.96, p < 0.01, n ¼ 5), decl<strong>in</strong><strong>in</strong>g <strong>to</strong> jus<strong>to</strong>ne (Phaeophyscia nigricans) between 50 <strong>and</strong> 54 mg m ÿ3 .Species associated with high NO 2 were generally thoseassociated with high NO x concentrations with the exception<strong>of</strong> Flavoparmelia caperata.3.2.3. PM 10Species found <strong>in</strong> areas <strong>of</strong> high PM 10 are generally the samepollution <strong>to</strong>lerant species associated with NO x <strong>and</strong> SO 2 , withthe exception <strong>of</strong> Phlyctis argena <strong>and</strong> Micarea pras<strong>in</strong>a. The
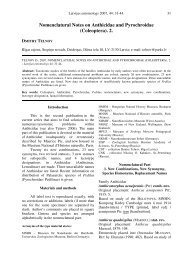
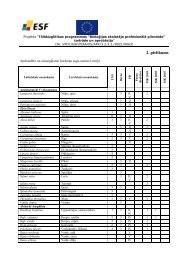
L. Davies et al. / Environmental Pollution 146 (2007) 299e310305Fig. 4. (a) <strong>Diversity</strong> <strong>and</strong> first records as a function <strong>of</strong> NO x (mgm ÿ3 ) (<strong>Diversity</strong>: r ¼ 0.8, p < 0.001, n ¼ 15; First records: r ¼ 0.85, p < 0.05, n ¼ 6); (b) Lichenabundance (trees colonised cover) <strong>and</strong> maximum concentrations <strong>of</strong> NO x (mgm ÿ3 ). Species recorded at concentrations above 200 mg m ÿ3 from left <strong>to</strong> right are:Physcia nigricans, Lepraria <strong>in</strong>cana, Scoliciosporum chlorococcum, Lecanora dispersa, Melanelia subaurifera, Xanthoria c<strong>and</strong>elaria, Parmelia sulcata, Lecanoraexpallens, Am<strong>and</strong><strong>in</strong>ea punctata, Physica tenella, Xanthoria polycarpa, X. pariet<strong>in</strong>a, Physcia orbicularis, P. adscendens (r ¼ 0.85, p < 0.001, n ¼ 76). (c) Biodiversity<strong>and</strong> first records as a function <strong>of</strong> <strong>in</strong>creas<strong>in</strong>g NO 2 (mgm ÿ3 ) (First records: r ¼ 0.96, p < 0.01, n ¼ 5).