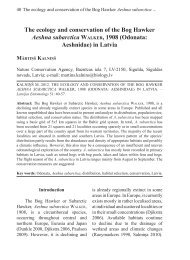
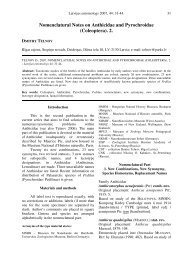
300 L. Davies et al. / Environmental Pollution 146 (2007) 299e310a computer-based model <strong>of</strong> dispersion <strong>in</strong> the atmosphere.The modell<strong>in</strong>g results were validated aga<strong>in</strong>st hourly datafrom 24 AUN moni<strong>to</strong>r<strong>in</strong>g stations <strong>in</strong> <strong>London</strong> <strong>and</strong> are generallyconsistent with measurements (Fig. 1) although annualmean NO x may under-predict, particularly at high concentrations(Carruthers et al., 2003). The spatial patterns <strong>of</strong> NO x<strong>and</strong> NO 2 <strong>in</strong> <strong>London</strong> are shown (Fig. 2). NO x concentrationsexceeded 100 mg m ÿ3 throughout central <strong>London</strong>. Particulatematter <strong>in</strong> <strong>London</strong>, measured as PM 10 , <strong>in</strong>cludes elemental carbon,organic compounds, CaSO 4 , NaCl, NaNO 3 , (NH 4 ) 2 SO 4 ,Fe-rich particulates, other metals, spores, <strong>and</strong> bound water(AQEG, 2005). Annual average concentrations across thestudy area ranged from 24e31 mg m ÿ3 (Fig. 2). Annual averageconcentrations <strong>of</strong> sulphur dioxide have fallen froma high <strong>of</strong> over 350 mg m ÿ3 <strong>in</strong> central <strong>London</strong> <strong>in</strong> 1970(GLA, 2002), <strong>to</strong> less than 10 mg m ÿ3 (Fig. 2). Higher SO 2concentrations are emitted from road transport <strong>in</strong> <strong>London</strong>than nationally (GLA, 2002), with annual average SO 2 nowreflect<strong>in</strong>g a similar distribution pattern <strong>to</strong> other transportpollutants. Industries, ma<strong>in</strong>ly located <strong>to</strong> the south-east <strong>of</strong><strong>London</strong> generate occasional short-term peak concentrationswhich may reach 200 mg m ÿ3 (15-m<strong>in</strong> mean) <strong>in</strong> the <strong>London</strong>area (ERG, 2002) <strong>and</strong> could affect the distribution <strong>of</strong> sensitivespecies.The <strong>in</strong>troduction <strong>of</strong> the three-way catalyst system <strong>of</strong> mo<strong>to</strong>rvehicles has resulted <strong>in</strong> a significant amount <strong>of</strong> ammonia be<strong>in</strong>gemitted from vehicle exhausts, particularly from slow-mov<strong>in</strong>gtraffic (Cape et al., 2004). Annual average concentrations measuredat a s<strong>in</strong>gle station <strong>in</strong> central <strong>London</strong> are consistent at ca5 mg m ÿ3 (UK National Ammonia Network). More recentbi-monthly measurements (12 month period) at a roundabout<strong>in</strong> outer <strong>London</strong> reached 9 mg m ÿ3 <strong>and</strong> averaged 7 mg m ÿ3 ,with background concentrations at 3 mg m ÿ3 (James <strong>and</strong>Davies, 2005). Insufficient emissions data exist <strong>to</strong> model <strong>and</strong>analyse ammonia at a f<strong>in</strong>e scale, but it is an important source<strong>of</strong> <strong>nitrogen</strong> <strong>in</strong> <strong>London</strong> <strong>and</strong> has been modelled us<strong>in</strong>g FRAME(S<strong>in</strong>gles et al., 1998). These data were therefore <strong>in</strong>cluded <strong>in</strong>the analysis. A small sample <strong>of</strong> climatic variables wasFig. 1. (a) annual average NO x (1999) from 24 Au<strong>to</strong>mated Urban Network Sites <strong>in</strong> <strong>London</strong> <strong>in</strong> relation <strong>to</strong> outputs from ADMS-urban (r ¼ 0.96, p < 0.001, n ¼ 24)(Carruthers et al., 2003). (b). NO 2 as a function <strong>of</strong> <strong>in</strong>creas<strong>in</strong>g NO x (mgm ÿ3 ), (r ¼ 0.967, p < 0.001, n ¼ 334).
L. Davies et al. / Environmental Pollution 146 (2007) 299e310301Fig. 2. (aec) Maps <strong>of</strong> annual average pollutant concentrations (mgm ÿ3 ). (a) NO 2 , (b) PM 10 , (c) SO 2 . ADMS-Urban, 1999 (a,b) <strong>and</strong> 1996 (c). Sources: Carrutherset al., 2003 (a,b), Environment Agency, 2002 (c). (d) Map <strong>of</strong> 32 <strong>London</strong> Boroughs <strong>and</strong> the City <strong>of</strong> <strong>London</strong> illustrat<strong>in</strong>g the locations <strong>of</strong> the survey sites (Arc GIS v9).<strong>in</strong>vestigated us<strong>in</strong>g <strong>in</strong>formation provided by the MeteorologicalOffice for the years 1995 <strong>and</strong> 2000.This study uses these data sets <strong>in</strong> order <strong>to</strong> <strong>in</strong>vestigate therelationship between the distribution <strong>and</strong> diversity <strong>of</strong> <strong>epiphytes</strong>on Frax<strong>in</strong>us excelsior (European ash) <strong>in</strong> <strong>London</strong> <strong>and</strong>EU Limit Values (European Commission, 1996) for sulphurdioxide (SO 2 ) <strong>and</strong> <strong>oxides</strong> <strong>of</strong> <strong>nitrogen</strong> (NO x ) <strong>to</strong> protect sensitivevegetation <strong>and</strong> ecosystems. <strong>London</strong> does not exceed theLimit Value (LV) for SO 2 <strong>of</strong> 20 mg m ÿ3 , but exceeds theNO x LV <strong>of</strong> 30 mg m ÿ3 (GLA, 2002). Although these LVs arenot applicable <strong>in</strong> large conurbations at the present time, theyare nonetheless relevant <strong>to</strong> <strong>London</strong>’s natural environment.The results are also discussed <strong>in</strong> relation <strong>to</strong> the potentialrole <strong>of</strong> lichens <strong>and</strong> bryophytes as biomoni<strong>to</strong>rs <strong>of</strong> transport pollution,primarily as NO x . As far as we know this is the firstsemi-quantitative study <strong>of</strong> epiphytic diversity <strong>and</strong> distributionus<strong>in</strong>g f<strong>in</strong>e-scale modelled, validated data able <strong>to</strong> represent thefast chemistry <strong>and</strong> dispersion characteristics that occur withvehicle-emitted NO x .2. Materials <strong>and</strong> methods2.1. Location<strong>London</strong> is characterised by the highest concentrations <strong>of</strong> <strong>nitrogen</strong> dioxide(NO 2 ) <strong>in</strong> the U.K. <strong>and</strong> transport is the major emission source (GLA, 2002). Itis therefore an appropriate location <strong>to</strong> <strong>in</strong>vestigate the effects <strong>of</strong> NO x. A representativesample <strong>of</strong> <strong>London</strong>’s epiphytic flora was obta<strong>in</strong>ed by select<strong>in</strong>g trees <strong>in</strong>public parks <strong>and</strong> open spaces <strong>in</strong> each <strong>of</strong> the 32 <strong>London</strong> Boroughs <strong>and</strong> the City<strong>of</strong> <strong>London</strong> (Fig. 2).2.2. Survey approach <strong>and</strong> methodologyA s<strong>in</strong>gle tree species, ash (Frax<strong>in</strong>us excelsior L.), the most widely availablespecies <strong>in</strong> the study area, was selected <strong>to</strong> reduce the <strong>in</strong>fluence <strong>of</strong> barkrelated variables (Barkman, 1958; James et al., 1977). Sites were preferentiallyselected where healthy, upright trees <strong>of</strong> open aspect were available<strong>in</strong> habitats correspond<strong>in</strong>g primarily <strong>to</strong> urban parks <strong>and</strong> recreation areas,but <strong>in</strong> their absence country parks, woodl<strong>and</strong> edge <strong>and</strong> roadside sites werealso surveyed. The sizes <strong>and</strong> shapes <strong>of</strong> the parks ranged from small localparks (<strong>of</strong> about one acre or less) <strong>to</strong> large circular <strong>and</strong> oblong parks suchas Regent’s Park, Westm<strong>in</strong>ster (central <strong>London</strong>), which extends over500 acres.Most trees <strong>in</strong> <strong>London</strong> carry only algae; therefore, <strong>to</strong> <strong>in</strong>vestigate diversityit was necessary <strong>to</strong> record from trees carry<strong>in</strong>g additional epiphytic flora.Trees were selected <strong>to</strong> be a m<strong>in</strong>imum distance <strong>of</strong> 100 m from the road,thus the localities are termed ‘‘background’’ sites. The first trees meet<strong>in</strong>gthe selection criteria <strong>and</strong> carry<strong>in</strong>g species other than algae were recorded.Records were taken from a m<strong>in</strong>imum <strong>of</strong> eight trees <strong>in</strong> each borough. Frequentlythere were fewer than eight trees at a locality <strong>and</strong> therefore twoor three different sites were surveyed with<strong>in</strong> a borough before sufficient treeswere found.In <strong>to</strong>tal 334 trees were surveyed dur<strong>in</strong>g 2002 <strong>and</strong> 2003. The position <strong>of</strong>each tree <strong>and</strong> associated flora was geo-referenced us<strong>in</strong>g a GPS (Magellan,2002). The girth <strong>of</strong> each tree was measured at 150 cm above ground. Treegirths ranged from 20 <strong>to</strong> 350 cm with a mean <strong>of</strong> 97 cm. Girth sizes were