Diversity and sensitivity of epiphytes to oxides of nitrogen in London
Diversity and sensitivity of epiphytes to oxides of nitrogen in London
Diversity and sensitivity of epiphytes to oxides of nitrogen in London

You also want an ePaper? Increase the reach of your titles
YUMPU automatically turns print PDFs into web optimized ePapers that Google loves.
Environmental Pollution 146 (2007) 299e310www.elsevier.com/locate/envpol<strong>Diversity</strong> <strong>and</strong> <strong>sensitivity</strong> <strong>of</strong> <strong>epiphytes</strong> <strong>to</strong> <strong>oxides</strong> <strong>of</strong> <strong>nitrogen</strong> <strong>in</strong> <strong>London</strong>L. Davies a,b, *, J.W. Bates a , J.N.B. Bell a , P.W. James b , O.W. Purvis ba Centre for Environmental Policy, South Kens<strong>in</strong>g<strong>to</strong>n Campus, Imperial College <strong>London</strong>, <strong>London</strong> SW7 2AZ, UKb Natural His<strong>to</strong>ry Museum, <strong>London</strong> SW7 5BD, UKReceived 15 Oc<strong>to</strong>ber 2005; accepted 10 March 2006Epiphytic biodiversity <strong>in</strong> <strong>London</strong> is related <strong>to</strong> ambient NO x .AbstractThis study <strong>in</strong>vestigated the distribution <strong>and</strong> diversity <strong>of</strong> <strong>epiphytes</strong> <strong>in</strong> <strong>London</strong> <strong>in</strong> relation <strong>to</strong> NO x us<strong>in</strong>g f<strong>in</strong>e-scale atmospheric dispersion modell<strong>in</strong>g.The survey recorded over 3000 <strong>epiphytes</strong> from 334 trees (Frax<strong>in</strong>us excelsior) represent<strong>in</strong>g 74 lichen, 14 moss, 7 fungal <strong>and</strong> 3 algal species.There was a significant <strong>in</strong>verse relationship between diversity <strong>and</strong> NO x . <strong>Diversity</strong> decl<strong>in</strong>ed where NO x exceeded 70 mg m ÿ3 <strong>and</strong> NO 2exceeded 40 mg m ÿ3 , suggest<strong>in</strong>g a phy<strong>to</strong><strong>to</strong>xic effect. However, there was a significant positive relationship between NO x <strong>and</strong> lichen abundancedue <strong>to</strong> the ubiqui<strong>to</strong>us distribution <strong>of</strong> pollution <strong>to</strong>lerant species, ma<strong>in</strong>ly associated with eutrophication. A scale <strong>of</strong> lichen <strong>sensitivity</strong> <strong>to</strong> NO x hasbeen derived.Ó 2006 Elsevier Ltd. All rights reserved.Keywords: Air pollution; Biodiversity; Biomoni<strong>to</strong>r<strong>in</strong>g; Lichen; NO x1. IntroductionThe last major work on the lichen flora <strong>of</strong> <strong>London</strong>(Laundon, 1970) reported very low diversity attributed ma<strong>in</strong>ly<strong>to</strong> <strong>sensitivity</strong> <strong>to</strong> sulphur dioxide. The current study <strong>in</strong>vestigatesthe distribution <strong>and</strong> diversity <strong>of</strong> epiphytic species <strong>in</strong> <strong>London</strong>under contemporary conditions. Emissions <strong>of</strong> <strong>oxides</strong> <strong>of</strong> <strong>nitrogen</strong>(NO x ) <strong>in</strong> <strong>London</strong> have changed very little over the period,but the sources <strong>and</strong> emission heights are now quite different(GLA, 2002). His<strong>to</strong>rically, NO x was emitted at chimney height<strong>and</strong> was a product <strong>of</strong> domestic <strong>and</strong> <strong>in</strong>dustrial coal burn<strong>in</strong>g.NO x <strong>in</strong> <strong>London</strong> is nowadays ma<strong>in</strong>ly emitted from vehicles atground level where dispersion is <strong>of</strong>ten impeded, particularly<strong>in</strong> narrow streets <strong>and</strong> at major road junctions (Colvile et al.,2001; Arnold et al., 2005). Emissions are primarily (ca 75e95%),<strong>in</strong> the form <strong>of</strong> nitric oxide (AQEG, 2004). NO is rapidly converted<strong>to</strong> NO 2 , where sufficient ozone exists, but <strong>in</strong> urbanareas ozone is <strong>of</strong>ten relatively depleted <strong>and</strong> NO may rema<strong>in</strong>* Correspond<strong>in</strong>g author. Tel.: þ44 20 7594 9295.E-mail address: l<strong>in</strong>da.davies@imperial.ac.uk (L. Davies).unusually elevated (Clapp <strong>and</strong> Jenk<strong>in</strong>, 2001). Areas <strong>of</strong> highestNO x are located at the roadside <strong>and</strong> where major transportroutes converge. NO 2 is rapidly dispersed away from roads,decreas<strong>in</strong>g by ca. 70% with<strong>in</strong> 20e30 m <strong>of</strong> the roadside(AQEG, 2004). The ratio <strong>of</strong> NO 2 <strong>to</strong> NO x is ca 0.25 at urbanroadside, ca. 0.5 at urban background <strong>and</strong> greater <strong>in</strong> rural areas(AQEG, 2004). It is therefore very important that any study <strong>of</strong><strong>epiphytes</strong> <strong>in</strong> relation <strong>to</strong> transport pollutants uses data appropriate<strong>to</strong> the location <strong>of</strong> the species under <strong>in</strong>vestigation.<strong>London</strong> has a comprehensive air pollution moni<strong>to</strong>r<strong>in</strong>g networkma<strong>in</strong>ta<strong>in</strong>ed <strong>to</strong> national st<strong>and</strong>ards under the Au<strong>to</strong>matedUrban Network (AUN: DEFRA, 2004). Data collected atwidely spaced stations generally provide a good <strong>in</strong>dication<strong>of</strong> ambient concentrations, but, ow<strong>in</strong>g <strong>to</strong> the rapid chemicaltransformations <strong>and</strong> variable dispersion characteristics across<strong>London</strong>, these measurements are not fully representative <strong>of</strong>the extent <strong>of</strong> the spatial variations experienced <strong>in</strong> this city.Measurements are therefore supplemented by data obta<strong>in</strong>edfrom atmospheric dispersion modell<strong>in</strong>g <strong>and</strong> validated aga<strong>in</strong>stlocal real-time measurements.Pollution data applied <strong>in</strong> this study were generated byCarruthers et al. (2003) us<strong>in</strong>g ADMS-urban (CERC, 2001),0269-7491/$ - see front matter Ó 2006 Elsevier Ltd. All rights reserved.doi:10.1016/j.envpol.2006.03.023
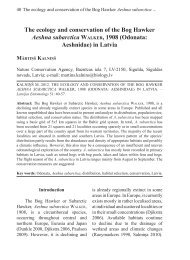
300 L. Davies et al. / Environmental Pollution 146 (2007) 299e310a computer-based model <strong>of</strong> dispersion <strong>in</strong> the atmosphere.The modell<strong>in</strong>g results were validated aga<strong>in</strong>st hourly datafrom 24 AUN moni<strong>to</strong>r<strong>in</strong>g stations <strong>in</strong> <strong>London</strong> <strong>and</strong> are generallyconsistent with measurements (Fig. 1) although annualmean NO x may under-predict, particularly at high concentrations(Carruthers et al., 2003). The spatial patterns <strong>of</strong> NO x<strong>and</strong> NO 2 <strong>in</strong> <strong>London</strong> are shown (Fig. 2). NO x concentrationsexceeded 100 mg m ÿ3 throughout central <strong>London</strong>. Particulatematter <strong>in</strong> <strong>London</strong>, measured as PM 10 , <strong>in</strong>cludes elemental carbon,organic compounds, CaSO 4 , NaCl, NaNO 3 , (NH 4 ) 2 SO 4 ,Fe-rich particulates, other metals, spores, <strong>and</strong> bound water(AQEG, 2005). Annual average concentrations across thestudy area ranged from 24e31 mg m ÿ3 (Fig. 2). Annual averageconcentrations <strong>of</strong> sulphur dioxide have fallen froma high <strong>of</strong> over 350 mg m ÿ3 <strong>in</strong> central <strong>London</strong> <strong>in</strong> 1970(GLA, 2002), <strong>to</strong> less than 10 mg m ÿ3 (Fig. 2). Higher SO 2concentrations are emitted from road transport <strong>in</strong> <strong>London</strong>than nationally (GLA, 2002), with annual average SO 2 nowreflect<strong>in</strong>g a similar distribution pattern <strong>to</strong> other transportpollutants. Industries, ma<strong>in</strong>ly located <strong>to</strong> the south-east <strong>of</strong><strong>London</strong> generate occasional short-term peak concentrationswhich may reach 200 mg m ÿ3 (15-m<strong>in</strong> mean) <strong>in</strong> the <strong>London</strong>area (ERG, 2002) <strong>and</strong> could affect the distribution <strong>of</strong> sensitivespecies.The <strong>in</strong>troduction <strong>of</strong> the three-way catalyst system <strong>of</strong> mo<strong>to</strong>rvehicles has resulted <strong>in</strong> a significant amount <strong>of</strong> ammonia be<strong>in</strong>gemitted from vehicle exhausts, particularly from slow-mov<strong>in</strong>gtraffic (Cape et al., 2004). Annual average concentrations measuredat a s<strong>in</strong>gle station <strong>in</strong> central <strong>London</strong> are consistent at ca5 mg m ÿ3 (UK National Ammonia Network). More recentbi-monthly measurements (12 month period) at a roundabout<strong>in</strong> outer <strong>London</strong> reached 9 mg m ÿ3 <strong>and</strong> averaged 7 mg m ÿ3 ,with background concentrations at 3 mg m ÿ3 (James <strong>and</strong>Davies, 2005). Insufficient emissions data exist <strong>to</strong> model <strong>and</strong>analyse ammonia at a f<strong>in</strong>e scale, but it is an important source<strong>of</strong> <strong>nitrogen</strong> <strong>in</strong> <strong>London</strong> <strong>and</strong> has been modelled us<strong>in</strong>g FRAME(S<strong>in</strong>gles et al., 1998). These data were therefore <strong>in</strong>cluded <strong>in</strong>the analysis. A small sample <strong>of</strong> climatic variables wasFig. 1. (a) annual average NO x (1999) from 24 Au<strong>to</strong>mated Urban Network Sites <strong>in</strong> <strong>London</strong> <strong>in</strong> relation <strong>to</strong> outputs from ADMS-urban (r ¼ 0.96, p < 0.001, n ¼ 24)(Carruthers et al., 2003). (b). NO 2 as a function <strong>of</strong> <strong>in</strong>creas<strong>in</strong>g NO x (mgm ÿ3 ), (r ¼ 0.967, p < 0.001, n ¼ 334).
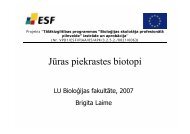
L. Davies et al. / Environmental Pollution 146 (2007) 299e310301Fig. 2. (aec) Maps <strong>of</strong> annual average pollutant concentrations (mgm ÿ3 ). (a) NO 2 , (b) PM 10 , (c) SO 2 . ADMS-Urban, 1999 (a,b) <strong>and</strong> 1996 (c). Sources: Carrutherset al., 2003 (a,b), Environment Agency, 2002 (c). (d) Map <strong>of</strong> 32 <strong>London</strong> Boroughs <strong>and</strong> the City <strong>of</strong> <strong>London</strong> illustrat<strong>in</strong>g the locations <strong>of</strong> the survey sites (Arc GIS v9).<strong>in</strong>vestigated us<strong>in</strong>g <strong>in</strong>formation provided by the MeteorologicalOffice for the years 1995 <strong>and</strong> 2000.This study uses these data sets <strong>in</strong> order <strong>to</strong> <strong>in</strong>vestigate therelationship between the distribution <strong>and</strong> diversity <strong>of</strong> <strong>epiphytes</strong>on Frax<strong>in</strong>us excelsior (European ash) <strong>in</strong> <strong>London</strong> <strong>and</strong>EU Limit Values (European Commission, 1996) for sulphurdioxide (SO 2 ) <strong>and</strong> <strong>oxides</strong> <strong>of</strong> <strong>nitrogen</strong> (NO x ) <strong>to</strong> protect sensitivevegetation <strong>and</strong> ecosystems. <strong>London</strong> does not exceed theLimit Value (LV) for SO 2 <strong>of</strong> 20 mg m ÿ3 , but exceeds theNO x LV <strong>of</strong> 30 mg m ÿ3 (GLA, 2002). Although these LVs arenot applicable <strong>in</strong> large conurbations at the present time, theyare nonetheless relevant <strong>to</strong> <strong>London</strong>’s natural environment.The results are also discussed <strong>in</strong> relation <strong>to</strong> the potentialrole <strong>of</strong> lichens <strong>and</strong> bryophytes as biomoni<strong>to</strong>rs <strong>of</strong> transport pollution,primarily as NO x . As far as we know this is the firstsemi-quantitative study <strong>of</strong> epiphytic diversity <strong>and</strong> distributionus<strong>in</strong>g f<strong>in</strong>e-scale modelled, validated data able <strong>to</strong> represent thefast chemistry <strong>and</strong> dispersion characteristics that occur withvehicle-emitted NO x .2. Materials <strong>and</strong> methods2.1. Location<strong>London</strong> is characterised by the highest concentrations <strong>of</strong> <strong>nitrogen</strong> dioxide(NO 2 ) <strong>in</strong> the U.K. <strong>and</strong> transport is the major emission source (GLA, 2002). Itis therefore an appropriate location <strong>to</strong> <strong>in</strong>vestigate the effects <strong>of</strong> NO x. A representativesample <strong>of</strong> <strong>London</strong>’s epiphytic flora was obta<strong>in</strong>ed by select<strong>in</strong>g trees <strong>in</strong>public parks <strong>and</strong> open spaces <strong>in</strong> each <strong>of</strong> the 32 <strong>London</strong> Boroughs <strong>and</strong> the City<strong>of</strong> <strong>London</strong> (Fig. 2).2.2. Survey approach <strong>and</strong> methodologyA s<strong>in</strong>gle tree species, ash (Frax<strong>in</strong>us excelsior L.), the most widely availablespecies <strong>in</strong> the study area, was selected <strong>to</strong> reduce the <strong>in</strong>fluence <strong>of</strong> barkrelated variables (Barkman, 1958; James et al., 1977). Sites were preferentiallyselected where healthy, upright trees <strong>of</strong> open aspect were available<strong>in</strong> habitats correspond<strong>in</strong>g primarily <strong>to</strong> urban parks <strong>and</strong> recreation areas,but <strong>in</strong> their absence country parks, woodl<strong>and</strong> edge <strong>and</strong> roadside sites werealso surveyed. The sizes <strong>and</strong> shapes <strong>of</strong> the parks ranged from small localparks (<strong>of</strong> about one acre or less) <strong>to</strong> large circular <strong>and</strong> oblong parks suchas Regent’s Park, Westm<strong>in</strong>ster (central <strong>London</strong>), which extends over500 acres.Most trees <strong>in</strong> <strong>London</strong> carry only algae; therefore, <strong>to</strong> <strong>in</strong>vestigate diversityit was necessary <strong>to</strong> record from trees carry<strong>in</strong>g additional epiphytic flora.Trees were selected <strong>to</strong> be a m<strong>in</strong>imum distance <strong>of</strong> 100 m from the road,thus the localities are termed ‘‘background’’ sites. The first trees meet<strong>in</strong>gthe selection criteria <strong>and</strong> carry<strong>in</strong>g species other than algae were recorded.Records were taken from a m<strong>in</strong>imum <strong>of</strong> eight trees <strong>in</strong> each borough. Frequentlythere were fewer than eight trees at a locality <strong>and</strong> therefore twoor three different sites were surveyed with<strong>in</strong> a borough before sufficient treeswere found.In <strong>to</strong>tal 334 trees were surveyed dur<strong>in</strong>g 2002 <strong>and</strong> 2003. The position <strong>of</strong>each tree <strong>and</strong> associated flora was geo-referenced us<strong>in</strong>g a GPS (Magellan,2002). The girth <strong>of</strong> each tree was measured at 150 cm above ground. Treegirths ranged from 20 <strong>to</strong> 350 cm with a mean <strong>of</strong> 97 cm. Girth sizes were
Table 1Species recorded from 334 Frax<strong>in</strong>us excelsior <strong>in</strong> <strong>London</strong> (2002e2003)LICHENS LICHENS LICHENS LICHENS BRYOPHYTES LIVERWORTSOrder: Arthoniales Lecanorales Lecanorales Teloschistales Amblystegium serpens Frullania dilatataFamily: Arthoniaceae Acarosporaceae Micareaceae Teloschistaceae BrachytheciumLophocolea bidentatarutabulumArthonia radiata (1) Strangospora p<strong>in</strong>icola (15) Micarea pras<strong>in</strong>a Caloplaca flavocitr<strong>in</strong>a (2) Dicranoweisia cirrataA. spadicea (1) Xanthoria c<strong>and</strong>elaria (235) Dicranum scoparium NON-LICHENISED FUNGIBacidiaceae Parmeliaceae X. pariet<strong>in</strong>a (415) Eurhynchium praelongum Athelia arachnoideaChrysothricaceae Bacidia arceut<strong>in</strong>a (1) Evernia prunastri (94) X. polycarpa (410) Grimmia pulv<strong>in</strong>ata Gloniopsis praelongaChrysothrix flavovirens (2) B. delicata (51) Flavoparmelia caperata (62) Hypnum <strong>and</strong>oi Hysterium pulicarisB. friesiana (1) F. soredians (22) H. cupressiforme Ionotus hispidusRocellaceae B. laurocerasi (1) Hypogymnia physodes (30) H. resup<strong>in</strong>atum Lachnella alboviolascensSchisma<strong>to</strong>mma decolorans (1) Clios<strong>to</strong>mum griffithii (2) H. tubulosa (1) Orthotrichum aff<strong>in</strong>e Lichenoccus erodensLecania cyrtella (30) Hypotrachyna revoluta (4) O. diaphanumPyrenulales L. naegelii (1) Melanelia exasperatula (2) O. lyellii ALGAEMonoblastiaceae M. glabratula (57) Rhynchostegum confertum Apatacoccus spp.Anisomeridium biforme (8) C<strong>and</strong>elariaceae M. subaurifera (211) Incertae sedis Ulota crispa Prasiola crispaC<strong>and</strong>elaria concolor (21) Parmelia sulcata (284) Trichotheliales Trentepohlia spp.C<strong>and</strong>elariella reflexa (188) Parmotrema ch<strong>in</strong>ense (34) TrichothliaceaeGyalectales C. vitell<strong>in</strong>a (144) Punctelia subrudecta (79) Por<strong>in</strong>a chlorotica (3)Gyalectaceae C. xanthostigma (3) P. ulophylla (16)Dimerella p<strong>in</strong>eti (21) Usnea cornuta (4) AnamorphicCatillariaceae Lepraria <strong>in</strong>cana (102)Catillaria chalybeia (1) Phlyctidaceae L. lobificans (2)Phlyctis argena (24)CladoniaceaeCladonia coniocraea (4) PhysciaceaeC. fimbriata (4) Am<strong>and</strong><strong>in</strong>ea punctata (335)Diploicia canescens (18)Lecanoraceae Hyperphyscia adglut<strong>in</strong>ata (39)Lecanora albella (2) Phaeophyscia orbicularis (438)L. barkmaniana (2) P. nigricans (20)L. carp<strong>in</strong>ea (38) Physcia adscendens (548)L. chlarotera (128) P. aipolia (19)L. compallens (3) P. caesia (45)L. confusa (45) P. dubia (31)L. conizaeoides (30) P. tenella (406)L. dispersaPhysconia grisea (36)agg (143).L. expallens (299) R<strong>in</strong>od<strong>in</strong>a exigua (6)L. muralis (5) R. gennarii (26)L. persimilis (4) R. subexigua (1)L. symmicta (79)Lecidella elaeochroma (134) Ramal<strong>in</strong>aceaeL. scabra (10) Ramal<strong>in</strong>a far<strong>in</strong>acea (69)Scoliciosporumchlorococcum (154)Lichen abundance (trees colonised cover value) <strong>in</strong> parentheses.L. Davies et al. / Environmental Pollution 146 (2007) 299e310303
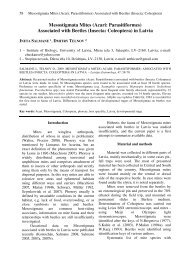
304 L. Davies et al. / Environmental Pollution 146 (2007) 299e310Fig. 3. CCA results. Lichen <strong>and</strong> bryophyte distribution <strong>in</strong> relation <strong>to</strong> environmental variables. Nitrophytes are largely associated with transport pollutants <strong>and</strong> acidophyteswith bark pH (designation after van Herk, 2002).species (lichens <strong>and</strong> two mosses, 76 species) <strong>in</strong> each class <strong>and</strong>the number <strong>of</strong> first records (the first time a species was recorded)<strong>in</strong> each class (Fig. 4). There was a significant <strong>in</strong>verserelationship between NO x <strong>and</strong> diversity (r ¼ 0.80, p < 0.001,n ¼ 15) <strong>and</strong> first records with<strong>in</strong> each class (r ¼ 0.85,p < 0.05, n ¼ 6), (Fig. 4). <strong>Diversity</strong> was highest (60 species)<strong>in</strong> the first two classes (50e69 mg m ÿ3 ) <strong>and</strong> then decl<strong>in</strong>edwith just fourteen species rema<strong>in</strong><strong>in</strong>g above 200 mg m ÿ3 . Firstrecords were also highest at lowest concentrations, decl<strong>in</strong><strong>in</strong>g<strong>to</strong> 3e5 species <strong>in</strong> each class up <strong>to</strong> concentrations <strong>of</strong>110 mg m ÿ3 , after which there were no further first records.There was a significant positive relationship (r ¼ 0.85,p < 0.001, n ¼ 76) between abundance (number <strong>of</strong> treescolonised cover) <strong>and</strong> the highest concentration at which specieswere recorded (Fig. 4), show<strong>in</strong>g that the most NO x <strong>to</strong>lerantspecies are widely distributed <strong>and</strong> abundant. New records<strong>and</strong> rare species were generally conf<strong>in</strong>ed <strong>to</strong> areas <strong>of</strong> low NO xwhere the ratio <strong>of</strong> NO <strong>to</strong> NO x is generally at its lowest (Fig. 1).However, there were a few notable exceptions. Species <strong>to</strong>lerant<strong>of</strong> NO x , but with low abundance <strong>and</strong> not recorded <strong>in</strong> areas<strong>of</strong> low NO x were: Phaeophyscia nigricans, R<strong>in</strong>od<strong>in</strong>a gennarii,R. subexigua, Lecanora barkmaniana <strong>and</strong> L. compallens. Thelatter two were recently described from the Netherl<strong>and</strong>s <strong>and</strong>associated with roadside trees (Aptroot <strong>and</strong> van Herk, 1999;van Herk <strong>and</strong> Aptroot, 1999). R. gennarii is designateda ‘‘nitrophyte’’ <strong>in</strong> the Dutch scale for ammonia (van Herk,2002). R<strong>in</strong>od<strong>in</strong>a exigua was also recorded with a high meanNO x value. These results suggest these species may be stimulatedby high NO x concentrations. However, such environmentsare generally also characterised by high levels <strong>of</strong>ammonia <strong>and</strong> particulate matter (dusts).3.2.2. NO 2Species were grouped <strong>in</strong><strong>to</strong> classes <strong>of</strong> equal size (5 mg m ÿ3<strong>in</strong>tervals) <strong>and</strong> plotted aga<strong>in</strong>st the number <strong>of</strong> species (lichens<strong>and</strong> two mosses) <strong>in</strong> each class <strong>and</strong> the number <strong>of</strong> first records<strong>in</strong> each class (Fig. 4). Biodiversity was highest (59 species)<strong>in</strong> the second class (35e39 mg m ÿ3 ) <strong>and</strong> then decl<strong>in</strong>ed with seventeenspecies rema<strong>in</strong><strong>in</strong>g <strong>in</strong> the highest class (60e64 mg m ÿ3 ).There was a significant <strong>in</strong>verse relationship between NO 2<strong>and</strong> first records (r ¼ 0.96, p < 0.01, n ¼ 5), decl<strong>in</strong><strong>in</strong>g <strong>to</strong> jus<strong>to</strong>ne (Phaeophyscia nigricans) between 50 <strong>and</strong> 54 mg m ÿ3 .Species associated with high NO 2 were generally thoseassociated with high NO x concentrations with the exception<strong>of</strong> Flavoparmelia caperata.3.2.3. PM 10Species found <strong>in</strong> areas <strong>of</strong> high PM 10 are generally the samepollution <strong>to</strong>lerant species associated with NO x <strong>and</strong> SO 2 , withthe exception <strong>of</strong> Phlyctis argena <strong>and</strong> Micarea pras<strong>in</strong>a. The
L. Davies et al. / Environmental Pollution 146 (2007) 299e310305Fig. 4. (a) <strong>Diversity</strong> <strong>and</strong> first records as a function <strong>of</strong> NO x (mgm ÿ3 ) (<strong>Diversity</strong>: r ¼ 0.8, p < 0.001, n ¼ 15; First records: r ¼ 0.85, p < 0.05, n ¼ 6); (b) Lichenabundance (trees colonised cover) <strong>and</strong> maximum concentrations <strong>of</strong> NO x (mgm ÿ3 ). Species recorded at concentrations above 200 mg m ÿ3 from left <strong>to</strong> right are:Physcia nigricans, Lepraria <strong>in</strong>cana, Scoliciosporum chlorococcum, Lecanora dispersa, Melanelia subaurifera, Xanthoria c<strong>and</strong>elaria, Parmelia sulcata, Lecanoraexpallens, Am<strong>and</strong><strong>in</strong>ea punctata, Physica tenella, Xanthoria polycarpa, X. pariet<strong>in</strong>a, Physcia orbicularis, P. adscendens (r ¼ 0.85, p < 0.001, n ¼ 76). (c) Biodiversity<strong>and</strong> first records as a function <strong>of</strong> <strong>in</strong>creas<strong>in</strong>g NO 2 (mgm ÿ3 ) (First records: r ¼ 0.96, p < 0.01, n ¼ 5).
306 L. Davies et al. / Environmental Pollution 146 (2007) 299e310latter is now abundant at roadside sites <strong>of</strong> medium traffic flow(James <strong>and</strong> Davies, 2005) <strong>and</strong> is also associated with pollution,although not specifically N or S compounds (Dobson, 2004).3.2.4. M<strong>in</strong>imum temperature <strong>and</strong> ra<strong>in</strong>fallLichen <strong>sensitivity</strong> <strong>to</strong> urban environments is well documented(Copp<strong>in</strong>s, 1973). Temperatures <strong>in</strong> <strong>London</strong> rema<strong>in</strong> 2e3 Cwarmer <strong>in</strong> the city centre <strong>and</strong> <strong>in</strong>ner suburbs throughout theyear, although temperatures <strong>in</strong> central <strong>London</strong> occasionallyfall below zero. Annual average relative humidity <strong>in</strong> <strong>London</strong>(measured at <strong>London</strong> Heathrow) varied between 73% <strong>and</strong>82% over a 27-year period (D.R. Middle<strong>to</strong>n, pers. commun.),slightly below that suggested for optimum lichen metabolismfor green algae (Nash, 1997), <strong>and</strong> <strong>in</strong> central <strong>London</strong> averaged62% dur<strong>in</strong>g August <strong>and</strong> September 2004 (A. Hudson-Smith,pers. commun.). Ra<strong>in</strong>fall fluctuates year on year, but is lower<strong>in</strong> the centre <strong>of</strong> <strong>London</strong>. Species associated with areas <strong>of</strong> highra<strong>in</strong>fall were Dimerella p<strong>in</strong>eti, Lecidella scabra <strong>and</strong> the mossEurhynchium praelongum. Species associated with low ra<strong>in</strong>fall<strong>and</strong> m<strong>in</strong>imum temperature were generally the most pollution<strong>to</strong>lerant (Fig. 3).3.2.5. Acid bark <strong>and</strong> girthThe CCA analysis identified a positive relationshipbetween the follow<strong>in</strong>g species <strong>and</strong> acid bark: Anisomeridiumbiforme, Strangospora p<strong>in</strong>icola, Hypogymnia physodes, Everniaprunastri, Ramal<strong>in</strong>a far<strong>in</strong>acea, Lepraria <strong>in</strong>cana <strong>and</strong>Parmotrema ch<strong>in</strong>ense. Most are classified as acidophytes(van Herk, 2002) <strong>and</strong> were not associated with transportpollution.Records <strong>of</strong> acidophytes (Hawksworth <strong>and</strong> Rose, 1970; vanHerk, 2002) have cont<strong>in</strong>ued <strong>to</strong> decl<strong>in</strong>e (Bates et al., 2001)<strong>and</strong> for some species distribution was relatively low (abundance<strong>in</strong> brackets) (Fig. 5): A. Lecanora conizaeoides (30),B. Hypogymnia physodes (30), but not for all: C. Everniaprunastri (94), D. Lepraria <strong>in</strong>cana (102).Fig. 5. Distribution <strong>of</strong> species associated with acidity: (a). Lecanoraconizaeoides <strong>and</strong> (b). Hypogymnia physodes (both <strong>in</strong> decl<strong>in</strong>e); (c) Everniaprunastri<strong>and</strong> (d) Lepraria <strong>in</strong>cana (both widely distributed).Large girth was important <strong>in</strong> the second CCA ord<strong>in</strong>ationaxis for Strangospora p<strong>in</strong>icola, Physconia grisea, Physciacaesia <strong>and</strong> P. dubia, species associated with eutrophication<strong>and</strong> nutrient-rich dusts (Gilbert, 1976; James et al., 1977).Lecanora carp<strong>in</strong>ea, L. confusa <strong>and</strong> L. symmicta were widelyrecorded <strong>and</strong> demonstrated a preference for trees with a smallgirth. These species are more usually conf<strong>in</strong>ed <strong>to</strong> twigs, whichwere not sampled <strong>in</strong> this study.3.3. <strong>Diversity</strong> <strong>and</strong> EU limit valuesThe critical levels <strong>to</strong> protect sensitive vegetation <strong>and</strong>ecosystems were derived ma<strong>in</strong>ly from studies carried out onhigher plants <strong>and</strong> focus on the effects <strong>of</strong> NO 2 (WHO, 2000).More recent studies <strong>in</strong>vestigate a wider range <strong>of</strong> vegetation<strong>and</strong> the impact <strong>of</strong> other N compounds as well as transport emissionsgenerally (NEGTAP, 2001; Bell <strong>and</strong> Treshow, 2002; Bignalet al., 2004). Many different approaches have been applied<strong>to</strong> <strong>in</strong>vestigate the impact <strong>of</strong> NO x <strong>in</strong> both field studies <strong>and</strong> chamberfumigation studies (Fuentes <strong>and</strong> Rowe, 1998; Bell <strong>and</strong>Treshow, 2002; Gombert et al., 2002; Batty et al., 2003; Lorenz<strong>in</strong>iet al., 2003; Purvis et al., 2003, 2004). Fumigation studieson higher plants us<strong>in</strong>g s<strong>in</strong>gle <strong>and</strong> mixed transport emissionshave identified direct <strong>to</strong>xicity effects, enhanced growth <strong>and</strong>element accumulation with vary<strong>in</strong>g degrees <strong>of</strong> <strong>sensitivity</strong> fordifferent species (NEGTAP, 2001; Bignal et al., 2004). Nitrogen-compoundsalso contribute <strong>to</strong> acidification <strong>and</strong> eutrophication(NEGTAP, 2001). Some studies suggest that exposure <strong>to</strong>mo<strong>to</strong>r vehicle exhaust has little additional <strong>in</strong>fluence comparedwith exposure <strong>to</strong> NO x alone (Bignal et al., 2004).NO has been recognised as hav<strong>in</strong>g quite dist<strong>in</strong>ct effectsfrom those attributed <strong>to</strong> NO 2 <strong>and</strong> may be the more <strong>to</strong>xic component<strong>of</strong> NO x (Wellburn, 1990; Mansfield, 2002). It is also animportant signall<strong>in</strong>g mechanism <strong>in</strong> animal cell function(Mansfield, 2002) <strong>and</strong> <strong>in</strong> plant defence mechanisms.Effects <strong>of</strong> NO 2 on lichen physiology were first demonstratedat concentrations <strong>of</strong> 3760 mg m ÿ3 <strong>and</strong> 7562 mg m ÿ3 underlabora<strong>to</strong>ry conditions (Nash, 1976). Many studies showthat traffic emissions affect lichens from the cellular <strong>to</strong> communitylevel, although the fac<strong>to</strong>rs responsible are poorly unders<strong>to</strong>od(Nash, 1988; Von Arb <strong>and</strong> Brunold, 1990; Seaward<strong>and</strong> Copp<strong>in</strong>s, 2004). Angold (1997) reported the loss <strong>of</strong> terricolouslichens near roads <strong>in</strong> the New Forest <strong>and</strong> suggested thatcompetition from faster grow<strong>in</strong>g species was a contribu<strong>to</strong>ryfac<strong>to</strong>r. Nitrogen concentrations <strong>in</strong> Physcia adscendens grow<strong>in</strong>gadjacent <strong>to</strong> roads were found <strong>to</strong> <strong>in</strong>crease with proximity<strong>to</strong> roads <strong>of</strong> high traffic flow, but not <strong>in</strong> Hypogymnia physodes(Gombert et al., 2002). NO x was considered a possible fac<strong>to</strong>rprevent<strong>in</strong>g colonisation <strong>of</strong> Parmelia saxatilis adjacent <strong>to</strong> busyroads <strong>in</strong> central <strong>London</strong> (Batty et al., 2003). Traffic flow rateswere l<strong>in</strong>ked with dusts <strong>and</strong> enhanced <strong>nitrogen</strong> <strong>and</strong> z<strong>in</strong>c levels<strong>in</strong> Parmelia sulcata <strong>and</strong> identified as a fac<strong>to</strong>r contribut<strong>in</strong>g <strong>to</strong>its poor health <strong>in</strong> Burnham Beeches, west <strong>of</strong> <strong>London</strong> (Purviset al., 2003, 2004). NO 2 derived from traffic emissions limitedlichen diversity (expressed as an Index <strong>of</strong> Atmospheric Purity‘‘IAP’’) <strong>in</strong> Seville, Spa<strong>in</strong> (Fuentes <strong>and</strong> Rowe, 1998) <strong>and</strong> <strong>in</strong>Tuscany, Italy (expressed as a lichen biodiversity value,
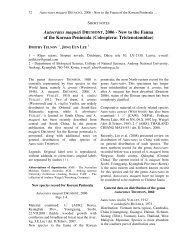
L. Davies et al. / Environmental Pollution 146 (2007) 299e310307Lorenz<strong>in</strong>i et al., 2003). NO x derived from domestic heat<strong>in</strong>gemissions was considered responsible for changes <strong>in</strong> diversityat Pis<strong>to</strong>ia, Italy (Loppi <strong>and</strong> Cors<strong>in</strong>i, 2003).Further evidence <strong>of</strong> vary<strong>in</strong>g <strong>sensitivity</strong> <strong>to</strong> transport emissions<strong>and</strong> NO x was found <strong>in</strong> Xanthoria pariet<strong>in</strong>a which wasunharmed follow<strong>in</strong>g exposure <strong>to</strong> high traffic emissions, unlikethe more sensitive Ramal<strong>in</strong>a duriaei, which showed extensivephysiological changes (Silberste<strong>in</strong> et al., 1996a,b). A superiorresponse by X. pariet<strong>in</strong>a <strong>to</strong> oxidative stress was identified asa key fac<strong>to</strong>r. Other studies have reported antioxidant responses<strong>in</strong> lichens follow<strong>in</strong>g exposure <strong>to</strong> NO x ,SO 2 <strong>and</strong> ozone (Bates,2002; Cuny et al., 2002).There is much empirical evidence from field studies l<strong>in</strong>k<strong>in</strong>gmany <strong>of</strong> the pollution <strong>to</strong>lerant lichens <strong>to</strong> <strong>nitrogen</strong> (Barkman,1958; James et al., 1977; Seaward <strong>and</strong> Copp<strong>in</strong>s, 2004; Davies,2005). Labora<strong>to</strong>ry-based studies have recorded high N accumulationwith<strong>in</strong> the thalli <strong>of</strong> many species (Purvis et al., 2003,2004; Gaio-Oliveira et al., 2004; Gombert et al., 2002). Theseassociations led <strong>to</strong> the term ‘‘nitrophyte’’. A scale <strong>of</strong> <strong>sensitivity</strong><strong>to</strong> ammonia was devised, although it was later found that barkpH was the ma<strong>in</strong> fac<strong>to</strong>r affect<strong>in</strong>g changes <strong>in</strong> community structureon oak (van Herk, 2002). Conversely, some species arehighly sensitive <strong>to</strong> N <strong>and</strong> prefer a more acidic environment.High deposition <strong>of</strong> <strong>nitrogen</strong> can be directly <strong>to</strong>xic <strong>to</strong> terricolouslichens <strong>and</strong> mosses <strong>of</strong> heathl<strong>and</strong> areas <strong>and</strong> some <strong>epiphytes</strong>(Pitcairn et al., 1991; van Herk, 2001; Massara, 2004).Whilst the focus <strong>of</strong> this study is NO x , it is recognised thatmany other pollutants are associated with transport. In particularammonia <strong>and</strong> ammonium compounds as well as dusts,heavy metals, VOCs <strong>and</strong> PAHs, may be contribut<strong>in</strong>g <strong>to</strong> theresults. In addition, the modelled data, although validatedaga<strong>in</strong>st actual measurements, may occasionally over- orunder-estimate NO x . Furthermore, urban environments areless humid <strong>and</strong> warmer than rural areas which will restrict distribution.In addition, record<strong>in</strong>g was conf<strong>in</strong>ed <strong>to</strong> Frax<strong>in</strong>usexcelsior, a neutral bark tree species. These fac<strong>to</strong>rs must betaken <strong>in</strong><strong>to</strong> consideration when summaris<strong>in</strong>g the results <strong>of</strong>this study, as well as the avoidance <strong>of</strong> trees without <strong>epiphytes</strong>.Lichen diversity <strong>in</strong> <strong>London</strong> has <strong>in</strong>creased by an order <strong>of</strong>magnitude s<strong>in</strong>ce the 1970s (Laundon, 1970) (Fig. 6). Muchcan be attributed <strong>to</strong> reductions <strong>in</strong> SO 2 <strong>and</strong> acidity (Hawksworth,2002), but this study shows that the number <strong>of</strong> lichens<strong>in</strong> many <strong>of</strong> the central <strong>London</strong> Boroughs is now significantlyhigher than <strong>in</strong> some outer <strong>London</strong> Boroughs (Fig. 6). This islargely expla<strong>in</strong>ed by the distribution <strong>of</strong> the pollution <strong>to</strong>lerantspecies, many <strong>of</strong> which are also associated with eutrophication.Few rare species were found; some not seen <strong>in</strong> <strong>London</strong>for decades have returned <strong>and</strong> others are new records for theCapital (Waterfield, 2002). In areas <strong>of</strong> highest NO x , species recordedbelong almost exclusively <strong>to</strong> the families C<strong>and</strong>elariaceae,Physciaceae <strong>and</strong> Teloschistaceae. Further evidence <strong>of</strong> theunremarkable flora is provided by the presence <strong>of</strong> just tw<strong>of</strong>ruticose species, Ramal<strong>in</strong>a far<strong>in</strong>acea <strong>and</strong> Usnea cornuta,the latter with a thallus length not exceed<strong>in</strong>g 1.5 cm.Three <strong>of</strong> the most widely distributed species, Xanthoriac<strong>and</strong>elaria group, X. pariet<strong>in</strong>a <strong>and</strong> X. polycarpa, are characterisedby the presence <strong>of</strong> pariet<strong>in</strong>, an antioxidant anthraqu<strong>in</strong>one(Søcht<strong>in</strong>g <strong>and</strong> Lutzoni, 2003), which is the pigment that(a)(b)EnfieldEnfieldBarnetBarnetHarrowWaltham ForestHar<strong>in</strong>geyRedbridgeHarrowWaltham ForestHar<strong>in</strong>geyRedbridgeHill<strong>in</strong>gdonBrentHackneyCamdenIsl<strong>in</strong>g<strong>to</strong>n parkNewhamEal<strong>in</strong>gTowerWestm<strong>in</strong>ster City HamletsKens<strong>in</strong>g<strong>to</strong>nHammersmithGreenwichHounslowSouthwarkLambethW<strong>and</strong>sworthLewishamBark<strong>in</strong>gBexleyHaver<strong>in</strong>gHill<strong>in</strong>gdonBrentHackneyCamdenIsl<strong>in</strong>g<strong>to</strong>n parkNewhamEal<strong>in</strong>gCityTower HamletsKens<strong>in</strong>g<strong>to</strong>nWestm<strong>in</strong>sterHammersmithSouthwarkGreenwichHounslowLambethW<strong>and</strong>sworthLewishamBark<strong>in</strong>gBexleyHaver<strong>in</strong>gRichmondMer<strong>to</strong>nRichmondMer<strong>to</strong>nK<strong>in</strong>gs<strong>to</strong>nSut<strong>to</strong>nCroydonBromleyK<strong>in</strong>gs<strong>to</strong>nSut<strong>to</strong>nCroydonBromley1970LICHENS2004LICHENS0 - 128 - 1415 - 233 - 424 - 355 - 736 - 47EXCLUDEDEXCLUDEDFig. 6. (a). Lichen diversity on trees, 1970. (b) Lichen diversity on Frax<strong>in</strong>us excelsior, 2004.
L. Davies et al. / Environmental Pollution 146 (2007) 299e310309Bates, J.W., Roy, D.B., Pres<strong>to</strong>n, C.D., 2004. Occurrence <strong>of</strong> epiphytic bryophytes<strong>in</strong> a ‘‘tetrad’’ transect across southern Brita<strong>in</strong>. 2. Analysis <strong>and</strong>modell<strong>in</strong>g <strong>of</strong> epiphyte-environmental relationships. Journal <strong>of</strong> Bryology26, 181e197.Batty, K., Bates, J.W., Bell, J.N.B., 2003. A transplant experiment on the fac<strong>to</strong>rsprevent<strong>in</strong>g lichen colonization <strong>of</strong> oak bark <strong>in</strong> southeast Engl<strong>and</strong> underdecl<strong>in</strong><strong>in</strong>g SO 2 pollution. Canadian Journal <strong>of</strong> Botany 81, 439e451.Bell, J.N.B., Treshow, M., 2002. Air Pollution <strong>and</strong> Plant Life, second ed. JohnWiley, Chichester, UK.Bignal, K., Ashmore, M., Power, S., 2004. The Ecological Effects <strong>of</strong> DiffuseAir Pollution from Road Transport. English Nature Research Report 580.English Nature, Peterborough.Cape, J.N., Tang, Y.S., van Dijk, N., Love, L., Sut<strong>to</strong>n, M.A., Palmer, S.C.F.,2004. Concentrations <strong>of</strong> ammonia <strong>and</strong> <strong>nitrogen</strong> dioxide at roadside verges,<strong>and</strong> their contribution <strong>to</strong> <strong>nitrogen</strong> deposition. Environmental Pollution 132,469e478.Carruthers, D., Blair, J., Johnson, K., 2003. Validation <strong>and</strong> Sensitivity Study <strong>of</strong>ADMS-Urban for <strong>London</strong>. Prepared for DEFRA by Cambridge EnvironmentalResearch Consultants Ltd., Cambridge.CERC, 2001. ADMS-Urban User Manual. Cambridge Environmental ResearchConsultants Ltd, Cambridge.Clapp, L.J., Jenk<strong>in</strong>, M.E., 2001. Analysis <strong>of</strong> the relationship between ambientlevels <strong>of</strong> O 3 ,NO 2 <strong>and</strong> NO as a function <strong>of</strong> NO x <strong>in</strong> the UK. AtmosphericEnvironment 35, 6391e6405.Colvile, R.N., Hutch<strong>in</strong>son, E.J., M<strong>in</strong>dell, J.S., Warren, R.F., 2001. The transportsec<strong>to</strong>r as a source <strong>of</strong> air pollution. Atmospheric Environment 35,1537e1565.Copp<strong>in</strong>s, B.J., 1973. The drought hypothesis. In: Ferry, B.W., Baddeley, M.S.,Hawksworth, D.L. (Eds.), Air Pollution <strong>and</strong> Lichens. Athlone Press, <strong>London</strong>.Copp<strong>in</strong>s, B.J., 2002. Checklist <strong>of</strong> Lichens <strong>of</strong> Great Brita<strong>in</strong> <strong>and</strong> Irel<strong>and</strong>. BritishLichen Society.Cuny, D., Pignata, M.L., Kranner, I., Beckett, R., 2002. Biomarkers <strong>of</strong> pollution<strong>in</strong>ducedoxidative stress <strong>and</strong> membrane damage <strong>in</strong> lichens. In: Nimis, P.L.,Scheidegger, C., Wolseley, P.A. (Eds.), Moni<strong>to</strong>r<strong>in</strong>g with LichensdMoni<strong>to</strong>r<strong>in</strong>gLichens. Kluwer Academic Publishers, The Netherl<strong>and</strong>s.Davies, L., 2005. The Lichens <strong>of</strong> <strong>London</strong> under contemporary atmosphericconditions. PhD Thesis, Imperial College, University <strong>of</strong> <strong>London</strong>.DEFRA, 2004. Au<strong>to</strong>mated Urban Network. Netcen, AEA Technology.Department for Environment, Food <strong>and</strong> Rural Affairs. .Dobson, F., 2004. Lichens. The Richmond Publish<strong>in</strong>g Company, Slough.ERG, 2002. Air Quality Assessment <strong>in</strong> <strong>London</strong> <strong>and</strong> the East Thames Corridor.Environmental Research Group, K<strong>in</strong>gs College <strong>London</strong>. Report for theEnvironment Agency.ESRI, 1997. Environmental Systems Research Institute. Gett<strong>in</strong>g <strong>to</strong> know GeographicalInformation Systems. ESRI, California, USA.European Commission, 1996. Council Directive 96/62/EC on ambient airquality assessment <strong>and</strong> management. Official Journal L 296/96, 55e63.Fuentes, J.M.C., Rowe, J.G., 1998. The effect <strong>of</strong> air pollution from <strong>nitrogen</strong>dioxide (NO 2 ) on epiphytic lichens <strong>in</strong> Seville, Spa<strong>in</strong>. Aerobiologia 14,241e247.Gaio-Oliveira, G., Dahlman, L., Palmqvist, K., Maguas, C., 2004. Ammoniumuptake <strong>in</strong> the nitrophytic lichen Xanthoria pariet<strong>in</strong>a <strong>and</strong> its effects onvitality <strong>and</strong> balance between symbionts. Lichenologist 36, 75e86.Gilbert, O.L., 1976. An alkal<strong>in</strong>e dust effect on epiphytic lichens. Lichenologist8, 173e178.Gombert, S., Asta, J., Seaward, M.R.D., 2002. Correlation between the <strong>nitrogen</strong>concentration <strong>of</strong> two epiphytic lichens <strong>and</strong> the traffic density <strong>in</strong> anurban area. Environmental Pollution 123, 281e290.GLA, 2002. Mayor’s Air Quality Strategy. Greater <strong>London</strong> Authority. .Hawksworth, D.L., 2002. Bio<strong>in</strong>dication calibrated scales <strong>and</strong> their utility. In:Nimis, P.L., Scheidegger, C., Wolseley, P.A. (Eds.), Moni<strong>to</strong>r<strong>in</strong>g withLichensdMoni<strong>to</strong>r<strong>in</strong>g Lichens. Kluwer Academic Publishers, Netherl<strong>and</strong>s,pp. 11e20.Hawksworth, D.L., Rose, F., 1970. Quantitative scale for estimat<strong>in</strong>g sulphurdioxide pollution <strong>in</strong> Engl<strong>and</strong> <strong>and</strong> Wales us<strong>in</strong>g epiphytic lichens. Nature227, 145e148.van Herk, C.M., Aptroot, A., 1999. Lecanora compallens <strong>and</strong> L. s<strong>in</strong>uosa, twonew overlooked corticolous lichen species from western Europe. Lichenologist31, 543e553.van Herk, C.M., 2001. Bark pH <strong>and</strong> susceptibility <strong>to</strong> <strong>to</strong>xic air pollutants as<strong>in</strong>dependent causes <strong>of</strong> changes <strong>in</strong> epiphytic lichen composition <strong>in</strong> space<strong>and</strong> time. Lichenologist 33, 419e441.van Herk, C.M., 2002. Epiphytes on wayside trees as an <strong>in</strong>dica<strong>to</strong>r <strong>of</strong> eutrophication.In: Nimis, P.L., Scheidegger, C., Wolseley, P.A. (Eds.), Moni<strong>to</strong>r<strong>in</strong>gwith LichensdMoni<strong>to</strong>r<strong>in</strong>g Lichens. Kluwer Academic Publishers, TheNetherl<strong>and</strong>s, pp. 285e289.Von Arb, C., Brunold, C., 1990. Lichen physiology <strong>and</strong> air pollution. 1. Physiologicalresponses <strong>of</strong> <strong>in</strong> situ Parmelia sulcata among air pollution zoneswith<strong>in</strong> Biel, Switzerl<strong>and</strong>. Canadian Journal <strong>of</strong> Botany 68, 35e42.James, P.W., Davies, L., 2005. Lichen distribution at the roadside <strong>in</strong> Epp<strong>in</strong>gForest. A report for the Environment Agency (Science Project 13508).James, P.W., Hawksworth, D.L., Rose, F., 1977. Lichen communities <strong>in</strong> theBritish Isles: a prelim<strong>in</strong>ary conspectus. In: Seaward, M.R.D. (Ed.), LichenEcology. <strong>London</strong> Academic Press, pp. 295e413.Jongman, R.H.G., Ter Braak, C.J.F., Van Tongeren, O.F.R. (Eds.), 2002. DataAnalysis <strong>in</strong> Community <strong>and</strong> L<strong>and</strong>scape Ecology. Cambridge UniversityPress, UK.Kelly, F.J., 2003. Oxidative stress: Its role <strong>in</strong> air pollution <strong>and</strong> adverse healtheffects. Occupational Environmental Medic<strong>in</strong>e 60, 612e616.Laundon, J.R., 1970. <strong>London</strong>’s lichens. <strong>London</strong> Naturalist 49, 20e66.Loppi, S., Cors<strong>in</strong>i, A., 2003. <strong>Diversity</strong> <strong>of</strong> epiphytic lichens <strong>and</strong> metal contents<strong>of</strong> Parmelia caperata thalli as moni<strong>to</strong>rs <strong>of</strong> air pollution <strong>in</strong> the <strong>to</strong>wn <strong>of</strong>Pis<strong>to</strong>ia (c Italy). Environmental Moni<strong>to</strong>r<strong>in</strong>g <strong>and</strong> Assessment 86, 289e301.Lorenz<strong>in</strong>i, G., L<strong>and</strong>i, U., Loppi, S., Nali, C., 2003. Lichen distribution <strong>and</strong>bio<strong>in</strong>dica<strong>to</strong>r <strong>to</strong>bacco plants give discordant response: A case study fromItaly. Environmental Moni<strong>to</strong>r<strong>in</strong>g <strong>and</strong> Assessment 82, 243e264.Magellan, 2002. Meridian Gold. Thales, California.Mansfield, T.A., 2002. Nitrogen <strong>oxides</strong>: old problems <strong>and</strong> new challenges. In:Bell, J.N.B., Treshow, M. (Eds.), Air Pollution <strong>and</strong> Plant Life. Wiley, UK,pp. 119e133.Massara, A.C., 2004. The Ecology <strong>and</strong> Physiology <strong>of</strong> the Pollution TolerantLichen, Lecanora conizaeoides. PhD Thesis. Imperial College, University<strong>of</strong> <strong>London</strong>.Nash III, T.H., 1976. Sensitivity <strong>of</strong> lichens <strong>to</strong> <strong>nitrogen</strong> dioxide fumigations.Bryologist 76, 333e339.Nash III, T.H., 1988. Correlat<strong>in</strong>g Fumigation Studies with Field Effects. BibliothecaLichenologica 30, 201e216.Nash III, T.H., 1997. Lichen Biology. Cambridge University Press, <strong>London</strong>.NEGTAP, 2001. Transboundary Air Pollution: Acidification, Eutrophication<strong>and</strong> Ground-level Ozone <strong>in</strong> the UK. NEGTAP.Orange, A., James, P.W., White, F.J., 2001. Microchemical Methods for theIdentification <strong>of</strong> Lichens. British Lichen Society.PC-ORD, 2003. Version 4. Pitcairn, C.E.R., Fowler, D., Grace, J., 1991. Changes <strong>in</strong> species composition<strong>of</strong> semi-natural vegetation associated with the <strong>in</strong>crease <strong>in</strong> atmospheric <strong>in</strong>puts<strong>of</strong> <strong>nitrogen</strong>. Nature Conservancy Council, Peterborough, Engl<strong>and</strong>.Purvis, O.W., Chimonides, J., D<strong>in</strong>, V.K., Ero<strong>to</strong>kri<strong>to</strong>u, L., Jeffries, T.,Jones, G.C., Louw<strong>of</strong>f, S., Read, H., Spiro, B., 2003. Which fac<strong>to</strong>rs are responsiblefor the chang<strong>in</strong>g lichen floras <strong>of</strong> <strong>London</strong>? Science <strong>of</strong> the TotalEnvironment 310, 179e189.Purvis, O.W., Chimonides, P.J., Jeffries, T.E., Jones, G.C., Read, H., Spiro, B.,2004. Investigat<strong>in</strong>g biogeochemical signatures <strong>in</strong> the lichen Parmeliasulcata at Burnham Beeches, Buck<strong>in</strong>ghamshire, Engl<strong>and</strong>. Lichenologist37, 329e344.Seaward, M.R.D., 1997. Urban deserts bloom: a lichen renaissance. BibliothecaLichenologica 67, 297e309.Seaward, M.R.D., Copp<strong>in</strong>s, B.J., 2004. Lichens <strong>and</strong> hypertrophication. BibliothecaLichenologica 88, 561e572.Silberste<strong>in</strong>, L., Siegel, B.Z., Mukhtar, A., Galun, M., 1996a. Comparativestudies on Xanthoria pariet<strong>in</strong>a, a pollution-resistant lichen, <strong>and</strong> Ramal<strong>in</strong>aduriaei, a sensitive species. I. Effects <strong>of</strong> air pollution on physiological processes.Lichenologist 28, 355e365.Silberste<strong>in</strong>, L., Siegel, B.Z., Mukhtar, A., Galun, M., 1996b. Comparativestudies on Xanthoria pariet<strong>in</strong>a, a pollution-resistant lichen, <strong>and</strong> Ramal<strong>in</strong>a