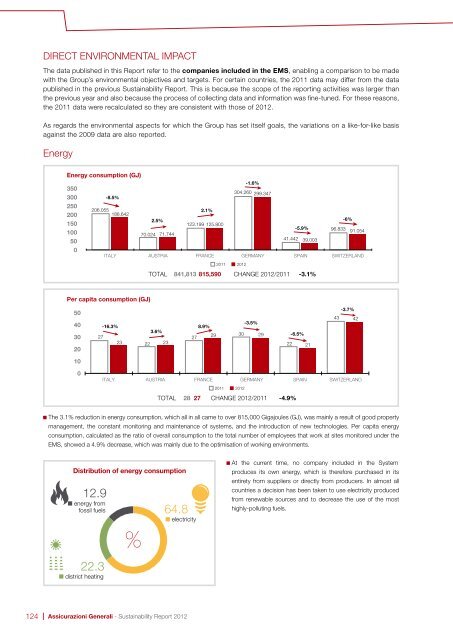
DIRECT ENVIRONMENTAL IMPACTThe data published in this <strong>Report</strong> refer to the companies included in the EMS, enabling a comparison to be madewith the Group’s environmental objectives and targets. For certain countries, the 2011 data may differ from the datapublished in the previous <strong>Sustainability</strong> <strong>Report</strong>. This is because the scope of the reporting activities was larger thanthe previous year and also because the process of collecting data and information was fine-tuned. For these reasons,the 2011 data were recalculated so they are consistent with those of <strong>2012</strong>.As regards the environmental aspects for which the Group has set itself goals, the variations on a like-for-like basisagainst the 2009 data are also reported.EnergyEnergy consumption (GJ)350300250200150100500-8.5%206.055188.6422.5%70.024 71.7442.1%123.199 125.800-1.6%304.260 299.347-5.9%41.442 39.003ITALY AUSTRIA FRANCE GERMANY SPAIN2011 <strong>2012</strong>TOTAL 841,813 815,590 CHANGE <strong>2012</strong>/2011 -3.1%-6%96.833 91.054SWITZERLANDPer capita consumption (GJ)50403020-16.3%3.6%2723 22 23-3.5%8.9%2729 30 29-6.5%22 21-3.7%43 42100ITALY AUSTRIA FRANCE GERMANY SPAIN SWITZERLAND2011 <strong>2012</strong>TOTAL 28 27 CHANGE <strong>2012</strong>/2011 -4.9%The 3.1% reduction in energy consumption, which all in all came to over 815,000 Gigajoules (GJ), was mainly a result of good propertymanagement, the constant monitoring and maintenance of systems, and the introduction of new technologies. Per capita energyconsumption, calculated as the ratio of overall consumption to the total number of employees that work at sites monitored under theEMS, showed a 4.9% decrease, which was mainly due to the optimisation of working environments.Distribution of energy consumption12.9■ energy fromfossil fuels%64.8■ electricityAt the current time, no company included in the Systemproduces its own energy, which is therefore purchased in itsentirety from suppliers or directly from producers. In almost allcountries a decision has been taken to use electricity producedfrom renewable sources and to decrease the use of the mosthighly-polluting fuels.22.3■ district heating124 | Assicurazioni <strong>Generali</strong> - <strong>Sustainability</strong> <strong>Report</strong> <strong>2012</strong>
Electricity consumption (KWh)50,000,00040,000,00030,000,00020,000,00010,000,0000-10.1%41,639,74637,435,152-1.7%11,431,169 11,241,535-0.4%21,330,07221,424,494-6.7%49,661,02746,345,137-0.6%-5.9%19,810,465 19,697,66711,511,59010,834,206ITALY AUSTRIA FRANCE GERMANY SPAIN SWITZERLAND2011 <strong>2012</strong>TOTAL 155,478,491 146,883,769 CHANGE <strong>2012</strong>/2011 -5.5%Per capita consumption (KWh)10864201.9%8,888 9,052-17.8%-6.5%6.2%-8.5%6,0945,537 -0.6%5,6994,5504,608 4,893 4,8354,4253,570 3,548ITALY AUSTRIA FRANCE GERMANY SPAIN SWITZERLAND2011 <strong>2012</strong>TOTAL 5,224 4,847 CHANGE <strong>2012</strong>/2011 -7.2% GHANGE <strong>2012</strong>/2009 -6.9%The objective of reducing per capita electricity consumption by 5% during the 2010-<strong>2012</strong> three-year period was achieved with a 6.9%reduction overall. This was made possible thanks to innumerable initiatives launched at the Group sites, one of the most important beingthe more efficient management of the Data Processing Centre (DPC) in Mogliano Veneto, Italy. The DPC’s are certainly one of the biggestsources of electricity consumption within the Group, other areas including lighting, the operating of machinery, air conditioning and, in somecountries, heating.In <strong>2012</strong> the DPC’s consumed a total of 35.7 GWh (-10% compared with 2011), the equivalent of 24.3% of the total. Of the various companysites, the Mogliano Veneto Centre is the most energy intensive also because - like the DPC in Germany - it also carries out ancillary activitieson behalf of Group companies located in other countries.There was also a reduction in per capita electricity consumption too, to which almost all of the countries made a contribution except forFrance and Switzerland. The reduction in Italy was particularly significant and stemmed from three main factors: the new Programmable LogicController (PLC) system installed in the Mogliano Veneto complex, which makes it possible to manage lighting and heating automatically,the optimisation of the work spaces at almost all sites and, as mentioned, the more efficient management of the DPC. There was also asignificant reduction in per capita consumption in Germany following the increase in size of the workforce in the buildings monitored as aresult of the launch also in this country of a project to optimise spaces. On the contrary, the increase in per capita consumption in Francewas mainly due to the reduction of the workforce in the sites included in the EMS.ENVIRONMENT AND CLIMATE CHANGE | 125
- Page 4 and 5:
Sustainability Report 2012A complet
- Page 6 and 7:
Chairman and Group CEOletter to the
- Page 9 and 10:
sustainability context and complete
- Page 11:
FRANCEE-Cie Vie S.A.Europ Assistanc
- Page 14 and 15:
at a glanceEMPLOYEESEmployee polici
- Page 16 and 17:
at a glanceFINANCIALCOMMUNITYIn a y
- Page 18 and 19:
at a glanceSUPPLIERSThe Generali Gr
- Page 20:
at a glanceENVIRONMENT ANDCLIMATE C
- Page 23:
IndexTHE GROUP 24Mission, vision, v
- Page 26 and 27:
thE group79,454employees69.6billion
- Page 28 and 29:
MISSION, VISION, VALUES AND COMPETE
- Page 30 and 31:
CORPORATE BODIESBoard ofStatutoryAu
- Page 32 and 33:
EngagementDuring the hearing before
- Page 34 and 35:
The Code includes the introduction
- Page 36 and 37:
In Italy, the Group Anti-money Laun
- Page 38 and 39:
In order to make innovation an inte
- Page 40 and 41:
The Generali Group is committed to
- Page 42 and 43:
ADHESION TO EXTERNALVOLUNTARY INITI
- Page 45 and 46:
STAKEHOLDERsPrague - Czech Republic
- Page 47 and 48:
Human resources arethe Group’s fu
- Page 49 and 50:
mobility, coaching programmes and p
- Page 51 and 52:
Reliability. In addition, the sloga
- Page 53 and 54:
In Italy and France, when returning
- Page 55 and 56:
normally have the option, often gua
- Page 57 and 58:
HEALTH AND SAFETY IN THEWORKPLACETh
- Page 59 and 60:
Emirates, the Philippines, Guatemal
- Page 61 and 62:
SIZE AND CHARACTERISTICS OF THE WOR
- Page 63 and 64:
On average, a third (33.4%) of posi
- Page 65 and 66:
Workforce by age bracket2011 2012 2
- Page 67 and 68:
Labour disputesNumber and value of
- Page 69 and 70:
To foster greater staff involvement
- Page 71 and 72:
Committedto innovation anddiversifi
- Page 73 and 74:
SIZE AND CHARACTERISTICS OFTHE SALE
- Page 75 and 76: DIRECT CHANNELS, with no intermedia
- Page 77 and 78: Satisfaction surveys on services pr
- Page 79 and 80: Along with thecommitment to strengt
- Page 81 and 82: FINANCIAL AND SUSTAINABILITY PERFOR
- Page 83 and 84: RatingRating agencyRating*A.M.BestA
- Page 85: Main meetings with analysts and inv
- Page 88 and 89: PRODUCT POLICIESCustomer loyalty is
- Page 90 and 91: Products with particular environmen
- Page 92 and 93: Over the last few years, various ro
- Page 94 and 95: • fill out questionnaires with a
- Page 96 and 97: of pre-packaged solutions. As part
- Page 98 and 99: Surveys on servicesGERMANYOnline su
- Page 100 and 101: Percentage of clients by age bracke
- Page 102 and 103: Change in number of claims2009-2012
- Page 104 and 105: Change in numberof complaints recei
- Page 106 and 107: SUPPLIERSKarolinen Karee, Munich, G
- Page 108 and 109: Relationships with contractual part
- Page 110 and 111: SIZE AND CHARACTERISTICSOF SUPPLIER
- Page 112 and 113: COMMUNITYOld-Aged Survey, Germania1
- Page 114 and 115: GUIDELINES FOR COMMUNITYINITIATIVES
- Page 116 and 117: For example, in 2012 the Generali E
- Page 118 and 119: Cultural areaWith a view to promoti
- Page 120 and 121: Sports areaGenerali regards sport a
- Page 122 and 123: ENVIRONMENT ANDCLIMATE CHANGEOilsee
- Page 124 and 125: In order to pursue the abovemention
- Page 128 and 129: Electricity quota from renewable so
- Page 130 and 131: PaperPaper consumption3530252015105
- Page 132 and 133: WaterWater consumption (m 3 )-0.4%3
- Page 134 and 135: In all countries, IT waste, compris
- Page 136 and 137: Flight kilometres travelled by empl
- Page 138 and 139: The increase in exposure to climate
- Page 140 and 141: EXPENDITURES AND INVESTMENTSFOR ENV
- Page 142 and 143: ENVIRONMENTAL RANKINGGenerali’s a
- Page 145 and 146: CONTENTINDEXParis - France
- Page 147 and 148: REPORTEDGLOBALCOMPACTPRINCIPLESCROS
- Page 149 and 150: GLOBALREPORTED COMPACTPRINCIPLESful
- Page 151 and 152: REPORTEDGLOBALCOMPACTPRINCIPLESCROS
- Page 153: GLOBALREPORTED COMPACTCROSS-REFEREN
- Page 156 and 157: GRIINDICATORSDESCRIPTIONASPECT: Div
- Page 158 and 159: GRIINDICATORSDESCRIPTIONSOCIETYDisc
- Page 160 and 161: GRIINDICATORSDESCRIPTIONASPECT: Pub
- Page 162 and 163: GRIINDICATORSDESCRIPTIONASPECT: Cus
- Page 164 and 165: GRIINDICATORSFS3. CoreDESCRIPTIONPr
- Page 168: Co-ordination:Corporate Social Resp