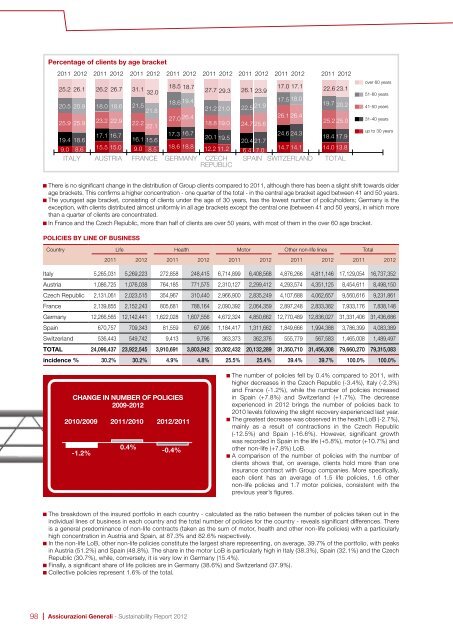
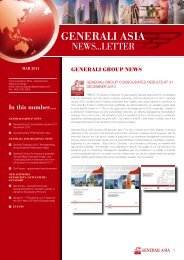
Percentage of clients by age bracket2011 <strong>2012</strong> 2011 <strong>2012</strong> 2011 <strong>2012</strong> 2011 <strong>2012</strong> 2011 <strong>2012</strong> 2011 <strong>2012</strong> 2011 <strong>2012</strong> 2011 <strong>2012</strong>25.2 26.1 26.2 26.7 31.132.018.5 18.727.7 29.320.5 20.9 18.0 18.618.6 19.421.521.821.2 21.025.9 25.9 23.2 22.927.0 26.422.222.118.8 19.017.1 16.717.3 16.719.4 18.616.1 15.620.1 19.59.0 8.6 15.5 15.0 9.0 8.518.6 18.8 12.2 11.2ITALY AUSTRIA FRANCE GERMANY CZECHREPUBLIC17.0 17.126.1 23.917.5 18.022.5 21.926.1 26.424.7 25.624.6 24.320.4 21.714.7 14.16.4 7.0SPAIN SWITZERLAND22.6 23.119.7 20.225.2 25.018.4 17.914.0 13.8TOTALover 60 years51-60 years41-50 years31-40 yearsup to 30 yearsThere is no significant change in the distribution of Group clients compared to 2011, although there has been a slight shift towards olderage brackets. This confirms a higher concentration - one quarter of the total - in the central age bracket aged between 41 and 50 years.The youngest age bracket, consisting of clients under the age of 30 years, has the lowest number of policyholders; Germany is theexception, with clients distributed almost uniformly in all age brackets except the central one (between 41 and 50 years), in which morethan a quarter of clients are concentrated.In France and the Czech Republic, more than half of clients are over 50 years, with most of them in the over 60 age bracket.Policies by line of businessCountry Life Health Motor Other non-life lines Total2011 <strong>2012</strong> 2011 <strong>2012</strong> 2011 <strong>2012</strong> 2011 <strong>2012</strong> 2011 <strong>2012</strong>Italy 5,265,031 5,269,223 272,858 248,415 6,714,899 6,408,568 4,876,266 4,811,146 17,129,054 16,737,352Austria 1,086,725 1,076,038 764,185 771,575 2,310,127 2,299,412 4,293,574 4,351,125 8,454,611 8,498,150Czech Republic 2,131,061 2,023,515 354,967 310,440 2,966,900 2,835,249 4,107,688 4,062,657 9,560,616 9,231,861France 2,139,855 2,152,243 805,681 788,164 2,090,392 2,064,359 2,897,248 2,833,382 7,933,176 7,838,148Germany 12,266,565 12,142,441 1,622,028 1,607,556 4,672,324 4,850,662 12,770,489 12,836,027 31,331,406 31,436,686Spain 670,757 709,343 81,559 67,996 1,184,417 1,311,662 1,849,666 1,994,388 3,786,399 4,083,389Switzerland 536,443 549,742 9,413 9,796 363,373 362,376 555,779 567,583 1,465,008 1,489,497TOTAL 24,096,437 23,922,545 3,910,691 3,803,942 20,302,432 20,132,289 31,350,710 31,456,308 79,660,270 79,315,083incidence % 30.2% 30.2% 4.9% 4.8% 25.5% 25.4% 39.4% 39.7% 100.0% 100.0%Change in number of policies2009-<strong>2012</strong>2010/2009-1.2%2011/2010 <strong>2012</strong>/20110.4%-0.4%The number of policies fell by 0.4% compared to 2011, withhigher decreases in the Czech Republic (-3.4%), Italy (-2.3%)and France (-1.2%), while the number of policies increasedin Spain (+7.8%) and Switzerland (+1.7%). The decreaseexperienced in <strong>2012</strong> brings the number of policies back to2010 levels following the slight recovery experienced last year.The greatest decrease was observed in the health LoB (-2.7%),mainly as a result of contractions in the Czech Republic(-12.5%) and Spain (-16.6%). However, significant growthwas recorded in Spain in the life (+5.8%), motor (+10.7%) andother non-life (+7.8%) LoB.A comparison of the number of policies with the number ofclients shows that, on average, clients hold more than oneinsurance contract with Group companies. More specifically,each client has an average of 1.5 life policies, 1.6 othernon-life policies and 1.7 motor policies, consistent with theprevious year’s figures.The breakdown of the insured portfolio in each country - calculated as the ratio between the number of policies taken out in theindividual lines of business in each country and the total number of policies for the country - reveals significant differences. Thereis a general predominance of non-life contracts (taken as the sum of motor, health and -9,6% other non-life policies) with a particularlyhigh concentration in Austria and Spain, at 87.3% and 82.6% respectively.In the non-life LoB, other non-life policies constitute the largest share representing, on average, 39.7% of the portfolio, with peaksin Austria (51.2%) and Spain (48.8%). The share in the motor LoB is particularly high in Italy (38.3%), Spain (32.1%) and the CzechRepublic (30.7%), while, conversely, it is very low in Germany (15.4%).Finally, a significant share of life policies are in Germany (38.6%) and Switzerland (37.9%).Collective policies represent 1.6% of the total.98 | Assicurazioni <strong>Generali</strong> - <strong>Sustainability</strong> <strong>Report</strong> <strong>2012</strong>
Management of non-life claimsIn the non-life insurance segment, the quality of customerservice is mainly measured at the claim settlement stage.The Group has shared facilities in all countries to optimiseclaim management procedures and to facilitate thesettlement of claims, although independent managementprocedures still exist in certain companies. In order toimprove customer service and, in particular, to reduceclaim assessment timelines, the Group companieshave introduced streamlined procedures for managing“straightforward” claims, i.e. claims for damage only togoods that receive moderate reimbursement.With regard to the different stages of claims management,most Group companies have developed services forhandling customer needs.In particular, based on specific local requirements andthe services developed by individual Group companies,clients can:• receive information and assistance at the agency,through the call centres or the website, at approvedbody repair shops or independent brokers which useIT systems that can provide full automated responsesincluding all useful references;• report an accident via an agency, call centre (whichcan provide customer support or assistance to the salesnetwork for reports received by the agency), website(using the appropriate online forms), or smartphoneapplication;• obtain the contact details of an assessor via theagency when reporting the claim, by contacting the callcentre, or by SMS. Furthermore, in Austria, France andSwitzerland, a remote assessment system is availablewhich, in addition to limiting travel demands onassessors and therefore benefitting the environment,it also reduces the inconvenience to the client. In<strong>2012</strong>, a drive-in service as a result of special weatherevents such as hail was launched in Switzerland,which simplifies and speed of claims assessmentson a collective basis, thus significantly reducing thetimelines for claim settlement.In <strong>2012</strong>, a project was completed involving Groupcompanies based in Italy and <strong>Generali</strong> BusinessSolutions settlements area. The project’s objectives wereto review the wording of communications sent to clientsfollowing a claim with a view to making all informationfully understandable and readily accessible and to ensurethe prompt and correct handling of claims.Agreements and conventions with healthcare facilities,doctors, roadside-assistance providers, body shops, carhire firms, etc. are in place to facilitate customer access tothe services provided. The supplier selection proceduresadopted by Group companies are aimed at ensuring highservice levels for the customer. In particular, agreementswith body shops, in addition to ensuring excellent serviceand keeping the cost of claims to a minimum, may alsoinclude the provision of a courtesy vehicle, warranty onrepairs and the provision of the service without advancepayment and/or the total refund of the claim withoutcharging the excess. Similarly, agreements are in placewith companies specializing in the repair and replacementof windscreens, which offer a high quality service andmanage claims directly with the companies without askingthe client for advance payment.Non-life claimsCountryNumber ofclaims reportedNumber ofclaims settledSums paid for claims(thousand euros)2011 <strong>2012</strong> 2011 <strong>2012</strong> 2011 <strong>2012</strong>Italy 1,801,376 1,563,546 1,655,496 1,433,691 4,060,030 3,708,157Austria 812,871 846,033 878,066 903,064 881,350 932,779Czech Republic 503,073 491,063 445,269 411,665 542,440 496,140France 708,075 675,796 673,529 669,561 1,654,582 1,479,402Germany 3,685,917 3,739,967 3,128,146 3,072,065 2,711,634 2,769,060Spain 1,783,868 1,833,037 1,927,388 2,033,788 909,389 897,508Switzerland 246,279 256,902 245,214 277,608 402,000 421,727TOTAL 9,541,459 9,406,344 8,953,108 8,801,442 11,161,424 10,704,773CLIENTS | 99
- Page 4 and 5:
Sustainability Report 2012A complet
- Page 6 and 7:
Chairman and Group CEOletter to the
- Page 9 and 10:
sustainability context and complete
- Page 11:
FRANCEE-Cie Vie S.A.Europ Assistanc
- Page 14 and 15:
at a glanceEMPLOYEESEmployee polici
- Page 16 and 17:
at a glanceFINANCIALCOMMUNITYIn a y
- Page 18 and 19:
at a glanceSUPPLIERSThe Generali Gr
- Page 20:
at a glanceENVIRONMENT ANDCLIMATE C
- Page 23:
IndexTHE GROUP 24Mission, vision, v
- Page 26 and 27:
thE group79,454employees69.6billion
- Page 28 and 29:
MISSION, VISION, VALUES AND COMPETE
- Page 30 and 31:
CORPORATE BODIESBoard ofStatutoryAu
- Page 32 and 33:
EngagementDuring the hearing before
- Page 34 and 35:
The Code includes the introduction
- Page 36 and 37:
In Italy, the Group Anti-money Laun
- Page 38 and 39:
In order to make innovation an inte
- Page 40 and 41:
The Generali Group is committed to
- Page 42 and 43:
ADHESION TO EXTERNALVOLUNTARY INITI
- Page 45 and 46:
STAKEHOLDERsPrague - Czech Republic
- Page 47 and 48:
Human resources arethe Group’s fu
- Page 49 and 50: mobility, coaching programmes and p
- Page 51 and 52: Reliability. In addition, the sloga
- Page 53 and 54: In Italy and France, when returning
- Page 55 and 56: normally have the option, often gua
- Page 57 and 58: HEALTH AND SAFETY IN THEWORKPLACETh
- Page 59 and 60: Emirates, the Philippines, Guatemal
- Page 61 and 62: SIZE AND CHARACTERISTICS OF THE WOR
- Page 63 and 64: On average, a third (33.4%) of posi
- Page 65 and 66: Workforce by age bracket2011 2012 2
- Page 67 and 68: Labour disputesNumber and value of
- Page 69 and 70: To foster greater staff involvement
- Page 71 and 72: Committedto innovation anddiversifi
- Page 73 and 74: SIZE AND CHARACTERISTICS OFTHE SALE
- Page 75 and 76: DIRECT CHANNELS, with no intermedia
- Page 77 and 78: Satisfaction surveys on services pr
- Page 79 and 80: Along with thecommitment to strengt
- Page 81 and 82: FINANCIAL AND SUSTAINABILITY PERFOR
- Page 83 and 84: RatingRating agencyRating*A.M.BestA
- Page 85: Main meetings with analysts and inv
- Page 88 and 89: PRODUCT POLICIESCustomer loyalty is
- Page 90 and 91: Products with particular environmen
- Page 92 and 93: Over the last few years, various ro
- Page 94 and 95: • fill out questionnaires with a
- Page 96 and 97: of pre-packaged solutions. As part
- Page 98 and 99: Surveys on servicesGERMANYOnline su
- Page 102 and 103: Change in number of claims2009-2012
- Page 104 and 105: Change in numberof complaints recei
- Page 106 and 107: SUPPLIERSKarolinen Karee, Munich, G
- Page 108 and 109: Relationships with contractual part
- Page 110 and 111: SIZE AND CHARACTERISTICSOF SUPPLIER
- Page 112 and 113: COMMUNITYOld-Aged Survey, Germania1
- Page 114 and 115: GUIDELINES FOR COMMUNITYINITIATIVES
- Page 116 and 117: For example, in 2012 the Generali E
- Page 118 and 119: Cultural areaWith a view to promoti
- Page 120 and 121: Sports areaGenerali regards sport a
- Page 122 and 123: ENVIRONMENT ANDCLIMATE CHANGEOilsee
- Page 124 and 125: In order to pursue the abovemention
- Page 126 and 127: DIRECT ENVIRONMENTAL IMPACTThe data
- Page 128 and 129: Electricity quota from renewable so
- Page 130 and 131: PaperPaper consumption3530252015105
- Page 132 and 133: WaterWater consumption (m 3 )-0.4%3
- Page 134 and 135: In all countries, IT waste, compris
- Page 136 and 137: Flight kilometres travelled by empl
- Page 138 and 139: The increase in exposure to climate
- Page 140 and 141: EXPENDITURES AND INVESTMENTSFOR ENV
- Page 142 and 143: ENVIRONMENTAL RANKINGGenerali’s a
- Page 145 and 146: CONTENTINDEXParis - France
- Page 147 and 148: REPORTEDGLOBALCOMPACTPRINCIPLESCROS
- Page 149 and 150: GLOBALREPORTED COMPACTPRINCIPLESful
- Page 151 and 152:
REPORTEDGLOBALCOMPACTPRINCIPLESCROS
- Page 153:
GLOBALREPORTED COMPACTCROSS-REFEREN
- Page 156 and 157:
GRIINDICATORSDESCRIPTIONASPECT: Div
- Page 158 and 159:
GRIINDICATORSDESCRIPTIONSOCIETYDisc
- Page 160 and 161:
GRIINDICATORSDESCRIPTIONASPECT: Pub
- Page 162 and 163:
GRIINDICATORSDESCRIPTIONASPECT: Cus
- Page 164 and 165:
GRIINDICATORSFS3. CoreDESCRIPTIONPr
- Page 168:
Co-ordination:Corporate Social Resp