The Atlantic Meridional Overturning Circulation and the subpolar ...
The Atlantic Meridional Overturning Circulation and the subpolar ...
The Atlantic Meridional Overturning Circulation and the subpolar ...

You also want an ePaper? Increase the reach of your titles
YUMPU automatically turns print PDFs into web optimized ePapers that Google loves.
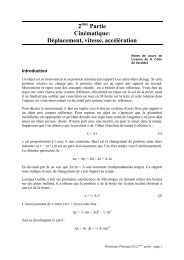
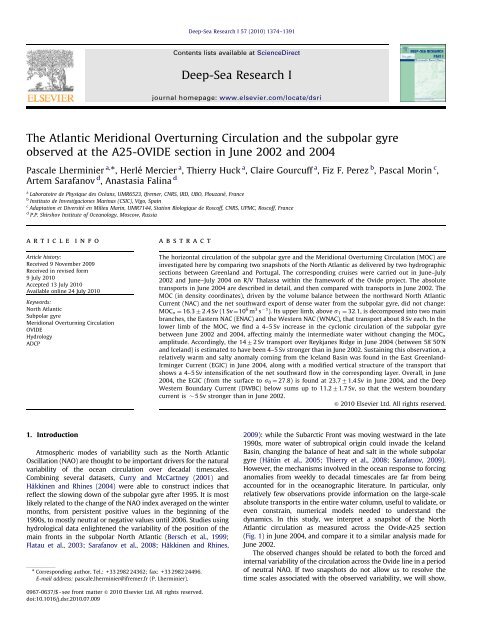
Deep-Sea Research I 57 (2010) 1374–1391Contents lists available at ScienceDirectDeep-Sea Research Ijournal homepage: www.elsevier.com/locate/dsri<strong>The</strong> <strong>Atlantic</strong> <strong>Meridional</strong> <strong>Overturning</strong> <strong>Circulation</strong> <strong>and</strong> <strong>the</strong> <strong>subpolar</strong> gyreobserved at <strong>the</strong> A25-OVIDE section in June 2002 <strong>and</strong> 2004Pascale Lherminier a, , Herlé Mercier a , Thierry Huck a , Claire Gourcuff a , Fiz F. Perez b , Pascal Morin c ,Artem Sarafanov d , Anastasia Falina da Laboratoire de Physique des Océans, UMR6523, Ifremer, CNRS, IRD, UBO, Plouzané, Franceb Instituto de Investigaciones Marinas (CSIC), Vigo, Spainc Adaptation et Diversité en Milieu Marin, UMR7144, Station Biologique de Roscoff, CNRS, UPMC, Roscoff, Franced P.P. Shirshov Institute of Oceanology, Moscow, Russiaarticle infoArticle history:Received 9 November 2009Received in revised form9 July 2010Accepted 13 July 2010Available online 24 July 2010Keywords:North <strong>Atlantic</strong>Subpolar gyre<strong>Meridional</strong> <strong>Overturning</strong> <strong>Circulation</strong>OVIDEHydrologyADCPabstract<strong>The</strong> horizontal circulation of <strong>the</strong> <strong>subpolar</strong> gyre <strong>and</strong> <strong>the</strong> <strong>Meridional</strong> <strong>Overturning</strong> <strong>Circulation</strong> (MOC) areinvestigated here by comparing two snapshots of <strong>the</strong> North <strong>Atlantic</strong> as delivered by two hydrographicsections between Greenl<strong>and</strong> <strong>and</strong> Portugal. <strong>The</strong> corresponding cruises were carried out in June–July2002 <strong>and</strong> June–July 2004 on R/V Thalassa within <strong>the</strong> framework of <strong>the</strong> Ovide project. <strong>The</strong> absolutetransports in June 2004 are described in detail, <strong>and</strong> <strong>the</strong>n compared with transports in June 2002. <strong>The</strong>MOC (in density coordinates), driven by <strong>the</strong> volume balance between <strong>the</strong> northward North <strong>Atlantic</strong>Current (NAC) <strong>and</strong> <strong>the</strong> net southward export of dense water from <strong>the</strong> <strong>subpolar</strong> gyre, did not change:MOC s ¼ 16:372:4Sv(1Sv¼10 6 m 3 s 1 ). Its upper limb, above s 1 ¼ 32:1, is decomposed into two mainbranches, <strong>the</strong> Eastern NAC (ENAC) <strong>and</strong> <strong>the</strong> Western NAC (WNAC), that transport about 8 Sv each. In <strong>the</strong>lower limb of <strong>the</strong> MOC, we find a 4–5 Sv increase in <strong>the</strong> cyclonic circulation of <strong>the</strong> <strong>subpolar</strong> gyrebetween June 2002 <strong>and</strong> 2004, affecting mainly <strong>the</strong> intermediate water without changing <strong>the</strong> MOC samplitude. Accordingly, <strong>the</strong> 1472 Sv transport over Reykjanes Ridge in June 2004 (between 58 3 50uN<strong>and</strong> Icel<strong>and</strong>) is estimated to have been 4–5 Sv stronger than in June 2002. Sustaining this observation, arelatively warm <strong>and</strong> salty anomaly coming from <strong>the</strong> Icel<strong>and</strong> Basin was found in <strong>the</strong> East Greenl<strong>and</strong>-Irminger Current (EGIC) in June 2004, along with a modified vertical structure of <strong>the</strong> transport thatshows a 4–5 Sv intensification of <strong>the</strong> net southward flow in <strong>the</strong> corresponding layer. Overall, in June2004, <strong>the</strong> EGIC (from <strong>the</strong> surface to s 0 ¼ 27:8) is found at 23.771.4 Sv in June 2004, <strong>and</strong> <strong>the</strong> DeepWestern Boundary Current (DWBC) below sums up to 11.271.7 Sv, so that <strong>the</strong> western boundarycurrent is 5 Sv stronger than in June 2002.& 2010 Elsevier Ltd. All rights reserved.1. IntroductionAtmospheric modes of variability such as <strong>the</strong> North <strong>Atlantic</strong>Oscillation (NAO) are thought to be important drivers for <strong>the</strong> naturalvariability of <strong>the</strong> ocean circulation over decadal timescales.Combining several datasets, Curry <strong>and</strong> McCartney (2001) <strong>and</strong>Häkkinen <strong>and</strong> Rhines (2004) were able to construct indices thatreflect <strong>the</strong> slowing down of <strong>the</strong> <strong>subpolar</strong> gyre after 1995. It is mostlikely related to <strong>the</strong> change of <strong>the</strong> NAO index averaged on <strong>the</strong> wintermonths, from persistent positive values in <strong>the</strong> beginning of <strong>the</strong>1990s, to mostly neutral or negative values until 2006. Studies usinghydrological data enlightened <strong>the</strong> variability of <strong>the</strong> position of <strong>the</strong>main fronts in <strong>the</strong> <strong>subpolar</strong> North <strong>Atlantic</strong> (Bersch et al., 1999;Flatau et al., 2003; Sarafanov et al., 2008; Häkkinen <strong>and</strong> Rhines, Corresponding author. Tel.: +33 2982 24362; fax: +33 2982 24496.E-mail address: pascale.lherminier@ifremer.fr (P. Lherminier).2009): while <strong>the</strong> Subarctic Front was moving westward in <strong>the</strong> late1990s, more water of subtropical origin could invade <strong>the</strong> Icel<strong>and</strong>Basin, changing <strong>the</strong> balance of heat <strong>and</strong> salt in <strong>the</strong> whole <strong>subpolar</strong>gyre (Hátún et al., 2005; Thierry et al., 2008; Sarafanov, 2009).However, <strong>the</strong> mechanisms involved in <strong>the</strong> ocean response to forcinganomalies from weekly to decadal timescales are far from beingaccounted for in <strong>the</strong> oceanographic literature. In particular, onlyrelatively few observations provide information on <strong>the</strong> large-scaleabsolute transports in <strong>the</strong> entire water column, useful to validate, oreven constrain, numerical models needed to underst<strong>and</strong> <strong>the</strong>dynamics. In this study, we interpret a snapshot of <strong>the</strong> North<strong>Atlantic</strong> circulation as measured across <strong>the</strong> Ovide-A25 section(Fig. 1) inJune2004,<strong>and</strong>compareittoasimilaranalysismadeforJune 2002.<strong>The</strong> observed changes should be related to both <strong>the</strong> forced <strong>and</strong>internal variability of <strong>the</strong> circulation across <strong>the</strong> Ovide line in a periodof neutral NAO. If two snapshots do not allow us to resolve <strong>the</strong>time scales associated with <strong>the</strong> observed variability, we will show,0967-0637/$ - see front matter & 2010 Elsevier Ltd. All rights reserved.doi:10.1016/j.dsr.2010.07.009
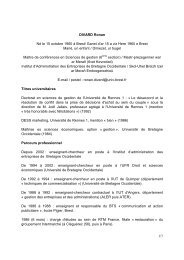
P. Lherminier et al. / Deep-Sea Research I 57 (2010) 1374–1391 137568N37N40N45W45N50NIrmingerSea60N 1215 21 5002736 Icel<strong>and</strong>55NBFZ Basin46 100040W65NGr eenl<strong>and</strong>DSReykjanesRidgeIcel<strong>and</strong>HattonB.RockallP.58 ESM62CGF Z 15006972752000798330WMid <strong>Atlantic</strong> RidgeAzoresPlateauABR20W2500903000FBCWest EuropeanBasinIberianAbyssalPlainU.K.109 118IberianPeninsula10W0EGICDWBCEGCNIICICWNACENACFig. 1. (a) Ovide hydrological stations (black numbers) plotted on bathymetry (500 m intervals). CGFZ: Charlie-Gibbs Fracture Zone; BFZ: Bight Fracture Zone. FBC: Faroe-Bank Channel. ESM: Eriador Seamount; ABR: Azores-Biscay Rise. White numbers refer to <strong>the</strong> along-section distance from Greenl<strong>and</strong> (601N 43 3 09uW). (b) A schematic viewof <strong>the</strong> upper <strong>and</strong> deep-ocean currents (plain <strong>and</strong> dashed lines, respectively) following Schott et al. (2004), apart from a more upstream separation of <strong>the</strong> North <strong>Atlantic</strong>Current in an eastern (ENAC) <strong>and</strong> a western (WNAC) branch, as suggested by Ovide observations. DWBC: Deep Western Boundary Current; EGC: East Greenl<strong>and</strong> Current;EGIC: East Greenl<strong>and</strong>-Irminger Current; IC: Irminger Current; NIIC: North Icel<strong>and</strong> Irminger Current.however, that some of <strong>the</strong> features most likely participate to <strong>the</strong>contraction <strong>and</strong> salinification of <strong>the</strong> <strong>subpolar</strong> gyre observed since1995 (Häkkinen <strong>and</strong> Rhines, 2004; Johnson <strong>and</strong> Gruber, 2007).<strong>The</strong> method consists in <strong>the</strong> computation of absolute transportsacross <strong>the</strong> section via <strong>the</strong> inversion of <strong>the</strong> geostrophic velocity fieldcombined with direct current measurements. <strong>The</strong> obtained transportsshow our best estimates of <strong>the</strong> circulation at <strong>the</strong> time of <strong>the</strong> surveys.This method is particularly suitable in <strong>the</strong> <strong>subpolar</strong> gyre where <strong>the</strong>circulation is strongly barotropic. <strong>The</strong> objective is to underst<strong>and</strong> someaspects of <strong>the</strong> coupling between <strong>the</strong> <strong>subpolar</strong> gyre horizontalcirculation <strong>and</strong> <strong>the</strong> <strong>Meridional</strong> <strong>Overturning</strong> <strong>Circulation</strong> (MOC).As it was articulated by Schott <strong>and</strong> Br<strong>and</strong>t (2007),‘‘estimating<strong>the</strong> variability of <strong>the</strong> MOC from <strong>the</strong> ocean observations aloneis a challenging task’’. To begin with, one must define a suitable
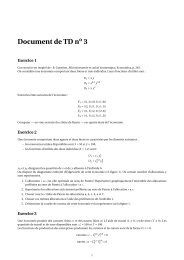
1376P. Lherminier et al. / Deep-Sea Research I 57 (2010) 1374–1391estimate of <strong>the</strong> overturning. In our study, <strong>the</strong> geographicdissociation of <strong>the</strong> warm northward inflow in <strong>the</strong> WesternEuropean Basin <strong>and</strong> <strong>the</strong> cold southward outflow in <strong>the</strong> IrmingerBasin at <strong>the</strong> same depths (Fig. 1) introduces a 3–4 Sv ‘‘Deaconcell’’effect (1 Sv¼10 6 m 3 s 1 ) when <strong>the</strong> MOC is estimated by <strong>the</strong>transport integrated in depth coordinates (Schott <strong>and</strong> Br<strong>and</strong>t,2007; Lherminier et al., 2007; Marsh et al., 2005). Computing <strong>the</strong>MOC in density coordinates ðMOC s Þ takes into account <strong>the</strong> factthat most of <strong>the</strong> East Greenl<strong>and</strong>-Irminger Current (EGIC) at 601Nultimately belongs to <strong>the</strong> lower limb of <strong>the</strong> MOC, while <strong>the</strong> North<strong>Atlantic</strong> Current (NAC) at <strong>the</strong> same depths belongs to <strong>the</strong> upperlimb. Thus it appears to better reflect <strong>the</strong> water mass transformationnorth of <strong>the</strong> Ovide section <strong>and</strong> <strong>the</strong> associated heat transport.In <strong>the</strong> following, we first present our method for estimating<strong>the</strong> transports across <strong>the</strong> section. Next, we show that <strong>the</strong> MOC swas 16.3 Sv both in June 2002 <strong>and</strong> 2004 <strong>and</strong> analyze how <strong>the</strong>horizontal circulation contributes to <strong>the</strong> overturning. Using fluxestimates at <strong>the</strong> Greenl<strong>and</strong>–Scotl<strong>and</strong> sills, we find that <strong>the</strong>transport over Reykjanes Ridge nearly doubled in 2004, <strong>and</strong> <strong>the</strong>nidentify <strong>the</strong> important role of <strong>the</strong> circulation at <strong>the</strong> intermediatelevels in this pattern. <strong>The</strong> water masses sampled on <strong>the</strong> sectionare <strong>the</strong>n described at <strong>the</strong> light of <strong>the</strong> computed transports, withan emphasis on <strong>the</strong> origin of observed changes in <strong>the</strong> IrmingerCurrent <strong>and</strong> in <strong>the</strong> East Greenl<strong>and</strong>-Irminger Current. <strong>The</strong> results<strong>and</strong> <strong>the</strong>ir limitations are <strong>the</strong>n discussed in <strong>the</strong> last section.2. Data <strong>and</strong> method2.1. CTD, oxygen <strong>and</strong> silicate data<strong>The</strong> Ovide 2004 survey was carried out on <strong>the</strong> French R/VThalassa. <strong>The</strong> hydrological section line (Fig. 1) is identical to <strong>the</strong> lineof Ovide 2002 discussed in Lherminier et al. (2007) (L07 hereafter).Observations started on 13 June 2004 <strong>and</strong> ended on 3 July 2004. Itis composed of 106 CTD stations, beginning 8 Nm from Greenl<strong>and</strong>at station 12, <strong>and</strong> finishing at station 118 on <strong>the</strong> Portuguese shelf.When R/V Thalassa arrived at <strong>the</strong> tip of Greenl<strong>and</strong>, part of <strong>the</strong> shelfwas covered with ice, but <strong>the</strong> East Greenl<strong>and</strong> Coastal Current couldbe observed, in contrast with <strong>the</strong> 2002 survey where we could onlybegin sampling at <strong>the</strong> shelf break, 21 Nm from Greenl<strong>and</strong>.At each station, measurements of temperature, conductivity<strong>and</strong> pressure were obtained using a Neil Brown Mark III CTDprobe. Dissolved oxygen was measured with an SBE-43. <strong>The</strong>rosette was equipped with 28 8-l bottles. Seawater samples wereanalyzed on board to determine salinity <strong>and</strong> dissolved oxygenconcentration—for calibration purposes—as well as nutrients, pH<strong>and</strong> alkalinity used for anthropogenic carbon inventories (Pérezet al., 2008). <strong>The</strong> CTDO 2 measurement accuracies are better than1 dbar for pressure, 0.002 1C for temperature, 0.003 for salinity<strong>and</strong> 1 mmol kg 1 for dissolved oxygen (Billant et al., 2006). <strong>The</strong>vertical sections of properties (y, S,O 2 ) are shown in Fig. 2.Silicate (actually orthosilicic acid Si(OH)4) was measured frombottle samples using Fanning <strong>and</strong> Pilson (1973) method with anAuto Analyser II Bran <strong>and</strong> Luebbe (Fig. 3). We obtain a precisionbetter than 70:25 mmol l 1 , i.e. 0.10% of <strong>the</strong> full scale in <strong>the</strong>WOCE st<strong>and</strong>ard (Joyce, 1991).2.2. SADCP data<strong>The</strong> velocity <strong>and</strong> direction of <strong>the</strong> oceanic currents weremeasured along <strong>the</strong> route by <strong>the</strong> two Shipboard Acoustic DopplerCurrent Profilers (SADCP): an RDI Narrow B<strong>and</strong> at 75 kHz (NB75)<strong>and</strong> an RDI Broad B<strong>and</strong> at 150 kHz (BB150). Raw data wereprocessed as explained in L07. At stations, SADCP profiles could becompared with Lowered ADCP profiles processed by <strong>the</strong> LDEO-Visbeck software (Visbeck, 2002).Between <strong>the</strong> stations, we corrected <strong>the</strong> NB75 alignment by+0.221 so that we find no correlation between ship velocity <strong>and</strong><strong>the</strong> current velocity perpendicular to <strong>the</strong> ship track. This correctionis different from <strong>the</strong> Ovide 2002 survey ðþ0:45 3 Þ in all likelihoodbecause <strong>the</strong> placement of <strong>the</strong> GPS antennas was changed in <strong>the</strong>meantime, leading to a slight change in <strong>the</strong> ship mean headingestimates. In this work, we relied largely on <strong>the</strong> NB75 currentsaveraged in <strong>the</strong> layer from 200 to 400 m depth between stations.However, since this ADCP failed between stations 73 <strong>and</strong> 76, weused <strong>the</strong> BB150 data in <strong>the</strong> 40–130 m layer <strong>the</strong>re, after makingsure that <strong>the</strong> Ekman currents could be neglected (weak winds).<strong>The</strong> BB150 data were also more appropriate on <strong>the</strong> shallow EastGreenl<strong>and</strong> Shelf, from stations 12 to 15. An alignment correction of0.121 was applied on <strong>the</strong> BB150 data.Barotropic tidal currents were removed using <strong>the</strong> global 1/4degree tide model of Egbert et al. (1994). Note that tidal currentsthat were removed were all smaller than <strong>the</strong> error estimate of <strong>the</strong>SADCP mean velocity between stations shown in Fig. 4c.2.3. Transport estimates across <strong>the</strong> section<strong>The</strong> data are combined in a generalized least squares inversemodel (Lux et al., 2000), as in L07, to estimate <strong>the</strong> absolute velocityacross <strong>the</strong> Ovide section <strong>and</strong> quantify <strong>the</strong> associated uncertaintybased on one st<strong>and</strong>ard deviation (<strong>the</strong> st<strong>and</strong>ard error). We start froman a priori solution that consists of <strong>the</strong> geostrophic velocity field as<strong>the</strong> sum of <strong>the</strong> <strong>the</strong>rmal wind <strong>and</strong> apriori(first guess) reference levelvelocities. <strong>The</strong> objective of <strong>the</strong> inversion is to refine <strong>the</strong> velocityestimates at <strong>the</strong> reference level by minimizing—in <strong>the</strong> least squaressense—a set of constraints given by independent estimates oftransports (i.e. ADCP measurements <strong>and</strong> integral transports of mass<strong>and</strong> tracers) <strong>and</strong> <strong>the</strong> distance to <strong>the</strong> a priori solution. Each piece ofinformation is weighted by an associated error (see L07 for moredetails). <strong>The</strong> model gives an absolute velocity field along withst<strong>and</strong>ard errors. All <strong>the</strong> transports discussed hereafter are countedpositive north-eastward <strong>and</strong> include <strong>the</strong> Ekman transport calculatedseparately from Quikscat winds <strong>and</strong> equally distributed in <strong>the</strong>first 30 m. Sections 2.3.1 <strong>and</strong> 2.3.2 give <strong>the</strong> details of <strong>the</strong> constraintsthat are specific to <strong>the</strong> 2004 inversion. <strong>The</strong> reader not interested inthose details might skip directly to <strong>the</strong> presentation of <strong>the</strong> resultingvelocity field Section 2.3.3.2.3.1. Selecting <strong>the</strong> a priori solution<strong>The</strong> reference level is set at different isopycnals depending on<strong>the</strong> region: s 1 ¼ 32:35 or bottom between stations 12 <strong>and</strong> 46,s 2 ¼ 36:94 between stations 46 <strong>and</strong> 49, s 2 ¼ 37 between stations49 <strong>and</strong> 70, s 4 ¼ 45:84 or bottom between stations 70 <strong>and</strong> 118. <strong>The</strong>depth of <strong>the</strong> reference level is plotted in Fig. 4a. In <strong>the</strong> westernboundary current (stations 12–22), an a priori velocity value of0.15 m s 1 is chosen at <strong>the</strong> reference levels, based on <strong>the</strong>average of SADCP <strong>and</strong> Lowered ADCP (LADCP) observations ofthree different cruises (Fourex 1997 <strong>and</strong> Ovide). O<strong>the</strong>rwise, <strong>the</strong> apriori reference level velocity is set to 0 (stations 22–118) inagreement with <strong>the</strong> weak velocities measured by <strong>the</strong> LADCP,except at pair 62 (st. 73–74) where all current observationssuggest a peculiar barotropic circulation (Fig. 4b).<strong>The</strong> a priori velocity error at <strong>the</strong> reference level, shown in greyin Fig. 4b, is chosen between 0.01 <strong>and</strong> 0.15 m s 1 according to <strong>the</strong>observed variability of <strong>the</strong> circulation at this level. <strong>The</strong> largeuncertainties, up to 0.15 m s 1 , permitted in <strong>the</strong> Irminger-Icel<strong>and</strong>Basins, take into account <strong>the</strong> full-depth energetic features seen on<strong>the</strong> LADCP section (Fig. 5a). Final estimates of <strong>the</strong> reference levelvelocities (Fig. 4b) result from <strong>the</strong> final inversion called ‘‘OV04’’ in
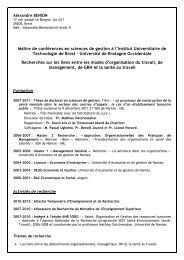
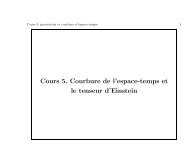
1378P. Lherminier et al. / Deep-Sea Research I 57 (2010) 1374–1391Depth (m)05001000150020002500300035004000450050001217 22 27 32 37 42 47 52 57 62 67 72 77 82 87 92 97 102 107 118σ 1=32.1>4540353025201614121086 Silicate420 μ mol/kg -1σ 1=32.38Distance from Greenl<strong>and</strong> (km)σ 2=36.94σ 4=45.850 500 1000 1500 2000 2500 3000Fig. 3. Ovide 2004 section of dissolved silicate (Si(OH)4). Bottle levels are materialized with light grey dots. For each station, silicate profiles were interpolated with a 10 mvertical resolution using density from CTD data.<strong>the</strong> following, <strong>and</strong> based on this a priori field plus all <strong>the</strong>constraints developed in Section 2.3.2. Those velocities arefound reasonably compatible with <strong>the</strong> first guess.<strong>The</strong> a priori solution takes into account some specific patternsof <strong>the</strong> velocity field as measured by <strong>the</strong> LADCP in June 2004.<strong>The</strong>refore, it is slightly different from <strong>the</strong> a priori solution that waschosen for <strong>the</strong> June 2002 section in L07. An experiment conductedwith <strong>the</strong> same a priori solution as in 2002 showed that <strong>the</strong>adjustments made on <strong>the</strong> a priori velocity field improved <strong>the</strong>compatibility with <strong>the</strong> constraints developed hereafter, withoutchanging <strong>the</strong> solution significantly.2.3.2. ConstraintsAs in L07, <strong>the</strong> overall volume transport to <strong>the</strong> north is set to1 Sv, in agreement with <strong>the</strong> latest estimates of <strong>the</strong> Arcticexchanges with <strong>the</strong> North <strong>Atlantic</strong> (Cuny et al., 2005; Maslowskiet al., 2004; Serreze et al., 2006). Imposing this constraint is alsoconsistent with high resolution models, which show a monthlyvariability of 71 Sv across <strong>the</strong> Ovide section (A.-M. Treguier, pers.communication). Ganachaud (2003) shows that <strong>the</strong> ageostrophicvariability of <strong>the</strong> ocean, induced by internal wave isopycnal heavehas an uncompensated transport near <strong>the</strong> slopes, inducing a 3 Sverror in <strong>the</strong> volume constraint we set. <strong>The</strong> section was sampledwithin 20 days, so one might expect that this lack of synopticityhas consequences on <strong>the</strong> net transport across <strong>the</strong> section, besides<strong>the</strong> effect of ageostrophic dynamics. However, typical mesoscalefeatures are crossed within 1 or 2 days, i.e. much less than <strong>the</strong>irtypical timescale, so that eddies have actually a negligible nettransport. For this reason, Ganachaud (2003) concluded thatnon-synopticity is not <strong>the</strong> main issue in inverse analysis ofhydrological surveys. As a result, <strong>the</strong> accumulated effect ofnon-synopticity, ageostrophy <strong>and</strong> monthly variability leads to a73 Sv st<strong>and</strong>ard error on <strong>the</strong> volume transport. After <strong>the</strong> inversionOV04, a value of 0.172.5 Sv is obtained (Table 1).O<strong>the</strong>r constraints are provided by <strong>the</strong> transports calculatedfrom <strong>the</strong> SADCP measurements averaged between <strong>the</strong> stations <strong>and</strong>projected perpendicular to <strong>the</strong> section, to be directly comparableto geostrophic transports. Averaging SADCP data between stationsbelow <strong>the</strong> Ekman layer minimizes <strong>the</strong> spatial aliasing <strong>and</strong> <strong>the</strong>impact of <strong>the</strong> ageostrophic dynamics. <strong>The</strong> errors on <strong>the</strong> SADCPvelocity estimates are calculated as in L07 <strong>and</strong> lie between 0.01<strong>and</strong> 0.06 m s 1 (Fig. 4c), large values resulting from short-distancepairs or from bad wea<strong>the</strong>r. Unfortunately, <strong>the</strong> SADCP data couldnot be used in <strong>the</strong> oligotrophic Iberian Abyssal Plain, becausesuitable reflectors are probably much scarcer than in <strong>the</strong> o<strong>the</strong>rparts of <strong>the</strong> section. Residuals on SADCP constraints, normalizedby <strong>the</strong> a priori error, are plotted Fig. 4d. Comparing <strong>the</strong> a priori <strong>and</strong><strong>the</strong> final residuals shows <strong>the</strong> sensible improvement in <strong>the</strong>compatibility between <strong>the</strong> geostrophic velocity field <strong>and</strong> <strong>the</strong>SADCP data.<strong>The</strong> transport in <strong>the</strong> Eastern Boundary Current (stations109–118) was estimated by LADCP measurements as in L07, <strong>and</strong>used as an additional constraint: 573 Sv in <strong>the</strong> top layer (down tos 2 ¼ 36:94), <strong>and</strong> 172 Sv below. It results in transports of 2.570.8<strong>and</strong> 1.570.8 Sv in those boxes after inversion. Adding all <strong>the</strong>ADCP constraints diminishes <strong>the</strong> uncertainties on <strong>the</strong> transport ofeach current (Table 1).<strong>The</strong> solution minimizing <strong>the</strong> squared distance to <strong>the</strong> a priorisolution <strong>and</strong> residuals of all <strong>the</strong> constraints above, shown in <strong>the</strong>‘‘+ADCP’’ column of Table 1, results in large uncertainties in <strong>the</strong>Iberian Abyssal Plain (IAP) deep circulation, as it could beexpected from <strong>the</strong> lack of direct velocity measurements or ADCPconstraints <strong>the</strong>re. Fur<strong>the</strong>rmore, <strong>the</strong> net silicate transport of67 kmol s 1 across <strong>the</strong> section is slightly high compared to whatwe can find in <strong>the</strong> literature (Fogelqvist et al., 2003; Álvarez et al.,2002; Dittmar <strong>and</strong> Kattner, 2003). To improve <strong>the</strong> silicate budget<strong>and</strong> reduce <strong>the</strong> uncertainties, we use an overall constraint of0730 kmol s 1 . As expected, <strong>the</strong> silicate constraint reducessignificantly <strong>the</strong> northward transport of Antarctic Bottom Water(AABW), but mainly in <strong>the</strong> IAP (Table 1) where no o<strong>the</strong>r dataconstrain <strong>the</strong> solution; <strong>the</strong> transport is hardly changed west of <strong>the</strong>Azores-Biscay Rise (Fig. 1a) where <strong>the</strong> deep water is also rich insilicate. To compensate for this issue of <strong>the</strong> least squares method,we also constrain <strong>the</strong> bottom transport of <strong>the</strong> IAP to 0.870.8 Sv,consistently with <strong>the</strong> method <strong>and</strong> estimates of McCartney (1992)<strong>and</strong> Saunders (1987). This way, we recover <strong>the</strong> a priorigeostrophic total transport of AABW with a more balanced impactof <strong>the</strong> silicate constraint east <strong>and</strong> west of <strong>the</strong> Azores-Biscay Rise,while <strong>the</strong> silicate transport is reduced to 5728 kmol s 1 . Adetailed comparison between <strong>the</strong> solutions with or without <strong>the</strong>last 2 constraints shows that, considering <strong>the</strong> computed errors,both solutions are compatible (Table 1). However, we prefer touse <strong>the</strong> fully constrained solution, named ‘‘OV04’’, that bothconserves silicate <strong>and</strong> is close to published estimates of <strong>the</strong>bottom water transport in <strong>the</strong> IAP (McCartney, 1992).
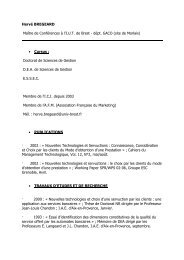
P. Lherminier et al. / Deep-Sea Research I 57 (2010) 1374–1391 13790−1000Depth (m)−2000−3000−4000−50000 500 1000 1500 2000 2500 300012 21 31 41 51 61 71 81 91 101 111Ref. level velocity (m/s)0.10−0.1−0.2−0.30 500 1000 1500 2000 2500 30000.06Error on SADCP ctt (m/s)0.050.040.030.020.0100 500 1000 1500 2000 2500 3000Resid. on ADCP ctt50−50 500 1000 1500 2000 2500 3000Distance (km)Fig. 4. Inverse model set-up <strong>and</strong> performance for OV04. (a) Ovide section with a 2 km resolution bathymetry measured with a 12 kHz sounder <strong>and</strong> <strong>the</strong> depth of <strong>the</strong>reference levels used in <strong>the</strong> inversion. (b) Velocities at <strong>the</strong> reference level: values after inversion (black dotted line) with final error interval, <strong>and</strong> a priori values (grey line)<strong>and</strong> error (grey patch). (c) Error on <strong>the</strong> SADCP velocity used to constrain each pair of stations. (d) Residuals of <strong>the</strong> SADCP constraints before (dotted grey line) <strong>and</strong> afterinversion (dotted black line) normalized by <strong>the</strong> SADCP errors shown above.2.3.3. Results<strong>The</strong> resulting OV04 velocity field is plotted in Fig. 5b. <strong>The</strong>comparison with <strong>the</strong> quasi-independent LADCP data Fig. 5a <strong>and</strong> cis remarkable, considering that <strong>the</strong> LADCP velocity field is aliasedby <strong>the</strong> discrete spatial sampling (see L07 for evidence of thisaliasing). Indeed, all <strong>the</strong> main features are resolved in bothvelocity fields with similar intensities, although <strong>the</strong> inversesolution is a geostrophic average between stations <strong>and</strong> <strong>the</strong> LADCPprofiles are local measurements.In Fig. 5c, comparisons at three selected depths above 2000 m(LADCP data are more uncertain below) show that <strong>the</strong> agreementis not as good in <strong>the</strong> IAP, as a result from <strong>the</strong> lack of SADCPconstraints <strong>the</strong>re. However, no bias could be detected, <strong>and</strong> <strong>the</strong>mesoscale patterns seem to be simply smoo<strong>the</strong>d out, as expected.
1380P. Lherminier et al. / Deep-Sea Research I 57 (2010) 1374–1391Depth (m)0−1000−2000−3000−4000−500012 17 22 27 32 37 42 47 52 57 62 67 72 77 82 87 92 97 102 107 St#32.432.450.50.40.30.20.10−0.1−0.2−0.3−0.4−0.5−0.7 m/s31.832.132.232.332.3532.431.632.4532.5.0 500 1000 1500 2000 2500 3000Distance (km)3232.5.232.132.232.332.3532.432.45Depth (m)0−1000−2000−3000−4000−500012 17 22 27 32 37 42 47 52 57 62 67 72 77 82 87 92 97 102 107 St#32.432.450.50.40.30.20.10−0.1−0.2−0.3−0.4−0.5−0.7 m/s31.832.132.232.332.3532.431.632.4532.5.500 1000 1500 2000 2500 3000Distance (km)3232.5.232.132.232.332.3532.432.45Velocity (m/s)0.20.1−0.1 0−0.2−0.30.20.1−0.1 0−0.2−0.30.20.1−0.1 0−0.2−0.3LADCPINVERSION0 500 1000 1500 2000 2500 3000Distance (km)Fig. 5. Ovide 2004 velocity section perpendicular to <strong>the</strong> section (a) measured with <strong>the</strong> LADCP at stations, (b) resulting from <strong>the</strong> geostrophic inversion, i.e. representative of <strong>the</strong>mean velocity between stations. LADCP <strong>and</strong> inverse velocity estimates are independent. Isopycnal s 1 lines (black) <strong>and</strong> <strong>the</strong> reference levels (brown) are plotted. (c) Comparisonof LADCP (black) <strong>and</strong> OV04 inversion (red) velocities at 500, 1000 <strong>and</strong> 2000 m depths. LADCP data have been interpolated linearly at <strong>the</strong> mid-distance of station pairs.500m1000m2000mNorth-west of <strong>the</strong> IAP, <strong>the</strong> st<strong>and</strong>ard deviation of differencebetween <strong>the</strong> inverse <strong>and</strong> LADCP velocities is similar to <strong>the</strong> LADCPprecision, i.e. 0:03 m s 1 .3. Analysis of <strong>the</strong> <strong>Meridional</strong> <strong>Overturning</strong> <strong>Circulation</strong> <strong>and</strong> <strong>the</strong>heat flux3.1. <strong>The</strong> <strong>Meridional</strong> <strong>Overturning</strong> <strong>Circulation</strong><strong>The</strong> vertical structure of <strong>the</strong> circulation during Ovide 2004(OV04 solution) is plotted in Fig. 6, along with Fourex 1997(in August 1997, called 4X97 hereafter) <strong>and</strong> Ovide 2002 (in June2002, called OV02 hereafter) that were presented in L07. <strong>The</strong>transports integrated in density layers (thin lines) depict <strong>the</strong>transport of <strong>the</strong> two limbs of <strong>the</strong> MOC s : northward aboves 1 32:1 <strong>and</strong> southward below. Once accumulated from <strong>the</strong>bottom with a change in <strong>the</strong> sign (thick lines), <strong>the</strong> value of <strong>the</strong>MOC s can be read as <strong>the</strong> maximum, i.e. 16.4 Sv in OV04, 16.2 Sv inOV02 <strong>and</strong> 18.5 Sv in 4X97, with an uncertainty of 72.4 Sv givenby <strong>the</strong> inverse model. Unlike L07, we calculate <strong>the</strong> MOC s byaccumulating <strong>the</strong> transport from <strong>the</strong> bottom, since we realizedthat <strong>the</strong> non-zero net transport is a consequence of <strong>the</strong> large scalecirculation through <strong>the</strong> Arctic Ocean, <strong>and</strong> <strong>the</strong>refore affects mainly
P. Lherminier et al. / Deep-Sea Research I 57 (2010) 1374–1391 1381Table 1Results of different inversions, beginning with no constraint except <strong>the</strong> reference velocity <strong>and</strong> associated errors (‘‘no constraint’’), <strong>and</strong> progressively adding <strong>the</strong> differenttypes of constraints.No constraint Volume only + ADCPs + Silic. + IAP OV04Net trsp. (Sv) 25 726 1.0 73.0 0.8 72.9 0.1 72.6 0.1 72.5MOC s (Sv) 16.4 73.4 16.0 72.6 16.3 72.5 16.4 72.4Heat flux (10 15 W) 0.55 70.08 0.53 70.07 0.51 70.05 0.51 70.05Sil. flux (kmol s 1 ) 104 7160 67 7117 4 729 5 728EGIC, st. 12–21 (Sv) 18.8 77.4 11.5 76.9 23.8 71.4 23.7 71.4 23.7 71.4DWBC, st. 12–27 (Sv) 11.8 75.4 8.2 74.4 11.6 71.8 11.3 71.7 11.2 71.7AABW,WEB (Sv) 0.9 72.1 1.2 72.0 1.3 71.7 0.7 71.0 1.0 70.6AABW,IAP (Sv) 1.0 72.0 1.2 71.9 0.9 71.7 0.3 71.3 0.7 70.7‘‘Volume only’’ includes <strong>the</strong> 173 Sv overall transport. <strong>The</strong> ‘‘+ ADCPs’’ includes <strong>the</strong> volume constraint <strong>and</strong> <strong>the</strong> SADCP between Greenl<strong>and</strong> <strong>and</strong> <strong>the</strong> Iberian Abyssal Plain (IAP)<strong>and</strong> <strong>the</strong> LADCP on <strong>the</strong> eastern boundary. ‘‘+ Silic.’’ conserves also <strong>the</strong> silicate content north of <strong>the</strong> section, <strong>and</strong> ‘‘+ IAP’’ adds a constraint on part of <strong>the</strong> bottom transport(details in <strong>the</strong> text). <strong>The</strong> last column corresponds to <strong>the</strong> final solution. Note that for each inversion, all constraints are applied in once. <strong>The</strong> ‘‘Net trsp’’ is <strong>the</strong> total transportacross <strong>the</strong> section after inversion; MOC s is <strong>the</strong> <strong>Meridional</strong> <strong>Overturning</strong> <strong>Circulation</strong> integrated in isopynal layers. <strong>The</strong> heat flux is computed as RR rC pvy dx dz (where C p is<strong>the</strong> specific heat of water, v its velocity <strong>and</strong> y <strong>the</strong> potential temperature relative to 0 1C), neglecting <strong>the</strong> fact that <strong>the</strong> net transport is not exactly zero. <strong>The</strong> EGIC <strong>and</strong> <strong>the</strong>DWBC are separated by s 2 ¼ 36:94; <strong>the</strong> total transport below s 4 ¼ 45:85 in <strong>the</strong> Western European Basin (called AABW-WEB) is shown versus its contribution in <strong>the</strong> IAP(AABW-IAP, between stations 92 <strong>and</strong> 109).σ 13030.130.230.330.430.5FOUREX 199730.6OVIDE 200230.7OVIDE 200430.830.93131.131.231.331.431.531.631.731.831.9Upper layer3232.132.2Intermediate layer32.332.432.5Deep + bottom layer32.6-10 -5 0 5 10 15 20Transport in Svσ 130.83131.231.431.631.83232.232.432.6ColdbranchUpper layerIntermediate layerWest Europ. B. 2002West Europ. B. 2004Irminger Sea 2002Irminger Sea 2004Deep layerWarmbranchBottom layerσ MOCσ32.42Dσ32.54B-20 -15 -10 -5 0 5 10 15 20Transport (Sv)Fig. 6. Transport integrated in density ðs 1 Þ layers with a 0.01 kg m 3 resolution(thin lines) across Ovide section in OV02 <strong>and</strong> OV04 (grey <strong>and</strong> black, respectively)<strong>and</strong> across Fourex section in 4X97 (dashed grey). Values were multiplied by 10 forclarity. <strong>The</strong> same transports accumulated from <strong>the</strong> bottom are shown in thicklines. <strong>The</strong> sign was changed (positive north-eastward) so that <strong>the</strong> maximumcorresponds to <strong>the</strong> MOC s values (see text). <strong>The</strong> line at s 1 ¼ 32:42 gives <strong>the</strong> upperlimit of <strong>the</strong> deep water ðs D Þ, <strong>and</strong> 32.1 <strong>the</strong> density of <strong>the</strong> MOC s maximum ðs MOC Þ.<strong>the</strong> lightest waters that pass <strong>the</strong> sills. This is <strong>the</strong> reason why <strong>the</strong>1997 estimate is 0.5 Sv weaker than in L07. So we conclude thatwe obtain a similar MOC in June 2002 <strong>and</strong> June 2004, one that isweaker than in 1997. As in OV02, <strong>the</strong> MOC s amplitude is onlymarginally affected by <strong>the</strong> ADCP constraints (Table 1), <strong>and</strong> itsestimation error is mainly related to <strong>the</strong> uncertainty on <strong>the</strong> nettransport across <strong>the</strong> section.In <strong>the</strong> following, <strong>the</strong> isopycnal of <strong>the</strong> maximum of <strong>the</strong> MOCwill be labelled s MOC (i.e. s 1 ¼ 32:2 in 2002 <strong>and</strong> 32.1 in 2004), <strong>and</strong><strong>the</strong> layer above will be referred to as <strong>the</strong> upper layer. <strong>The</strong>isopycnal s D between <strong>the</strong> intermediate <strong>and</strong> deep layer is set ats 2 ¼ 36:94, that corresponds to s 1 32:42 or more classicallys 0 27:8. <strong>The</strong> isopycnal s B separates <strong>the</strong> deep <strong>and</strong> <strong>the</strong> bottomFig. 7. Transport in <strong>the</strong> Irminger Sea (plain lines) <strong>and</strong> in <strong>the</strong> West European Basin(dashed lines), accumulated from <strong>the</strong> bottom in 2002 (grey) <strong>and</strong> 2004 (black), as afunction of s 1 . s MOC is <strong>the</strong> level of <strong>the</strong> MOC s maximum, s D is <strong>the</strong> upper limit of <strong>the</strong>deep water, <strong>and</strong> s B ðs 1 ¼ 32:54Þ <strong>the</strong> upper limit of <strong>the</strong> DSOW layer.layers that transport, respectively, <strong>the</strong> North-East <strong>Atlantic</strong> DeepWater (NEADW) <strong>and</strong> <strong>the</strong> Denmark Strait Overflow Water (DSOW)in <strong>the</strong> Irminger Sea. This limit is set here at s 0 ¼ 27:88, i.e.s 1 32:54 or s 2 37:1.<strong>The</strong> western boundary current, composed of <strong>the</strong> East-Greenl<strong>and</strong>/Irminger Current (EGIC) <strong>and</strong> <strong>the</strong> Deep Western Boundary Current(DWBC), is an important contributor to <strong>the</strong> southward branch of <strong>the</strong>MOC. Near Greenl<strong>and</strong>, we define <strong>the</strong> DWBC as <strong>the</strong> southwardtransport of water denser than s D between <strong>the</strong> slope <strong>and</strong> <strong>the</strong>deepest station in <strong>the</strong> Irminger Sea (station 27 in 2004), followinghere <strong>the</strong> definition of Bacon (1998). Its transport is estimated at11.271.7 Sv. It is 2 Sv stronger than in OV02, <strong>and</strong> similar to <strong>the</strong>4X97 value (L07). In terms of decadal variability, <strong>the</strong> DWBC wasfound to increase by at least 2 Sv between <strong>the</strong> mid-1990s <strong>and</strong> <strong>the</strong>2000s around a mean value of 9Sv (Sarafanov et al., 2009, in
1382P. Lherminier et al. / Deep-Sea Research I 57 (2010) 1374–1391press), close to our 2002 estimate. Mooring arrays at Cape Farewellgave 7.8 Sv in 2005–2006 (Bacon <strong>and</strong> Saunders, 2010) <strong>and</strong>13Svin1978 (Dickson <strong>and</strong> Brown, 1994). So <strong>the</strong> DWBC measured in 2004st<strong>and</strong>s in <strong>the</strong> upper range of <strong>the</strong> different estimates.<strong>The</strong> EGIC, above <strong>the</strong> DWBC, also contributes to <strong>the</strong> southwardtransport of dense water below <strong>the</strong> density of <strong>the</strong> MOC maximumðs MOC Þ. This dense part of <strong>the</strong> EGIC ðs 1 Zs MOC Þ transports24.272.0 Sv in OV04 (stations 12–23), 6 Sv more than in OV02,when <strong>the</strong> EGIC is defined here from <strong>the</strong> Greenl<strong>and</strong> to <strong>the</strong> pair ofstations where <strong>the</strong> flow reverses to <strong>the</strong> north (at 59 3 41u39 3 35uboth years, i.e. 200 km from Greenl<strong>and</strong>). However, part of thischange is due to an intensified cyclonic circulation in <strong>the</strong> IrmingerSea, <strong>and</strong> once integrated on <strong>the</strong> basin (Fig. 7), <strong>the</strong> net increase isonly 3 Sv in <strong>the</strong> EGIC. So <strong>the</strong> transport of <strong>the</strong> dense part of <strong>the</strong>western boundary current (<strong>the</strong> DWBC plus <strong>the</strong> EGIC contributingto <strong>the</strong> MOC) is about 5 Sv larger in June 2004 than in June 2002,although <strong>the</strong> net MOC s is <strong>the</strong> same. As <strong>the</strong> Reykjanes Ridge acts asa natural barrier in <strong>the</strong> deep horizontal circulation, <strong>the</strong> totalbaroclinic transport shown in Fig. 6 has been decomposed west<strong>and</strong> east of <strong>the</strong> ridge in Fig. 7. <strong>The</strong> baroclinic structure of <strong>the</strong> upperlayer (Fig. 7) is similar for both inversions, showing mainly <strong>the</strong>northward transport of <strong>the</strong> lightest waters of <strong>the</strong> North <strong>Atlantic</strong>Current in <strong>the</strong> Western European Basin. However, <strong>the</strong> layer belowbehaves differently: no net transport is found east of <strong>the</strong> ridge inOV02, but in OV04, approximately 5 Sv of intermediate watersflow to <strong>the</strong> north into <strong>the</strong> Western European Basin, while a similaradditional flow is found southwards in <strong>the</strong> Irminger Sea above <strong>the</strong>DSOW, between s MOC <strong>and</strong> s B . In this export, <strong>the</strong> contribution of<strong>the</strong> upper intermediate layer ðs MOC os 1 o32:25Þ is particularlystrong in 2004. Those changes will be fur<strong>the</strong>r discussed in <strong>the</strong> lastsection.3.2. <strong>The</strong> heat fluxIn OV04, <strong>the</strong> net heat transport northward amounts to 0.5170.05 PW (1 PW¼10 15 W); it was found at 0.44 PW in OV02 <strong>and</strong>0.66 PW in 4X97, with a similar error (L07). So <strong>the</strong> net heat flux isslightly, but not significantly, higher in OV04 than in OV02. Asmall part of <strong>the</strong> difference (0.007 PW) is due to a 1.6 1C warmersurface layer (over 40 m), due to a particularly warm Spring in2004.In June 2002 <strong>and</strong> 2004, <strong>the</strong> net heat fluxes are significantlysmaller than in August 1997, with Ovide values closer to <strong>the</strong>climatological heat flux (Álvarez et al., 2002). Only 0.02 PW couldbe explained by <strong>the</strong> slightly different locations of <strong>the</strong> sections(see Fig. 1 <strong>and</strong> <strong>the</strong> discussion in L07). Although we cannot prove ityet, we expect some correlation between <strong>the</strong> heat flux <strong>and</strong> <strong>the</strong>MOC s , since <strong>the</strong> area covered by <strong>the</strong> upper limb of <strong>the</strong> MOC soverlaps with <strong>the</strong> NAC that brings heat northward, <strong>and</strong> since <strong>the</strong>contribution of <strong>the</strong> eddies <strong>and</strong> me<strong>and</strong>ers to <strong>the</strong> heat transportacross <strong>the</strong> section was shown to be small (Treguier et al., 2006).Indeed, from ocean models constrained by observations, Hucket al. (2008) show a strong relation between MOC s (THC of <strong>the</strong>irFig. 2) <strong>and</strong> heat flux at 481N, <strong>and</strong> both reached a maximum in <strong>the</strong>mid 1990s <strong>and</strong> have been declining since (T. Huck, personalcomm.). In contrast, one expects a weaker correlation between<strong>the</strong> MOC integrated over depth <strong>and</strong> <strong>the</strong> heat transport for sectionscrossing <strong>the</strong> <strong>subpolar</strong> gyre (Biastoch et al., 2007).In <strong>the</strong> following section, we decompose <strong>the</strong> structure of <strong>the</strong>upper limb of <strong>the</strong> MOC s <strong>and</strong> show <strong>the</strong> similarities in June 2002 <strong>and</strong>2004 despite a strong mesoscale turbulence. <strong>The</strong>n, we investigate<strong>the</strong> large scale horizontal circulation at intermediate depth, quantifyits intensification in June 2004, <strong>and</strong> examine <strong>the</strong> consequences for<strong>the</strong> transport <strong>and</strong> hydrological properties of individual currents.4. Variability of <strong>the</strong> upper ocean circulation <strong>and</strong> itscontribution to <strong>the</strong> MOCWe propose now to identify <strong>the</strong> water masses <strong>and</strong> quantify <strong>the</strong>transports that contributes to <strong>the</strong> upper limb of <strong>the</strong> MOC s , i.e.above s MOC (Fig. 8). East of Eriador Seamount, <strong>the</strong> transport isdominated by <strong>the</strong> large NAC sustained by <strong>the</strong> contrast between<strong>the</strong> relatively cold-fresh waters of <strong>the</strong> <strong>subpolar</strong> gyre <strong>and</strong> <strong>the</strong>warmer-saltier water of subtropical origin (Belkin <strong>and</strong> Levitus,1996; Bersch et al., 1999). In this front, <strong>the</strong> top layer salinityincreases from about 35 to 35.6 (Fig. 8a). Holliday et al. (2008)specify that over <strong>the</strong> 1976–2006 time period, <strong>the</strong> salinity valuesover <strong>the</strong> North-East <strong>Atlantic</strong> reach a maximum around 2004. <strong>The</strong>net northward flow of <strong>the</strong> NAC is scattered among powerfuleddies <strong>and</strong> me<strong>and</strong>ers within <strong>the</strong> front (Fig. 8b).4.1. Westward shift of <strong>the</strong> NAC northwestern branch<strong>The</strong> nor<strong>the</strong>rn limit of <strong>the</strong> NAC is observed in June 2004 at 531N<strong>and</strong> 251W, near Eriador Seamount (<strong>the</strong> prolongation of Hatton Bank,1450 km from Greenl<strong>and</strong> on <strong>the</strong> section). This current is found about200 km to <strong>the</strong> south-east in June 2002, in <strong>the</strong> prolongation of <strong>the</strong>Rockall Plateau. At 521N, near <strong>the</strong> Charlie-Gibbs Fracture Zone(CGFZ), <strong>the</strong> position of <strong>the</strong> NAC is relatively constrained by <strong>the</strong>bathymetry. At Ovide latitudes, it is more spread out <strong>and</strong> Belkin <strong>and</strong>Levitus (1996) for example have reported shifts of <strong>the</strong> NAC positionup to 300 km over a few months. However, <strong>the</strong> nor<strong>the</strong>rn limit of <strong>the</strong>NAC is easily identified in Fig. 8a <strong>and</strong> b, <strong>and</strong> seems to be influencedby <strong>the</strong> two topographic features south of <strong>the</strong> Rockall Plateau(Fig. 8c). Its relatively sou<strong>the</strong>rn position observed in June 2002, near51 3 30uN, is possibly linked to <strong>the</strong> ‘‘sou<strong>the</strong>rn mode’’ described byBower <strong>and</strong> von Appen (2008): in 2002–2003, altimetry <strong>and</strong> floatmeasurements show that <strong>the</strong> North <strong>Atlantic</strong> Current crossed <strong>the</strong>Mid-<strong>Atlantic</strong> Ridge at an extreme sou<strong>the</strong>rn position, with a flowclose to zero in <strong>the</strong> CGFZ. In June 2004, <strong>the</strong> flow through CGFZ isdominant again, <strong>and</strong> <strong>the</strong> NAC nor<strong>the</strong>rn limit is found more to <strong>the</strong>north downstream during Ovide; large me<strong>and</strong>ers also appearswithin <strong>the</strong> 1000 km-wide NAC, in agreement with intense <strong>and</strong>sustained EKE observed by Häkkinen <strong>and</strong> Rhines (2009) in 2004. <strong>The</strong>velocity profile just north of <strong>the</strong> front is very barotropic, with avelocity of +0.15 m s 1 at <strong>the</strong> reference level after inversion (Fig. 4b,station 61), <strong>and</strong> recalls <strong>the</strong> observation of <strong>the</strong> NAC front made bySchott et al. (1999) at <strong>the</strong> CGFZ in 1997.4.2. Recirculation into <strong>the</strong> subtropical gyre<strong>The</strong> sou<strong>the</strong>rn limit of <strong>the</strong> NAC is more difficult to determine,because it depends on how one takes into account <strong>the</strong> southwardrecirculation in <strong>the</strong> Iberian Basin. For convenience, we place<strong>the</strong> limit on <strong>the</strong> Azores-Biscay Rise that, in <strong>the</strong> mean circulationscheme of Paillet <strong>and</strong> Mercier (1997), separates <strong>the</strong> broad northwardflow associated with <strong>the</strong> NAC <strong>and</strong> <strong>the</strong> southward recirculationin <strong>the</strong> Iberian Basin. <strong>The</strong> transport of this southward recirculationamounts to 8 Sv in OV02 <strong>and</strong> 3 Sv in OV04 in <strong>the</strong> top layer (Fig. 8),<strong>and</strong> was shown to be anti-correlated with <strong>the</strong> NAC northwardtransport in an eddy-resolving model (Treguier et al., 2006). So <strong>the</strong>sou<strong>the</strong>astern part of <strong>the</strong> section mainly describes a varyinganticyclonic circulation centered on <strong>the</strong> Azores-Biscay Rise, that isfed by <strong>the</strong> eastern part of <strong>the</strong> NAC <strong>and</strong> belongs to subtropical gyre.4.3. Branches <strong>and</strong> fate of <strong>the</strong> NACWithin <strong>the</strong> NAC, it is possible to distinguish several branchescharacterized by <strong>the</strong> maxima in <strong>the</strong> northward transport.Could our transport calculation be used to support <strong>the</strong> scheme
1384P. Lherminier et al. / Deep-Sea Research I 57 (2010) 1374–139160.7±1.37.1±1.41.5±1.37.9±1.33.3±1.69.6±2.14.5 ±1.813.8 ±2.16.2±3.511.4±3.73.5±1.82.8±1.7June-July 2002: above σ 2 =36.94June-July 2004: above σ 2 =36.9412.5±3.119.6±3.32.8±0.83.2±0.83.4±0.82.9±0.83.3 ±1.64.5±1.85.9±1.53.5±1.88.5±1.92.8±1.70.1±2.20.2±1.8June-July 2002: below σ 2 =36.94June-July 2004: below σ 2 =36.94Fig. 9. Transport balance between <strong>the</strong> Greenl<strong>and</strong>–Scotl<strong>and</strong> sills <strong>and</strong> <strong>the</strong> Ovide section (numbers in Sv) on top of <strong>the</strong> bathymetry. Top (bottom) plots refers to <strong>the</strong> layerabove (below) s D ðs 0 27:8Þ. OV02 results are on <strong>the</strong> left (a,c), OV04 on <strong>the</strong> right (b,d). Arrows indicate <strong>the</strong> direction, but <strong>the</strong>ir size are only a qualitative indication of <strong>the</strong>transports. Crosses <strong>and</strong> circles are for downward <strong>and</strong> upward net transports, respectively. Across <strong>the</strong> Ovide section, grey arrows <strong>and</strong> numbers come from <strong>the</strong> inversionsdescribed in Section 2.3. Black arrows <strong>and</strong> numbers come from <strong>the</strong> generalized least squares inversion discussed in Section 5.entrainment of Lower Deep Water (rich in AABW, see van Aken,2000) in <strong>the</strong> Icel<strong>and</strong>–Scotl<strong>and</strong> Overflow Water (ISOW, itself <strong>the</strong>product of a mixing down <strong>the</strong> Icel<strong>and</strong>–Scotl<strong>and</strong> sills as explainedin Yashayaev <strong>and</strong> Dickson, 2008; Sarafanov et al., 2010). <strong>The</strong>NEADW totally belongs to <strong>the</strong> lower layer, as attested by <strong>the</strong>increase in silicate concentration with depth, which exceeds12 mmol kg 1 only below s D on each side of Reykjanes Ridge inFig. 3. <strong>The</strong> Ovide section crosses Reykjanes Ridge at <strong>the</strong> latitude of58 3 50uN. As seen in Fig. 2, <strong>the</strong> deep water lies below <strong>the</strong> top ofReykjanes Ridge. Considering that <strong>the</strong>re is no sill in <strong>the</strong> ridgebetween <strong>the</strong> Ovide section <strong>and</strong> Icel<strong>and</strong> nor any evidence that <strong>the</strong>isopycnals rise northwards, significant quantities of deep watercannot pass over Reykjanes Ridge between <strong>the</strong> section <strong>and</strong>Icel<strong>and</strong>. Thus one finds three interfaces between those fourboxes, <strong>and</strong> four interfaces with <strong>the</strong> <strong>subpolar</strong> seas.We are interested in estimating <strong>the</strong> fluxes <strong>and</strong> errors through <strong>the</strong>seven interfaces of <strong>the</strong> four boxes, <strong>the</strong> transports across <strong>the</strong> Ovideline being known as a result of <strong>the</strong> previous inversions. <strong>The</strong> sevenfluxes are linked with five equations: <strong>the</strong> balance of overall volumeflux across <strong>the</strong> Greenl<strong>and</strong>–Scotl<strong>and</strong> sills <strong>and</strong> <strong>the</strong> Ovide section(reflecting <strong>the</strong> overall volume conservation), <strong>and</strong> <strong>the</strong> volumeconservation in <strong>the</strong> 4 boxes. <strong>The</strong> method <strong>and</strong> hypo<strong>the</strong>sis used toestimate those fluxes are fur<strong>the</strong>r described in Appendix A. Note that<strong>the</strong> transport through <strong>the</strong> English Channel (0.1 Sv) is neglected.5.2. Transport estimates in June 2002 <strong>and</strong> 2004Transports estimated in OV02 <strong>and</strong> OV04 are illustrated inFig. 9. <strong>The</strong> variability of <strong>the</strong> transport above Reykjanes Ridgest<strong>and</strong>s out. Increasing from 9.6 Sv in June 2002 to 13.8 Sv in June2004, it quantifies <strong>the</strong> statement made in Section 3.1: <strong>the</strong><strong>subpolar</strong> gyre was found more energetic in June 2004. <strong>The</strong>additional 4–5 Sv found above <strong>the</strong> ridge in 2004 are consistentwith a similar increase identified in <strong>the</strong> intermediate layer onboth sides of <strong>the</strong> ridge (Fig. 7).One may object that <strong>the</strong> flow connecting <strong>the</strong> Icel<strong>and</strong> Basin <strong>and</strong><strong>the</strong> Irminger Sea could have simply passed round <strong>the</strong> ridge moreto <strong>the</strong> south in 2002 instead of over <strong>the</strong> ridge. However, <strong>the</strong>northward Irminger Current (Fig. 1), as measured across <strong>the</strong> Ovidesection west of <strong>the</strong> Reykjanes Ridge, did not vary significantlybetween OV02 <strong>and</strong> OV04 (Fig. 8, between 530 <strong>and</strong> 700 km);examining <strong>the</strong> barotropic transport, it was found at about 13 Svfrom surface to bottom both years. It means that an additional
P. Lherminier et al. / Deep-Sea Research I 57 (2010) 1374–1391 1385westward flux appeared in <strong>the</strong> intermediate layer above <strong>the</strong>ridge, that entirely fed a stronger export of water from <strong>the</strong>Irminger Sea.<strong>The</strong> Denmark Strait overflow at Denmark Strait <strong>and</strong> <strong>the</strong>entrainment from <strong>the</strong> intermediate water tends also to bestronger in OV04 than in OV02, feeding <strong>the</strong> stronger DeepWestern Boundary Current across Ovide. <strong>The</strong> overall picture isconsistent with <strong>the</strong> relation between <strong>the</strong> overflow intensity <strong>and</strong><strong>the</strong> subsequent entrainment, as shown in Price <strong>and</strong> Baringer(1994). However, <strong>the</strong> entrainment here is an estimate over <strong>the</strong>whole Irminger Sea, <strong>and</strong> some entrainment can be suspectedwithin <strong>the</strong> Irminger Current, independently from <strong>the</strong> plumedynamics of <strong>the</strong> overflow (Lauderdale et al., 2008). Since <strong>the</strong>transport in <strong>the</strong> bottom layer at 601N is similar in OV02 <strong>and</strong> OV04(2 Sv, Fig. 7), it is actually plausible that <strong>the</strong> overflow did notchange much. No significant change can indeed be seen betweenMay 2002 <strong>and</strong> 2004 in <strong>the</strong> transport of <strong>the</strong> bottom layer whenlooking at <strong>the</strong> 631N Angmassalik timeseries reported by Dicksonet al. (2008a) (considering advection times of about one month).East of Reykjanes Ridge, <strong>the</strong> neutral transport of water denserthan s D through <strong>the</strong> Ovide section reflects <strong>the</strong> balance between<strong>the</strong> northward flow of Lower Deep Water, that includes AABW(van Aken, 2000), <strong>and</strong> <strong>the</strong> southward flow of NEADW alongReykjanes Ridge. So <strong>the</strong> resulting 2.8–3.5 Sv found upward in <strong>the</strong>Western European Basin includes <strong>the</strong> upwelling due to <strong>the</strong>blocking of <strong>the</strong> Lower Deep Water by <strong>the</strong> bathymetry, minus<strong>the</strong> entrainment by <strong>the</strong> Icel<strong>and</strong> Scotl<strong>and</strong> Overflow (about 1 Sv inSmethie et al., 2000). A net NEADW southward export of 2–4 Sv isfound in <strong>the</strong> DWBC east of <strong>the</strong> Reykjanes Ridge in June 2002 <strong>and</strong>2004, consistently with previous estimates of Saunders (1994).To conclude this section, <strong>the</strong> 4–5 Sv increase in <strong>the</strong> transportover Reykjanes Ridge in June 2004, as compared to 2002, is <strong>the</strong>most noticeable result of this analysis. We will now show howthis result modified <strong>the</strong> hydrological properties of <strong>the</strong> nor<strong>the</strong>astern<strong>subpolar</strong> gyre in <strong>the</strong> intermediate layer.6. Origin <strong>and</strong> fate of <strong>the</strong> flow across <strong>the</strong> Reykjanes Ridge6.1. Evolution of <strong>the</strong> hydrological properties along <strong>the</strong> <strong>subpolar</strong> gyrecirculationIn order to better identify <strong>the</strong> water masses advected from <strong>the</strong>Icel<strong>and</strong> Basin to <strong>the</strong> Irminger Sea, <strong>the</strong> eastern <strong>subpolar</strong> gyre isdivided into three regions. Each region is illustrated in Fig. 10 bytwo y2S plots of <strong>the</strong> corresponding Ovide stations in OV02 <strong>and</strong>OV04, over color patches indicating <strong>the</strong> transports binned in <strong>the</strong>y2S space.<strong>The</strong> first region to be discussed is <strong>the</strong> Icel<strong>and</strong> Basin, between<strong>the</strong> top of Reykjanes Ridge to <strong>the</strong> nor<strong>the</strong>rn limit of <strong>the</strong> NAC. <strong>The</strong>cyclonic circulation of <strong>the</strong> Icel<strong>and</strong> Basin is particularly visible inOV04 (Fig. 10b), where <strong>the</strong> fresher waters are advected northward,in <strong>the</strong> eastern Icel<strong>and</strong> Basin <strong>and</strong> west of <strong>the</strong> NAC, <strong>and</strong> <strong>the</strong>saltier southward, along Reykjanes Ridge. This repartition oftransport-properties in <strong>the</strong> upper layer shows that (i) <strong>the</strong> origin of<strong>the</strong> salt along Reykjanes Ridge has to be found more to <strong>the</strong> nor<strong>the</strong>astin <strong>the</strong> NAC (Pollard et al., 2004; Thierry et al., 2008), <strong>and</strong> (ii)<strong>the</strong> SubArctic Intermediate Water (SAIW) visible by <strong>the</strong> relativeminima in salinity (Harvey <strong>and</strong> Arhan, 1988) <strong>and</strong> advectednorthward in <strong>the</strong> Icel<strong>and</strong> Basin has a minor influence near <strong>the</strong>ridge. <strong>The</strong> bipolar transport-property repartition is much lessclear in 2002 (Fig. 10a), because <strong>the</strong> cyclonic circulation was quiteweak <strong>and</strong> <strong>the</strong> SAIW not so present. However, <strong>the</strong> southwardcurrent east of <strong>the</strong> ridge also transports <strong>the</strong> saltier water.<strong>The</strong> eastern Irminger Sea (Figs. 10c <strong>and</strong> d) is subject to <strong>the</strong>influence of <strong>the</strong> north-eastward Irminger Current. <strong>The</strong> origin ofthis current is still debated. It is generally admitted that <strong>the</strong>barotropic anticyclonic circulation observed around ReykjanesRidge during Ovide surveys exists all year round, following f/Hcontours (Bower et al., 2002; Treguier et al., 2005). In ourobservations, <strong>the</strong> Irminger Current has <strong>the</strong> structure typical ofsummer as described in Knutsen et al. (2005). Fur<strong>the</strong>r west,Lavender et al. (2005) describe narrow cyclonic circulations justoffshore Greenl<strong>and</strong> that connect <strong>the</strong> central Labrador Sea <strong>and</strong>central Irminger Sea, <strong>and</strong> are mainly wind-driven <strong>and</strong> present allyearlong according to Spall <strong>and</strong> Pickart (2003). Those circulationpatterns are represented schematically in Fig. 1b. In June 2004(Fig. 10d), one clearly finds <strong>the</strong> two distinct influences in <strong>the</strong> upperlayer (above about 1700 m) advected northward: on <strong>the</strong> one h<strong>and</strong>,a relatively salty mixing line proper to <strong>the</strong> Icel<strong>and</strong>ic Slope Water(ISW), a mixture of ISOW <strong>and</strong> <strong>Atlantic</strong> <strong>the</strong>rmocline water describedby Yashayaev et al. (2007) <strong>and</strong> flowing southward on <strong>the</strong> eastside of <strong>the</strong> ridge (Figs. 10a <strong>and</strong> b); on <strong>the</strong> o<strong>the</strong>r h<strong>and</strong>, a freshermixing line that incorporates <strong>the</strong> upper Labrador Sea Water (uLSW)<strong>and</strong> most likely belongs to <strong>the</strong> inner <strong>subpolar</strong> gyre. So thisanalysis reveals <strong>the</strong> dual origin of <strong>the</strong> Irminger Current (Icel<strong>and</strong>Basin <strong>and</strong> south of Greenl<strong>and</strong>). Any significant shortcut of <strong>the</strong> NACfrom <strong>the</strong> Charlie-Gibbs Fracture Zone, as described by Pollard et al.(2004) in 1996, would have brought much saltier water into <strong>the</strong>Irminger Sea, <strong>and</strong> is <strong>the</strong>refore very unlikely here.<strong>The</strong> western boundary current is characterized by <strong>the</strong> southwardEGIC above s D , whose hydrological properties are found to be verydifferent in June 2002 <strong>and</strong> 2004. <strong>The</strong> EGIC is usually definedbetween <strong>the</strong> coast <strong>and</strong> <strong>the</strong> center of <strong>the</strong> <strong>the</strong>rmal dome near <strong>the</strong>surface (station 23 in Fig. 2a); going eastward from Greenl<strong>and</strong> along<strong>the</strong> section, it stops where <strong>the</strong> flow reverses, 200 km from <strong>the</strong> coast<strong>and</strong> on <strong>the</strong> 2800 m isobath. Figs. 10e <strong>and</strong> f show in dark blue whichwater masses are <strong>the</strong> most represented in <strong>the</strong> core of <strong>the</strong> EGIC.In June 2002, <strong>the</strong> water mass signatures are quite well preserved,with fresh elbows characteristic of <strong>the</strong> uLSW <strong>and</strong> <strong>the</strong> lower LSW(lLSW), <strong>and</strong> <strong>the</strong> salty influence of <strong>the</strong> ISOW underneath. By contrast,<strong>the</strong> June 2004 y2S plot exhibits a nearly straight mixing line from<strong>the</strong> intermediate water to a quite fresh DSOW (S¼34.83) in <strong>the</strong> coreof <strong>the</strong> current. Only in <strong>the</strong> offshore rim of <strong>the</strong> current can <strong>the</strong>signature of <strong>the</strong> uLSW be found (on two pairs of stations). <strong>The</strong> o<strong>the</strong>rstriking difference between Figs. 10e <strong>and</strong> f is <strong>the</strong> significantsouthward transport of relatively salty intermediate water in2004, at densities around s 1 ¼ 32:15, just below s MOC . A fineranalysis of <strong>the</strong> EGIC indicates a transport of 5.6 Sv of this water, i.e.4.3 Sv more than in June 2002 (32:1os 1 o32:25, S434:95,Fig. 10f). Water within this isopycnal layer is found between 130<strong>and</strong> 370 m, i.e. 100 m thicker <strong>and</strong> deeper than in 2002.6.2. Origin of <strong>the</strong> warm <strong>and</strong> salty anomaly in <strong>the</strong> EGIC in June 2004Based on <strong>the</strong> previous analysis, we modified <strong>the</strong> limits of <strong>the</strong>domain of Fig. 10 (that were based on transport arguments) <strong>and</strong>identified five new regions with coherent hydrological propertiesin <strong>the</strong> <strong>subpolar</strong> gyre (limits detailed in Table 2). <strong>The</strong> meanproperties of waters in those regions are plotted in Fig. 11. <strong>The</strong>WNAC is included, <strong>and</strong> <strong>the</strong> outer rim of <strong>the</strong> EGIC (marked by <strong>the</strong>presence of uLSW) belongs to <strong>the</strong> central Irminger Sea. Weobserve that <strong>the</strong> mean properties of <strong>the</strong> WNAC, of <strong>the</strong> centralIcel<strong>and</strong> Basin <strong>and</strong> those above Reykjanes Ridge did not changesignificantly between 2002 <strong>and</strong> 2004. Noteworthy contrasts arefound in <strong>the</strong> western boundary current, where a warm <strong>and</strong> saltyanomaly between s MOC <strong>and</strong> 32.25 (up to 6.2 1C <strong>and</strong> 35.03) in June2004 has properties very similar to those found on <strong>the</strong> ReykjanesRidge, <strong>and</strong> less than 0.1 fresher than those of <strong>the</strong> WNAC. A smally2S inflection point is also found in <strong>the</strong> 2002 western boundarycurrent at s MOC (i.e. s 1 ¼ 32:2 in 2002), up to 5.2 1C <strong>and</strong> 34.94 in
P. Lherminier et al. / Deep-Sea Research I 57 (2010) 1374–1391 1387On <strong>the</strong> eastern edge of <strong>the</strong> North <strong>Atlantic</strong> <strong>subpolar</strong> gyre, along <strong>the</strong>Ovide section, <strong>the</strong> NAC system was characterized by energeticeddies, among which two main branches, called here <strong>the</strong> WNAC<strong>and</strong> <strong>the</strong> ENAC, were distinguished. While <strong>the</strong> WNAC was found in<strong>the</strong> prolongation of <strong>the</strong> Rockall plateau in June 2002, it was200 km more to <strong>the</strong> north in June 2004, in <strong>the</strong> prolongation of <strong>the</strong>Hatton plateau. Those two distinct positions of <strong>the</strong> WNAC recall<strong>the</strong> sou<strong>the</strong>rn <strong>and</strong> nor<strong>the</strong>rn modes described by Bower <strong>and</strong> vonAppen (2008) at <strong>the</strong> vicinity of Charlie-Gibbs <strong>and</strong> FaradayFracture Zones in summer 2002 <strong>and</strong> 2004, respectively. Most of<strong>the</strong> 8 Sv ENAC top layer transport (Fig. 8) passed <strong>the</strong> Icel<strong>and</strong>–Scotl<strong>and</strong> Sills, while about 8 Sv of <strong>the</strong> WNAC in <strong>the</strong> same densitylayer flowed toward <strong>the</strong> Irminger Sea where <strong>the</strong> water densifiedduring <strong>the</strong> previous winter within <strong>the</strong> eastern <strong>subpolar</strong> gyre isevacuated via <strong>the</strong> EGIC (Brambilla et al., 2008; McCartneyTable 2Limits of <strong>the</strong> hydrological regions plotted in Figs. 10 <strong>and</strong> 11.Region 2004 (2002) stations Location12 (none) 59 3 52uN, 42 3 56uWWBC 15 (6) 59 3 50uN, 42 3 32uW– 21 (12) 59 3 45uN, 40 3 54uWIrm. 23 (14) 59 3 41uN, 39 3 35uW– 31 (22) 59 3 10uN, 34 3 29uWR.R. 36 (27) 58 3 51uN, 31 3 17uWIcel. 46 (36) 56 3 37uN, 27 3 33uW– 62 (44) 53 3 39uN, 25 3 14uW68 (49) 51 3 46uN, 23 3 47uWWNAC 69 (50) 51 3 24uN, 23 3 29uW72 (53) 50 3 17uN, 22 3 36uW75 (56) 49 3 09uN, 21 3 44uW79 (60) 47 3 40uN, 20 3 33uWStation numbers used in <strong>the</strong> text <strong>and</strong> <strong>the</strong> figures are in bold characters.Correspondence between 2002 <strong>and</strong> 2004 numbering is indicated (2002 numbersare between paren<strong>the</strong>sis), so that all stations can be located in Fig. 1 where 2004stations are plotted.<strong>and</strong> Talley, 1984). Of course, additional datasets <strong>and</strong> modelsare required to fur<strong>the</strong>r study <strong>the</strong> stability of <strong>the</strong> consistencybetween <strong>the</strong> ENAC <strong>and</strong> <strong>the</strong> outflow into <strong>the</strong> Nordic seas.Fur<strong>the</strong>rmore, <strong>the</strong> strong eddies observed between <strong>the</strong> twoNAC main branches were likely to facilitate significant watermass exchanges.When measured across <strong>the</strong> section at 58 3 N50u, <strong>the</strong> IrmingerCurrent in OV02 <strong>and</strong> OV04 is estimated at 1273 Sv northwardwest of Reykjanes Ridge <strong>and</strong> balances <strong>the</strong> southward transport ofslightly warmer <strong>and</strong> saltier water measured on <strong>the</strong> o<strong>the</strong>r flank of<strong>the</strong> ridge. In <strong>the</strong> Irminger Sea, <strong>the</strong> Irminger Current is feddownstream by <strong>the</strong> transport over Reykjanes Ridge. Building on<strong>the</strong> (documented) assumption that <strong>the</strong> transports over <strong>the</strong>Greenl<strong>and</strong>–Scotl<strong>and</strong> Sills have a small variability at monthly tointerannual time scales, we found a 14 Sv transport overReykjanes Ridge in June 2004, between <strong>the</strong> section <strong>and</strong> Icel<strong>and</strong>(Fig. 9). Compared to June 2002, <strong>the</strong> additional transport of 4–5 Svwas related to <strong>the</strong> transport increase in <strong>the</strong> intermediate layerupstream (Fig. 7). No clear increase could be found in <strong>the</strong> surfacecurrents seen by altimetry, confirming that <strong>the</strong> anomaly onReykjanes Ridge is found in a sub-surface density layer. In <strong>the</strong>year 2001, Pickart et al. (2005) observed no transport increase in<strong>the</strong> Irminger Current between <strong>the</strong>ir estimates at 591N west ofReykjanes Ridge <strong>and</strong> at 651N off Greenl<strong>and</strong>. This apparentcontradiction with a significant flux over Reykjanes Ridge canonly be explained by a detrainment of similar amplitude from <strong>the</strong>Irminger Current as it flows along Reykjanes Ridge. This detrainedwater would ultimately merge with <strong>the</strong> western boundarycurrent along its path off Greenl<strong>and</strong>.At 601N, west of <strong>the</strong> narrow cyclonic circulation mentioned inSection 6.1, <strong>the</strong> EGIC is found at 23.7 Sv in OV04, when integratedfrom <strong>the</strong> surface to s D . Compared to OV02, <strong>the</strong> 3.2 Sv nettransport increase is concentrated in <strong>the</strong> upper intermediatelayer (Fig. 12). Below s D , <strong>the</strong> DWBC transports 11.2 Sv southward,with <strong>the</strong> 2.1 Sv increase totally located above <strong>the</strong> DSOW layer(i.e. above <strong>the</strong> dashed line in Fig. 12). So <strong>the</strong> 4–5 Sv intensification111098WBC (6−12)Irm. (12− 22)R.R. (22− 36)Icel. (36− 49)WNAC (49−53)26.827WBC (15−21)Irm. (21−31)R.R. (31−46)Icel. (46−62)WNAC (62−69)26.82727. 47627.227. 427. 254332. 132.232.253732.3836.9432. 132.232.2536.9432.3 8237.237.213734.7 34.8 34.9 35 35.1 35.234.7 34.8 34.9 35 35.1 35.2Fig. 11. y2S profiles averaged along isopycnals in <strong>the</strong> different hydrological realms of <strong>the</strong> Ovide section nor<strong>the</strong>rn part, which limits are detailed in Table 2. WBC st<strong>and</strong>s for<strong>the</strong> core of <strong>the</strong> western boundary current (from <strong>the</strong> shelf break to 130 km from Greenl<strong>and</strong>); Irm.: <strong>the</strong> central Irminger Sea (delimited by <strong>the</strong> presence of uLSW); R.R.: <strong>the</strong>Reykjanes Ridge (delimited by <strong>the</strong> anticyclonic circulation around it); Icel.: <strong>the</strong> central Icel<strong>and</strong> Basin; WNAC: <strong>the</strong> most western branch of <strong>the</strong> North <strong>Atlantic</strong> Current. s 0(dotted lines), s 1 (dashed) <strong>and</strong> s 2 (plain) are plotted.
1388P. Lherminier et al. / Deep-Sea Research I 57 (2010) 1374–13913.2±1.9-0.7-+4.3-0.4-0.0±1.85.0±3.9-0.7±1.5σ MOC7°C+0.9±2.12.2±2.0-0.4±1.9-0.3±2.2-0.1±2.9Ovide sectiontransport difference:June 2004 – June 2002nor<strong>the</strong>astwardsouthwestwardFig. 12. Differences in transports (Sv) across <strong>the</strong> Ovide section: June 2004 minus June 2002. Grey values are not significant. Direction symbols are plotted according to <strong>the</strong>usual direction of <strong>the</strong> flow, <strong>and</strong> differences are algebraic. Thick lines separing <strong>the</strong> regions refer to <strong>the</strong> maximum of <strong>the</strong> MOC ðs MOC Þ, <strong>the</strong> upper limit of <strong>the</strong> deep water ðs D Þ,<strong>the</strong> eastern limits of <strong>the</strong> EGIC <strong>and</strong> of <strong>the</strong> DWBC, <strong>and</strong> <strong>the</strong> nor<strong>the</strong>rn limit of <strong>the</strong> NAC. Dotted isopycnal lines in <strong>the</strong> western boundary current are s MOC , s 1 ¼ 32:25 <strong>and</strong> s B .of <strong>the</strong> intermediate layer circulation found in <strong>the</strong> WNAC <strong>and</strong> overReykjanes Ridge is observed in <strong>the</strong> western boundary current overa density range that includes <strong>the</strong> deep layer, while <strong>the</strong> import ofNEADW in <strong>the</strong> eastern Irminger Sea has not changed (Fig. 12). <strong>The</strong>large diapycnal diffusivity observed in <strong>the</strong> western boundarycurrent by Lauderdale et al. (2008) (up to 10 3 m 2 s 1 in <strong>the</strong> EGIC)likely explain this intensified entrainment of intermediate waterin <strong>the</strong> DWBC in OV04, modifying <strong>the</strong> vertical distribution oftransport mainly below s MOC <strong>and</strong> erasing <strong>the</strong> hydrographicsignatures of <strong>the</strong> LSW <strong>and</strong> ISOW (Fig. 11).<strong>The</strong> bottom layer, representative of <strong>the</strong> DSOW core, transports2 Sv in both years (Fig. 7),butismarkedbymuchfresherwaters in June 2004. This steadiness is in agreement withDickson <strong>and</strong> Brown (1994) conclusion, although it may alsobe a coincidence considering <strong>the</strong> monthly variability of <strong>the</strong>DSOW transport at <strong>the</strong> Denmark Strait (between 2 <strong>and</strong> 4 Sv inMacr<strong>and</strong>er et al., 2005).It can be objected that <strong>the</strong> transports estimated in OV02 <strong>and</strong>OV04 may result from a daily to weekly variability. However, asshown by Ganachaud (2003) <strong>and</strong> discussed in Section 2.3.2, mostof this high frequency variability is damped by <strong>the</strong> inversionmethod that mixes observations made over three weeks. This isconfirmed by <strong>the</strong> first analysis of <strong>the</strong> EGIC transport made by anarray of currentmeters, showing that our results are consistentwith one-month averages (Daniault et al., submitted for publication).At longer timescales, realistic models show that <strong>the</strong>monthly variability of <strong>the</strong> MOC s <strong>and</strong> of <strong>the</strong> boundary currentsis weaker between June <strong>and</strong> August (A.-M. Treguier, pers.communication).In June 2004, a noticeable anomaly of warm <strong>and</strong> salty waterwas found in <strong>the</strong> upper intermediate layer ðs 1 ¼ 32:1232:25Þ, thatdid not exist in June 2002. Both transports <strong>and</strong> properties point to<strong>the</strong> WNAC as its only possible origin. <strong>The</strong> advection of such ananomaly directly from <strong>the</strong> NAC into <strong>the</strong> Irminger Sea (west of <strong>the</strong>Mid-<strong>Atlantic</strong> Ridge) is disregarded here, considering <strong>the</strong> relativelyfresh properties of <strong>the</strong> eastern Irminger Sea (Fig. 10). A focusprocess study will be needed to elucidate <strong>the</strong> timescales of <strong>the</strong>anomalies in transport <strong>and</strong> properties of <strong>the</strong> Irminger Current.However, this intrusion of warm <strong>and</strong> salty water into <strong>the</strong> <strong>subpolar</strong>gyre is consistent with our observation of <strong>the</strong> northwestward shiftof <strong>the</strong> WNAC. At decadal timescales, it also relates with anincreasing intrusion of subtropical water in <strong>the</strong> eastern North<strong>Atlantic</strong> in <strong>the</strong> 2000s (Hátún et al., 2005; Johnson <strong>and</strong> Gruber,2007; Holliday et al., 2008; Häkkinen <strong>and</strong> Rhines, 2009).<strong>The</strong> MOC s was found to be <strong>the</strong> same during OV02 <strong>and</strong> OV04, atabout 16 Sv (Fig. 6), despite <strong>the</strong> changes in <strong>the</strong> horizontalcirculation of <strong>the</strong> <strong>subpolar</strong> gyre intermediate layer. <strong>The</strong> densificationof <strong>Atlantic</strong> Water in <strong>the</strong> Nordic seas results in 6 Sv overflowsat <strong>the</strong> Greenl<strong>and</strong>–Scotl<strong>and</strong> ridge seen at <strong>the</strong> bottom of <strong>the</strong> DWBC,<strong>and</strong> we assumed <strong>the</strong>m to be similar in 2002 <strong>and</strong> 2004. Anentrainment of about 2 Sv is expected to increase <strong>the</strong> DenmarkStrait Overflow transport shortly after <strong>the</strong> sill (Dickson <strong>and</strong>Brown, 1994). Some entrainment (less than 2 Sv) is also expecteddownstream <strong>the</strong> Icel<strong>and</strong>–Scotl<strong>and</strong> overflow, although <strong>the</strong> balancewith a plausible upwelling across s MOC cannot be quantified here.As a result, about 8 Sv of <strong>the</strong> MOC s are inherently associated with<strong>the</strong> overflows.<strong>The</strong>re are still about 8 Sv to explain in <strong>the</strong> MOC s value.According to our results, those find <strong>the</strong>ir source in <strong>the</strong> horizontalcirculation formed mainly by <strong>the</strong> WNAC above s MOC northward<strong>and</strong> <strong>the</strong> EGIC below this isopycnal southward. <strong>The</strong> top of <strong>the</strong>DWBC (3 Sv in OV04, <strong>and</strong> 1 Sv in OV02) is also part of this balance,via <strong>the</strong> entrainment under <strong>the</strong> EGIC, <strong>and</strong> <strong>the</strong> variability of <strong>the</strong>intermediate layer circulation modifies <strong>the</strong> transport distributionin <strong>the</strong> lower limb of <strong>the</strong> MOC s without changing its amplitude. So<strong>the</strong> 8 Sv integral transport southward, above <strong>the</strong> overflowcontribution, is mainly driven by <strong>the</strong> formation of dense waterin <strong>the</strong> North <strong>Atlantic</strong> <strong>subpolar</strong> gyre in winter (Brambilla et al.,2008) that is progressively replaced later on by lighter water via<strong>the</strong> WNAC along <strong>the</strong> horizontal circulation of <strong>the</strong> gyre.One may expect some seasonal variability in <strong>the</strong> contributionof <strong>the</strong> horizontal circulation. This is due to <strong>the</strong> changingstratification in <strong>the</strong> subsurface Irminger Sea, <strong>and</strong> additionally to<strong>the</strong> influence of <strong>the</strong> wind on <strong>the</strong> gyre circulation. This seasonalcycle is not addressed by <strong>the</strong> measurements since <strong>the</strong> Ovidesection is always repeated in June. In a simulation forced by atime-averaged seasonal cycle, Treguier et al. (2006) show a 4 Svpeak-to-peak seasonal variability in <strong>the</strong>ir MOC s across <strong>the</strong> Ovidepath, with a maximum in Spring <strong>and</strong> a minimum in Autumn. At<strong>the</strong> end of <strong>the</strong> winter, <strong>the</strong> EGIC mixed layer deepens <strong>and</strong> getsdenser than s MOC , while <strong>the</strong> stratification did not change much atsimilar densities in <strong>the</strong> WNAC (i.e. below <strong>the</strong> main pycnocline), sothat <strong>the</strong> volume increase at <strong>the</strong> top of <strong>the</strong> MOC s lower limb shallindeed induce a stronger MOC s . Some of <strong>the</strong> MOC s variability is
P. Lherminier et al. / Deep-Sea Research I 57 (2010) 1374–1391 1389Table 3Transport values (in Sv) used for setting <strong>the</strong> a priori fluxes in <strong>the</strong> four boxes model (results on Fig. 9).InterfaceAnnual meantransportMonth std.dev.ReferenceRemarksDeep layer lateral fluxes (s 2 436:94, i.e. s 1 432:42, s 0 427:8)Denmark strait overflow(to <strong>the</strong> North <strong>Atlantic</strong>)3 1 Macr<strong>and</strong>er et al. (2005)Hansen <strong>and</strong> Østerhus (2000)Dickson et al. (2008a)No specific pattern in Springs 2002 <strong>and</strong> 2004Icel<strong>and</strong>–Scotl<strong>and</strong>Overflow (to <strong>the</strong>North <strong>Atlantic</strong>)3 1 Hansen <strong>and</strong> Østerhus (2007)Østerhus et al. (2008)1.970.5 at Faroe-Bank Channel, plus 170.5across Icel<strong>and</strong>-Faroe <strong>and</strong> Wyville-ThompsonRidgeOver Reykjanes R.Ovide—Icel<strong>and</strong>0 0 Reykjanes Ridge acts as a solid barrierUpper layer lateral fluxes (s 2 o36:94, i.e. s 0 o27:8)Icel<strong>and</strong>-Shetl<strong>and</strong> Inflow(to <strong>the</strong> Nordic seas)7.7 2 Summarized in Hansen et al. (2008) Including 3.8 Sv in <strong>the</strong> Faroe branch <strong>and</strong> 3.9 Svin <strong>the</strong> Shetl<strong>and</strong> branchAt <strong>the</strong> Denmark Strait:NIIC+EGCIrminger CurrentOvide—Icel<strong>and</strong>1 2 Jónsson <strong>and</strong> Valdimarsson (2005)Pickart et al. (2005)12 5 Treguier et al. (2005)Bower et al. (2002)NIIC:+0.770.6 SvEGC: 2Sv9.3–15.6 Sv in models(obs.: floats on s 0 ¼ 27:5)Interfaces between <strong>the</strong> two layers (transports positive upward)Irminger Sea 3 10 Dickson <strong>and</strong> Brown (1994)West European Basin +3 10 To compensate <strong>the</strong> Icel<strong>and</strong>–Scotl<strong>and</strong> Overflow(negligible flux across <strong>the</strong> Ovide section)also due to <strong>the</strong> gyre circulation variability induced by <strong>the</strong> wind,stronger in winter, but this point requires a focused study. Finally,as was observed in <strong>the</strong> hydrological properties of <strong>the</strong> Ovidesection, a large fraction of <strong>the</strong> LSW formed in <strong>the</strong> LabradorSea recirculates into <strong>the</strong> <strong>subpolar</strong> gyre before being advectedequatorward in <strong>the</strong> DWBC. So <strong>the</strong> MOC s as calculated hereaccounts for it, but with a lag that is not clear yet <strong>and</strong> needs to bebetter understood.<strong>The</strong> Ovide section reveals a complex eastern <strong>subpolar</strong> gyre thatcan be seen as an imbrication of four cyclonic circulations: a tightcyclonic circulation off Greenl<strong>and</strong>; a larger but closed gyre(in terms of full-depth stream lines) with an eastern frontier at<strong>the</strong> nor<strong>the</strong>astern limit of <strong>the</strong> WNAC (Fig. 8); a larger gyre up to <strong>the</strong>ENAC <strong>and</strong> to <strong>the</strong> Greenl<strong>and</strong>–Scotl<strong>and</strong> sills, responsible of abouthalf of <strong>the</strong> water mass transformation in <strong>the</strong> <strong>subpolar</strong> North<strong>Atlantic</strong> according to this analysis; <strong>and</strong> <strong>the</strong> large-scale gyre thatincludes <strong>the</strong> Nordic seas <strong>and</strong> accounts for <strong>the</strong> o<strong>the</strong>r half.Acknowledgements<strong>The</strong> authors wish to acknowledge <strong>the</strong> colleagues <strong>and</strong> shipcrews who collected all <strong>the</strong> data discussed in this paper, <strong>and</strong> KeithRodgers for his help in <strong>the</strong> manuscript. <strong>The</strong> Quikscat gridded winddata were obtained from CERSAT, at IFREMER, Plouzané (France).For this work, Pascale Lherminier <strong>and</strong> Ca<strong>the</strong>rine Kermabon weresupported by Ifremer, Herlé Mercier, Thierry Huck <strong>and</strong> PascalMorin by CNRS, Claire Gourcuff by Ifremer <strong>and</strong> CNES, Fiz F. Perezby <strong>the</strong> European Commission within <strong>the</strong> 6th Framework Program(EU FP6 CARBOCEAN Integrated Project, Contract no. 511176).Artem Sarafanov <strong>and</strong> Anastasia Falina were supported by<strong>the</strong> Russian Ministry of Education <strong>and</strong> Science under <strong>the</strong>‘‘World Ocean’’ Federal Programme (contract 01.420.1.2.0001),<strong>the</strong> RFBR grant 08-05-00858 <strong>and</strong> <strong>the</strong> Russian President grantMK-394.2010.5. <strong>The</strong> Ovide project mainly relies on funds fromIfremer, INSU <strong>and</strong> LEFE.Appendix A. <strong>The</strong> four-box model: method <strong>and</strong> <strong>the</strong> a priorisolutionTo estimate unknown fluxes across <strong>the</strong> box interfaces in Fig. 9,one might set <strong>the</strong> two well-known overflows at 3 Sv towards <strong>the</strong>lower boxes, use <strong>the</strong> transports across <strong>the</strong> Ovide section toprescribe <strong>the</strong> exchanges with <strong>the</strong> <strong>Atlantic</strong> south of <strong>the</strong> Ovidesection, <strong>and</strong> <strong>the</strong>n solve <strong>the</strong> system of equations, beginning by <strong>the</strong>lower boxes. However, it seems more interesting to estimateerrors by solving <strong>the</strong> system with a generalized least squaresmethod, similar to <strong>the</strong> one applied previously (Mercier, 1986). <strong>The</strong>st<strong>and</strong>ard errors on <strong>the</strong> Ovide inversion set <strong>the</strong> errors on <strong>the</strong> fivevolume conservation equations. A unique solution is obtained bysetting a priori values for <strong>the</strong> seven unknown fluxes (Jackson,1979), compatible with <strong>the</strong> flux values at <strong>the</strong> time of <strong>the</strong> cruises,resulting in transport estimates <strong>and</strong> errors through <strong>the</strong> interfaces.For that purpose, we use <strong>the</strong> annual mean with an a priori errorthat reflects both <strong>the</strong> sampling uncertainty <strong>and</strong> <strong>the</strong> monthlyvariability, so that <strong>the</strong> most likely values relative to our twosnapshots of June lies within <strong>the</strong> a priori ranges.A state-of-<strong>the</strong>-art review of <strong>the</strong> North <strong>Atlantic</strong>-Nordic Seaexchanges was first presented by Hansen <strong>and</strong> Østerhus (2000).Since <strong>the</strong>n, an intense period of observations within <strong>the</strong> EC-VEINS(Variability of Exchanges in Nor<strong>the</strong>rn Seas) <strong>and</strong> ASOF (Arctic-Subarctic Ocean Fluxes) studies was achieved, more focused on<strong>the</strong> variability <strong>and</strong> <strong>the</strong> fresh water fluxes. No detectable trend wasfound in <strong>the</strong> net exchanges across <strong>the</strong> Greenl<strong>and</strong>–Scotl<strong>and</strong> sills(Dickson et al., 2008b), at least during <strong>the</strong> main decade ofobservations from <strong>the</strong> late 1990s to 2005. <strong>The</strong> a priori transportsacross <strong>the</strong> seven interfaces were chosen based on those observations,<strong>and</strong> are described in Table 3.ReferencesÁlvarez, M.F., Bryden, H.L., Pérez, F.F., Ríos, A.F., Roson, G., 2002. Physical <strong>and</strong>biogeochemical fluxes <strong>and</strong> net budgets in <strong>the</strong> <strong>subpolar</strong> <strong>and</strong> temperate North<strong>Atlantic</strong>. J. Mar. Res. 60 (2), 191–226.
1390P. Lherminier et al. / Deep-Sea Research I 57 (2010) 1374–1391Bacon, S., 1998. Decadal variability in <strong>the</strong> outflow from <strong>the</strong> Nordic seas to <strong>the</strong> deep<strong>Atlantic</strong> Ocean. Nature 394, 871–874.Bacon, S., Saunders, P.M., 2010. <strong>The</strong> deep western boundary current at cape farewell:results from a moored current meter array. J. Phys. Oceanogr. 40 (4), 815–829.Belkin, I.M., Levitus, S., 1996. Temporal variability of <strong>the</strong> subartic front near <strong>the</strong>Charlie-Gibbs fracture zone. J. Geophys. Res. 101, 28,871–28,874.Bersch, M., Meincke, J., Sy, A., 1999. Interannual <strong>the</strong>rmohaline changes in <strong>the</strong>nor<strong>the</strong>rn North <strong>Atlantic</strong> 1991–1996. Deep-Sea Res. II 46, 55–75.Biastoch, A., Völker, C., Böning, C., 2007. Uptake <strong>and</strong> spreading of anthropogenictrace gases in an eddy-permitting model of <strong>the</strong> <strong>Atlantic</strong> Ocean. J. Geophys. Res.112 (C09017).Billant, A., Branellec, P., Huck, T., 2006. Campagne OVIDE 2004: rapport de donnéesCTD-O 2 . Technical Report DRO/DOPS/LPO/06-01, Ifremer.Bower, A.S., Le Cann, B., Rossby, T., Zenk, W., Gould, J., Speer, K.G., Richardson, P.L.,Prater, M.D., Zhang, H.-M., 2002. Directly measured mid-depth circulation in<strong>the</strong> nor<strong>the</strong>astern North <strong>Atlantic</strong> Ocean. Nature 419, 603–607.Bower, A.S., von Appen, W.-J., 2008. Interannual variability in <strong>the</strong> pathways of <strong>the</strong>North <strong>Atlantic</strong> current over <strong>the</strong> mid-<strong>Atlantic</strong> ridge <strong>and</strong> <strong>the</strong> impact of <strong>the</strong>topography. J. Phys. Oceanogr. 38, 104–120.Brambilla, E., Talley, L.D., Robbins, P.E., 2008. Subpolar mode water in <strong>the</strong> nor<strong>the</strong>astern<strong>Atlantic</strong>:2.Origin<strong>and</strong>transformation.J.Geophys.Res.113(C04026).Cuny, J., Rhines, P.B., Kwok, R., 2005. Davis Strait volume, freshwater <strong>and</strong> heatfluxes. Deep Sea Res. I 52, 519–542.Curry, R.G., McCartney, M.S., 2001. Ocean gyre circulation changes associated with<strong>the</strong> North <strong>Atlantic</strong> oscillation. J. Phys. Oceanogr. 31, 3374–3400.Daniault, N., Lherminier, P., Mercier, H., submitted for publication. <strong>Circulation</strong> <strong>and</strong>transport at <strong>the</strong> south east tip of greenl<strong>and</strong>. J. Phys. Oceanogr, under review.Dickson, R.R., Brown, J., 1994. <strong>The</strong> production of North <strong>Atlantic</strong> Deep water:sources, rates, <strong>and</strong> pathways. J. Geophys. Res. 99 (C6), 12319–12341.Dickson, R.R., Dye, S., Jonsson, S., Köhl, A., Macr<strong>and</strong>er, A., Marnela, M., Meincke, J.,Olsen, S.M., Rudels, B., Valdimarsson, H., Voet, G., 2008a. <strong>The</strong> overflow fluxwest of Icel<strong>and</strong>: variability, origins <strong>and</strong> forcing. In: Dickson, R.R., Meinke, J.,Rhines, P. (Eds.), Arctic-Subarctic Ocean Fluxes: Defining <strong>the</strong> Role of <strong>the</strong>Nor<strong>the</strong>rn Seas in Climate. Springer Science+Business Media B.V., P.O. Box 17,AA Dordrecht, <strong>The</strong> Ne<strong>the</strong>rl<strong>and</strong>s, pp. 427–440.Dickson, R.R., Meincke, J., Rhines, P., 2008b. Arctic–subarctic ocean fluxes: defining<strong>the</strong> role of <strong>the</strong> nor<strong>the</strong>rn seas in climate. Springer Science+Business Media B.V.,P.O. Box 17, AA Dordrecht, <strong>The</strong> Ne<strong>the</strong>rl<strong>and</strong>s.Dittmar, T., Kattner, G., 2003. <strong>The</strong> biogeochemistry of <strong>the</strong> river <strong>and</strong> shelf ecosystemof <strong>the</strong> Arctic Ocean: a review. Marine Chemistry 83 (3–4), 103–120.Egbert, G., Bennett, A., Foreman, M., 1994. TOPEX/Poseidon tides estimated using aglobal inverse model. J. Geophys. Res. 99 (C12), 24821–24852.Fanning, K., Pilson, M., 1973. On <strong>the</strong> spectrophotometric determination ofdissolved silica in natural waters. Anal. Chem. 45, 136–140.Flatau, M.K., Talley, L.D., Niiler, P.P., 2003. <strong>The</strong> North <strong>Atlantic</strong> oscillation, surfacecurrent velocities, <strong>and</strong> SST changes in <strong>the</strong> <strong>subpolar</strong> North <strong>Atlantic</strong>. J. Climate16, 2355–2369.Fogelqvist, E., Blindheim, J., Tanhua, T., Østerhus, S., Buch, E., Rey, F., 2003.Greenl<strong>and</strong>–Scotl<strong>and</strong> overflow studied by hydro-chemical multivariate analysis.Deep Sea Res. I 50 (1), 73–102.Ganachaud, A., 2003. Error budget of inverse box models: <strong>the</strong> North <strong>Atlantic</strong>. J.Atmos. Ocean. Technol. 20 (11), 1641–1655.Häkkinen, S., Rhines, P.B., 2004. Decline of <strong>subpolar</strong> North <strong>Atlantic</strong>. Science 304,555–559.Häkkinen, S., Rhines, P.B., 2009. Shifting surface currents in <strong>the</strong> nor<strong>the</strong>rn North<strong>Atlantic</strong>. J. Geophys. Res. 114 (C04005).Hansen, B., Østerhus, S., 2000. North <strong>Atlantic</strong>-Nordic Seas exchanges. Prog.Oceanogr. 45, 109–208.Hansen, B., Østerhus, S., 2007. Faroe bank channel overflow 1995–2005. Progr.Oceanogr. 75, 817–856.Hansen, B., Østerhus, S., Turrell, W.R., Jonsson, S., Valdimarsson, H., Hátún, H.,Olsen, S.M., 2008. <strong>The</strong> inflow of <strong>Atlantic</strong> water, heat, <strong>and</strong> salt to <strong>the</strong> nordic seasacross <strong>the</strong> Greenl<strong>and</strong>–Scotl<strong>and</strong> ridge. In: Dickson, R.R., Meincke, J., Rhines, P.(Eds.), Arctic-Subarctic Ocean Fluxes: Defining <strong>the</strong> Role of <strong>the</strong> Nor<strong>the</strong>rn Seas inClimate. Springer Science+Business Media B.V., pp. 15–43.Harvey, J.G., Arhan, M., 1988. <strong>The</strong> water masses of <strong>the</strong> central North <strong>Atlantic</strong> in1983–1984. J. Phys. Oceanogr. 18 (12), 1855–1875.Hátún, H., S<strong>and</strong>ø, A.B., Drange, H., Hansen, B., Valdimarsson, H., 2005. Influenceof <strong>the</strong> <strong>Atlantic</strong> <strong>subpolar</strong> gyre on <strong>the</strong> <strong>the</strong>rmohaline circulation. Science 309,1841–1844.Holliday, N.P., Hughes, S.L., Bacon, S., Beszczynska-Möller, A., Hansen, B., Lavin, A.,Loeng, H., Mork, K.A., Østerhus, S., Sherwin, T., Walczowski, W., 2008. Reversalof <strong>the</strong> 1960s to 1990s freshening trend in <strong>the</strong> nor<strong>the</strong>ast North <strong>Atlantic</strong> <strong>and</strong>Nordic Seas. Geophys. Res. Lett. 35 (L03614).Huck, T., de Verdiere, A.C., Estrade, P., Schopp, R., 2008. Low-frequency variations of <strong>the</strong>large-scale ocean circulation <strong>and</strong> heat transport in <strong>the</strong> North <strong>Atlantic</strong> from1955–1998 in situ temperature <strong>and</strong> salinity data. Geophys. Res. Lett. 35 (L23613).Jackson, D.D., 1979. <strong>The</strong> use of a priori data to resolve non-uniqueness in linearinversion. Geophys. J. R. Astron. Soc. 57, 137–157.Johnson, G.C., Gruber, N., 2007. Decadal water mass variations along 201W in <strong>the</strong>Nor<strong>the</strong>astern <strong>Atlantic</strong> Ocean. Prog. Oceanogr. 73, 277–295.Jónsson, S., Valdimarsson, H., 2005. <strong>The</strong> flow of <strong>Atlantic</strong> water to <strong>the</strong> North Icel<strong>and</strong>icShelf <strong>and</strong> its relation to <strong>the</strong> drift of cod larvae. ICES J. Mar. Sci. 62, 1350–1359.Joyce, T.M., 1991. WOCE Operations Manual: WHP Operations <strong>and</strong> Methods.Technical Report WOCE Report no 68/91, <strong>The</strong> Woods Hole OceanographicInstitution.Knutsen, Ø., Svendsen, H., Østerhus, S., Rossby, T., Hansen, B., 2005. Directmeasurements of <strong>the</strong> mean flow <strong>and</strong> eddy kinetic energy structure of <strong>the</strong>upper ocean circulation in <strong>the</strong> NE <strong>Atlantic</strong>. Geophys. Res. Lett. 32 (L14604).Lauderdale, J.M., Bacon, S., Garabato, A.C.N., Holliday, N.P., 2008. Intensifiedturbulent mixing in <strong>the</strong> boundary current system of sou<strong>the</strong>rn Greenl<strong>and</strong>.Geophys. Res. Lett. 35 (L04611).Lavender, K.L., Owens, W.B., Davis, R.E., 2005. <strong>The</strong> mid-depth circulation of <strong>the</strong><strong>subpolar</strong> North <strong>Atlantic</strong> Ocean as measured by subsurface floats. Deep Sea Res.I 52, 767–785.Lherminier, P., Mercier, H., Gourcuff, C., Álvarez, M.F., Bacon, S., Kermabon, C.,2007. Transport across <strong>the</strong> 2002 Greenl<strong>and</strong>-Portugal section <strong>and</strong> comparisonwith 1997. J. Geophys. Res. 112 (C07003).Lux, M., Mercier, H., Arhan, M., 2000. Interhemispheric exchanges of mass <strong>and</strong> heatin <strong>the</strong> <strong>Atlantic</strong> Ocean in January–March 1993. Deep Sea Res. I 48, 605–638.Macr<strong>and</strong>er, A., Send, U., Valdimarsson, H., Jonsson, S., Käse, R.H., 2005. Interannualchanges in <strong>the</strong> overflows from <strong>the</strong> Nordic Seas into <strong>the</strong> <strong>Atlantic</strong> Ocean throughDenmark Strait. Geophys. Res. Lett. 32 (L06606).Marsh, R., de Cuevas, B.A., Coward, A.C., Bryden, H.L., Álvarez, M.F., 2005.<strong>The</strong>rmohaline circulation at three key sections in <strong>the</strong> North <strong>Atlantic</strong> over1985–2002. Geophys. Res. Lett. 32 (L10604).Maslowski, W., Marble, D., Walczowski, W., Schauer, U., Clement, J.L., Semtner, A.J.,2004. On climatological mass, heat <strong>and</strong> salt transports through <strong>the</strong> Barents Sea<strong>and</strong> Fram Strait from a pan-Arctic coupled ice-ocean model simulation. J.Geophys. Res. 109 (C3), C03032.McCartney, M.S., 1992. Recirculating components to <strong>the</strong> deep boundary currentof <strong>the</strong> nor<strong>the</strong>rn North <strong>Atlantic</strong>. Prog. Oceanogr. 29 (4), 283–383.McCartney, M.S., Talley, L.D., 1984. Warm-to-cold water conversion in <strong>the</strong>nor<strong>the</strong>rn North <strong>Atlantic</strong>. J. Phys. Oceanogr. 12, 1169–1188.Mercier, H., 1986. Determining <strong>the</strong> general circulation of <strong>the</strong> ocean: a non linearinverse problem. J. Geophys. Res. 91 (C4), 5103–5109.Østerhus, S., Shervin, T., Quadfasel, D., Hansen, B., 2008. <strong>The</strong> overflow transporteast of Icel<strong>and</strong>. In: Dickson, R.R., Meincke, J., Rhines, P. (Eds.), Arctic–SubarcticOcean Fluxes: Defining <strong>the</strong> Role of <strong>the</strong> Nor<strong>the</strong>rn Seas in Climate. SpringerScience+Business Media B.V., pp. 427–440.Østerhus, S., Turrell, W.R., Jonsson, S., Hansen, B., 2005. Measured volume, heat <strong>and</strong>salt fluxes from <strong>the</strong> <strong>Atlantic</strong> to <strong>the</strong> Arctic Mediterranean. Geophys. Res. Lett. 32(L7603).Paillet, J., Mercier, H., 1997. An inverse model of <strong>the</strong> eastern North <strong>Atlantic</strong>general circulation <strong>and</strong> <strong>the</strong>rmocline ventilation. Deep Sea Res. I 44 (8),1293–1328.Pérez, F.F., Vázquez-Rodríguez, M., Louarn, E., Padín, X.A., Mercier, H., Ríos, A.F.,2008. Temporal variability of <strong>the</strong> anthropogenic CO 2 storage in <strong>the</strong> Irmingersea. Biogeosciences 5, 1669–1679 URL: /http://www.biogeosciences.net/5/1669/2008/S.Pickart, R.S., Torres, D.J., Fratantoni, P.S., 2005. <strong>The</strong> East Greenl<strong>and</strong> Spill Jet. J. Phys.Oceanogr. 35, 1037–1053.Pollard, R.T., Read, J.F., Holliday, N.P., 2004. Water masses <strong>and</strong> circulationpathways through <strong>the</strong> Icel<strong>and</strong> Bassin during Vivaldi 1996. J. Geophys. Res.109 (C04004).Price, J.F., Baringer, O., 1994. Outflows <strong>and</strong> deep water production by marginalseas. Prog. Oceanogr. 33, 161–200.Sarafanov, A., 2009. On <strong>the</strong> effect of <strong>the</strong> North <strong>Atlantic</strong> Oscillation on temperature<strong>and</strong> salinity of <strong>the</strong> <strong>subpolar</strong> North <strong>Atlantic</strong> intermediate <strong>and</strong> deep waters. ICESJ. Mar. Sci. 66, 1448–1454.Sarafanov, A., Falina, A., Lherminier, P., Mercier, H., Sokov, A., Gourcuff, C., in press.Assessing decadal changes in <strong>the</strong> Deep Western Boundary Current absolutetransport sou<strong>the</strong>ast of Cape Farewell (Greenl<strong>and</strong>) from hydrography <strong>and</strong>altimetry. J. Geophys. Res. 115, doi:10.1029/2009JC005811.Sarafanov, A., Falina, A., Mercier, H., Lherminier, P., Sokov, A., 2009. Recent changesin <strong>the</strong> Greenl<strong>and</strong>–Scotl<strong>and</strong> overflow-derived water transport inferred fromhydrographic observations in <strong>the</strong> sou<strong>the</strong>rn Irminger Sea. Geophys. Res. Lett. 36(L13606).Sarafanov, A., Falina, A., Sokov, A., Demidov, A., 2008. Intense warming <strong>and</strong>salinification of intermediate waters of sou<strong>the</strong>rn origin in <strong>the</strong> eastern <strong>subpolar</strong>North <strong>Atlantic</strong> in <strong>the</strong> 1990s to mid-2000s. J. Geophys. Res. 113 (C12022).Sarafanov, A., Mercier, H., Falina, A., Sokov, A., Lherminier, P., 2010. Cessation <strong>and</strong>partial reversal of deep water freshening in <strong>the</strong> nor<strong>the</strong>rn North <strong>Atlantic</strong>:observation-based estimates <strong>and</strong> attribution. Tellus A 62A, 80–90.Saunders, P.M., 1987. Flow through discovery gap. J. Phys. Oceanogr. 17, 631–643.Saunders, P.M., 1994. <strong>The</strong> flux of overflow water through <strong>the</strong> Charlie Gibbs fracturezone. J. Geophys. Res. 99, 12343–12355.Schott, F., Br<strong>and</strong>t, P., 2007. <strong>Circulation</strong> <strong>and</strong> deep water export of <strong>the</strong> <strong>subpolar</strong> North<strong>Atlantic</strong> during <strong>the</strong> 1990’s. In: Ocean <strong>Circulation</strong>, mechanisms <strong>and</strong> impacts.Geophysical Monograph, No. 173. AGU, pp. 91–118.Schott, F., Stramma, L., Fischer, J., 1999. Interaction of <strong>the</strong> North <strong>Atlantic</strong> currentwith <strong>the</strong> deep Charlie Gibbs fracture zone throughflow. Geophys. Res. Lett. 26,369–372.Schott, F., Zantopp, R., Stramma, L., Dengler, M., Fischer, J., Wibaux, M., 2004.<strong>Circulation</strong> <strong>and</strong> Deep-Water Export at <strong>the</strong> western exit of <strong>the</strong> <strong>subpolar</strong> North<strong>Atlantic</strong>. J. Phys. Oceanogr. 34, 817–843.Serreze, M.C., Barrett, A.P., Slater, A.G., Woodgate, R.A., Aagaard, K., Lammers, R.B.,Steele, M., Moritz, R., Meredith, M., Lee, C.M., 2006. <strong>The</strong> large-scale freshwatercycle of <strong>the</strong> Arctic. J. Geophys. Res. 111 (C11010).Smethie, William M., J., Fine, R.A., 2000. Rates of North <strong>Atlantic</strong> Deep Waterformation calculated from chlorofluorocarbon inventories. Deep Sea Res. I48(1), 189–215.
P. Lherminier et al. / Deep-Sea Research I 57 (2010) 1374–1391 1391Spall, M.A., Pickart, R.S., 2003. Wind-driven recirculations <strong>and</strong> exchange in <strong>the</strong>Labrador <strong>and</strong> Irminger seas. J. Phys. Oceanogr. 33 (8), 1829–1845.Thierry, V., de Boisseson, E., Mercier, H., 2008. Interannual variability of <strong>subpolar</strong>mode water properties over <strong>the</strong> Reykjanes ridge during 1990–2006. J.Geophys. Res. 113 (C04016).Treguier, A.-M., Gourcuff, C., Lherminier, P., Mercier, H., Barnier, B., Madec, G.,Molines, J.-M., Penduff, T., Czeschel, L., Böning, C.W., 2006. Internal <strong>and</strong> forcedvariability along a section between Greenl<strong>and</strong> <strong>and</strong> Portugal in <strong>the</strong> CLIPPER<strong>Atlantic</strong> model. Oceans Dyn. 56, 568–580.Treguier, A.-M., <strong>The</strong>etten, S., Chassignet, E.P., Penduff, T., Smith, R., Talley, L.D.,Beismann, J.O., Böning, C.W., 2005. <strong>The</strong> North <strong>Atlantic</strong> <strong>subpolar</strong> gyre in fourhigh-resolution models. J. Phys. Oceanogr. 35 (5), 757–774.van Aken, H.M., 2000. <strong>The</strong> hydrography of <strong>the</strong> mid-latitude Nor<strong>the</strong>ast <strong>Atlantic</strong>Ocean: II: <strong>the</strong> intermediate water masses. Deep Sea Res. I 47 (5), 789–824.Visbeck, M., 2002. Deep velocity profiling using Lowered Acoustic Doppler CurrentProfilers: bottom track <strong>and</strong> inverse solutions. J. Atmos. Ocean. Technol. 19 (5),794–807.Yashayaev, I., Bersch, M., van Aken, H.M., 2007. Spreading of <strong>the</strong> Labrador SeaWater to <strong>the</strong> Irminger <strong>and</strong> Icel<strong>and</strong> basins. Geophys. Res. Lett. 34 (L10602).Yashayaev, I., Dickson, R.R., 2008. Transformation <strong>and</strong> fate of overflows in <strong>the</strong>nor<strong>the</strong>rn North <strong>Atlantic</strong>. In: Dickson, R.R., Meinke, J., Rhines, P. (Eds.), Arctic-Subarctic Ocean Fluxes: Defining <strong>the</strong> Role of <strong>the</strong> Nor<strong>the</strong>rn Seas in Climate.Springer Science+Business Media B.V., P.O. Box 17, AA Dordrecht, <strong>The</strong>Ne<strong>the</strong>rl<strong>and</strong>s, pp. 505–526.