Key West Transit Development Plan 2010 - KeyWestCity.com
Key West Transit Development Plan 2010 - KeyWestCity.com
Key West Transit Development Plan 2010 - KeyWestCity.com

You also want an ePaper? Increase the reach of your titles
YUMPU automatically turns print PDFs into web optimized ePapers that Google loves.
KEY WEST, FLORIDATRANSIT DEVELOPMENT PLAN<strong>2010</strong> - 2019JANUARY <strong>2010</strong>Prepared by:The <strong>Key</strong> <strong>West</strong> Department of Transportation627 Palm Avenue<strong>Key</strong> <strong>West</strong>, Florida 33041-1409TBG082810024135DFBFINAL REPORT
Contents1 Introduction..................................................................................................................................1-11.1 Identification of Submitting Entity................................................................................1-11.2 Overview of <strong>Transit</strong> <strong>Development</strong> <strong>Plan</strong> (TDP) Requirements ..................................1-11.3 Overview of <strong>Transit</strong> <strong>Development</strong> <strong>Plan</strong> (TDP) Requirements ..................................1-21.4 Report Organization ........................................................................................................1-32 Data Collection and Analysis....................................................................................................2-12.1 Physical Description of Study Area...............................................................................2-12.2 Population Profile ............................................................................................................2-12.2.1 Population Characteristics ...............................................................................2-12.2.2 Population Densities .........................................................................................2-22.2.3 In<strong>com</strong>e Characteristics......................................................................................2-62.2.4 Automobile Ownership and Availability ......................................................2-82.2.5 Employment Characteristics............................................................................2-92.2.6 Major Trip Attractors ........................................................................................2-92.2.7 Tourist and Visitor Levels ..............................................................................2-112.2.8 Roadway and Traffic Conditions ..................................................................2-132.3 Description of <strong>Development</strong> Activities.......................................................................2-142.3.1 Existing <strong>Plan</strong>ning Documents........................................................................2-142.3.2 2025 Florida Transportation <strong>Plan</strong> (FTP) .......................................................2-152.3.3 Strategic Regional Policy <strong>Plan</strong> for South Florida ........................................2-162.3.4 2008 Monroe County Transportation Disadvantaged Service <strong>Plan</strong> .........2-172.4 Public <strong>Transit</strong> in <strong>Key</strong> <strong>West</strong>............................................................................................2-182.4.1 <strong>Key</strong> <strong>West</strong> Bus Service......................................................................................2-182.4.2 Other <strong>Transit</strong> Related Services ......................................................................2-242.5 Bus Fare and Pass Program ..........................................................................................2-272.6 Trend and Peer Analysis...............................................................................................2-282.6.1 Performance Indicators...................................................................................2-282.6.2 Operating Statistics .........................................................................................2-292.7 Trend Analysis................................................................................................................2-292.7.1 Fixed-Route Trend Analysis ..........................................................................2-292.8 Peer Analysis ..................................................................................................................2-312.8.1 Peer System Selection Methodology.............................................................2-312.8.2 Performance Indicators...................................................................................2-332.8.3 Direct Comparison Analysis..........................................................................2-352.9 Vehicle Inventory ...........................................................................................................2-363 Public Involvement.....................................................................................................................3-13.1 Public Involvement <strong>Plan</strong> .................................................................................................3-13.2 Public Workshops ............................................................................................................3-13.3 Public Workshop Results ................................................................................................3-23.4 On-Board Survey..............................................................................................................3-23.5 Fleet Maintenance Survey...............................................................................................3-5TBG082810024135DFB/WPB31044333184.PDF/Final Reportiii
CONTENTS3.6 Bus Driver Survey ............................................................................................................3-73.7 South Florida Workforce (SFW) Coordination ............................................................3-94 Funding Availability...................................................................................................................4-14.1 Small <strong>Transit</strong> Intensive Cities (49 U.S.C. §5336(j) ........................................................4-14.2 Bus and Bus Related Facilities Program (49 U.S.C. §5309).........................................4-14.3 Strategic Intermodal System (SIS) Funds......................................................................4-14.4 State Infrastructure Bank.................................................................................................4-24.5 <strong>Transit</strong> Corridor Program ...............................................................................................4-34.6 Public <strong>Transit</strong> Block Grant Program..............................................................................4-34.7 Public <strong>Transit</strong> Service <strong>Development</strong> Program.............................................................4-44.8 Fuel Taxes..........................................................................................................................4-54.8.1 One-Six Cents Local Option Fuel Tax.............................................................4-54.8.2 One-Five Cents Local Option Fuel Tax ..........................................................4-54.8.3 Ninth-Cent Fuel Tax..........................................................................................4-64.9 Ad Valorem Tax ...............................................................................................................4-64.10 Local Discretionary Sales Surtaxes (Local Option Sales Taxes).................................4-64.10.1 Charter County <strong>Transit</strong> System Surtax...........................................................4-64.10.2 Local Government Infrastructure Surtax .......................................................4-74.11 Impact Fees........................................................................................................................4-74.12 Tourist <strong>Development</strong> Tax ...............................................................................................4-85 <strong>Transit</strong> Goals and Objectives....................................................................................................5-15.1 KWDoT Mission and Vision Statements.......................................................................5-15.2 Assessment of Goals, Objectives, and Strategies (FY 2005 – FY 2009)......................5-15.3 Re<strong>com</strong>mended Goals and Objectives............................................................................5-56 <strong>Transit</strong> Alternatives Evaluation................................................................................................6-16.1 <strong>Development</strong> of Alternatives..........................................................................................6-16.2 Evaluation Methodology.................................................................................................6-26.3 Selection of Alternatives..................................................................................................6-56.4 Existing <strong>Transit</strong> Services .................................................................................................6-56.4.1 Proposed Alternatives ......................................................................................6-66.4.2 Modeling Results.............................................................................................6-196.5 Revenue Potential...........................................................................................................6-217 Ten Year <strong>Transit</strong> <strong>Development</strong> <strong>Plan</strong>........................................................................................7-17.1 Ten-Year TDP Service Priorities.....................................................................................7-17.2 Ten-Year TDP Capital and Infrastructure Alternatives..............................................7-27.3 Ten-Year TDP Policy and <strong>Plan</strong>ning Activities .............................................................7-37.4 Ten-Year TDP Coordination Activities .........................................................................7-47.5 Monitoring Program to Track Performance Measures ...............................................7-67.6 Ten-Year TDP Implementation <strong>Plan</strong> .............................................................................7-67.7 Ten-Year Ridership Projections......................................................................................7-77.8 Ten-Year Financial plan...................................................................................................7-7MapsTBG082810024135DFB/WPB31044333184.PDF/Final Reportiv
CONTENTSTables1-1 TDP Checklist.......................................................................................................................1-22-1 <strong>Key</strong> <strong>West</strong> <strong>Transit</strong> Service Population ...............................................................................2-22-2 Population Density (2007) ..................................................................................................2-22-3 Population Age Distribution (2007)..................................................................................2-32-4 Distribution of Persons Age 0-17 by Census Block Group (2000) ................................2-42-5 Distribution of Persons Age 60 and Over by Census Block Group (2000)..................2-52-6 Household In<strong>com</strong>e Distribution (2007) ............................................................................2-72-7 Household Vehicle Availability (2007).............................................................................2-82-8 <strong>Key</strong> <strong>West</strong> Employment by Type of Work (2007).............................................................2-92-9 <strong>Key</strong> <strong>West</strong> Annual Visitor Characteristics (2008) ...........................................................2-112-10 <strong>Key</strong> <strong>West</strong> Existing Roadway Level of Service (LOS) Characteristics on ExistingRoutes..................................................................................................................................2-132-11 Selected Performance Review Indicators and Measures Fixed-Route<strong>Transit</strong> Services..................................................................................................................2-282-12 <strong>Key</strong> <strong>West</strong> <strong>Transit</strong> Operating Statistics (2008) ................................................................2-292-13 <strong>Key</strong> <strong>West</strong> DOT Performance Indicators .........................................................................2-302-14 <strong>Transit</strong> Peer Review Selection (2008)..............................................................................2-322-15 <strong>Transit</strong> Peer Review Service Efficiency Comparison....................................................2-332-16 <strong>Transit</strong> Peer Review Cost Effectiveness Comparison...................................................2-342-17 <strong>Transit</strong> Peer Review Service Effectiveness Comparison..............................................2-342-18 <strong>Transit</strong> Peer Review Farebox Recovery Ratio................................................................2-352-19 <strong>Transit</strong> Direct Comparison Analysis ..............................................................................2-362-20 <strong>Key</strong> <strong>West</strong> DOT Bus Fleet Inventory................................................................................2-366-1 2009 Fixed Route Bus Service – Peak and Off-Peak Headways....................................6-66-2 <strong>Transit</strong> Boarding’s Summary (Average Weekday).......................................................6-196-3 <strong>Transit</strong> Boarding’s Summary (Annual Ridership)........................................................6-206-4 Farebox Revenue Estimates .............................................................................................6-227-1 Summary of Capital Needs (FY <strong>2010</strong>-FY2019) ................................................................7-97-2 Summary of Projected Capital Needs (FY <strong>2010</strong>-FY2019)...............................................7-97-3 Estimated Operating Costs (FY <strong>2010</strong>-FY2019)...............................................................7-127-4 Summary of Revenue (FY <strong>2010</strong>-FY2019)........................................................................7-147-5 Estimated Summary of Projected Cost and Revenue Needs (FY <strong>2010</strong>-FY2019).......7-157-6 Estimated Summary of Projected Operating and Capital Needs(FY <strong>2010</strong>-FY2019) ...............................................................................................................7-15TBG082810024135DFB/WPB31044333184.PDF/Final Reportv
CONTENTSFigures2-1 <strong>Key</strong> <strong>West</strong> Census Tracts and Block Groups.....................................................................2-32-2 Percent of Population Under 18 ........................................................................................2-52-3 Percent of Population Over Age 60...................................................................................2-62-4 Percent of Households with Annual In<strong>com</strong>e Below $10,000.........................................2-82-5 <strong>Key</strong> <strong>West</strong> Major Trip Generators and Traffic Attractors .............................................2-102-6 <strong>Key</strong> <strong>West</strong> International Airport.......................................................................................2-112-7 Cruise Ship Passenger Counts.........................................................................................2-122-8 <strong>Key</strong> <strong>West</strong> International Airport.......................................................................................2-122-9 <strong>Key</strong> <strong>West</strong> Port Operations................................................................................................2-132-10 Blue, Red and Green Bus Routes.....................................................................................2-192-11 Blue, Red and Green Bus Schedules ...............................................................................2-202-12 Gold, Purple and Orange Bus Routes.............................................................................2-212-13 Gold, Purple and Orange Bus Routes.............................................................................2-222-14 Lower <strong>Key</strong>s Shuttle Bus Schedules.................................................................................2-236-1 Blue and Green Bus Lines ..................................................................................................6-76-2 Red and Orange Bus Lines...............................................................................................6-116-3 Blue, Green, and Red Bus Lines ......................................................................................6-146-4 Gold, Purple, and Orange Bus Lines ..............................................................................6-16AppendixesABCLower <strong>Key</strong>s Shuttle Bus Route <strong>Development</strong> and Operational AnalysisPublic InvolvementMonroe County Mass <strong>Transit</strong> ElementTBG082810024135DFB/WPB31044333184.PDF/Final Reportvi
1.1 Identification of Submitting EntityAgency: <strong>Key</strong> <strong>West</strong> Department of TransportationMailing Address: PO Box 1078, <strong>Key</strong> <strong>West</strong>, FL 33041-1409Office Address: 627 Palm Avenue, <strong>Key</strong> <strong>West</strong>, FL 33041-1409Telephone Number: (305) 809-3910Authorizing Agency Representative: Myra Wittenburg, Manager1.2 Overview of <strong>Transit</strong> <strong>Development</strong> <strong>Plan</strong> (TDP) RequirementsThe Florida Department of Transportation (FDOT) requires each recipient of the Public<strong>Transit</strong> Block Grant (PTBG) program to submit a 10-year <strong>Transit</strong> <strong>Development</strong> <strong>Plan</strong> (TDP)with yearly updates. The TDP is a planning tool used to identify future needs for transitservice, define the <strong>com</strong>munity’s goals and develop a program of improvements. Thesubmission cycle as defined by Florida Statutes is to perform a Major update to the TDPevery fifth year. The last Major update was performed in 2005 by the University of SouthFlorida Center for Urban Transportation Research (CUTR). This new TDP develops newgoals and objectives and other relevant data to reflect current year through 2019.On February 20, 2007, FDOT promulgated Rule 14-73.001, which substantially changed theTDP requirements. The changes are documented below:• Extending the planning horizon from 5 years to 10 years,• Requiring updates every 5 years instead of every 3 years,• Making the annual minor updates, public involvement, and demand estimationrequirements more explicit.• Establishing a deadline for said approval in order to qualify for funding.In addition to the State mandate, the TDP also can assist in meeting several objectives,outlined in the "Florida Department of Transportation Guidance for Producing a <strong>Transit</strong><strong>Development</strong> <strong>Plan</strong>.”TBG082810024135DFB/WPB31044333184.PDF/Final Report1-1
SECTION 2—DATA COLLECTION AND ANALYSISTABLE 2-1<strong>Key</strong> <strong>West</strong> <strong>Transit</strong> Service Population2000 20082000-2008% Change (Decrease)<strong>Key</strong> <strong>West</strong> Population 25,478 22,364 (12.22%)Stock Island 4,410 4,064 (7.85%)Big Coppitt <strong>Key</strong> 2,595 2,391 (7.86%)Cudjoe <strong>Key</strong> 1,695 1,562 (8.51%)Big Pine <strong>Key</strong> 5,032 4,637 (7.85%)Marathon 10,255 9,526 (7.11%)Total Service Area 49,465 44,544 (9.95%)2.2.2 Population DensitiesTable 2-2 <strong>com</strong>pares <strong>Key</strong> <strong>West</strong>'s population and population density with the state of Florida.According to projections developed by the University of Florida's Bureau of Economic andBusiness Research (BEBR) in 2007, the City of <strong>Key</strong> <strong>West</strong> had a much higher populationdensity of 1,950 persons per square mile than the state average of 349 persons per squaremile.TABLE 2-2Population Density (2007)Permanent PopulationDensity(Persons Per Square Mile)Florida (2007) 18,807,219 349<strong>Key</strong> <strong>West</strong> (2007) 22,364 1,950Table 2-3 <strong>com</strong>pares <strong>Key</strong> <strong>West</strong>'s population age distribution over the last 10 years of recentdata. The greatest shift in age has been from the 35-44 age group where they have lost20 percent from their group. This is probably attributable to the acceleration of housingcosts in <strong>Key</strong> <strong>West</strong> during this time period. The 55-64 age group also increased about12 percent primarily due to aging of the current population without an influx of newresidents in that age group.TBG082810024135DFB/WPB31044333184.PDF/Final Report2-2
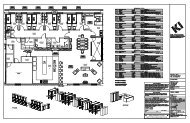
SECTION 2—DATA COLLECTION AND ANALYSISfTABLE 2-3Population Age Distribution (2007)0-19 20-34 35-44 45-54 55-64 65+<strong>Key</strong> <strong>West</strong> (2007) 17% 19% 18% 18% 16% 12%<strong>Key</strong> <strong>West</strong> (1997) 21 % 9% 38% 13% 4% 15%Figure 2-1 illustrates the <strong>Key</strong> <strong>West</strong> tracts and block groups. A census block group (BG) is acluster of census blocks having the same first digit of their four-digit identifying numberswithin a census tract. For example, block group 3 (BG 3) within a census tract includes allblocks numbered from 3000 to 3999. BGs generally contain between 600 and 3,000 people,with an optimum size of 1,500 people. Most BGs were delineated by local participants aspart of the U.S. Census Bureau's Participant Statistical Areas Program. The U.S. CensusBureau delineated BGs only where a local, state, or tribal government declined to participateor where the U.S. Census Bureau could not identify a potential local or tribal participant.This information is accumulated during the 10-year census period.FIGURE 2-1<strong>Key</strong> <strong>West</strong> Census Tracts and Block Groups<strong>Key</strong> <strong>West</strong>, Florida, 2000TBG082810024135DFB/WPB31044333184.PDF/Final Report2-3
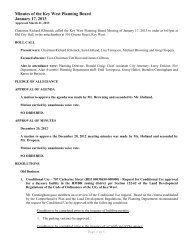
SECTION 2—DATA COLLECTION AND ANALYSISTable 2-4 shows the 2000 Census block groups with 20 percent or greater concentration ofaged 17 and younger residents in <strong>Key</strong> <strong>West</strong>. The percentage of the population younger than18 years is also depicted in Figure 2-2. These data show that eleven block groups within <strong>Key</strong><strong>West</strong> had populations where persons under the age of 18 consist of at least 20 percent of thetotal block group population. The three block groups with the highest percentage of personsunder the age of 18 are 9721.00 BG 3 (44 percent) which includes Sigsbee Park NavalHousing, 9721.00 BG 2 (45 percent) which includes the Sigbee Naval Housing, and 9719.00BG 3 (35 percent) in the New Town area. As illustrated in Figure 2-2, high concentrations ofpersons under the age of 18 are also found on Fleming Island, which also belongs to the U.S.Navy.TABLE 2-4Distribution of Persons Age 0-17 by Census Block Group (2000)Census Block Group Percentage Age 0-17Tract 9721.00 BG 2 (N <strong>Key</strong> <strong>West</strong> - Sigsbee Naval Housing) 43%Tract 9719.00 BG 3 (NE <strong>Key</strong> <strong>West</strong> - New Town) 35%Tract 9725.00 BG 4 (<strong>Key</strong> <strong>West</strong> Truman Annex) 23%Tract 9721.00 BG 1 (N <strong>Key</strong> <strong>West</strong> - Sigsbee Park & Naval Housing) 21%Tract 9721.00 BG 3 (N <strong>Key</strong> <strong>West</strong> - Sigsbee Park & Naval Housing) 44%Tract 9718.00 BG 3 (Stock Island) 26%Tract 9718.00 BG 5 (Stock Island) 31%Tract 9718.00 BG 2 (Stock Island) 23%Tract 9722.00 BG 1 (Central <strong>Key</strong> <strong>West</strong> - New Town) 25%Tract 9724.00 BG 5 (SW <strong>Key</strong> <strong>West</strong> - Old Town) 21%Tract 9722.00 BG 3 (Central <strong>Key</strong> <strong>West</strong> - New Town) 20%TBG082810024135DFB/WPB31044333184.PDF/Final Report2-4
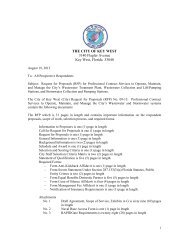
SECTION 2—DATA COLLECTION AND ANALYSISfFIGURE 2-2Percent of Population Under 18<strong>Key</strong> <strong>West</strong>, Florida, 2000Table 2-5 and Figure 2-3 illustrate the concentration of people aged 60 and older in <strong>Key</strong><strong>West</strong>. These data indicate that the most densely populated area of seniors is located in tract9718.00 BG 4 in the Stock Island area (37 percent). Other areas with high concentrations ofseniors include northeast <strong>Key</strong> <strong>West</strong> in the New Town Area and southwest <strong>Key</strong> <strong>West</strong> in theOld Town area.TABLE 2-5Distribution of Persons Age 60 and Over by Census Block Group (2000)Census Block GroupPercentage Age 60and OlderTract 9718.00 BG 4 (Stock Island) 37%Tract 9721.00 BG 4 (NE <strong>Key</strong> <strong>West</strong> - New Town) 34%Tract 9724.00 BG 4 (SW <strong>Key</strong> <strong>West</strong> - Old Town) 26%Tract 9726.00 BG 1 (SW <strong>Key</strong> <strong>West</strong>) 23%Tract 9719.00 BG 3 (Stock Island) 23%Tract 9724.00 BG 5 (SW <strong>Key</strong> <strong>West</strong> - Old Town) 22%Tract 9720.00 BG 1 (S. <strong>Key</strong> <strong>West</strong>) 21%TBG082810024135DFB/WPB31044333184.PDF/Final Report2-5
SECTION 2—DATA COLLECTION AND ANALYSISfTABLE 2-5Distribution of Persons Age 60 and Over by Census Block Group (2000)Census Block GroupPercentage Age 60and OlderTract 9720.00 BG 3 (S. <strong>Key</strong> <strong>West</strong>) 21%Tract 9725.00 BG 2(NW <strong>Key</strong> <strong>West</strong> - Old Town) 20%Tract 9725.00 BG 1(NW <strong>Key</strong> <strong>West</strong> - Old Town) 20%Tract 9724.00 BG 2(NW <strong>Key</strong> <strong>West</strong> - Old Town) 20%FIGURE 2-3Percent of Population Over Age 60<strong>Key</strong> <strong>West</strong>, Florida, 2000Age groups at both ends of the scale (under age 18 and age 60 and older) are of significantinterest with regard to potential transportation needs and transit use. The young and theelderly often do not have adequate access to automobiles and, therefore, <strong>com</strong>monly aremore dependent on public transportation and alternative forms of transportation (such aswalking and biking) than persons in the middle age groups.2.2.3 In<strong>com</strong>e CharacteristicsIn<strong>com</strong>e is an important factor in assessing transportation needs and use of conventionalpublic transit systems. In general, low-in<strong>com</strong>e persons are more likely to rely on publicTBG082810024135DFB/WPB31044333184.PDF/Final Report2-6
SECTION 2—DATA COLLECTION AND ANALYSIStransportation for mobility and access to jobs, shopping, medical services, and recreationalactivities.Table 2-6 shows the distribution of household in<strong>com</strong>e in <strong>Key</strong> <strong>West</strong> for 2007. In Florida, thenumber of households reporting in<strong>com</strong>e of $25,000 or less is 17.4 percent <strong>com</strong>pared to20.9 percent for <strong>Key</strong> <strong>West</strong>. <strong>Key</strong> <strong>West</strong> had slightly higher median household in<strong>com</strong>e of$51,722 as <strong>com</strong>pared to the State median of $46,602.TABLE 2-6Household In<strong>com</strong>e Distribution (2007)City of <strong>Key</strong> <strong>West</strong>Total households 9,671 100%Less than $10,000 757 7.80%$10,000 to $14,999 485 5.00%$15,000 to $24,999 784 8.10%$25,000 to $34,999 1,047 10.80%$35,000 to $49,999 1,438 14.90%$50,000 to $74,999 2,281 23.60%$75,000 to $99,999 1,289 13.30%$100,000 to $149,999 991 10.20%$150,000 to $199,999 248 2.60%$200,000 or more 351 3.60%Median household in<strong>com</strong>e (dollars) 51,722 (X)Mean household in<strong>com</strong>e (dollars) 72,770 (X)Figure 2-4 provides 2000 Census data on the block groups with the highest percentages ofhouseholds with an annual in<strong>com</strong>e of less than $10,000. Figure 2-4 graphically illustrates thepercentage of households with annual in<strong>com</strong>e less than $10,000 by census block group.Block groups with a high concentration of low-in<strong>com</strong>e households are shown in darkershades on the map. The census block group in <strong>Key</strong> <strong>West</strong> with the highest percentage of thepopulation with annual in<strong>com</strong>es of less than $10,000 is tract 9724.00 BG 5 (31 percent). Thisblock group is located in the southwest section of Old Town. Other densely concentratedareas of households with in<strong>com</strong>es less than $10,000 are located on Stock Island and in theNew Town area west of Fourteenth Street. This information is helpful in determining busrouting.TBG082810024135DFB/WPB31044333184.PDF/Final Report2-7
SECTION 2—DATA COLLECTION AND ANALYSISfFIGURE 2-4Percent of Households with Annual In<strong>com</strong>e Below $10,000<strong>Key</strong> <strong>West</strong>, Florida, 20002.2.4 Automobile Ownership and AvailabilityTable 2-7 shows the distribution of vehicle availability among households in <strong>Key</strong> <strong>West</strong> andFlorida, according to results of the 2007 American Community Survey Census. As of 2007,nearly 19 percent of households in <strong>Key</strong> <strong>West</strong> did not have a vehicle available for use. Thisfigure is triple the 2007 average for Florida (6.4 percent).TABLE 2-7Household Vehicle Availability (2007)Number of Vehicles AvailableNone One Two Three or More<strong>Key</strong> <strong>West</strong> 18.9% 47.1% 28.9% 5.1%Florida 6.4% 39.7% 39% 14.9%TBG082810024135DFB/WPB31044333184.PDF/Final Report2-8
SECTION 2—DATA COLLECTION AND ANALYSIS2.2.5 Employment CharacteristicsTable 2-8 contains the distribution of employment in <strong>Key</strong> <strong>West</strong> by type of work. Asexpected, the highest concentration of jobs in one defined type of employment is in theac<strong>com</strong>modation/food service sector (17.3 percent).TABLE 2-8<strong>Key</strong> <strong>West</strong> Employment by Type of Work (2007)Type of EmploymentPercentage of all EmploymentAc<strong>com</strong>modation/Food Service 17.3%Construction 7.9%Real Estate/Rental Leasing 9.4%Government 13.6%Utilities/Waste Services 6.5%Health Care/Social Assistance 5.3%Retail 11.8%All Other Services 28.2%2.2.6 Major Trip AttractorsWhen analyzing a public transit system, it is important to look at the spatial distribution ofmajor trip attractors and generators in <strong>com</strong>parison to the existing route network. Theseareas usually attract a large number of people, resulting in a concentration of trips, which ismore conducive to public transit use. Seven (7) categories of trip generators and attractorswere identified in <strong>Key</strong> <strong>West</strong>, a sampling of these but not fully inclusive, are as follows:<strong>Key</strong> <strong>West</strong> Major Generators and AttractorsSchoolsGerald Adams Elementary Poinciana ElementaryGlynn Archer Elementary Sigsbee SchoolHorace O’Bryant School Florida <strong>Key</strong>s Community College<strong>Key</strong> <strong>West</strong> High SchoolShopping AreasSearstown MallDuval Street Duval Square Shopping CenterOverseas Market Laud’s End VillageVisitor/Recreation AreasMallory Square Little White House MuseumHiggs Beach Historic <strong>West</strong> Martello TowerSmathers Beach Historic East Martello Tower & MuseumTennessee Williams Fine Arts Center Ripley’s Believe it or NotTBG082810024135DFB/WPB31044333184.PDF/Final Report2-9
SECTION 2—DATA COLLECTION AND ANALYSISHemingway House Clayton Sterling BaseballLighthouse & Military Museum City Marina & Charter Boat Docks<strong>Key</strong> <strong>West</strong> AquariumTransportationGreyhound Bus Depot <strong>Key</strong> <strong>West</strong> International AirportGovernment & FacilitiesTruman Annex Monroe County CourthouseChildren & Families Department Offices <strong>Key</strong> <strong>West</strong> City HallSenior Citizen Plaza Monroe County School Board OfficesHospitalLower <strong>Key</strong>s Medical CenterHousing AreasBahama Village Sigsbee ParkPorter Place Poinciana PlazaPeary Court Ocean WalkVisitor Ac<strong>com</strong>modation AreasHotel Row, N. Roosevelt Blvd Hotel Row, S. Roosevelt BlvdHotel/Motel Area, Old TownAs illustrated in Figure 2-5, the majority of the identified trip generators and attractors areeither directly on a <strong>Key</strong> <strong>West</strong> <strong>Transit</strong> route or are within a short walking distance to the route.FIGURE 2-5<strong>Key</strong> <strong>West</strong> Major Trip Generators and Traffic AttractorsTBG082810024135DFB/WPB31044333184.PDF/Final Report2-10
SECTION 2—DATA COLLECTION AND ANALYSIS2.2.7 Tourist and Visitor Levels<strong>Key</strong> <strong>West</strong> experiences a huge influx of visitors annually. Traditionally, the visitor season for<strong>Key</strong> <strong>West</strong> is in the winter and spring months, however, the island is host to more and morevisitors during other months of the year. According to the <strong>Key</strong> <strong>West</strong> Chamber of Commercewebsite, <strong>Key</strong> <strong>West</strong> received over 2.2 million visitors in 2008 significantly down from the2003 estimate of 2.6 million. That is still up significantly from the 1.4 million visitors arrivingon the island in 1996. The following Table 2-9 summarizes this information.TABLE 2-9<strong>Key</strong> <strong>West</strong> Annual Visitor Characteristics (2008)Method of Travel Total Visitors 5-Year DecreaseCruise Ship Passengers 1,067,222 (26.4%)<strong>Key</strong> <strong>West</strong> Passenger Arrivals (Airport) 222,198 (23.8%)Arrival by Automobile (estimated) 900,000 ---Total Annual Visitors 2,254,055 (17.0%)The following Figures 2-6 and 2-7 reflect drop off in airport traffic and cruise ship passengercounts respectively since 2004.FIGURE 2-6<strong>Key</strong> <strong>West</strong> International AirportAugust Month, Year-to-Date & Full Year Totals – 2004-2009TBG082810024135DFB/WPB31044333184.PDF/Final Report2-11
SECTION 2—DATA COLLECTION AND ANALYSISFIGURE 2-7Cruise Ship Passenger CountsAugust Month, Year-to-Date & Full Year Totals – 2004-2009The following Figures 2-8 and 2-9 reflect the peak seasonal visitor periods for airport andcruise traffic are from December through March with March being the peak month. Thedifference from the off-peak to the peak months is approximately a 285 percent increasefrom the September low to the March peak period.FIGURE 2-8<strong>Key</strong> <strong>West</strong> International AirportNumber of Passenger Arrivals by <strong>Plan</strong>e per Month2004-2009 Passenger Count ComparisonTBG082810024135DFB/WPB31044333184.PDF/Final Report2-12
SECTION 2—DATA COLLECTION AND ANALYSISFIGURE 2-9<strong>Key</strong> <strong>West</strong> Port Operations<strong>Key</strong> <strong>West</strong> Cruise Ship Data – Passenger CountsNumber of Passenger Arrivals 2004-20092.2.8 Roadway and Traffic ConditionsThe 1993 City of <strong>Key</strong> <strong>West</strong> Comprehensive <strong>Plan</strong> contains information on state and federalroadway segments with existing and projected level of service (LOS) deficiencies. Table 2-10contains information derived from the <strong>Key</strong> <strong>West</strong> Comprehensive <strong>Plan</strong>’s Traffic CirculationElement, updated in 2000. Only the Palm Avenue roadway segment is considered deficientbased on the levels of service information available. Levels of Service of “E” and below areconsidered deficient. It is re<strong>com</strong>mended that further study is performed by the city toupdate the LOS status of these segments to current conditions.TABLE 2-10<strong>Key</strong> <strong>West</strong> Existing Roadway Level of Service (LOS) Characteristics on Existing RoutesRoadway SegmentPalm Ave, N. Roosevelt Blvd to White StreetUS 1, Cow <strong>Key</strong> Bridge to N. Roosevelt BlvdLevel of ServiceEDN. Roosevelt Blvd, US 1 to Kennedy Drive DN. Roosevelt Blvd, Kennedy Blvd to Palm Ave DS. Roosevelt Blvd, Bertha to US 1 DTBG082810024135DFB/WPB31044333184.PDF/Final Report2-13
SECTION 2—DATA COLLECTION AND ANALYSISTABLE 2-10<strong>Key</strong> <strong>West</strong> Existing Roadway Level of Service (LOS) Characteristics on Existing RoutesDuval St, Front St to South StRoadway SegmentWhitehead St, Front St to South StFlagler Ave, White St to Roosevelt BlvdUnited St, George St to Whitehead StTruman Ave, Palm Ave to Whitehead StSouthard St, White St to Whitehead StUS 1 from Stock Island to MarathonLevel of ServiceDDDDDDCSource: 1993 City of <strong>Key</strong> <strong>West</strong> Comprehensive <strong>Plan</strong>, Traffic Circulation element (2000 update)2.3 Description of <strong>Development</strong> Activities2.3.1 Existing <strong>Plan</strong>ning DocumentsThis TDP presents specific transit planning activities designed to enhance the viability ofpublic transit services in <strong>Key</strong> <strong>West</strong>. The City of <strong>Key</strong> <strong>West</strong> 2008 conformed version of the“Comprehensive <strong>Plan</strong>” was reviewed and no future improvements are budgeted to transit,nor does it mention the current transit system as a viable means of transportation. TheMonroe County technical document portion of the <strong>2010</strong> Comprehensive <strong>Plan</strong> was alsoreviewed. In Appendix C of this document is the “Mass <strong>Transit</strong> Element” updated March 5,2007. Their mass transit element does not recognize the KWDoT transit service as part ofMonroe County’s mass transit systems.Under section 14-73.00(3)(b) it requires an assessment of the extent to which land use andurban design patterns in the <strong>Key</strong> <strong>West</strong> transit service area support or hinder the efficientprovision of transit service, including any efforts being undertaken by KWDOT or local landuse authorities to foster a more transit-friendly operating environment. The City of <strong>Key</strong><strong>West</strong> “Comprehensive <strong>Plan</strong>” does not mention transit as it relates land use planningactivities. The land use maps are outdated (1991) as well as it land use policies as theypertain to transportation improvements (1992). The City is currently working on updatingthe land use elements mentioned to reflect the current and future <strong>Key</strong> <strong>West</strong> land uses. Withthe lack of available information it is re<strong>com</strong>mended that this section is updated after theTBG082810024135DFB/WPB31044333184.PDF/Final Report2-14
SECTION 2—DATA COLLECTION AND ANALYSIS<strong>2010</strong> US Census data is available while utilizing the revised Comprehensive <strong>Plan</strong> that theCity of <strong>Key</strong> <strong>West</strong> is working on updating.The KWDoT has provided a more urban friendly transit system by providing bicycle rackson buses as well as an on-line ‘real-time” bus routing software that users can monitor busschedules and on-time performance to better plan their day while utilizing transit.2.3.2 2025 Florida Transportation <strong>Plan</strong> (FTP)The 2025 FTP is Florida’s statewide 20-year transportation plan, which provides a policyframework for allocating funding that will be spent to meet the transportation needs of thestate. Florida is <strong>com</strong>mitted to providing livable <strong>com</strong>munities and mobility for people andfreight through greater connectivity and meeting the rising needs of businesses andhouseholds for safety, security, efficiency, and reliability. The FTP provides goals andobjectives for Florida’s transportation system.The long range goals with supporting objectives that are pertinent to KWDoT are as follows.• Enriched quality of life and responsible environmental stewardship.• <strong>Plan</strong>, develop, implement, and fund the transportation system to ac<strong>com</strong>modate thehuman scale, including pedestrian, bicycle, transit-oriented, and other <strong>com</strong>munityenhancingfeatures, unless inappropriate.• Facilitate economic development opportunities in Florida’s economically distressedareas by improving transportation access from these areas to markets in a manner thatreflects regional and <strong>com</strong>munity visions.• Reduce per capita vehicle miles traveled by single occupancy vehicles, especially duringpeak hours of highway use.• Ensure that the transportation system is accessible to all users, including young, elderly,disabled, and economically disadvantaged persons.• Promote sustainable transportation investments in Florida’s future.• Reduce the cost of providing and operating transportation facilities.• Document the gap between funding resources and needs across all levels and all modesin a consistent and <strong>com</strong>patible format.TBG082810024135DFB/WPB31044333184.PDF/Final Report2-15
SECTION 2—DATA COLLECTION AND ANALYSIS• Coordination among the many partners involved in planning and implementingtransportation investments must be strengthened.• Use effective public involvement and context sensitive design to develop transportationfacilities that support <strong>com</strong>munity visions and enhance quality of life• Provide state, local, and private sector incentives to encourage joint funding.In summary, the FTP supports the development of state, regional and local transit services.The growth in Florida requires new and innovative approaches by all modes to meet theneeds today and in the future.2.3.3 Strategic Regional Policy <strong>Plan</strong> for South FloridaThe South Florida Regional <strong>Plan</strong>ning Council (SFRPC) Strategic Regional Policy <strong>Plan</strong> forSouth Florida addresses critical issues for the South Florida Region. It is a plan for the entireRegion, not just the South Florida Regional <strong>Plan</strong>ning Council. While it is a guide for localgovernments in the development and implementation of their <strong>com</strong>prehensive plans, it alsoprovides a framework for non-governmental organizations seeking to enhance theiractivities within the Region. As such, the goals and targets in the document are expressed inthe imperative to underscore the Council’s intention to work with all of regional partners toimplement the plan.The Strategic Regional Policy <strong>Plan</strong> for South Florida (SRPP) contains 22 goals that reflect thepriority issues of the Region. These issues, including affordable housing, school facilities,transportation, and natural resources, are addressed in the context of the SRPP’s supportingvalues: Sustainability, Connectivity, and Responsibility. Indicators and targets are providedfor each goal to help determine progress, identify opportunities for improvement andcollaboration, and recognize regional success. Of the 22 goals, GOAL 8 applies to KWDoT.GOAL 8 is to “Enhance the Region’s mobility, efficiency, safety, quality of life, andeconomic health through improvements to road, port, and public transportationinfrastructure.”The following policies pertain to KwDOT:Policy 8.1- Maintain the Florida Intrastate Highway System, other state roads, localroadways, and public transportation systems to preserve the Region’s investment inTBG082810024135DFB/WPB31044333184.PDF/Final Report2-16
SECTION 2—DATA COLLECTION AND ANALYSISinfrastructure; support daily use and needs; enhance the Region’s global <strong>com</strong>petitivenessand economic health; increase safety; ensure emergency access and response; and providefor evacuation purposes.Policy 8.2-Reduce the utilization of the Florida Interstate Highway System and other<strong>com</strong>ponents of the regional road system for short, local trips.Policy 8.4- Expand use of public transportation, including buses, <strong>com</strong>muter rail, waterbornetransit, and alternative transportation modes that provide services for pedestrians, bikers,and the transportation disadvantaged, and increase its role as a major <strong>com</strong>ponent in theoverall regional transportation system.Policy 8.5- Identify all possible existing and future funding sources at the local, state, andfederal levels and from the private sector, and facilitate access to these sources in order tomeet the Region's transportation needs.Policy 8.7-Ensure that the transportation network, including public transportation, supportsthe emergency evacuation needs of the Region.Policy 8.8- Ensure the safety of the transportation system by implementing measures toreduce vehicle, pedestrian, and bicycle crashes, and increase the safety of <strong>com</strong>mercialvehicle operations.2.3.4 2008 Monroe County Transportation Disadvantaged Service <strong>Plan</strong>The Monroe County Transportation Disadvantaged Service <strong>Plan</strong> (TDSP) is consistent withthe goals, objectives and policies of the adopted Monroe County Year <strong>2010</strong> Comprehensive<strong>Plan</strong>. Within Monroe County’s Comprehensive <strong>Plan</strong>, Goal 401 in section 3.4 (Mass <strong>Transit</strong>)contains objectives and policies “to provide a coordinated surface transportation system fortransportation disadvantaged people within Monroe County and to encourage such asystem for all residents and guests.” The TDSP is also consistent with the goals of the <strong>Key</strong><strong>West</strong> <strong>Transit</strong> <strong>Development</strong> <strong>Plan</strong>.Chapter 427 of the Florida Statutes establishes the Florida Commission for theTransportation Disadvantaged (CTD) and directs the CTD to “ac<strong>com</strong>plish the coordinationof transportation services provided to the transportation disadvantaged.” As such, themission of CTD is to ensure the availability of efficient, cost-effective, and qualityTBG082810024135DFB/WPB31044333184.PDF/Final Report2-17
SECTION 2—DATA COLLECTION AND ANALYSIStransportation services for the transportation disadvantaged. In ac<strong>com</strong>plishing its purpose,the CTD approves a Community Transportation Coordinator (CTC) for each area of thestate which is charged with arranging cost-effective, efficient, unduplicated, andunfragmented transportation disadvantaged services within its respective service area.Additionally, a designated official planning agency (DOPA) is approved by the CTD andcharged with creating the Local Coordinating Board (LCB) and providing technicalassistance to the LCB. The LCB acts as an advisory board and as such provides guidance,monitors, evaluates and supports the transportation activities of the CTC.The Health Council of South Florida, Inc. was appointed as the DOPA for Monroe County atthe CTD meeting of April 22, 1993. During that year, the LCB was established, anorientation session was held, by-laws were adopted, and a grievance <strong>com</strong>mittee wascreated. The LCB is the oversight body for the CTC and provides a forum for theTransportation Disadvantaged in the <strong>com</strong>munity.The Board advocates for improved transportation and coordination of services to meet theneeds of local residents. As an advisory board, the LCB advises, monitors, evaluates andsupports the transportation activities of the CTC. After establishment, the LCB underwentthe process of selecting a CTC.2.4 Public <strong>Transit</strong> in <strong>Key</strong> <strong>West</strong>2.4.1 <strong>Key</strong> <strong>West</strong> Bus ServiceOverview of Existing System<strong>Key</strong> <strong>West</strong>'s transit system was originally established in 1972 as the <strong>Key</strong> <strong>West</strong> Port and<strong>Transit</strong> Authority. The system, now known as <strong>Key</strong> <strong>West</strong> <strong>Transit</strong> (KWT), is a department ofthe City of <strong>Key</strong> <strong>West</strong>. It is managed by the Director of Transportation, who reports to theCity Manager. The City Manager, in turn, reports to the <strong>Key</strong> <strong>West</strong> City Commission, whichserves as an advisory board to the transit system. The City Commission is <strong>com</strong>prised ofseven members: representatives from six voting districts and the Mayor, elected at large.KWT provides fixed-route motorbus services to the City of <strong>Key</strong> <strong>West</strong> and to Stock Island,which is outside the <strong>Key</strong> <strong>West</strong> city limits but in Monroe County. Monroe County providesdemand-response services throughout the county, including the City of <strong>Key</strong> <strong>West</strong>. Thesystem also opened full operation of a 250-space Park N' Ride facility on August 9, 1996.TBG082810024135DFB/WPB31044333184.PDF/Final Report2-18
SECTION 2—DATA COLLECTION AND ANALYSISThe <strong>Key</strong> <strong>West</strong> Department of Transportation (KWDoT) currently operates six fixed routes.Of the six, two traditional fixed routes operate in one-way loops around the Island. TheGreen Route operates in a counter-clockwise direction serving the entire Island mostly alongSouth and North Roosevelt Boulevard, and serves Stock Island as well. The Blue Routeclosely mirrors the green route; however, the blue route follows a clockwise pattern. TheRed Route is a clockwise figure eight route that serves the interior of <strong>Key</strong> <strong>West</strong> only. Thesethree routes operate Monday through Sunday from approximately 6:00 a.m. until 11:48 p.m.The three remaining routes operate Monday through Saturday approximately 6:00 a.m. until6:50 p.m. The Orange operates in a counter-clockwise direction, mostly along Flagler and N.Roosevelt Boulevard serving the western half of the island farthest <strong>West</strong> island roads. ThePurple Route operates in a similar area but utilizes North Roosevelt Blvd. and TrumanAvenue to a greater extent. The Gold Route is a bi-directional route serving Stock Island andnortheast <strong>Key</strong> <strong>West</strong>. All six routes operate with an approximate 50-minute to 1-hourfrequency. See the following figures for route maps and schedules. It should be noted thatsince this study has <strong>com</strong>menced, modifications have been made to these routes and can bereviewed at http://www.kwtransit.<strong>com</strong>/.FIGURE 2-10Blue, Red and Green Bus RoutesTBG082810024135DFB/WPB31044333184.PDF/Final Report2-19
SECTION 2—DATA COLLECTION AND ANALYSISFIGURE 2-11Blue, Red and Green Bus SchedulesTBG082810024135DFB/WPB31044333184.PDF/Final Report2-20
SECTION 2—DATA COLLECTION AND ANALYSISFIGURE 2-12Gold, Purple and Orange Bus RoutesTBG082810024135DFB/WPB31044333184.PDF/Final Report2-21
SECTION 2—DATA COLLECTION AND ANALYSISFIGURE 2-13Gold, Purple and Orange Bus RoutesTBG082810024135DFB/WPB31044333184.PDF/Final Report2-22
SECTION 2—DATA COLLECTION AND ANALYSISLower <strong>Key</strong>s Shuttle Service<strong>Key</strong> <strong>West</strong> DOT also operates the Lower <strong>Key</strong>s Shuttle. It is a 7-day-a-week shuttle servicefrom 5:30 a.m. to 11:25 p.m. It operates one northbound and one southbound shuttle from<strong>Key</strong> <strong>West</strong> to Marathon. It has reduced service on the weekends. It operates on generally1 hr. and 20 min. headways. See the following table for current route schedules.FIGURE 2-14Lower <strong>Key</strong>s Shuttle Bus Schedules<strong>Key</strong> <strong>West</strong> Park N' Ride ShuttleThe <strong>Key</strong> <strong>West</strong> Park N' Ride service is available at The Old Town Garage located on thecorner of Grinnell and Caroline Streets. Inclusive of the $13 fee, you can park your car andride the shuttle all day to the downtown area including Old Town, the Southernmost Point,Mallory Square and the points in between. The <strong>Key</strong> <strong>West</strong> Park N' Ride shuttle arrives andleaves the Park N' Ride facility every half hour (top and bottom of each hour). Specificinformation for this service is as follows:Location: Grinnell and Caroline StreetNo of available spaces: 300Hours: 8:30 am - 12:00 midnightTBG082810024135DFB/WPB31044333184.PDF/Final Report2-23
SECTION 2—DATA COLLECTION AND ANALYSISParking Rates:$2.00 / hour$13.00 maximum per day$20.00 lost ticket fee$99.75 (plus tax) monthly parking permitAdditional Information:Overnight parkingCars, vans, and passenger trucks onlyHeight restriction 7 ft 2 inNo vehicle storageMonthly permits may be purchased at the attendant's booth in the Garage2.4.2 Other <strong>Transit</strong> Related ServicesDade-Monroe ExpressMiami-Dade <strong>Transit</strong> (MDT) contracted with American Coach Lines to provide bus servicefor the corridor between Florida City (Wal-Mart) and City of Marathon. The bus service isknown as Dade-Monroe Express with the route designation being #301.The fare for each one-way trip on the Dade-Monroe Express is $1.85 and requires thepassenger to provide the bus driver with the exact amount; no change can be provided.Metro Bus Passes, Bus Tokens, Golden and Patriot Passports, STS ID’s and MDT EmployeeID’s are accepted as well.The fare for transferring to the Dade-Monroe Express bus from the mainland MDT bus is inaddition to the regular $1.50 MDT bus fare. The transfer requires that an extra $.50 be paidto the MDT driver. Then along with that transfer, another $.35 is paid when boarding theDade-Monroe Express for a total cost of $2.35 for the <strong>com</strong>bined trip.TBG082810024135DFB/WPB31044333184.PDF/Final Report2-24
SECTION 2—DATA COLLECTION AND ANALYSISThe fare for transferring to the mainland MDT bus from the Dade-Monroe Express bus is inaddition to the regular $1.85 Dade-Monroe Express bus fare. The transfer requires that anadditional $.50 be paid to the Dade-Monroe Express driver. The passenger will present thetransfer to the MDT driver with no additional fare being required. This results in a total costof $2.35 for the <strong>com</strong>bined trip.Monroe County <strong>Transit</strong>’s Paratransit ServiceMonroe County <strong>Transit</strong> (MCT) is a door-to-door service designed for people who needtransportation. The elderly and/or disabled individuals who are unable to access regularfixed route or <strong>com</strong>muter bus service are especially encouraged to use this service.MCT provides paratransit transportation within the Florida <strong>Key</strong>s, available between milemarker 0 in <strong>Key</strong> <strong>West</strong> through mile marker 113 in <strong>Key</strong> Largo as well as Ocean Reef. MonroeCounty <strong>Transit</strong> meets the requirements of the Americans with Disabilities Act (ADA) andprovides door-to-door service to those individuals who qualify.The residents outside of <strong>Key</strong> <strong>West</strong> and those who live in <strong>Key</strong> <strong>West</strong> should adhere to the followingguide lines in order to use these services:• Those who live in <strong>Key</strong> <strong>West</strong> because of visual, physical or mental impairment cannotrecognize destinations or cope with the physical requirements of the regular bus service.• <strong>Key</strong> <strong>West</strong> residents whom would use regular bus service if the buses couldac<strong>com</strong>modate their necessary mobility aids such as wheelchairs, scooters, etc.• Individuals, who live in <strong>Key</strong> <strong>West</strong>, but because of impairments or impairment-relatedconditions, cannot get to or wait at a regular bus stop.Generally, the <strong>Key</strong> <strong>West</strong> residents will utilize the fixed route City of <strong>Key</strong> <strong>West</strong> bus system ifthey live within ¾ of a mile to the fixed route system.Guidance Clinic of the Middle <strong>Key</strong>s. (GCMK)GCMK provides transportation services and is the designated Community TransportationCoordinator (CTC) and Medicaid Coordinator for Monroe County. The CTC is responsiblefor administering a countywide system of transportation for all Monroe citizens who aretransportation disadvantaged.TBG082810024135DFB/WPB31044333184.PDF/Final Report2-25
SECTION 2—DATA COLLECTION AND ANALYSIS2.6.2 Operating StatisticsA trend analysis was conducted to examine the performance of the KWDoT’s fixed-routebus service. Data were <strong>com</strong>piled based on the information received from KWDoT for 3 yearsfrom 2005 through 2008. This analysis includes statistical tables that present selectedperformance indicators and effectiveness and efficiency measures for the selected timeperiod. Table 2-12 lists the base measures used in this performance for the trend analysis.TABLE 2-12<strong>Key</strong> <strong>West</strong> <strong>Transit</strong> Operating Statistics (2008)Indicator 2005-2006 2006-2007 2007-2008Passenger Trips 519,673 505,885 515,729Active Vehicles in Total FleetVehicles in Total FleetVehicle Hours81534,94481541,26291745,877Revenue Miles 742,869 764,303 795,749Operating RevenueFarebox Revenue$931,815$381,277$974,068$496,450$1,417,862$538,471Vehicle Maintenance Operating Expense $683,985 $673,325 $571,581General Admin. Operating Expense $387,592 $381,551 $323,895Total Operating Expense $3,211,766 $3,218,484 $3,323,131Operating Cost per Vehicle (Hour) $91.91 $78.00 $72.44Operating Cost per Vehicle (Miles) $4.32 $4.21 $4.18Net Operating Cost per Passenger Trip $4.39 $4.44 $3.69Source: KWDOT2.7 Trend Analysis2.7.1 Fixed-Route Trend AnalysisA trend analysis was conducted to examine the performance of KWDoT transit over time.Data were <strong>com</strong>piled from the KWDoT financial reports for fiscal years 2002-2008. Thisanalysis includes statistics and tables that present selected performance indicators andeffectiveness and efficiency measures for the selected time period. Highlights of the trendanalysis are presented below.Between FY 2005 and FY 2008, one (1) additional route was added expanding service intoMarathon (Aqua Route).TBG082810024135DFB/WPB31044333184.PDF/Final Report2-29
SECTION 2—DATA COLLECTION AND ANALYSISThe performance indicators are used to present the data that are reported directly inNational <strong>Transit</strong> Database (NTD) reports and relate to overall system performance. Selectedperformance indicators are presented in Table 2-13.TABLE 2-13<strong>Key</strong> <strong>West</strong> DOT Performance IndicatorsPerformanceIndicator 2003-2004 2004-2005 2005-2006 2006-2007 2007-2008%Change2003-2008Passenger Trips 310,736 319,088 519,673 505,885 515,729 65.97%Revenue Miles 258,425 358,728 742,869 764,303 795,749 208%Total Op. Expense $1,142,802 $1,442,831 $3,211,766 $3,218,484 $3,323,131 191%Operating Revenue $272,269 $346,575 $931,815 $974,068 $1,417,862 421%Vehicles/Max Service 6 6 8 8 8/9 33%Net Expense/Pass.Trip2007NationalAverage$3.67 $4.41 $4.39 $4.44 $3.69 0.5% $2.33The following is a summary of the trends that are evident among the performanceindicators provided in Table 2-13. It should be noted that operating expenses increased in 2004-2005 due to the implementation of the Lower <strong>Key</strong>s Shuttle service and further increased in 2006-2007with the addition of the <strong>Key</strong> <strong>West</strong> Park N’ Ride operating costs.• The passenger trips for KWDoT increased from 310,736 to 515,729 an increase of66 percent between 2003 and 2008. This was primarily due to the new Aqua Route toMarathon.• The total vehicle revenue miles being provided by KWDoT increased from 258,425miles in 2003 to 795,749 miles in 2008, an increase of approximately 208 percent. Thiswas primarily due to the new Aqua Route to Marathon.• Total operating expense increased from $1,142,802 in 2003 to $3,323,131 in 2008, anincrease of nearly 191 percent. When operating expenses are <strong>com</strong>pared to 2006, theincrease is only 3.2 percent. This growth is due in large part, to the expanded hours ofservice and route expansion during the period. Other factors have also impacted overallsystem costs during this time, as well as increased fuel costs.• Operating revenue increased from $272,269 in 2003 to $1,417,862 in FY 2008, an increaseof 421 percent. Much of this increase is due to the corresponding growth in KWDoTTBG082810024135DFB/WPB31044333184.PDF/Final Report2-30
SECTION 2—DATA COLLECTION AND ANALYSISridership and a fare increase during this time as well as in<strong>com</strong>e from the <strong>Key</strong> <strong>West</strong> ParkN’ Ride.The number of vehicles operated in maximum service increased by 33 percent, from six(6) in 2003 to eight (8) in 2008.2.8 Peer Analysis2.8.1 Peer System Selection MethodologyThe <strong>Key</strong> <strong>West</strong> transit system is a very unique system when <strong>com</strong>pared to other transitsystems nationwide. It serves a very small confined area (with the exception of the Lower<strong>Key</strong>s Shuttle), far less than any other <strong>com</strong>parable system within the NTD database.The peer selection was conducted using the most recent available 2007 NTD data. The peerswere identified through an objective assessment of four standard variables in NTD. Afterthe peer systems were selected, the 2007 NTD data for each peer system was obtainedthrough the NTD website and used to conduct the peer review analysis. The variables usedto select the peer systems include:• Service Area• Annual Trips• Directly Operated Buses• Service Area PopulationFirst, the peer group selection was based on annual trips. The goal was to locate transitservices that operate near the 500,000 annual trip range the KWDoT has attained over thelast 3 years of service. The next goal was to locate bus operated systems similar to KWDoTwhere they operate a total fleet of approximately 15 fleet vehicles. After these two criteriawere met, service areas were reviewed as well as population served. An effort was initiallymade to utilize Florida based and the southeastern-based systems first. Due to the lack of<strong>com</strong>parable local systems, national fixed-route systems were also considered.Based on the results of the peer selection process, five transit systems were selected for thepeer review analysis. Table 2-14 presents the selected peers and their category statistics forselection.TBG082810024135DFB/WPB31044333184.PDF/Final Report2-31
SECTION 2—DATA COLLECTION AND ANALYSISTABLE 2-14<strong>Transit</strong> Peer Review Selection (2008)<strong>Transit</strong> SystemServicePopulationService Area(SquareMiles)Annual TripsAnnualPassengerMilesNo. ofBusesOperatedLaguna Beach Municipal<strong>Transit</strong>24,969 9 462,654 792,785 17Johnson City <strong>Transit</strong> 49,381 33 532,500 1,970,396 10City of Union <strong>Transit</strong> 70,300 18 437,915 1,321,074 11City of Ocala (FloridaSunTran)Polk County <strong>Transit</strong> Service(Florida)89,638 55 341,902 1,079,877 6153,924 27 571,202 1,412,596 19Peer Group Mean 77,642 28.4 469,234 1,315,345 10.6<strong>Key</strong> <strong>West</strong> <strong>Transit</strong> 49,465 58 515,729 795,749 17Source: National <strong>Transit</strong> DatabaseThe five (5) selected peers are as follows:Laguna Beach Municipal <strong>Transit</strong> (CLB)ID Number: 9119www.lagunabeachcity.net505 Forest AvenueDirector of Public Works/City Engineer: Mr. Steve MayLaguna Beach, CA 92651(949) 497-0351Johnson City <strong>Transit</strong> System (JCT)ID Number: 4054www.johnsoncitytransit.org137 <strong>West</strong> Market StreetDirector: Ms. Eldonna JanutoloJohnson City, TN 37604(423) 434-6260City of Union City <strong>Transit</strong> Division (UCT)ID Number: 9161www.ci.union-city.ca.us34009 Alvarado-Niles RoadDirector of Public Works: Ms. Mintze ChengUnion City, CA 94587(510) 675-5308City of Ocala, Florida (SunTran)ID Number: 4120www.suntran.orgTBG082810024135DFB/WPB31044333184.PDF/Final Report2-32
SECTION 2—DATA COLLECTION AND ANALYSIS121 Southeast Watula Avenue, P.O. Box 1270Director: Mr. Greg SlayOcala, FL 34478-1270(352) 629-8297Polk County <strong>Transit</strong> Services Division - Polk County Board of County Commissioners(PCTS)ID Number: 4127www.Polk-County.net1290 Golfview Avenue, Drawer HS09, 9005Director, Polk County <strong>Transit</strong> Services: Mr. Paul SimmonsBartow, FL 33831-9005(863) 534-53682.8.2 Performance IndicatorsSelected performance indicators for the peer review are presented in this section. Categoriesof performance indicators include population, population density, ridership, revenue miles,and vehicles.Tables 2-15 through 2-19 present the performance indicators for the peer review analysis.TABLE 2-15<strong>Transit</strong> Peer Review Service Efficiency Comparison<strong>Transit</strong> SystemOperating Expense perVehicle MileOperating Expense perHourLaguna Beach Municipal <strong>Transit</strong> $8.52 $80.42Johnson City <strong>Transit</strong> $3.38 $47.23City of Union <strong>Transit</strong> $5.50 $68.36City of Ocala $4.41 $68.62Polk County <strong>Transit</strong> Service $2.85 $53.42Peer Group Mean $4.93 $63.65<strong>Key</strong> <strong>West</strong> <strong>Transit</strong> $4.18 $72.44Source: National <strong>Transit</strong> DatabaseThe service efficiency results for <strong>Key</strong> <strong>West</strong> <strong>Transit</strong> are better as <strong>com</strong>pared to the peer group.The results indicate that <strong>Key</strong> <strong>West</strong> <strong>Transit</strong> operates at 15.21 percent more efficient than thepeer group mean per mile and 13.82 percent less on an hourly basis. This would indicatethat <strong>Key</strong> <strong>West</strong> <strong>Transit</strong> is efficient in managing their overall expenses and are in-line with theresults of the peer group mean.TBG082810024135DFB/WPB31044333184.PDF/Final Report2-33
SECTION 2—DATA COLLECTION AND ANALYSISTABLE 2-16<strong>Transit</strong> Peer Review Cost Effectiveness Comparison<strong>Transit</strong> SystemOperating Expense perPassenger MileOperating Expense perPassenger TripLaguna Beach Municipal <strong>Transit</strong> $1.98 $3.40Johnson City <strong>Transit</strong> $0.76 $2.75City of Union <strong>Transit</strong> $2.08 $6.30City of Ocala $1.64 $5.01Polk County <strong>Transit</strong> Service $1.31 $3.21Peer Group Mean $1.55 $4.13<strong>Key</strong> <strong>West</strong> <strong>Transit</strong> $4.17 $6.44The cost effectiveness results for <strong>Key</strong> <strong>West</strong> <strong>Transit</strong> as <strong>com</strong>pared to the peer group indicatethat <strong>Key</strong> <strong>West</strong> <strong>Transit</strong> operates at 169 percent less efficient than the peer group mean on anoperating expense per passenger mile basis and is 56 percent less efficient on an hourly costbasis. This could reflect the fact that the <strong>Key</strong> <strong>West</strong> service has underutilized times when theyare not transporting an adequate capacity of passengers. This analysis does not includefarebox recovery where <strong>Key</strong> <strong>West</strong> <strong>Transit</strong> excels over the other peer groups.TABLE 2-17<strong>Transit</strong> Peer Review Service Effectiveness Comparison<strong>Transit</strong> SystemPassenger Trips perVehicle Revenue MilePassenger Trips perVehicle Revenue HourLaguna Beach Municipal <strong>Transit</strong> 2.51 23.67Johnson City <strong>Transit</strong> 1.23 17.18City of Union <strong>Transit</strong> 0.87 10.85City of Ocala 0.88 13.70Polk County <strong>Transit</strong> Service 0.89 16.65Peer Group Mean 1.27 16.41<strong>Key</strong> <strong>West</strong> <strong>Transit</strong> 0.65 11.24The service effectiveness results for <strong>Key</strong> <strong>West</strong> <strong>Transit</strong> are lower as <strong>com</strong>pared to the peergroup. The results indicate that they are 48.8 percent per vehicle revenue mile and 46 percentper vehicle revenue hour less effective in generating passenger trips than the peer groupmean. Once again this would suggest that <strong>Key</strong> <strong>West</strong> <strong>Transit</strong> is running some ineffectiveroutes or times that have low ridership numbers as <strong>com</strong>pared to the peer group mean.TBG082810024135DFB/WPB31044333184.PDF/Final Report2-34
SECTION 2—DATA COLLECTION AND ANALYSISTABLE 2-18<strong>Transit</strong> Peer Review Farebox Recovery Ratio<strong>Transit</strong> SystemTotal OperatingExpensesTotal FareboxRevenueFarebox RecoveryRatioLaguna Beach Municipal <strong>Transit</strong> $1,571,587 $148,718 9.46%Johnson City <strong>Transit</strong> $2,108,298 $224,163 10.63%City of Union <strong>Transit</strong> $3,250,872 $407,599 12.54%City of Ocala $1,880,136 $204,573 10.88%Polk County <strong>Transit</strong> Service $2,066,749 $148,271 7.17%Peer Group Mean $2,175,528 $226,665 10.14%<strong>Key</strong> <strong>West</strong> <strong>Transit</strong> $3,323,131 $538,471 16.2%The farebox recovery ratio of a passenger transportation system is the proportion of theamount of revenue generated through fares by its paying customers as a fraction of the costof its total operating expenses. Most systems aren't self-supporting, so advertising revenueand government subsidies are usually required to cover costs. The Hong Kong MTRCorporation is one of the few self-supporting transit systems in the world. The fareboxrecovery ratio for <strong>Key</strong> <strong>West</strong> <strong>Transit</strong> excelled as <strong>com</strong>pared to the peer group mean. Theresults indicate that they are recovering 16.2 percent of their operating cost through fareboxrevenue as <strong>com</strong>pared to the 10.14 percent mean of the peer group. This would suggest that<strong>Key</strong> <strong>West</strong> <strong>Transit</strong> is very effective in recovering their costs through user fares. If you adadvertising, parking and other non-tax funded revenue the farebox recovery increases to32.19 percent. This <strong>com</strong>pares slightly better than the national average for all bus transitsystems at 26.61 percent.2.8.3 Direct Comparison AnalysisSince <strong>Key</strong> <strong>West</strong> <strong>Transit</strong> is a very unique system, the study looked at a direct <strong>com</strong>parison toLaguna Beach Municipal <strong>Transit</strong> (CLB). Both systems serve a similar size, directly operate afleet of 17 buses and have similar ridership. The following Table 2-19 is a summation onhow they <strong>com</strong>pare to each other.TBG082810024135DFB/WPB31044333184.PDF/Final Report2-35
SECTION 2—DATA COLLECTION AND ANALYSISTABLE 2-19<strong>Transit</strong> Direct Comparison Analysis<strong>Transit</strong> SystemLaguna Beach Municipal<strong>Transit</strong><strong>Key</strong> <strong>West</strong> <strong>Transit</strong>Annual Trips 462,654 515,729Annual Passenger Miles 792,785 795,749Buses Operated 17 17Operating Expense $1,571,587 $3,323,131Non-Tax Revenue $347,302 $1,417,862Net Expense Ratio 22.10% 32.19%Net Operating Cost per Passenger Trip $2.65 $3.69Net Operating expense per passenger mile $1.54 $2.392.9 Vehicle InventoryThe KWDoT vehicle inventory consists of 21 vehicles. Of these vehicles, transit has 17 busesthat seat 23 or more people. All of the buses are accessible to persons with disabilities. Inaddition, KWDoT operates 1 van and 4 pick-ups. Table 2-20 contains a <strong>com</strong>plete inventoryof the transit fleet vehicles operated by KWDoT. The average age of the fleet isapproximately 5 years this <strong>com</strong>pares to the national average of 7.1 years. These vehicleshave a re<strong>com</strong>mended service life of 500,000 miles or 10 years.TABLE 2-20<strong>Key</strong> <strong>West</strong> DOT Bus Fleet InventoryDescription Year VIN# Fuel Status MileageGILLIG BUS 2001 15GGE181011090404 DIESEL ACTIVE 156172GILLIG BUS 2001 15GGE181211090405 DIESEL ACTIVE 168153GILLIG BUS 2001 15GGE181411090406 DIESEL ACTIVE 266710GILLIG BUS 2001 15GGE181611090407 DIESEL ACTIVE 252727GILLIG BUS 2001 15GGE181611090408 DIESEL ACTIVE 153398GILLIG BUS 2001 15GGE181X11090409 DIESEL ACTIVE 259957GILLIG BUS 2001 15GGE181161090410 DIESEL ACTIVE 292111GILLIG BUS 2001 15GGE181181090411 DIESEL ACTIVE 151761GILLIG BUS 2001 15GGE181631090684 DIESEL ACTIVE 220719GILLIG BUS 2003 15GGE181831090685 DIESEL ACTIVE 302378GILLIG BUS 2003 15GGE18X631090686 DIESEL ACTIVE 160013GILLIG BUS 2003 15GGE181631090684 DIESEL ACTIVE 235614GILLIG BUS 2003 15GGE181131090687 DIESEL ACTIVE 315340GILLIG BUS 2003 15GGE181331090688 DIESEL ACTIVE 241129GILLIG BUS 2003 15GGE181131090690 DIESEL ACTIVE 228985GILLIG BUS 2008 15GGB271081078831 DIESEL ACTIVE 99894GILLIG BUS 2008 15GGB271281078832 DIESEL ACTIVE 93417TBG082810024135DFB/WPB31044333184.PDF/Final Report2-36
Public input is an important part in the development of the TDP. The Public Involvement<strong>Plan</strong> (PIP) was developed to allow a “hands on” approach and reach out for participationfrom citizens in the <strong>com</strong>munity. The PIP originally consisted of the following:• two (2) Project Advisory Committee Meetings (PAC)• three (3) Community Discussion Groups (CDG)• two (2) informational public workshops,• on-board survey of bus riders,• survey of bus operators (drivers),• survey of fleet maintenance• City Commission approval of the TDPBased on input from the City of <strong>Key</strong> <strong>West</strong> Attorney it was determined that all meetings heldwould require public notice as per Florida Sunshine Law interpretation. Therefore onlypublic workshops and one meeting was held with the Monroe County Local CoordinatingBoard for Transportation Disadvantaged Services. In order to avoid confusion with thepublic, the PAC and CDG meetings were not developed or conducted and all futuremeetings are considered public workshops and are to be provided public notice as perFlorida Statutes. Therefore, the main public involvement activity consisted of on-board usersurveys and advertised public workshops.3.1 Public Involvement <strong>Plan</strong>As required under Florida Rule 14-73.001, a public involvement plan was drafted for theTDP. It was approved by FDOT. A copy of the plan can be found in Appendix B. For copiesof public notices used to advertise public involvement activities, see Appendix B.3.2 Public WorkshopsA public workshop was held on November 18, 2009 at the Senior Citizen Plaza Auditoriumat 1400 Kennedy Drive in <strong>Key</strong> <strong>West</strong>. The public was notified about the meeting vianewspaper advertisements, live radio interview and announcement, membership mailingsTBG082810024135DFB/WPB31044333184.PDF/Final Report3-1
SECTION 3—PUBLIC INVOLVEMENTby the <strong>Key</strong> <strong>West</strong> Chamber of Commerce, mass e-mails by the KWDoT and flyers providedon the current <strong>Key</strong> <strong>West</strong> and Lower <strong>Key</strong>s Shuttle routes.A questionnaire was provided for public <strong>com</strong>ment, a copy of the Draft <strong>2010</strong>-2019 TDP wasmade available for review and a PowerPoint presentation was presented at the workshop.These items are presented in Appendix B of this document.3.3 Public Workshop ResultsIn many cases public workshops have proven to be an effective technique for obtainingsubstantive public participation in the planning process. Although this workshop wasadvertised via newspaper, radio, flyers and e-mail it was very sparsely attended. The major<strong>com</strong>ments as the result of the work shop are as follows:• KWDoT should consider operating night time service that serves the Old Town area• The bus schedule should have consistent times that service each stop (example: at25 minutes past the hour each hour) so the bus schedule does not have to be revieweddepending on the time of the service• KWDoT should consider a “trunk line” route that serves N. Roosevelt Blvd.3.4 On-Board SurveySurveys were handed out to passengers during the month of October, 2009. Approximately72 surveys were received which account for approximately 10 percent of the dailyboardings. All routes were surveyed. The results of this survey are presented below. For acopy of the on-board survey, see Appendix B.Purpose of Riding the BusThe main purpose of riding the bus consisted of three (3) main reasons; work, school,shopping. Riders using the transit system to work consisted of 74 percent of the users.Eleven (11) percent of the users used bus service for school and the remainder used theservice for shopping or medical appointments.Why Ride the Bus?Given that there are other modes of transportation available within the confines of the City,the primary reason to utilize the bus were that 37 percent of the users did not own motorTBG082810024135DFB/WPB31044333184.PDF/Final Report3-2
SECTION 3—PUBLIC INVOLVEMENTvehicles and 31 percent of the users did not have drivers licenses. The remaining 32 percentused transit based on its convenience.How many times days per week do you ride the bus?Based on the survey results, the majority of riders are regular riders of the system. Thesurvey indicated that riders used the system 5.03 days per week. This would be indicative ofthe type of rider whom, as indicated in the previous section had no motor vehicle or driverslicense.How do you get to the bus stop?The vast majority of the users walk to the bus stop. Over 85 percent walk to/from the busstop. The remainder ride bicycles (11 percent) or get there by some other mode oftransportation. It should be noted that each bus has the ability to carry two bicycles.How far do you travel to get to the bus stop?Approximately one-third of the transit users travel 1 to 3 blocks to their local bus stops. It isdesirable to have all users within a ¾ mile walking distance to their nearest stop.Considering approximately 75 percent of the users are less than three-eighths of mile fromtheir stop, it is likely that 90 percent of the users are less than the desirable three-fourthsmile walking distance. In the event users do not have the physical capabilities of walkingto/from the fixed route bus system they can call the GCMC for transportation assistance.The overall results are as follows:• 17 percent less than 1 block• 33 percent 1 to 3 blocks• 23 percent 3 to 5 blocks• 27 percent more than 5 blocksDo you have other transportation options?Approximately one-third of the riders surveyed had other transportation options such asautomobile or bicycle available. The remaining two-thirds of the users are dependent on busservice. Of the approximately 515,000 passenger trips in 2008, 343,000 trips werenecessitated by people without alternate modes of transportation.TBG082810024135DFB/WPB31044333184.PDF/Final Report3-3
SECTION 3—PUBLIC INVOLVEMENTHow long have you been using <strong>Key</strong> <strong>West</strong> Bus service?The following is a summarized list of how long the surveyed users have been utilizing thebus service.• 7 percent Less than 1 month• 18 percent 1-6 months• 19 percent 6-12 months• 20 percent 1-3 years• 36 percent More than 3 yearsThese are significant numbers that give precedent to the long term users of the service. Since56 percent of the current users have been utilizing the <strong>Key</strong> <strong>West</strong> bus service for more than1 year, it can be concluded that it is important to understand the desires of these people as itrelates to their bus service needs. It is also important to understand why new users onlyaccount for 7 percent of the usage. An effort should be made to bring on new users whilebeing receptive to the desires of the core long term users.How would you rate the <strong>Key</strong> <strong>West</strong> Bus service?It is evident from the results below that the service provide by KWDoT transit is acceptableby over 87 percent of the users whom rated their service as good or better. Therefore most ofthe users appear to be satisfied overall with the current service.• 26 percent Excellent• 61 percent Good• 13 percent Fair• 0 percent PoorWhat improvements would you like to see?The most requested improvements consisted of the following:• 45 percent Less wait times• 17 percent No improvements needed• 15 percent More stop locations• 12 percent Other improvements• 11 percent More routesTBG082810024135DFB/WPB31044333184.PDF/Final Report3-4
SECTION 3—PUBLIC INVOLVEMENTIt is understandable how the number one improvement request would be less wait times,considering that the typical user can wait up to one hour for their bus to <strong>com</strong>e. In manylarge cities bus wait times are typically 15 minutes or less. The reduction of bus headwayswill generally require more resources in order to implement. In Chapter 7, under thedevelopment of the Alternatives the reduction of headways will be evaluated along withmore stop locations under the current route structure. It does appear based on thegeography and demographics of <strong>Key</strong> <strong>West</strong> the current route system is acceptable.Approximately 11 percent of the users would like to have more routes available. This canalso be attributed to the recent budgetary cuts to KWDoT and reduction of route service thatoccurred during this study.3.5 Fleet Maintenance SurveyFleet maintenance was interviewed to determine their efficiency, safety and to provideoverall input on how to improve the functionality of their services. Their main concern isthat the existing maintenance facility is functionally obsolete. They share the facility withthe City vehicle fleet maintenance; therefore, it limits the space available for busmaintenance. They essentially have one interior bay to work on vehicles. This bay includes apit for fluid changes. This be<strong>com</strong>es an efficiency issue when fluids need to be transferredfrom the below grade pit to the used fluid holding facility since there is no fluid pumpingsystem available. Fluids must be pumped manually which can cause spills and leaks. This isnot only an environmental concern but also a safety concern since oils can be tracked on tothe floor and stairs thus creating a safety hazard.TBG082810024135DFB/WPB31044333184.PDF/Final Report3-5
SECTION 3—PUBLIC INVOLVEMENTThe second inefficiency noted was that the bus lift system is located outside themaintenance building in the open. Under normal operating circumstances the lift should belocated within an interior facility or at a minimum an open covered structure. Under thepresent condition mechanics and helpers must service the fleet in the direct sunlight orunder adverse weather conditions. It is noted that the City has budgeted money for a newmaintenance facility.TBG082810024135DFB/WPB31044333184.PDF/Final Report3-6
SECTION 3—PUBLIC INVOLVEMENTThe current maintenance staff consists of three (3) mechanics and two (2) helpers. Theinterviews indicated with a new facility, maintenance could expand their services to providepaint and body which is normally sent outside the facility. An additional staff memberwould be required to provide this service, therefore a cost/benefit analysis would need tobe performed to determine if this is beneficial.The staff members felt they had adequate training, with the exception of their knowledge ofthe bus <strong>com</strong>mercial air conditioning (A/C) systems. With proper training they believe allA/C repairs could be done with the in-house staff.3.6 Bus Driver SurveyA written bus driver survey was prepared and anonymously <strong>com</strong>pleted by 15 driverscurrently employed by KWDoT. For a copy of the bus driver survey, see Appendix B. Thefollowing are the results of the survey conducted.TBG082810024135DFB/WPB31044333184.PDF/Final Report3-7
SECTION 3—PUBLIC INVOLVEMENTHow long have you been working for KWDoT?The average length of tenure with KWDoT is 5.2 years of service with the minimum of6 months and the maximum of 20 years.What are the most frequent <strong>com</strong>plaints you hear from passengers?• 33 percent- bus is running late• 33 percent- schedule changes• 13 percent- air conditioning un<strong>com</strong>fortable• 21 percent- more frequent serviceIs there adequate run time in your schedule?• 87 percent- Yes• 13 percent –NoSome additional <strong>com</strong>ments indicated that during peak season they can run late and some ofthe routes have certain stops that tend to run late due to travel time scheduling.How do you suggest improving bus schedules?There was no definite reason but the <strong>com</strong>ments consisted of the following:• Experiment with an all night service• Better marketing• More driver input, talk with drivers before changing schedules• Have a seasonal scheduleAre more shelters or signs needed?• 40 percent- Yes• 60 percent- NoSome of the locations needed were on the Lower <strong>Key</strong>s Shuttle stops and at TrumanAve/Emma St. and Truman Ave/White St.TBG082810024135DFB/WPB31044333184.PDF/Final Report3-8
SECTION 3—PUBLIC INVOLVEMENTAre safety improvements needed?• 47 percent Yes• 53 percent NoSome of the safety improvements re<strong>com</strong>mended are:• More lights at Lower <strong>Key</strong>s Shuttle stops• Make passengers sit if bus is not full• Passengers need better control of their children• Drivers and passengers need to both follow posted rulesHow can KWDoT improve its service?The responses were varied and included the following:• Adjust the schedule times when early or late times be<strong>com</strong>e a problem• Bring the old routes back• Give more appreciation to the drivers• More lights at the Lower <strong>Key</strong>s Shuttle stops3.7 South Florida Workforce (SFW) CoordinationAs per state requirements coordination with SFW is required as part of the TDP process.The local SFW coordinator is Youth Co-Op, Inc (YCI). They are located at:<strong>Key</strong> <strong>West</strong> Career Center1111 12th Street, Suites 307<strong>Key</strong> <strong>West</strong>, FL 33040Phone: 305.292.6762Fax: 305.292.6891Their primary goal is to provide positive futures for at-risk youth. They work with youthsand their families as well. Today YCI provides quality, cost effective services toparticipants at no cost. Their mission is based upon a proven formula to educate, empowerand employ. YCI has effectively met the needs of thousands using this formula as theirTBG082810024135DFB/WPB31044333184.PDF/Final Report3-9
SECTION 3—PUBLIC INVOLVEMENTguide. YCI's vision is to expand their highly successful business, workforce, refugee, andyouth programs.We interviewed David Demala (ddemala@southfloridaworkforce.<strong>com</strong>), Manager, to get hisfeedback regarding <strong>Key</strong> <strong>West</strong> <strong>Transit</strong> service. His <strong>com</strong>ments were as follows:• Their clients were generally pleased with <strong>Key</strong> <strong>West</strong> <strong>Transit</strong> service• Their main <strong>com</strong>plaint was that buses were not showing up at the stops “late” as perschedules• They would like to see better <strong>com</strong>munication from <strong>Key</strong> <strong>West</strong> DOT like advance e-mailsprior to bus service changes so he can pass this on to their clients• If <strong>Key</strong> <strong>West</strong> were to have quarterly coordination meetings he would like to be involvedin them.TBG082810024135DFB/WPB31044333184.PDF/Final Report3-10
Provided below is a summary of various transit funding mechanisms that are potentiallyavailable to KWDoT <strong>Transit</strong>.4.1 Small <strong>Transit</strong> Intensive Cities (49 U.S.C. §5336(j)The Small <strong>Transit</strong> Intensive Cities program was established by SAFETEA-LU within theUrbanized Area Formula Program. The program is available to transit intensive urbanizedareas with less than 200,000 in population and is funded through a set-aside from theformula program. Both operating and capital programs that are consistent with theUrbanized Area Formula Program guidelines are eligible for this type of funding.4.2 Bus and Bus Related Facilities Program (49 U.S.C. §5309)The Bus and Bus Related Facilities Program provides capital assistance to eligible recipientson a discretionary basis. <strong>Transit</strong> authorities and other state and local public bodies andagencies are eligible recipients.4.3 Strategic Intermodal System (SIS) FundsFlorida’s SIS was established in 2003 to enhance Florida’s economic <strong>com</strong>petitiveness byfocusing limited state resources on those transportation facilities that are critical to Florida’seconomy and quality of life. The SIS is a statewide network of high-priority transportationfacilities, including the state’s largest and most significant <strong>com</strong>mercial service airports,spaceport, deepwater seaports, freight rail terminals, passenger rail and intercity busterminals, rail corridors, waterways, and highways. These facilities are the workhorses ofFlorida’s transportation system, carrying more than 99 percent of all <strong>com</strong>mercial airpassengers, virtually all waterborne freight tonnage, almost all rail freight, and more than68 percent of all truck traffic and 54 percent of total traffic on the SIS.FDOT’s investment policy, which was developed in conjunction with legislative action in2004 to establish funding for the SIS, will result in an increase in the proportion ofdiscretionary capacity funds allocated to the SIS to about 75 percent by 2015. At that rate,TBG082810024135DFB/WPB31044333184.PDF/Final Report4-1
SECTION 4—FUNDING AVAILABILITYabout one-third of all state and federal funds available to FDOT will be available for SIScapacity projects. Funding for all capacity projects – both SIS and non-SIS – will beapproximately $2.4 billion in 2014, including $100 million specifically earmarked for the SIS.Additionally, Senate Bill 360, passed by the Florida Legislature during the 2005 Legislativesession and signed into law on June 24, 2005, updated Florida’s growth managementframework and is intended to “Close the Gap” between new development and constructionof needed transportation infrastructure. The bill provides increased funding through newand existing capital investment programs including the SIS. As a result of this legislation,the Department of Transportation has identified $2.775 billion of new funding available forprogramming on the SIS over the Department’s work program timeframe (FY 2006 throughFY 2011).4.4 State Infrastructure BankThe SIB is a revolving loan and credit enhancement program consisting of two separateaccounts. The federally-funded SIB account is capitalized by federal money matched withstate money as required by law; the state-funded SIB account is capitalized by bondproceeds and state money only. The SIB can provide loans and other assistance to publicand private entities carrying out or proposing to carry out projects eligible for assistanceunder state and federal law. Highway and transit projects are eligible for SIB participation.SIB participation from the federally-funded SIB account is limited to projects that meet allfederal requirements pursuant to the Safe, Accountable, Flexible, and EfficientTransportation Equity Act: A Legacy for Users (SAFETEA-LU), and the applicable federalguidelines. SIB participation from the state-funded SIB account is limited to a transportationfacility project that is on the SHS, or that provides for increased mobility on the state'stransportation system in accordance with Section 339.55, Florida Statutes (FS), or providesfor intermodal connectivity with airports, seaports, rail facilities, transportation terminals,and other intermodal options for increased accessibility and movement of people, cargo,and freight. Projects of the TRIP are also eligible for the state-funded SIB, provided theproject is matched by a minimum of 25 percent from funds other than SIB. The SIB canleverage funds through loans and credit enhancement assistance to improve projectfeasibility. The SIB cannot provide assistance in the form of a grant. The amount of any loanor other assistance may be subordinated to other debt financing for a project with anTBG082810024135DFB/WPB31044333184.PDF/Final Report4-2
SECTION 4—FUNDING AVAILABILITYinvestment grade rating of "BBB" or higher. Loans from the SIB may bear interest at orbelow market interest rates, as determined by the FDOT.4.5 <strong>Transit</strong> Corridor ProgramThe <strong>Transit</strong> Corridor Program is authorized in Chapter 341, FS. Specific program guidelinesare provided in FDOT Procedure Topic Number 725-030-003. The <strong>Transit</strong> Corridor Programprovides funding to Community Transportation Coordinators or transit agencies to supportnew services within specific corridors when the services are designed and expected toreduce or alleviate congestion or remedy other mobility issues within the corridor. <strong>Transit</strong>Corridor funds are discretionary and are distributed based on documented need. <strong>Transit</strong>Corridor Program funds may be used for capital or operating expenses. Eligible projectsmust be identified in a TDP, Congestion Management System <strong>Plan</strong>, or other formal studyundertaken by a public agency. FDOT Central Office annually reviews all existing (i.e.,currently approved and operating as of the annual review) <strong>Transit</strong> Corridor projects andallocates to the respective FDOT district office sufficient funds to cover these ongoingprojects. First priority for funding under this program is for existing projects to meet theiradopted goals and objectives. Any remaining funds are allocated to each of the districts byformula, based on each district’s percentage of the total state urbanized population.Projects are funded at one-half the non-federal share. Projects that have regional orstatewide significance may receive funding at up to 100 percent. The classification of aproject as being either of regional or statewide significance is made by FDOT Central Office.4.6 Public <strong>Transit</strong> Block Grant ProgramThe Public <strong>Transit</strong> Block Grant Program was established by the Florida Legislature toprovide a stable source of funding for public transit. The specific program authority isprovided in Section 341.052, FS. Specific program guidelines are provided in FDOTProcedure Topic Number 725-030- 030. Funds are awarded by FDOT to those public transitproviders eligible to receive funding from the FTA’s Sections 5307 and 5311 programs andto Community Transportation Coordinators. The Department of Transportation distributes85 percent of the funds to FTA Section 5307 providers and to FTA Section 5311 providerswho are not Community Transportation Coordinators. The Florida Commission for theTBG082810024135DFB/WPB31044333184.PDF/Final Report4-3
SECTION 4—FUNDING AVAILABILITYTransportation Disadvantaged distributes 15 percent of the funds to CommunityTransportation Coordinators according to their own funding formula. Public <strong>Transit</strong> BlockGrant funds may be used for eligible capital and operating costs of providing public transitservice. Program funds may also be used for transit service development and transitcorridor projects. Public <strong>Transit</strong> Block Grant projects must be consistent with applicableapproved local government <strong>com</strong>prehensive plans. State participation is limited to 50 percentof the non-federal share of capital projects. Program funds may be used to pay up to50 percent of eligible operating costs, or an amount equal to the total revenue, excludingfarebox, charter, and advertising revenue, and federal funds received by the provider foroperating costs, whichever amount is less.4.7 Public <strong>Transit</strong> Service <strong>Development</strong> ProgramThe Public <strong>Transit</strong> Service <strong>Development</strong> Program was enacted by the Florida Legislature toprovide initial funding for special projects. The Public <strong>Transit</strong> Service <strong>Development</strong>Program is authorized in Chapter 341, FS. Specific program guidelines are provided inFDOT Procedure Topic Number 725-030-005. The program is selectively applied todetermine whether a new or innovative technique or measure can be used to improve orexpand public transit services. Service <strong>Development</strong> Projects specifically include projectsinvolving the use of new technologies; services, routes, or vehicle frequencies; the purchaseof special transportation services; and other such techniques for increasing service to theriding public. Projects involving the application of new technologies or methods forimproving operations, maintenance, and marketing in public transit systems are alsoeligible for Service <strong>Development</strong> Program funding. Service <strong>Development</strong> Projects aresubject to specified times of duration, but no more than 3 years. If determined to besuccessful, Service <strong>Development</strong> Projects must be continued by the public transit providerwithout additional Public <strong>Transit</strong> Service <strong>Development</strong> Program funds. Each FDOT districtoffice must develop a program of eligible Service <strong>Development</strong> projects and submit thatprogram of projects to the FDOT Central Office by the first working day of July each year.Implementation of those projects can begin on or after July 1 of the following fiscal year.Projects submitted for funding must be justified in the recipient’s TDP (or TDSP, ifapplicable).TBG082810024135DFB/WPB31044333184.PDF/Final Report4-4
SECTION 4—FUNDING AVAILABILITY4.8 Fuel TaxesTaxes imposed on motor and diesel fuel vary between counties within the State of Florida.There are three separate fuel taxes which counties have the option to levy. These taxes totalup to 12 cents on every net gallon of motor and diesel fuel sold within the county.4.8.1 One-Six Cents Local Option Fuel TaxOriginally called the Local Option Gas Tax until 1996, the 1-6 Cents Local Option Fuel Tax,or First Local Option, is a tax of 1 to 6 cents on every net gallon of motor and diesel fuel soldwithin the county. The tax is adopted through a majority vote of the county’s governingbody or voter approval in a countywide referendum. This tax is automatically imposed ondiesel fuel in all counties. The county distributes proceeds to municipalities according to aninterlocal agreement. The counties and cities are authorized to use the proceeds to fundnumerous projects, including public transportation capital and/or operating costs. MonroeCounty has adopted the maximum 6 cents per gallon and distributes 36.5 percent of theproceeds to the City of <strong>Key</strong> <strong>West</strong>.4.8.2 One-Five Cents Local Option Fuel TaxThe 1-5 Cents Local Option Fuel Tax, or Second Local Option, is in addition to the previous1-6 Cents Local Option in which the Legislature authorized an additional tax of 1 to 5 centson every net gallon of motor fuel sold within the county. Diesel fuel is not subject to this tax.The tax is adopted through a majority vote of the county’s governing body or voterapproval in a countywide referendum. The county distributes proceeds to municipalitiesaccording to an interlocal agreement. The counties and cities are authorized to use theproceeds for transportation expenditures needed to meet the requirements of the capitalimprovements element or an adopted <strong>com</strong>prehensive plan or for expenditures needed tomeet the immediate local transportation problems and for other transportation-relatedexpenditures critical for building <strong>com</strong>prehensive roadway networks by local governments.Only capital improvements on public transportation are eligible for funding using the 1-5Cents Local Option Fuel tax. Monroe County has not adopted the Second Local Option FuelTax.TBG082810024135DFB/WPB31044333184.PDF/Final Report4-5
SECTION 4—FUNDING AVAILABILITY4.8.3 Ninth-Cent Fuel TaxThe Ninth-Cent Fuel Tax is a tax of 1 cent on every net gallon of motor and diesel fuel soldwithin a county. The tax was first authorized in 1972 by §336.021, F.S. Diesel fuel was notadded to the tax until 1990. The most recent change to the tax came in 1993 when theLegislature removed a previous referendum requirement and stated that any county canimpose the tax by extraordinary vote of its board of <strong>com</strong>missioners. The county maydistribute tax proceeds to incorporated municipalities, but it is not required to do so.Among other authorized uses, the proceeds can go towards public transportation operationsand maintenance. The Ninth-cent Fuel Tax has not been enacted in Monroe County.4.9 Ad Valorem TaxAn ad valorem assessment is a tax on property for certain services. In Florida, certaincounties use dedicated ad valorem taxes to fund public transportation as part of a transitauthority (for example, Hillsborough and Pinellas). Other counties fund publictransportation through a County general fund that is <strong>com</strong>posed largely of revenues from advalorem tax revenue. While local governments are constitutionally limited to ten mills($1 per $1,000 of property value) for operating purposes, local voters may authorizeadditional mills for other purposes by referendum.4.10 Local Discretionary Sales Surtaxes (Local Option SalesTaxes)There are two types of sales taxes that can be used to fund transit.4.10.1 Charter County <strong>Transit</strong> System SurtaxThe Charter County <strong>Transit</strong> System Surtax was first authorized in 1976 by §212.055(1) F.S. asa means to aid in funding the Dade Area Rapid <strong>Transit</strong> (DART) system. The sales surtaxmay be levied at a rate of up to one percent by charter counties that adopted a charter priorto January 1, 1984, as well as by a county government that consolidates with one or moremunicipalities. For charter counties, the tax must be approved by a majority vote of thecounty’s governing body. For consolidated governments, the tax is subject to voter approvalin a countywide referendum. The proceeds shall be placed in a county trust fund orprovided by the county’s governing body to an expressway or transportation authority.Generally, the proceeds may be used for the planning, development, construction,TBG082810024135DFB/WPB31044333184.PDF/Final Report4-6
SECTION 4—FUNDING AVAILABILITYoperation, and maintenance of fixed guideway rapid transit systems, bus systems, roads,and bridges. The eligible counties include: Broward, Duval, Hillsborough, Miami- Dade,Pinellas, Sarasota, and Volusia. The tax is currently levied in Duval and Miami-Dade at0.5 percent. While not currently available in Monroe County, the legislature could choose toexpand the scope of this law to include counties such as Monroe County.4.10.2 Local Government Infrastructure SurtaxA Local Government Infrastructure Surtax may be levied at the rate of 0.5 or 1 percentpursuant to an ordinance enacted by a majority vote of the County’s governing body andapproved by voters in a countywide referendum. Generally, the proceeds must be used tofinance, plan, and construct infrastructure; to acquire land for public recreation orconservation or natural resources; or to finance the closure of local government-owned solidwaste landfills that are already closed or are required to close. Infrastructure is defined asany fixed capital expenditure or fixed capital outlay associated with the construction,reconstruction, or improvement of public facilities which have a life expectancy of 5 or moreyears and any related land acquisition, land improvement, design, and engineering costs.Proceeds shall be distributed to the county and its associated municipalities according to aninterlocal agreement, and cannot be used to fund the operational expenditures ofinfrastructure. Up to 15 percent of the proceeds may be allocated for the purpose of fundingcounty economic development projects of a general public purpose targeted to improvelocal economies, including the funding of operational costs and incentives related toeconomic development. The referendum ballot must state this intention in order to have avalid use of the proceeds. All counties are eligible to levy this surtax.4.11 Impact FeesAn impact fee is a one-time fee against new development which covers capital expansionconsumed by the new development. The fee is not a tax, as it is a condition for improvingproperty. Currently, Monroe County does not have a Transportation Impact Fee. There areno example applications in Florida regarding the use of impact fees to fund public transit,but initiatives are being undertaken in other parts of the country. In San Francisco, forexample, impact fees from new downtown office construction are helping fund peak-hourtransit services in the area.TBG082810024135DFB/WPB31044333184.PDF/Final Report4-7
SECTION 4—FUNDING AVAILABILITY4.12 Tourist <strong>Development</strong> TaxMonroe County has a five (5) percent Tourist <strong>Development</strong> tax applied to any person(business) who rents or leases any transient ac<strong>com</strong>modations for a period of 6 months orless. This tax applies to hotels, motels, apartment buildings, single or multifamily dwellings,mobile home parks, condominiums, and cottages.Past State Attorney opinion is that this tax can be used for the following:1. To acquire, construct, extend, enlarge, remodel, repair, improve, maintain, operate, orpromote one or more publicly owned and operated convention centers, sports stadiums,sports arenas, coliseums, or auditoriums within the boundaries of the county ;2. To promote and advertise tourism in the State of Florida and nationally andinternationally;)3. To fund convention bureaus, tourist bureaus, tourist information centers, and newsbureaus as county agencies or by contract with the chambers of <strong>com</strong>merce or similarassociations in the county; or4. To finance beach improvement, maintenance, renourishment, restoration, and erosioncontrol, including shoreline protection, enhancement, cleanup, or restoration of inlandlakes and rivers to which there is public access."Therefore it is assumed that these funds are not available for transit, contrary to opinion inpast TDPs.TBG082810024135DFB/WPB31044333184.PDF/Final Report4-8
This section presents the <strong>Transit</strong> Goals and Objectives for the next 10 years. The sectionbegins with a review and assessment of goals, objectives, and strategies adopted in the 2005TDP. This review and assessment provides an indication of the extent to which goals andobjectives have been achieved, as well as the status of the implementation of strategies.Performance standards are also re<strong>com</strong>mended to assist in monitoring the extent to whichgoals and objectives are achieved over the next 10 years.5.1 KWDoT Mission and Vision StatementsThe goals and objectives are based on KWDoT’s public transportation mission statement.KWDoT’s current mission and vision statements are as follows:KWDoT’s Mission StatementTo provide a safe and reliable public transportation service that is efficient, effective andenvironmentally sensitive.KWDoT’s Vision StatementA tropical island with unique <strong>com</strong>munity character in harmony with the diversity of itspeople and with its environment.5.2 Assessment of Goals, Objectives, and Strategies (FY 2005 –FY 2009)Goal 1: Provide safe, secure <strong>com</strong>fortable public transit option to the public.To maintain ridership and have the ability to increase the potential pool of discretionary(choice) transit users, transit systems must provide amenities which increase riders’ ease ofutilizing the system as well as their level of <strong>com</strong>fort. These amenities include bus sheltersand benches, information kiosks and <strong>com</strong>munity outreach/education programs. Another<strong>com</strong>ponent of this goal involves continuing marketing efforts to increase the visibility of the<strong>Key</strong> <strong>West</strong> <strong>Transit</strong> System. Additional <strong>com</strong>munity awareness of the services available may beable to foster a significant increase in ridership.TBG082810024135DFB/WPB31044333184.PDF/Final Report5-1
SECTION 5—TRANSIT GOALS AND OBJECTIVESTo better serve the tourism industry in <strong>Key</strong> <strong>West</strong>, the transit system should explore theestablishment of operational schedules rather than published route timetables. This wouldbest coincide with a significant increase in frequency for the current system. If all routes hadfrequencies of 15 or 20 minutes, printed schedules would not be necessary, as all bus stopssigns would read, “Bus arrives every 15 (or 20) minutes.” Based on traffic conditions andcongestion, established routes may require 3 buses for a 20 minute frequency in November,while in March, a peak tourist period, the same route may require 6 buses to provide the20 minute frequency. Also, alternative fuel vehicles are still an improving technology andshould be followed for possible use in the system. It can be a more pleasant experience forthe riding public and also addresses issues of environmental pollution.Assessment: <strong>Key</strong> <strong>West</strong> <strong>Transit</strong> has ac<strong>com</strong>plished this goal by installing a Real TimePassenger Information System (RTPIS) that provides internet access as well as voiceresponse and text messaging options to the public at any time and from any location. Thisnew technology should prove to be a great tool as it relates to marketing of the system andpublic information / public outreach.The frequencies were achieved with 20 minute intervals under the 6 route system - excepton Sundays and holidays.Goal 2: Provide service options to help reduce vehicular traffic and congestion in <strong>Key</strong><strong>West</strong>.<strong>Key</strong> <strong>West</strong> experiences traffic congestion in the morning and afternoon peak periods. Muchof this congestion is attributed to workers who must drive in to <strong>Key</strong> <strong>West</strong> from the homes inthe Lower and Middle <strong>Key</strong>s. The high cost of living in the City of <strong>Key</strong> <strong>West</strong> causes manyworkers to live in places north of the City. Establishing partnerships which can lead to jointtransportation ventures would play a major role in alleviating the City’s considerable trafficcongestion issues. Providing park and ride facilities in the Middle/ Lower <strong>Key</strong>s with serviceto the City would also work towards achieving this goal.Exploring contracting opportunities with private sector transportation services could assistin the delivery of later evening service, intensive levels of service during major tourismevents, and even with employer transportation services – providing opportunities tocontract with City employers to provide transit service to their homes in the lower/ middleTBG082810024135DFB/WPB31044333184.PDF/Final Report5-2
SECTION 5—TRANSIT GOALS AND OBJECTIVESkeys. To further increase use of transit in the City of <strong>Key</strong> <strong>West</strong>, an increase in frequency to15 to 30 minutes would greatly benefit the riding public. To address this, additional busesshould be purchased and added into service.Assessment: There are several new carpool and vanpool efforts available in <strong>Key</strong> <strong>West</strong> andMonroe County, which operate in conjunction with the Green Living Energy and EducationExtension Office located in <strong>Key</strong> <strong>West</strong>, Florida, and as a part of the extension services offeredby the University of Florida.The city did succeed in starting a Job Access Reverse Commute bus service by expandingservices between <strong>Key</strong> <strong>West</strong> and Marathon, daily, connecting the Lower Florida <strong>Key</strong>s withthe City of <strong>Key</strong> <strong>West</strong> - and with a <strong>com</strong>mute service provided by Miami-Dade <strong>Transit</strong>between Florida City and Marathon, also 7 / days per week. This creates a regionalconnection for public transportation in the Florida <strong>Key</strong>s.Goal 3: Secure long term funding assistance for public transit system.This goal emphasizes the long-term financial feasibility of the <strong>Key</strong> <strong>West</strong> <strong>Transit</strong> System.Securing a dedicated funding source and developing programs to boost revenue areimportant activities that need to be addressed for the long-term health of the transit system.Possible long term funding sources include gas taxes, property tax assessments, dedicating aportion of local sales tax, and tourist (hotel) taxes. Opportunities to forge public/privatepartnerships as well as contracting activities may also boost the long term health of thetransit system. Also investigate working with the Monroe County and neighboringjurisdictions in the provision of service, especially when working to implement the Lower<strong>Key</strong>s Shuttle service.Assessment: While the City did pay for and receive a thorough Dedicated FundingFeasibility Study with many re<strong>com</strong>mendations on course of action to select for futurefunding requirements - no action or direction has been developed to follow thoseopportunities through to fruition.Goal 4: Provide transit service emphasizing intermodal connections.<strong>Key</strong> <strong>West</strong> <strong>Transit</strong> should coordinate closely with both the cruise ship industry/ferry serviceand airport to provide connecting services to those tourists arriving via these methods.TBG082810024135DFB/WPB31044333184.PDF/Final Report5-3
SECTION 5—TRANSIT GOALS AND OBJECTIVESSeamless transportation connections can dramatically boost ridership at the same timeeliminating the need for tourist to choose taxi service, car rental service and even bike andmoped service. A key <strong>com</strong>ponent in providing this seamless service would be closecoordination with the transportation providers in adapting the transit bus schedules andservices. Providing transit 39 services within 10 to 15 minutes of arrival at these facilitieswould provide a tremendous service to arriving tourists.Providing cruise/ferry facilities, the airport and all highly visited tourist locations (hotels,points of interest) access to current transit marketing materials is critical in making touristsaware of the services available in the City of <strong>Key</strong> <strong>West</strong>. Working with the Chamber ofCommerce can help the transit agency ensure marketing materials are located in and aroundthe high traffic tourist locations.Assessment: The details outlined in this goal were not achieved - mainly due to budgetaryrestrictions of having more than 6 routes in service on any given day. While the generalpublic mentality is such that most people believe a small island such as <strong>Key</strong> <strong>West</strong> shouldafford us easy opportunity to have bus service with fairly quick turnaround times - that isnot the case due to the limited road structure. Buses are subject to traffic influxes, detoursand other road related issues that do not make it possible to provide 15 minute or lessheadway time with a 6 route system. The city would require 8 bus routes minimum per dayin order to achieve the goal outlined above.Goal 5: Implement innovative solutions to solve congestion and funding issues.<strong>Key</strong> <strong>West</strong> <strong>Transit</strong> now offers unlimited ride passes for daily, weekly and monthly travel ofthe system. Consideration of a fare reduction to $0.50 may further attract ridership.Emphasis should be provided on increasing the number of outlets where these passes can bepurchased, in addition to the bus driver where it currently occurs. Also, marketing the 31-day passes to employers for employee use can increase the revenue received by the farebox.To further address funding issues, staff should study options for alternate funding sources.Also, it is important for <strong>Key</strong> <strong>West</strong> <strong>Transit</strong> to review the actual running times of service toensure customer satisfaction. Staff should seek ways to conduct time checks on all routes atleast on a quarterly basis. Changing congestion conditions can affect the delivery ofscheduled service.TBG082810024135DFB/WPB31044333184.PDF/Final Report5-4
SECTION 5—TRANSIT GOALS AND OBJECTIVESAssessment: There has been some improvement in this area due to our continued effort toprovide passenger information via advertising and marketing as well as free public serviceannouncements when available to us, on the radio, print media and television insofar asadvertising spots with a focus on the customer being prepared to board the bus, exit fromthe rear door - all of the "time saving" techniques that are typically inclusive as a beststandards practice.5.3 Re<strong>com</strong>mended Goals and ObjectivesBased on the assessment of the FY 2005 – FY 2009 goals and objectives, as well as thefeedback received from the public involvement activities and KWDoT staff, there<strong>com</strong>mended goals and objectives are provided as follows:Goal 1. Increase Frequencies on the Fixed-Route SystemHistorically, KWT routes have operated with one-hour frequencies which mean that there isone bus per hour at any given stop along a route. Frequencies of 35 minutes are achieved byhaving routes that mirror one another with the exception of serving the airport and portionsof the New Town area. Because the size of the <strong>Key</strong> <strong>West</strong> service area (<strong>Key</strong> <strong>West</strong> and StockIsland) is significantly smaller than the service areas of all other Florida transit systems, it ishighly feasible that frequencies can be reduced significantly through the dedication ofadditional resources and buses.Objective 1-1. As funding allows, determine how increased frequencies can be ac<strong>com</strong>plishedfrom operational improvements and refined running times.Strategy 1-1 Determine how frequencies could be increased by reducing the current numberof routes (6 to 4) but increasing their frequency with the current available fleet.Strategy 1-2. Determine how frequencies could be increased to 30 minutes through thepurchase and addition of buses to a realigned route network.Goal 2. Establish Operational/Seasonal SchedulesObjective 2-1. Establish operational and seasonal schedules as a means of meeting customerdemand in a way that is invisible to the riding public.TBG082810024135DFB/WPB31044333184.PDF/Final Report5-5
SECTION 5—TRANSIT GOALS AND OBJECTIVESStrategy 2-1. Implement an ongoing service planning process. In this process, route runningtimes would be checked on a periodic basis to detect changing user conditions. This wouldinclude a.m. and p.m. peak hours, mid-day, and evening during the tourist and off-touristseasons. The existing Synchromatics software could be used to assist in this process.Goal 3. Promote Employer-Provided SubsidiesObjective 3-1. The Transportation Commute Benefit Program is a provision of the InternalRevenue Code, Section 132(f), which permits employers to subsidize their employees' cost of<strong>com</strong>muting to work, by transit and vanpools, up to $110 per month. These expenses are taxdeductible to the employer and cost the employer less than providing the same amount ingross in<strong>com</strong>e.Strategy 3-1. Educate employers so they can take advantage of the provision in the tax codethat allows employees to use pre-tax in<strong>com</strong>e dollars to pay for qualified fringe benefits suchas transit passes, vanpool fares, and qualified parking.Strategy 3-2. Educate employees so they take home more of their paycheck by utilizingtransit.Goal 4. Add More Buses in Daily Service:Objective 4-1. As budget constraints are decreased, additional resources (i.e., buses andoperators) could be added to the existing service to reduce the current headways andprovide additional capacity for new customers.Strategy 4-1. It is re<strong>com</strong>mended that additional service be considered on a yearly basis asrevenue stream increases.Goal 5. Bus Replacement Program:Objective 5-1. The current bus fleet has nine (9) mid-life vehicles that range in mileage from230,000 to 315,000 miles. Based on the rate of current usage of 45,000 miles per year the500,000 mile service life will be reached in approximately 5 years. The Department shouldevaluate a phased replacement schedule of a total cost of $6.0 million for the eventualreplacement of these vehicles.TBG082810024135DFB/WPB31044333184.PDF/Final Report5-6
SECTION 5—TRANSIT GOALS AND OBJECTIVESStrategy 5-1. Rotate the usage of these vehicles to balance the mileage since some of theolder vehicles have dramatically less usage than the newer vehicles by as much as50 percent.Strategy 5-2. Develop a phased bus replacement implementation program.Goal 6. Coordinate with the Monroe County <strong>Plan</strong>ning Department:Objective 6-1. KWDoT through close coordination with Monroe County’s <strong>Plan</strong>ningDepartment should be recognized as a viable asset not only to the City but to the County asa whole.Strategy 6-1. The KWDoT should request that the Monroe County CIP section under “Mass<strong>Transit</strong>” recognize the <strong>Key</strong> <strong>West</strong> <strong>Transit</strong> and the Lower <strong>Key</strong>s shuttle as a viable transitsystem.Strategy 6-2. The <strong>Key</strong> <strong>West</strong> City Commission should encourage the identity of the transitsystem by the County as a contributing asset to Monroe County and should work with theCity in promoting it use.Objective 6-2. After the <strong>2010</strong> census, work with both Monroe County and City planners toupdate the current land use data for implementation for future transit modeling updates.Strategy 6-3. The <strong>Key</strong> <strong>West</strong> City Commission should encourage the County to considerutilizing some County Surface Transportation Program funding to support KWDoT transitenhancements such as marketing, development of passenger amenities and transit facilities.Goal 7. Continue to explore the use of local funding:Objective 7-1. Local funding should be explored further to directly support public transitservices available to the general public.Strategy 7-1. Identify and meet on a quarterly basis with potential local funding agencies.This would allow for the expansion and improvement of transit services and could beleveraged to qualify for additional state and federal grants.TBG082810024135DFB/WPB31044333184.PDF/Final Report5-7
SECTION 5—TRANSIT GOALS AND OBJECTIVESGoal 8. New Administrative and Operations Facility:Objective 8-1. Accelerate the design and construction of a new administrative andoperations facility for KWDoT.Strategy 7-1. Since the design and construction of this facility has been funded, the cityshould immediately develop a procurement schedule that accelerates the construction ofthis facility.Goal 9. Maintenance, Miscellaneous and Passenger Amenity Items:Objective 9-1. Apply for Federal Grants for major maintenance equipment and toolsrequired to maintain the federally financed buses. Other miscellaneous items, such asmoney counting equipment, bus shelters and benches, and bus signs, are also eligible forcapital grant assistance.Strategy 9-1. Program these purchases in the TDP so they are eligible. Although thesepurchases may occur sporadically throughout the TDP period FTA Section 5311 funds areprogrammed annually. (2009 through 2018)Goal 10. Examination of Community Service and Special Event Policies:Special consideration should be given to the financial equity of the services offered and anyadverse impacts these services have on regular services due to the additional cost structure.Objective 10-1. KWDoT should continue to monitor the number and type of special eventtransportation services it provides.Strategy 10-1. KWDoT should promote more private–public partnership sponsorships withthe food, beverage and entertainment industries as long as they continue to be profitable.Goal 11. Maintain Efforts to Develop a Unified Public Image and Marketing Approach:Objective 11-1. Develop a positive, unified public image of KWDoT transit.Strategy 11-1. Develop a unified marketing theme to promote awareness of transit thusincreasing ridership.Strategy 11-2. Track the results of marketing efforts for effectiveness.TBG082810024135DFB/WPB31044333184.PDF/Final Report5-8
SECTION 5—TRANSIT GOALS AND OBJECTIVESStrategy 11-3. Develop marketing budgets that are <strong>com</strong>parable to other transit agenciesbased on size and service area.Goal 12. Develop a Community Outreach and Education Program:Objective 12-1. KWDoT transit should expand its <strong>com</strong>munity outreach programs to providean understanding of the specific services offered and their benefits to the <strong>com</strong>munity.Strategy 12-1. It is re<strong>com</strong>mended that a formal Community Outreach Program beestablished and continued throughout the TDP planning horizon.Strategy 12-2. Provide e-mails “blasts” to interested public and private entities of updates toservice or other important information.Strategy 12-3. Develop and conduct quarterly “results oriented” user group meetings thatdiscusses service feedback as well as operator implementation strategies.Goal 13. Promote Additional Commuter Assistance Programs:Due to the limited resources available for public transportation services, KWDoT shouldwork with the local members of the <strong>Key</strong> <strong>West</strong> Chamber of Commerce to provideinformation to their members to assist in organizing ride share programsObjective 13-1. To promote employer supplied carpool and vanpool services in order toimprove bus ridership and promote mobility.Strategy 13-1. The focus of these efforts should be on major employers located in the cityand on Stock Island. Opportunities to partner with business owners for this provision ofshared use could result in a “win-win” for both public and private sectors.Strategy 13-2. Inform employers that their available pool of potential employees could reachout beyond the current walking or cycling distances to their place of employment.Goal 14. Encourage Training Opportunities for Fleet Maintenance Employees:Objective 14-1 KWDoT should provide employee training to their fleet maintenancepersonnel to expand their capabilities.TBG082810024135DFB/WPB31044333184.PDF/Final Report5-9
SECTION 5—TRANSIT GOALS AND OBJECTIVESStrategy 14-1. The future expanded maintenance facility will offer more opportunity toprovide a full service repair facility for the bus fleet. By better training, services that aresubcontracted out can be done in-house at a reduced cost.TBG082810024135DFB/WPB31044333184.PDF/Final Report5-10
SECTION 6—TRANSIT ALTERNATIVES EVALUATIONIn this section, the procedure for developing and evaluating the alternatives is provided. Analternative can be an improvement to the transit system such as the implementation of anew route or service improvements. It can also be administrative in nature such asimproving marketing, training or staff enhancements. After identifying the alternatives,each are evaluated to prioritize their need. The purpose of this section is to identify localtransit alternatives to guide transit planning through the Year 2019 in the City of <strong>Key</strong> <strong>West</strong>and Stock Island planning area. As the demographics and most importantly the touristdemand have decreased, the growth of the KWDoT has also been affected. The path to moveforward will require long-term <strong>com</strong>mitment, <strong>com</strong>munity support, and proactiveimplementation strategies in order to maintain the current service as well as allow for thereverse trend if such occurs.Evaluation criteria and methods for <strong>com</strong>paring alternatives are discussed before the variousservice alternatives are mapped and described. The alternatives have been designed toaddress identified needs consistent with <strong>com</strong>munity goals and objectives.6.1 <strong>Development</strong> of Alternatives<strong>Transit</strong> alternatives for KWDoT were developed through the methods that are describedbelow.• Public involvement - Public workshops and user surveys were held in order to gathertheir input in the alternatives analysis selection. It was evident from the public inputthat shorter headways were the number one suggestion for improvements.• Transportation surveys - Surveys were conducted as part of the TDP process to obtainadditional input from the users of the transit system. Multiple surveys were conductedthat targeted bus passengers. A second survey was conducted that surveyed bus drivers,and staff that conducted operation and maintenance of the vehicles. The results of thesurveys are provided in Sections 3.4 through 3.6.TBG082810024135DFB/WPB31044333184.PDF/Final Report6-1
SECTION 6—TRANSIT ALTERNATIVES EVALUATION• Discussions with KWDoT staff - Numerous discussions took place over the past severalmonths with the KWDoT administration staff. These discussions provided insight intothe operations of KWDoT, as well as a local understanding of <strong>Key</strong> <strong>West</strong> Citygovernment.• The Lower <strong>Key</strong>s Shuttle (Aqua Route) was not part of the modeling alternatives analysissince it is essentially a single road route system (US 1) and provides little benefit with amodeling analysis. The “Lower <strong>Key</strong>s Shuttle Bus Route <strong>Development</strong> and OperationalAnalysis” in Appendix “A” can be used as a reference document that describes thecurrent route and stop configuration studied in the shuttle service. Since this report nonew demographic is available.6.2 Evaluation MethodologyThe most recently available socioeconomic data for the City of <strong>Key</strong> <strong>West</strong> is the pre-loadedUS Census 2000 for population and the Info USA data for employment. These data inputswere utilized for the TBEST analysis. For the years between 2000 and 2009, population andemployment were escalated at a rate of 1% annually as this is the lowest growth ratepermissible in the TBEST program. The City anticipated City of <strong>Key</strong> <strong>West</strong> has endurednegative growth over the past five years. For the years between, <strong>2010</strong> and 2020, a 2% growthrate was utilized to be conservative. These adjustments were made within TBEST. Theridership was calibrated based upon these assumptions.Over the past several years, the Public <strong>Transit</strong> Office of the Florida Department ofTransportation has been spearheading the development of transit demand forecastingmodels and transit systems planning tools for a wide variety of applications as part of itsbroader <strong>Transit</strong> Model Improvement Program. Quite often, transit agencies do not have theresources and staff to implement large-scale travel demand modeling systems or collect andassemble the elaborate databases needed to support such model systems. The modeldevelopment efforts of the FDOT Public <strong>Transit</strong> Office have been focused on meeting thetransit planning and modeling needs of a wide variety of planning agencies through thedevelopment of user-friendly tools that can be implemented in a wide variety of planningcontexts. TBEST represents a culminating effort towards developing a truly operational andTBG082810024135DFB/WPB31044333184.PDF/Final Report6-2
SECTION 6—TRANSIT ALTERNATIVES EVALUATIONuser-friendly stop-level ridership forecasting software package that offers full GIS-basedfunctionality and network coding capability.The software includes a host of methodological developments that make it a very powerfultransit planning and analysis package. TBEST (<strong>Transit</strong> Boarding’s Estimation andSimulation Tool) is capable of simulating travel demand at the individual stop-level whileaccounting for network connectivity, spatial and temporal accessibility, time-of-dayvariations, and route/stop <strong>com</strong>petition and <strong>com</strong>plementaries, thus making it the ideal toolfor transit planning and ridership forecasting. Public transit’s distinctive characteristic is itshigh dependence on users walking to access the system. Thus, transit's appeal is highlydependent on the ability to access activities by walking to and from transit. Capturing thisimportant characteristic requires databases and software capabilities to be able to capturesmall geographic scale differences in accessibility. This capability within TBEST gives it adistinctive advantage over more traditional roadway based travel demand forecast models.TBEST has been developed so that the user can interface with the software largely throughan interface that provides full GIS functionality. Users have are required to have Arc View9.2 residing locally on the machine to use TBEST. A modest investment in Arc View willallow the user to realize the full potential of TBEST. Socio-economic scenarios, supplyattributes, and route and stop configurations can be changed and edited instantly, thusmaking TBEST a truly user-friendly transit ridership forecasting tool. TBEST includesestimates of several performance measures in its output. Performance measures such asroute miles, service miles, service hours, boardings per service mile or hour, and averageboardings per service run are provided by TBEST at the individual route-level and for thesystem as a whole. These performance measures can be used to assess the impacts ofvarious socio-economic and supply scenarios on system performance.Ridership estimates provided by TBEST are sensitive to a host of planning factors includingsocio-economic characteristics, network configuration and connectivity, and transit systemattributes. TBEST ridership estimates are sensitive to population characteristics such asin<strong>com</strong>e, auto ownership, household size, number of children, number of elderly,race/ethnic <strong>com</strong>position, and number of workers. Employment variables in the TBESTequations include <strong>com</strong>mercial, industrial, and service employment (consistent withTBG082810024135DFB/WPB31044333184.PDF/Final Report6-3
SECTION 6—TRANSIT ALTERNATIVES EVALUATIONdefinitions used in FSUTMS). <strong>Transit</strong> system attributes that affect ridership includeboarding fare, transfer fare, travel time, frequency/headway, special generator type (e.g.,shopping mall, stadium, university, etc.), number of transfers, out-of-vehicle time includingboth access/egress time and waiting time, route type (e.g., crosstown, express, local,circulator, etc.), and technology type (e.g., BRT, bus, trolley, etc.).TBG082810024135DFB/WPB31044333184.PDF/Final Report6-4
SECTION 6—TRANSIT ALTERNATIVES EVALUATION6.3 Selection of Alternatives to be ModeledThe possible scenarios of alternatives that were considered include the following:Maintain all existing routes – These first alternatives involves maintaining the six existingroutes and studying the current reduced service of four routes.Additional Infrastructure – The next alternative involves the addition of moreinfrastructure to support the bus system. Infrastructure would include additional passengeramenities such as shelters and benches. It also would include bus stop signs, informationdisplays, and other forms of signage. This has resulted in the addition of 60 bike racks andbenches included in the 10 year capital improvement budget.Increase Frequency (Existing Routes) – Under this alternative, frequency would be doubledfor all existing routes which operates on approximately 60-minute plus headways. Thisalternative would decrease headways to 30-45 minutes on all routes.6.4 Existing <strong>Transit</strong> ServicesIn 2008, <strong>Key</strong> <strong>West</strong> bus service included fixed route bus service with six (6) bus routes and37 stop locations. The service provided an 18 hours span of service from 5:30 A.M. until11:30 P.M. The six routes included the following routes:1. Blue,2. Green,3. Red,4. Gold,5. Purple, and6. Orange.Recently, service cuts were made due to budget considerations. In November 2009, two ofthe six routes were eliminated and portions of the Purple and Gold routes were <strong>com</strong>binedwith other routes. The Blue and Green routes retained their previous alignments and stoplocations. However, the alignment and bus stops changed for the Red and Orange routes.The former Red and Gold routes were <strong>com</strong>bined to create a modified Red route and theformer Orange and Purple routes were <strong>com</strong>bined to create a modified Orange route.TBG082810024135DFB/WPB31044333184.PDF/Final Report6-5
SECTION 6—TRANSIT ALTERNATIVES EVALUATIONIn the description of the alternatives sections below, the fixed route bus service alignmentsand stop locations are described. As described in detail there are two basic alternatives thatwere evaluated. The first alternative would include the existing four (4) routes with higherservice frequency. This alternative would reduce the time that passengers would wait at abus stop for the next bus by half. The second alternative would include all of the six (6) busroutes operated through October 2009 with increased service frequency – cutting theheadways by half. Below, Table 6-1 highlights the peak and non-peak hour headways forfixed route bus service in <strong>Key</strong> <strong>West</strong> and Stock Island in 2009.TABLE 6-12009 Fixed Route Bus Service – Peak and Off-Peak HeadwaysBlue Green Red OrangePeak1 hour and 18minutes1 hour and 24minutes1 hour and 12minutes1 hour and 13minutesOff-Peak1 hour and 33minutes1 hour and 39minutes1 hour and 27minutes1 hour and 28minutes6.4.1 Proposed AlternativesAlternative #1This proposed improvement would enhance the four (4) existing routes. Headways for thesefixed route services would be reduced by half from roughly 1½ hours to 45 minutes betweenbuses. This alternative would reduce the time that passengers would wait at a bus stop forthe next bus. The four routes and stops as operated today would not change – only thefrequency of the service. The span of service and stop locations would not change either.The proposed alternative could be implemented in <strong>2010</strong> depending on budget constraintsand continue through 2020. Below, a turn by turn description of each of the routes as well astheir stop locations is provided. The Alternative #1 bus routes and stops are presented in thefollowing order: Blue, Green, Red, and Orange.A. Blue Fixed Route Bus ServiceAs illustrated on Figure 6-1, the Blue route follows a clockwise route around the perimeterroads of the islands of <strong>Key</strong> <strong>West</strong> and nearby Stock Island. The Blue route has a total of20 bus stops with 16 bus stops located on the island of <strong>Key</strong> <strong>West</strong> and 4 bus stops located onStock Island. The bus operates on North Roosevelt Boulevard and makes stops at theTBG082810024135DFB/WPB31044333184.PDF/Final Report6-6
SECTION 6—TRANSIT ALTERNATIVES EVALUATIONOverseas Market, <strong>Key</strong> Plaza, Senior Center, Searstown/Publix Shopping Center, and theRadisson Hotel located at the northeastern point of <strong>Key</strong> <strong>West</strong>. The Blue route follows theOverseas Highway (U.S. 1) across a bridge to Stock Island and makes a left-turn ontoCollege Road.FIGURE 6-1Blue and Green Bus LinesThe bus follows College Road and makes a stop at the Lower <strong>Key</strong>s Medical Center. Afterleaving the Lower <strong>Key</strong>s Medical Center, the bus follows College Road back to the OverseasHighway (U.S. 1), makes a right-turn onto the Overseas Highway (U.S. 1), left-turn onto2 nd Street, left-turn onto Maloney Avenue, right-turn onto 4th Avenue (4th Avenue be<strong>com</strong>es5th Avenue after a slight right-turn), a right-turn onto Cross Street, and a left-turn onto theOverseas Highway (U.S. 1). The bus crosses back over the bridge to <strong>Key</strong> <strong>West</strong>, makes a leftturnonto South Roosevelt Boulevard, right-turn onto Bertha Avenue, left-turn onto FlaglerAvenue, right-turn onto Reynolds Street, left-turn onto South Street, right-turn ontoSimonton Street, left-turn onto Truman Avenue, left-turn onto Thomas Street, right-turnonto Virginia Street, right-turn onto Emma Street, right-turn onto Angela Street, left-turnTBG082810024135DFB/WPB31044333184.PDF/Final Report6-7
SECTION 6—TRANSIT ALTERNATIVES EVALUATIONonto Whitehead Street, right-turn onto Caroline Street, right-turn onto Grinnell Street, leftturnonto Eaton Street, and right-turn onto White Street before the route ends at theintersection of Truman Avenue and White Street. The following bus stops are located on theBlue route.<strong>Key</strong> <strong>West</strong> - Northern PathTruman Avenue/White StreetNorth Roosevelt Boulevard/4th StreetOverseas Market<strong>Key</strong> PlazaSenior CenterSearstown/Publix Shopping CenterNorth Roosevelt/Radisson HotelStock IslandLower <strong>Key</strong>s Medical CenterMaloney Avenue/2nd Street5th Avenue/5th StreetU.S. 1/Cross Street<strong>Key</strong> <strong>West</strong> - Southern PathDuck Avenue/South Roosevelt BoulevardOceanwalk Condos<strong>Key</strong> <strong>West</strong> International Airport/BeachesFlagler Avenue/Bertha AvenueFlagler Avenue/White StreetSouth Street/Simonton StreetEmma Street/Petronia StreetCaroline Street/Whitehead StreetGrinnell Street/Caroline StreetTruman Avenue/White StreetTBG082810024135DFB/WPB31044333184.PDF/Final Report6-8
SECTION 6—TRANSIT ALTERNATIVES EVALUATIONB. Green Fixed Route Bus ServiceThe second fixed route bus service included in Alternative #1 is the Green route which isalso illustrated on Figure 6-1. The Green route runs counterclockwise and shares bus stopswith the Blue route. The Green route has 19 bus stops with 15 located on the island of <strong>Key</strong><strong>West</strong> and 4 located on nearby Stock Island. The Green route starts at the intersection ofGrinnell Street and Caroline Street. The bus continues on Caroline Street, and makes a leftturnonto Whitehead Street, right-turn onto Petronia Street, right-turn onto Emma Street,left-turn onto Amelia Street, right-turn onto Whitehead Street, left-turn onto United Street,right-turn onto Simonton Street, left-turn onto South Street, right-turn onto Reynolds Street,left-turn onto Flagler Avenue, right-turn onto Bertha Avenue, and slight left onto SouthRoosevelt Boulevard in <strong>Key</strong> <strong>West</strong>. The bus crosses a bridge on the Overseas Highway (U.S.1) to Stock Island and makes a right-turn onto Cross Street, left-turn onto 5th Avenue, slightleft-turn onto 4th Avenue, left-turn onto Maloney Avenue, right-turn onto 2nd Street, rightturnonto Overseas Highway (U.S. 1), left-turn onto College Road, right-turn onto OverseasHighway (U.S. 1), and cross over the bridge back into <strong>Key</strong> <strong>West</strong>. The bus makes a left-turnonto South Roosevelt Boulevard, right-turn onto Duck Avenue, right-turn onto 14th Street,right-turn onto Northside Drive, right-turn onto Kennedy Drive, left-turn onto NorthRoosevelt Boulevard (which turns into Truman Avenue), right-turn onto White Street, leftturnonto Eaton Avenue, right-turn onto Grinnell Street, and left-turn onto Caroline Street.Unlike the Blue route, once the Green route crosses back over into <strong>Key</strong> <strong>West</strong>, the bus makesa second stop at the intersection of South Roosevelt Boulevard and Duck Avenue andcontinues onto Duck Avenue to the intersection of Duck Avenue and 14th Street. Thefollowing bus stops are located on the Green route.<strong>Key</strong> <strong>West</strong>Grinnell Street/Caroline StreetCaroline Street/Duval StreetEmma Street/Petronia StreetSouth Street/Simonton StreetFlagler Avenue/White StreetFlagler Avenue/Bertha AvenueTBG082810024135DFB/WPB31044333184.PDF/Final Report6-9
SECTION 6—TRANSIT ALTERNATIVES EVALUATION<strong>Key</strong> <strong>West</strong> International Airport/BeachesOceanwalk CondosDuck Avenue/South Roosevelt BoulevardStock IslandU.S. 1/Cross Street5th Avenue/5th StreetMaloney Avenue/2nd StreetLower <strong>Key</strong>s Medical Center<strong>Key</strong> <strong>West</strong>Duck Avenue/South Roosevelt BoulevardSearstown/Publix Shopping CenterSenior Center<strong>Key</strong> PlazaOverseas MarketNorth Roosevelt Boulevard/4th StreetTruman Avenue/White StreetGrinnell Street/Caroline StreetC. Red Fixed Route Bus ServiceAs illustrated on Figure 6-2, the Red route operates in a figure eight – crossing itself at itscenter. The Red route has a total of 17 bus stops with 13 stops located on the island of <strong>Key</strong><strong>West</strong> and 4 stops located on nearby Stock Island. As illustrated on Figure 6-2, the Red routestarts at the intersection of Flagler Avenue and Bertha Avenue and follows Flagler Avenue.The bus makes a left-turn onto Kennedy Drive, right-turn onto Northside Drive, looparound Toppino Drive and 14th Street, follows 14th Street, left-turn onto Duck Avenue, leftturnonto South Roosevelt Boulevard in <strong>Key</strong> <strong>West</strong>. The bus crosses a bridge on the OverseasHighway (U.S. 1) to Stock Island, makes a left-turn onto College Road, right-turn onto theOverseas Highway (U.S. 1), left-turn onto 2nd Street, left-turn onto Maloney Avenue, rightturnonto 4th Avenue, slight right onto 5th Avenue, right-turn onto Cross Street, left-turnonto the Overseas Highway (U.S. 1). The bus crosses the bridge back into <strong>Key</strong> <strong>West</strong> andTBG082810024135DFB/WPB31044333184.PDF/Final Report6-10
SECTION 6—TRANSIT ALTERNATIVES EVALUATIONmakes a right-turn onto North Roosevelt Boulevard, right-turn onto Palm Avenue, left-turnonto Easton Avenue, left-turn onto White Street, left-turn onto Truman Avenue/NorthRoosevelt Boulevard, right-turn onto 1st Street before the route ends at the intersection ofFlagler Avenue and Bertha Avenue. The following bus stops are located on the Red route.<strong>Key</strong> <strong>West</strong>Flagler Avenue/Bertha AvenueKennedy Drive/Flagler AvenueSenior CenterOverseas Market<strong>Key</strong> PlazaSearstown/Publix Shopping Center14th Street/Duck AvenueFIGURE 6-2Red and Orange Bus LinesFor simplicity’s sake, the Red and Orange routes are illustrated together on Figure 6-2.TBG082810024135DFB/WPB31044333184.PDF/Final Report6-11
SECTION 6—TRANSIT ALTERNATIVES EVALUATIONStock IslandLower <strong>Key</strong>s Medical CenterMaloney Avenue/2nd Street5th Avenue/5th StreetU.S. 1/Cross Street<strong>Key</strong> <strong>West</strong>North Roosevelt Boulevard – WalgreensDepartment of Transportation/Palm AvenueEaton Avenue/White StreetTruman Avenue/White Street1st Street/Roosevelt DriveFlagler Avenue/Bertha AvenueD. Orange Fixed Route Bus ServiceAs illustrated on Figure 6-2 above, the Orange route operates in a figure eight – crossingitself at its center. The Orange route has a total of 17 bus stops all located on the island of<strong>Key</strong> <strong>West</strong>. As illustrated on Figure 6-2, the Orange route begins on Palm Avenue at theDepartment of Transportation (DOT) building. The bus makes a left-turn onto EastonAvenue, right-turn onto Grinnell Street, left-turn onto Caroline Street, right-turn ontoSimonton Street, left-turn onto Front Street, left-turn onto Whitehead Street, right-turn ontoPetronia Street, left-turn onto Emma Street, left-turn onto Amelia Street, left-turn ontoWhitehead Street, right-turn onto Fleming Street, right-turn onto Simonton Street, left-turnonto South Street, left-turn onto White Street, right-turn onto Truman Avenue (which turnsinto North Roosevelt Boulevard), right-turn onto Toppino Drive, right-turn onto NorthsideDrive, left-turn onto Kennedy Drive/14th Street, right-turn onto Flagler Avenue, right-turnonto 1st Street before the route ends on Palm Avenue at the Department of Transportationbuilding. The following bus stops are located on the Orange route.Department of Transportation/Palm AvenueGrinnell Street/Caroline StreetFront Street/Mallory SquareTBG082810024135DFB/WPB31044333184.PDF/Final Report6-12
SECTION 6—TRANSIT ALTERNATIVES EVALUATIONEmma Street/Petronia StreetWhitehead Street/Fleming StreetSimonton Street/United StreetUnited Street/White StreetWhite Street/Truman AvenueNorth Roosevelt BoulevardOverseas Market<strong>Key</strong> PlazaSearstown/Publix Shopping CenterSenior CenterFlagler Avenue/10th StreetFlagler Avenue/<strong>Key</strong> <strong>West</strong> High School1st Street/Roosevelt DriveDepartment of Transportation/Palm AvenueAlternative #2This proposed improvement alternative include six (6) bus routes. These are the same sixroutes that were operated prior to the service cuts in 2009. Headways for each of the sixroutes would be reduced by half. Passengers would wait at a bus stop for the next bus foraround 45 minutes with this alternative. The Red, Gold, Purple, and Orange routes wouldreflect the pre-2009 service alignments with all of the previous stops, as operated beforeNovember 2009. The Blue and Green routes would not change from Alternative #1. As such,Alternative #2 would modify the 2008 service by reducing “headways” by half. The span ofservice and stop locations would not change. The proposed alternative would beimplemented in <strong>2010</strong> and continue through 2020.A. Blue Fixed Route Bus ServiceThe bus stops and alignment for the Blue route are the same as illustrated in Alternative #1.B. Green Fixed Route Bus ServiceThe bus stops and alignment for the Green route are the same as illustrated inAlternative #1.TBG082810024135DFB/WPB31044333184.PDF/Final Report6-13
SECTION 6—TRANSIT ALTERNATIVES EVALUATIONFIGURE 6-3Blue, Green, and Red Bus LinesC. Red Fixed Route Bus ServiceAs illustrated on Figure 6-3, the Red route follows a clockwise route on the island of <strong>Key</strong><strong>West</strong>. The Red route has 12 bus stops with all located on the island of <strong>Key</strong> <strong>West</strong> (the busstops at the intersection of Flagler Avenue and Bertha Avenue twice).For simplicity’s sake, the Blue, Green, and Red routes are illustrated together on Figure 6-3.As illustrated on Figure 6-3, the Red route starts at the Department of TransportationBuilding on Palm Avenue. The bus follows Palm Avenue, turns slight right, crosses NorthRoosevelt Boulevard, and be<strong>com</strong>es 1st Street. The bus continues to the intersection of FlaglerAvenue and Bertha Avenue, makes a left-turn onto Flagler Avenue, left-turn onto KennedyBoulevard, right-turn onto Northside Drive, loops around 14th Street, left-turn onto DuckAvenue, right-turn onto South Roosevelt Boulevard, slight-right onto Bertha Avenue, left-TBG082810024135DFB/WPB31044333184.PDF/Final Report6-14
SECTION 6—TRANSIT ALTERNATIVES EVALUATIONturn onto Flagler Avenue, right-turn onto Reynolds Street, left-turn onto South Street, rightturnonto Simonton Street, right-turn onto Caroline Street, right-turn onto Grinnell Street,left-turn onto Eaton Avenue, right-turn onto Palm Avenue before the route ends on PalmAvenue at the Department of Transportation building. The following bus stops are locatedon the Red route.Department of Transportation/Palm AvenueFlagler Avenue/Bertha AvenueSenior Citizens Center/Kennedy Drive<strong>Key</strong> PlazaSearstown/Publix Shopping CenterDuck Avenue/South Roosevelt BoulevardOceanwalk Condos<strong>Key</strong> <strong>West</strong> International AirportFlagler Avenue/Bertha AvenueFlagler Avenue/White StreetSouth Street/Simonton StreetGrinnell Street/Caroline StreetDepartment of Transportation/Palm AvenueD. Gold Fixed Route Bus ServiceAs illustrated on Figure 6-4, the Gold route operates in a figure eight and originates on StockIsland, crosses over to and runs through <strong>Key</strong> <strong>West</strong>, and ends back on Stock Island. The Goldroute has 10 bus stops with six (6) bus stops located on the island of <strong>Key</strong> <strong>West</strong> and four (4)bus stops located on Stock Island.TBG082810024135DFB/WPB31044333184.PDF/Final Report6-15
SECTION 6—TRANSIT ALTERNATIVES EVALUATIONFIGURE 6-4Gold, Purple, and Orange Bus LinesThe Gold route starts at the Lower <strong>Key</strong>s Medical Center. The bus follows College Road tothe Overseas Highway (U.S. 1). The bus makes a right-turn onto the Overseas Highway(U.S. 1), and makes a left-turn onto 2nd Street, left-turn onto Maloney Avenue, right-turnonto 4th Avenue, slight right onto 5th Avenue, right-turn onto Cross Street, and left-turnonto the Overseas Highway (U.S. 1). The bus crosses over a bridge into <strong>Key</strong> <strong>West</strong>, makes aright-turn onto North Roosevelt Boulevard, left-turn onto Kennedy Boulevard/13th Street,left-turn onto Northside Drive, left-turn onto Toppino Drive, left-turn onto 14th Street, leftturnonto Duck Avenue, left-turn onto South Roosevelt Boulevard, right-turn onto theOverseas Highway (U.S. 1), left-turn onto College Road before the route ends at the Lower<strong>Key</strong>s Medical Center on College Road. The following bus stops are located on the Goldroute.TBG082810024135DFB/WPB31044333184.PDF/Final Report6-16
SECTION 6—TRANSIT ALTERNATIVES EVALUATIONStock IslandCollege Road/Lower <strong>Key</strong>s Medical CenterMaloney Avenue/2nd Street5th Avenue/5th StreetCross Street/U.S. 1<strong>Key</strong> <strong>West</strong>North Roosevelt Boulevard/Toppino DriveOverseas Market<strong>Key</strong> PlazaSenior Citizens Center/Kennedy DriveSearstown Shopping CenterDuck Avenue/South Roosevelt BoulevardStock IslandCollege Road/Lower <strong>Key</strong>s Medical CenterE. Purple Fixed Route Bus ServiceAs illustrated on Figure 6-4, the Purple route operates in a figure eight pattern. The Purpleroute has 11 bus stops with all located on the island of <strong>Key</strong> <strong>West</strong>. As illustrated onFigure 6-4, the Purple route begins on Palm Avenue at the Department of Transportationbuilding. The bus makes a left-turn onto Easton Avenue, right-turn onto Grinnell Street, leftturnonto Caroline Street, left-turn onto Whitehead Street, right-turn onto Petronia Street,left-turn onto Emma Street, left-turn onto Amelia Street, left-turn onto Whitehead Street,right-turn onto Truman Avenue (Truman Avenue turns into North Roosevelt Boulevard)right-turn into the shopping center before 13th Street, left-turn in shopping center parkinglot to Northside Drive, loop around back to Northside Drive, left-turn onto Kennedy Drive,right-turn onto Flagler Avenue, right turn onto 1st Street (continues as Palm Avenue aftercrossing North Roosevelt Boulevard) before the route ends on Palm Avenue at theDepartment of Transportation building. The following bus stops are located on the Purpleroute.TBG082810024135DFB/WPB31044333184.PDF/Final Report6-17
SECTION 6—TRANSIT ALTERNATIVES EVALUATIONDepartment of Transportation/Palm AvenueGrinnell Street/Caroline StreetCaroline StreetEmma Street/Petronia StreetWhite Street/Truman AvenueNorth Roosevelt Boulevard/4th StreetOverseas Market<strong>Key</strong> PlazaSearstown/Publix Shopping CenterSenior Citizens Center/Kennedy DriveFlagler Avenue/Bertha AvenueDepartment of Transportation/Palm AvenueF. Orange Fixed Route Bus ServiceAs illustrated on Figure 6-4, the Orange route follows a counterclockwise route. The Orangeroute has a total of ten (10) bus stops all located on the island of <strong>Key</strong> <strong>West</strong>. As illustrated onFigure 6-4, the Orange route begins on Palm Avenue at the Department of Transportationbuilding. The bus makes a left-turn onto Easton Avenue, right-turn onto Grinnell Street, leftturnonto Caroline Street, right-turn onto Simonton Street, left-turn onto Front Street, leftturnonto Whitehead Street, left-turn onto Fleming Street, right-turn onto Simonton Street,left-turn onto United Street, right-turn onto White Street, left-turn onto Atlantic Boulevard,left-turn onto Bertha Avenue, right-turn onto Flagler Avenue, left-turn onto Kennedy Drive,right-turn onto Northside Drive, loop around Northside Drive, right-turn onto KennedyDrive, left-turn onto North Roosevelt Boulevard, right-turn onto Palm Avenue before theroute ends on Palm Avenue at the Department of Transportation building. The followingbus stops are located on the Orange route.Department of Transportation/Palm AvenueGrinnell Street/Caroline StreetFront Street/Mallory SquareFlagler Avenue/White StreetFlagler Avenue/Bertha AvenueTBG082810024135DFB/WPB31044333184.PDF/Final Report6-18
SECTION 6—TRANSIT ALTERNATIVES EVALUATIONSenior Citizens Center/Kennedy DriveSearstown/Publix Shopping Center<strong>Key</strong> PlazaOverseas MarketNorth Roosevelt Boulevard/4th StreetDepartment of Transportation/Palm Avenue6.4.2 Modeling ResultsTwo basic alternatives have been presented in this technical memorandum. The firstalternative would include the existing four (4) routes with higher service frequency. Thisalternative would reduce the time that passengers would wait at a bus stop for the next busby half. The second alternative would include all of the six (6) bus routes operated in 2008with increased service frequency – cutting the headways by half. Ridership for thesealternatives was estimated using the TBEST ridership estimation tool promulgated byFDOT. The results of the analysis of these two alternatives are presented in followingTables 6-2 and 6-3.TABLE 6-2<strong>Transit</strong> Boarding’s Summary (Average Weekday)<strong>Transit</strong> Routes(Before Cuts)<strong>Transit</strong> Routes(After Cuts)RoutesBase Year2009Total Boarding’sAlternative 12020Blue 226 397Gold 118 176Green 225 363Lower <strong>Key</strong>s Shuttle 318 535Orange 130 198Purple 147 243Red 187 319Alternative 22020Blue 304Green 267Lower keys Shuttle 364Orange 161Red 140Total Boarding’s 1351 2229 1235Total Boarding’sComparison to BaseYear (% Change)N/A 65% -9%TBG082810024135DFB/WPB31044333184.PDF/Final Report6-19
SECTION 6—TRANSIT ALTERNATIVES EVALUATIONTABLE 6-3<strong>Transit</strong> Boarding’s Summary (Annual Ridership)TBG082810024135DFB/WPB31044333184.PDF/Final Report6-20
SECTION 6—TRANSIT ALTERNATIVES EVALUATIONThe results indicate that if the headways are reduced by 50 percent on both the six (6) andfour (4) route service, the ridership would increase by 65 percent. The results also indicatethat the new reduced four (4) route service will only reduce ridership from the previous six(6) route service by 9 percent in the Year 2020.6.5 Revenue PotentialThis criterion most closely reflects the objective to provide a financially feasible and efficienttransit system. An efficient transit system incorporates a fare structure that is able togenerate sufficient revenue (in <strong>com</strong>bination with government subsidies) to provide qualitytransit service in addition to providing a level of service that is <strong>com</strong>parable to the fare. Toestimate the revenue potential of alternatives, the projected fare-box revenues and fare-boxrecovery rates were reviewed. It is estimated that the farebox revenue of the four (4) routeservice would ultimately decrease the current farebox from $538,471 to $492,238. As shownin Table 6-4, the expanded service would increase the farebox revenue to $888,499 in theYear 2020 with disregard to inflation and fare increases.TBG082810024135DFB/WPB31044333184.PDF/Final Report6-21
SECTION 6—TRANSIT ALTERNATIVES EVALUATIONTABLE 6-4Farebox Revenue EstimatesBase Year 2009 <strong>2010</strong> 2011 2012 2013 2014 2015 2016 2017 2018 2019 2020Estimated Revenue Per Boarding 1.09 1.09 1.09 1.09 1.09 1.09 1.09 1.09 1.09 1.09 1.09 1.09Alternative 1 Total Boardings 737189 744561 752006 759526 767122 774793 782541 790366 798270 806252 814315Alternative 1 Annual Revenue $804,346.92 $812,390.51 $ 820,513.75 $ 828,718.82 $ 837,006.81 $ 845,376.64 $ 853,830.49 $ 862,368.34 $ 870,992.40 $ 879,701.56 $ 888,499.10Alternative 2 Total Boardings 408411 412495 416620 420788 424994 429244 433537 437872 442251 446673 451140Alternative 2 Annual Revenue $445,617.24 $450,073.29 $ 454,574.08 $ 459,121.79 $ 463,710.95 $ 468,348.13 $ 473,032.22 $ 477,762.14 $ 482,540.07 $ 487,364.91 $ 492,238.85TBG082810024135DFB/WPB31044333184.PDF/Final Report6-22
Based on the information presented in the previous sections, the following servicealternatives and implementation strategies are provided for the KWDoT <strong>2010</strong>-2019 TDP. TheTDP services represent the out<strong>com</strong>e of coordination with KWDoT staff, public involvementactivities, and transit demand analysis. These alternatives provide for the most viableservice to be provided to existing and potential transit users.7.1 Ten-Year TDP Service Priorities• Continue Operating Existing Fixed Bus RoutesThe existing fixed bus routes should continue to operate. Fixed-route ridership hasremained constant with around one-half million passenger trips from 2005 through 2008,indicating that the current routes (October 2009) are productive. The current reduced routeservice November (2009), should be closely monitored for ridership and efficiency levels as<strong>com</strong>pared to the previous full service schedule. As a result, it is re<strong>com</strong>mended that changesto the current service should be <strong>com</strong>pared to the previous schedule and adjustments bemade accordingly as budget constraints permit.• Increase Frequencies on the Fixed-Route SystemReducing headways has the potential of improving the attractiveness and efficiency of theservice. Public workshop participants and survey respondents indicated the need forimproving headways on many of the fixed bus routes. Historically, KWT routes haveoperated with one-hour frequencies, which means that there is one bus per hour at anygiven stop along a route. Frequencies of 35 minutes are achieved by having routes thatmirror one another with the exception of serving the airport and portions of the New Townarea. Because the size of the <strong>Key</strong> <strong>West</strong> service area (<strong>Key</strong> <strong>West</strong> and Stock Island) issignificantly smaller than the service areas of all other Florida transit systems, it is highlyfeasible that frequencies can be reduced significantly through the dedication of additionalresources and buses. Some increased frequencies can be ac<strong>com</strong>plished from operationalimprovements and refined running times. In addition, frequencies could be increased by 15-TBG082810024135DFB/WPB31044333184.PDF/Final Report7-1
SECTION 7—TEN-YEAR TRANSIT DEVELOPMENT PLAN20 minutes through the purchase and addition of buses to the previous service or utilizingthe existing fleet on the current reduced service.• Establish Operational/Seasonal SchedulesIt is suggested that <strong>Key</strong> <strong>West</strong> <strong>Transit</strong> establish operational and seasonal schedules as ameans of meeting customer demand in a way that is transparent to the riding public.Frequency is achieved by dividing the total round trip running time of a route by thenumber of buses serving that route. If a route has a round trip running time of 60 minutes,then 2 buses are required to achieve a 30-minute frequency. However, round trip runningtimes for <strong>Key</strong> <strong>West</strong> <strong>Transit</strong> could vary at different times of year based on traffic conditionsand peak times of day. Therefore, during some periods of the day or seasons of the year theround trip running time for a particular route could vary between 30 and 60 minutes, whichwould impact the number of buses necessary to achieve a 30-minute frequency. In order toachieve these types of schedules, <strong>Key</strong> <strong>West</strong> <strong>Transit</strong> would need to implement an ongoingservice planning process. In this process, route running times would be checked on aperiodic basis to detect changing conditions. This would include a.m. and p.m. peak hours,mid-day, and evening during the tourist and off-tourist seasons.• Add More Buses in Daily ServiceThis would apply if reduced frequency would be implemented on the full service routes.Additional resources (i.e., buses and operators) would be added to the full service routeschedule to reduce the current headways and provide additional capacity for newcustomers. It was determined in the modeling analysis that if service frequency was increased by 50 percent, the ridership would increase by 65 percent by the Year 2020.7.2 Ten-Year TDP Capital and Infrastructure AlternativesThe following capital and infrastructure alternatives were developed for the TDP’s 10-yearplanning horizon.• Bus Replacement Program:The current bus fleet has nine (9) vehicles that range in mileage from 230,000 to 315,000miles. Based on the rate of current usage of 45,000 miles per year the 500,000 mile service lifewill be reached in approximately 5 years. The Department should evaluate a phasedTBG082810024135DFB/WPB31044333184.PDF/Final Report7-2
SECTION 7—TEN-YEAR TRANSIT DEVELOPMENT PLANreplacement schedule at a total cost of $6.0 million for the eventual replacement of thesevehicles. A strategy should also be developed as to rotate the usage of these vehicles tobalance the mileage since some of the older vehicles have dramatically less usage than thenewer vehicles by as much as 50 percent less usage.• New Administrative and Operations Facility:Funding has been programmed for the design and construction of a new administrative,operations and maintenance facility for KWDoT. It was assumed that Citywide fleetmaintenance would continue to be done off-site at the existing Palm Avenue facility. Theminimum size of this facility should ac<strong>com</strong>modate the current 40 full time employees (FTE)and current bus fleet of 17.• Maintenance, Miscellaneous and Passenger Amenity Items:The transit fleet is maintained by KWDoT. Major maintenance equipment and toolsrequired to maintain the federally financed buses are eligible for federal assistance. Othermiscellaneous items, such as money counting equipment, bus shelters and benches, and bussigns, are also eligible for capital grant assistance. All purchases must be programmed in theTDP to be eligible. Although these purchases may occur sporadically throughout the TDPperiod.7.3 Ten-Year TDP Policy and <strong>Plan</strong>ning ActivitiesDuring the 10-year planning horizon KWDoT should undertake several policy and planninginitiatives to provide a basis for service improvements, efficiency improvements and thefuture direction of the agency. Funds have been added to the financial plan (see Table 7-3)for these planning efforts, which may include, but are not limited to, the following:• Comprehensive Operations Analysis (COA) – A <strong>com</strong>prehensive operations analysiswill review all KWDoT services and provide information on service efficiencies, routeperformance and overall operations. This analysis should be done within the next 5-yearhorizon.• Synchromatics Training – The Synchromatics software system used by KWDoT fortracking passenger counts is a fully integrated automated passenger counting solution(APC). APC has two <strong>com</strong>ponents: real-time information on capacity of a bus shown toTBG082810024135DFB/WPB31044333184.PDF/Final Report7-3
SECTION 7—TEN-YEAR TRANSIT DEVELOPMENT PLANriders and reporting for agency use. The APC data and analysis from their routemanagement solution software could be used to <strong>com</strong>bine routes, balance service withdemand, and reduce vehicle turnover; effectively achieving the same or better servicewith fewer resources. This software should be used to the maximum extent software inorder to enhance efficiency. This software would be very effective in determining whereineffective routes and downtimes occur.• Continue to explore the use of local fundingTo directly support public transit services available to the general public. Additional localfunding would allow for the expansion and improvement of transit services and could beleveraged to access additional state and federal grants.• Examination of Community Service and Special Event Policies:KWDoT should continue to monitor the number and type of special event transportationservices it provides. Special consideration should be given to the financial equity of theservices offered and any adverse impacts these services have on regular services due to theadditional cost structure. Promote private –public partnership with local product promotersand use as a revenue generator as well as a marketing outlet to promote ridership.• Maintain Efforts to Develop a Unified Public Image and Marketing Approach:It is important that the positive, unified public image of KWDoT transit be maintained and aunified marketing theme developed. KWDoT is encouraged to expand their marketingefforts in either adding marketing staff or using a consultant to perform these services.• Fleet Maintenance Training:KWDoT should provide employee training to their fleet maintenance personnel to expandtheir capabilities. The future expanded maintenance facility will offer more opportunity toprovide a full service repair facility for the bus fleet.7.4 Ten-Year TDP Coordination ActivitiesDuring the 10-year planning horizon KWDoT should undertake several coordinationinitiatives to provide a basis for ridership improvements and how the city and the Countyview KWDoT. These planning efforts, which may include, but are not limited to, thefollowing:TBG082810024135DFB/WPB31044333184.PDF/Final Report7-4
SECTION 7—TEN-YEAR TRANSIT DEVELOPMENT PLAN• Develop a Community Outreach and Education Program:KWDoT transit should expand its <strong>com</strong>munity outreach programs to provide anunderstanding of the specific services offered and their benefits to the <strong>com</strong>munity. It isre<strong>com</strong>mended that a formal Community Outreach Program be established and continuedthroughout the TDP planning horizon.• Promote Employer-Provided SubsidiesThe Transportation Commute Benefit Program is a provision of the Internal Revenue Code,Section 132(f), which permits employers to subsidize their employees' cost of <strong>com</strong>muting towork, by transit and vanpools, up to $110 per month. These expenses are tax deductible tothe employer and cost the employer less than providing the same amount in gross in<strong>com</strong>e.Employers also can take advantage of the provision in the tax code that allows employees touse pre-tax in<strong>com</strong>e dollars to pay for qualified fringe benefits such as transit passes, vanpoolfares, and qualified parking, As a result, employees take home more of their paycheck andemployers benefit from this by saving on payroll taxes (at least 7.65 percent savings) andother salary-based benefits such as pension contributions defined as a percent of salary.• Commuter Assistance ProgramsDue to the limited resources available for public transportation services, KWDoT shouldwork with the local members of the <strong>Key</strong> <strong>West</strong> Chamber of Commerce to provideinformation to their members to assist in organizing programs such as employer suppliedcarpool and vanpool services in order to improve bus ridership. The focus of these effortsshould be on major employers located in the City and on Stock Island. Opportunities topartner with business owners for this provision of shared use could result in a “win-win”for both public and private sectors.• Work with the Monroe County <strong>Plan</strong>ning Department:To recognize the KWDoT transit system as a viable asset not only to the City but to theCounty as a whole. The Monroe County CIP section under “Mass <strong>Transit</strong>” does notrecognize the existence of the <strong>Key</strong> <strong>West</strong> or Lower <strong>Key</strong>s Shuttle transit system. The identityof the system should be promoted by the County as a contributing asset to Monroe Countyand should work with the City in promoting its use. They should look at utilizing someTBG082810024135DFB/WPB31044333184.PDF/Final Report7-5
SECTION 7—TEN-YEAR TRANSIT DEVELOPMENT PLANcounty Surface Transportation Program funding to support KWDoT transit capital projectssuch as bus procurement, development of passenger amenities and transit facilities.7.5 Monitoring Program to Track Performance MeasuresOn a quarterly basis KWDoT staff will continue to review data in order to monitor overallperformance. The following data will continue to be reviewed during these quarterlymeetings:• Passenger trips (system-wide and by route)• Passenger per revenue hour (system-wide and by route)• Passenger per revenue mile (system-wide and by route),• Farebox revenue and recovery ratio (system-wide and by route),• Bus pass sales (system-wide)• Total revenue (system-wide)• Total operating cost (system-wide)• Operating cost per passenger trip (system-wide)• Operating cost per revenue hour (system-wide)• Operating cost per revenue mile (system-wide)Data will continue to be <strong>com</strong>pared to previous quarterly and annual totals so as to gaugetrends in operation. This data will continue to be used for current and proposed systemimprovements as well as for future TDP updates.7.6 Ten-Year TDP Implementation <strong>Plan</strong>Several key on-going strategies are identified in this section to assist in carrying out the 10-year implementation plan. These strategies are outlined below.Implement <strong>Plan</strong> – KWDoT must continue to take ownership of the plan to ensure itsimplementation in an efficient manner. This action requires a <strong>com</strong>mitment to review andreference the plan on a regular basis to ensure that efforts are undertaken as appropriate.Enhance Marketing and Public Awareness – KWDoT should look at cost effectivelymarketing and tracking marketing results to review progress and effectiveness. In additionto marketing efforts, new opportunities for public outreach should be sought. Further,TBG082810024135DFB/WPB31044333184.PDF/Final Report7-6
SECTION 7—TEN-YEAR TRANSIT DEVELOPMENT PLANadditional resources need to be devoted to marketing to expand the level of awarenessregarding public transportation.Maintain Quality of Service – As part of the public involvement process, on-board surveyswere conducted in which respondents were asked to rate the <strong>Key</strong> <strong>West</strong> and Lower <strong>Key</strong>sShuttle transit system. The respondents reflected an overall high level of satisfaction withthe quality of transit services being provided. It is important that on-board surveys beconducted periodically as part of service assessment and implementation. Since word-ofmouthis perhaps the most effective form of marketing, this quality of service must bemaintained and improved to keep existing users satisfied and to ultimately attract newusers over time.7.7 Ten-Year Ridership ProjectionsThe ten-year ridership projections were based on an enhanced service and a reducedserviced from the original six (6) route service to the current four (4) route service. Theresults indicate that if the headways are reduced by 50 percent on both the six (6) and thecurrent four (4) route service, the ridership would increase by 65 percent by the Year 2020.The results also indicate that the new reduced four (4) route service will only reduceridership from the previous six (6) route service by 9 percent by the Year 2020.7.8 Ten-Year Financial planNumerous assumptions were made to project public transportation costs and revenues forthe time period from FY <strong>2010</strong> through FY 2019. The following assumptions made foroperating and capital costs and revenues for fixed-route services. These assumptions aresummarized below.Capital Cost Assumptions• Based on the Consumer Price Index (CPI) data for the last 10 years from 2000 to 2009, theaverage annual inflation rate is approximately 2.5 percent. Therefore, an annual inflationrate of 2.5 percent is used for all operating cost projections for fixed-route services.• Annual operating cost for fixed-route service is based on the projected FY 2009/<strong>2010</strong>operating budget of $3.05 mil was used as a base cost and inflated using an inflationrate of 2.5 percent per year thereafter.TBG082810024135DFB/WPB31044333184.PDF/Final Report7-7
SECTION 7—TEN-YEAR TRANSIT DEVELOPMENT PLAN• Based on the current cost of transit vehicles in Florida and recent KWDoT vehiclepurchases, unit costs of $400,000 per bus were used. The unit costs include theadditional cost for equipment upgrades, such as GPS, security, <strong>com</strong>munications andbicycle racks.The following Tables 7-1 and 7-2 indicate the estimated capital requirements andexpenditures through FY 2019.Operating Cost AssumptionsUtilizing the City of <strong>Key</strong> <strong>West</strong> past, current and most recent projected budget detail ledgersand budget detail worksheets the transit operating costs were projected for the TDP timeperiod from FY <strong>2010</strong> through FY 2019. The operating budget was classified in the followingcategories:• General administration costs for <strong>Key</strong> <strong>West</strong> <strong>Transit</strong>• General operating and maintenance costs for <strong>Key</strong> <strong>West</strong> <strong>Transit</strong>• General operating and maintenance costs for the Lower <strong>Key</strong>s Shuttle Service• Operation and maintenance of the <strong>Key</strong> <strong>West</strong> Park and Ride facility• These costs were classified to match the City of <strong>Key</strong> <strong>West</strong> general ledger classification asfollows:Administration CostsSalaries and WagesFICARetirement contributionsHealth InsuranceWorkers Comp.Prof. ServicesAccounting & AuditingOther contract Svcs.CommunicationsRentals & LeasesInsurancePrintingPromotional ActivitiesOffice suppliesBooks & MembershipsTravelTrainingOperations CostsSalaries and WagesOvertimeFICARetirement contributionsHealth InsuranceSpecial PayProf. ServicesBus Repair & Maint.Other contract Svcs.CommunicationsOperating suppliesFuelPrintingPromotional ActivitiesOffice suppliesBooks & MembershipsTravelTrainingTBG082810024135DFB/WPB31044333184.PDF/Final Report7-8
SECTION 7—TEN-YEAR TRANSIT DEVELOPMENT PLANTABLE 7-1Summary of Capital Needs (FY <strong>2010</strong>-FY2019)Capital Needs10 YR NeedFY<strong>2010</strong>FY2011FY2012FY2013FY2014FY2015FY2016FY2017FY2018 FY 2019Replacement Buses (ExistingService)15 0 0 8 0 3 2 0 0 0 2Support Vehicles 2 0 2 0 0 0 0 0 0 0 0Admin and Maintenance Facility 1 0 1 0 0 0 0 0 0 0 0Bike Racks 60 10 10 10 10 10 10 0 0 0 0Bus Benches 60 10 10 10 10 10 10 0 0 0 0Note all new furnishing, fixtures and equipment including in new admin and maintenance facility costTABLE 7-2Summary of Projected Capital Needs (FY <strong>2010</strong>-FY2019)Capital NeedsUnit Cost($2009) FY <strong>2010</strong> FY 2011 FY 2012 FY 2013 FY 2014 FY 2015 FY 2016 FY 2017FY2018 FY 201910-YearTotalReplacement Buses(Existing Service)$400,000 $ - $ - $3,200,000.00 $ - $1,200,000.00 $800,000.00 $ - $ - $ - $800,000.00 $6,000,000.00Support Vehicles $35,000 $ - $70,000.00 $ - $ - $ - $ - $ - $ - $ - $ - $70,000.00Admin andMaintenance Facility$7,200,000 $ - $3,600,000.00 $3,600,000.00 $ - $ - $ - $ - $ - $ - $ - $7,200,000.00Bike Racks $2,000 $20,000.00 $20,000.00 $20,000.00 $20,000.00 $20,000.00 $20,000.00 $ - $ - $ - $ - $120,000.00Bus Benches $1,500 $15,000.00 $15,000.00 $15,000.00 $15,000.00 $15,000.00 $15,000.00 $ - $ - $ - $ - $90,000.00Total $35,000.00 $3,705,000.00 $6,835,000.00 $35,000.00 $1,235,000.00 $835,000.00 $ - $ - $ - $800,000.00 $13,480,000.00Note all new furnishing, fixtures and equipment including in new admin and maintenance facility costTBG082810024135DFB/WPB31044333184.PDF/Final Report7-9
SECTION 7—TEN-YEAR TRANSIT DEVELOPMENT PLANThe majority of operating costs were lumped into these categories in an effort to monitorfuture costs with the actual costs <strong>com</strong>piled in the City of <strong>Key</strong> <strong>West</strong> accounting system. Thefollowing Table 7-3 indicates the estimated operating cost requirements through FY 2019.Revenue Assumptions (See Table 7-4)• Based on the FDOT 5-Year Work Program, Rural and Small Urban Areas (FTA Section5311) funds are assumed to be $384,233 for FY 2009/<strong>2010</strong>. Thereafter, an inflation factorof 2.5 percent is used annually after the 5-year FDOT projections.• Based on the actual FY 2008/2009 operating budget, Job Access and Reverse Commutefunds are $420,700 from FTA and $160,000 from FDOT and assumed to be $420,000 fromFTA and $236,800 from FDOT for FY 2009/<strong>2010</strong>. These funds will end in the FY <strong>2010</strong>and must be converted to Commuter Assistance Funds.• Based on the FDOT 5-Year Work Program, State Block Grant funding is assumed to be$172,500 for FY <strong>2010</strong>. Thereafter, an inflation factor of 2.5 percent is used annually afterthe 5-Year FDOT projections.• Based on the actual FY 2008/2009 operating budget, the Motor Fuel tax Rebate was$10,009 and contributions are estimated at $10,000 for FY <strong>2010</strong>. Thereafter, an inflationfactor of 2.5 percent is used annually.• Based on the actual FY 2008/2009 operating budget, the charge for services was$1,049,700 and contributions are estimated at $1,011,700 for FY <strong>2010</strong>. Thereafter, aninflation factor of 2.5 percent is used annually.The following Table 7-3 indicates the estimated operating cost requirements through FY 2019.The estimated operating costs and estimated revenues are shown below in Table 7-5. Anestimated shortfall of $8,016,961.02 is anticipated without additional revenue sources suchas increased fares, local, state or federal participation.The estimated capital improvement requirements, operating costs and estimated revenuesare shown below in Table 7-6. It is assumed that $6,280,000 of the capital improvementshortfall will be provided by FTA grants.In order for KWDoT to move forward with the 10-year plan additional revenue sources willbe necessary to address unfunded needs. It is important to note, that during the planningTBG082810024135DFB/WPB31044333184.PDF/Final Report7-10
SECTION 7—TEN-YEAR TRANSIT DEVELOPMENT PLANhorizon additional sources of funding may surface that are not currently available.Therefore, it is important that all agencies supporting public transit improvements continueto review funding opportunities and exhaust all available sources to support public transitenhancements.TBG082810024135DFB/WPB31044333184.PDF/Final Report7-11
SECTION 7—TEN-YEAR TRANSIT DEVELOPMENT PLANTABLE 7-3Estimated Operating Costs (FY <strong>2010</strong>-FY2019)Source FY <strong>2010</strong> FY 2011 FY 2012 FY 2013 FY 2014 FY 2015 FY 2016 FY 2017 FY 2018 FY 2019 10-Year TotalGeneral Admin $ - $ - $ - $ - $ - $ -Salaries and Wages $ 88,000.00 $ 90,200.00 $ 92,455.00 $ 94,766.38 $ 97,135.53 $ 99,563.92 $ 102,053.02 $ 104,604.35 $ 107,219.45 $ 109,899.94 $ 985,897.60Fica $ 7,000.00 $ 7,175.00 $ 7,354.38 $ 7,538.23 $ 7,726.69 $ 7,919.86 $ 8,117.85 $ 8,320.80 $ 8,528.82 $ 8,742.04 $ 78,423.67Retirement contributions $ 10,800.00 $ 11,070.00 $ 11,346.75 $ 11,630.42 $ 11,921.18 $ 12,219.21 $ 12,524.69 $ 12,837.81 $ 13,158.75 $ 13,487.72 $ 120,996.52Health Insurance $ 12,420.00 $ 12,730.50 $ 13,048.76 $ 13,374.98 $ 13,709.36 $ 14,052.09 $ 14,403.39 $ 14,763.48 $ 15,132.56 $ 15,510.88 $ 139,146.00Workers Comp. $ 109,000.00 $ 111,725.00 $ 114,518.13 $ 117,381.08 $ 120,315.61 $ 123,323.50 $ 126,406.58 $ 129,566.75 $ 132,805.92 $ 136,126.06 $ 1,221,168.61Prof. Services $ 4,500.00 $ 4,612.50 $ 4,727.81 $ 4,846.01 $ 4,967.16 $ 5,091.34 $ 5,218.62 $ 5,349.09 $ 5,482.81 $ 5,619.88 $ 50,415.22Accounting & Auditing $ 10,950.00 $ 11,223.75 $ 11,504.34 $ 11,791.95 $ 12,086.75 $ 12,388.92 $ 12,698.64 $ 13,016.11 $ 13,341.51 $ 13,675.05 $ 122,677.03Other contract Svcs. $ 59,000.00 $ 60,475.00 $ 61,986.88 $ 63,536.55 $ 65,124.96 $ 66,753.08 $ 68,421.91 $ 70,132.46 $ 71,885.77 $ 73,682.92 $ 660,999.52Communications $ 2,400.00 $ 2,460.00 $ 2,521.50 $ 2,584.54 $ 2,649.15 $ 2,715.38 $ 2,783.26 $ 2,852.85 $ 2,924.17 $ 2,997.27 $ 26,888.12Rentals & Leases $ 4,800.00 $ 4,920.00 $ 5,043.00 $ 5,169.08 $ 5,298.30 $ 5,430.76 $ 5,566.53 $ 5,705.69 $ 5,848.33 $ 5,994.54 $ 53,776.23Insurance $ 95,750.00 $ 98,143.75 $ 100,597.34 $ 103,112.28 $ 105,690.08 $ 108,332.34 $ 111,040.64 $ 113,816.66 $ 116,662.08 $ 119,578.63 $ 1,072,723.80Printing $ 5,500.00 $ 5,637.50 $ 5,778.44 $ 5,922.90 $ 6,070.97 $ 6,222.75 $ 6,378.31 $ 6,537.77 $ 6,701.22 $ 6,868.75 $ 61,618.60Promotional Activities $ 6,000.00 $ 6,150.00 $ 6,303.75 $ 6,461.34 $ 6,622.88 $ 6,788.45 $ 6,958.16 $ 7,132.11 $ 7,310.42 $ 7,493.18 $ 67,220.29Office supplies $ 7,000.00 $ 7,175.00 $ 7,354.38 $ 7,538.23 $ 7,726.69 $ 7,919.86 $ 8,117.85 $ 8,320.80 $ 8,528.82 $ 8,742.04 $ 78,423.67Books & Memberships $ 1,750.00 $ 1,793.75 $ 1,838.59 $ 1,884.56 $ 1,931.67 $ 1,979.96 $ 2,029.46 $ 2,080.20 $ 2,132.21 $ 2,185.51 $ 19,605.92Travel $ 5,000.00 $ 5,125.00 $ 5,253.13 $ 5,384.45 $ 5,519.06 $ 5,657.04 $ 5,798.47 $ 5,943.43 $ 6,092.01 $ 6,244.31 $ 56,016.91Training $ 5,000.00 $ 5,125.00 $ 5,253.13 $ 5,384.45 $ 5,519.06 $ 5,657.04 $ 5,798.47 $ 5,943.43 $ 6,092.01 $ 6,244.31 $ 56,016.91Total General Admin $ 434,870.00 $ 445,741.75 $ 456,885.29 $ 468,307.43 $ 480,015.11 $ 492,015.49 $ 504,315.88 $ 516,923.77 $ 529,846.87 $ 543,093.04 $ 4,872,014.63City Maintenance-KWTSalaries and Wages $ 529,190.00 $ 542,419.75 $ 555,980.24 $ 569,879.75 $ 584,126.74 $ 598,729.91 $ 613,698.16 $ 629,040.61 $ 644,766.63 $ 660,885.80 $ 5,928,717.60Overtime $ 50,000.00 $ 51,250.00 $ 52,531.25 $ 53,844.53 $ 55,190.64 $ 56,570.41 $ 57,984.67 $ 59,434.29 $ 60,920.14 $ 62,443.15 $ 560,169.09Fica $ 44,510.00 $ 45,622.75 $ 46,763.32 $ 47,932.40 $ 49,130.71 $ 50,358.98 $ 51,617.95 $ 52,908.40 $ 54,231.11 $ 55,586.89 $ 498,662.52Retirement contributions $ 64,820.00 $ 66,440.50 $ 68,101.51 $ 69,804.05 $ 71,549.15 $ 73,337.88 $ 75,171.33 $ 77,050.61 $ 78,976.88 $ 80,951.30 $ 726,203.21Health Insurance $ 134,900.00 $ 138,272.50 $ 141,729.31 $ 145,272.55 $ 148,904.36 $ 152,626.97 $ 156,442.64 $ 160,353.71 $ 164,362.55 $ 168,471.61 $ 1,511,336.20special Pay $ 2,630.00 $ 2,695.75 $ 2,763.14 $ 2,832.22 $ 2,903.03 $ 2,975.60 $ 3,049.99 $ 3,126.24 $ 3,204.40 $ 3,284.51 $ 29,464.89Prof. Services $ 11,550.00 $ 11,838.75 $ 12,134.72 $ 12,438.09 $ 12,749.04 $ 13,067.76 $ 13,394.46 $ 13,729.32 $ 14,072.55 $ 14,424.37 $ 129,399.06Bus Repair & Maint. $ 90,000.00 $ 92,250.00 $ 94,556.25 $ 96,920.16 $ 99,343.16 $ 101,826.74 $ 104,372.41 $ 106,981.72 $ 109,656.26 $ 112,397.67 $ 1,008,304.36Other contract Svcs. $ 8,000.00 $ 8,200.00 $ 8,405.00 $ 8,615.13 $ 8,830.50 $ 9,051.27 $ 9,277.55 $ 9,509.49 $ 9,747.22 $ 9,990.90 $ 89,627.05Communications $ 5,500.00 $ 5,637.50 $ 5,778.44 $ 5,922.90 $ 6,070.97 $ 6,222.75 $ 6,378.31 $ 6,537.77 $ 6,701.22 $ 6,868.75 $ 61,618.60Operating supplies $ 35,000.00 $ 35,875.00 $ 36,771.88 $ 37,691.17 $ 38,633.45 $ 39,599.29 $ 40,589.27 $ 41,604.00 $ 42,644.10 $ 43,710.20 $ 392,118.36Fuel $ 200,000.00 $ 205,000.00 $ 210,125.00 $ 215,378.13 $ 220,762.58 $ 226,281.64 $ 231,938.68 $ 237,737.15 $ 243,680.58 $ 249,772.59 $ 2,240,676.35Printing $ 15,000.00 $ 15,375.00 $ 15,759.38 $ 16,153.36 $ 16,557.19 $ 16,971.12 $ 17,395.40 $ 17,830.29 $ 18,276.04 $ 18,732.94 $ 168,050.73Promotional Activities $ 2,500.00 $ 2,562.50 $ 2,626.56 $ 2,692.23 $ 2,759.53 $ 2,828.52 $ 2,899.23 $ 2,971.71 $ 3,046.01 $ 3,122.16 $ 28,008.45TBG082810024135DFB/WPB31044333184.PDF/Final Report7-12
SECTION 7—TEN-YEAR TRANSIT DEVELOPMENT PLANTABLE 7-3Estimated Operating Costs (FY <strong>2010</strong>-FY2019)Source FY <strong>2010</strong> FY 2011 FY 2012 FY 2013 FY 2014 FY 2015 FY 2016 FY 2017 FY 2018 FY 2019 10-Year TotalOffice supplies $ 1,000.00 $ 1,025.00 $ 1,050.63 $ 1,076.89 $ 1,103.81 $ 1,131.41 $ 1,159.69 $ 1,188.69 $ 1,218.40 $ 1,248.86 $ 11,203.38Books & Memberships $ 1,350.00 $ 1,383.75 $ 1,418.34 $ 1,453.80 $ 1,490.15 $ 1,527.40 $ 1,565.59 $ 1,604.73 $ 1,644.84 $ 1,685.97 $ 15,124.57Travel $ 1,200.00 $ 1,230.00 $ 1,260.75 $ 1,292.27 $ 1,324.58 $ 1,357.69 $ 1,391.63 $ 1,426.42 $ 1,462.08 $ 1,498.64 $ 13,444.06Training $ 5,000.00 $ 5,125.00 $ 5,253.13 $ 5,384.45 $ 5,519.06 $ 5,657.04 $ 5,798.47 $ 5,943.43 $ 6,092.01 $ 6,244.31 $ 56,016.91Total KWT Maintenance $ 1,202,150.00 $1,232,203.75 1263008.844 1294584.065 1326948.666 1360122.383 1394125.443 1428978.579 1464703.043 1501320.619 $ 13,468,145.39City Maintenance-Lower <strong>Key</strong>s ShuttleSalaries and Wages $ 440,000.00 $ 451,000.00 $ 462,275.00 $ 473,831.88 $ 485,677.67 $ 497,819.61 $ 510,265.10 $ 523,021.73 $ 536,097.27 $ 549,499.71 $ 4,929,487.98Overtime $ 50,000.00 $ 51,250.00 $ 52,531.25 $ 53,844.53 $ 55,190.64 $ 56,570.41 $ 57,984.67 $ 59,434.29 $ 60,920.14 $ 62,443.15 $ 560,169.09Fica $ 37,500.00 $ 38,437.50 $ 39,398.44 $ 40,383.40 $ 41,392.98 $ 42,427.81 $ 43,488.50 $ 44,575.72 $ 45,690.11 $ 46,832.36 $ 420,126.82Retirement contributions $ 25,230.00 $ 25,860.75 $ 26,507.27 $ 27,169.95 $ 27,849.20 $ 28,545.43 $ 29,259.06 $ 29,990.54 $ 30,740.31 $ 31,508.81 $ 282,661.32Health Insurance $ 42,160.00 $ 43,214.00 $ 44,294.35 $ 45,401.71 $ 46,536.75 $ 47,700.17 $ 48,892.67 $ 50,114.99 $ 51,367.87 $ 52,652.06 $ 472,334.58Special Pay $ 1,180.00 $ 1,209.50 $ 1,239.74 $ 1,270.73 $ 1,302.50 $ 1,335.06 $ 1,368.44 $ 1,402.65 $ 1,437.72 $ 1,473.66 $ 13,219.99Workers <strong>com</strong>p. $ 15,640.00 $ 16,031.00 $ 16,431.78 $ 16,842.57 $ 17,263.63 $ 17,695.22 $ 18,137.61 $ 18,591.05 $ 19,055.82 $ 19,532.22 $ 175,220.89Prof. Services $ 9,280.00 $ 9,512.00 $ 9,749.80 $ 9,993.55 $ 10,243.38 $ 10,499.47 $ 10,761.95 $ 11,031.00 $ 11,306.78 $ 11,589.45 $ 103,967.38Bus Repair & Maint. $ 80,000.00 $ 82,000.00 $ 84,050.00 $ 86,151.25 $ 88,305.03 $ 90,512.66 $ 92,775.47 $ 95,094.86 $ 97,472.23 $ 99,909.04 $ 896,270.54Other contract Svcs. $ 8,800.00 $ 9,020.00 $ 9,245.50 $ 9,476.64 $ 9,713.55 $ 9,956.39 $ 10,205.30 $ 10,460.43 $ 10,721.95 $ 10,989.99 $ 98,589.76Communications $ 3,500.00 $ 3,587.50 $ 3,677.19 $ 3,769.12 $ 3,863.35 $ 3,959.93 $ 4,058.93 $ 4,160.40 $ 4,264.41 $ 4,371.02 $ 39,211.84Operating supplies $ 30,000.00 $ 30,750.00 $ 31,518.75 $ 32,306.72 $ 33,114.39 $ 33,942.25 $ 34,790.80 $ 35,660.57 $ 36,552.09 $ 37,465.89 $ 336,101.45Fuel $ 250,000.00 $ 256,250.00 $ 262,656.25 $ 269,222.66 $ 275,953.22 $ 282,852.05 $ 289,923.35 $ 297,171.44 $ 304,600.72 $ 312,215.74 $ 2,800,845.44Printing $ 15,000.00 $ 15,375.00 $ 15,759.38 $ 16,153.36 $ 16,557.19 $ 16,971.12 $ 17,395.40 $ 17,830.29 $ 18,276.04 $ 18,732.94 $ 168,050.73Promotional Activities $ 3,500.00 $ 3,587.50 $ 3,677.19 $ 3,769.12 $ 3,863.35 $ 3,959.93 $ 4,058.93 $ 4,160.40 $ 4,264.41 $ 4,371.02 $ 39,211.84Office supplies $ 1,000.00 $ 1,025.00 $ 1,050.63 $ 1,076.89 $ 1,103.81 $ 1,131.41 $ 1,159.69 $ 1,188.69 $ 1,218.40 $ 1,248.86 $ 11,203.38Books & Memberships $ 1,350.00 $ 1,383.75 $ 1,418.34 $ 1,453.80 $ 1,490.15 $ 1,527.40 $ 1,565.59 $ 1,604.73 $ 1,644.84 $ 1,685.97 $ 15,124.57Travel $ 1,200.00 $ 1,230.00 $ 1,260.75 $ 1,292.27 $ 1,324.58 $ 1,357.69 $ 1,391.63 $ 1,426.42 $ 1,462.08 $ 1,498.64 $ 13,444.06Training $ 5,000.00 $ 5,125.00 $ 5,253.13 $ 5,384.45 $ 5,519.06 $ 5,657.04 $ 5,798.47 $ 5,943.43 $ 6,092.01 $ 6,244.31 $ 56,016.91Maintenance-Lower <strong>Key</strong>s Shuttle $ 1,020,340.00 $1,045,848.50 $ 1,071,994.71 $ 1,098,794.58 $1,126,264.44 $1,154,421.06 $ 1,183,281.58 $ 1,212,863.62 $1,243,185.21 $ 1,274,264.84 $ 11,431,258.55Park N Ride Operation $ 250,000.00 $ 256,250.00 $ 262,656.25 $ 269,222.66 $ 275,953.22 $ 282,852.05 $ 289,923.35 $ 297,171.44 $ 304,600.72 $ 312,215.74 $ 2,800,845.44TOTAL $ 2,907,360.00 $2,980,044.00 $ 3,054,545.10 $ 3,130,908.73 $3,209,181.45 $3,289,410.98 $ 3,371,646.26 $ 3,455,937.41 $3,542,335.85 $ 3,630,894.24 $ 32,572,264.02TBG082810024135DFB/WPB31044333184.PDF/Final Report7-13
SECTION 7—TEN-YEAR TRANSIT DEVELOPMENT PLANTABLE 7-4Summary of Revenue (FY <strong>2010</strong>-FY2019)FederalSource FY <strong>2010</strong> FY 2011 FY 2012 FY 2013 FY 2014 FY 2015 FY 2016 FY 2017 FY 2018 FY 2019 10-Year TotalSection 5311 $ 384,233 $ 418,500.00 $ 439,500.00 $ 461,500.00 $ 484,500.00 $490,500.00 $ 527,939.06 $ 541,137.54 $ 554,665.98 $ 568,532.63 $ 4,991,337.71JARC-FTA $ 420,700.00 $ - $ - $ - $ - $ - $ - $ - $ - $ - $ 420,700.00StateFDOT BLOCK Grant $ 172,500.00 $ 170,500.00 $ 177,500.00 $ 184,000.00 $ 184,000.00 $184,000.00 $ 201,720.00 $ 206,763.00 $ 211,932.08 $ 217,230.38 $ 1,951,445.45JARC - FDOT (Lower <strong>Key</strong>s) $ 236,800.00 $ 180,500.00 $ 180,500.00 - $ 180,500.00 - $ - $ - $ - $ - $ - $ - $ 236,800.00Commuter Asst (in lieu JARC) $ - $ 335,000.00 $ 343,375.00 $ 351,959.38 $ 360,758.36 $369,777.32 $ 379,021.75 $ 388,497.30 $ 398,209.73 $ 408,164.97 $ 3,334,763.80Motor Fuel Tax Rebate $ 10,000.00 $ 10,250.00 $ 10,506.25 $ 10,768.91 $ 11,038.13 $ 11,314.08 $ 11,596.93 $ 11,886.86 $ 12,184.03 $ 12,488.63 $ 112,033.82Local (City / County)City of Marathon $ 55,000.00 $ 57,500.00 $ 58,937.50 $ 60,410.94 $ 61,921.21 $ 63,469.24 $ 65,055.97 $ 66,682.37 $ 68,349.43 $ 70,058.17 $ 627,384.83Monroe County BOCC $ 55,000.00 $ 57,500.00 $ 58,937.50 $ 60,410.94 $ 61,921.21 $ 63,469.24 $ 65,055.97 $ 66,682.37 $ 68,349.43 $ 70,058.17 $ 627,384.83City of <strong>Key</strong> <strong>West</strong> $ 55,000.00 $ 57,500.00 $ 58,937.50 $ 60,410.94 $ 61,921.21 $ 63,469.24 $ 65,055.97 $ 66,682.37 $ 68,349.43 $ 70,058.17 $ 627,384.83New <strong>Transit</strong> Facility Funding*FL-03-0316 $ - $1,505,759.00 $1,505,759.00 $ - $ - $ - $ - $ - $ - $ - $ 3,011,518.00FL-04-0065 $ - $ 247,500.00 $ 247,500.00 $ - $ - $ - $ - $ - $ - $ - $ 495,000.00FL-04-0095 $ - $ 622,000.00 $ 622,000.00 $ - $ - $ - $ - $ - $ - $ - $ 1,244,000.00FL-18-XO29 (partial) $ - $ 500,000.00 $ 500,000.00 $ - $ - $ - $ - $ - $ - $ - $ 1,000,000.00FL-12-X003 $ - $ 247,500.00 $ 247,500.00 $ - $ - $ - $ - $ - $ - $ - $ 495,000.00FL-18-XO29 (pending partial) $ - $ 500,000.00 $ 500,000.00 $ - $ - $ - $ - $ - $ - $ - $ 1,000,000.00Other City <strong>Transit</strong>Farebox Revenues $ 300,000.00 $ 307,500.00 $ 315,187.50 $ 323,067.19 $ 331,143.87 $339,422.46 $ 347,908.03 $ 356,605.73 $ 365,520.87 $ 374,658.89 $ 3,361,014.53Bus Advertising $ 5,000.00 $ 5,125.00 $ 5,253.13 $ 5,384.45 $ 5,519.06 $ 5,657.04 $ 5,798.47 $ 5,943.43 $ 6,092.01 $ 6,244.31 $ 56,016.91City Bus Shelter Ads $ 70,000.00 $ 71,750.00 $ 73,543.75 $ 75,382.34 $ 77,266.90 $ 79,198.57 $ 81,178.54 $ 83,208.00 $ 85,288.20 $ 87,420.41 $ 784,236.72Parking $ 368,800.00 $ 378,020.00 $ 387,470.50 $ 397,157.26 $ 407,086.19 $417,263.35 $ 427,694.93 $ 438,387.31 $ 449,346.99 $ 460,580.66 $ 4,131,807.20Conch Harbor Parking $ 16,000.00 $ 16,400.00 $ 16,810.00 $ 17,230.25 $ 17,661.01 $ 18,102.53 $ 18,555.09 $ 19,018.97 $ 19,494.45 $ 19,981.81 $ 179,254.11Other Charges $ 16,100.00 $ 16,502.50 $ 16,915.06 $ 17,337.94 $ 17,771.39 $ 18,215.67 $ 18,671.06 $ 19,137.84 $ 19,616.29 $ 20,106.69 $ 180,374.45We've Got The <strong>Key</strong>s $ 35,000.00 $ 35,875.00 $ 36,771.88 $ 37,691.17 $ 38,633.45 $ 39,599.29 $ 40,589.27 $ 41,604.00 $ 42,644.10 $ 43,710.20 $ 392,118.36Interest on Investments $ 5,000.00 $ 5,125.00 $ 5,253.13 $ 5,384.45 $ 5,519.06 $ 5,657.04 $ 5,798.47 $ 5,943.43 $ 6,092.01 $ 6,244.31 $ 56,016.91Lower <strong>Key</strong>s $ -Lower <strong>Key</strong>s Bus Fares $ 230,000.00 $ 232,000.00 $ 234,000.00 $ 236,000.00 $ 238,000.00 $240,000.00 $ 242,000.00 $ 244,000.00 $ 246,000.00 $ 248,000.00 $ 2,390,000.00Lower <strong>Key</strong>s Shelter Ads $ 8,500.00 $ 8,712.50 $ 8,930.31 $ 9,153.57 $ 9,382.41 $ 9,616.97 $ 9,857.39 $ 10,103.83 $ 10,356.42 $ 10,615.34 $ 95,228.75TOTAL OPERATING REVENUE** $2,472,900.00 $2,206,260.00 $ 2,269,329.00 $2,338,250.00 $2,400,043.00 $2,456,095.00 $2,513,497.00 $2,572,284.00 $2,632,491.00 $2,694,154.00 $ 31,800,821.19*These funds are exclusive for New <strong>Transit</strong> Facility Funding Only**Less New <strong>Transit</strong> Facility FundingTBG082810024135DFB/WPB31044333184.PDF/Final Report7-14
SECTION 7—TEN-YEAR TRANSIT DEVELOPMENT PLANTABLE 7-5Estimated Summary of Projected Cost and Revenue Needs (FY <strong>2010</strong>-FY2019)FY <strong>2010</strong> FY 2011 FY 2012 FY 2013 FY 2014 FY 2015 FY 2016 FY 2017 FY 2018 FY 2019 10-Year TotalOperating Costs - Existing Service $ 2,907,360.00 $ 2,980,044.00 $ 3,054,545.10 $ 3,130,908.73 $ 3,209,181.45 $ 3,289,410.98 $ 3,371,646.26 $3,455,937.41 $3,542,335.85 $ 3,630,894.24 $ 32,572,264.02Estimated Operating Revenue $ 2,472,900.00 $ 2,206,260.00 $ 2,269,329.00 $ 2,338,250.00 $ 2,400,043.00 $ 2,456,095.00 $ 2,513,497.00 $2,572,284.00 $2,632,491.00 $ 2,694,154.00 $ 31,800,821.00Total Operating Cost Funding Shortfall $ 434,460.00 $ 773,784.00 $ 785,216.10 $ 792,658.73 $ 809.138.45 $ 833,315.98 $ 858,149.26 $ 883,653.41 $ 909,844.85 $ 936,740.24 $ 8,016,961.02TABLE 7-6Estimated Summary of Projected Operating and Capital Needs (FY <strong>2010</strong>-FY2019)FY <strong>2010</strong> FY 2011 FY 2012 FY 2013 FY 2014 FY 2015 FY 2016 FY 2017 FY 2018 FY 2019 10-Year TotalOperating Costs - Existing Service $ 2,907,360.00 $ 2,980,044.00 $ 3,054,545.10 $ 3,130,908.73 $ 3,209,181.45 $ 3,289,410.98 $ 3,371,646.26 $3,455,937.41 $3,542,335.85 $ 3,630,894.24 $ 32,572,264.02Costs - Capital Improvements $ 35,000.00 $ 3,705,000.00 $ 6,835,000.00 $ 35,000.00 $ 1,235,000.00 $ 835,000.00 $ - $ - $ - $ 800,000.00 $ 13,480,000.00Total Operating and Capital Costs Required $ 2,942,360.00 $ 6,685,044.00 $ 9,889,545.10 $ 3,165,908.73 $ 4,444,181.45 $ 4,124,410.98 $ 3,371,646.26 $3,455,937.41 $3,542,335.85 $ 4,430,894.24 $ 46,052,264.02Estimated Operating Revenue $ 2,472,900.00 $ 5,829,019.00 $ 5,892,088.00 $ 2,338,250.00 $ 2,400,043.00 $ 2,456,095.00 $ 2,513,497.00 $2,572,284.00 $2,632,491.00 $ 2,694,154.00 $ 31,800,821.00Total Funding Shortfall $ 469,460.00 $ 856,025.00 $ 3,997,457.10 $ 827,658.73 $ 2,044,138.45 $ 1,668,315.98 $ 858,149.26 $ 883,653.41 $ 909,844.85 $ 1,736,740.24 $ 14,251,443.02Note: All capital improvements include new furnishing, fixtures and equipment used in new admin and maintenance facilityTBG082810024135DFB/WPB31044333184.PDF/Final Report7-15
Appendix ALower <strong>Key</strong>s Shuttle Bus Route <strong>Development</strong> andOperational AnalysisTBG082810024135DFB/WPB31044333184.PDF/Final Report
TBG082810024135DFB/WPB31044333181.PDF/Final Report
TBG082810024135DFB/WPB31044333181.PDF/Final Report
TBG082810024135DFB/WPB31044333181.PDF/Final Report
TBG082810024135DFB/WPB31044333181.PDF/Final Report
TBG082810024135DFB/WPB31044333181.PDF/Final Report
TBG082810024135DFB/WPB31044333181.PDF/Final Report
TBG082810024135DFB/WPB31044333181.PDF/Final Report
TBG082810024135DFB/WPB31044333181.PDF/Final Report
TBG082810024135DFB/WPB31044333181.PDF/Final Report
TBG082810024135DFB/WPB31044333181.PDF/Final Report
TBG082810024135DFB/WPB31044333181.PDF/Final Report
TBG082810024135DFB/WPB31044333181.PDF/Final Report
TBG082810024135DFB/WPB31044333181.PDF/Final Report
TBG082810024135DFB/WPB31044333181.PDF/Final Report
TBG082810024135DFB/WPB31044333181.PDF/Final Report
TBG082810024135DFB/WPB31044333181.PDF/Final Report
TBG082810024135DFB/WPB31044333181.PDF/Final Report
TBG082810024135DFB/WPB31044333181.PDF/Final Report
TBG082810024135DFB/WPB31044333181.PDF/Final Report
TBG082810024135DFB/WPB31044333181.PDF/Final Report
TBG082810024135DFB/WPB31044333181.PDF/Final Report
TBG082810024135DFB/WPB31044333181.PDF/Final Report
TBG082810024135DFB/WPB31044333181.PDF/Final Report
TBG082810024135DFB/WPB31044333181.PDF/Final Report
TBG082810024135DFB/WPB31044333181.PDF/Final Report
TBG082810024135DFB/WPB31044333181.PDF/Final Report
TBG082810024135DFB/WPB31044333181.PDF/Final Report
TBG082810024135DFB/WPB31044333181.PDF/Final Report
TBG082810024135DFB/WPB31044333181.PDF/Final Report
TBG082810024135DFB/WPB31044333181.PDF/Final Report
TBG082810024135DFB/WPB31044333181.PDF/Final Report
TBG082810024135DFB/WPB31044333181.PDF/Final Report
TBG082810024135DFB/WPB31044333181.PDF/Final Report
TBG082810024135DFB/WPB31044333181.PDF/Final Report
TBG082810024135DFB/WPB31044333181.PDF/Final Report
TBG082810024135DFB/WPB31044333181.PDF/Final Report
TBG082810024135DFB/WPB31044333181.PDF/Final Report
TBG082810024135DFB/WPB31044333181.PDF/Final Report
TBG082810024135DFB/WPB31044333181.PDF/Final Report
TBG082810024135DFB/WPB31044333181.PDF/Final Report
TBG082810024135DFB/WPB31044333181.PDF/Final Report
TBG082810024135DFB/WPB31044333181.PDF/Final Report
TBG082810024135DFB/WPB31044333181.PDF/Final Report
TBG082810024135DFB/WPB31044333181.PDF/Final Report
TBG082810024135DFB/WPB31044333181.PDF/Final Report
TBG082810024135DFB/WPB31044333181.PDF/Final Report
TBG082810024135DFB/WPB31044333181.PDF/Final Report
TBG082810024135DFB/WPB31044333181.PDF/Final Report
TBG082810024135DFB/WPB31044333181.PDF/Final Report
TBG082810024135DFB/WPB31044333181.PDF/Final Report
TBG082810024135DFB/WPB31044333181.PDF/Final Report
TBG082810024135DFB/WPB31044333181.PDF/Final Report
TBG082810024135DFB/WPB31044333181.PDF/Final Report
TBG082810024135DFB/WPB31044333181.PDF/Final Report
TBG082810024135DFB/WPB31044333181.PDF/Final Report
TBG082810024135DFB/WPB31044333181.PDF/Final Report
TBG082810024135DFB/WPB31044333181.PDF/Final Report
TBG082810024135DFB/WPB31044333181.PDF/Final Report
TBG082810024135DFB/WPB31044333181.PDF/Final Report
TBG082810024135DFB/WPB31044333181.PDF/Final Report
TBG082810024135DFB/WPB31044333181.PDF/Final Report
TBG082810024135DFB/WPB31044333181.PDF/Final Report
TBG082810024135DFB/WPB31044333181.PDF/Final Report
TBG082810024135DFB/WPB31044333181.PDF/Final Report
TBG082810024135DFB/WPB31044333181.PDF/Final Report
TBG082810024135DFB/WPB31044333181.PDF/Final Report
TBG082810024135DFB/WPB31044333181.PDF/Final Report
TBG082810024135DFB/WPB31044333181.PDF/Final Report
TBG082810024135DFB/WPB31044333181.PDF/Final Report
TBG082810024135DFB/WPB31044333181.PDF/Final Report
TBG082810024135DFB/WPB31044333181.PDF/Final Report
TBG082810024135DFB/WPB31044333181.PDF/Final Report
TBG082810024135DFB/WPB31044333181.PDF/Final Report
TBG082810024135DFB/WPB31044333181.PDF/Final Report
TBG082810024135DFB/WPB31044333181.PDF/Final Report
TBG082810024135DFB/WPB31044333181.PDF/Final Report
TBG082810024135DFB/WPB31044333181.PDF/Final Report
TBG082810024135DFB/WPB31044333181.PDF/Final Report
TBG082810024135DFB/WPB31044333181.PDF/Final Report
TBG082810024135DFB/WPB31044333184.PDF/Final ReportAppendix BPublic Involvement
KEY WEST, FLORIDATRANSIT DEVELOPMENT PLAN<strong>2010</strong> - 2019Public Involvement <strong>Plan</strong>September 2009Prepared byThe <strong>Key</strong> <strong>West</strong> Department of Transportation627 Palm Avenue<strong>Key</strong> <strong>West</strong>, Florida 33041-1409TBG082810024135DFB/WPB31044333182.PDF/Final Report
1.0 IntroductionThe <strong>Transit</strong> <strong>Development</strong> <strong>Plan</strong> (TDP) is the strategic guide for public transportationin <strong>Key</strong> <strong>West</strong> over the next ten years. The TDP includes an evaluation of existingservices, a review of demographic and travel behavior characteristics of the servicearea, a summary of local transit policies, the development of proposed transitenhancements, and the preparation of a ten-year implementation plan that providesguidance for <strong>Key</strong> <strong>West</strong> Department of Transportation (KWDOT) during the ten-yearplanning horizon. The TDP concludes with a ten-year financial plan (projected costsand revenues) based on the ten-year implementation plan.2.0 Project Description<strong>Key</strong> <strong>West</strong> is the southernmost city in the United States and serves as a gateway tothe Caribbean, between the Atlantic Ocean and the Gulf of Mexico. It is 150 milessouthwest of Miami and 90 miles north of Cuba. It is approximately 2 miles by 4miles wide and has a total area of 7.4 square miles. Its northern counterpart StockIsland has a total area of 5.8 square miles. U.S. 1 provides the only land access (via42 bridges) to <strong>Key</strong> <strong>West</strong> from mainland Florida.<strong>Key</strong> <strong>West</strong> along with its beauty, history and civilities attract a large number ofvisitors each year, with the peak in the winter months. <strong>Key</strong> <strong>West</strong> has also be<strong>com</strong>e amajor destination for cruise ships. Residents and visitors enjoy spending time atarea beaches such as Higgs Beach and Smathers Beach. In addition, fishing,snorkeling, SCUBA diving and sight seeing are favorite pastimes. The island alsooffers attractions such as the old Town historic area as well as an active nightlife.3.0 Public Involvement GoalsThe KWDOT created this Public Involvement <strong>Plan</strong> (PIP or <strong>Plan</strong>) to provideguidelines for establishing and maintaining optimum public involvement withassessment tools to evaluate the effectiveness of the TDP. Exemplary publicinvolvement begins early in the planning process and continues throughout each ofthe plan stages, helping to avoid, minimize, and mitigate project impacts whileproviding the best engineering and operational solutions.The objectives of the KWDOT’s Public Involvement <strong>Plan</strong> are to:Inform the public of transportation meetings and other events.Educate the public regarding KWDOT’s vision and orientation towards the futureand their role in the transit planning and decision-making process.TBG082810024135DFB/WPB31044333182.PDF/Final Report1
Solicit the public by providing opportunities early and often in the transit planningand decision-making process.Reach out to all residents and businesses in the planning area to inform, educate,and integrate public feedback; with special emphasis on those <strong>com</strong>munities withpeople who have been underrepresented and/or underserved.Monitor and Improve the public involvement process.4.0 <strong>Transit</strong> <strong>Development</strong> <strong>Plan</strong> (TDP)The TDP is an unconstrained document that is a guide to capital and operationalimprovements of the <strong>Key</strong> <strong>West</strong> transit system. The state of Florida requires all transitproperties receiving Public <strong>Transit</strong> Block Grants to prepare a 10-year TDP withannual updates.The key elements of the TDP include prior ac<strong>com</strong>plishments, revisions for theup<strong>com</strong>ing year and financial projections. It is an integral part of the City’stransportation system. <strong>Key</strong> <strong>West</strong> has its own unique transit needs, plans and visionsand it is our responsibility to assist them in achieving their goals.This transit planning process will create an integrated and balanced transit systemthat is the priority of the City. By including transit and transit related projects (i.e.sidewalks, bus shelters and bus benches) in formal documents we are reinforcing theimportance and priority of these projects. The goals of transit are to make transitfinancially feasible and create an environment that contributes to the riders’ qualityof life by making transit an attractive and flexible alternative to private automobiles.5.0 Data Collection/Identification of Affected PublicsThis activity <strong>com</strong>mences at the outset of the project and continues throughout, as theproject database will be constantly expanding to include persons as they be<strong>com</strong>eknown to the PIP teams. Gathering of e-mail addresses and fax numbers will becritical, because mailing of all meeting notices is infeasible due to the exceptionallylarge number of individuals living or working within the study area. Our team willgather contact information on elected officials, agencies, civic organizations,property owners and business operators within its respective route. Representativesof homeowner and <strong>com</strong>munity groups and major business interests within the studycorridor will be identified and included in the project database. Lists of those whouse the <strong>Key</strong> <strong>West</strong> transit services include;TBG082810024135DFB/WPB31044333182.PDF/Final Report2
• Students• Tourists• Hourly workers• Senior citizens• General public at-largeEvery effort will be made, including passing out invitation cards to those using theservices to inform them of all the public meetings. Individuals within each groupwill be identified and added to the project database. Some of these groups are:• Community Discussion Groups• Monroe County <strong>Plan</strong>ning Commission• <strong>Key</strong> <strong>West</strong> City Commission• Business leaders• General public6.0 Outreach ActivitiesInformation on the project will be presented at scheduled public meetings by thestudy technical team. They will be assisted by the PIP team, whom will schedulemeetings, secure meeting rooms that meet ADA access requirements; arrange forsecurity as needed; assist in creating announcement flyers to be distributed alongthe routes and transmitted electronically; prepare and distribute media advisoriesand public service announcements; prepare agendas in consultation with thetechnical team; staff sign-in tables; and take and distribute meeting minutes.A. Project Advisory Committee (PAC) MeetingsThere will be three of these meetings. Invitations will be sent via e-mail. This<strong>com</strong>mittee will be used to provide general oversight of the project and insure thatdecisions made are representative of and meet City of <strong>Key</strong> <strong>West</strong> requirements. PACmeetings will be held to inform of the project kick-off and address schedule anddeliverable requirements.It is anticipated that this group will include:Mayor & CommissionersCity ManagerAsst. City ManagerPort Operations Director-<strong>Plan</strong>ning DirectorCommunity Services DirectorFinance DirectorKWDOT SuperintendentTBG082810024135DFB/WPB31044333182.PDF/Final Report3
KWDOT Project & Grants ManagerKWDOT DirectorFDOT PTO OfficeB. Community Discussion Group (CDG) MeetingsThere will be three of these meetings. Invitations printed on City letterhead andsigned by the Director of KWDOT will be e-mailed to the list <strong>com</strong>piled by the PIPTeam.The purpose of the meetings is to acquaint relevant interest groups such asbusinesses, <strong>com</strong>munity associations, social service agencies, local governmentplanning departments, economic development interests, tourist industryrepresentatives and education representatives with the project and the study team,and to explain the proposed schedule, major issues, alternatives to be consideredand how their support may be needed. The meetings will be an informal review ofintent and purpose of the project followed by an open discussion. Comments will bedocumented in meeting minutes.Invitees will also be provided with a questionnaire that will enable them to provideinitial feedback about the project. The survey will enable participants to provideadditional information relevant to their individual interests. Once a set of proposalsand re<strong>com</strong>mendations has been put forth to the KWDOT, CDG meetings will beheld to allow the interest groups <strong>com</strong>munity to respond to those proposals and toprovide feedback on the development of the TDP.It is anticipated that this group will include:Environmental Engineer (City of <strong>Key</strong> <strong>West</strong> General Services)Director of Monroe County Social Services (disabled door to door provider)LCB / CTC (Guidance Clinic of the Middle <strong>Key</strong>s)Select <strong>Key</strong>s <strong>Transit</strong> RidersSouth Florida Work Force (local office)Florida <strong>Key</strong>s Healthy StartCity of Marathon City ManagerMonroe County AdministratorHistoric Tours of America / trains, trolleys<strong>Key</strong>s Shuttle (based in Marathon)Taxi Companies (<strong>Key</strong> <strong>West</strong> to Marathon)This outreach is important at the beginning of the study because relevant interestgroups need to learn of the project firsthand, and not by hearing about it once it is inTBG082810024135DFB/WPB31044333182.PDF/Final Report4
full swing. At some point during the project these groups will be asked to endorse orsupport it as it moves forward.C. Public WorkshopsThere will be two of these workshops. A first workshop will be 3 weeks after theCDG meeting. Fliers e-mail and handouts along with posters and notices placedaround town, in buses, etc. will announce the meetings. They will be held after thereis an initial awareness of the project and after the project database has beendeveloped. All of those listed as part of the PAC and CDG along with the public atlarge will also be invited to participate.At the first meeting the initial purpose and need will be presented for the public toreview and offer <strong>com</strong>ments. The second meeting will offer the goals and objectivesdeveloped for the TDP as they have been refined during the course of the study, andagain the public can review them and offer <strong>com</strong>ments.The meetings will begin with an informal review of project illustrations (ifnecessary) followed by a PowerPoint presentation and open discussion. Commentswill be documented in meeting minutes.D. One-on-One MeetingsThe CDG and Public workshops will be supplemented with a series of one-on-onemeetings with individuals, <strong>com</strong>munity leaders and key local officials as needed.These one-on-one meetings will provide a means of outlining the study progressand issues, as well as providing an opportunity to begin to garner their support.Issues, concerns, and interests expressed by these individuals during these one-ononemeetings will be summarized and presented to the study team for its use indeveloping the TDP. The one-on-one meetings will be chronicled in summaryfashion. Depending upon releases provided by individuals, quotes may be providedin these reports.7.0. Evaluation of Public Involvement ProgramMembers of the Public Involvement Team will exchange information on the<strong>com</strong>ments and re<strong>com</strong>mendations which emerge as the study unfolds. At theconclusion of each major public involvement activity, a close-out action item list willbe produced which will serve as an ongoing update to address <strong>com</strong>ments andre<strong>com</strong>mendations conveyed by the public.TBG082810024135DFB/WPB31044333182.PDF/Final Report5
8.0 DeliverablesThe Public Involvement Team will conduct meetings as described herein. Followingvarious outreach events, team members will submit reports, summaries or meetingminutes as appropriate. The final deliverables will include the PIP and input into theTDP in Section 3 under Public Involvement activities as well as meeting minutes aspart of the appendices.Other associated deliverables will include:o Project Databaseo Meeting materials and noticeso Meeting notices/invitation letterso Invitation flyers for distribution via e-mailo Display ads/meeting noticeso Public Service Announcementso Agendaso Sign-in sheetso Nametagso Meeting directional signs/posterso Comment cardso Interview meeting summarieso Meeting reports/minutes9.0 Outreach ScheduleOUTREACH ACTIVITY SCHEDULE (subject to change)Develop CDG and PACDetermine Public Workshop (PW) LocationConduct PAC Meeting #1Conduct CDG Meeting #1Conduct PAC Meeting #2Conduct CDG Meeting #2Conduct PW Meeting #1Approve TDP By City CommissionConduct PW Meeting #2Conduct CDG Meeting #3Conduct PAC Meeting #3Meet with individuals10-Sep10-Sep24-Sep8-Oct22-Oct29-Oct12-Nov1-Dec9-Dec15-Dec16-DecOn-goingTBG082810024135DFB/WPB31044333182.PDF/Final Report6
TBG082810024135DFB/WPB31044333182.PDF/Final Report
Public WorkshopNovember 18, 2009TBG082810024135DFB/WPB31044333182.PDF/Final Report
What is a TDP?• TDP means <strong>Transit</strong> <strong>Development</strong> <strong>Plan</strong>• It’s a tool to PLAN a 10-Year Horizon forKWDoT’s <strong>Transit</strong> System• It serves as the basis for defining publictransit needs which is the prerequisite toreceive State and Federal funds $$$$$$$TBG082810024135DFB/WPB31044333182.PDF/Final Report
<strong>2010</strong>-2019 2019 TDP• Draft ReportTBG082810024135DFB/WPB31044333182.PDF/Final Report
PI Objectives-Why Are You Here?• Educate and present information• Solicit public input• Integrate public feedback into the TDP• Monitor and improve the PI process for thenext 10 yearsTBG082810024135DFB/WPB31044333182.PDF/Final Report
What will the TDP do?• It will define Public Transportation Needs• It will solicit input by coordinating with other plans• It will invoke public participation• It will explore <strong>com</strong>munity goals with decision makersand stake holders• It will develop alternative courses of action• It will develop a systematic plan and monitoringprogramTBG082810024135DFB/WPB31044333182.PDF/Final Report
City of <strong>Key</strong> <strong>West</strong> Demographics• Population has decreased by 12.2% sincethe 2000 US Census• Tourism has dropped by 0.5 Mil Visitors• Service population thru Marathon hasdropped by 10%• 19% of the <strong>Key</strong> <strong>West</strong> Population does notown an automobile as <strong>com</strong>pared to 6% forthe state of FloridaTBG082810024135DFB/WPB31044333182.PDF/Final Report
<strong>Key</strong> <strong>West</strong> Tourism Stats (5 Years)• Cruise Ship Passengers 1,067,222(26.4%)• <strong>Key</strong> <strong>West</strong> Passenger Arrivals (Airport)222,198(23.8%)• Total Annual Visitors 2,254,055(17.0%)TBG082810024135DFB/WPB31044333182.PDF/Final Report
KWT Trend AnalysisTBG082810024135DFB/WPB31044333182.PDF/Final Report
How does KWT <strong>com</strong>pare?• Peer Review Analysis– Service Area– Annual Passenger Trips– Directly Operated Buses– Service Area Population• Laguna Beach Municipal <strong>Transit</strong>• Johnson City <strong>Transit</strong>• City of Union <strong>Transit</strong>• City of Ocala (SunTran)• Polk County <strong>Transit</strong> ServiceTBG082810024135DFB/WPB31044333182.PDF/Final Report
Peer Review Service EfficiencyTBG082810024135DFB/WPB31044333182.PDF/Final Report
Peer Review Service EffectivenessTBG082810024135DFB/WPB31044333182.PDF/Final Report
Farebox Recovery-The National Standard• Farebox Recovery is the ratio of bus faresover operating costs• The National Average is 26.61% for bussystems• The best are NYC, Wash. DC and Chicagoat 40% to 50%• The worst are Dallas, Detroit and Clevelandat 10% to 14%TBG082810024135DFB/WPB31044333182.PDF/Final Report
Peer Review Farebox RecoveryTBG082810024135DFB/WPB31044333182.PDF/Final Report
Farebox Recovery-The Vicious CycleTBG082810024135DFB/WPB31044333182.PDF/Final Report
The Beneficial CircleTBG082810024135DFB/WPB31044333182.PDF/Final Report
KWT Farebox Recovery• Gross Farebox- 16.2%• Net Farebox (After including other nonsubsidizedrevenues)- 32.19%TBG082810024135DFB/WPB31044333182.PDF/Final Report
Measures of Bus <strong>Transit</strong> Efficiency• Operating Expense per Revenue VehicleMile– KWT $4.18, $8.70NA, $4.93PEER• Operating Expense per passenger trip– KWT $6.44, $3.18NA, $4.13PEER• Passenger Trips Per Vehicle Mile– KWT 0.64, 0.25 NA, 0.36PEERTBG082810024135DFB/WPB31044333182.PDF/Final Report
How to Improve PerformanceMeasures- Re<strong>com</strong>mendation #1• Utilize Synchromatics software system usedby KwDOT for tracking passenger counts• Quarterly Monitoring Program to TrackPerformance Measures• Continue Operating Existing Fixed BusRoutesTBG082810024135DFB/WPB31044333182.PDF/Final Report
How to Improve PerformanceMeasures- Re<strong>com</strong>mendation #2• Comprehensive Operations Analysis(COA) – A <strong>com</strong>prehensive operationsanalysis would review all KwDOT servicesand provide information on serviceefficiencies, route performance and overalloperations. This analysis should be donewithin the next 5-year horizon after allSynchromatics data is validatedTBG082810024135DFB/WPB31044333182.PDF/Final Report
Bus Fleet• Consists of 16 Buses• Vehicles average over 5 Years of Age• Will Need to be replaced over Next 10 Years• Should try to balance mileage betterTBG082810024135DFB/WPB31044333182.PDF/Final Report
Bus Fleet - Re<strong>com</strong>mendation #3• New Buses Required as early as 2012• Estimated Fleet Replacement Cost $6.0M by2019• Develop Bus Replacement Program Early-On and Apply for FTA FundingTBG082810024135DFB/WPB31044333182.PDF/Final Report
Fleet Maintenance SurveyTBG082810024135DFB/WPB31044333182.PDF/Final Report
Maintenance Facility ImprovementsRe<strong>com</strong>mendation #4• Construct New Operating, Maintenance andAdmin Facility – Estimate $7.0M• Temporarily Improve Bus Lift– Cover with Canopy, or– Move Inside Current Facility• Temporarily Upgrade Service PIT– Permanent Waste Oil PumpTBG082810024135DFB/WPB31044333182.PDF/Final Report
Customer Survey Results• Riders using the <strong>Key</strong> <strong>West</strong> transit system towork consisted of 74 percent of the users• 37 percent of the users did not own motorvehicles• Riders used the system on average 5.03days per weekTBG082810024135DFB/WPB31044333182.PDF/Final Report
Customer Survey Results (Con(Con’t)• Over 85% walk to/from the bus stop• 75% of the users are less than three-eighths of milefrom their stop• Approximately one-third of the riders surveyed hadother transportation options• 56% of the current users have been utilizing the <strong>Key</strong><strong>West</strong> bus service and Lower <strong>Key</strong>s Shuttle for morethan 1 yearTBG082810024135DFB/WPB31044333182.PDF/Final Report
Customer Survey Results (Con(Con’t)• 85% of the users rated transit service asgood or better• 0 percent of the users rated transit service aspoor• Number One improvement request was lesswait times (45%)TBG082810024135DFB/WPB31044333182.PDF/Final Report
Customer Survey-Re<strong>com</strong>mendation #6• Examine reducing bus headways (less waittime) in Alternatives Analysis• Investigate operating peak season enhancedschedulesTBG082810024135DFB/WPB31044333182.PDF/Final Report
How To Improve RidershipRe<strong>com</strong>mendation #7• Develop a Community Outreach andEducation Program• Commuter Assistance Programs– Partner with Businesses and Chamber to OfferIncentives for using <strong>Transit</strong>– Promote Employer-Provided Subsidies• Increase Frequencies on the Fixed-RouteSystemTBG082810024135DFB/WPB31044333182.PDF/Final Report
Alternatives Analysis• Reviewing Pre-October KWT bus schedule 6Routes• Determining the Impact of reducing waittimes• Reviewing Current KWT bus schedule 4Routes• Determining the Impact of reducing waittimesTBG082810024135DFB/WPB31044333182.PDF/Final Report
10 Year Financial Outlook• Additional Capital Improvements– New Buses-$6.0 Mil– New Admin & O&M Facility-$7.0 Mil• Operating Costs-$32.0 Mil• Anticipated Revenues-$31.8 Mil• Additional Funding Required-$13.0 MilTBG082810024135DFB/WPB31044333182.PDF/Final Report
New Funding RequirementsRe<strong>com</strong>mendation #8• Work with FDOT “early on” to secureadditional or new funding sources• Apply for FTA Grants for bus fleet upgrades• Hire financial consultant that specializes intransit funding opportunitiesTBG082810024135DFB/WPB31044333182.PDF/Final Report
Who Approves the TDP?• City of <strong>Key</strong> <strong>West</strong> City Commission• Florida Department of Transportation• PTO Office (Public Transportation Office)– 60 Days for approval• Due by September 1 st of the State FiscalYear (extension to end of 2009)• Annual Updates are RequiredTBG082810024135DFB/WPB31044333182.PDF/Final Report
How Can You Help?• We want to solicit your input• We want you involved in the decision makingprocess• We want your feedback in our observationsand re<strong>com</strong>mendations• We want you to support our planTBG082810024135DFB/WPB31044333182.PDF/Final Report
Any Questions?THANK YOU!!!!TBG082810024135DFB/WPB31044333182.PDF/Final Report
<strong>Key</strong> <strong>West</strong> <strong>Transit</strong> FY <strong>2010</strong>-FY 2019 TDP InterviewQuestions (November 18, 2009 Workshop)(1) Are you currently aware of <strong>Key</strong> <strong>West</strong> <strong>Transit</strong> System and its services?(2) Is the public perception of KWT good, satisfactory, or poor?(3) Is there a need for additional transit service in the Lower keys and <strong>Key</strong> <strong>West</strong>?(4) What type of transit services would you like to see more of in the <strong>Key</strong> <strong>West</strong> area?(More Frequent Fixed-Route, Express Bus, Trolley, Demand Response, IncreasedWeekend Service, Late Evening Service)?(5) Are you willing to pay additional local taxes for an expanded transit system?(6) What are reasonable passenger fares for transit service: (please specify per trip orother)(7) Who do you believe uses the transit system? (Worker, Students, Unemployed,Elderly, Tourists/Visitors)TBG082810024135DFB/WPB31044333182.PDF/Final Report1
(8) What do you believe is the purpose of most transit trips?(Medical, Shopping recreation, Work, School)(9) Do you use KWT? Why? Why not?(10) What do you think are the most significant issues facing automobiletravelers? Do you use KWT? Why? Why not?(11) What do you think are the most significant issues facing transit users?(12) What group of travelers seems to experience the most difficult transportationconditions (disabled, low-in<strong>com</strong>e, elderly, <strong>com</strong>muters, etc)? Why?(13) Do you believe there is a traffic congestion problem in <strong>Key</strong> <strong>West</strong>? (If Yes, goto the next question, if No skip to question 20).(14) Do you believe that public transportation can relieve congestion in key <strong>West</strong>?TBG082810024135DFB/WPB31044333182.PDF/Final Report2
(15) What efforts or initiatives are you aware of that have been undertaken in thelast five years to address traffic congestion in the region (locally)?(16) (Of those listed above) Which would you describe as having been successfuland why?(17) (Of those listed above) Which would you describe as having beenunsuccessful and why?(18) What efforts would you like to see undertaken, to address traffic congestionin the region?(19) What are the major destinations within your immediate <strong>com</strong>munity?(20) What are the major destinations outside of your <strong>com</strong>munity where people aretraveling to, from your area?TBG082810024135DFB/WPB31044333182.PDF/Final Report3
(21) What additional steps do you feel should be taken to increase the use ofpublic transit?(21) Any other <strong>com</strong>ments?TBG082810024135DFB/WPB31044333182.PDF/Final Report4
ENGLISH<strong>Key</strong> <strong>West</strong> and Lower <strong>Key</strong>s Shuttle Ridership SurveyPlease CIRCLE your response. Please use BEST FIT answers. 1 2 3 4Please answer ALL 11 questions- INCOMPLETE SURVEYS WILL NOT BE COUNTED1: What route do you primarily take?<strong>Key</strong> <strong>West</strong>: Blue Red Green OrangeLower <strong>Key</strong>s: Aqua Lime2: What is the main purpose of your trip?Work School Shopping Medical Other3: Why do you take the bus?I don’t have a drivers license I don’t have a car Bus is more convenient4: How many times per week do you use the bus for transportation?1 2 3 4 5 6 75: What mode of transportation do you use to get to or from the bus stop?Auto Scooter Bicycle Walk Other6: How far do you travel to reach the bus stop?Less than 1 block 1 to 3 blocks 3 to 5 blocks More than 5 blocks7: Do you have other transportation options? Yes No If yes what option?Auto Motor Cycle Scooter Bicycle OtherPlease see questions on next page…. Page 1 of 2TBG082810024135DFB/WPB31044333182.PDF/Final Report
8: How long have you been using the <strong>Key</strong> <strong>West</strong> or Lower <strong>Key</strong>s Shuttle Service?Less than one month 1 to 6 months 6 to 12 months1 to 3 years More than 3 years9: How would you rate our bus service?Excellent Good Fair Poor10: Are more bus routes needed?YesNo11: What type of service improvements would you like to see?Less wait time More routes More stop locations NoneComments: _____________________________________________________________________________________________________________________________________________________________________________________________________________________________________________________________________________________________________________________________________________________________________________________________________________________________________________________Thank you for your time. Page 2 of 2TBG082810024135DFB/WPB31044333182.PDF/Final Report2
Estudio del Número de Usuarios del TransportePúblico en Cayo Hueso y los Cayos BajosPor favor, marquee su repuesta. 1 2 3 4Por favor responda a TODAS las 11 preguntas - PAPELES INCOMPLETOS NO SERANCONTADAS1: ¿Qué ruta principalmente toma usted?Cayo Hueso: Azul Roja Verde AnaranjadaCayos Bajos: Aqua Limon2: ¿Cuál es el objetivo principal de su viaje?Trabajo Escuela De <strong>com</strong>pras Medical Otro3: : ¿Por qué toma usted el autobús?No tengo licencia de manejar No tengo carro Es más conveniente4: ¿Cuántas veces por semana usa el autobús para el transporte?1 2 3 4 5 6 75: ¿Qué modo de transporte utiliza usted para llegar a, o ir de, la parada de autobús?Carro Vespa Bicicleta Caminar Otro6: ¿Qué distancia viaja usted para llegar a la parada de autobús?Menos de una cuadra De 1 a 3 cuadras De 3 a 5 cuadras Más de 5 cuadras7: ¿Tiene otras opciones de transporte? Sí No Si usted respondio sí, qué opcion?Carro Vespa Bicicleta Caminar OtroPor favor vea las preguntas en la proxima pagina….Página 1 de 2TBG082810024135DFB/WPB31044333182.PDF/Final Report
8: ¿Por cuánto tiempo ha usado el transporte público in Cayo Hueso o los CayosBajos?Menos de un mes De 1 a 6 meses De 6 a 12 mesesDe 1 a 3 anosMás de 3 anos9: ¿Cómo calificaría nuestro servicio de autobús?Excelente Bueno Fair pobre10: ¿Piensa que más rutas de autobús son necesarias?SíNo11: ¿Cómo se puede mejorar nuestro servicio de autobús?Esperar menos tiempo Más rutas Más paradas No se puede mejorar el servicioComentarios: _____________________________________________________________________________________________________________________________________________________________________________________________________________________________________________________________________________________________________________________________________________________________________________________________________________________________________________________Gracias por su tiempo.Página 2 de 2TBG082810024135DFB/WPB31044333182.PDF/Final Report2
<strong>Key</strong> <strong>West</strong> 2009-2019 TDP Bus Operator SurveyPlease answer ALL 8 questions1: What route do you primarily operate?______________________________________________________________________2: How long have you been a bus operator for KWDoT?______________________________________________________________________3: What are the most frequent <strong>com</strong>plaints you hear from passengers?-------------------------------------------------------------------------------------------------_____________________________________________________________________________________________________________________________________________________________________________________________________________________________________________________________________________________________________________________________________4: Is their adequate run time in your route to meet the published bus schedules?______ If not, where is more time needed?____________________________________________________________________________________________________________________________________________________________________________________________________________________________________________________________________5: How do you suggest improving bus scheduling?___________________________________________________________________________________________________________________________________________________________________________________________________TBG082810024135DFB/WPB31044333182.PDF/Final ReportPage 1 of 2
6: Are more pedestrian enhancements such as shelters, signs, etc. needed?______ If yes, please list specific locations?__________________________________________________________________________________________________________________________________7: Are there any safety improvements re<strong>com</strong>mended for both drivers and /orpassengers?___________________________________________________________________________________________________________________________________________________________________________________________________8: How do you think KWDoT can improve its service?-------------------------------------------------------------------------------------------------_____________________________________________________________________________________________________________________________________________________________________________________________________________________________________________________________________________________________________________________________________Thank you for your time. Page 2 of 2TBG082810024135DFB/WPB31044333182.PDF/Final Report2
TBG082810024135DFB/WPB31044333184.PDF/Final ReportAppendix CMonroe County Mass <strong>Transit</strong> Element
TBG082810024135DFB/WPB31044333183.PDF/Final Report
TBG082810024135DFB/WPB31044333183.PDF/Final Report
TBG082810024135DFB/WPB31044333183.PDF/Final Report
TBG082810024135DFB/WPB31044333183.PDF/Final Report
TBG082810024135DFB/WPB31044333183.PDF/Final Report
TBG082810024135DFB/WPB31044333183.PDF/Final Report
TBG082810024135DFB/WPB31044333183.PDF/Final Report
TBG082810024135DFB/WPB31044333183.PDF/Final Report
TBG082810024135DFB/WPB31044333183.PDF/Final Report
TBG082810024135DFB/WPB31044333183.PDF/Final Report
TBG082810024135DFB/WPB31044333183.PDF/Final Report
TBG082810024135DFB/WPB31044333183.PDF/Final Report
TBG082810024135DFB/WPB31044333183.PDF/Final Report
TBG082810024135DFB/WPB31044333183.PDF/Final Report
TBG082810024135DFB/WPB31044333183.PDF/Final Report
TBG082810024135DFB/WPB31044333183.PDF/Final Report
TBG082810024135DFB/WPB31044333183.PDF/Final Report
TBG082810024135DFB/WPB31044333183.PDF/Final Report