

Planck Pre-Launch Status Papers - APC - Université Paris Diderot ...
Planck Pre-Launch Status Papers - APC - Université Paris Diderot ...
Planck Pre-Launch Status Papers - APC - Université Paris Diderot ...

Create successful ePaper yourself
Turn your PDF publications into a flip-book with our unique Google optimized e-Paper software.
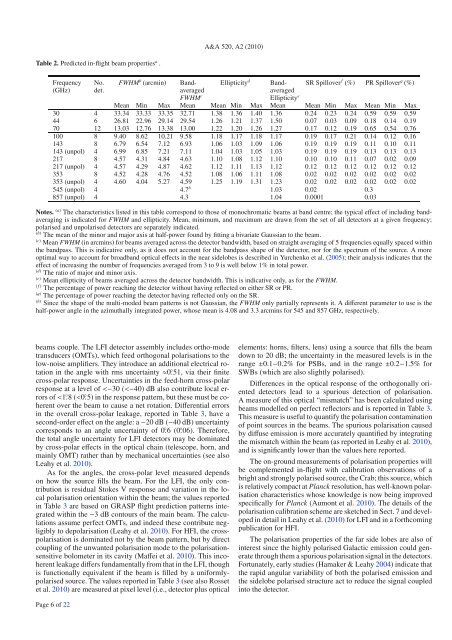
A&A 520, A2 (2010)Table 2. <strong>Pre</strong>dicted in-flight beam properties a .Ellipticity d BandaveragedSR Spillover f (%) PR Spillover g (%)Frequency No. FWHM b (arcmin) BandaveragedFWHM c Ellipticity e(GHz) det.Mean Min Max Mean Mean Min Max Mean Mean Min Max Mean Min Max30 4 33.34 33.33 33.35 32.71 1.38 1.36 1.40 1.36 0.24 0.23 0.24 0.59 0.59 0.5944 6 26.81 22.96 29.14 29.54 1.26 1.21 1.37 1.50 0.07 0.03 0.09 0.18 0.14 0.1970 12 13.03 12.76 13.38 13.00 1.22 1.20 1.26 1.27 0.17 0.12 0.19 0.65 0.54 0.76100 8 9.40 8.62 10.21 9.58 1.18 1.17 1.18 1.17 0.19 0.17 0.21 0.14 0.12 0.16143 8 6.79 6.54 7.12 6.93 1.06 1.03 1.09 1.06 0.19 0.19 0.19 0.11 0.10 0.11143 (unpol) 4 6.99 6.85 7.21 7.11 1.04 1.03 1.05 1.03 0.19 0.19 0.19 0.13 0.13 0.13217 8 4.57 4.31 4.84 4.63 1.10 1.08 1.12 1.10 0.10 0.10 0.11 0.07 0.02 0.09217 (unpol) 4 4.57 4.29 4.87 4.62 1.12 1.11 1.13 1.12 0.12 0.12 0.12 0.12 0.12 0.12353 8 4.52 4.28 4.76 4.52 1.08 1.06 1.11 1.08 0.02 0.02 0.02 0.02 0.02 0.02353 (unpol) 4 4.60 4.04 5.27 4.59 1.25 1.19 1.31 1.23 0.02 0.02 0.02 0.02 0.02 0.02545 (unpol) 4 4.7 h 1.03 0.02 0.3857 (unpol) 4 4.3 1.04 0.0001 0.03Notes. (a) The characteristics listed in this table correspond to those of monochromatic beams at band centre; the typical effect of including bandaveragingis indicated for FWHM and ellipticity. Mean, minimum, and maximum are drawn from the set of all detectors at a given frequency;polarised and unpolarised detectors are separately indicated.(b) The mean of the minor and major axis at half-power found by fitting a bivariate Gaussian to the beam.(c) Mean FWHM (in arcmins) for beams averaged across the detector bandwidth,basedonstraightaveragingof5frequenciesequallyspacedwithinthe bandpass. This is indicative only, as it does not account for the bandpass shape of the detector, nor for the spectrum of the source. A moreoptimal way to account for broadband optical effects in the near sidelobes is described in Yurchenko et al. (2005); their analysis indicates that theeffect of increasing the number of frequencies averaged from 3 to 9 is well below 1% in total power.(d) The ratio of major and minor axis.(e) Mean ellipticity of beams averaged across the detector bandwidth. This is indicative only, as for the FWHM.( f ) The percentage of power reaching the detector without having reflected on either SR or PR.(g) The percentage of power reaching the detector having reflected only on the SR.(h) Since the shape of the multi-moded beam patterns is not Gaussian, the FWHM only partially represents it. A different parameter to use is thehalf-power angle in the azimuthally integrated power, whose meanis4.08and3.3arcminsfor545and857GHz,respectively.beams couple. The LFI detector assembly includes ortho-modetransducers (OMTs), which feed orthogonal polarisations to thelow-noise amplifiers. They introduce an additional electrical rotationin the angle with rms uncertainty ≈0. ◦ 51, via their finitecross-polar response. Uncertainties in the feed-horn cross-polarresponse at a level of


