

Planck Pre-Launch Status Papers - APC - Université Paris Diderot ...
Planck Pre-Launch Status Papers - APC - Université Paris Diderot ...
Planck Pre-Launch Status Papers - APC - Université Paris Diderot ...

You also want an ePaper? Increase the reach of your titles
YUMPU automatically turns print PDFs into web optimized ePapers that Google loves.
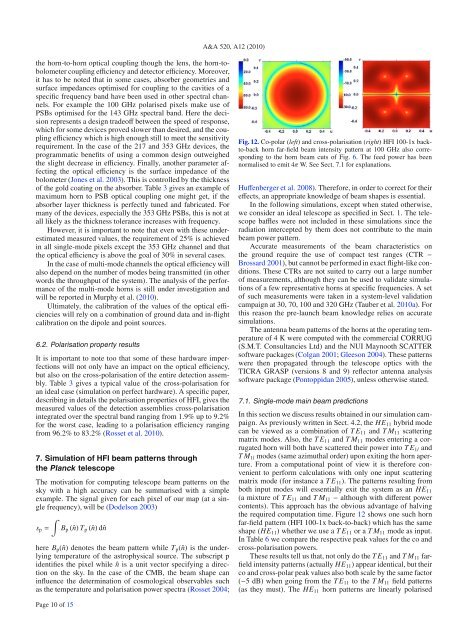
A&A 520, A12 (2010)the horn-to-horn optical coupling though the lens, the horn-tobolometercoupling efficiency and detector efficiency. Moreover,it has to be noted that in some cases, absorber geometries andsurface impedances optimised for coupling to the cavities of aspecific frequency band have been used in other spectral channels.For example the 100 GHz polarised pixels make use ofPSBs optimised for the 143 GHz spectral band. Here the decisionrepresents a design tradeoff between the speed of response,which for some devices proved slower than desired, and the couplingefficiency which is high enough still to meet the sensitivityrequirement. In the case of the 217 and 353 GHz devices, theprogrammatic benefits of using a common design outweighedthe slight decrease in efficiency. Finally, another parameter affectingthe optical efficiency is the surface impedance of thebolometer (Jones et al. 2003). This is controlled by the thicknessof the gold coating on the absorber. Table 3 gives an example ofmaximum horn to PSB optical coupling one might get, if theabsorber layer thickness is perfectly tuned and fabricated. Formany of the devices, especially the 353 GHz PSBs, this is not atall likely as the thickness tolerance increases with frequency.However, it is important to note that even with these underestimatedmeasured values, the requirement of 25% is achievedin all single-mode pixels except the 353 GHz channel and thatthe optical efficiency is above the goal of 30% in several cases.In the case of multi-mode channels the optical efficiency willalso depend on the number of modes being transmitted (in otherwords the throughput of the system). The analysis of the performanceof the multi-mode horns is still under investigation andwill be reported in Murphy et al. (2010).Ultimately, the calibration of the values of the optical efficiencieswill rely on a combination of ground data and in-flightcalibration on the dipole and point sources.6.2. Polarisation property resultsIt is important to note too that some of these hardware imperfectionswill not only have an impact on the optical efficiency,but also on the cross-polarisation of the entire detection assembly.Table 3 gives a typical value of the cross-polarisation foran ideal case (simulation on perfect hardware). A specific paper,describing in details the polarisation properties of HFI, gives themeasured values of the detection assemblies cross-polarisationintegrated over the spectral band ranging from 1.9% up to 9.2%for the worst case, leading to a polarisation efficiency rangingfrom 96.2% to 83.2% (Rosset et al. 2010).7. Simulation of HFI beam patterns throughthe <strong>Planck</strong> telescopeThe motivation for computing telescope beam patterns on thesky with a high accuracy can be summarised with a simpleexample. The signal given for each pixel of our map (at a singlefrequency), will be (Dodelson 2003)∫s p = B p (ˆn) T p (ˆn) dˆnhere B p (ˆn) denotesthebeampatternwhileT p (ˆn) istheunderlyingtemperature of the astrophysical source. The subscript pidentifies the pixel while ˆn is a unit vector specifying a directionon the sky. In the case of the CMB, the beam shape caninfluence the determination of cosmological observables suchas the temperature and polarisation power spectra (Rosset 2004;Fig. 12. Co-polar (left)andcross-polarisation(right) HFI100-1xbackto-backhorn far-field beam intensity pattern at 100 GHz also correspondingto the horn beam cuts of Fig. 6. Thefeedpowerhasbeennormalised to emit 4π W. See Sect. 7.1 for explanations.Huffenberger et al. 2008). Therefore, in order to correct for theireffects, an appropriate knowledge of beam shapes is essential.In the following simulations, except when stated otherwise,we consider an ideal telescope as specified in Sect. 1. The telescopebaffles were not included in these simulations since theradiation intercepted by them does not contribute to the mainbeam power pattern.Accurate measurements of the beam characteristics onthe ground require the use of compact test ranges (CTR −Brossard 2001), but cannot be performed in exact flight-like conditions.These CTRs are not suited to carry out a large numberof measurements, although they can be used to validate simulationsof a few representative horns at specific frequencies. A setof such measurements were taken inasystem-levelvalidationcampaign at 30, 70, 100 and 320 GHz (Tauber et al. 2010a). Forthis reason the pre-launch beam knowledge relies on accuratesimulations.The antenna beam patterns of the horns at the operating temperatureof 4 K were computed with the commercial CORRUG(S.M.T. Consultancies Ltd) and the NUI Maynooth SCATTERsoftware packages (Colgan 2001; Gleeson 2004). These patternswere then propagated through the telescope optics with theTICRA GRASP (versions 8 and 9) reflector antenna analysissoftware package (Pontoppidan 2005), unless otherwise stated.7.1. Single-mode main beam predictionsIn this section we discuss results obtained in our simulation campaign.As previously written in Sect. 4.2, the HE 11 hybrid modecan be viewed as a combination of TE 11 and TM 11 scatteringmatrix modes. Also, the TE 11 and TM 11 modes entering a corrugatedhorn will both have scattered their power into TE 1l andTM 1l modes (same azimuthal order) upon exiting the horn aperture.From a computational point of view it is therefore convenientto perform calculations with only one input scatteringmatrix mode (for instance a TE 11 ). The patterns resulting fromboth input modes will essentially exit the system as an HE 11(a mixture of TE 11 and TM 11 − although with different powercontents). This approach has the obvious advantage of halvingthe required computation time. Figure 12 shows one such hornfar-field pattern (HFI 100-1x back-to-back) which has the sameshape (HE 11 )whetherweuseaTE 11 or a TM 11 mode as input.In Table 6 we compare the respective peak values for the co andcross-polarisation powers.These results tell us that, not only do the TE 11 and TM 11 farfieldintensity patterns (actually HE 11 )appearidentical,buttheirco and cross-polar peak values also both scale by the same factor(−5 dB)whengoingfromtheTE 11 to the TM 11 field patterns(as they must). The HE 11 horn patterns are linearly polarisedPage 10 of 15


