Planck Pre-Launch Status Papers - APC - Université Paris Diderot ...
Planck Pre-Launch Status Papers - APC - Université Paris Diderot ... Planck Pre-Launch Status Papers - APC - Université Paris Diderot ...
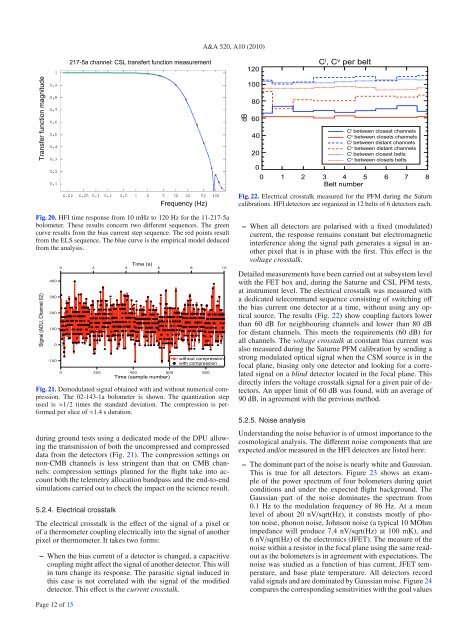
A&A 520, A10 (2010)217-5a channel: CSL transfert function measurement120C i , C v per beltTransfer function magnitudeFrequency (Hz)dB100806040200C i between closest channelsC v between closets channelsC i between distant channelsC v between distant channelsC i between closest beltsC v between closets belts0 1 2 3 4 5 6 7 8Belt numberFig. 22. Electrical crosstalk measured for the PFM during the Saturncalibrations. HFI detectors are organized in 12 belts of 6 detectors each.Fig. 20. HFI time response from 10 mHz to 120 Hz for the 11-217-5abolometer. These results concern two different sequences. The greencurve results from the bias current step sequence. The red points resultfrom the ELS sequence. The blue curve is the empirical model deducedfrom the analysis.Signal (ADU, Channel 02)Time (s)Time (sample number)without compressionwith compressionFig. 21. Demodulated signal obtained with and without numerical compression.The 02-143-1a bolometer is shown. The quantization stepused is ≈1/2 timesthestandarddeviation.Thecompressionisperformedper slice of ≈1.4 s duration.during ground tests using a dedicated mode of the DPU allowingthe transmission of both the uncompressed and compresseddata from the detectors (Fig. 21). The compression settings onnon-CMB channels is less stringent than that on CMB channels:compression settings planned for the flight take into accountboth the telemetry allocation bandpass and the end-to-endsimulations carried out to check theimpactonthescienceresult.5.2.4. Electrical crosstalkThe electrical crosstalk is the effect of the signal of a pixel orof a thermometer coupling electrically into the signal of anotherpixel or thermometer. It takes two forms:– When the bias current of a detector is changed, a capacitivecoupling might affect the signal of another detector. This willin turn change its response. The parasitic signal induced inthis case is not correlated with the signal of the modifieddetector. This effect is the current crosstalk.– When all detectors are polarised with a fixed (modulated)current, the response remains constant but electromagneticinterference along the signal path generates a signal in anotherpixel that is in phase with the first. This effect is thevoltage crosstalk.Detailed measurements have been carried out at subsystem levelwith the FET box and, during the Saturne and CSL PFM tests,at instrument level. The electrical crosstalk was measured withadedicatedtelecommandsequenceconsistingofswitchingoffthe bias current one detector at a time, without using any opticalsource. The results (Fig. 22) showcouplingfactorslowerthan 60 dB for neighbouring channels and lower than 80 dBfor distant channels. This meets the requirements (60 dB) forall channels. The voltage crosstalk at constant bias current wasalso measured during the Saturne PFM calibration by sending astrong modulated optical signal when the CSM source is in thefocal plane, biasing only one detector and looking for a correlatedsignal on a blind detector located in the focal plane. Thisdirectly infers the voltage crosstalk signal for a given pair of detectors.An upper limit of 60 dB was found, with an average of90 dB, in agreement with the previous method.5.2.5. Noise analysisUnderstanding the noise behavior is of utmost importance to thecosmological analysis. The different noise components that areexpected and/or measured in the HFI detectors are listed here:– The dominant part of the noise is nearly white and Gaussian.This is true for all detectors. Figure 23 shows an exampleof the power spectrum of four bolometers during quietconditions and under the expected flight background. TheGaussian part of the noise dominates the spectrum from0.1 Hz to the modulation frequency of 86 Hz. At a meanlevel of about 20 nV/sqrt(Hz), it constists mostly of photonnoise, phonon noise, Johnson noise (a typical 10 MOhmimpedance will produce 7.4 nV/sqrt(Hz) at 100 mK), and6nV/sqrt(Hz) of the electronics (JFET). The measure of thenoise within a resistor in the focal plane using the same readoutas the bolometers is in agreement with expectations. Thenoise was studied as a function of bias current, JFET temperature,and base plate temperature. All detectors recordvalid signals and are dominated by Gaussian noise. Figure 24compares the corresponding sensitivities with the goal valuesPage 12 of 15
F. Pajot et al.: Planck pre-launch status: HFI ground calibrationFig. 23. Noise power spectrum of three bolometers during the Saturnecalibrations: the 74-857-4, the dark 1 and the dark 2. The noise spectraldensity is shown from 10 mHz to 100 Hz, just above the modulationfrequency. The high frequency drop is due to the post-processing filtering.The low frequency noise is slightly above the white noise becauseof some 0.1 K fluctuations (for the dark bolometers) and some Saturnebackground fluctuations (for the 857 GHz bolometer).Fig. 24. Individual sensitivity of all bolometers measured during calibrationscompared to requirement and goal. The goal is twice as highas the requirement. Sensitivities are consistent with the overall missiongoals given in the Planck Blue Book (The Planck consortium 2005).(Table 1). A detailed discussion of sensitivities can be foundin Lamarre et al. (2010).– During the ground tests, the PFM bolometers receive particleimpacts at a rate varying from 1 to 20 per hour, dependingon the bolometer.– Because of the AC modulation scheme of the bolometers,we do not expect 1/ f noise from the electronics. Using the10 MOhm resistor channel, we see that this is indeed thecase for frequencies above 3 mHz. For bolometers, signalscaused by fluctuations in both the background and the baseplate temperature mimic 1/ f noise. This set an upper limit tothe noise because a stable enough state could not be reachedduring the ground-based tests.– Some of the HFI photometric pixels are affected by popcornor telegraphic noise. The signal hops from one valueto another as if in a two-level system. During the CSL campaign,the instrument being integrated in the satellite, onlytwo channels exhibiting strong telegraph noise were identified(70-143-8 and 55-545-3), while many channels wereduring the HFI PFM calibration in Orsay.– Under vibrations, the detector signal can contains microphoniclines at some specific frequencies. During the PFMtests in Saturn and at CSL, excitation was produced andfound to originate in the facilities themselves (Helium refill,cryocoolers, etc.). The only linesidentifiedasoriginatingin the satellite and instrument were due to the 4 K activecryocooler of HFI. However, these lines were dominated byEMI/EMC interferences known to originate from the driveelectronics of this cooler. These lines are very narrow becauseboth the data acquisition rate and the cooler frequencyare determined by a common clock. They are removed fromthe time domain data using a moving average template. Themicrophonic contribution is very weak, and cancelled whenthe vibration control system (VCS) of the 4 K cooler is activated.Therefore, the frequency of the 4 K cryocooler usedduring the CSL ground tests will be used during the flight.5.3. Thermal behaviour5.3.1. Static performance of the cooler and operation pointThe behaviour of the full HFI cryogenic chain could not be testedin the Saturne test cryostat because the sorption cooler and the4Kcoolerareintegratedinacomplexwayinthespacecraftandthe payload module. They all rely on the passive cooling providedby the 3rd V-groove and the warm radiator, which radiatesinto deep space the power of the sorption cooler. Tests and qualificationwere carried out at the sub-system level or with an incompletesetup for the CSL CQM tests, until the CSL PFM campaignbegan. The overall performance of the cryogenic chainwere derived from this latter campaign.The performance of the 4 K cooler concerns– the heat lift capability;– the temperature of the cold head providing the pre-coolingof the gases of the dilution cooler;as a function of the adjustable parameters– the compressors frequency;– the stroke amplitude;and the environment parameters– the pre-cooling of the helium gas by the sorption cooler;– the temperature of the base plate of the compressors.The filling pressure was chosen to be 4.5 bars. The lowest resonancefrequency of the spacecraft panel on which the compressorsare mounted is 72 Hz. We therefore chose a frequencyabove 37 Hz. The operating frequency affects the efficiency ofthe cooler (ratio of heat lift to electrical power). This efficiencyshows a broad maximum around 40 Hz. Furthermore, because ofthe failures of the lead-in wires and the change of design, the riskare minimized by selecting a frequency lower than 45 Hz. Wethus chose a frequency in the possible range between 37.41 and41.74 Hz and preferably one of the three frequencies used duringthe TV-TB tests (37.41, 40.08, and 41.74 Hz). In view of a limitedand well understood EMI-EMC and microphonics lines seenin the data (mostly generated by the CSL facility), our choice ofthe nominal frequency is 40.08 Hz. Furthermore, the frequencyPage 13 of 15
- Page 140 and 141: unmodelled long-timescale thermally
- Page 142 and 143: A&A 520, A8 (2010)Fig. 5. Polarisat
- Page 144 and 145: A&A 520, A8 (2010)Table 3. Band-ave
- Page 146 and 147: A&A 520, A8 (2010)where S stands fo
- Page 148 and 149: A&A 520, A8 (2010)Fig. 11. Simulate
- Page 150 and 151: stored in the LFI instrument model,
- Page 152 and 153: A&A 520, A8 (2010)Table 5. Statisti
- Page 154 and 155: A&A 520, A8 (2010)comparable in siz
- Page 156 and 157: A&A 520, A8 (2010)Table B.1. Main b
- Page 158 and 159: A&A 520, A8 (2010)Bond, J. R., Jaff
- Page 160 and 161: A&A 520, A9 (2010)- (v) an optical
- Page 162 and 163: A&A 520, A9 (2010)Fig. 2. The Russi
- Page 164 and 165: A&A 520, A9 (2010)Table 3. Estimate
- Page 166 and 167: A&A 520, A9 (2010)Fig. 7. Picture o
- Page 168 and 169: A&A 520, A9 (2010)Fig. 9. Cosmic ra
- Page 170 and 171: A&A 520, A9 (2010)Fig. 13. Principl
- Page 172 and 173: A&A 520, A9 (2010)Fig. 16. Noise sp
- Page 174 and 175: A&A 520, A9 (2010)Table 6. Basic ch
- Page 176 and 177: A&A 520, A9 (2010)with warm preampl
- Page 178 and 179: A&A 520, A9 (2010)20 Laboratoire de
- Page 180 and 181: A&A 520, A10 (2010)Table 1. HFI des
- Page 182 and 183: A&A 520, A10 (2010)based on the the
- Page 184 and 185: A&A 520, A10 (2010)Fig. 6. The Satu
- Page 186 and 187: A&A 520, A10 (2010)5. Calibration a
- Page 188 and 189: A&A 520, A10 (2010)Fig. 16. Couplin
- Page 192 and 193: A&A 520, A10 (2010)10 -310 -495-The
- Page 194 and 195: A&A 520, A11 (2010)DOI: 10.1051/000
- Page 196 and 197: P. A. R. Ade et al.: Planck pre-lau
- Page 198 and 199: P. A. R. Ade et al.: Planck pre-lau
- Page 200 and 201: P. A. R. Ade et al.: Planck pre-lau
- Page 202 and 203: A&A 520, A12 (2010)Table 1. Summary
- Page 204 and 205: arrangement was also constrained by
- Page 206 and 207: A&A 520, A12 (2010)frequency cut-of
- Page 208 and 209: A&A 520, A12 (2010)Fig. 9. Gaussian
- Page 210 and 211: A&A 520, A12 (2010)the horn-to-horn
- Page 212 and 213: A&A 520, A12 (2010)Fig. 15. Composi
- Page 214 and 215: A&A 520, A12 (2010)Fig. 19. Broad-b
- Page 216 and 217: A&A 520, A13 (2010)DOI: 10.1051/000
- Page 218 and 219: C. Rosset et al.: Planck-HFI: polar
- Page 220 and 221: C. Rosset et al.: Planck-HFI: polar
- Page 222 and 223: of frequencies and shown to have po
- Page 224 and 225: C. Rosset et al.: Planck-HFI: polar
- Page 226 and 227: C. Rosset et al.: Planck-HFI: polar
A&A 520, A10 (2010)217-5a channel: CSL transfert function measurement120C i , C v per beltTransfer function magnitudeFrequency (Hz)dB100806040200C i between closest channelsC v between closets channelsC i between distant channelsC v between distant channelsC i between closest beltsC v between closets belts0 1 2 3 4 5 6 7 8Belt numberFig. 22. Electrical crosstalk measured for the PFM during the Saturncalibrations. HFI detectors are organized in 12 belts of 6 detectors each.Fig. 20. HFI time response from 10 mHz to 120 Hz for the 11-217-5abolometer. These results concern two different sequences. The greencurve results from the bias current step sequence. The red points resultfrom the ELS sequence. The blue curve is the empirical model deducedfrom the analysis.Signal (ADU, Channel 02)Time (s)Time (sample number)without compressionwith compressionFig. 21. Demodulated signal obtained with and without numerical compression.The 02-143-1a bolometer is shown. The quantization stepused is ≈1/2 timesthestandarddeviation.Thecompressionisperformedper slice of ≈1.4 s duration.during ground tests using a dedicated mode of the DPU allowingthe transmission of both the uncompressed and compresseddata from the detectors (Fig. 21). The compression settings onnon-CMB channels is less stringent than that on CMB channels:compression settings planned for the flight take into accountboth the telemetry allocation bandpass and the end-to-endsimulations carried out to check theimpactonthescienceresult.5.2.4. Electrical crosstalkThe electrical crosstalk is the effect of the signal of a pixel orof a thermometer coupling electrically into the signal of anotherpixel or thermometer. It takes two forms:– When the bias current of a detector is changed, a capacitivecoupling might affect the signal of another detector. This willin turn change its response. The parasitic signal induced inthis case is not correlated with the signal of the modifieddetector. This effect is the current crosstalk.– When all detectors are polarised with a fixed (modulated)current, the response remains constant but electromagneticinterference along the signal path generates a signal in anotherpixel that is in phase with the first. This effect is thevoltage crosstalk.Detailed measurements have been carried out at subsystem levelwith the FET box and, during the Saturne and CSL PFM tests,at instrument level. The electrical crosstalk was measured withadedicatedtelecommandsequenceconsistingofswitchingoffthe bias current one detector at a time, without using any opticalsource. The results (Fig. 22) showcouplingfactorslowerthan 60 dB for neighbouring channels and lower than 80 dBfor distant channels. This meets the requirements (60 dB) forall channels. The voltage crosstalk at constant bias current wasalso measured during the Saturne PFM calibration by sending astrong modulated optical signal when the CSM source is in thefocal plane, biasing only one detector and looking for a correlatedsignal on a blind detector located in the focal plane. Thisdirectly infers the voltage crosstalk signal for a given pair of detectors.An upper limit of 60 dB was found, with an average of90 dB, in agreement with the previous method.5.2.5. Noise analysisUnderstanding the noise behavior is of utmost importance to thecosmological analysis. The different noise components that areexpected and/or measured in the HFI detectors are listed here:– The dominant part of the noise is nearly white and Gaussian.This is true for all detectors. Figure 23 shows an exampleof the power spectrum of four bolometers during quietconditions and under the expected flight background. TheGaussian part of the noise dominates the spectrum from0.1 Hz to the modulation frequency of 86 Hz. At a meanlevel of about 20 nV/sqrt(Hz), it constists mostly of photonnoise, phonon noise, Johnson noise (a typical 10 MOhmimpedance will produce 7.4 nV/sqrt(Hz) at 100 mK), and6nV/sqrt(Hz) of the electronics (JFET). The measure of thenoise within a resistor in the focal plane using the same readoutas the bolometers is in agreement with expectations. Thenoise was studied as a function of bias current, JFET temperature,and base plate temperature. All detectors recordvalid signals and are dominated by Gaussian noise. Figure 24compares the corresponding sensitivities with the goal valuesPage 12 of 15


