Planck Pre-Launch Status Papers - APC - Université Paris Diderot ...
Planck Pre-Launch Status Papers - APC - Université Paris Diderot ... Planck Pre-Launch Status Papers - APC - Université Paris Diderot ...
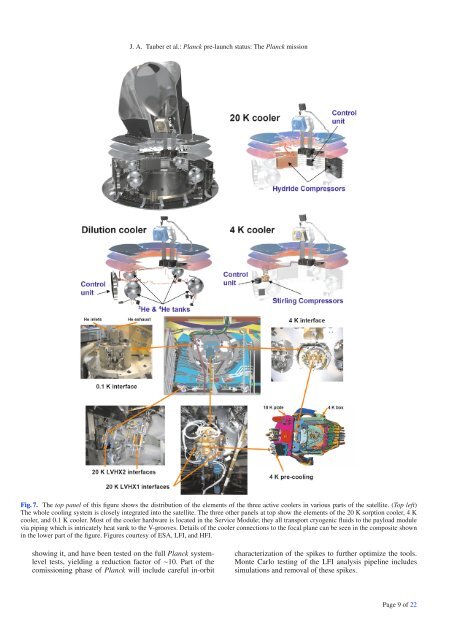
J. A. Tauber et al.: Planck pre-launch status: The Planck missionFig. 7. The top panel of this figure shows the distribution of the elements of the three active coolers in various parts of the satellite. (Top left)The whole cooling system is closely integrated into the satellite. The three other panels at top show the elements of the 20 K sorption cooler, 4 Kcooler, and 0.1 K cooler. Most of the cooler hardware is located in the Service Module; they all transport cryogenic fluids to the payload modulevia piping which is intricately heat sunk to the V-grooves. Details of the cooler connections to the focal plane can be seen in the composite shownin the lower part of the figure. Figures courtesy of ESA, LFI, and HFI.showing it, and have been tested on the full Planck systemleveltests, yielding a reduction factor of ∼10. Part of thecomissioning phase of Planck will include careful in-orbitcharacterization of the spikes to further optimize the tools.Monte Carlo testing of the LFI analysis pipeline includessimulations and removal of these spikes.Page 9 of 22
A&A 520, A1 (2010)Table 4. Summary of Planck instrument performance in flight, as predicted from ground characterisation (Mennella et al. 2010; Lamarreetal.2010)Instrument LFI HFICenter frequency [GHz] 30 44 70 100 143 217 353 545 857Number of polarised detectors a 4 6 12 8 8 8 8Number of unpolarised detectors 4 4 4 4 4Mean b FWHM (arcmin) 32.7 29.5 13.0 9.6 7.0 4.6 4.5 4.7 4.3Mean c ellipticity 1.36 1.50 1.27 1.17 1.05 1.11 1.13 1.03 1.04Bandwidth (∆ν, GHz) 4.5 4.1 12 32 45 68 104 174 258∆T/T per pixel (Stokes I) d 3.3 5.2 8.9 3 2.2 4.8 2.0 150 6000∆T/T per pixel (Stokes Q &U) e 4.6 7.4 12.7 4.8 4.1 9 38Point source sensitivity f (1σ,mJy) 22 59 46 14 10 14 38 44 45Notes. (a) For the LFI, the values shown correspond to the output of a linearly polarised differential radiometer; two such outputs, referred to as“detectors” in this paper, are supported by each horn. In fact each of the two radiometer outputs from one horn is built from the data acquired bytwo diodes, each of which are switched at high frequency between the sky and a blackbody load at 4 K (see Bersanelli et al. 2010). For the HFI,a(polarised)detectoristakentobetheoutputofoneofapairoflinearlypolarised polarisation-sensitive bolometers; each horn contains one pair,i.e. two orthogonally-polarised detectors. Unpolarised spider-web bolometers are present in some of the horns, in these cases there is only onedetector per horn. See Lamarre et al. (2010).(b) Band-averaged, including polarised and unpolarised detectors, see Tauber et al. (2010).(c) Band-averaged, including polarised and unpolarised detectors, see Tauber et al. (2010).(d) In µK/K (thermodynamictemperature)for15monthsintegration,1σ, forsquarepixelswhosesidesaregivenintherow“MeanFWHM”.The instantaneous sensitivities used for these estimates are drawn from ground calibration, averaged for all detectors in each channel; for LFI thesensitivity√is the mean of the two methods described in Mennella et al. (2010).(e) 2 × ∆T/T(I).( f ) Not including background confusion. Estimates of confusion levels can be extracted from Leach et al. (2008).sampled (0.016 to 100 Hz), are set by the following requirements(details can be found in Lamarre et al. 2010):– by design, fluctuations in the 100 mK stage (carrying thebolometers) should induce an extra noise less than 20% ofthe background photon noise on the bolometers– similarly, fluctuations in the 1.6 and 4 K stages (containingfilters and horns in the optical path), should induce emissionleading to stray-light levels less than 20% of the noise of thewhole detection chain for all channels.To achieve these stringent goals, each thermal stage within HFIis actively controlled:Fig. 8. Measured temperature fluctuation spectra at the two heat exchangersof the 20 K sorption cooler. LVHX1 is the interface to HFIwhich provides pre-cooling to the 4K cooler; the level of fluctuationsseen by the HFI focal plane unit is damped significantly by the interveningmechanical structure, and further reduced by active control ofthe 4K plate. LVHX2 is the interface to the LFI focal plane; when thetemperature control loop is used (TSA: bottom panel), the level of fluctuationsis significantly reduced.2.3.2. Deviations from ideality in HFIThe bolometers and readout system of HFI are intrinsically extremelystable (Lamarre et al. 2010), and the main instabilitiesthat will affect the HFI are of thermal origin. Stability requirementson the temperature of the different HFI stages, throughoutthe frequency range where useful scientific data from the sky are– The temperature of the 4 K box, containing the back-to-backhorns coupling to the sky, is regulated by a PID servo systemwith a heating belt providing a temperature stability suchthat the power spectrum of the temperature fluctuations islower that 10 µK/ √ Hz within the band of sampling frequencieswhere useful information from the sky resides (0.016 to100 Hz).– APIDservosystemcontrolsthestabilityofthe1.6Kscreenof the FPU (to which the bandpass-defining filters are attached)with a stability requirement of 28 µK/ √ Hz (in therange of frequencies 0.016 to 100 Hz).– The bolometer temperature of 100 mK provides for veryhigh sensitivity, limited mostly by the background photonnoise, with a noise equivalent power around 10 −17 W/ √ Hzfor the channels near the peak of the CMB spectrum. The requiredtemperature stability for this stage is thus very stringent:20 nK/ √ Hz in the sampling frequency range 0.016 to100 Hz. This is achieved mostly through a passive thermalfilter mounted between the dilution cooler’s cold tip and thebolometer optical plate. The mechanical link between thesetwo stages is built out of a Holmium-Yttrium alloy which hasaveryhighheatcapacityinthe100mKrange,providingathermal time constant of several hours between these stages.Page 10 of 22
- Page 1 and 2: A&A 520, E1 (2010)DOI: 10.1051/0004
- Page 3 and 4: ABSTRACTThe European Space Agency
- Page 5 and 6: A&A 520, A1 (2010)Fig. 2. An artist
- Page 7 and 8: A&A 520, A1 (2010)Fig. 4. Planck fo
- Page 9: A&A 520, A1 (2010)Fig. 6. The Planc
- Page 13 and 14: A&A 520, A1 (2010)three frequency c
- Page 15 and 16: A&A 520, A1 (2010)Fig. 12. The left
- Page 17 and 18: A&A 520, A1 (2010)Fig. 14. Left pan
- Page 19 and 20: A&A 520, A1 (2010)flux limit of the
- Page 21 and 22: A&A 520, A1 (2010)- University of C
- Page 23 and 24: A&A 520, A1 (2010)57 Instituto de A
- Page 25 and 26: A&A 520, A2 (2010)Fig. 1. (Left) Th
- Page 27 and 28: A&A 520, A2 (2010)Fig. 3. (Top)Twos
- Page 29 and 30: A&A 520, A2 (2010)Table 2. Predicte
- Page 31 and 32: Table 3. Predicted in-flight main b
- Page 33 and 34: A&A 520, A2 (2010)materials. Theref
- Page 35 and 36: A&A 520, A2 (2010)Fig. 11. Comparis
- Page 37 and 38: A&A 520, A2 (2010)Table 5. Inputs u
- Page 39 and 40: A&A 520, A2 (2010)Fig. 16. Three cu
- Page 41 and 42: A&A 520, A2 (2010)Table 7. Optical
- Page 43 and 44: A&A 520, A2 (2010)Fig. A.1. Dimensi
- Page 45 and 46: A&A 520, A2 (2010)5 Università deg
- Page 47 and 48: A&A 520, A3 (2010)Horizon 2000 medi
- Page 49 and 50: A&A 520, A3 (2010)Fig. 1. CMB tempe
- Page 51 and 52: A&A 520, A3 (2010)Ω ch 2τn s0.130
- Page 53 and 54: A&A 520, A3 (2010)Fig. 6. Integral
- Page 55 and 56: A&A 520, A3 (2010)Table 2. LFI opti
- Page 57 and 58: 3.3.1. SpecificationsThe main requi
- Page 59 and 60: A&A 520, A3 (2010)Fig. 11. Schemati
J. A. Tauber et al.: <strong>Planck</strong> pre-launch status: The <strong>Planck</strong> missionFig. 7. The top panel of this figure shows the distribution of the elements of the three active coolers in various parts of the satellite. (Top left)The whole cooling system is closely integrated into the satellite. The three other panels at top show the elements of the 20 K sorption cooler, 4 Kcooler, and 0.1 K cooler. Most of the cooler hardware is located in the Service Module; they all transport cryogenic fluids to the payload modulevia piping which is intricately heat sunk to the V-grooves. Details of the cooler connections to the focal plane can be seen in the composite shownin the lower part of the figure. Figures courtesy of ESA, LFI, and HFI.showing it, and have been tested on the full <strong>Planck</strong> systemleveltests, yielding a reduction factor of ∼10. Part of thecomissioning phase of <strong>Planck</strong> will include careful in-orbitcharacterization of the spikes to further optimize the tools.Monte Carlo testing of the LFI analysis pipeline includessimulations and removal of these spikes.Page 9 of 22


