Application Note 3 - Tebu-Bio
Application Note 3 - Tebu-Bio
Application Note 3 - Tebu-Bio

You also want an ePaper? Increase the reach of your titles
YUMPU automatically turns print PDFs into web optimized ePapers that Google loves.
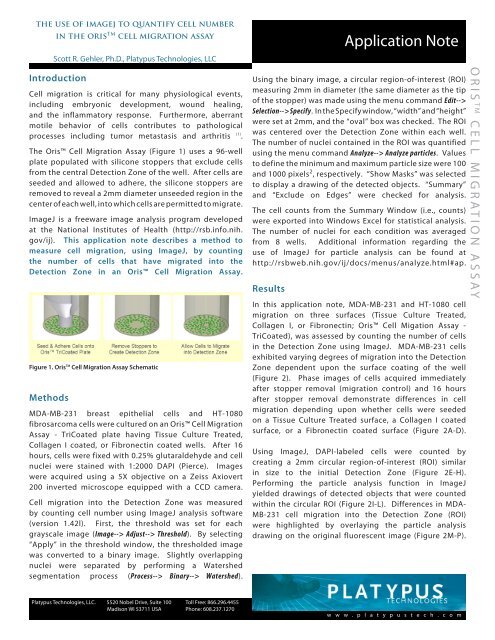
the use of imagej to quantify cell number<br />
Introduction<br />
Cell migration is critical for many physiological events,<br />
including embryonic development, wound healing,<br />
and the inflammatory response. Furthermore, aberrant<br />
motile behavior of cells contributes to pathological<br />
processes including tumor metastasis and arthritis (1) .<br />
The Oris Cell Migration Assay (Figure 1) uses a 96-well<br />
plate populated with silicone stoppers that exclude cells<br />
from the central Detection Zone of the well. After cells are<br />
seeded and allowed to adhere, the silicone stoppers are<br />
removed to reveal a 2mm diameter unseeded region in the<br />
center of each well, into which cells are permitted to migrate.<br />
ImageJ is a freeware image analysis program developed<br />
at the National Institutes of Health (http://rsb.info.nih.<br />
gov/ij). This application note describes a method to<br />
measure cell migration, using ImageJ, by counting<br />
the number of cells that have migrated into the<br />
Detection Zone in an Oris Cell Migration Assay.<br />
Methods<br />
in the oris TM cell migration assay<br />
Scott R. Gehler, Ph.D., Platypus Technologies, LLC<br />
Figure 1. Oris TM Cell Migration Assay Schematic<br />
MDA-MB-231 breast epithelial cells and HT-1080<br />
fibrosarcoma cells were cultured on an Oris Cell Migration<br />
Assay - TriCoated plate having Tissue Culture Treated,<br />
Collagen I coated, or Fibronectin coated wells. After 16<br />
hours, cells were fixed with 0.25% glutaraldehyde and cell<br />
nuclei were stained with 1:2000 DAPI (Pierce). Images<br />
were acquired using a 5X objective on a Zeiss Axiovert<br />
200 inverted microscope equipped with a CCD camera.<br />
Cell migration into the Detection Zone was measured<br />
by counting cell number using ImageJ analysis software<br />
(version 1.42l). First, the threshold was set for each<br />
grayscale image (Image--> Adjust--> Threshold). By selecting<br />
“Apply” in the threshold window, the thresholded image<br />
was converted to a binary image. Slightly overlapping<br />
nuclei were separated by performing a Watershed<br />
segmentation process (Process--> Binary--> Watershed).<br />
Platypus Technologies, LLC. 5520 Nobel Drive, Suite 100 Toll Free: 866.296.4455<br />
Madison WI 53711 USA Phone: 608.237.1270<br />
<strong>Application</strong> <strong>Note</strong><br />
Using the binary image, a circular region-of-interest (ROI)<br />
measuring 2mm in diameter (the same diameter as the tip<br />
of the stopper) was made using the menu command Edit--><br />
Selection--> Specify. In the Specify window, “width” and “height”<br />
were set at 2mm, and the “oval” box was checked. The ROI<br />
was centered over the Detection Zone within each well.<br />
The number of nuclei contained in the ROI was quantified<br />
using the menu command Analyze--> Analyze particles. Values<br />
to define the minimum and maximum particle size were 100<br />
and 1000 pixels 2 , respectively. “Show Masks” was selected<br />
to display a drawing of the detected objects. “Summary”<br />
and “Exclude on Edges” were checked for analysis.<br />
The cell counts from the Summary Window (i.e., counts)<br />
were exported into Windows Excel for statistical analysis.<br />
The number of nuclei for each condition was averaged<br />
from 8 wells. Additional information regarding the<br />
use of ImageJ for particle analysis can be found at<br />
http://rsbweb.nih.gov/ij/docs/menus/analyze.html#ap.<br />
Results<br />
In this application note, MDA-MB-231 and HT-1080 cell<br />
migration on three surfaces (Tissue Culture Treated,<br />
Collagen I, or Fibronectin; Oris Cell Migation Assay -<br />
TriCoated), was assessed by counting the number of cells<br />
in the Detection Zone using ImageJ. MDA-MB-231 cells<br />
exhibited varying degrees of migration into the Detection<br />
Zone dependent upon the surface coating of the well<br />
(Figure 2). Phase images of cells acquired immediately<br />
after stopper removal (migration control) and 16 hours<br />
after stopper removal demonstrate differences in cell<br />
migration depending upon whether cells were seeded<br />
on a Tissue Culture Treated surface, a Collagen I coated<br />
surface, or a Fibronectin coated surface (Figure 2A-D).<br />
Using ImageJ, DAPI-labeled cells were counted by<br />
creating a 2mm circular region-of-interest (ROI) similar<br />
in size to the initial Detection Zone (Figure 2E-H).<br />
Performing the particle analysis function in ImageJ<br />
yielded drawings of detected objects that were counted<br />
within the circular ROI (Figure 2I-L). Differences in MDA-<br />
MB-231 cell migration into the Detection Zone (ROI)<br />
were highlighted by overlaying the particle analysis<br />
drawing on the original fluorescent image (Figure 2M-P).<br />
w w w . p l a t y p u s t e c h . c o m<br />
ORIS TM CELL MIGRATION ASSAY
Merge Particle Analysis DAPI with Phase<br />
Drawing ROI Outline<br />
Figure 3. Quantitation of Cell Number using<br />
ImageJ.<br />
MDA-MB-231 (A) and HT-1080 (B) cell migration<br />
on three surfaces (Tissue Culture Treated,<br />
Collagen I, or Fibronectin). Data are presented<br />
as average cell number ± SD from 8 wells for<br />
each condition. p