Modeling the tip-sample interaction in an atomic force microscope ...
Modeling the tip-sample interaction in an atomic force microscope ...
Modeling the tip-sample interaction in an atomic force microscope ...

You also want an ePaper? Increase the reach of your titles
YUMPU automatically turns print PDFs into web optimized ePapers that Google loves.
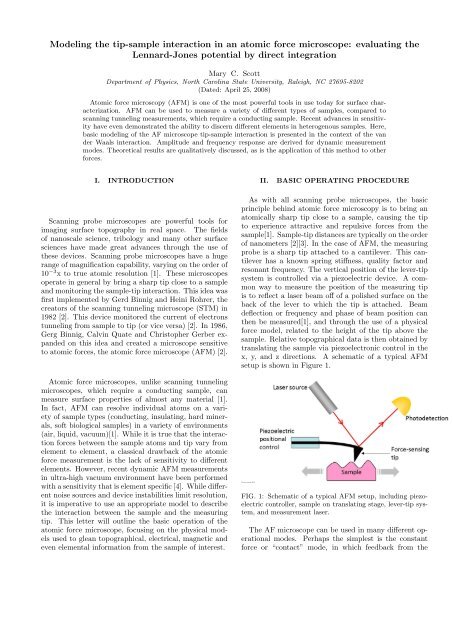
<strong>Model<strong>in</strong>g</strong> <strong>the</strong> <strong>tip</strong>-<strong>sample</strong> <strong><strong>in</strong>teraction</strong> <strong>in</strong> <strong>an</strong> <strong>atomic</strong> <strong>force</strong> <strong>microscope</strong>: evaluat<strong>in</strong>g <strong>the</strong>Lennard-Jones potential by direct <strong>in</strong>tegrationMary C. ScottDepartment of Physics, North Carol<strong>in</strong>a State University, Raleigh, NC 27695-8202(Dated: April 25, 2008)Atomic <strong>force</strong> microscopy (AFM) is one of <strong>the</strong> most powerful tools <strong>in</strong> use today for surface characterization.AFM c<strong>an</strong> be used to measure a variety of different types of <strong>sample</strong>s, compared tosc<strong>an</strong>n<strong>in</strong>g tunnel<strong>in</strong>g measurements, which require a conduct<strong>in</strong>g <strong>sample</strong>. Recent adv<strong>an</strong>ces <strong>in</strong> sensitivityhave even demonstrated <strong>the</strong> ability to discern different elements <strong>in</strong> heterogenous <strong>sample</strong>s. Here,basic model<strong>in</strong>g of <strong>the</strong> AF <strong>microscope</strong> <strong>tip</strong>-<strong>sample</strong> <strong><strong>in</strong>teraction</strong> is presented <strong>in</strong> <strong>the</strong> context of <strong>the</strong> v<strong>an</strong>der Waals <strong><strong>in</strong>teraction</strong>. Amplitude <strong>an</strong>d frequency response are derived for dynamic measurementmodes. Theoretical results are qualitatively discussed, as is <strong>the</strong> application of this method to o<strong>the</strong>r<strong>force</strong>s.I. INTRODUCTIONII.BASIC OPERATING PROCEDURESc<strong>an</strong>n<strong>in</strong>g probe <strong>microscope</strong>s are powerful tools forimag<strong>in</strong>g surface topography <strong>in</strong> real space. The fieldsof n<strong>an</strong>oscale science, tribology <strong>an</strong>d m<strong>an</strong>y o<strong>the</strong>r surfacesciences have made great adv<strong>an</strong>ces through <strong>the</strong> use of<strong>the</strong>se devices. Sc<strong>an</strong>n<strong>in</strong>g probe <strong>microscope</strong>s have a huger<strong>an</strong>ge of magnification capability, vary<strong>in</strong>g on <strong>the</strong> order of10 −3 x to true <strong>atomic</strong> resolution [1]. These <strong>microscope</strong>soperate <strong>in</strong> general by br<strong>in</strong>g a sharp <strong>tip</strong> close to a <strong>sample</strong><strong>an</strong>d monitor<strong>in</strong>g <strong>the</strong> <strong>sample</strong>-<strong>tip</strong> <strong><strong>in</strong>teraction</strong>. This idea wasfirst implemented by Gerd B<strong>in</strong>nig <strong>an</strong>d He<strong>in</strong>i Rohrer, <strong>the</strong>creators of <strong>the</strong> sc<strong>an</strong>n<strong>in</strong>g tunnel<strong>in</strong>g <strong>microscope</strong> (STM) <strong>in</strong>1982 [2]. This device monitored <strong>the</strong> current of electronstunnel<strong>in</strong>g from <strong>sample</strong> to <strong>tip</strong> (or vice versa) [2]. In 1986,Gerg B<strong>in</strong>nig, Calv<strong>in</strong> Quate <strong>an</strong>d Christopher Gerber exp<strong>an</strong>dedon this idea <strong>an</strong>d created a <strong>microscope</strong> sensitiveto <strong>atomic</strong> <strong>force</strong>s, <strong>the</strong> <strong>atomic</strong> <strong>force</strong> <strong>microscope</strong> (AFM) [2].Atomic <strong>force</strong> <strong>microscope</strong>s, unlike sc<strong>an</strong>n<strong>in</strong>g tunnel<strong>in</strong>g<strong>microscope</strong>s, which require a conduct<strong>in</strong>g <strong>sample</strong>, c<strong>an</strong>measure surface properties of almost <strong>an</strong>y material [1].In fact, AFM c<strong>an</strong> resolve <strong>in</strong>dividual atoms on a varietyof <strong>sample</strong> types (conduct<strong>in</strong>g, <strong>in</strong>sulat<strong>in</strong>g, hard m<strong>in</strong>erals,soft biological <strong>sample</strong>s) <strong>in</strong> a variety of environments(air, liquid, vacuum)[1]. While it is true that <strong>the</strong> <strong><strong>in</strong>teraction</strong><strong>force</strong>s between <strong>the</strong> <strong>sample</strong> atoms <strong>an</strong>d <strong>tip</strong> vary fromelement to element, a classical drawback of <strong>the</strong> <strong>atomic</strong><strong>force</strong> measurement is <strong>the</strong> lack of sensitivity to differentelements. However, recent dynamic AFM measurements<strong>in</strong> ultra-high vacuum environment have been performedwith a sensitivity that is element specific [4]. While differentnoise sources <strong>an</strong>d device <strong>in</strong>stabilities limit resolution,it is imperative to use <strong>an</strong> appropriate model to describe<strong>the</strong> <strong><strong>in</strong>teraction</strong> between <strong>the</strong> <strong>sample</strong> <strong>an</strong>d <strong>the</strong> measur<strong>in</strong>g<strong>tip</strong>. This letter will outl<strong>in</strong>e <strong>the</strong> basic operation of <strong>the</strong><strong>atomic</strong> <strong>force</strong> <strong>microscope</strong>, focus<strong>in</strong>g on <strong>the</strong> physical modelsused to gle<strong>an</strong> topographical, electrical, magnetic <strong>an</strong>deven elemental <strong>in</strong>formation from <strong>the</strong> <strong>sample</strong> of <strong>in</strong>terest.As with all sc<strong>an</strong>n<strong>in</strong>g probe <strong>microscope</strong>s, <strong>the</strong> basicpr<strong>in</strong>ciple beh<strong>in</strong>d <strong>atomic</strong> <strong>force</strong> microscopy is to br<strong>in</strong>g <strong>an</strong><strong>atomic</strong>ally sharp <strong>tip</strong> close to a <strong>sample</strong>, caus<strong>in</strong>g <strong>the</strong> <strong>tip</strong>to experience attractive <strong>an</strong>d repulsive <strong>force</strong>s from <strong>the</strong><strong>sample</strong>[1]. Sample-<strong>tip</strong> dist<strong>an</strong>ces are typically on <strong>the</strong> orderof n<strong>an</strong>ometers [2][3]. In <strong>the</strong> case of AFM, <strong>the</strong> measur<strong>in</strong>gprobe is a sharp <strong>tip</strong> attached to a c<strong>an</strong>tilever. This c<strong>an</strong>tileverhas a known spr<strong>in</strong>g stiffness, quality factor <strong>an</strong>dreson<strong>an</strong>t frequency. The vertical position of <strong>the</strong> lever-<strong>tip</strong>system is controlled via a piezoelectric device. A commonway to measure <strong>the</strong> position of <strong>the</strong> measur<strong>in</strong>g <strong>tip</strong>is to reflect a laser beam off of a polished surface on <strong>the</strong>back of <strong>the</strong> lever to which <strong>the</strong> <strong>tip</strong> is attached. Beamdeflection or frequency <strong>an</strong>d phase of beam position c<strong>an</strong><strong>the</strong>n be measured[1], <strong>an</strong>d through <strong>the</strong> use of a physical<strong>force</strong> model, related to <strong>the</strong> height of <strong>the</strong> <strong>tip</strong> above <strong>the</strong><strong>sample</strong>. Relative topographical data is <strong>the</strong>n obta<strong>in</strong>ed bytr<strong>an</strong>slat<strong>in</strong>g <strong>the</strong> <strong>sample</strong> via piezoelectronic control <strong>in</strong> <strong>the</strong>x, y, <strong>an</strong>d z directions. A schematic of a typical AFMsetup is shown <strong>in</strong> Figure 1.Project/setup.JPGFIG. 1: Schematic of a typical AFM setup, <strong>in</strong>clud<strong>in</strong>g piezoelectriccontroller, <strong>sample</strong> on tr<strong>an</strong>slat<strong>in</strong>g stage, lever-<strong>tip</strong> system,<strong>an</strong>d measurement laser.The AF <strong>microscope</strong> c<strong>an</strong> be used <strong>in</strong> m<strong>an</strong>y different operationalmodes. Perhaps <strong>the</strong> simplest is <strong>the</strong> const<strong>an</strong>t<strong>force</strong> or “contact” mode, <strong>in</strong> which feedback from <strong>the</strong>
2<strong>force</strong> measurement is used to keep <strong>the</strong> <strong>force</strong>, <strong>an</strong>d <strong>the</strong>refore<strong>the</strong> dist<strong>an</strong>ce above <strong>the</strong> <strong>sample</strong>, const<strong>an</strong>t. The <strong>sample</strong>height c<strong>an</strong> <strong>the</strong>n be measured directly[2]. This method requires<strong>in</strong>dependent measurement of <strong>the</strong> <strong>force</strong> exerted on<strong>the</strong> <strong>sample</strong> <strong>tip</strong> <strong>an</strong>d <strong>the</strong> <strong>tip</strong> position. There are two ma<strong>in</strong>dynamic modes of operation, frequency modulation <strong>an</strong>damplitude modulation, also known as non-contact <strong>an</strong>dtapp<strong>in</strong>g modes, respectively[6]. Dur<strong>in</strong>g operation <strong>in</strong> a dynamicmode measurement, <strong>the</strong> piezoelectronic controlleroscillates <strong>the</strong> lever-<strong>tip</strong> system. Frequency <strong>an</strong>d amplitude<strong>in</strong>formation are measured through phase-sensitiveoptical measurement (i.e., lock-<strong>in</strong> detection)[2][1]. Amplitudemodulation (tapp<strong>in</strong>g mode), which typically <strong>in</strong>volvesmov<strong>in</strong>g <strong>the</strong> <strong>tip</strong> from <strong>the</strong> non-contact (attractive<strong>force</strong>) region to <strong>the</strong> contact (repulsive <strong>force</strong>) region. Thismeasurement is most often performed <strong>in</strong> gas or liquidmedia, whereas <strong>the</strong> frequency modulation mode (noncontact)is more conducive to measurement <strong>in</strong> vacuumconditions [6]As always, sources of noise should be considered. Thermaldrift of <strong>the</strong> <strong>sample</strong> <strong>an</strong>d especially of <strong>an</strong>y piezoelectricposition<strong>in</strong>g devices are a concern. Measures c<strong>an</strong> betaken to <strong>the</strong>rmally stabilize <strong>the</strong> system, but speed<strong>in</strong>g up<strong>the</strong> measurement is <strong>the</strong> primary way to deal with thisproblem. O<strong>the</strong>r sources <strong>in</strong>clude laser beam stability <strong>an</strong>dmeasurement noise[2].III.MODELING THE TIP-SAMPLEINTERACTIONBeyond limit<strong>in</strong>g <strong>an</strong>y sources of noise <strong>in</strong> <strong>the</strong> device, resolution<strong>in</strong> AF <strong>microscope</strong>s depends on <strong>the</strong> model usedto relate <strong>the</strong> response of <strong>the</strong> c<strong>an</strong>tilever-<strong>tip</strong> system to <strong>the</strong>height of <strong>the</strong> <strong>tip</strong> above <strong>the</strong> <strong>sample</strong>. For this section, dynamicmode operation only is considered. While <strong>the</strong> contactmode of operation directly measures height, dynamicmodels are considered more sophisticated <strong>an</strong>d more readilygive <strong>atomic</strong> resolution[6]. This is <strong>in</strong> part due to reducedphysical <strong><strong>in</strong>teraction</strong> between <strong>the</strong> <strong>tip</strong> <strong>an</strong>d <strong>sample</strong><strong>an</strong>d due to <strong>the</strong> <strong>in</strong>crease <strong>in</strong> measureable parameters <strong>in</strong> adynamic mode. Frequency, amplitude, phase <strong>an</strong>d overalloffset of <strong>the</strong> <strong>tip</strong> c<strong>an</strong> all be measured. Any one of <strong>the</strong>separameters alone could characterize <strong>the</strong> surface, but toge<strong>the</strong>r<strong>the</strong>y result <strong>in</strong> higher resolution[6].M<strong>an</strong>y models exist to describe <strong>the</strong> response of <strong>an</strong> oscillat<strong>in</strong>glever with <strong>an</strong> external <strong>force</strong> field. These <strong>in</strong>cludeperturbation <strong>the</strong>ory, Fourier <strong>an</strong>alysis, <strong>an</strong>d variationalapproach[6]. All of <strong>the</strong>se methods strive to make<strong>the</strong> connection between <strong>the</strong> <strong>tip</strong> response <strong>an</strong>d <strong>the</strong> heightof <strong>the</strong> <strong>tip</strong> above <strong>the</strong> <strong>sample</strong>, which will ultimately leadto <strong>the</strong> “picture” of <strong>the</strong> <strong>sample</strong>’s surface. Common toall of <strong>the</strong>se methods is <strong>the</strong> development of a govern<strong>in</strong>gequation of motion. In <strong>the</strong> method below, <strong>the</strong> <strong>force</strong> willbe <strong>in</strong>corporated <strong>in</strong>to <strong>the</strong> equation of motion via <strong>an</strong> effectivespr<strong>in</strong>g const<strong>an</strong>t. Then, <strong>the</strong> harmonic oscillatorproblem for <strong>the</strong> c<strong>an</strong>tilever-<strong>tip</strong> system c<strong>an</strong> be solved bydirect <strong>in</strong>tegration[2]. This direct <strong>in</strong>tegration method requires<strong>an</strong> <strong><strong>in</strong>teraction</strong> potential that obeys a power law,i.e.,w(r) = −Cr n (1)Where r is <strong>the</strong> dist<strong>an</strong>ce between <strong>in</strong>teract<strong>in</strong>g objects <strong>an</strong>dC is a material- <strong>an</strong>d geometry-specific const<strong>an</strong>t. Thisgeneral <strong>force</strong> c<strong>an</strong> <strong>the</strong>n be <strong>in</strong>tegrated over various volumes<strong>an</strong>d def<strong>in</strong>ed <strong>in</strong> terms of <strong>the</strong> <strong>tip</strong>-<strong>sample</strong> dist<strong>an</strong>ce, z. Forexample, <strong>in</strong>tegrat<strong>in</strong>g a po<strong>in</strong>t particle’s <strong><strong>in</strong>teraction</strong> with a2D sheet of molecules with number density ρ 1 results <strong>in</strong>[2]:2πρ 1 C 1W (r) = −. (2)(n − 2)(n − 3) zn−3 This would be <strong>an</strong> ideal model if <strong>the</strong> <strong>tip</strong> were truly <strong>atomic</strong>allysharp. However, actual <strong>tip</strong>s have a f<strong>in</strong>ite radiusof curvature. A better model is to consider <strong>the</strong> <strong>tip</strong> asphere of radius R, where R is <strong>the</strong> radius of curvature of<strong>the</strong> actual <strong>tip</strong>. Perform<strong>in</strong>g a pairwise <strong>in</strong>tegration over asphere of radius R <strong>an</strong>d number density ρ 2 <strong>an</strong>d a sheetwith number density ρ 1 gives, for z
3Project/geom.JPG= -C 0 [ σ − 1 z 2 300A =σ 7z08 ] (8)− 2 σ 715 z09 ] (9)Project/response.JPG∂t + k(z − u)FIG. 2: Geometry to solve <strong>the</strong> driven, <strong>force</strong>d harmonic oscillatorproblem.where k is <strong>the</strong> spr<strong>in</strong>g const<strong>an</strong>t of <strong>the</strong> lever <strong>an</strong>d z <strong>an</strong>d u areare <strong>the</strong> positions of <strong>the</strong> <strong>tip</strong> <strong>an</strong>d <strong>the</strong> driv<strong>in</strong>g piezoelectronicdevice, respectively. The height of <strong>the</strong> <strong>sample</strong> is set tozero. At this po<strong>in</strong>t <strong>the</strong> problem is solved <strong>in</strong> <strong>the</strong> sense that<strong>the</strong> <strong>tip</strong> position (which is also <strong>the</strong> relative <strong>tip</strong> height) isnow related to <strong>the</strong> position of <strong>the</strong> driv<strong>in</strong>g piezoelectronicdevice, which is known. However to extract frequency<strong>an</strong>d amplitude data from this model, we Taylor exp<strong>an</strong>d<strong>the</strong> <strong>force</strong> about z 0 <strong>an</strong>d take <strong>the</strong> first two terms:F 0 = −C 0 [ σ z02 − 130F 1 = 2C 0 [ σ z 3 0with C 0 = − 2 3 π2 ɛρ 1 ρ 2 σ 5 . The effective spr<strong>in</strong>g const<strong>an</strong>twill be def<strong>in</strong>ed ask ′ = k − F 1 (10)for a geometry with z positive towards <strong>the</strong> <strong>sample</strong>. Theequation of motion to solve ism ∂2 z+ γ ∂z + k(z − u) = F (z) (11)2∂twith <strong>the</strong> positions of <strong>the</strong> base of <strong>the</strong> lever driven by <strong>the</strong>piezoelectric controller, <strong>an</strong>d <strong>the</strong> <strong>tip</strong> given by<strong>an</strong>du = u 0 + ae iwt (12)z = z 0 + Ae iwt−iθ (13)respectively. γ is mω 0 /Q, <strong>the</strong> damp<strong>in</strong>g coeffecient withω 0 = sqrt(k/m) <strong>the</strong> natural reson<strong>an</strong>t frequency. Q is<strong>the</strong> quality factor of <strong>the</strong> spr<strong>in</strong>g. With <strong>the</strong> Taylor seriesapproximation of <strong>the</strong> <strong>force</strong>, Eq. 11 ism ∂2 z∂t 2 + γ ∂zσ 7] + 2Cz08 0 [ σ − 2 z03 15σ 7](14)z09Apply<strong>in</strong>g <strong>the</strong> condition that at equilibrium F 0 = k(z 0 −u 0 ), we see that <strong>the</strong> amplitude is def<strong>in</strong>ed byA(k ′ − ω 2 m + iωγ) = ake iθ . (15)The reson<strong>an</strong>t frequency for this system is ω ′ 0 =sqrt(k ′ /m). Solv<strong>in</strong>g for <strong>the</strong> amplitude givesaω02[(ω 0 ′ 2 − ω 2 ) 2 + ω 2 ω0 2 . (16)/Q2 ]1/2For operation near reson<strong>an</strong>ce, <strong>the</strong> reson<strong>an</strong>t frequency isω 0 ′ ∼ = √ (k/m 1 − F )12k(17)<strong>an</strong>d <strong>the</strong> amplitude reduces to A = a(k/k ′ )Q for operationnear ω ′ 0 [2].FIG. 3: Frequency <strong>an</strong>d amplitude response as a function ofoverall height, z 0, for v<strong>an</strong> der Waals <strong><strong>in</strong>teraction</strong>. All const<strong>an</strong>tshave been set to 1.It should be noted that for this approximation, <strong>the</strong> elementspecific attributes of <strong>the</strong> system (damp<strong>in</strong>g, etc.)have been absorbed <strong>in</strong>to qu<strong>an</strong>tities like γ <strong>an</strong>d k. Forelemental resolution, <strong>the</strong>se values are still const<strong>an</strong>t withrespect to <strong>the</strong> z direction but are no longer const<strong>an</strong>ts withrespect to <strong>the</strong> x <strong>an</strong>d y directions. Substitut<strong>in</strong>g <strong>in</strong>to <strong>the</strong>seresults <strong>the</strong> <strong>force</strong> derivative for <strong>the</strong> v<strong>an</strong> der Waals <strong><strong>in</strong>teraction</strong>gives <strong>the</strong> response as a function of <strong>the</strong> <strong>force</strong> derivative,F 1 , <strong>an</strong>d <strong>the</strong>refore as a function of z 0 , <strong>the</strong> overallheight above <strong>the</strong> <strong>sample</strong>. These are plotted <strong>in</strong> Figure 3.It c<strong>an</strong> also be seen from Figure 3 that, as one would <strong>in</strong>tuitivelyexpect, <strong>an</strong> attractive <strong>force</strong> <strong>in</strong>creases <strong>the</strong> amplitude<strong>an</strong>d decreases <strong>the</strong> reson<strong>an</strong>t frequency, while a repulsive<strong>force</strong> decreases <strong>the</strong> amplitude <strong>an</strong>d <strong>in</strong>creases <strong>the</strong> reson<strong>an</strong>tfrequency. This is evident <strong>in</strong> that as z/σ becomes small<strong>an</strong>d <strong>the</strong> <strong>force</strong> becomes repulsive, <strong>the</strong> amplitude decreases<strong>an</strong>d <strong>the</strong> frequency <strong>in</strong>creases.
4In general, this procedure could also be applied toa surface where electric or magnetic <strong><strong>in</strong>teraction</strong>s werepresent. For a th<strong>in</strong> magentic film, <strong>the</strong> magnetic <strong>force</strong>will be nearly const<strong>an</strong>t when compared with electric <strong>an</strong>d<strong>atomic</strong> <strong>force</strong>s. The electric <strong>force</strong>, which falls off moreslowly th<strong>an</strong> <strong>the</strong> v<strong>an</strong> der Waals for <strong>the</strong> case of a sphere<strong>in</strong>teract<strong>in</strong>g with a pl<strong>an</strong>e[2], will be dom<strong>in</strong><strong>an</strong>t at longerdist<strong>an</strong>ces. However, if only magnetic <strong>an</strong>d <strong>atomic</strong> <strong>force</strong>sare considered, <strong>the</strong>re may be a dist<strong>an</strong>ce at which <strong>the</strong> magnetic<strong>force</strong> will beg<strong>in</strong> to outweigh <strong>the</strong> v<strong>an</strong> der Waals <strong>force</strong>[2]. These different <strong>force</strong> behaviors become particularilyimport<strong>an</strong>t when element-specific topography is desired.Figure 4 shows <strong>the</strong> qualitative behavior of <strong>the</strong> three ma<strong>in</strong><strong>force</strong>s under consideration. The electrostatic <strong>force</strong> hasbeen derived from <strong>the</strong> electrostatic <strong><strong>in</strong>teraction</strong> betweena sphere of radius R <strong>an</strong>d a two dimensional pl<strong>an</strong>e. Themagnetic <strong>force</strong> was derived from consider<strong>in</strong>g two <strong>in</strong>teract<strong>in</strong>gmagnetized spheres [2].Project/<strong>force</strong>s.JPGFIG. 4: Comparison of various <strong><strong>in</strong>teraction</strong> <strong>force</strong>s. Interactionpotentials have been <strong>in</strong>tegrated over a sphere <strong>an</strong>d a pl<strong>an</strong>e.IV.CONCLUDING REMARKSThe resolution limit of a sc<strong>an</strong>n<strong>in</strong>g <strong>force</strong> <strong>microscope</strong> dependsnot only on experimental noise, but also on <strong>the</strong> validityof <strong>the</strong> model used to describe <strong>the</strong> system. Here, wehave modeled <strong>the</strong> c<strong>an</strong>tilever-<strong>tip</strong> system as a mass spr<strong>in</strong>gsystem. The microscopic v<strong>an</strong> der Waals potential was<strong>in</strong>tegrated over <strong>the</strong> macroscopic <strong>sample</strong> <strong>an</strong>d <strong>tip</strong>, <strong>an</strong>d <strong>in</strong>corporated<strong>in</strong>to <strong>the</strong> govern<strong>in</strong>g equation of motion as <strong>an</strong>effective spr<strong>in</strong>g const<strong>an</strong>t. Reson<strong>an</strong>t frequencies <strong>an</strong>d amplitudeswere determ<strong>in</strong>ed for operation with a driv<strong>in</strong>gfrequency near <strong>the</strong> natural (un<strong>force</strong>d) reson<strong>an</strong>t frequencyof <strong>the</strong> c<strong>an</strong>tilever-<strong>tip</strong> system. This simple model outl<strong>in</strong>es<strong>the</strong> basic procedure that allows <strong>the</strong> connection between<strong>tip</strong> response <strong>an</strong>d height above <strong>the</strong> <strong>sample</strong> to be made.This model c<strong>an</strong> be exp<strong>an</strong>ded to <strong>in</strong>clude o<strong>the</strong>r <strong>force</strong>s,such as electric or magnetic, <strong>an</strong>d to account for a <strong>sample</strong>comprised of more th<strong>an</strong> one element. A basic orderof-magnitudecomparison was made between <strong>the</strong> electric,magnetic <strong>an</strong>d <strong>atomic</strong> <strong>force</strong>s. The implementation of <strong>the</strong>seexp<strong>an</strong>ded models, along with a stable experimental device,allow for true <strong>atomic</strong> resolution <strong>an</strong>d elemental sensitivity.These features, comb<strong>in</strong>ed with <strong>the</strong> ability of AF<strong>microscope</strong>s to measure a wide variety of <strong>sample</strong>s, makeAFMs some of <strong>the</strong> most import<strong>an</strong>t characterization toolsfor surface scientists today.[1] C.B. Prater, H.J. Butt, P.K. H<strong>an</strong>sma, Nature. 345, 6278(1990).[2] D. Sarid, Sc<strong>an</strong>n<strong>in</strong>g <strong>force</strong> microscopy with applications toelectric, magnetic <strong>an</strong>d <strong>atomic</strong> <strong>force</strong>s. New York: OxfordUniversity press (1994).[3] J.N. Israelachvili <strong>an</strong>d D. Tabor, Proc. R. Soc. Lond. 331(1972).[4] Y. Sugimoto, P. Pou,M. Abe, al., Nature. 446, 7131(2007).[5] A. S. Foster <strong>an</strong>d W. A. Hofer, Sc<strong>an</strong>n<strong>in</strong>g Probe Microscopy.New York: Spr<strong>in</strong>ger (2006).[6] R. Garcia <strong>an</strong>d R. Perez, Surface Science Reports. 47(2002).