Administrator's Guide - Kerio Software Archive
Administrator's Guide - Kerio Software Archive Administrator's Guide - Kerio Software Archive
Chapter 21 Status Information21.5 Traffic ChartsIn the Status → Traffic Charts section you can view (in graphical format) the number of connectionsto individual services of Kerio MailServer and the number of processed messages (bothincoming and outgoing) for a given period.Figure 21.6Traffic ChartsThe graph allows the following parameter settings:Monitored parameterUse the first field to choose the monitored parameter:• Connections / HTTP — the number of connections to the HTTP service• Connections/IMAP — the number of connections to the IMAP service• Connections / LDAP — the number of connections to the LDAP service• Connections / NNTP — the number of connections to the NNTP service• Connections / Outgoing SMTP — the number of outgoing connections of the SMTPservice• Connections / Rejected SMTP — number of rejected connections to the SMTP service(connections blocked by the Spammer repellent filter)• Connections/POP3 — the number of connections to the POP3 service• Connections/SMTP — the number of connections to the SMTP service• Messages / Received — the number of messages processed by the MailServer (the totalof outgoing and incoming SMTP messages and messages downloaded from remotePOP3 mailboxes)• Messages / Spam — number of messages marked as spam by the antispam filter242
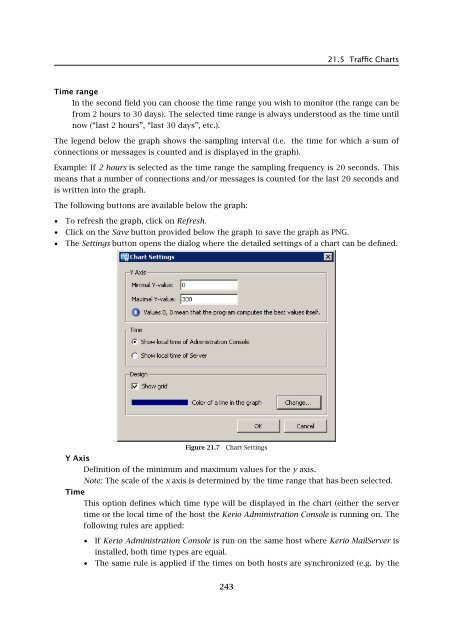
21.5 Traffic ChartsTime rangeIn the second field you can choose the time range you wish to monitor (the range can befrom 2 hours to 30 days). The selected time range is always understood as the time untilnow (“last 2 hours”, “last 30 days”, etc.).The legend below the graph shows the sampling interval (i.e. the time for which a sum ofconnections or messages is counted and is displayed in the graph).Example: If 2 hours is selected as the time range the sampling frequency is 20 seconds. Thismeans that a number of connections and/or messages is counted for the last 20 seconds andis written into the graph.The following buttons are available below the graph:• To refresh the graph, click on Refresh.• Click on the Save button provided below the graph to save the graph as PNG.• The Settings button opens the dialog where the detailed settings of a chart can be defined.Figure 21.7 Chart SettingsY AxisDefinition of the minimum and maximum values for the y axis.Note: The scale of the x axis is determined by the time range that has been selected.TimeThis option defines which time type will be displayed in the chart (either the servertime or the local time of the host the Kerio Administration Console is running on. Thefollowing rules are applied:• If Kerio Administration Console is run on the same host where Kerio MailServer isinstalled, both time types are equal.• The same rule is applied if the times on both hosts are synchronized (e.g. by the243
- Page 191 and 192: 16.7 Recommended configuration of a
- Page 193 and 194: 16.8 Monitoring of spam filter’s
- Page 195 and 196: 16.8 Monitoring of spam filter’s
- Page 197 and 198: 17.1 Integrated McAfee Anti-VirusBe
- Page 199 and 200: 17.4 Server responses to detection
- Page 201 and 202: 17.5 Filtering Email Attachments17.
- Page 203 and 204: 17.6 Antivirus control statisticsFi
- Page 205 and 206: 18.1 ArchivingPath to the archive d
- Page 207 and 208: 18.2 Backup of user foldersFigure 1
- Page 209 and 210: 18.2 Backup of user foldersFigure 1
- Page 211 and 212: 18.2 Backup of user folders• Save
- Page 213 and 214: 18.2 Backup of user folders2. The s
- Page 215 and 216: Chapter 19LDAP serverThe built-in L
- Page 217 and 218: 19.2 Configuring Email ClientsFigur
- Page 219 and 220: 19.2 Configuring Email ClientsMaxim
- Page 221 and 222: 20.2 Creating a Mailing List• con
- Page 223 and 224: 20.2 Creating a Mailing ListFigure
- Page 225 and 226: 20.3 Posting rulesFigure 20.4Creati
- Page 227 and 228: 20.4 Moderators and MembersAdd this
- Page 229 and 230: 20.4 Moderators and MembersAdding a
- Page 231 and 232: 20.5 Mailing list archiving2. This
- Page 233 and 234: 20.7 How to use Mailing ListsExampl
- Page 235 and 236: Chapter 21Status InformationKerio M
- Page 237 and 238: 21.2 Message queue processingFrom,
- Page 239 and 240: 21.3 Active ConnectionsActive Conne
- Page 241: 21.4 Opened FoldersComponentsThree
- Page 245 and 246: 21.6 StatisticsRefreshThis button r
- Page 247 and 248: 22.1 Log settingsFigure 22.2Save lo
- Page 249 and 250: 22.1 Log settingsLog debugSelect th
- Page 251 and 252: 22.3 MailAuth_type=’0’, Passwor
- Page 253 and 254: 22.4 SecurityMailing list messagesT
- Page 255 and 256: 22.4 SecurityAntibombingServer over
- Page 257 and 258: 22.8 Debug• From: jsmith@company.
- Page 259 and 260: 22.8 Debug• IMAP Server — commu
- Page 261 and 262: 22.9 Performance Monitor (under Win
- Page 263 and 264: 23.1 Viewing public folders in indi
- Page 265 and 266: 24.1 Kerio MailServer on WindowsFig
- Page 267 and 268: 24.1 Kerio MailServer on WindowsFig
- Page 269 and 270: 24.2 Kerio MailServer on LinuxExamp
- Page 271 and 272: 24.2 Kerio MailServer on Linuxdebug
- Page 273 and 274: 24.3 Kerio MailServer on Mac OSTo e
- Page 275 and 276: 24.3 Kerio MailServer on Mac OSFigu
- Page 277 and 278: 24.3 Kerio MailServer on Mac OSFigu
- Page 279 and 280: 24.3 Kerio MailServer on Mac OSFigu
- Page 281 and 282: 24.4 Starting Open Directory and Ke
- Page 283 and 284: 24.4 Starting Open Directory and Ke
- Page 285 and 286: Figure 25.1Setting Windows NT domai
- Page 287 and 288: 25.1 Setting NTLM in MS Outlook ext
- Page 289 and 290: Chapter 26Kerio MailServer Environm
- Page 291 and 292: 26.3 FirewallFrom technical reasons
21.5 Traffic ChartsTime rangeIn the second field you can choose the time range you wish to monitor (the range can befrom 2 hours to 30 days). The selected time range is always understood as the time untilnow (“last 2 hours”, “last 30 days”, etc.).The legend below the graph shows the sampling interval (i.e. the time for which a sum ofconnections or messages is counted and is displayed in the graph).Example: If 2 hours is selected as the time range the sampling frequency is 20 seconds. Thismeans that a number of connections and/or messages is counted for the last 20 seconds andis written into the graph.The following buttons are available below the graph:• To refresh the graph, click on Refresh.• Click on the Save button provided below the graph to save the graph as PNG.• The Settings button opens the dialog where the detailed settings of a chart can be defined.Figure 21.7 Chart SettingsY AxisDefinition of the minimum and maximum values for the y axis.Note: The scale of the x axis is determined by the time range that has been selected.TimeThis option defines which time type will be displayed in the chart (either the servertime or the local time of the host the <strong>Kerio</strong> Administration Console is running on. Thefollowing rules are applied:• If <strong>Kerio</strong> Administration Console is run on the same host where <strong>Kerio</strong> MailServer isinstalled, both time types are equal.• The same rule is applied if the times on both hosts are synchronized (e.g. by the243


