Key West Carrying Capacity Traffic Study ... - KeyWestCity.com
Key West Carrying Capacity Traffic Study ... - KeyWestCity.com
Key West Carrying Capacity Traffic Study ... - KeyWestCity.com

You also want an ePaper? Increase the reach of your titles
YUMPU automatically turns print PDFs into web optimized ePapers that Google loves.
City of <strong>Key</strong> <strong>West</strong> <strong>Carrying</strong> <strong>Capacity</strong> <strong>Traffic</strong> <strong>Study</strong>EXECUTIVE SUMMARYThe purpose of the <strong>Carrying</strong> <strong>Capacity</strong> <strong>Traffic</strong> <strong>Study</strong> was to assess the capacity of City streets andrelated transportation infrastructure. The <strong>Study</strong> was also to address specialized vehicles and theirimpacts to roadways and adjacent land uses including impacts associated with mobility, noise,and air quality.Data CollectionIn order to accurately evaluate the transportation infrastructure, an extensive amount of datacollection was undertaken for this study. Through preliminary meetings with the City staff, 15roadway corridors and 25 intersections were identified to define the specific study area. Thefollowing items were evaluated as part of the data collection process:Intersection <strong>Traffic</strong> Turning Movement Counts24-Hour Bi-Directional Tube Counts<strong>Traffic</strong> Speed CountsVehicle Classification CountsCorridor Travel Time RunsMulti-Modal Vehicle AttributesGeneral Roadway CharacteristicsExisting Speed Limit InventoryExisting Parking InventoryCruise Ship Related DataExisting Bike Lane InventoryExisting <strong>Traffic</strong> Sound Level SamplingExisting Conditions Analysis MethodologyVISSIM traffic micro-simulation software was chosen for the project due to the uniquecharacteristics of the City such as the prevalence of multi-modal vehicles and pedestrians. TheCity transportation network was evaluated using four different methodologies:1. FDOT Generalized Tables. The first methodology consisted of <strong>com</strong>paring peak hourtraffic volumes to the FDOT Quality/Level of Service tables. This generalized planninganalysis is limited and is considered an estimate of capacity.2. Volume to <strong>Capacity</strong> Ratio. This methodology determined the v/c ratios on each of thestudy corridors based on the critical intersection. The v/c ratios in this analysis areconsidered more detailed and accurate than the FDOT v/c ratios.3. HCM Average Speed. The procedure identified in the City Comprehensive Plan and theHCM both require the LOS to be determined based on the average speed methodology.This procedure was <strong>com</strong>pleted by actual time travel runs and through a micro-simulationCalvin, Giordano & AssociatesPage I
City of <strong>Key</strong> <strong>West</strong> <strong>Carrying</strong> <strong>Capacity</strong> <strong>Traffic</strong> <strong>Study</strong>traffic analysis. The results for this methodology were used for the final determination ofLOS as it reflects the most accurate possible evaluation.4. VISSIM Micro-simulation. The final methodology used in this traffic study was toevaluate the traffic operations of the study intersections. The Level of Service thresholdswere determined based on delay thresholds identified in the HCM. VISSIM microsimulationsoftware was utilized to determine the approach and intersection delay.The hierarchy of <strong>com</strong>plexity and accuracy for each of the four methodologies utilized isillustrated in Figure A below.Figure AHierarchy of <strong>Traffic</strong> Evaluation ToolsExisting Conditions Analysis ResultsThe results of the existing conditions analysis demonstrated that there are several roadwaycorridors and intersections within the City that are over capacity or operating at a Level ofService that is not within defined acceptable standards, as illustrated on Table A below. It cantherefore be concluded that the overall transportation network will not support additional trafficunless capacity improvements are implemented. The effects of new trip generators on the overallroadway network will be dependent, in part, on the location of the development/operation, tripdistribution/tour route, individual vehicle attributes, and the size of development/operation.Calvin, Giordano & AssociatesPage II
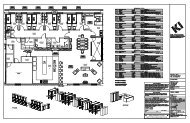
City of <strong>Key</strong> <strong>West</strong> <strong>Carrying</strong> <strong>Capacity</strong> <strong>Traffic</strong> <strong>Study</strong>Table AExisting Conditions <strong>Capacity</strong> DeficienciesMETHODOLOGYFDOT Generalized LOS TablesVolume/<strong>Capacity</strong> RatioHighway <strong>Capacity</strong> Manual (HCM)METHODOLOGYVISSIM Micro-SimulationOVER CAPACITY CORRIDORSDuval StreetEaton StreetPalm AvenueN. Roosevelt BoulevardTruman AvenueDuval StreetN. Roosevelt BoulevardTruman AvenueWhitehead StreetDuval StreetWhitehead StreetTruman AvenueN. Roosevelt BoulevardPalm Avenue/1st Street/Bertha StreetOVER CAPACITY INTERSECTIONSWhitehead Street/Southard StreetWhitehead Street/Truman AvenueDuval Street/Truman AvenueSimonton Street/Truman AvenuePalm Avenue (1st Street)/N. Roosevelt BoulevardN. Roosevelt Boulevard/Overseas HighwayOptimized Conditions AnalysisSince the existing roadway infrastructure within the City is generally not conducive to traditionalcapacity improvements, such as roadway widening, focus was shifted to operationalimprovements such as traffic signal modifications. Improvements to existing traffic signaltiming were shown to significantly improve corridor and intersection operations,potentially generating additional roadway capacity, as illustrated in Figure B below.In addition to the signal timing improvements, one roadway infrastructure improvement wasconsidered. It would be relatively cost-effective to extend the length of the exclusive left turnlane on Palm Avenue at N. Roosevelt Boulevard by approximately 200 feet. This roadwaymodification would significantly improve traffic operations at the intersection and throughout thecorridor.Calvin, Giordano & AssociatesPage III
City of <strong>Key</strong> <strong>West</strong> <strong>Carrying</strong> <strong>Capacity</strong> <strong>Traffic</strong> <strong>Study</strong>Figure BAverage Travel Delay Comparison31002900270020.9%Decrease inTravel Time DelayAverage Travel Delay (s)250023002100190017001500ExistingConditionsOptimizedConditionsCalvin, Giordano & AssociatesPage IV
Re<strong>com</strong>mendationsCity of <strong>Key</strong> <strong>West</strong> <strong>Carrying</strong> <strong>Capacity</strong> <strong>Traffic</strong> <strong>Study</strong>1. Plan for and Implement a City-Wide Signal Timing Program to Address Over-<strong>Capacity</strong>Roadway Congestion.Several primary roadway corridors and intersections within the City operate below theacceptable Level of Service thresholds established in the City Comprehensive Plan. The resultsof this study illustrated that improvements to the traffic signal operations can have a significantbenefit to traffic operations on the overall City roadway network.Most of the signalized intersections in Old Town operate on fixed signal timing which means thegreen time allotted to each particular traffic movement does not vary as the traffic demandschange. It is beneficial to operate traffic signals with actuation rather than fixed timing.Actuation simply means that as the traffic demands increase for a given traffic movement (suchas northbound left-turns, or east bound through movements, etc.), more green time is allocated tothe higher demand movement. This is ac<strong>com</strong>plished through the use of traffic detectors whichidentify fluctuations in traffic demand. The conversion of a fixed signal timing intersection to anactuated signal timing intersection will require vehicle detection equipment. Common vehicledetectors include in-ground loop detectors, microwave detectors, and video detectors. Actuatedsignals would minimize wasted green time and improve the efficiency of individual intersectionsand overall corridors. To realize the most benefit with the least initial cost, it is re<strong>com</strong>mended theCity implement the following prioritization for signal timing improvements:1. Optimize signal timing at intersections already equipped with vehicle detector equipment.2. Install vehicle detector equipment and optimize signal timing at intersections capable ofac<strong>com</strong>modating the installation of vehicle detector equipment.3. Modify traffic signal equipment, install vehicle detector equipment and optimize signaltiming at intersections currently without detection capabilities.The signalized intersections phasing plan as well as the existing and optimized signal timingplans are included in Appendix P. ***It should be noted that fine-tuning of the proposed signaltiming plans will be required in the field. This should be supervised by an experiencedprofessional traffic engineer.Signal timing progression along the corridors could also increase the efficiency of the roadwaynetwork. Progression involves timing traffic signals along a particular corridor in such a way thatgroups of vehicles can travel through several intersections without stopping. Signal timingprogression is <strong>com</strong>monly implemented by installing underground fiber-optic cables to connectseveral traffic signals along a corridor. The traffic signals are then able to “<strong>com</strong>municate” witheach other and respond to traffic demand. Implementing signal timing progression would requirea substantial infrastructure investment and therefore may not be immediately feasible.Calvin, Giordano & AssociatesPage V
City of <strong>Key</strong> <strong>West</strong> <strong>Carrying</strong> <strong>Capacity</strong> <strong>Traffic</strong> <strong>Study</strong>2. Establish and Implement a Transportation Concurrency Management System toAddress New Franchise Agreements and Land Development Projects.This study documented that several roadway corridors and intersections are operating belowacceptable LOS thresholds established in the City’s Comprehensive Plan. It is thereforereasonable to conclude that the addition of any new traffic generators without substantialcapacity improvements would only exacerbate traffic congestion. The signal timingimprovements proposed in this study were shown to likely result in improved traffic operationsand additional roadway capacity. In the event additional roadway capacity is generated, it isre<strong>com</strong>mended the City monitor the availability of the excess capacity through a TransportationConcurrency Management System.Concurrency Management Systems stem from Florida Statues relating to growth managementwhich require that facilities needed to support new development, such as roadways, are in place“concurrent” with the new development. In this instance, new trip generators, such as franchiseagreements or land development projects, would need to demonstrate that roadway capacity isavailable to support the proposed franchise agreement or project.Applicants for new franchise agreements or land development projects can utilize the VISSIMtraffic model provided in this study to demonstrate the effects of their respective projects on theoverall roadway network. It is re<strong>com</strong>mended that these traffic impacts be considered on a casespecificbasis for several reasons: Franchise vehicle characteristics that effect roadway capacity can vary greatly. Individualapplicants can provide the City with specific vehicle attributes at the time of application. Proposed tour routes or areas of utilization can vary greatly. Individual applicants canprovide the City specific information as to their proposed routes.The City should require all applicants for franchise agreements or land development projectssubmit a traffic study demonstrating the effects of the proposed application on the overallroadway network. Applicants who are able to demonstrate that their particular traffic applicationwill not exceed available roadway network capacity could then be considered for approval. Forapplicants that are unable to demonstrate an ability to work within available roadway capacitylimits, the City may elect to request that the applicant contribute to a predetermined congestionmanagement project, at the discretion of the City. This type of concurrency managementrequirement is <strong>com</strong>monplace throughout the State of Florida.3. Utilize VISSIM Software for Future <strong>Traffic</strong> Analysis.VISSIM micro-simulation traffic software was chosen for this study in order to accuratelyanalyze the wide variety of multi-modal vehicles in the City. Many popular traffic softwarepackages such as Synchro and HCS are limited with regard to the types of vehicles that can beevaluated. As part of this study, a highly calibrated VISSIM model was constructed and will beCalvin, Giordano & AssociatesPage VI
City of <strong>Key</strong> <strong>West</strong> <strong>Carrying</strong> <strong>Capacity</strong> <strong>Traffic</strong> <strong>Study</strong>provided to City Staff for use at their discretion. The existing conditions VISSIM modelen<strong>com</strong>passes over 50 intersections and 15 corridors.As improvements are made to the signal timing, the VISSIM model can be quickly updated toaccount for the future modifications. The VISSIM model can be updated for infinite future trafficconditions and scenarios such as:Proposed franchise vehicle operations.Proposed land development projects.Proposed modifications to intersection and roadway operations such as one-way streets.Future construction projects and associated detours.New bicycle/pedestrian facilities.New bus routes.Signal timing changes.CGA will provide City Staff with a day of training on how to use the software. It is, however,re<strong>com</strong>mended that a professional traffic engineer be consulted for any major modifications oranalysis.4. Monitor <strong>Traffic</strong> Counts on an Annual Basis.It is not expected that the traffic patterns will greatly change in the short term but traffic patternsare not stagnant over time. The FDOT has 23 count stations in the City that are updated on anannual basis. These counts should be reviewed as they are a good indicator of any increase ordecrease of traffic volumes over a several year time frame. In addition to the bi-directionalroadway counts collected by the FDOT, turning movement counts should also be periodicallyupdated. Travel patterns can change for a number of reasons, the most <strong>com</strong>mon being newdevelopment and infrastructure improvements. Whenever traffic patterns change, it will bebeneficial to modify and optimize signal timing.5. Lengthen the Existing Southeast Bound Left Turn on Palm Avenue at N. RooseveltBoulevard.The southeast bound approach at the intersection of Palm Avenue and N. Roosevelt Boulevard(left-turn movement from Palm Avenue onto N. Roosevelt Blvd) is operating at LOS E duringthe Mid Day and PM peak hours. The analysis demonstrated that excessive vehicle queuingoccurs at this approach due to the high volume of left-turning traffic (590 vehicles during the PMpeak hour). This excessive queuing not only causes delay for the left-turn movement, butexacerbates the overall delay at the intersection. The existing left turn lane length ofapproximately 170 feet should be extended by at least 200 feet to ac<strong>com</strong>modate the vehiclequeue. This will greatly improve the overall operation of the intersection. A cursory review ofthe lane geometry indicated that adequate right-of-way is likely available to ac<strong>com</strong>modate theproposed lane extension.Calvin, Giordano & AssociatesPage VII
City of <strong>Key</strong> <strong>West</strong> <strong>Carrying</strong> <strong>Capacity</strong> <strong>Traffic</strong> <strong>Study</strong>6. Plan for and Implement a Sign Inventory and Improvement Program.The data collected as part of this study indicate that over the past five years, more than 25% ofthe parking violations occurred from unauthorized parking in a designated parking space or in ano parking zone. Since the City is host to a high volume of tourists who may be unfamiliar withlocal regulations, it may be beneficial to work to improve signage associated with local parkingrestrictions and regulations.Other deficiencies in the City’s traffic signage were also observed such as signage that is non<strong>com</strong>pliantwith the Manual of Uniform <strong>Traffic</strong> Control Devices (MUTCD). Ensuring that allroadway signage within the City is <strong>com</strong>pliant with current MUTCD standards will likelyimprove driving conditions for motorists and ultimately improve roadway capacity.7. Plan for and Construct Additional Off-Street Parking Facilities.<strong>Key</strong> <strong>West</strong> residents who participated in surveys associated with this study were strongly in favorof adding more off-street parking facilities. On-street parking facilities can contribute to roadwaycongestion as drivers search for and maneuver within available parking spaces. The addition ofoff-street parking facilities may reduce some roadway congestion by providing an alternative toon-street parking facilities.8. Consider Installing Shared Lane Markings for Bicycles in Accordance with NewlyAdopted MUTCD Standards.Bicycles accounted for approximately 8.3% of the overall traffic volumes collected as part of thisstudy and it is evident that bicycles are a popular mode of transportation for both residents andtourists. Although there are few opportunities for new dedicated bike lanes within the City due toexisting right-of-way limitations, alternative traffic signage and pavement markings couldgreatly improve the bicycling experience throughout the City. The 2009 Manual of Uniform<strong>Traffic</strong> Control Devices (MUTCD) allows for a shared lane marking to be used to:1. Assist bicyclists with lateral positioning in a shared lane with on-street parallel parking inorder to reduce the chance of a bicyclist’s impacting the open door of a parked vehicle,2. Assist bicyclists with lateral positioning in lanes that are too narrow for a motor vehicleand a bicycle to travel side by side within the same traffic lane,3. Alert road users of the lateral location bicyclists are likely to occupy within the traveledway,4. Encourage safe passing of bicyclists by motorists, and5. Reduce the incidence of wrong-way bicycling.If new bicycle routes are established on roadways without dedicated bike lanes, shared lanemarkings along with the applicable traffic signage (R4-11: “May Use Full Lane” and W16-1P:Calvin, Giordano & AssociatesPage VIII
City of <strong>Key</strong> <strong>West</strong> <strong>Carrying</strong> <strong>Capacity</strong> <strong>Traffic</strong> <strong>Study</strong>“Share the Road”) should be considered. Related excerpts from the 2009 MUTCD identifyingthe proposed shared lane markings are included in Appendix Q.9. Complete All-Way Stop Warrant Analysis Prior to the Conversion of Two-Way StopControl (TWSC) Intersections to All-Way Stop Control (AWSC).The City receives numerous requests for additional stop control at intersections for variousreasons. The State of Florida has adopted standards set forth in the 2009 Manual on Uniform<strong>Traffic</strong> Control Devices (MUTCD) to address traffic control modifications, includingconversions of stop-controlled intersections. It is important that standards set forth in theMUTCD are followed when considering traffic operational changes.Calvin, Giordano & AssociatesPage IX
City of <strong>Key</strong> <strong>West</strong> <strong>Carrying</strong> <strong>Capacity</strong> <strong>Traffic</strong> <strong>Study</strong>TABLE OF CONTENTSPageEXECUTIVE SUMMARY ............................................................................................ I-IX1.0 INTRODUCTION .........................................................................................................12.0 DATA COLLECTION ..................................................................................................22.1 Determination of Peak Season ...........................................................................22.2 Turning Movement Counts ................................................................................72.3 24 Hour Bi-Directional Tube Counts .................................................................92.4 Speed Counts ...................................................................................................102.5 Travel Time Runs ............................................................................................112.6 Multi-Modal Vehicle Attributes ......................................................................172.7 Roadway Characteristics ..................................................................................222.8 Speed Limit Inventory .....................................................................................232.9 Parking Inventory.............................................................................................232.10 Loading Zones ...............................................................................................302.11 Parking Violations .........................................................................................302.12 Bike Lane Inventory ......................................................................................322.13 Sound Level Measurements ...........................................................................343.0 PUBLIC OUTREACH .................................................................................................364.0 EXISTING CONDITIONS ANALYSIS .....................................................................384.1 Street Classifications ........................................................................................384.2 Roadway Level of Service ...............................................................................424.3 Travel Time Run Existing Conditions .............................................................444.4 FDOT LOS Tables ...........................................................................................474.5 Highway <strong>Capacity</strong> Manual V/C Ratios ............................................................514.6 Microscopic <strong>Traffic</strong> Simulation .......................................................................534.7 VISSIM Network .............................................................................................544.8 Intersection Level of Service ...........................................................................594.9 Analysis of Failing Roadways and Intersections .............................................654.10 Staples Avenue Bridge ...................................................................................715.0 FUTURE CONDITIONS ANALYSIS ........................................................................725.1 Background Growth .........................................................................................725.2 Optimized Conditions ......................................................................................755.3 Duval Street Scenarios .....................................................................................856.0 CONCLUSIONS..........................................................................................................877.0 RECOMMENDATIONS .............................................................................................91Calvin, Giordano & AssociatesPage i
City of <strong>Key</strong> <strong>West</strong> <strong>Carrying</strong> <strong>Capacity</strong> <strong>Traffic</strong> <strong>Study</strong>List of TablesNumber Description Page1 US-1 Monthly <strong>Traffic</strong> Volumes ................................................................. 32 Monthly Cruise Ship Passengers and Vessel Embarkments ...................... 53 Monthly Ferry Vessel Embarkments ......................................................... 64 Old Town and Non-Old Town Vehicle Classification Percentages .......... 85 24-Hour Tube Counts ................................................................................ 96 Speed Count Data .................................................................................... 107 TravTime Results ..................................................................................... 148 Posted Speed Limits ................................................................................. 239 Parking Utilization ................................................................................... 2510 Parking Violations Fiscal Years 2006-2010 ............................................ 3111 Typical Sound Levels .............................................................................. 3412 Urban Street Class Based On Functional and Design Categories............ 4113 Roadway Functional and Design Categories ........................................... 4114 LOS Standards ......................................................................................... 4315 Urban Street Level of Service by Classification ...................................... 4416 TravTime Results – Existing LOS ........................................................... 4517 Two-Way Peak Hour V/C Ratios ............................................................ 4818 Directional Peak Hour V/C Ratios ........................................................... 4919 HCM Critical V/C Ratios......................................................................... 5220 Existing Conditions Average Speed Comparison .................................... 5621 Existing Conditions Travel Time Comparison ........................................ 5722 LOS Criteria for Signalized Intersections ................................................ 5923 LOS Criteria for Stop Controlled Intersections ....................................... 6024 Intersections Existing Conditions ............................................................ 6125 FDOT Historical <strong>Traffic</strong> Volumes ........................................................... 7326 Monroe County Population Projections ................................................... 7427 Signalized Intersection Operations .......................................................... 7628 Optimized Conditions Average Speed ..................................................... 7829 Optimized Conditions Travel Times ........................................................ 80Calvin, Giordano & AssociatesPage ii
City of <strong>Key</strong> <strong>West</strong> <strong>Carrying</strong> <strong>Capacity</strong> <strong>Traffic</strong> <strong>Study</strong>List of ExhibitsNumber Description Page1 <strong>Study</strong> Corridors and Intersections ............................................................ 132 PM Peak Hour Average Speed ................................................................ 153 Downtown Parking Inventory .................................................................. 274 Bicycle Routes ......................................................................................... 335 PM Peak Hour Two-Way V/C Ratios ...................................................... 506 PM Peak Hour Directional LOS .............................................................. 587 Intersections with a LOS E or LOS F Approach ..................................... 668 Optimized Conditions PM Peak Hour Directional LOS .......................... 799 PM Peak Hour Travel Times ................................................................... 8110 PM Peak Hour Travel Delay .................................................................... 82List of FiguresNumber Description Page1 Greenhouse Gas Emissions ...................................................................... 162 Observed Sound Levels ........................................................................... 353 Hierarchy of <strong>Traffic</strong> Evaluation Tools ..................................................... 534 Average Speed Comparison ..................................................................... 835 Average Travel Time Comparison ........................................................... 836 Average Travel Delay Comparison ......................................................... 84AppendixAppendix A – Turning Movement CountsAppendix B – 24-Hour Tube CountsAppendix C – Speed CountsAppendix D – TravTime ResultsAppendix E – Cale Pay Station Parking DataAppendix F – Sound RecordingsAppendix G – Community Values Survey and Open House QuestionnaireAppendix H – FDOT Quality/Level of Service TablesAppendix I – HCS ReportsAppendix J – VISSIM Existing Conditions ResultsAppendix K – Existing Conditions Signal TimingAppendix L – FDOT AADT Historical Trend AnalysisAppendix M – FDOT <strong>Traffic</strong> CountsAppendix N – VISSIM Optimized Conditions ResultsAppendix O – Optimized Conditions Signal TimingAppendix P – Existing & Optimized Signal Timing ComparisonAppendix Q – MUTCD Shared Lane MarkingsCalvin, Giordano & AssociatesPage iii
City of <strong>Key</strong> <strong>West</strong> <strong>Carrying</strong> <strong>Capacity</strong> <strong>Traffic</strong> <strong>Study</strong>1.0 INTRODUCTIONThe City of <strong>Key</strong> <strong>West</strong> is a city of historic significance located at the southern tip of the Florida<strong>Key</strong>s and is the southernmost city in the continental United States. The Florida Bureau ofEconomic Business Research (BEBR) estimated the 2009 population of <strong>Key</strong> <strong>West</strong> at 23,178residents; however the number of people in the City at any given time can vary greatly due to theseasonal nature of the tourism industry. The primary industry in the City is tourism which bringsin people from all over the world to see the historic City.Many of the streets within the City are narrow two-lane roadways with very limited opportunitiesfor roadway widening due to physical constraints. The historical significance and unique natureof the City brings in thousands of tourists annually. Tourists arrive and depart the City viamotorized vehicles, air travel, ferry boats and cruise ships.The unique qualities and characteristics of <strong>Key</strong> <strong>West</strong> have led to the proliferation of a widevariety of non-traditional modes of transportation. This is most evident in the part of the Cityknown as Old Town. In addition to standard passenger cars, delivery trucks, and buses, other<strong>com</strong>mon vehicle types include tour trains, tour trolleys, electric cars, scooters, bikes, andpedicabs. These multi-modal transportation alternatives along with high pedestrian activity andthe existing roadway infrastructure limitations present a unique challenge in assessing theexisting and future roadway capacity. For this reason, careful consideration was given to severalcarrying capacity methodologies, which are outlined in detail within this following report.This study will assess the carrying capacity of the existing roadway network and providere<strong>com</strong>mendations for improvements, when possible. The study will address specialized vehiclesand their impacts to roadways and adjacent land uses including impacts associated with mobility,noise, and air quality.Calvin, Giordano & Associates Page 1
City of <strong>Key</strong> <strong>West</strong> <strong>Carrying</strong> <strong>Capacity</strong> <strong>Traffic</strong> <strong>Study</strong>2.0 DATA COLLECTIONAn extensive amount of data collection was undertaken for this study in order to develop anoverview of the existing transportation facilities within the City. The data collection process wasan integral <strong>com</strong>ponent in determining existing capacity, and provided a baseline to estimatepotential future capacity and feasible transportation related improvements. The following itemswere evaluated as part of the data collection process:Intersection <strong>Traffic</strong> Turning Movement Counts24-Hour Bi-Directional Tube Counts<strong>Traffic</strong> Speed CountsVehicle Classification CountsCorridor Travel Time RunsMulti-Modal Vehicle AttributesGeneral Roadway CharacteristicsExisting Speed Limit InventoryExisting Parking InventoryCruise Ship Related DataExisting Bike Lane InventoryExisting <strong>Traffic</strong> Sound Level Sampling2.1 Determination of Peak SeasonFor many reasons, such as fluctuations in demand from the tourism industry and seasonalvariations in the weather, the population of the City of <strong>Key</strong> <strong>West</strong> can vary greatly throughout atypical year. In addition to the transient population attributable to tourism, <strong>Key</strong> <strong>West</strong> is home tomany “seasonal” residents who only reside in the area during the winter months. In order todetermine the peak seasonal periods, available monthly data was evaluated for traffic counts,cruise ship passengers, and ferry vessel departures.The Florida Department of Transportation (FDOT) collects traffic data at numerous locationsthroughout the City for various time durations. However, the FDOT has only one continuouscount station within the area that collects traffic volumes on a daily basis. This count station islocated on US-1 approximately 1,200 feet east of Cow <strong>Key</strong> Bridge on Stock Island. The monthlybreakdown of traffic counts from 2004 through 2010 is presented on Table 1. The data indicatesthat the highest traffic volumes are present from January to April at this location.Calvin, Giordano & Associates Page 2
City of <strong>Key</strong> <strong>West</strong> <strong>Carrying</strong> <strong>Capacity</strong> <strong>Traffic</strong> <strong>Study</strong>Table 1US-1 Monthly <strong>Traffic</strong> VolumesMonth 2004 2005 2006 2007 2008 2009 2010 AverageJanuary 38,800 39,600 38,250 36,900 36,700 35,800 36,700 37,500February 41,000 41,300 41,500 38,800 39,300 38,200 38,900 39,900March 43,200 43,000 41,300 40,500 39,900 38,900 40,300 41,000April 40,500 39,200 38,700 38,300 36,700 37,200 38,400 38,400May 38,400 38,300 37,100 36,500 35,100 34,600 36,600 36,700June 37,900 36,900 36,000 35,500 34,300 34,000 35,400 35,700July 38,000 33,900 35,600 35,100 33,300 34,200 34,400 34,900August 34,800 33,500 33,400 34,700 32,200 N/A 34,000 33,800September 30,200 33,700 32,900 32,900 28,800 32,800 32,800 32,000October 37,000 32,000 35,100 34,700 32,600 34,300 35,000 34,400November 37,300 40,300 34,400 33,900 32,200 34,100 34,600 35,300December 36,600 36,000 35,400 35,200 34,000 36,200 35,200 35,500Source: FDOT Count Station 90-0165 located on US-1 1,200 feet east of Cow <strong>Key</strong> Bridge on Stock IslandYellow highlight indicates highest four monthsCalvin, Giordano & Associates Page 3
City of <strong>Key</strong> <strong>West</strong> <strong>Carrying</strong> <strong>Capacity</strong> <strong>Traffic</strong> <strong>Study</strong>Cruise ships are a very prevalent <strong>com</strong>ponent of the tourism industry in <strong>Key</strong> <strong>West</strong>. At the time ofthis study, there were three docking facilities available to large cruise ships: Mallory SquareDock, Pier B, and the Navy Mole. The monthly breakdown of actual cruise ship passenger andvessel disembarkments between fiscal years 2001-2002 and 2010-2011 are shown on Table 2.The data indicates that the highest number of passengers and port calls historically has beenbetween the months of December and March.The final item used to determine the peak season was monthly ferry vessel embarkments. At thetime of this study, there were three ferry vessels servicing the City: the <strong>Key</strong> <strong>West</strong> Express, theBig Cat, and the Whale Watcher. The monthly breakdown of ferry vessel embarkments betweenfiscal years 2006-2007 and 2009-2010 is shown on Table 3. The results indicate that the highestnumber of ferry departures historically has occurred between the months of January and April.The <strong>com</strong>bined data of the FDOT traffic counts, cruise ship data, and the ferry vessel datademonstrates that the peak season is generally between the months of December and April.Additionally, City staff had indicated the months of January through March as peak season for<strong>Key</strong> <strong>West</strong>. Therefore, the majority of the peak season data collection was performed from lateJanuary to early March. Travel time runs and daily traffic volumes for the study corridors werecollected during late January while intersection turning movement counts for the studyintersections were collected during early March.Calvin, Giordano & Associates Page 4
City of <strong>Key</strong> <strong>West</strong> <strong>Carrying</strong> <strong>Capacity</strong> <strong>Traffic</strong> <strong>Study</strong>Table 2Monthly Cruise Ship Passengers and Vessel DisembarkmentsPassenger DataMonth FY 01-02 FY 02-03 FY 03-04 FY 04-05 FY 05-06 FY 06-07 FY 07-08 FY 08-09 FY 09-10 FY 10-11 AVERAGEOctober 49,306 80,551 64,237 64,920 38,120 60,080 68,205 50,362 64,745 77,422 61,795November 80,891 102,590 73,942 78,704 64,312 77,532 60,764 64,957 63,456 80,471 74,762December 91,242 126,166 116,153 114,988 103,652 97,576 92,184 92,359 75,119 90,852 100,029January 86,393 109,501 95,356 104,759 96,322 75,714 86,253 71,819 69,747 95,777 89,164February 81,250 109,767 91,782 97,204 85,508 73,057 81,686 77,595 60,465 82,113 84,043March 88,441 109,757 108,987 112,234 100,221 93,470 82,145 78,309 79,734 88,926 94,222April 82,478 103,891 88,213 89,646 89,444 81,119 78,328 72,938 72,484 77,691 83,623May 71,832 76,109 75,110 67,704 64,016 46,026 44,222 91,120 60,829 49,793 64,676June 72,245 76,122 69,907 64,204 62,702 47,437 35,910 79,830 69,457 46,502 62,432July 83,902 78,078 46,355 63,989 62,566 52,627 45,266 64,231 64,665 54,129 61,581August 79,527 84,158 62,023 68,728 50,600 69,083 33,517 58,605 71,077 N/A 64,146September 75,129 65,507 37,725 49,681 41,626 57,233 45,927 61,642 53,067 N/A 54,171Port CallsMonth FY 01-02 FY 02-03 FY 03-04 FY 04-05 FY 05-06 FY 06-07 FY 07-08 FY 08-09 FY 09-10 FY 10-11 AVERAGEOctober 27 44 32 34 18 29 35 22 28 35 30November 51 57 43 46 35 40 31 31 28 36 40December 57 79 60 63 55 51 49 46 34 39 53January 50 66 51 52 50 41 46 37 37 45 48February 47 63 46 48 44 38 40 39 29 37 43March 51 56 54 57 48 48 39 34 35 40 46April 44 56 42 51 41 39 37 34 31 34 41May 35 38 36 33 29 21 18 37 24 18 29June 32 39 31 28 26 20 14 29 26 16 26July 35 34 20 28 26 22 18 23 23 18 25August 33 40 28 31 21 28 13 21 26 N/A 27September 35 31 19 24 20 26 20 25 21 N/A 25Source: City of <strong>Key</strong> <strong>West</strong>, 2011Calvin, Giordano & Associates Page 5
City of <strong>Key</strong> <strong>West</strong> <strong>Carrying</strong> <strong>Capacity</strong> <strong>Traffic</strong> <strong>Study</strong>Table 3Monthly Ferry Vessel EmbarkmentsMonth<strong>Key</strong><strong>West</strong>ExFY 06-07 FY 07-08 FY 08-09 FY 09-10VesselVesselVesselVesselBigCatWhaleWatcherTotal<strong>Key</strong><strong>West</strong>ExBigCatWhaleWatcherTotal<strong>Key</strong><strong>West</strong>ExBigCatWhaleWatcher<strong>Key</strong><strong>West</strong>ExBigCatWhaleWatcherAVERAGETOTALOctober 21 3 0 24 22 13 0 35 10 15 0 25 17 8 0 25 27November 21 0 2 23 21 9 0 30 9 11 0 20 15 8 0 23 24December 11 12 7 30 22 12 7 41 9 12 6 27 11 9 6 26 31January 15 15 10 40 27 6 9 42 18 11 10 39 17 12 8 37 40February 23 9 12 44 27 9 19 55 23 5 17 45 30 1 14 45 47March 31 21 28 80 29 7 27 63 28 3 27 58 N/A N/A N/A N/A 67April 27 14 15 56 29 0 9 38 22 6 14 42 N/A N/A N/A N/A 45May 31 14 0 45 6 25 0 31 13 18 0 31 N/A N/A N/A N/A 36June 29 9 0 38 12 18 0 30 11 19 0 30 N/A N/A N/A N/A 33July 31 13 0 44 13 18 0 31 16 15 0 31 N/A N/A N/A N/A 35August 26 10 0 36 12 11 0 23 8 17 0 25 N/A N/A N/A N/A 28September 22 10 0 32 9 8 0 17 6 14 0 20 N/A N/A N/A N/A 23TotalTotalCalvin, Giordano & Associates Page 6
City of <strong>Key</strong> <strong>West</strong> <strong>Carrying</strong> <strong>Capacity</strong> <strong>Traffic</strong> <strong>Study</strong>2.2 Turning Movement Counts<strong>Traffic</strong> turning movement counts were collected for 25 key intersections within the City. The 25intersections chosen for counts were agreed upon during scoping discussions with City staff. The25 study intersections are shown below:Whitehead St at Greene StWhitehead St at Fleming StWhitehead St at Southard StDuval St at Front StDuval St at Eaton StDuval St at Southard StDuval St at Angela StDuval St at Truman AveDuval St at South StSimonton St at Caroline StSimonton St at Fleming StSimonton St at United StGrinnell St at Fleming StWhite St at Eaton StWhite St at Southard StWhite St at Truman AveWhite St at Catherine StWhite St at Flagler AvePalm Ave/1 st St at Truman Ave1 st St at Flagler AveRoosevelt Blvd at Kennedy DrRoosevelt Blvd at Overseas HwyRoosevelt Blvd at Flagler AveOlivia St at Frances StThomas St at Petronia StThe turning movement counts were collected from March 5, 2011 to March 16, 2011 from 7-9AM, 12-1 PM, and 4-6 PM. Additionally, the following vehicle classifications were collectedduring all of the turning movement counts:1. Cars/Trucks2. Bicycles3. Scooters4. Delivery Trucks/Buses5. Electric Cars6. Tour Trains7. Pedicabs/3-Wheeled Bicycles8. Tour Vehicles9. PedestriansStandard traffic engineering procedures generally call for vehicle classifications counts for onlycars/trucks, heavy vehicles (which incorporates delivery trucks, buses, etc.), and pedestrians.However, due to the unique nature of the City of <strong>Key</strong> <strong>West</strong> and to provide a more detailedanalysis of roadway functionality, additional multi-modal vehicles were identified. Deliverytrucks were grouped with buses since their vehicle characteristics such as size, acceleration,deceleration, and desired speed, are very similar for transportation modeling purposes. This isconsistent with nationally accepted Highway <strong>Capacity</strong> Manual procedures.Calvin, Giordano & Associates Page 7
City of <strong>Key</strong> <strong>West</strong> <strong>Carrying</strong> <strong>Capacity</strong> <strong>Traffic</strong> <strong>Study</strong>The multimodal vehicles are primarily found in the “Old Town” area of the City. For purposes ofthe study, the Old Town area will consist of the entire lengths of Whitehead Street, Duval Street,and Simonton Street. Table 4 identifies the vehicle classifications for the Old Town area and thenon-Old Town area. The vehicle classification percentages were determined from the 25 studyintersections and broken down by the AM, Mid-Day (MD), and PM peak hours. The raw datasheets for the turning movement counts are included in Appendix A.Table 4Old Town and Non-Old Town Vehicle Classification PercentagesVehicle ClassificationOld TownNon-Old TownAM MD PM AM MD PMCars/Trucks 71.3% 63.6% 63.7% 89.5% 89.3% 90.0%Bicycles 16.6% 17.0% 18.7% 3.8% 3.6% 3.8%Scooters 7.7% 11.0% 11.4% 4.3% 5.0% 5.0%Delivery Trucks/Buses 1.3% 1.0% 0.5% 1.9% 1.2% 0.6%Electric Cars 0.8% 3.5% 1.9% 0.2% 0.4% 0.2%Tour Trains 0.7% 1.3% 0.8% 0.1% 0.1% 0.1%Pedicabs 0.4% 1.4% 2.0% 0.1% 0.1% 0.1%Tour Vehicles 1.0% 1.4% 0.9% 0.2% 0.2% 0.2%Calvin, Giordano & Associates Page 8
City of <strong>Key</strong> <strong>West</strong> <strong>Carrying</strong> <strong>Capacity</strong> <strong>Traffic</strong> <strong>Study</strong>2.3 24-Hour Bi-Directional Tube Counts24-Hour Bi-Directional Tube Counts were collected during the months of January, April, andJuly of 2011. The 24-hour counts were performed at various months in order to establish peakand off peak seasonal adjustments. The locations and results of the 24-hour tube counts areshown on Table 5 for each month. The raw 24-hour tube counts are included in Appendix B.Table 52011 24-Hour Tube CountsJanuary April JulyRoadway Location CountDateDailyVolumeCountDateDailyVolumeCountDateDailyVolume1st St 50' W. of Flagler Ave 1/20/2011 6,366 4/28/2011 6,541 7/21/2011 5,598Duval St 210' E. of Fleming Ave 1/22/2011 6,714 5/1/2011 6,371 7/24/2011 4,590Eaton St 240' N. of Elizabeth St 1/20/2011 8,538 4/28/2011 9,031 7/21/2011 8,488Flagler Ave 220' N. of 1st St 1/21/2011 10,908 4/29/2011 13,756 7/22/2011 13,456Fleming St 50' S. of Elizabeth St 1/20/2011 2,995 4/28/2011 2,987 7/21/2011 2,745Simonton St 235' E. of Front St 1/22/2011 3,946 4/30/2011 4,854 7/23/2011 4,308South St 180' N. of Simonton St 1/22/2011 5,841 4/30/2011 6,797 7/23/2011 6,800Southard St 135' S. of Simonton St 1/20/2011 2,811 4/28/2011 3,219 7/21/2011 2,857Truman Ave 140' N. of Duval St 1/21/2011 8,459 4/29/2011 9,417 7/22/2011 7,345United St 250' S. of Williams St 1/21/2011 6,180 4/29/2011 7,027 7/22/2011 6,029N. Roosevelt1/20/2011 - 4/28/11 -7/21/2011 -230' N. of 1st St18,65219,874Blvd1/22/20114/30/117/23/201112,430White St 150' E. of Truman Ave 1/21/2011 9,231 4/29/2011 8,912 7/22/2011 9,076Whitehead St 220' E. of Greene St 1/22/2011 4,861 4/30/2011 5,106 7/24/2011 5,228TOTAL 95,502 103,892 88,950Calvin, Giordano & Associates Page 9
City of <strong>Key</strong> <strong>West</strong> <strong>Carrying</strong> <strong>Capacity</strong> <strong>Traffic</strong> <strong>Study</strong>2.4 Speed Counts<strong>Traffic</strong> speed counts were collected at the same time and location as the 24-hour bi-directionaltube counts. The speed data collection produced 50 th percentile and 85 th percentile speedvolumes for the study corridors. Standard traffic engineering principles call for the 85 thpercentile speed volume to be considered the free flow speed (FFS). However, due to the natureof the City, some of the collected speed data may have been heavily influenced by prevalentvehicle stops and slow downs. Therefore, the 85 th percentile speed may not necessarily reflectthe true FFS. The results of the speed data collection are shown on Table 6. The raw speedcounts are included in Appendix C.RoadwayLocationTable 6Speed Count DataNB/EBAverage(mph)85thPercentile(mph)Average(mph)SB/WB85thPercentile(mph)1st St 50' W. of Flagler Ave 19 25 13 20Duval St 210' E. of Fleming Ave 10 16 10 17Eaton St 240' N. of Elizabeth St 21 27 18 24Flagler Ave 220' N. of 1st St 21 28 16 26Fleming St 50' S. of Elizabeth St 16 23 N/A N/ASimonton St 235' E. of Front St 12 21 13 22South St 180' N. of Simonton St 20 27 17 24Southard St 135' S. of Simonton St N/A N/A 8 13Truman Ave 140' N. of Duval St 15 22 13 20United St 250' S. of Williams St 23 29 21 28N. RooseveltBlvd230' N. of 1st St 27 35 18 29White St 150' E. of Truman Ave 16 24 11 18Whitehead St 220' E. of Greene St 15 22 15 23Calvin, Giordano & Associates Page 10
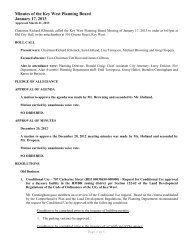
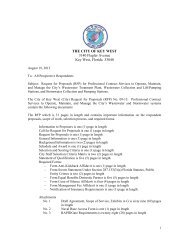
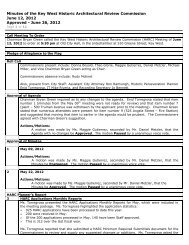
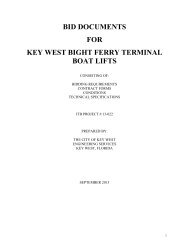
City of <strong>Key</strong> <strong>West</strong> <strong>Carrying</strong> <strong>Capacity</strong> <strong>Traffic</strong> <strong>Study</strong>2.5 Travel Time RunsTravel time runs were <strong>com</strong>pleted for the study corridors between January 20 and January 22,2011 as well as April 28 and April 29, 2011. The travel time runs were performed from 7-9 AM,11 AM–1 PM, and 4-6 PM for each of the study corridors. Several key corridors were selectedfor the travel time runs based on scoping meetings with the City staff. The selected key corridorsfor the travel time runs were:Whitehead StDuval StSimonton StWhite StEaton StFleming StSouthard StTruman AvenueUnited StSouth StFlagler AvePalm Ave1 st StBertha StN. Roosevelt BlvdThe study corridors and intersections areshown on Exhibit 1. The travel time runswere <strong>com</strong>puted utilizing GeoStats travelrecording technology. The small GPS travelrecorders were placed in vehicles that werethen driven by <strong>Traffic</strong> Engineers to travelthe aforementioned roadways during thedates and times listed above. The GPSrecorders collected numerous data statisticsincluding GPS coordinates, speed, anddistance traveled. Once the travel runs were<strong>com</strong>pleted, the data was uploaded to theGeoStats TravTime software.The TravTime software was then utilized to produce several measures of effectiveness such asaverage speed over a distance, delay, greenhouse gas emissions, and total travel time. This datahelped to identify and quantify existing roadway conditions and to calibrate the microscopicsimulation model. The average speed, congestion, and travel time results for each of the studycorridors are summarized on Table 7.The average speeds for each of the corridors were further broken down by direction and intosmall roadway segments. The small traffic segments were chosen using engineering judgmentbased on distinguishable roadway segmentation along the corridor. The average <strong>com</strong>bined twowayspeed for each of the study corridors during the PM peak hour is depicted on Exhibit 2.Calvin, Giordano & Associates Page 11
City of <strong>Key</strong> <strong>West</strong> <strong>Carrying</strong> <strong>Capacity</strong> <strong>Traffic</strong> <strong>Study</strong>The average speed by roadway segment results demonstrates that most of the congestion occursin the Old Town area. The roadways of Whitehead Street, Duval Street, Simonton Street, and theeast-west roadway segments between these roads have the lowest average speeds. Additionally,westbound Truman Avenue maintains a low average speed during the PM peak hour.The raw statistics, measure of effectiveness including the estimated greenhouse gas emissions,and graphs for the travel time runs are included in Appendix D.Calvin, Giordano & Associates Page 12
Exhibit 1 • <strong>Study</strong> Corridors & IntersectionsN. Roosevelt BlvdEaton StFlagler AveFleming StSouthard StFirst StSimonton StTruman AveWhite StDuval StBertha StWhitehead StUnited StSouth StLegend<strong>Study</strong> corridor<strong>Study</strong> Intersection<strong>Study</strong> IntersectionAdded Due to High Delay
City of <strong>Key</strong> <strong>West</strong> <strong>Carrying</strong> <strong>Capacity</strong> <strong>Traffic</strong> <strong>Study</strong>Table 7TravTime Results – Existing ConditionsCorridorAvgCong.Time(s)AMMid DayPMNB/ EB SB/ WB NB/ EB SB/ WB NB/ EB SB/ WBAvgSpeed(mph)AvgTime(s)AvgCong.Time(s)AvgSpeed(mph)AvgTime(s)AvgCong.Time(s)AvgSpeed(mph)Fleming St 68.4 15.03 172.2 N/A N/A N/A 166.2 10.37 253.2 N/A N/A N/A 147.0 10.65 240.0 N/A N/A N/ASouthard St N/A N/A N/A 129.6 11.02 235.2 N/A N/A N/A 120.0 11.86 218.4 N/A N/A N/A 106.8 11.88 215.4Duval St 134.4 13.36 285.6 147.0 12.94 294.6 409.8 7.72 494.4 512.4 6.97 547.2 543.6 6.63 581.4 578.4 6.25 610.8Whitehead St 97.2 14.94 241.2 75.6 16.25 221.4 238.2 10.33 348.6 277.8 9.78 368.4 238.8 10.34 348.0 299.4 9.06 405.6Simonton St 93.0 14.69 257.4 100.2 14.31 261.6 214.2 10.62 355.8 155.4 12.12 309.0 238.8 10.17 371.4 256.2 9.86 387.0South St 75.6 15.93 235.2 65.4 16.54 222.0 111.6 14.13 265.2 138.0 12.97 286.2 108.0 13.03 287.4 120.6 13.41 274.2United St 56.4 18.39 219.0 75.0 16.86 239.4 74.4 17.23 234.0 81.6 16.38 246.0 83.4 16.24 248.4 79.2 16.32 247.2White St 79.8 17.2 240.6 89.4 16.05 251.4 107.4 15.04 270.6 124.2 14.49 280.8 99.6 15.43 265.8 126.6 14.08 286.2Palm Ave/1st St 115.2 17.6 315.0 81.0 20.01 273.6 142.8 16.09 344.4 98.4 18.63 294.0 172.8 14.18 388.2 272.4 11.8 463.8Eaton St 69.6 14.76 168.0 49.8 16.44 147.0 110.4 12.19 198.0 144.6 10.68 225.6 89.4 13.14 183.6 115.8 11.26 211.2Flagler Ave 51.6 24.21 400.2 82.2 22.12 439.2 105.6 21.69 444.6 81.6 22.33 435.0 84.0 22.49 427.2 76.8 22.47 432.6Truman 80.4 14.56 222.6 74.4 14.83 216.0 118.2 13.19 243.0 123.6 12.99 249.6 115.2 12.56 255.0 403.8 6.46 513.0US-1 112.2 22.53 431.4 143.4 21.63 452.4 166.2 19.88 489.0 250.2 16.98 576.6 208.8 17.68 550.2 237.0 17.89 547.2AvgTime(s)AvgCong.Time(s)AvgSpeed(mph)AvgTime(s)AvgCong.Time(s)AvgSpeed(mph)AvgTime(s)AvgCong.Time(s)AvgSpeed(mph)AvgTime(s)Notes:Congestion time for purposes of TravTime refers to total time spent under 15mph.Palm Ave, 1 st St, and Bertha St <strong>com</strong>bined into one study segmentNB/SB roadways include: Duval St, Whitehead St, Simonton St, White St, and Palm Ave/1 st St/Bertha St.EB/WB roadways include: Fleming St, Southard St, South St, United St, Eaton St, Flagler Ave, Truman Ave, and US-1.Calvin, Giordano & Associates Page 14
Exhibit 2 • PM Peak Hour Existing Conditions Average SpeedSPEEDLIMIT35N. Roosevelt BlvdSPEEDLIMIT30SPEEDLIMIT25SPEEDLIMIT30Eaton StFleming StSouthard StSPEEDLIMIT30Palm AveSPEEDLIMIT30Flagler AveFirst StSPEEDLIMIT3030White StSPEEDLIMITSimonton StTruman AveSPEEDLIMIT30Whitehead StDuval St25SPEEDLIMIT30SPEEDLIMIT30SPEEDLIMITSPEEDLIMIT25SPEEDLIMIT30United StSPEEDLIMIT25South StSPEEDLIMIT25Bertha St30SPEEDLIMIT0 - 10 MPHLegend10 - 15 MPH15 - 20 MPH20 - 25 MPH25 + MPHSPEEDLIMITXXExisting Speed LimitAverage speed by segment
City of <strong>Key</strong> <strong>West</strong> <strong>Carrying</strong> <strong>Capacity</strong> <strong>Traffic</strong> <strong>Study</strong>Greenhouse Gas EmissionsGreenhouse gas emissions were calculated for each of the study corridors utilizing the TravTimesoftware. The data output included emissions for Volatile Organic Compound (VOC), CarbonMonoxide (CO), and Oxides of Nitrogen (NOx). The results for the study corridors are shown onFigure 1. The data shown on Figure 1 includes the average emissions per mile of a standardpassenger vehicle during the PM peak hour.The roadways in the Old Town area produced greater emissions per mile per vehicle due to theheavier congestion and associated longer travel times per mile. Duval Street produced the highestamount of emissions while Flagler Avenue produced the lowest amount of emissions.Figure 1Greenhouse Gas Emissions6.00Emmissions in grams per mile5.004.003.002.001.000.00*Greenhouse gas emissions shown include the <strong>com</strong>bined total of Carbon Monoxide (CO), Volatile OrganicCompound (VOC), and Oxides of Nitrogen (NOx).Calvin, Giordano & Associates Page 16
City of <strong>Key</strong> <strong>West</strong> <strong>Carrying</strong> <strong>Capacity</strong> <strong>Traffic</strong> <strong>Study</strong>2.6 Multi-Modal Vehicle AttributesTravel time runs using the GeoStats GPS recorder were also <strong>com</strong>pleted for several of the multimodalvehicles in the City of <strong>Key</strong> <strong>West</strong>. Vehicle attributes such as size, speed, and accelerationfor cars, trucks, delivery trucks, buses, and bicycles are well documented in many nationallyrecognized microscopic traffic simulation programs. These simulation programs do not,however, contain specific standards for many of the unique vehicles that traverse the City of <strong>Key</strong><strong>West</strong>. Field data was therefore collected for tour trains, tour trolleys, pedicabs, scooters, andelectric cars. The attributes collected for the multi-modal vehicles were utilized in developing theexisting conditions traffic simulation model and determining the existing conditions for the studyintersections and corridors.Conch TrainThe Conch Train first departs at 9:00 AMand the last departure occurs at 4:30 PM.Train tours depart generally at least every 30minutes, with increased frequency whendemand calls for it. Each tour lastsapproximately 90 minutes and therefore,there are usually three tour trains on theroadway network at any given time duringoperational hours.The Conch Train is currently the only touring vehicle that could be considered a “tour train”. TheConch Train tour starts and ends on Front Street between Duval Street and Whitehead Street andtravels mostly in the Old Town area. In general, the Conch Train is not on any particularroadway segment for a long period of time and makes numerous turns throughout the tour. Giventhe large size of the vehicle (approximately 62 feet in length as <strong>com</strong>pared to a standard passengercar length of 15 feet), large gaps in traffic are necessary for the Conch Train to make left turns.This can cause additional delay for vehicles in the queue behind the Conch Train. Additionally,the Conch Train generally travels the roadways at a slower speed than regular vehicles since it isa sightseeing tour. This was measured using the GeoStats GPS recorder.Calvin, Giordano & Associates Page 17
City of <strong>Key</strong> <strong>West</strong> <strong>Carrying</strong> <strong>Capacity</strong> <strong>Traffic</strong> <strong>Study</strong>Tour TrolleysAt the time of this study, two tour trolley <strong>com</strong>panies were operational during daytime hours in<strong>Key</strong> <strong>West</strong>: Old Town Trolley and Cityview Trolley. Additionally, there were two “ghost tour”trolleys that were operational exclusively during the evening hours.Old Town TrolleyGenerally, the first daily departure for OldTown Trolley occurs at 9:00 AM and thelast daily departure occurs at 4:30 PM. TheOld Town Trolley has a departure frequencyof at least every 30 minutes with each tourlasting approximately 90 minutes.Therefore, there are usually three Old TownTour Trolleys on the roadway network atany given time during operational hours.Generally, the Old Town Trolley has twelve stops throughout the City. The primary stop is inproximity to the Conch Tour Train stop in Mallory Square. The Old Town Trolley travels mostlythroughout Old Town but also circulates around the entire city using N. Roosevelt Boulevard andS. Roosevelt Boulevard. Riders are able to freely board and depart any of the Old Town Trolleysat designated stops as frequently as they want during the same day after they purchase a boardingpass. Similarly to the Conch Train, the Old Town Trolley is generally not on a particularroadway segment for a long period of time and makes numerous turns throughout the tour. TheOld Town Trolley generally travels the roadways in Old Town at a slower speed than the regularvehicles and also must wait for larger gaps than standard passenger cars when making left turnsdue to the large size of the vehicle. This was measured using the GeoStats GPS recorder.Cityview TrolleyGenerally, the first daily departure forCityview Trolley occurs at 9:30 AM and thelast departure occurs at 4:30 PM. TheCityview Trolley has a departure frequencyof every 30 minutes with each tour lastingapproximately 60 minutes. Therefore, at anygiven time there are two Cityview Trolleyson the roadway network during operationalhours.Generally, the Cityview Trolley has eight stops throughout the City. The primary stop is atClinton Square on Whitehead Street just south of Front Street. The Cityview Trolley travelsthroughout Old Town and generally does not travel northeast of White Street. Riders are able toCalvin, Giordano & Associates Page 18
City of <strong>Key</strong> <strong>West</strong> <strong>Carrying</strong> <strong>Capacity</strong> <strong>Traffic</strong> <strong>Study</strong>freely board and depart any of the Cityview Trolleys at designated stops as frequently as theydesire during the same day after they purchase a boarding pass. Similarly to the Conch Train andOld Town Trolley, the Cityview Trolley generally makes numerous turns throughout the tourand is not on a particular roadway segment for a long period of time. The Cityview Trolleygenerally travels the roadways at a slower speed than regular vehicles and also must wait forlarger gaps than standard passenger cars when making left turns due to the large size of thevehicle. This was measured using the GeoStats GPS recorder.The Old Town Trolley and Cityview Trolley generally have similar vehicle characteristics interms of length, width, speed, and acceleration.PedicabsPedicabs are three-wheeled bicycles thatserve in a similar manner as taxis. At thetime of this study, the amount charged perpedicab ride was based on the amount oftime on the bicycle as opposed to distancetraveled. The City currently allows licensesfor 12 pedicabs in the City. Most of thepedicabs can be found in the Old Town areaparticularly Duval Street. However,occasionally pedicabs or other threewheeledbicycles can be found in other areasof the city. Most of the pedicabs operate inthe afternoon and evening hours to coincidewith tourist activity.Pedicabs travel the roadway generally on the right side of the roadway similar to bicycles whichallow faster moving vehicles to pass on the left side. However, pedicabs are much wider than abicycle making it a more difficult task for the passing vehicles. The City instructs pedicaboperators that drivers must pull off the road at intersections to allow traffic to pass. However,<strong>com</strong>pliance with this directive was observed to be sporadic. While the traveling speed of apedicab varies, they were observed in the field traveling significantly slower than passenger cars.This was measured using the GeoStats GPS recorder.Calvin, Giordano & Associates Page 19
City of <strong>Key</strong> <strong>West</strong> <strong>Carrying</strong> <strong>Capacity</strong> <strong>Traffic</strong> <strong>Study</strong>Electric CarsFor the purposes of this study, electric carsrefer to small vehicles, similar to golf cartsthat run entirely on electric power asopposed to gasoline. This classification doesnot include traditional passenger cars thatare electric or hybrid powered. The majorityof electric cars in <strong>Key</strong> <strong>West</strong> are rentalvehicles and not owned and used forpersonal uses by the local residents. Theyare popular tourist vehicles for both cruiseship passengers and overnight tourists. Theycan be rented for a set number of hours orovernight. The City currently allows licensesfor 17 electric car businesses and 208electric cars. Most of the electric cars can befound in the Old Town area particularlyDuval Street. However, it is <strong>com</strong>mon to seeelectric cars in other areas of the City aswell. Electric cars are more prevalent in theafternoon and evening hours when touristactivity is at its highest.Electric cars usually ac<strong>com</strong>modate two, four, or six passengers and they generally travel slowerthan passenger cars. This was measured using the GeoStats GPS recorder. The maximum speedof electric cars varies by model, size, and occupancy. However, most electric cars have two typesof drive modes which enable different maximum speeds. Generally, the slower drive mode has amaximum speed of around 15mph and the faster drive mode has a maximum speed of 25mph.Since most drivers of electric cars are tourists, there can be additional delay due to driverbehavior and unfamiliarity with the local roadway system.Calvin, Giordano & Associates Page 20
City of <strong>Key</strong> <strong>West</strong> <strong>Carrying</strong> <strong>Capacity</strong> <strong>Traffic</strong> <strong>Study</strong>ScootersElectric scooters or mopeds are popularvehicles in the City of <strong>Key</strong> <strong>West</strong>. The datacollection demonstrated that scooters<strong>com</strong>prise approximately 6.7% of the existingtraffic within the City. Scooters are<strong>com</strong>monly used by the local residents aswell as by tourists. Scooters could beconsidered well suited for <strong>Key</strong> <strong>West</strong>because of low speed limits, short traveldistances, smaller roadways, limited parkingand year-round warm weather. Scooters canbe rented for a set number of hours orovernight. The City currently allows licensesfor 22 scooter businesses and 985 scooterswithin the City. Additionally, there arecurrently licenses for five scooter deliverybusinesses from outside the city limits.There are a higher percentage of scooters inthe Old Town area but since scooters areused frequently by residents, they are<strong>com</strong>monly found throughout the City.Electric scooters generally are capable of traveling the speed limit on most of the roadways in<strong>Key</strong> <strong>West</strong>. However, some of the smaller engine scooters may not reach the 35 mph posted speedlimit on segments of N. Roosevelt Boulevard. The maximum speed and acceleration of scootersvaries by model, size, and occupancy.Calvin, Giordano & Associates Page 21
City of <strong>Key</strong> <strong>West</strong> <strong>Carrying</strong> <strong>Capacity</strong> <strong>Traffic</strong> <strong>Study</strong>BicyclesBicycles are also a popular mode oftransportation in the City of <strong>Key</strong> <strong>West</strong>. Thedata collection demonstrated that bicycles<strong>com</strong>prise approximately 8.3% of the existingtraffic within the City. Bicycles are<strong>com</strong>monly used by local residents as well astourists. Bicycles could be considered wellsuitedfor <strong>Key</strong> <strong>West</strong> because of short traveldistances, smaller roadways, limited parkingand year-round warm weather Bicycles canbe rented for a set number of hours orovernight. The City currently allows licensesfor 35 bicycle rental businesses.Dedicated bicycle lanes or shared use paths are present on the segments of the following studyroadways: Southard Street, Fleming Street, Palm Avenue, White Street, N. Roosevelt Boulevard,and Flagler Avenue.2.7 Roadway CharacteristicsA variety of roadway characteristics were collected and inventoried for each of the studycorridors. Data collected included but was not limited to speed limits, on-street parking facilities,bike lanes, roadway widths and lengths, geometry constraints, auxiliary turn lanes, and frequencyof driveways and roadway access points. Much of this information was incorporated into themicroscopic traffic simulation model.Calvin, Giordano & Associates Page 22
City of <strong>Key</strong> <strong>West</strong> <strong>Carrying</strong> <strong>Capacity</strong> <strong>Traffic</strong> <strong>Study</strong>2.8 Speed Limit InventoryAn inventory of posted speed limits was collected for the study corridors. The results are shownon Table 8. There are several corridors without posted speed limits. Pursuant to §316.183, F.S.and §316.189, F.S., the maximum speed within any municipality is 30 mph for business andresidence districts. A municipality may set a new maximum speed limit after an investigationdetermines that such a speed limit is reasonable. Therefore, it is assumed that all roadways thatdo not have a posted speed limit have a maximum speed limit of 30 mph.Table 8Posted Speed Limits25 mph 30 mph 35 mph Not PostedTruman Ave/ US-1west of Eisenhower DrRoosevelt Blvd/ US-1from Eisenhower Dr toParrot <strong>Key</strong> HotelRoosevelt Blvd/ US-1from Parrot <strong>Key</strong> Hotelto Overseas HwyWhite StFlagler Ave west of 1 st Roosevelt Blvd from 1 stUnited StStSt to Overseas HwyFlagler Ave from 1 st StSouth StSouthard Stto Roosevelt BlvdFleming St Palm Ave Front StWhitehead St 1 st St/Bertha St Duval StEaton StSimonton St2.9 Parking InventoryThe availability and convenience of vehicle parking is of vital importance in a city like <strong>Key</strong><strong>West</strong>. Many houses in <strong>Key</strong> <strong>West</strong> are historic, built without parking garages or driveways. This isparticularly the case with the houses located in Old Town. Therefore, many of the local residentsrely on on-street parking to access their homes.Land use is also a prominent constraint on the availability of the parking throughout the city.<strong>Key</strong> <strong>West</strong> is a small island and thus there are land limitations for roadway infrastructure.The tourism industry is a key <strong>com</strong>ponent of the parking demands in the city particularly in theOld Town area. Many historical and tourism sites are found in the Old Town area such as DuvalStreet, Mallory Square, the Southernmost Point, Sloppy Joe’s, and the Truman House.Additionally, the point of departure for many of the touring vehicles is near Mallory Square. Inorder to ac<strong>com</strong>modate the high parking demand in the Old Town area, several public pay parkingfacilities are available. The larger parking facilities in the Old Town area are described below.Calvin, Giordano & Associates Page 23
City of <strong>Key</strong> <strong>West</strong> <strong>Carrying</strong> <strong>Capacity</strong> <strong>Traffic</strong> <strong>Study</strong>Park N Ride (Old Town Garage)The Park N Ride parking garage containsapproximately 300 spaces. This facility islocated on Grinnell Street and CarolineStreet. The parking garage is open 24 hoursa day and has a fee of $2 per hour or $13 perday.Mallory Square Parking LotThe Mallory Square parking lot contains 100parking spaces and is located just west ofWall Street. The cost of parking is $4 perhour with an eight hour maximum.Park N Ride (Old Town Garage)City Hall Parking LotThe City Hall parking lot contains 84 parking spaces and is located west of Simonton Streetbetween Southard Street and Angela Street. The cost of parking is $1.50 per hour with an eighthour maximum.<strong>Key</strong> <strong>West</strong> Bight Parking LotThe <strong>Key</strong> <strong>West</strong> Bight parking lot contains 120 parking spaces and is located north of CarolineStreet between William Street and Margaret Street. The cost of parking is $2.50 per hour or$16.25 per day.Available data from parking garage pay stations (“Cale” pay stations) were reviewed andanalyzed to determine trends and occupancy rates. Several new Cale pay stations have beenadded over the last few years replacing the old metered style equipment. Therefore, several timeframes corresponding to the opening of the new Cale pay stations were evaluated.The utilization rate was determined by taking the summation of the average paid parking timesduring peak hours for the parking lot/garage. This number was then divided by the total availableparking time during those hours. This methodology provided an approximation of the parkingutilization for <strong>Key</strong> <strong>West</strong> Bight, Mallory Square, and the Old Town Garage. The analysis showedthat the <strong>Key</strong> <strong>West</strong> Bight and Mallory Square parking lots are utilized at a much higher rate thanthe Old Town Garage. The parking utilization for these three areas is shown on Table 9.Calvin, Giordano & Associates Page 24
City of <strong>Key</strong> <strong>West</strong> <strong>Carrying</strong> <strong>Capacity</strong> <strong>Traffic</strong> <strong>Study</strong>Table 9Parking UtilizationLocation: <strong>Key</strong> <strong>West</strong> Bight Location: Old Town Garage Location: Mallory SquareDates: 6/1/2010 – 9/30/2011 Dates: 7/1/2011 – 9/30/2011 Dates: 6/1/2010/ - 9/30/2011Times: 7:00AM – 7:00PM Times: 7:00AM – 7:00PM Times: 11:00AM – 7:00PMNumber of spaces: 120 Number of spaces: 300 Number of spaces: 100Average Daily Parking Time Per Hour Average Daily Parking Time Per Hour Average Daily Parking Time Per HourTime Total (min) Time Total (min) Time Total (min)7:00AM 10,306.39 7:00AM 10,066.318:00AM 4,668.79 8:00AM 3,346.969:00AM 8,950.14 9:00AM 4,741.9510:00AM 4,447.43 10:00AM 6,874.5611:00AM 5,940.07 11:00AM 6,786.52 11:00AM 4,750.1612:00PM 7,692.43 12:00PM 5,566.96 12:00PM 5,076.371:00PM 5,969.65 1:00PM 6,858.91 1:00PM 4,687.022:00PM 4,098.24 2:00PM 4,871.73 2:00PM 3,696.523:00PM 3,461.30 3:00PM 4,726.30 3:00PM 3,244.914:00PM 3,823.31 4:00PM 3,386.74 4:00PM 3,364.245:00PM 4,522.68 5:00PM 4,810.43 5:00PM 3,692.436:00PM 4,009.55 6:00PM 3,403.04 6:00PM 3,551.86TOTAL 67,889.98 TOTAL 65440.41 TOTAL 32,063.51Total available time* 86,400 Total available time* 216,000 Total available time* 48,000Average utilization 78.58% Average utilization 30.30% Average utilization 66.80%*Total available time = parking spaces x number of hours x 60 minutesCalvin, Giordano & Associates Page 25
City of <strong>Key</strong> <strong>West</strong> <strong>Carrying</strong> <strong>Capacity</strong> <strong>Traffic</strong> <strong>Study</strong>The data show that the Mallory Square and the <strong>Key</strong> <strong>West</strong> Bight parking lots have historicallybeen the highest revenue terminals. Between January 1, 2011 and September 30, 2011, theMallory Square and <strong>Key</strong> <strong>West</strong> Bight parking lots produced 31.5% and 18.9% of the total Calepay station revenues, respectively. Historical data from the Cale pay stations is included inAppendix E.In addition to the parking lots and garage, the City has on-street pay parking spaces availablethroughout the downtown area. These parking spaces are located at various locations onWhitehead Street, Duval Street, Simonton Street, Ann Street, Front Street, Greene Street,Caroline Street, Eaton Street, Fleming Street, Southard Street, Virginia Street, United Street, andSouth Street. Fees for on-street parking spaces are collected at parking pay stations or traditionalindividual pay meters. There are currently 42 pay stations and over 300 traditional parkingmeters in the City. The City intends to phase out the traditional parking meters and replace themwith pay stations. A map depicting the on-street pay for parking locations and pay stationlocations in the Old Town area is illustrated on Exhibit 3.Calvin, Giordano & Associates Page 26
Exhibit 3 • Downtown Parking InventoryPalm AveCaroline StEaton StFleming StSouthard StFirst StDuval StSimonton StTruman AveWhite StFlagler AveWhitehead StUnited StSouth StPay StationsLegendMetered ParkingSpaces
City of <strong>Key</strong> <strong>West</strong> <strong>Carrying</strong> <strong>Capacity</strong> <strong>Traffic</strong> <strong>Study</strong>On-street parking was also inventoried for each of the study corridors since the availability ofon-street parking affects street classification and roadway capacity. A description of theapproximate locations of parking for the study corridors is provided below:Flagler AvenueOn-street parking is available on both sides of the Flagler Avenue for the majority of theroadway. The on-street parking facilities generally serve the residents and homes adjacent toFlagler Avenue.Truman AvenueOn-street parking is available on Truman Avenue in the northeast direction from Simonton Streetto Eisenhower Drive. The parking facilities generally serve the businesses and public facilitiesadjacent to Truman Avenue.US-1/N. Roosevelt BoulevardThere are no on-street parking facilities on US-1/N. Roosevelt Boulevard from EisenhowerDrive to Overseas Highway.S. Roosevelt BoulevardOn-street parking is available on S. Roosevelt Boulevard from Bertha Street to just beforeFlagler Avenue in the eastbound direction only. The parking facilities on S. Roosevelt Boulevardserve the beach area and shared use path along the Atlantic Ocean.White StreetOn-street parking is available on White Street primarily from Atlantic Boulevard to TrumanAvenue on both sides of the roadway. Additional on-street parking is available from TrumanAvenue to Eaton Street but primarily in the southbound direction with only a limited number ofnorthbound parking spaces. The parking facilities along White Street serve both residents andbusinesses.United StreetOn-street parking is available on United Street on both sides of the roadway from WhiteheadStreet to Simonton Street. The on-street parking facilities east of Simonton Street are primarily inthe westbound direction with only some eastbound parking. The parking facilities on UnitedStreet primarily serve residents as well as some businesses.South StreetOn-street parking is generally available for the entire length of the corridor on both sides of theroadway. Parking east of Simonton Street serves the homes adjacent to the roadway. Parkingfrom Simonton Street to Duval Street is paid parking and serves the various tourist attractionssuch as the Southernmost Point.Calvin, Giordano & Associates Page 28
City of <strong>Key</strong> <strong>West</strong> <strong>Carrying</strong> <strong>Capacity</strong> <strong>Traffic</strong> <strong>Study</strong>Fleming StreetOn-street parking is available on both sides of Fleming Street for the entire length of thecorridor. The parking facilities from Whitehead Street to Simonton Street serve businesses whilethe parking from Simonton Street to White Street serves residential homes.Southard StreetOn-street parking is available on both sides of Southard Street from White Street to WhiteheadStreet. The parking facilities from White Street to Simonton Street serve homes while theparking facilities from Simonton Street to Whitehead Street serve businesses.Whitehead StreetOn-street parking is available on Whitehead Street from Greene Street to Fleming Street in thesouthbound direction. These southbound parking spaces are paid parking and serve the OldTown businesses. Additionally, parking in the northbound direction on Whitehead Street ispresent at various locations from South Street to Truman Avenue.Front StreetOn Street parking is available at various locations on Front Street. The parking on Front Streetserves the Old Town businesses.Duval StreetOn-street parking is available at various locations throughout the limits of Duval Street. Parkingis available in the southbound direction from Caroline Street to Fleming Street and from PetroniaStreet to south of South Street. On-street parking is also available in the northbound directionsfrom South Street to Truman Avenue. The parking on Duval Street serves the many popularnearby businesses and tourist attractions on Duval Street and in the Old Town area. Additionally,designated delivery and loading zones are present in the southbound direction from GreeneStreet to Caroline Street and from Fleming Street to Petronia Street.Simonton StreetOn-street parking is available throughout Simonton Street in the southbound direction. A smallsegment of parking in the northbound direction is available from South Street to United Street.The majority of on-street parking on Simonton Street is paid parking serving the variousbusinesses in the Old Town area.Eaton StreetOn-street parking is available on Eaton Street from Simonton Street to Whitehead Street in bothdirections and from White Street to Simonton Street in the westbound direction only. Theparking spaces on Eaton Street generally serve the Old Town area.Calvin, Giordano & Associates Page 29
City of <strong>Key</strong> <strong>West</strong> <strong>Carrying</strong> <strong>Capacity</strong> <strong>Traffic</strong> <strong>Study</strong>Palm AvenueThere are no on-street parking facilities on Palm Avenue from White Street to US-1/TrumanAvenue.1 st Street/Bertha StreetOn-street parking facilities on 1 st Street are available at various locations on both sides of theroadway from Truman Avenue to Flagler Avenue. Additional parking is available in thesouthbound direction only from Flagler Avenue to Atlantic Boulevard. The on-street parkingfacilities on 1 st Street primarily serve the homes adjacent to the roadway.2.10 Loading ZonesIn general, the Old Town area of the City does not have back-lot alleys for <strong>com</strong>mercialdeliveries. Therefore, many delivery truck drivers utilize on-street parking spaces for deliveryloading and unloading. The City provides standard red bag <strong>com</strong>mercial delivery zones as well asstandard loading zones in the <strong>com</strong>mercial core business district. The red bag zones areestablished daily at select, metered parking spaces at 6AM. City Ordinance (Chapter 7, Division2, Section 70-372 and 70-373) restricts <strong>com</strong>mercial deliveries to the hours of 6AM to 12PM onDuval Street and 6AM to 2PM on Whitehead Street, Simonton Street, Front Street, and CarolineStreet. The red bag parking spaces are only in effect during these hours.The standard loading zones in the <strong>com</strong>mercial core are non-metered spaces marked with a yellowcurb. Non-<strong>com</strong>mercial vehicles are allowed to load and unload for 15 minutes from 6AM to 6PMon Monday through Saturday. These loading zones be<strong>com</strong>e free parking after 6PM and aresometimes marked as taxi-stands or motorcycle parking after hours.Additional loading zones are available for the hospitality industry and small businesses. Theyallow for 30 minutes of loading at any given time with no time of day restrictions. Churchparking and loading zones are also regulated.The loading zones for tour trains and trolleys are regulated. The time limit for designatedsecondary stops for loading and unloading is 15 minutes. The tour trains and trolleys arepermitted to park at their respective primary depots for any length of time between 8AM and5PM from Monday through Sunday.2.11 Parking ViolationsEnforcement of parking and loading zones is critical in a city such as <strong>Key</strong> <strong>West</strong> whichexperiences a large daily influx of tourists. Parking violations from fiscal years 2006 to 2010were provided by the City staff and are presented in Table 10. Analysis of parking violationsover the past five years illustrates the highest number of violations due to time-limit expirationsfollowed by parking in a no parking zone or inapplicable designated parking space.Calvin, Giordano & Associates Page 30
City of <strong>Key</strong> <strong>West</strong> <strong>Carrying</strong> <strong>Capacity</strong> <strong>Traffic</strong> <strong>Study</strong>Table 10Parking Violations Fiscal Years 2006-2010Violation Description FY 06 FY 07 FY 08 FY 09 FY 10% Over5 YearPeriodBLK Blocking Driveways and Line of Sight 82 70 52 54 43 0.14%DESParking in Designated Parking Spaces (used mainly for nonresidents parking in residential marked spaces)7,199 4,790 4,047 4,396 3,934 11.35%FIR Blocking Fire Hydrant 128 129 134 129 219 0.34%FLN Blocking Fire Lane 109 219 303 36 43 0.33%HAN Parking in Handicap Space (without placard or plate) 90 33 26 15 20 0.09%NPZNo Parking Zone (used mainly for parking in loading zones,yellow curb, Trolley Stops, Commercial Bus space, etc.)7,148 8,048 8,525 5,167 4,313 15.47%OTHOther Violations (parking against traffic, parked for more than 72hours without moving, trailer or <strong>com</strong>mercial vehicle in residentialneighborhood, non emergency repair in right of way (oil change),2,392 2,725 3,940 3,009 2,967 7.00%etc.)OTPOvertime Parking (parking at expired meter or no valid pay24,249station receipt displayed)24,339 29,871 33,152 24,816 63.56%RV Parking RV in City Right of Way or Oversized (20 feet or greater) 143 135 109 245 332 0.45%SID Parking on Sidewalk 81 18 45 20 24 0.09%STR Parking in Street 481 361 685 677 336 1.18%Total Violations 42,102 40,867 47,737 46,900 37,047 214,653Source: City of <strong>Key</strong> <strong>West</strong> Parking EnforcementCalvin, Giordano & Associates Page 31
City of <strong>Key</strong> <strong>West</strong> <strong>Carrying</strong> <strong>Capacity</strong> <strong>Traffic</strong> <strong>Study</strong>2.12 Bike Lane InventoryIn the City of <strong>Key</strong> <strong>West</strong>, bicycles are a popular transportation choice for local residents as wellas tourists. Bicycles accounted for over 8% of the total vehicles counted at the 25 studyintersections. With the high number of bicyclists utilizing the City streets, it’s critical that theroadway infrastructure be sufficient to ac<strong>com</strong>modate bicyclists in a safe and efficient manner.An inventory of existing bike lines was conducted for each of the study corridors. Bike laneswere found to be present on Fleming Street, Southard Street, White Street from Truman Avenueto Atlantic Boulevard, and Flagler Avenue from Roosevelt Boulevard to Kennedy Drive. Inaddition to the designated bike lanes, shared use paths were also present on US-1 fromEisenhower Drive to Overseas Highway, Palm Avenue, and S. Roosevelt Boulevard.Exhibit 4 depicts the Bike Routes map from the 2005 City of <strong>Key</strong> <strong>West</strong> Transportation Elementthat was not approved by the City.Calvin, Giordano & Associates Page 32
City of <strong>Key</strong> <strong>West</strong> <strong>Carrying</strong> <strong>Capacity</strong> <strong>Traffic</strong> <strong>Study</strong>Exhibit 4Bicycle RoutesSource: Map taken from 2005 City of <strong>Key</strong> <strong>West</strong> Transportation Element (not approved)Calvin, Giordano & Associates Page 33
City of <strong>Key</strong> <strong>West</strong> <strong>Carrying</strong> <strong>Capacity</strong> <strong>Traffic</strong> <strong>Study</strong>2.13 Sound Level MeasurementsSound decibel (dB) level measurementswere recorded at several locations in theCity on Saturday, August 20, 2011. Fourlocations with relatively low traffic volumeswere chosen for the recordings to minimizebackground noise interference. The four lowtraffic volume locations included thefollowing:1. Grinnell Street between Eaton Street and Fleming Street2. Southard Street between Grinnell Street & Francis Street3. Reynolds Street between Casa Marina Court and Johnson Street4. Northeast corner of Fleming Street and Grinnell StreetFor reference, sound levels for typical noise sources are shown on Table 11.Table 11Typical Sound LevelsNoise Source or ActivityRelative LoudnessSound(human judgmentLevel Subject Impressionof different sound(dBA)levels)Jet aircraft takeoff from carrier (50 ft) 140 Threshold of pain 64 times as loudLoud rock concert near stage, Jet takeoffUn<strong>com</strong>fortable120(50 ft)loud16 times as loudJet takeoff (2,000 ft) 100 Very loud 4 times as loudHeavy truck or motorcycle (25 ft) 90 2 times as loudGarbage disposal, food blend (2 ft),Reference80 Moderately loudPneumatic drill (50 ft)loudnessPassenger car at 65 mph (25 ft) 70 1/2 as loudLarge store air-conditioning unit (20 ft) 60 1/4 as loudLight auto traffic (100 ft) 50 Quiet 1/8 as loudBedroom or quiet living room , Bird calls 40 1/16 as loudQuiet library, soft whisper (15 ft) 30 Very quiet 1/32 as loudSource: Beranek (1988) and EPA (1971)Calvin, Giordano & Associates Page 34
City of <strong>Key</strong> <strong>West</strong> <strong>Carrying</strong> <strong>Capacity</strong> <strong>Traffic</strong> <strong>Study</strong>The maximum observed decibel levels for vehicles maxed out at the following sound levels asshown on Figure 2:Figure 2Observed Sound LevelsSound Levels (dB)The sound level measurement results demonstrated that the tour trains, tour trolleys, and scootersgenerally do not produce greater decibel (dB) levels than standard passenger vehicles.Motorcycles produced the highest dB level of any of the observed vehicles.In addition to the isolated low traffic areas, recordings were also <strong>com</strong>pleted at three differentlocations on Duval Street. All sound recordings were made with the recording device at the backof sidewalk. The sound level recording charts are included in Appendix F.Calvin, Giordano & Associates Page 35
City of <strong>Key</strong> <strong>West</strong> <strong>Carrying</strong> <strong>Capacity</strong> <strong>Traffic</strong> <strong>Study</strong>3.0 PUBLIC OUTREACHAn open house was held from 7AM to 7PM on February 22, 2011 at City Hall. Residents wereable to meet with the project manager for this study and learn about the <strong>Carrying</strong> <strong>Capacity</strong><strong>Traffic</strong> <strong>Study</strong> methodology. A Questionnaire was given to those in attendance to allow the publicto voice their opinions on several transportation issues. The results of the Questionnaire showedthat residents felt most strongly about the importance of improving bicycle and pedestrianfacilities.Calvin, Giordano & Associates Page 36
City of <strong>Key</strong> <strong>West</strong> <strong>Carrying</strong> <strong>Capacity</strong> <strong>Traffic</strong> <strong>Study</strong>A Community Values Meeting was held onMay 25, 2011. Residents were given anopportunity to give feedback on theimportance of a variety of transportationissues. The survey was also made availablethrough the City website so that residentsnot in attendance could still have theiropinions heard. The results of theCommunity Values survey and the OpenHouse Questionnaire are provided inAppendix G.Nearly 200 people responded to the aforementioned surveys. The respondents felt most stronglyabout the following topics:Minimizing noise from vehicles in residential neighborhoods.Providing more bicycle facilities such as bike lanes and bike racks.Improving pedestrian facilities such as sidewalks, crosswalks, and signalizedintersections.Providing more off-street parking such as public parking garages and parking lots.Providing an ac<strong>com</strong>modating atmosphere for the tourist.Respondents indicated they were not willing to experience greater delay on roadways inorder to encourage tourism, cruise ship traffic or on-street parking.It is recognized that the number of respondents is only a small portion of the residents in the Cityand may not accurately reflect the opinion of the majority of the residents.Calvin, Giordano & Associates Page 37
City of <strong>Key</strong> <strong>West</strong> <strong>Carrying</strong> <strong>Capacity</strong> <strong>Traffic</strong> <strong>Study</strong>4.0 EXISTING CONDITIONS ANALYSIS4.1 Street ClassificationsChapter 15 of the 2000 Highway <strong>Capacity</strong> Manual (HCM) defines the methodology indetermining Level of Service (LOS) for Urban Streets. The methodology consists of measuringor calculating the average speed along a corridor and <strong>com</strong>paring it to thresholds of the roadwayclassification. The 2000 HCM identifies four levels of urban street classifications. The urbanstreet classifications are class I, II, III, or IV roadways.Each roadway’s street classification can be determined by free flow speed or the street’sfunctional and design categories. Free-flow speed is the term used to describe the average speedthat a motorist would travel if there were no congestion or other adverse conditions (such as badweather). Thoroughfare roadways are categorized into functional classification groups accordingto the character of traffic and the degree of land access that they will provide. The four functionalclassification groups for urban areas are principle arterials, minor arterials, collectors, and localroads. The primary function of arterial roadways is to provide mobility, while the primaryfunction of local roads is to provide access. The functional classifications of major thoroughfaresare further described below:Principal Arterials. The principal arterial system serves the major centers of activity of ametropolitan area and the highest volume traffic corridors. Principal arterials carry themost trips entering and leaving an urban area. Characteristics of principal arterials alsoinclude long average trip lengths, high operating speeds and less access than the otherroadway classifications.Minor Arterials. The minor arterial system provides support for principal arterials. Itprovides service for trips of moderate length and at a lower mobility than principalarterials. Minor arterials generally interconnect with principal arterials and collectorroads.Collectors. Collectors provide a lower degree of mobility and a higher degree of accessthan arterial roadways. They are designed for lower operating speeds and shorter tripdistances. Collectors provide access and distribute vehicular trips from arterials toresidential neighborhoods and <strong>com</strong>mercial areas.Local Streets. Local streets consist of all roadways that are not an arterial or collectorroadway. They provide access to abutting land uses and connect to the higher ordersystems. Local streets typically have the lowest level of mobility, shortest trip lengths,and lowest operating speeds.Calvin, Giordano & Associates Page 38
City of <strong>Key</strong> <strong>West</strong> <strong>Carrying</strong> <strong>Capacity</strong> <strong>Traffic</strong> <strong>Study</strong>The functional classification definitions described above are typical of an urban roadwaynetwork. However, not all roadways fit perfectly into any one classification. The City of <strong>Key</strong><strong>West</strong> is a unique urbanized area located on an island and the majority of the roadway system andland uses were constructed long ago. For this reason as well as infrastructure limitations, manyof the arterial roadways provide a greater amount of access, have shorter trip lengths, and loweroperating speeds than found on a typical arterial roadway.The functional classifications for each of the study corridors were determined from the 2009Florida Department of Transportation (FDOT) <strong>Traffic</strong> Information and Highway Data CD andare shown below:Principal ArterialsUS-1/N. Roosevelt BoulevardTruman AvenueWhitehead Street from Fleming Street to Truman AvenueMinor ArterialsFlagler Avenue between 1 st Street and S. Roosevelt BoulevardBertha Street1 st StreetPalm AvenueEaton StreetDuval Street between Eaton Street and Truman AvenueCollectorsWhitehead Street north of Fleming StreetWhitehead Street south of Truman AvenueDuval Street north of Eaton StreetDuval Street south of Truman AvenueSimonton StreetWhite StreetUnited StreetFlagler Avenue between White Street and 1 st StreetFront StreetLocal RoadsFlagler Avenue west of White StreetSouth StreetFleming StreetSouthard StreetCalvin, Giordano & Associates Page 39
City of <strong>Key</strong> <strong>West</strong> <strong>Carrying</strong> <strong>Capacity</strong> <strong>Traffic</strong> <strong>Study</strong>HCM design categories are also useful in determining the street classification for the studycorridors. Each design category is based on a number of parameters including signal spacing,free flow speed, access density, on-street parking, pedestrian activity, and roadside development.Exhibits 10-3 and 10-4 from the 2000 HCM as shown on Tables 12 and 13, respectively, furtherdescribe the functional and design categories. Generally, most of the study corridors consist of ahigh number of driveway and street accesses, on-street parking, low speed limits, high pedestrianactivity, and a high amount of roadside density. Based on these parameters, most of the studycorridors align with the Intermediate and Urban design categories.Calvin, Giordano & Associates Page 40
City of <strong>Key</strong> <strong>West</strong> <strong>Carrying</strong> <strong>Capacity</strong> <strong>Traffic</strong> <strong>Study</strong>Table 12Urban Street Class Based On Functional and Design CategoriesDesign CategoryFunctional CategoryPrincipal ArterialMinor ArterialHigh-Speed I N/ASuburban II IIIntermediate II III or IVUrban III or IV IVSource: Exhibit 10-3 from 2000 HCMTable 13Roadway Functional and Design CategoriesCriterionFunctional CategoryPrincipal ArterialMinor ArterialMobilityFunctionVery importantImportantAccess Function Very minor SubstantialPoints ConnectedFreeways, important activity centers,major traffic generatorsPrincipal arterialsRelatively long trips between majorPredominantTrips of moderate length withinpoints and through-trips entering,Trips Servedrelatively small geographical areasleaving, and passing through the cityDesign CategoryCriterion High Speed Suburban Intermediate UrbanDriveway/accessModerateVery low density Low densitydensitydensityHigh densityArterial typeMultilaneMultilane divided;Multilane Undivided oneway,two-way,divided;undivided or twolanewithundivided; one-two or moredivided orundivided ortwo-lane withshouldersway, two lane lanesshouldersParking No No Some SignificantSeparate left turnlanesYes Yes Usually SomeSignals/mi 0.5-2 1-5 4-10 6-12Speed limit 45-55 mph 40-45 mph 30-40 mph 25-35 mphPedestrianVery little Little Some UsuallyactivityRoadsideLow densitydevelopmentSource: Exhibit 10-4 from 2000 HCMLow to mediumdensityMedium tomoderate densityHigh densityCalvin, Giordano & Associates Page 41
City of <strong>Key</strong> <strong>West</strong> <strong>Carrying</strong> <strong>Capacity</strong> <strong>Traffic</strong> <strong>Study</strong>A street classification was assigned to each of the study corridors based on the roadway’sfunctional and design categories and free flow speed determined from speed data counts andtravel time runs <strong>com</strong>pleted during low volume periods. The assigned street classifications areshown below:Street Classification IIN. Roosevelt Boulevard east of EisenhowerDriveStreet Classification IIIPalm Avenue/1 st Street/Bertha StreetFlagler AvenueStreet Classification IVFleming StreetSouthard StreetDuval StreetWhitehead StreetSimonton StreetSouth StreetUnited StreetWhite StreetEaton StreetTruman Avenue west of Eisenhower Drive4.2 Roadway Level of ServiceLevel of Service (LOS) standards are used to determine the serviceability of roadways. LOS isdefined in the 2000 HCM as “A qualitative measure describing operational conditions within atraffic stream, based on service measures such as speed and travel time, freedom to maneuver,traffic interruptions, <strong>com</strong>fort, and convenience.”There are six different LOS classifications that represent a range of operation conditions and thedriver’s perception of those conditions.Level of Service A. This LOS generally describes free-flow traffic operations where motoristsare <strong>com</strong>pletely unimpeded in their ability to maneuver within the traffic stream. Drivers are ableto travel at their desired speed, and delays at intersections are minimal.Level of Service B. This LOS also describes free-flow traffic conditions, although the presenceof other vehicles within the traffic stream is noticeable. The ability to maneuver within the trafficstream is only slightly restricted and stopped delays are not significant.Level of Service C. For this LOS condition, traffic flow is generally stable, although the driver’schoice of speeds and ability to maneuver are increasingly restricted. Longer queues at signalizedintersections characterize this level of service.Level of Service D. <strong>Traffic</strong> flow is generally unstable where minor increases in flow result insubstantial delay. Driving speeds are tolerable for short periods, but are subject to suddenvariance. The ability to maneuver and select a travel speed is severely restricted.Calvin, Giordano & Associates Page 42
City of <strong>Key</strong> <strong>West</strong> <strong>Carrying</strong> <strong>Capacity</strong> <strong>Traffic</strong> <strong>Study</strong>Level of Service E. Large traffic volumes and significant delay typify this LOS. <strong>Traffic</strong> flow isunstable and is generally maintained by a low speed. Driver <strong>com</strong>fort is low due to limited spacebetween vehicles and rapidly changing speeds, and extensive delays are typically experienced atcritical intersections.Level of Service F. <strong>Traffic</strong> flow is characterized by extremely low speeds. Driving <strong>com</strong>fort islow and motorists incur significant delays. Substantial queuing also occurs at criticalintersections.LOS standards are primarily the measure of effectiveness that jurisdictions use to evaluate theirroadways. Each jurisdiction establishes the minimum LOS a roadway must meet to be deemedacceptable. Generally, LOS E or LOS F is considered to be a failing roadway.The established LOS standards as set forth in the City of <strong>Key</strong> <strong>West</strong> Comprehensive Plan areshown on Table 14.Table 14LOS StandardsRoadway Facilities Segment Min LOS Standard Peak HourState Urban Principal Arterials C (1)US 1 N. Roosevelt Blvd C (1)Truman Ave Physically Constrained (1)Whitehead St Physically Constrained (1)County Urban Minor ArterialsDCounty Urban CollectorsDCity Urban CollectorsD(1) Due to physical constraints that would make US 1 improvements cost prohibitive, the segments fromEisenhower Drive to Whitehead Street and from Truman Avenue to Fleming Street, are designated asconstrained. These segments have an existing operating condition below the LOS C standard. Constrainedfacilities level of service shall be C plus 5 (five) percent.The City Comprehensive Plan states that the LOS determination of thresholds shall be calculatedusing a speed based methodology. Therefore, for purposes of this study, the LOS speedthresholds will be based on Chapter 15 of the 2000 Highway <strong>Capacity</strong> Manual (HCM). Theaverage speed threshold for each LOS designation is further broken down by the Urban StreetClassification as shown on Table 15.Calvin, Giordano & Associates Page 43
City of <strong>Key</strong> <strong>West</strong> <strong>Carrying</strong> <strong>Capacity</strong> <strong>Traffic</strong> <strong>Study</strong>Table 15Urban Street Level of Service by ClassificationUrban Street Class I II III IVRange of free-flowspeeds (FFS)50 to 45 mph 45 to 35 mph 35 to 30 mph 35 to 25mphTypical FFS 50 mph 40 mph 35 mph 30 mphLOSAverage Travel Speed (mph)A > 42 > 35 > 30 > 25B > 34-42 > 28-35 > 24-30 > 19-25C > 27-34 > 22-28 > 18-24 > 13-19D > 21-27 > 17-22 > 14-18 > 9-13E > 16-21 > 13-17 > 10-14 > 7-9F ≤ 16 ≤ 13 ≤ 10 ≤ 7Source: Exhibit 15-2 from 2000 HCM.4.3 Travel Time Run Existing ConditionsThe travel time run results <strong>com</strong>pleted for each study roadway were <strong>com</strong>pared to the thresholdson Table 15 to establish the existing LOS for each of the corridors. The travel time runs werebroken down by peak hour and direction. When evaluating roadways, it is somewhatadvantageous to analyze larger roadway segments rather than shorter segments. However, due tothe nature of the City, many of the study corridors are short in length. Palm Avenue, 1 st Street,and Bertha Street were <strong>com</strong>bined into one segment for analysis purposes for this reason. Theexisting conditions average speed and LOS for each of the study corridors as determined by thetravel time runs are shown on Table 16. Additional statistics and graphs from travel time areincluded in Appendix D.Calvin, Giordano & Associates Page 44
City of <strong>Key</strong> <strong>West</strong> <strong>Carrying</strong> <strong>Capacity</strong> <strong>Traffic</strong> <strong>Study</strong>Table 16TravTime Results – Existing LOSAMMid DayPMNB/ EB SB/ WB NB/ EB SB/ WB NB/ EB SB/ WBCorridor From ToApproxDist.(miles)StreetClassAvgSpeed(mph)LOSAvgSpeed(mph)LOSAvgSpeed(mph)LOSAvgSpeed(mph)LOSAvgSpeed(mph)LOSAvgSpeed(mph)LOSFleming St Whitehead St White St 0.72 IV 15.03 C N/A N/A 10.37 D N/A N/A 10.65 D N/A N/ASouthard St White St Whitehead St 0.73 IV N/A N/A 11.02 D N/A N/A 11.86 D N/A N/A 11.88 DDuval St South St Front St 1.07 IV 13.36 C 12.94 D 7.72 E 6.97 F 6.63 F 6.25 FWhitehead St South St White St 1.00 IV 14.94 C 16.25 C 10.33 D 9.78 D 10.34 D 9.06 DSimonton St South St Front St 1.06 IV 14.69 C 14.31 C 10.62 D 12.12 D 10.17 D 9.86 DSouth St Whitehead St Ashby St 1.06 IV 15.93 C 16.53 C 14.13 C 13.22 C 13.03 C 15.37 CUnited St Whitehead St George St 1.14 IV 18.39 C 16.86 C 17.23 C 16.38 C 16.24 C 16.32 CWhite St Atlantic Blvd Eaton St 1.16 IV 17.2 C 16.05 C 15.04 C 14.49 C 15.43 C 14.08 CPalm Ave/ 1st St Roosevelt Blvd White St 1.56 III 17.6 D 20.01 C 16.09 D 18.63 C 14.18 D 11.8 EEaton St Whitehead St White St 0.69 IV 14.76 C 16.44 C 12.19 D 10.68 D 13.14 C 11.26 DFlagler Ave Reynolds St Roosevelt Blvd 2.71 III 24.21 B 22.12 C 21.69 C 22.33 C 22.49 C 22.47 CTruman Ave Whitehead St Eisenhower Dr 0.91 IV 14.56 C 14.83 C 13.19 C 12.99 D 12.56 D 6.46 FUS-1 Eisenhower Dr Overseas Blvd 2.65 II 22.53 C 21.63 D 19.88 D 16.98 E 17.68 D 17.89 DNotes:Street Class and LOS based on 2000 HCM Chapter 15.NB/SB roadways include: Duval St, Whitehead St, Simonton St, White St, Palm Ave/ 1 st St.EB/WB roadways include: Fleming St, Southard St, South St, United St, Eaton St, Flagler Ave, Truman Ave, and US-1.Calvin, Giordano & Associates Page 45
City of <strong>Key</strong> <strong>West</strong> <strong>Carrying</strong> <strong>Capacity</strong> <strong>Traffic</strong> <strong>Study</strong>The travel time results demonstrate that the following roadways are operating belowminimum LOS standards established in the City Comprehensive Plan:Duval StreetDuval Street is operating at LOS E and LOS F during the mid day peak hour for the northboundand southbound directions, respectively. Duval Street is also failing in both directions during thePM peak hour.Palm Avenue/1 St Street/Bertha StreetThis segment is operating at LOS E during the PM peak hour in the southbound direction.Truman AvenueTruman Avenue is operating at LOS D during the mid day peak hour in the westbound direction.Truman Avenue is also operating at LOS D and LOS F during the PM peak hour for theeastbound and westbound directions, respectively.N. Roosevelt BoulevardN. Roosevelt Boulevard is operating at LOS D during the AM peak hour in the westbounddirection and during the PM peak hour in both directions. US-1 is also operating at LOS E in thewestbound direction during the mid day peak hour.In addition to the failing roadways identified above, the average speed on Whitehead Street andSimonton Street is only one mph higher than that of a failing roadway segment.Calvin, Giordano & Associates Page 46
City of <strong>Key</strong> <strong>West</strong> <strong>Carrying</strong> <strong>Capacity</strong> <strong>Traffic</strong> <strong>Study</strong>4.4 FDOT LOS TablesThere are several methodologies that are <strong>com</strong>monly used to evaluate and determine capacity forroadways. The most basic level of analysis that is used by the FDOT is a generalized planninganalysis. The generalized planning analysis <strong>com</strong>pares hourly or daily roadway volumes to LOSvolume thresholds identified in the FDOT Quality/Level of Service tables. The volumethresholds are broken down by area type, roadway classification, and number of lanes amongother variables. The FDOT LOS tables are extensively researched throughout the nation and theState of Florida. The generalized planning analysis is limited and is most appropriate when“ballpark” determination of capacity or LOS is needed.The volumes for the study corridors were <strong>com</strong>pared to volume thresholds provided in the FDOTgeneralized planning tables. The two-way peak hour and directional volumes used in the analysiswere taken from the various turning movement counts collected for the study. The highestvolumes were taken for each roadway. In actuality, the volume to capacity (v/c) ratios can varythroughout the entire length of each roadway, but since each of the study corridors are short inlength, only the highest v/c ratio was calculated. The two-way peak hour and directional peakhour v/c ratios are shown in Tables 17 and 18, respectively. Additionally, the v/c ratios for thetwo-way PM peak hour are shown on Exhibit 5.The results of the planning analysis show that the following roadways exceed capacity at aminimum of one location on the corridor:Duval StreetEaton StreetPalm AvenueN. Roosevelt BoulevardTruman AvenueThere are numerous assumptions taken into account to develop the FDOT Level of Servicethreshold including signal timing, lane width, heavy vehicle percentage, free flow speed, amongmany others. The latest FDOT Quality/Level of Service tables are included in Appendix H.Since so many assumptions are made, other methodologies are re<strong>com</strong>mended to provide a moreaccurate analysis of the roadway network that takes into account the characteristics of the City.Calvin, Giordano & Associates Page 47
City of <strong>Key</strong> <strong>West</strong> <strong>Carrying</strong> <strong>Capacity</strong> <strong>Traffic</strong> <strong>Study</strong>Table 17Two-Way Peak Hour V/C RatiosRoadway (1)FromToClass (2)LOSStandardStandard<strong>Capacity</strong> (3)NonState RdAdjust.ExclusiveTurnLaneAdjust.Adjust.<strong>Capacity</strong>AM Peak Hour MD Peak Hour PM Peak Hour2-WayVolumeV/CRatio2-WayVolumeV/CRatio2-WayVolumeV/CRatio1st St/ Bertha N. Roosevelt Blvd S. Roosevelt Blvd II D 1,480 -10% No 1,332 460 0.35 530 0.40 530 0.40Duval St Front St South St III/IV D 1,150 -10% -20% 805 294 0.37 764 0.95 762 0.95Eaton St Whitehead St White St III/IV D 1,150 -10% -20% 805 1,052 1.31 1,276 1.59 1,422 1.77Flagler Ave 1st St S. Roosevelt Blvd II D 3,220 -10% No 2,898 1,040 0.36 1,189 0.41 1,360 0.47Flagler Ave Reynolds St 1st St II D 1,480 -10% No 1,332 825 0.62 977 0.73 1,070 0.80Fleming St Whitehead St White St III/IV D 690 -10% -20% 483 160 0.33 319 0.66 366 0.76Palm Ave White St S. Roosevelt Blvd II D 1,480 -10% No 1,332 1,192 0.89 1,475 1.11 1,499 1.13Roosevelt Blvd Eisenhower Dr Overseas Blvd II C 2,420 No No 2,420 1,897 0.78 2,851 1.18 2,919 1.21Simonton St Front St South St III/IV D 1,150 -10% -20% 805 341 0.42 590 0.73 585 0.73South St Whitehead St Ashby St III/IV D 1,150 -10% -20% 805 313 0.39 509 0.63 485 0.60Southard St Whitehead St White St III/IV D 690 -10% -20% 483 148 0.31 306 0.63 258 0.53Truman Ave (4) Whitehead St Eisenhower Dr III/IV C 1,150 No -20% 920 907 0.99 1,357 1.48 1,307 1.42United St Whitehead St George St III/IV D 1,150 -10% -20% 805 200 0.25 389 0.48 449 0.56White St Eaton St Atlantic Blvd III/IV D 1,150 -10% -20% 805 539 0.67 721 0.90 765 0.95Whitehead St Front St South St III/IV C 1,150 No -20% 920 361 0.39 616 0.67 700 0.76Notes:(1) Volumes determined from highest two-way peak hour volumes collected for the turning movement counts.(2) Roadway Classification based on signals per mile and not the same as Roadway Classification per Average Speed Methodology.(3) Roadway <strong>Capacity</strong> taken from 2009 FDOT Quality/Level of Service Handbook.(4) LOS Standard for US-1 is LOS C pursuant to City Comprehensive Plan and FDOT. However, the Truman Avenue and Whitehead Street standard capacity is based on LOS D forthe planning analysis due to the low capacity standards for LOS C on a two-lane undivided Class III/IV roadway.Calvin, Giordano & Associates Page 48
Roadway (1)1st St/Bertha StDuval StEaton StFlagler AvePalm AveRooseveltBlvdSimonton St Front StSouth StTrumanAve (4)United StWhite StWhiteheadStN. RooseveltBlvdFront StWhiteheadSt1st StFromWhite StEisenhowerDrWhiteheadStWhiteheadStWhiteheadStEaton StFront StS. RooseveltBlvdSouth StWhite StFlagler Ave Reynolds St 1st StToS. RooseveltBlvdS. RooseveltBlvdOverseasBlvdSouth StAshby StEisenhowerDrGeorge StAtlanticBlvdSouth StCity of <strong>Key</strong> <strong>West</strong> <strong>Carrying</strong> <strong>Capacity</strong> <strong>Traffic</strong> <strong>Study</strong>Table 18Directional Peak Hour V/C RatiosStandardNon ExclusiveAM Peak Hour MD Peak Hour PM Peak HourLOSAdjust.Direction Class (2)1-Way V/C 1-Way V/C 1-Way V/C<strong>Capacity</strong> (3) State Rd Turn LaneStandard<strong>Capacity</strong>Adjust. Adjust.Volume Ratio Volume Ratio Volume RatioNWB 258 0.35 327 0.45 277 0.38II D 810 -10% No 729SEB 249 0.34 250 0.34 283 0.39NWB 185 0.42 469 1.06 386 0.88III/IV D 630 -10% -20% 441SEB 109 0.25 295 0.67 372 0.84NEB 275 0.62 533 1.21 674 1.53III/IV D 630 -10% -20% 441SWB 748 1.70 743 1.68 748 1.70NEB 510 0.32 581 0.36 721 0.45II D 1,770 -10% No 1,593SWB 626 0.39 608 0.38 639 0.40NEB 342 0.47 402 0.55 529 0.73II D 810 -10% No 729SWB 483 0.66 575 0.79 541 0.74NWB 825 1.13 758 1.04 756 1.04II D 810 -10% No 729SEB 384 0.53 717 0.98 804 1.10NEB 661 0.50 1,383 1.04 1,463 1.10II C 1,330 No No 1,330SWB 1,236 0.93 1,573 1.18 1,488 1.12NWB 213 0.48 280 0.63 256 0.58III/IV D 630 -10% -20% 441SEB 128 0.29 310 0.70 348 0.79NEB 125 0.28 239 0.54 248 0.56III/IV D 630 -10% -20% 441SWB 188 0.43 270 0.61 237 0.54NEB 463 0.92 785 1.56 747 1.48III/IV C 630 No -20% 504SWB 444 0.88 572 1.13 560 1.11NEB 76 0.17 200 0.45 231 0.52III/IV D 630 -10% -20% 441SWB 124 0.28 189 0.43 218 0.49NWB 335 0.76 418 0.95 390 0.88III/IV D 630 -10% -20% 441SEB 205 0.46 308 0.70 323 0.73NWB 210 0.42 370 0.73 345 0.68III/IV C 630 No -20% 504SEB 170 0.34 265 0.53 459 0.91Notes:(1) Volumes determined from highest directional peak hour volumes collected for the turning movement counts. Southard St and Fleming St v/c ratios shown on previous table.(2) Roadway Classification based on signals per mile and not the same as Roadway Classification per Average Speed Methodology.(3) Roadway <strong>Capacity</strong> taken from 2009 FDOT Quality/Level of Service Handbook.(4) LOS Standard for US-1 is LOS C pursuant to City Comprehensive Plan and FDOT. However, the Truman Avenue and Whitehead Street standard capacity is based on LOS D forthe planning analysis due to the low capacity standards for LOS C on a two-lane undivided Class III/IV roadway.Calvin, Giordano & Associates Page 49
Exhibit 5 • Existing Conditions PM Peak Hour FDOT V/C RatioN. Roosevelt BlvdEaton StPalm AveFlagler AveFleming StSouthard StFirst StSimonton StTruman AveWhite StDuval StBertha StWhitehead StUnited StSouth StLegendFDOT traffic volume/roadway capacity ratio (V/C)V/C Ratio0 - 0.50.5 - 0.750.75 - 1.0Over capacity
City of <strong>Key</strong> <strong>West</strong> <strong>Carrying</strong> <strong>Capacity</strong> <strong>Traffic</strong> <strong>Study</strong>4.5 Highway <strong>Capacity</strong> Manual V/C RatiosAfter the generalized planning analysis, the next evaluation methodology available in a higherdegree of accuracy and <strong>com</strong>plexity level is the FDOT developed software ARTPLAN.ARTPLAN evaluates roadway conditions based on average speed and is primarily used in theplanning phase of a transportation project. ARTPLAN includes multi-modal elements and sometraffic signal parameters. However, ARTPLAN is still far too limited to accurately provideanalysis of the roadways in <strong>Key</strong> <strong>West</strong>.The next <strong>com</strong>monly used methodology in the State of Florida is an operational analysis using theanalytical methods found in the HCM and the Highway <strong>Capacity</strong> Software (HCS). The HCSallows for detailed analysis of intersections using actual traffic signal timing data. The HCMstates that the capacity of an Urban Street is based on the critical point in the roadway which isusually at a signalized intersection. The v/c ratio utilizing the HCM methodology is based on anumber of parameters including:Number of lanesLane widthHeavy vehiclesRoadway gradeParking activityBus blockagesArea typeLane utilizationLeft turnsRight turnsPedestrian and bicycle conflictsSignal timingThe v/c ratio for each of the study corridors was evaluated at the critical intersections utilizingthe HCM methodology as shown on Table 19. The results demonstrated that Duval Street, N.Roosevelt Boulevard, Truman Avenue, and Whitehead Street are overcapacity. The HCS reportsfor the critical intersections are included in Appendix I.The main limitations of the HCM are that it does not account for non-traditional multi-modalvehicles or inadequately sized exclusive turn lanes.Calvin, Giordano & Associates Page 51
City of <strong>Key</strong> <strong>West</strong> <strong>Carrying</strong> <strong>Capacity</strong> <strong>Traffic</strong> <strong>Study</strong>Table 19HCM Critical V/C RatiosRoadwayCritical IntersectionDirectionPeak HourCritical V/CRatio1st St Flagler Ave SEB PM 0.79Bertha St Flagler Ave NWB MD 0.71Duval St Truman Ave SEB PM 1.15Eaton St White St NEB PM 0.70Flagler Ave S. Roosevelt Blvd NEB PM 0.92Fleming St Simonton St NEB PM 0.90Palm Ave N. Roosevelt Blvd SEB PM 0.88N. Roosevelt Blvd Kennedy Dr NEB PM 1.01Simonton St United St SEB PM 0.45South St Simonton St (1) SWB PM 0.51Southard St Whitehead St (2) SWB PM 0.59Truman Ave Simonton St (1) SWB PM 1.06United St Simonton St NEB PM 0.32White St Eaton St NWB MD 0.98Whitehead St Truman Ave (1) SEB PM 1.14Notes:(1) Turning movements estimated(2) NEB direction has a higher v/c ratio but is not included in the one-way segment analysisCalvin, Giordano & Associates Page 52
City of <strong>Key</strong> <strong>West</strong> <strong>Carrying</strong> <strong>Capacity</strong> <strong>Traffic</strong> <strong>Study</strong>4.6 Microscopic <strong>Traffic</strong> SimulationThe HCM v/c ratios generally provide a relatively accurate portrayal of the existing conditions.However, a more detailed analysis is required to truly reflect the unique characteristics of theCity of <strong>Key</strong> <strong>West</strong>. The most <strong>com</strong>plex methodology for traffic analysis is microscopic simulation.Popular microscopic simulation tools include SIMTRAFFIC, CORSIM, PARAMICS, andVISSIM. The most popular micro simulation software used in Florida is CORSIM. CORSIM isone of the easier to use and simpler micro-simulation software packages. However, CORSIM islimited in the modeling of pedestrians and multi-modal vehicles. After careful evaluation of theeach of the micro simulation software packages, VISSIM was chosen for this study. VISSIM isone of the most sophisticated micro simulation programs available and allows for detailedcustomization of <strong>Key</strong> <strong>West</strong> specific vehicles, pedestrians, and bicycles. Additional advantages ofVISSIM include the ability to accurately model on-street parking, loading zones, specific tourroutes, geometrical constraints, and driver behavior. A 3D interface is also built into the programwhich allows for realistic visual presentations.The hierarchy of traffic evaluation tools is shown on Figure 3 below:Figure 3Hierarchy of <strong>Traffic</strong> Evaluation ToolsCalvin, Giordano & Associates Page 53
City of <strong>Key</strong> <strong>West</strong> <strong>Carrying</strong> <strong>Capacity</strong> <strong>Traffic</strong> <strong>Study</strong>4.7 VISSIM NetworkThe VISSIM network model was built utilizing the extensive amount of data collectionperformed for this study. An aerial of the entire city was imported into the model and scaledappropriately. The 15 study corridors and 25 study intersections were then added to the model.Additional intermediate roadways and intersections were added to the model as necessaryincluding each intersection that contained a traffic signal or stop control along the studycorridors. A sample of the model input parameters include the following:Roadway widthFree-flow speedSpeed limitExclusive turn lanesExisting signal timingPeak hour traffic volumesOn-street parking/loading zonesBike lanesTour vehicle routesRight turn and left turn speeds byvehicle typeVehicle types including <strong>Key</strong> <strong>West</strong>specific vehiclesAcceleration/deceleration profiles byvehicle typeOverall percent of volume by vehicletypeDriving behaviorFree flow speed is defined as the ideal travel speed one would travel on a roadway withoutimpediments such as traffic signals, stop signs, or other vehicles. VISSIM utilizes a speeddistribution for each roadway that is based on the free flow speed and speed limit. A speeddistribution allows for a more realistic modeling scenario since vehicles do not always travel atthe same speed. It was determined based on field review, speed counts, and travel time runs thatthe free flow speed in the Old Town area changes based on time of day. It should be noted thatthe free flow speed does not necessarily correlate with average speed, which is affected by trafficvolume and vehicle following conditions.One explanation for variations in free flow speeds is driver familiarity and the presence ofpedestrians. During the morning hours, most of the vehicles using the Old Town streets such asWhitehead Street, Duval Street, and Simonton Street are familiar with the area and will naturallydrive faster. However, during the afternoon and PM peak hour, a higher percentage of drivers aretourists and may likely be less familiar with the local streets and area. This may cause a decreasein vehicle speeds. Additionally, fewer pedestrians are present in Old Town in the AM peak hour.The presence of such a large amount of pedestrians later in the day in proximity may cause aslower driving speed. Therefore, the speed distributions were adjusted by time of day for the OldTown streets.Once the entire VISSIM network was built, simulations were run to <strong>com</strong>pare the model to theconditions observed in the field and documented in the travel time runs. An extensive calibrationeffort was undertaken to fine tune the model to more closely resemble the field conditions.Various adjustments were made to speed distributions, acceleration profiles, driving behaviorCalvin, Giordano & Associates Page 54
City of <strong>Key</strong> <strong>West</strong> <strong>Carrying</strong> <strong>Capacity</strong> <strong>Traffic</strong> <strong>Study</strong>and aggressiveness, and vehicle specific parameters. Due to the nature of the modeling process,the model results will never exactly replicate field conditions. However, through extensive finetuning, the existing conditions model was calibrated to closely resemble measured fieldconditions with only minor discrepancies. A <strong>com</strong>parison of the average speed and travel time forthe VISSIM final existing conditions and the Time Travel runs is shown on Table 20 and 21,respectively. Exhibit 6 depicts the PM peak hour directional LOS for each of the study corridors.Variations in LOS conditions between TravTime runs and VISSIM results are shown on Exhibit6.The <strong>com</strong>bined average speed of the study corridors resulted in a variation of 3.9%, 2.9%, and1.0% for the AM, MD, and PM peak hours, respectively, between the VISSIM model andTravTime field runs. The total travel time of the study corridors resulted in a difference of 3.8%,2.9%, and 0.1% for the AM, MD, and PM peak hours, respectively between the VISSIM modeland TravTime field runs. These results indicate that the simulation model is very wellcalibrated to existing field conditions measured during the data collection phase of thisstudy.Unlike other less sophisticated traffic analysis programs, the results for each VISSIM simulationrun will vary. A random seed generator is built into the VISSIM software that seeds the networkat different time intervals using different <strong>com</strong>binations and properties of vehicles. This createsvariation in each roadway and the entire network from one random seed to another. For purposesof this study, five different random seed VISSIM simulations were run for the existingconditions and each subsequent scenario. The lowest and highest value for each Measure ofEffectiveness (MOE) was then removed and the middle three values were averaged. The resultsshown in this report are the averages of the simulation runs and are not broken down by eachrandom seed. However, the data and results for each random seed run for all scenarios areincluded in the Appendix. The VISSIM existing conditions results are included in Appendix J.Calvin, Giordano & Associates Page 55
RoadwayRoadwayClassVISSIM(mph)City of <strong>Key</strong> <strong>West</strong> <strong>Carrying</strong> <strong>Capacity</strong> <strong>Traffic</strong> <strong>Study</strong>TravTime(mph)Table 20Existing Conditions Average Speed ComparisonAM Peak Hour%VISSIMLOSTravTimeLOSVISSIM(mph)Duval St EB/SB IV 14.00 12.94 8.2% C D 8.20 6.97 17.6% E F 6.53 6.25 4.5% F FDuval St WB/NB IV 13.50 13.36 1.0% C C 7.07 7.72 -8.5% E E 6.60 6.63 -0.5% F FEaton St EB/NB IV 16.30 14.76 10.4% C C 13.27 12.19 8.8% C D 11.63 13.14 -11.5% D CEaton St WB/SB IV 15.07 16.44 -8.4% C C 13.00 10.68 21.7% D D 11.47 11.26 1.8% D DFlagler Ave NB/EB III 22.70 24.21 -6.2% C B 22.67 21.69 4.5% C C 21.23 22.49 -5.6% C CFlagler Ave WB/SB III 22.37 22.12 1.1% C C 22.23 22.33 -0.4% C C 21.73 22.47 -3.3% C CFleming St EB/NB IV 13.47 15.03 -10.4% C C 10.20 10.37 -1.6% D D 10.03 10.65 -5.8% D DPalm Ave/1st St EB/SB III 17.50 20.01 -12.5% D C 14.43 18.63 -22.5% D C 11.53 11.80 -2.3% E EPalm Ave/1st St NB/WB III 16.43 17.60 -6.6% D D 15.90 16.09 -1.2% D D 16.10 14.18 13.5% D DSimonton St EB/SB IV 13.77 14.31 -3.8% C C 11.33 12.12 -6.5% D D 10.80 9.86 9.5% D DSimonton St NB/WB IV 13.50 14.69 -8.1% C C 10.10 10.62 -4.9% D D 9.93 10.17 -2.3% D DSouth St NB/EB IV 16.03 15.93 0.6% C C 13.43 14.13 -4.9% C C 13.93 13.03 6.9% C CSouth St SB/WB IV 14.93 16.54 -9.7% C C 13.83 12.97 6.7% C D 14.00 13.41 4.4% C CSouthard St WB/SB IV 11.87 11.02 7.7% D D 11.03 11.86 -7.0% D D 11.23 11.88 -5.4% D DTruman Ave NB/EB IV 14.63 14.56 0.5% C C 10.77 13.19 -18.4% D C 10.53 12.56 -16.1% D DTruman Ave SB/WB IV 13.60 14.83 -8.3% C C 10.23 12.99 -21.2% D D 7.60 6.46 17.6% E FUnited St EB/NB IV 16.23 18.39 -11.7% C C 14.53 17.23 -15.7% C C 15.17 16.24 -6.6% C CUnited St SB/WB IV 16.83 16.86 -0.2% C C 16.57 16.38 1.1% C C 15.40 16.32 -5.6% C CUS-1 NB/EB II 24.03 22.53 6.7% C C 21.67 19.88 9.0% D D 17.57 17.68 -0.6% D DUS-1 SB/WB II 20.90 21.63 -3.4% D D 18.00 16.98 6.0% D E 18.57 17.89 3.8% D DWhite St NB/WB IV 15.03 17.20 -12.6% C C 14.30 15.04 -4.9% C C 14.63 15.43 -5.2% C CWhite St SB/EB IV 15.70 16.50 -4.8% C C 13.37 14.49 -7.8% C C 15.00 14.08 6.5% C CWhitehead St SB/EB IV 14.43 16.25 -11.2% C C 9.47 9.78 -3.2% D D 8.37 9.06 -7.7% E DWhitehead St NB/WB IV 13.93 14.94 -6.7% C C 9.43 10.33 -8.7% D D 10.67 10.34 3.2% D DAVERAGE 16.12 16.78 -3.9% 13.54 13.94 -2.9% 12.93 13.05 -1.0%TravTime(mph)MD Peak Hour%VISSIMLOSTravTimeLOSVISSIM(mph)TravTime(mph)PM Peak Hour%VISSIMLOSTravTimeLOSCalvin, Giordano & Associates Page 56
City of <strong>Key</strong> <strong>West</strong> <strong>Carrying</strong> <strong>Capacity</strong> <strong>Traffic</strong> <strong>Study</strong>Table 21Existing Conditions Travel Time ComparisonAM Peak HourMD Peak HourPM Peak HourRoadwayVISSIM (s)Trav Time(s)Trav TimeTrav Time% VISSIM (s)% VISSIM (s)%(s)(s)Duval St EB/SB 271.3 294.6 -7.9% 462.1 547.2 -15.6% 581.0 610.8 -4.9%Duval St WB/NB 282.4 285.6 -1.1% 538.0 494.4 8.8% 579.8 581.4 -0.3%Eaton St EB/NB 148.5 168.0 -11.6% 182.3 198.0 -7.9% 207.8 183.6 13.2%Eaton St WB/SB 163.2 147.0 11.0% 189.9 225.6 -15.8% 213.9 211.2 1.3%Flagler Ave NB/EB 423.7 400.2 5.9% 424.4 444.6 -4.5% 452.7 427.2 6.0%Flagler Ave WB/SB 420.6 439.2 -4.2% 422.8 435.0 -2.8% 433.0 432.6 0.1%Fleming St EB/NB 191.7 172.2 11.3% 254.0 253.2 0.3% 257.4 240.0 7.2%Palm Ave/1st St EB/SB 320.7 273.6 17.2% 389.4 294.0 32.4% 486.9 463.8 5.0%Palm Ave/1st St NB/WB 337.8 315.0 7.2% 349.4 344.4 1.4% 343.8 388.2 -11.4%Simonton St EB/SB 277.4 261.6 6.1% 337.0 309.0 9.1% 354.2 387.0 -8.5%Simonton St NB/WB 281.6 257.4 9.4% 377.8 355.8 6.2% 382.6 371.4 3.0%South St NB/EB 238.1 235.2 1.2% 284.5 265.2 7.3% 274.1 287.4 -4.6%South St SB/WB 258.4 222.0 16.4% 278.4 286.2 -2.7% 275.8 274.2 0.6%Southard St WB/SB 221.7 235.2 -5.7% 239.0 218.4 9.4% 233.8 215.4 8.5%Truman Ave NB/EB 218.5 226.2 -3.4% 296.3 243.0 21.9% 305.2 255.0 19.7%Truman Ave SB/WB 241.2 216.0 11.7% 322.3 249.6 29.1% 431.3 513.0 -15.9%United St EB/NB 254.1 219.0 16.0% 283.4 234.0 21.1% 272.1 248.4 9.6%United St SB/WB 229.5 239.4 -4.1% 232.8 246.0 -5.4% 250.7 247.2 1.4%US-1 NB/EB 404.4 431.4 -6.3% 448.0 489.0 -8.4% 557.9 550.2 1.4%US-1 SB/WB 467.2 452.4 3.3% 541.1 576.6 -6.2% 525.5 547.2 -4.0%White St NB/WB 270.3 240.1 12.6% 284.3 270.6 5.1% 277.8 265.8 4.5%White St SB/EB 258.7 251.4 2.9% 302.9 280.8 7.9% 271.0 286.2 -5.3%Whitehead St SB/EB 251.0 221.4 13.4% 381.9 368.4 3.7% 436.2 405.6 7.6%Whitehead St NB/WB 259.4 241.2 7.5% 384.6 348.6 10.3% 341.1 348.0 -2.0%TOTAL 6691.4 6445.3 3.8% 8206.5 7977.6 2.9% 8745.7 8740.8 0.1%Calvin, Giordano & Associates Page 57
Exhibit 6 • Existing Conditions PM Peak Hour Peak Direction LOSN. Roosevelt BlvdEaton StPalm AveFlagler AveFleming StSouthard StFirst StSimonton StTruman AveWhite StDuval StBertha StWhitehead StUnited StSouth StLegendLOS CLOS DLOS ELOS FLOS based on average speed methodology.<strong>Key</strong> <strong>West</strong> <strong>com</strong>p plan identifies LOS C + 5% for US-1and LOS D for all other roadways.
City of <strong>Key</strong> <strong>West</strong> <strong>Carrying</strong> <strong>Capacity</strong> <strong>Traffic</strong> <strong>Study</strong>4.8 Intersection Level of ServiceDistinct Levels of Service for intersections are similar to those of roadways with six LOSdesignations (LOS A – LOS F). LOS A represents the most ideal situation with minimal if anydelay while LOS F represents the worst conditions with high vehicular delay. The 2000 HCMdetermines intersection LOS by control delay rather than average speed. The 2000 HCMcontains a methodology that is standard in traffic analysis practices that calculates intersectiondelay and LOS based on a variety of parameters including number of lanes, signal timing,progression, traffic volumes, heavy vehicle percentage, and approach speed, among others. TheHCM methodology is limited, however, in incorporating the unique vehicles present in the Cityof <strong>Key</strong> <strong>West</strong> and in analyzing oversaturated conditions and incorporating geometrical limitationssuch as short turn lanes.Micro-simulation analysis ac<strong>com</strong>modates more <strong>com</strong>plex input parameters resulting in a higherdegree of accuracy than the standard HCM analysis. It is used less frequently due to the amountof time and effort necessary to construct the network. Due to many of the reasons already statedand to keep consistency with the roadway analysis, VISSIM was used to analyze the studyintersections. The MOE used to determine the LOS for the intersections is delay similarly to theHCM. The delay criterion for the LOS designation also remains the same as identified in the2000 HCM for both signalized intersections and stop control intersections. Stop controlintersections have a different threshold for delay and LOS because of driver perception. A driveris more willing to tolerate a higher amount of delay at a signalized intersection since they knowthat the light will eventually turn green and they will have an opportunity to get through theintersection. This does not occur at stop controlled intersections and thus drivers are less willingto tolerate delay.The LOS designations for signalized intersections and stop controlled intersections are shown onTables 22 and 23, respectively.Table 22LOS Criteria for Signalized IntersectionsControl DelayLOSper Vehicle (seconds/veh)A ≤ 10B > 10-20C >20-35D >35-55E >55-80F >80Source: 2000 HCM Exhibit 16-2Calvin, Giordano & Associates Page 59
City of <strong>Key</strong> <strong>West</strong> <strong>Carrying</strong> <strong>Capacity</strong> <strong>Traffic</strong> <strong>Study</strong>Table 23LOS Criteria for Stop Controlled IntersectionsControl DelayLOSper Vehicle (seconds/veh)A 0-10B > 10-15C >15-25D >25-35E >35-50F >50Source: 2000 HCM Exhibit 17-2 and 17-22In addition to the previously identified 25 study intersections, the intersections of TrumanAvenue at Whitehead Street and Simonton Street were analyzed. The intersections of TrumanAvenue at Whitehead Street and Simonton Street were included due to high peak hour delaysidentified during the data collection phase. Results of the intersection operational analyses forexisting conditions are presented in Table 24. The existing signal timings for all signalizedintersections on the study corridors are included in Appendix K.Calvin, Giordano & Associates Page 60
City of <strong>Key</strong> <strong>West</strong> <strong>Carrying</strong> <strong>Capacity</strong> <strong>Traffic</strong> <strong>Study</strong>IntersectionIntersectionControlTable 24Intersections Existing ConditionsApproachAM Peak Hour MD Peak Hour PM Peak HourDelay (s) LOS Delay (s) LOS Delay (s)LOSDuval St atEaton StDuval St atFront StDuval St atSouthard StDuval St atAngela StDuval St atTruman AveDuval St atSouth StWhite St atEaton StWhitehead Stat Fleming StSignalSignalSignalSignalSignalFour-WayStopSignalSignalNEB 15.4 B 18.1 B 25.3 CSEB 9.7 A 21.0 C 36.4 DSWB 17.4 B 28.4 C 25.4 CNWB 9.7 A 28.2 C 27.8 CTotal 12.9 B 25.1 C 30.8 CNB 14.9 B 18.6 B 20.7 CSEB 10.9 B 11.7 B 14.0 BSWB 13.8 B 19.4 B 22.8 CNWB 12.2 B 25.0 C 32.1 CTotal 13.4 B 21.2 C 25.7 CSEB 10.0 B 20.7 C 30.6 CSWB 16.1 B 23.3 C 21.2 CNWB 8.8 A 37.5 D 45.3 DTotal 11.4 B 27.9 C 33.3 CNEB 12.7 B 14.9 B 15.0 BSEB 11.4 B 21.7 C 38.5 DSWB 10.6 B 14.9 B 12.9 BNWB 9.4 A 29.2 C 30.3 CTotal 10.6 B 24.2 C 31.0 CNEB 10.4 B 20.5 C 27.7 CSEB 13.1 B 42.3 D 75.7 ESWB 9.6 A 16.5 B 14.3 BNWB 11.9 B 39.8 D 50.8 DTotal 11.2 B 29.6 C 46.3 DNEB 7.9 A 15.3 C 12.8 BSEB 7.3 A 16.6 C 13.8 BSWB 12.3 B 24.3 C 17.1 CNWB 6.3 A 8.5 A 8.9 ATotal 9.8 A 18.6 C 14.0 BNEB 6.3 A 11.0 B 13.9 BSEB 17.6 B 22.1 C 24.2 CSWB 10.1 B 10.1 B 10.4 BNWB 22.3 C 34.7 C 40.6 DTotal 11.4 B 15.5 B 17.1 BNEB 13.5 B 15.4 B 17.4 BSEB 9.7 A 16.0 B 20.6 CNWB 13.4 B 24.9 C 18.7 BTotal 12.5 B 19.0 B 19.0 BCalvin, Giordano & Associates Page 61
City of <strong>Key</strong> <strong>West</strong> <strong>Carrying</strong> <strong>Capacity</strong> <strong>Traffic</strong> <strong>Study</strong>IntersectionSimonton St atFleming StGrinnell St atFleming StWhite St atSouthard StWhithead St atSouthard StWhitehead Stat Greene StWhitehead Stat TrumanAve (1)Simonton St atCaroline StSimonton St atTruman Ave (1)IntersectionControlSignalSignalSignalSignalFour-WayStopSignalSignalSignalTable 24 ContinuedIntersections Existing ConditionsApproachAM Peak Hour MD Peak Hour PM Peak HourDelay (s) LOS Delay (s) LOS Delay (s)LOSNEB 11.9 B 19.8 B 18.1 BSEB 7.6 A 10.2 B 12.3 BNWB 9.5 A 16.1 B 11.8 BTotal 10.0 B 17.0 B 14.6 BNEB 8.5 A 12.9 B 13.7 BSEB 14.4 B 14.9 B 14.8 BNWB 8.1 A 10.2 B 11.3 BTotal 9.2 A 13.1 B 13.5 BSEB 1.4 A 2.2 A 2.4 ASWB 5.6 A 5.6 A 5.1 ANWB 3.5 A 4.6 A 3.5 ATotal 2.6 A 3.3 A 3.0 ANEB 31.7 C 38.7 D 65.5 ESEB 22.2 C 31.2 C 49.8 DSWB 39.4 D 46.0 D 43.4 DNWB 20.3 C 33.7 C 24.4 CTotal 27.7 C 37.4 D 46.0 DNEB 6.1 A 8.3 A 8.4 ASEB 8.4 A 13.7 B 13.3 BSWB 6.0 A 8.3 A 8.6 ANWB 7.2 A 15.1 C 20.7 CTotal 7.3 A 12.9 B 14.7 BSEB 10.0 A 22.0 C 60.2 ESWB 10.4 B 12.7 B 14.8 BNWB 10.8 B 26.6 C 19.4 BTotal 10.6 B 22.2 C 40.2 DNEB 10.8 B 14.3 B 12.6 BSEB 8.9 A 10.0 A 11.2 BSWB 11.8 B 17.2 B 16.9 BNWB 9.2 A 12.8 B 10.8 BTotal 10.0 A 13.9 B 13.1 BNEB 15.7 B 37.4 D 66.5 ESEB 10.2 B 15.0 B 18.3 BSWB 20.7 C 34.5 C 111.7 FNWB 16.9 B 23.7 C 23.0 CTotal 17.0 B 30.6 C 61.6 ECalvin, Giordano & Associates Page 62
City of <strong>Key</strong> <strong>West</strong> <strong>Carrying</strong> <strong>Capacity</strong> <strong>Traffic</strong> <strong>Study</strong>IntersectionIntersectionControlTable 24 ContinuedIntersections Existing ConditionsApproachAM Peak Hour MD Peak Hour PM Peak HourDelay (s) LOS Delay (s) LOS Delay (s)LOSSimonton St atUnited StThomas St atPetronia StOlivia St atFrances StTruman Ave atWhite StWhite St atCatherine StWhite St atFlagler AveTruman Ave at1st StFlagler Ave at1st StSignalSignalOne-WayStopSignalTwo-WayStopSignalSignalSignalNEB 8.6 A 11.6 B 11.6 BSEB 14.5 B 17.5 B 19.0 BSWB 12.4 B 14.1 B 12.5 BNWB 11.9 B 15.3 B 14.9 BTotal 12.4 B 14.5 B 14.5 BSEB 7.5 A 8.0 A 8.0 ASWB 6.8 A 8.6 A 8.3 ANWB 8.0 A 8.8 A 9.2 ATotal 7.5 A 8.6 A 8.4 ANEB 6.2 A 7.5 A 7.5 ASEB 0.0 0.1 0.2NWB 0.1 0.2 0.1Total 3.2 4.5 4.3NEB 15.3 B 36.8 D 23.7 CSEB 29.0 C 43.9 D 35.2 DSWB 20.7 C 38.4 D 31.1 CNWB 36.3 D 41.9 D 37.6 DTotal 24.3 C 39.3 D 31.3 CNEB 8.3 A 9.0 A 9.7 ASEB 1.0 1.6 3.5SWB 7.4 A 7.9 A 7.8 ANWB 1.5 1.2 1.3Total 2.1 2.6 3.0NEB 14.4 B 11.0 B 13.6 BSEB 15.7 B 16.0 B 25.0 CSWB 18.0 B 15.5 B 20.3 CNWB 12.5 B 11.8 B 14.1 BTotal 16.1 B 14.5 B 20.0 BEB 17.1 B 24.9 C 25.3 CSEB 21.4 C 69.3 E 73.5 EWB 24.3 C 31.7 C 22.6 CNWB 27.9 C 31.0 C 29.2 CTotal 23.4 C 37.8 D 36.9 DNEB 24.0 C 24.9 C 29.9 CSEB 35.2 D 39.3 D 49.6 DSWB 23.9 C 24.3 C 25.3 CNWB 29.3 C 47.0 D 31.6 CTotal 26.6 C 31.7 C 31.4 CCalvin, Giordano & Associates Page 63
City of <strong>Key</strong> <strong>West</strong> <strong>Carrying</strong> <strong>Capacity</strong> <strong>Traffic</strong> <strong>Study</strong>IntersectionRooseveltBlvd atKennedy DrUS-1 atOverseas HwyUS-1 at FlaglerAveIntersectionControlSignalSignalSignalTable 24 ContinuedIntersections Existing ConditionsApproachAM Peak Hour MD Peak Hour PM Peak HourDelay (s) LOS Delay (s) LOS Delay (s)LOSNEB 23.5 C 35.7 D 39.9 DSEB 20.6 C 23.4 C 25.7 CSWB 31.0 C 52.3 D 44.1 DNWB 20.6 C 24.8 C 28.2 CTotal 26.5 C 39.7 D 38.2 DNB 8.0 A 18.0 B 27.3 CSEB 16.3 B 28.1 C 67.4 EWB 10.9 B 16.4 B 19.4 BTotal 11.6 B 21.1 C 39.4 DNB 11.4 B 13.0 B 14.6 BEB 19.2 B 17.3 B 25.6 CSB 16.5 B 12.9 B 13.5 BTotal 15.9 B 13.9 B 18.0 BNETWORK TOTAL16.4 25.3 29.9Notes:(1) Included in analysis due to high delay but not a study intersection.NEB – Northeast BoundSEB – Southeast BoundSWB – Southwest BoundNWB – Northwest BoundEB – EastboundWB – <strong>West</strong>boundNB – NorthboundSB - SouthboundCalvin, Giordano & Associates Page 64
City of <strong>Key</strong> <strong>West</strong> <strong>Carrying</strong> <strong>Capacity</strong> <strong>Traffic</strong> <strong>Study</strong>4.9 Analysis of Failing Roadways and IntersectionsThe results of the existing conditions analysis show that the following roadways andintersections are operating below the minimum LOS standards, as previously defined in thisstudy:RoadwaysAM PeakUS-1 westbound from Overseas Highway to Eisenhower DriveMD PeakDuval Street southboundDuval Street northboundTruman Avenue eastboundTruman Avenue westboundUS-1 eastbound from Eisenhower Drive to Overseas HighwayUS-1 westbound from Overseas Highway to Eisenhower DrivePM PeakDuval Street southboundDuval Street northboundTruman Avenue eastboundTruman Avenue westboundPalm Avenue/1 st Street eastbound/southboundUS-1 eastbound from Eisenhower Drive to Overseas HighwayUS-1 westbound from Overseas Highway to Eisenhower DriveWhitehead Street southboundIntersectionsMD PeakN. Roosevelt Boulevard at 1 st Street – Southeast approachPM PeakDuval Street at Truman Avenue – Southeast approachWhitehead Street at Southard Street – Northeast approachWhitehead Street at Truman Avenue – Southeast approachSimonton Street at Truman Avenue – Northeast and Southwest approaches, overall intersectionN. Roosevelt Boulevard at 1 st Street – Southeast approachUS-1 at Overseas Highway – Southeast approachExhibit 7 depicts each of the intersections that currently contain at least one approach operatingat LOS E or F.Calvin, Giordano & Associates Page 65
Exhibit 7 • Existing Conditions PM Peak HourIntersections with a LOS E or LOS F ApproachN. Roosevelt BlvdEaton StPalm AveFlagler AveFleming StSouthard StFirst StSimonton StTruman AveWhite StDuval StWhitehead StBertha StUnited StSouth StLegend<strong>Study</strong>CorridorIntersections WithLOS E or F Approach
City of <strong>Key</strong> <strong>West</strong> <strong>Carrying</strong> <strong>Capacity</strong> <strong>Traffic</strong> <strong>Study</strong>Duval Street <strong>Capacity</strong> IssuesDuval Street is arguably the most famous street in the City and a widely popular touristattraction. Retail shops, restaurants, and bars are prevalent along the entire Duval Street corridor,attracting significant pedestrian activity. In addition to link failures, the southeast approach onDuval Street at Truman Avenue was found to be failing during the PM peak hour. This can beattributed primarily to the high volume of left-turning vehicles from Duval Street onto TrumanAvenue. Like all intersections on Duval Street, there is no left- or right-turn deceleration laneavailable to reduce intersection delay.In general, congestion along the Duval Street corridor can be attributed to a number of factorsincluding the following:Heavy Pedestrian Activity. Since Duval Street is a primary tourist destination, it attracts ahigh volume of pedestrians. This can make traffic turning movements more difficult asdrivers yield to pedestrians and can cause traffic delays as drivers tend to be morecautious when pedestrians are present.Intersection Spacing. There are eight signalized intersections and two stop-controlledintersections in just over a one mile portion of the Duval Street corridor. This frequencyof intersections can contribute to traffic delays. In addition, the signalized intersectionsoperate with fixed timing rather than a coordinated progression timing plan that isresponsive to demand.Non-traditional Vehicles. Numerous modes of transportation can be found on DuvalStreet at any given time of day, such as pedicabs, tour vehicles, bicycles, scooters andsuch. Some non-traditional vehicles were found to generally travel slower than a typicalpassenger car, causing additional traffic delay.On Street Parking. Parking maneuvers and limited roadway width can contribute toincreased travel delay on the corridor.Truman Avenue <strong>Capacity</strong> IssuesTruman Avenue from Whitehead Street to Eisenhower Drive in the eastbound direction wasfound to be operating at LOS D during the mid day and PM peak hours. Truman Avenue fromEisenhower Drive to Whitehead Street in the westbound direction was found to be operating atLOS D and LOS F during the mid day and PM peak hours, respectively. LOS D is consideredacceptable for all other roadways in the City except the US-1 corridor. There are sevensignalized intersections on Truman Avenue from Whitehead Street to Eisenhower Drive, adistance of just under one mile. This high frequency of traffic signals along with the othercharacteristics such as driver unfamiliarity, high volume of non-traditional vehicles, lack ofauxiliary turn lanes, high pedestrian volumes, and poor signal progression arguably contribute tothe slow travel times on Truman Avenue.Calvin, Giordano & Associates Page 67
City of <strong>Key</strong> <strong>West</strong> <strong>Carrying</strong> <strong>Capacity</strong> <strong>Traffic</strong> <strong>Study</strong>The very slow average speed on Truman Avenue in the westbound direction during the PM peakhour can be most attributed to delays at the intersection of Truman Avenue at Simonton Street.Computer analysis and field data collection demonstrated that there is significant delay on thesouthwest bound approach on Truman Avenue at Simonton Street. The main cause of this is thehigh traffic volume approaching the intersection with inadequate signal timing. The green time tocycle length (g/C) ratio for this approach during the PM peak hour is 0.36 which is insufficientfor an approach with this high of traffic volumes. The signal timing is currently configured atthis intersection to assist vehicles making a left turn from the southeast bound approach onSimonton Street to eastbound Truman Avenue. The southeast bound approach is given exclusivegreen time before the start of the northwest bound approach on Simonton Street to help clear thequeue. By doing this, the cycle length time is extended and this results in a smaller percentage ofgreen time for Truman Avenue.The aerial image shown below and provided by Google Earth illustrates the long vehicular queuethat can occur on the southwest approach at the intersection of Truman Avenue at SimontonStreet.Southwest bound approach on Truman Avenue at Simonton Street.Source: Google EarthUS-1/N. Roosevelt Boulevard <strong>Capacity</strong> IssuesN. Roosevelt Boulevard from Eisenhower Drive to Overseas Highway in the eastbound directionis operating at LOS D during the mid day and PM peak hours. US-1 from Overseas Highway toEisenhower Drive in the westbound direction is operating at LOS D during the AM, mid day,Calvin, Giordano & Associates Page 68
City of <strong>Key</strong> <strong>West</strong> <strong>Carrying</strong> <strong>Capacity</strong> <strong>Traffic</strong> <strong>Study</strong>and PM peak hours. Some contributing factors to the slower average speeds are the high trafficvolumes, frequency of signalized intersections, and poor signal timing progression. Conditionson US-1 are congested but there are no single points of significantly high delay. Unlike manyother roadways in the City, N. Roosevelt Boulevard contains exclusive left turn lanes at variouslocations and a two-way center left turn lane throughout a majority of the roadway. The southside of N. Roosevelt Boulevard is mostly filled with <strong>com</strong>mercial development which contributesto the congestion because of the frequent access driveways. While some non-traditional vehiclesuse N. Roosevelt Boulevard, the volume as a percentage of overall traffic is much lower than theroads in the Old Town area.The southeast bound approach on N. Roosevelt Boulevard at Overseas Highway is currentlyoperating at LOS E during the PM peak hour. The high delay for this approach is primarilycaused by the high number of left turns at this approach. N. Roosevelt Boulevard and S.Roosevelt Boulevard serve as the only connection to Overseas Highway which is the onlyvehicular ingress and egress into <strong>Key</strong> <strong>West</strong>. Therefore, the southeast bound left turn movementduring the PM peak hour consists of a large number of workday <strong>com</strong>muters.Palm Avenue/1 st Street/Bertha Street <strong>Capacity</strong> IssuesFor analysis purposes, Palm Avenue, 1 st Street, and Bertha Street were <strong>com</strong>bined into one studysegment since all three roadway segments are contiguous and share <strong>com</strong>mon characteristics. ThePalm Avenue corridor in the eastbound/southbound direction is operating at LOS E during thePM peak hour, which is primarily attributable to delay at the Palm Avenue/1 st Street at N.Roosevelt Boulevard intersection.The southeast bound approach at theintersection of Palm Avenue and N.Roosevelt Boulevard is operating at LOS Eduring the MD and PM peak hours. This isprimarily attributable to the high volume ofleft-turning vehicles in the southeast boundleft-turn lane. Although a left-turndeceleration lane is provided, the lane isonly 170 feet in length, which was shown tobe significantly insufficient to ac<strong>com</strong>modatethe demand during the PM peak hour.The image shown to the right from GoogleEarth illustrates the deficiency at thisapproach.Southeast bound approach at Palm Avenue at US-1Source: Google EarthCalvin, Giordano & Associates Page 69
City of <strong>Key</strong> <strong>West</strong> <strong>Carrying</strong> <strong>Capacity</strong> <strong>Traffic</strong> <strong>Study</strong>Whitehead Street <strong>Capacity</strong> IssuesThe existing conditions TravTime results showed that the average speed on Whitehead Street inthe southbound direction during the PM peak hour is 9.06 mph, which corresponds to an LOS D.However, this average speed should be considered borderline LOS D/LOS E since the thresholdfor LOS E is 9.0 mph. Furthermore, the existing conditions VISSIM results show that WhiteheadStreet in the southbound direction during the PM peak hour is operating at LOS E with anaverage speed of 8.37 mph. The Whitehead Street segment from Fleming Street to TrumanAvenue is considered US-1.Whitehead Street is home to many popular tourist attractions such as the beginning and end ofUS-1, the Southernmost Point, and the Hemmingway House. The on-street parking present onWhitehead Street is attractive to tourists as well because of the proximity to Duval Street, FrontStreet, and Mallory Square.There are three traffic signals and three stop controlled intersection on the approximately onemilestretch of roadway. The reasons for the slow average speed is similar to that of Duval Streetin that there is a high percent of driver unfamiliarity, high number of pedestrians, high number ofnon-traditional vehicles, and the constant vehicle interactions of the on-street parking. The mostcongested portion of Whitehead Street is the southbound segment approaching Truman Avenue.The only failing approach on Whitehead Street is the southeast bound approach at TrumanAvenue. This approach processes the highest traffic volume on Whitehead Street and is<strong>com</strong>monly used as a gateway to other parts of the City. Similar to the other intersections onWhitehead Street, an exclusive left turn lane is not provided at this intersection.Southard Street at Whitehead Street <strong>Capacity</strong> IssuesThe northeast approach on Southard Street at Whitehead Street is operating at LOS E during thePM peak hour. The traffic signal at this intersection operates under split phasing, which can beless efficient, and has one of the longest signal timing cycle lengths in the City.Flagler Avenue at 1 st Street/Bertha Street <strong>Capacity</strong> IssuesThe traffic signal at Flagler Avenue and 1 st Street/Bertha Street currently operates under splitphasing. Although split phasing can be less efficient, it is necessary at this intersection due tophysical constraints.Calvin, Giordano & Associates Page 70
City of <strong>Key</strong> <strong>West</strong> <strong>Carrying</strong> <strong>Capacity</strong> <strong>Traffic</strong> <strong>Study</strong>4.10 Staples Avenue BridgeBicycle and pedestrian counts werecollected during the PM peak hour on April27, 2011 on the Staples Avenue Bridgebetween 8 th Street and 10 th Street. Therewere several pedestrians who crossed thebridge but the majority of crossings werebicyclists. The peak hour from 4:30PM to5:30 PM consisted of 115 bicycles and 15pedestrians crossing the bridge.The Staples Avenue Bridge is popularamong residents who <strong>com</strong>mute betweentheir homes southwest of the bridge and themany <strong>com</strong>mercial areas on Kennedy Driveand northeast of the bridge. It is also usedfrequently by students of the PoincianaElementary School which is locatedapproximately ½ mile northeast of thebridge.The only roadway that crosses the canalbetween N. Roosevelt Boulevard and S.Roosevelt Boulevard is Flagler Avenue.Flagler Avenue contains a bike lane but onlyfor the segment from Kennedy Drive to S.Roosevelt Boulevard. Therefore, the StaplesAvenue Bridge is an attractive alternative.Calvin, Giordano & Associates Page 71
City of <strong>Key</strong> <strong>West</strong> <strong>Carrying</strong> <strong>Capacity</strong> <strong>Traffic</strong> <strong>Study</strong>5.0 FUTURE CONDITIONS ANALYSIS5.1 Background GrowthIt is a <strong>com</strong>mon engineering practice when evaluating future traffic scenarios to first considerfuture growth resulting from undeveloped land and identified through historical trends. Mostcounties and Metropolitan Planning Organizations (MPO) throughout the state of Florida use atraffic modeling tool known as Florida State Urban Transportation Modeling Structure(FSUTMS). The FSUTMS is calibrated to existing conditions by using parameters such as theexisting land use data, roadway network, traffic data, and many data inputs. After calibration ofthe existing roadway network, the future planning year parameters such as future land uses andthe future transportation network are input into the model. Additionally, employment andpopulation data are input into the FSUTMS for the existing year and the future planning year.The existing and future population data is generally developed in the County’s Long RangeTransportation Plan and based on data provided by the University of Florida Bureau ofEconomic and Business Research (BEBR). Once all the future planning year data is inserted intothe model, the FSUTMS will project the future traffic conditions onto the roadway networktaking all data into account. The future year FSUTMS projections are considered more reliablefor a region as a whole and less reliable for individual roadway segments.However, an MPO has not been established for Monroe County and the County does notmaintain a FSUTMS. Therefore, it was necessary to develop an alternative approach in order toaccount for background growth. It was determined that the most feasible alternative would be toevaluate historical traffic counts in the City of <strong>Key</strong> <strong>West</strong> and to evaluate future Monroe Countypopulation projections from BEBR. Future population projections for <strong>Key</strong> <strong>West</strong> were notavailable so County information was considered.There are 23 FDOT count stations within the City of <strong>Key</strong> <strong>West</strong>. 22 of the 23 FDOT countstations have yearly data dating back to at least 1995. Therefore, 22 FDOT count stations wereevaluated for a 15-year span from 1995 to 2009. A regression analysis of the historical AverageAnnual Daily <strong>Traffic</strong> (AADT) volumes was <strong>com</strong>pleted using the FDOT “<strong>Traffic</strong> Trends”spreadsheet. A linear trend line was fit to the data, and the trend analysis printouts for eachtraffic monitoring site are provided in Appendix L. A summary of the historical FDOT trafficcounts are shown on Table 25 and included in Appendix M.The results show that there has been inconsistent growth for most of the individual roadways inthe City. Additionally, the summation of all the count stations demonstrate that whilefluctuations have occurred during various time spans, the overall traffic volumes are very similarin 1995 and 2009.Calvin, Giordano & Associates Page 72
City of <strong>Key</strong> <strong>West</strong> <strong>Carrying</strong> <strong>Capacity</strong> <strong>Traffic</strong> <strong>Study</strong>FDOTStation#Table 25FDOT Historical <strong>Traffic</strong> VolumesLOCATION 1995 1996 1997 1998 1999 2000 2001 2002 2003 2004 2005 2006 2007 2008 200990-004 Atlantic Blvd E. of White St 4,600 4,400 4,400 4,300 4,000 5,100 4,700 5,600 5,900 5,200 6,700 4,400 4,800 5,600 4,900 1.11% 20.7%90-0020 Eaton St W. of Duval St 5,900 5,800 6,600 6,300 5,900 6,100 5,600 3,900 4,500 4,200 5,500 3,700 4,800 5,300 4,700 -2.19% 42.7%90-0023 Duval St N. of Truman Ave 11,000 7,200 11,000 10,500 5,100 8,000 10,500 8,900 10,500 9,400 8,900 7,500 6,600 6,600 7,000 -2.18% 39.8%90-0025 White St N. of Truman Ave 7,300 9,200 6,800 6,600 7,200 7,400 5,900 7,600 6,700 7,400 7,100 5,300 4,700 5,600 5,000 -1.90% 44.9%90-0026 White St S. of Truman Ave 9,800 10,000 8,800 10,500 9,200 12,000 9,500 8,400 11,500 8,900 9,900 8,500 7,600 7,800 8,500 -1.37% 23.7%90-0028 Kennedy Blvd S. of US-1 8,400 8,600 9,000 11,000 10,500 8,500 9,400 9,900 10,500 9,700 9,900 9,900 8,800 7,500 9,300 -0.15% 0.5%90-0029 Byrd Rd N. of Roosevelt Blvd 6,800 5,900 6,100 7,400 6,400 5,600 5,800 6,500 6,600 5,800 5,800 5,100 4,400 6,200 4,600 -1.71% 40.5%90-0049 Roosevelt Blvd S. of US-1 17,500 18,000 19,000 21,000 19,000 18,100 20,500 20,000 22,000 21,500 21,500 23,500 18,900 17,900 19,400 0.72% 11.9%90-0073 1st St S. of US-1 6,500 7,000 9,200 7,800 6,500 7,300 7,100 7,400 7,700 8,000 8,000 7,000 6,000 7,800 6,700 -0.29% 1.7%90-0103 Palm Ave N. of US-1 18,500 17,500 18,000 21,000 19,900 15,500 18,000 18,300 22,500 19,700 19,500 18,200 17,800 16,200 18,300 -0.15% 0.8%90-0105 US-1 W. of SR A1A 29,500 28,000 30,500 40,500 34,500 31,500 34,500 34,500 36,500 34,500 31,000 32,500 32,000 29,000 33,500 0.46% 6.7%90-5004 Truman Ave W. of 1st St 17,500 15,000 20,000 22,500 22,500 20,500 21,500 22,500 22,500 21,000 18,600 13,700 18,100 18,500 19,600 0.00% 0.0%90-5008 Truman Ave W. of White St 13,000 13,500 17,000 17,400 16,000 25,100 17,000 14,500 14,000 14,300 14,000 14,800 16,800 15,200 16,800 0.28% 1.7%90-5011 Truman Ave E. of Duval St 13,500 5,300 11,000 12,000 9,300 9,200 12,000 8,800 9,000 10,400 8,200 7,600 8,600 8,600 9,300 -2.48% 59.2%90-5013 Whitehead St S. of Olivia St 6,700 6,100 9,800 7,400 9,100 10,100 9,600 8,100 8,800 8,300 6,700 5,900 5,300 6,400 6,700 -1.58% 15.5%90-5017 Flagler Ave W. of Roosevelt Blvd 8,400 9,300 9,200 10,700 10,400 10,800 11,000 10,600 11,100 10,500 9,900 12,500 11,200 9,300 11,900 2.00% 63.3%90-5025 Flagler Ave E. of White St 9,300 9,800 10,000 11,000 11,000 10,400 10,000 10,200 11,500 10,200 10,100 10,200 10,300 8,600 10,500 0.28% 6.8%90-5026 1st St S. of Seidenberg Ave 5,600 4,000 6,000 7,400 6,200 5,600 7,000 6,200 6,800 6,700 6,100 6,400 5,400 5,800 5,800 0.36% 1.9%90-5027 Roosevelt Blvd S. of Flagler Ave 12,000 11,500 11,500 12,000 12,500 9,600 11,000 13,000 13,500 13,100 12,700 10,000 9,500 10,100 11,200 -0.65% 7.8%90-5028 Roosevelt Blvd E. of Bertha St 10,500 10,000 10,500 10,000 8,700 11,800 11,000 10,100 11,500 11,200 10,700 6,900 6,400 8,900 7,200 -1.80% 28.7%90-5034 Roosevelt Blvd W. of Byrd Rd 31,500 30,000 36,500 42,500 42,500 34,500 32,500 37,000 37,500 37,500 34,000 33,000 34,500 30,000 34,500 -0.39% 3.0%90-5035 United St E. of Royal St 7,300 8,200 6,400 6,300 6,400 6,900 8,000 6,800 8,100 6,100 6,700 6,300 5,400 6,000 5,700 -1.43% 31.1%90-7071 Eaton St W. of Grinnell St 10,700 N/A N/ATotal (excluding FDOT Station # 90-7071) 261.1 244.3 277.3 306.1 282.8 279.6 282.1 278.8 299.2 283.6 271.5 252.9 247.9 242.9 261.1 -0.48% 9.8%Notes:Sum of all roadway volumes shown in thousands.Orange highlight indicates not a study corridor.Red highlight indicates removed from trend analysis for consistency.15YearLGRR^2Calvin, Giordano & Associates Page 73
City of <strong>Key</strong> <strong>West</strong> <strong>Carrying</strong> <strong>Capacity</strong> <strong>Traffic</strong> <strong>Study</strong>The analysis for population projections was taken from Projections of Florida Population byCounty, 2008-2035 produced by BEBR in March 2009. Table 26 documents the findings forMonroe County:Table 26Monroe County Population ProjectionsMonroe County 2008 2010 2015 2020 2025 2030 2035Estimate 76,081Low 72,400 69,000 65,800 62,600 59,600 56,600Medium 74,600 73,500 72,300 71,200 70,200 69,200High 76,900 77,800 78,800 79,700 80,600 81,500Source: University of Florida BEBRAll projections for April 1.The BEBR projections show that a slight negative growth is expected between 2008 and 2035. Inaddition to the roadway volume analysis and the BEBR projections, the future land use and theCity’s Comprehensive Plan were reviewed. The City Comprehensive Plan shows that there arefew vacant parcels available in the City. However, there are additional parcels that areunderdeveloped and could be redeveloped at a higher density at some point in the future.After taking into account the historical traffic trends, the BEBR projections, and the future landuse, it was determined that future background traffic growth could be considered minimal andtherefore no adjustments were made to the existing traffic volumes. The data showed that whilefluctuations may occur over short periods of time, population and traffic demand projections donot vary significantly through Year 2035.Calvin, Giordano & Associates Page 74
City of <strong>Key</strong> <strong>West</strong> <strong>Carrying</strong> <strong>Capacity</strong> <strong>Traffic</strong> <strong>Study</strong>5.2 Optimized ConditionsMost of the traffic signals throughout the City and particularly in Old Town operate on fixedtiming plans. In fixed signal timing plans, each signal phase will give the allotted green timeeach cycle regardless of vehicle demand. Fixed signal timing plans can sometimes increase delaysince stopped vehicles may have to wait while green time is given to the roadway where novehicles are present.For the optimized conditions simulation runs, each signalized intersection in the model was setup to operate in a fully actuated or semi-actuated signal timing plan. This means the signals willrespond to traffic demand and adjust green times accordingly. In order for traffic signals tooperate under these conditions, vehicle detectors must be present at each signalized intersection.Several corridors were also coordinated to increase progression along the roadways. Coordinatedpatterns were developed for particular segments of Duval Street, N. Roosevelt Boulevard,Truman Avenue, Eaton Street/Palm Avenue, and Flagler Avenue. Additional signal timingadjustments were made throughout the roadway network as well, focusing on the existingdeficiencies.The addition of vehicle detectors, actuated traffic signals, and signal timing optimization provedto be the most beneficial in improving travel times and delay. Signal timing progression can bedifficult for many of the corridors in the City due to lack of sufficient turn lanes at intersectionsand the inconsistent speeds of vehicles.Only one roadway lane geometry improvement was included for the optimized conditionsscenario. The auxiliary left-turn lane for the southeast bound approach on Palm Avenue at N.Roosevelt Boulevard was extended approximately 200 feet. It appears that this improvement canbe constructed with only a minor impact to the existing infrastructure. Some landscape areaswould be reduced and the existing shared use paths would need to be relocated. However, itappears this improvement could be ac<strong>com</strong>modated within the existing right-of-way.Signal timing adjustments were incorporated into the traffic simulation model for each signalizedintersection on the study corridors, rather than just the 25 study intersections. For each of thenon-study signalized intersections, the turning movement volumes were estimated based onengineering judgment and volume balancing the network. Therefore, the optimized signal timingdocumented in this report for these non study intersections may need to be adjusted once actualtraffic counts are collected.Table 27 shows signalized intersections modeled in this report that currently have vehicledetection or pedestrian signals. Many of the signalized intersections particularly in Old Townthat do have vehicle detection are currently not operating in an actuated mode.Calvin, Giordano & Associates Page 75
City of <strong>Key</strong> <strong>West</strong> <strong>Carrying</strong> <strong>Capacity</strong> <strong>Traffic</strong> <strong>Study</strong>Table 27Signalized Intersection OperationsIntersectionVehicle Detection Pedestrian SignalStreet 1 Street 2 Yes No Yes NoDuval Street Caroline Street X XDuval Street Front Street X XDuval Street Eaton Street X XDuval Street Fleming Street X XDuval Street Southard Street X XDuval Street Angela Street X XDuval Street Greene Street X XEaton Street Grinnell Street X XFlagler Avenue White Street X XFlagler Avenue 1st Street X XFlagler Avenue 5th Street X XFlagler Avenue Kennedy Drive X XFleming Street Grinnell Street X XN. Roosevelt Boulevard Palm Avenue X XN. Roosevelt Boulevard 5th Street X XN. Roosevelt Boulevard Kennedy Drive X XN. Roosevelt Boulevard Overseas Market X XPalm Avenue Ely Street X XS. Roosevelt Boulevard Flagler Avenue X XSimonton Street Eaton Street X XSimonton Street Fleming Street X XSimonton Street Southard Street X XSimonton Street United Street X XSimonton Street South Street X XSimonton Street Caroline Street X XThomas Street Petronia Street X XTruman Avenue Duval Street X XTruman Avenue Simonton Street X XTruman Avenue White Street X XTruman Avenue Windsor Lane X XTruman Avenue Whitehead Street X XTruman Avenue Florida Street X XTruman Avenue Eisenhower Drive X XUS-1 N. Roosevelt Boulevard X XWhite Street Southard Street X XWhite Street Eaton Street X XWhite Street Virginia Street X XWhitehead Street Fleming Street X XWhitehead Street Southard Street X XCalvin, Giordano & Associates Page 76
City of <strong>Key</strong> <strong>West</strong> <strong>Carrying</strong> <strong>Capacity</strong> <strong>Traffic</strong> <strong>Study</strong>The results of the optimized conditions analysis demonstrate that the proposed traffic signaltiming improvements resulted in a significant increase in average speed and decrease in traveltimes throughout the study area. Additionally, all roadways considered under this scenario wereshown to operate at LOS D or better with the exception of Duval Street. The average speedresults for the study roadways are shown on Table 28. Additional measures of effectivenessincluding travel time, corridor delay, and intersection delay for the optimized conditions areincluded in Appendix N. Exhibit 8 depicts the PM peak hour directional LOS for each of thestudy corridors. The modified signal timing used in the Optimized Conditions Analysis isincluded in Appendix O.Calvin, Giordano & Associates Page 77
City of <strong>Key</strong> <strong>West</strong> <strong>Carrying</strong> <strong>Capacity</strong> <strong>Traffic</strong> <strong>Study</strong>Table 28Optimized Conditions Average SpeedRoadwayRoadwayclassExistingConditionsAvg Time(mph)LOSAM PeakOptimized ConditionsAvg Time(mph)LOS %ExistingConditionsAvg Time(mph)LOSMD PeakOptimized ConditionsAvg Time(mph)LOS %ExistingConditionsAvg Time(mph)LOSPM PeakOptimized ConditionsAvg Time(mph)LOS %Duval St EB/SB IV 14.00 C 15.70 C 12.1% 8.20 E 9.17 D 11.8% 6.53 F 7.87 E 20.4%Duval St WB/NB IV 13.50 C 15.17 C 12.3% 7.07 E 8.13 E 15.1% 6.60 F 7.97 E 20.7%Eaton St EB/NB IV 16.30 C 18.63 C 14.3% 13.27 C 14.13 C 6.5% 11.63 D 11.30 D -2.9%Eaton St WB/SB IV 15.07 C 15.33 C 1.8% 13.00 D 13.30 C 2.3% 11.47 D 12.57 D 9.6%Flagler Ave NB/EB III 22.70 C 23.60 C 4.0% 22.67 C 22.60 C -0.3% 21.23 C 21.73 C 2.4%Flagler Ave WB/SB III 22.37 C 22.83 C 2.1% 22.23 C 22.30 C 0.3% 21.73 C 22.30 C 2.6%Fleming St EB/NB IV 13.47 C 13.87 C 3.0% 10.20 D 10.80 D 5.9% 10.03 D 10.53 D 5.0%Palm Ave/1st St EB/SB III 17.50 D 18.73 C 7.0% 14.43 D 17.60 D 21.9% 11.53 E 16.97 D 47.1%Palm Ave/1st St NB/WB III 16.43 D 16.27 D -1.0% 15.90 D 15.50 D -2.5% 16.10 D 15.80 D -1.9%Simonton St EB/SB IV 13.77 C 14.90 C 8.2% 11.33 D 11.57 D 2.1% 10.80 D 10.90 D 0.9%Simonton St NB/WB IV 13.50 C 15.33 C 13.6% 10.10 D 10.20 D 1.0% 9.93 D 10.50 D 5.7%South St NB/EB IV 16.03 C 16.37 C 2.1% 13.43 C 14.17 C 5.5% 13.93 C 14.83 C 6.5%South St SB/WB IV 14.93 C 15.77 C 5.6% 13.83 C 14.43 C 4.3% 14.00 C 14.20 C 1.4%Southard St WB/SB IV 11.87 D 14.10 C 18.8% 11.03 D 12.20 D 10.6% 11.23 D 12.53 D 11.6%Truman Ave NB/EB IV 14.63 C 16.60 C 13.4% 10.77 D 12.07 D 12.1% 10.53 D 13.53 C 28.5%Truman Ave SB/WB IV 13.60 C 15.17 C 11.5% 10.23 D 12.17 D 18.9% 7.60 E 12.23 D 61.0%United St EB/NB IV 16.23 C 16.47 C 1.4% 14.53 C 14.90 C 2.5% 15.17 C 14.87 C -2.0%United St SB/WB IV 16.83 C 17.13 C 1.8% 16.57 C 16.13 C -2.6% 15.40 C 16.00 C 3.9%US-1 NB/EB II 24.03 C 25.07 C 4.3% 21.67 D 22.43 C 3.5% 17.57 D 20.13 D 14.6%US-1 SB/WB II 20.90 D 22.27 C 6.5% 18.00 D 19.33 D 7.4% 18.57 D 18.63 D 0.4%White St NB/WB IV 15.03 C 16.73 C 11.3% 14.30 C 15.87 C 11.0% 14.63 C 15.43 C 5.5%White St SB/EB IV 15.70 C 17.30 C 10.2% 13.37 C 15.07 C 12.7% 15.00 C 15.10 C 0.7%Whitehead St SB/EB IV 14.43 C 15.80 C 9.5% 9.47 D 10.07 D 6.3% 8.37 E 9.93 D 18.7%Whitehead St NB/WB IV 13.93 C 14.97 C 7.4% 9.43 D 10.00 D 6.0% 10.67 D 10.27 D -3.7%AVERAGE 16.12 17.25 7.1% 13.54 14.34 5.9% 12.93 14.01 8.3%Calvin, Giordano & Associates Page 78
Exhibit 8 • Optimized Conditions PM Peak Direction LOSN. Roosevelt BlvdEaton StFleming StSouthard StPalm AveFlagler AveFirst StSimonton StTruman AveWhite StDuval StWhitehead StBertha StUnited StSouth StLegendLOS CLOS DLOS ELOS FLOS based on average speed methodology.<strong>Key</strong> <strong>West</strong> <strong>com</strong>p plan identifies LOS C + 5% for US-1and LOS D for all other roadways.
City of <strong>Key</strong> <strong>West</strong> <strong>Carrying</strong> <strong>Capacity</strong> <strong>Traffic</strong> <strong>Study</strong>Table 29 illustrates that that optimized conditions provide a significant decrease in travel timeand decrease in corridor delay.Table 29Optimized Conditions Travel TimesMeasure ofEffectiveness(MOE)Total Travel TimeTravel Time DelayPeakHourExistingConditions(s)Optimized ConditionsTime (s)% IncreaseAM 6691.4 6255.6 -6.5%MD 8206.5 7689.9 -6.3%PM 8745.7 7899.4 -9.7%AM 1967.7 1509.2 -23.3%MD 3155.2 2606.4 -17.4%PM 3681.7 2850.8 -22.6%Exhibit 9 illustrates a <strong>com</strong>parison of travel times between the existing conditions and optimizedconditions for each of the study corridors during the PM peak hour. Similarly, Exhibit 10 showsa <strong>com</strong>parison of travel time delay between the existing conditions and optimized conditions foreach of the study corridors during the PM peak hour. Figures 4, 5, and 6 depict a <strong>com</strong>parison ofthe existing conditions and optimized conditions for average speed, travel time, and travel timedelay, respectively, for the average of the three peak hours.In addition to the improved corridor travel times, the optimized conditions improve each of theexisting failing signalized intersections identified below to an LOS D or better.MD PeakTruman Avenue at 1 st Street – Southeast approachPM PeakDuval Street at Truman Avenue – Southeast approachWhitehead Street at Southard Street – Northeast approachWhitehead Street at Truman Avenue – Southeast approachSimonton Street at Truman Avenue – Northeast and Southwest approaches, overall intersectionTruman Avenue at 1 st Street – Southeast approachUS-1 at Overseas Highway – Southeast approachCalvin, Giordano & Associates Page 80
Exhibit 9 • Peak Hour Average Travel TimeN. Roosevelt Blvd9.03/(8.39)9.67/(8.04)6.48/(5.99)6.14/(5.98)6.14/(5.98)Whitehead St3.51/(3.41)Simonton StDuval St4.29/(4.08)3.90/(3.49)Eaton StFleming StSouthard St6.14/(4.18)4.57/(4.43)Truman Ave4.36/(4.33)4.58/(4.41)Palm AveWhite StUnited StSouth St6.92/(5.69)First StBertha St7.38/(7.20)Flagler AveLegend<strong>Study</strong>CorridorExisting Conditions X.XX (mins)Optimized Conditions X.XX (mins)*Average travel time reported is the average of both directions.
Exhibit 10 • Peak Hour Average DelayN. Roosevelt Blvd3.35/(2.69)5.34/(4.12)5.34/(4.12)3.07/(2.43)3.07/(2.43)2.63/(2.38)Whitehead St1.85/(1.75)Simonton StDuval St1.79/(1.61)1.95/(1.48)Eaton StFleming StSouthard St3.60/(1.69)1.54/(1.12)Truman Ave1.30/(1.23)1.54/(1.50)Palm AveWhite StUnited StSouth St3.19/(1.97)First StBertha St1.40/(1.35)Flagler AveLegend<strong>Study</strong>CorridorExisting Conditions X.XX (mins)Optimized Conditions X.XX (mins)*Average delay reported is the average of both directions.
City of <strong>Key</strong> <strong>West</strong> <strong>Carrying</strong> <strong>Capacity</strong> <strong>Traffic</strong> <strong>Study</strong>Figure 4 Figure 5Average Speed Comparison Average Travel Time Comparison16.0015.50800078007.6%DecreaseAverage Speed (mph)15.0014.5014.0013.507.1%IncreaseAverage Travel Time (s)7600740072007000680013.006600640012.50620012.00ExistingConditionsOptimizedConditions6000ExistingConditionsOptimizedConditionsCalvin, Giordano & Associates Page 83
City of <strong>Key</strong> <strong>West</strong> <strong>Carrying</strong> <strong>Capacity</strong> <strong>Traffic</strong> <strong>Study</strong>Figure 6AVERAGE TRAVEL DELAY COMPARISON3100290020.9%Decrease2700Average Travel Delay (s)250023002100190017001500ExistingConditionsOptimizedConditionsCalvin, Giordano & Associates Page 84
City of <strong>Key</strong> <strong>West</strong> <strong>Carrying</strong> <strong>Capacity</strong> <strong>Traffic</strong> <strong>Study</strong>5.3 Duval Street ScenariosAt the request of the City, additional alternate scenarios were considered for Duval Street todetermine the operational effects. The following scenarios were considered and modeled in theVISSIM traffic simulation network:1. No parking on Duval Street.2. Closure of Duval Street to vehicular traffic during the afternoon and evening hours.3. Closure of only a portion of Duval Street to vehicular traffic during evening hours.4. Reconfiguring Duval Street and Whitehead Street into one-way only roadways..No Parking on Duval StreetThe existing conditions roadway network was evaluated with the removal of parking on DuvalStreet to determine the operational effects. The results of the analysis showed that eliminatingparking on Duval Street would only result in minor improvements for the roadway and wouldnot improve the LOS.While it is likely that on-street parking on Duval Street does have a negative impact on thecorridor, it is not the primary reason for the heavy congestion. The two primary factorscontributing to the congestion are the number of fixed timing signalized intersections and thehigh number of pedestrians. Additional contributing factors include the variety of multi-modalvehicles, unfamiliar drivers, and the high volume of vehicular traffic. The <strong>com</strong>bination of thesefactors results in the slow travel time along Duval Street.Duval Street ClosureThe existing conditions roadway network was modified so that only pedestrians could utilizeDuval Street. The current vehicle traffic on Duval Street was re-distributed to Simonton Streetand Whitehead Street to determine the operational effects.The results of the analysis demonstrated that a significant degradation to traffic operations wouldoccur on Simonton Street and Whitehead Street with the removal of vehicular traffic on DuvalStreet. The additional vehicles re-routed to Simonton Street and Whitehead Street would createan unstable traffic flow that would increase travel times and delay significantly.Partial Duval Street ClosureThe existing conditions roadway network was modified to replicate a partial closure of DuvalStreet between the 500-600 block during the PM peak hour. As part of this study, turningmovement counts were collected during the AM, MD, and PM peak hours. The PM peak hourfor Duval Street fell between 4-5PM. The partial closure of Duval Street caused a significantamount of congestion in the immediate surrounding areas on Simonton Street and WhiteheadStreet. However, no turning movement counts were collected as part of this study after 6PM.Therefore, at later evening hours, it is possible that traffic volumes would have decreased enoughCalvin, Giordano & Associates Page 85
City of <strong>Key</strong> <strong>West</strong> <strong>Carrying</strong> <strong>Capacity</strong> <strong>Traffic</strong> <strong>Study</strong>that the partial road closure would have a less significant impact on the surrounding roadwaynetwork.Reconfiguring Duval Street and Whitehead Street from two-way roadways to one-way onlyroadwaysThe existing conditions roadway network was modified so that Duval Street would only allowfor northbound one-way traffic while Whitehead Street would only allow for southbound onewaytraffic. The typical section of Duval Street and Whitehead Street was also modified so thatthe roadway would be 11 feet wide with a 5’ foot bike lane. No additional roadwaymodifications were made.The results of the analysis demonstrated that conditions on Whitehead Street and Duval Streetwould deteriorate resulting in an increase in travel times.Calvin, Giordano & Associates Page 86
City of <strong>Key</strong> <strong>West</strong> <strong>Carrying</strong> <strong>Capacity</strong> <strong>Traffic</strong> <strong>Study</strong>6.0 CONCLUSIONSThe purpose of the <strong>Carrying</strong> <strong>Capacity</strong> <strong>Traffic</strong> <strong>Study</strong> was to assess the capacity of City streets andrelated transportation infrastructure. The <strong>Study</strong> was also to address specialized vehicles and theirimpacts to roadways and adjacent land uses including impacts associated with mobility, noise,and air quality.In order to accurately evaluate the transportation infrastructure, an extensive amount of datacollection was undertaken for this study. The following items were evaluated as part of the datacollection process:Turning Movement Counts24 Hour Bi-Directional Tube CountsSpeed CountsVehicle Classification CountsTravel Time RunsMulti-Modal Vehicle AttributesRoadway CharacteristicsSpeed Limit InventoryParking InventoryCruise Ship DataBike Lane InventorySound Level InventoryExisting Conditions Analysis MethodologyVISSIM traffic micro-simulation software was chosen for the project due to the uniquecharacteristics of the City such as the prevalence of multi-modal vehicles and pedestrians. TheCity transportation network was evaluated using four different methodologies:1. FDOT Generalized Tables. The first methodology consisted of <strong>com</strong>paring peak hourtraffic volumes to the FDOT Quality/Level of Service tables. This generalized planninganalysis is limited and is considered an estimate of capacity.2. Volume to <strong>Capacity</strong> Ratio. This methodology determined the v/c ratios on each of thestudy corridors based on the critical intersection. The v/c ratios in this analysis areconsidered more detailed and accurate than the FDOT v/c ratios.3. HCM Average Speed. The procedure identified in the City Comprehensive Plan and theHCM both require the LOS to be determined based on the average speed methodology.This procedure was <strong>com</strong>pleted by actual time travel runs and through a micro-simulationtraffic analysis. The results for this methodology were used for the final determination ofLOS as it reflects the most accurate possible evaluation.Calvin, Giordano & Associates Page 87
City of <strong>Key</strong> <strong>West</strong> <strong>Carrying</strong> <strong>Capacity</strong> <strong>Traffic</strong> <strong>Study</strong>4. VISSIM Micro-simulation. The final methodology used in this traffic study was toevaluate the traffic operations of the study intersections. The Level of Service thresholdswere determined based on delay thresholds identified in the HCM. VISSIM microsimulationsoftware was utilized to determine the approach and intersection delay.The hierarchy of <strong>com</strong>plexity and accuracy for each of the four methodologies utilized isillustrated in Figure A below.Figure AHierarchy of <strong>Traffic</strong> Evaluation ToolsExisting Conditions Analysis ResultsThe results of the existing conditions analysis demonstrated that there are several roadwaycorridors and intersections within the City that are over capacity or operating at a Level ofService that is not within defined acceptable standards, as illustrated on Table A below. It cantherefore be concluded that the overall transportation network will not support additional trafficunless capacity improvements are implemented. The effects of new trip generators on the overallroadway network will be dependent, in part, on the location of the development/operation, tripdistribution/tour route, individual vehicle attributes, and the size of development/operation.Calvin, Giordano & Associates Page 88
City of <strong>Key</strong> <strong>West</strong> <strong>Carrying</strong> <strong>Capacity</strong> <strong>Traffic</strong> <strong>Study</strong>Table AExisting Conditions DeficienciesMETHODOLOGYFDOT Generalized LOS TablesVolume/<strong>Capacity</strong> RatioHighway <strong>Capacity</strong> Manual (HCM)METHODOLOGYVISSIM Micro-SimulationOVER CAPACITY CORRIDORSDuval StreetEaton StreetPalm AvenueN. Roosevelt BoulevardTruman AvenueDuval StreetN. Roosevelt BoulevardTruman AvenueWhitehead StreetDuval StreetWhitehead StreetTruman AvenueN. Roosevelt BoulevardPalm Avenue/1st Street/Bertha StreetOVER CAPACITY INTERSECTIONSWhitehead Street/Southard StreetWhitehead Street/Truman AvenueDuval Street/Truman AvenueSimonton Street/Truman AvenuePalm Avenue (1st Street)/N. Roosevelt BoulevardOptimized Conditions AnalysisSince the existing roadway infrastructure within the City is generally not conducive to traditionalcapacity improvements, such as roadway widening, focus was shifted to operationalimprovements such as traffic signal modifications. Improvements to existing traffic signaltiming were shown to significantly improve corridor and intersection operations,potentially generating additional roadway capacity.In addition to the signal timing improvements, one roadway infrastructure improvement wasconsidered. It would be relatively cost-effective to extend the length of the exclusive left turnlane on Palm Avenue at N. Roosevelt Boulevard by approximately 200 feet. This roadwaymodification would significantly improve traffic operations at the intersection and throughout thecorridor.The optimized conditions scenario (signal timing improvements, one infrastructureimprovement) resulted in a significant improvement in the overall roadway network operations.Each of the study corridors where shown to experience shorter vehicular travel times and delays.Truman Avenue, Whitehead Street, and Palm Avenue/1 st Street were improved from Level ofService E to Level of Service D during the PM peak hour. Duval Street improved from LOS F toCalvin, Giordano & Associates Page 89
City of <strong>Key</strong> <strong>West</strong> <strong>Carrying</strong> <strong>Capacity</strong> <strong>Traffic</strong> <strong>Study</strong>LOS E during the PM peak hour. Each of the study intersections that had an LOS E or LOS Fapproach improved to LOS D or better in the optimized conditions scenario.The improvements identified in this study will likely provide additional capacity on the overallroadway network within the study area. However, Duval Street and US-1 will likely continue tooperate below the established LOS identified in the City Comprehensive Plan, even withproposed operational improvements.Should the City elect to implement the proposed improvements, it is likely traffic operations onthe overall roadway network within the study area will improve, resulting in additional roadwaycapacity. If additional roadway capacity is generated, it is re<strong>com</strong>mended that the City monitorthe availability of the excess capacity through a Concurrency Management System. This systemis simply a means for the City to “keep track” of the available roadway capacity as new trafficgenerators, such as additional franchise agreements or new land development projects, areapproved. It is re<strong>com</strong>mended that the City follow similar concurrency management systempractices throughout Florida and require new applicants provide a <strong>com</strong>prehensive traffic studydetailing the ramifications of their respective proposals. Applicants can either demonstrate thattheir proposed development or operation will not result in traffic volumes that exceed theavailable capacity, or if proposed franchise agreements or land development projects will resultin traffic volumes that exceed available capacity, the City can then require the applicant mitigatethe resulting traffic congestions through appropriate infrastructure or operational improvements.Calvin, Giordano & Associates Page 90
City of <strong>Key</strong> <strong>West</strong> <strong>Carrying</strong> <strong>Capacity</strong> <strong>Traffic</strong> <strong>Study</strong>7.0 RECOMMENDATIONS1. Plan for and Implement a City-Wide Signal Timing Program to Address Over-<strong>Capacity</strong>Roadway Congestion.Several primary roadway corridors and intersections within the City operate below theacceptable Level of Service thresholds established in the City Comprehensive Plan. The resultsof this study illustrated that improvements to the traffic signal operations can have a significantbenefit to traffic operations on the overall City roadway network.Most of the signalized intersections in Old Town operate on fixed signal timing which means thegreen time allotted to each particular traffic movement does not vary as the traffic demandschange. It is beneficial to operate traffic signals with actuation rather than fixed timing.Actuation simply means that as the traffic demands increase for a given traffic movement (suchas northbound left-turns, or east bound through movements, etc.), more green time is allocated tothe higher demand movement. This is ac<strong>com</strong>plished through the use of traffic detectors whichidentify fluctuations in traffic demand. The conversion of a fixed signal timing intersection to anactuated signal timing intersection will require vehicle detection equipment. Common vehicledetectors include in-ground loop detectors, microwave detectors, and video detectors. Actuatedsignals would minimize wasted green time and improve the efficiency of individual intersectionsand overall corridors. To realize the most benefit with the least initial cost, it is re<strong>com</strong>mendedthe City implement the following prioritization for signal timing improvements:4. Optimize signal timing at intersections already equipped with vehicle detector equipment.5. Install vehicle detector equipment and optimize signal timing at intersections capable ofac<strong>com</strong>modating the installation of vehicle detector equipment.6. Modify traffic signal equipment, install vehicle detector equipment and optimize signaltiming at intersections currently without detection capabilities.The signalized intersections phasing plan as well as the existing and optimized signal timingplans are included in Appendix P. ***It should be noted that fine-tuning of the proposed signaltiming plans will be required in the field. This should be supervised by an experiencedprofessional traffic engineer.Signal timing progression along the corridors could also increase the efficiency of the roadwaynetwork. Progression involves timing traffic signals along a particular corridor in such a way thatgroups of vehicles can travel through several intersections without stopping. Signal timingprogression is <strong>com</strong>monly implemented by installing underground fiber-optic cables to connectseveral traffic signals along a corridor. The traffic signals are then able to “<strong>com</strong>municate” witheach other and respond to traffic demand. Implementing signal timing progression would requirea substantial infrastructure investment and therefore may not be immediately feasible.Calvin, Giordano & Associates Page 91
City of <strong>Key</strong> <strong>West</strong> <strong>Carrying</strong> <strong>Capacity</strong> <strong>Traffic</strong> <strong>Study</strong>2. Establish and Implement a Transportation Concurrency Management System toAddress New Franchise Agreements and Land Development Projects.This study documented that several roadway corridors and intersections are operating belowacceptable LOS thresholds established in the City’s Comprehensive Plan. It is thereforereasonable to conclude that the addition of any new traffic generators without substantialcapacity improvements would only exacerbate traffic congestion. The signal timingimprovements proposed in this study were shown to likely result in improved traffic operationsand additional roadway capacity. In the event additional roadway capacity is generated, it isre<strong>com</strong>mended the City monitor the availability of the excess capacity through a TransportationConcurrency Management System.Concurrency Management Systems stem from Florida Statues relating to growth managementwhich require that facilities needed to support new development, such as roadways, are in place“concurrent” with the new development. In this instance, new trip generators, such as franchiseagreements or land development projects, would need to demonstrate that roadway capacity isavailable to support the proposed franchise agreement or project.Applicants for new franchise agreements or land development projects can utilize the VISSIMtraffic model provided in this study to demonstrate the effects of their respective projects on theoverall roadway network. It is re<strong>com</strong>mended that these traffic impacts be considered on a casespecificbasis for several reasons: Franchise vehicle characteristics that effect roadway capacity can vary greatly. Individualapplicants can provide the City with specific vehicle attributes at the time of application. Proposed tour routes or areas of utilization can vary greatly. Individual applicants canprovide the City specific information as to their proposed routes.The City should require all applicants for franchise agreements or land development projectssubmit a traffic study demonstrating the effects of the proposed application on the overallroadway network. Applicants who are able to demonstrate that their particular traffic applicationwill not exceed available roadway network capacity could then be considered for approval. Forapplicants that are unable to demonstrate an ability to work within available roadway capacitylimits, the City may elect to request that the applicant contribute to a predetermined congestionmanagement project, at the discretion of the City. This type of concurrency managementrequirement is <strong>com</strong>monplace throughout the State of Florida.3. Utilize VISSIM Software for Future <strong>Traffic</strong> Analysis.VISSIM micro-simulation traffic software was chosen for this study in order to accuratelyanalyze the wide variety of multi-modal vehicles in the City. Many popular traffic softwarepackages such as Synchro and HCS are limited with regard to the types of vehicles that can beevaluated. As part of this study, a highly calibrated VISSIM model was constructed and will beCalvin, Giordano & Associates Page 92
City of <strong>Key</strong> <strong>West</strong> <strong>Carrying</strong> <strong>Capacity</strong> <strong>Traffic</strong> <strong>Study</strong>provided to City Staff for use at their discretion. The existing conditions VISSIM modelen<strong>com</strong>passes over 50 intersections and 15 corridors.As improvements are made to the signal timing, the VISSIM model can be quickly updated toaccount for future modifications. The VISSIM model can be updated for infinite future trafficconditions and scenarios such as:Proposed franchise vehicle operations.Proposed land development projects.Proposed modifications to intersection and roadway operations such as one-way streets.Future construction projects and associated detours.New bicycle/pedestrian facilities.New bus routes.Signal timing changes.CGA will provide City Staff with a day of training on how to use the software. It is, however,re<strong>com</strong>mended that a professional traffic engineer be consulted for any major modifications oranalysis.4. Monitor <strong>Traffic</strong> Counts on an Annual Basis.It is not expected that the traffic patterns will greatly change in the short term but traffic patternsare not stagnant over time. The FDOT has 23 count stations in the City that are updated on anannual basis. These counts should be reviewed as they are a good indicator of any increase ordecrease of traffic volumes over a several year time frame. In addition to the bi-directionalroadway counts collected by the FDOT, turning movement counts should also be periodicallyupdated. Travel patterns can change for a number of reasons, the most <strong>com</strong>mon being newdevelopment and infrastructure improvements. Whenever traffic patterns change, it will bebeneficial to modify and optimize signal timing.5. Lengthen the Existing Southeast Bound Left Turn on Palm Avenue at N. RooseveltBoulevard.The southeast bound approach at the intersection of Palm Avenue and N. Roosevelt Boulevard(left-turn movement from Palm Avenue onto N. Roosevelt Blvd) is operating at LOS E duringthe Mid Day and PM peak hours. The analysis demonstrated that excessive vehicle queuingoccurs at this approach due to the high volume of left-turning traffic (590 vehicles during the PMpeak hour). This excessive queuing not only causes delay for the left-turn movement, butexacerbates the overall delay at the intersection. The existing left turn lane length ofapproximately 170 feet should be extended by at least 200 feet to ac<strong>com</strong>modate the vehiclequeue. This will greatly improve the overall operation of the intersection. A cursory review ofthe lane geometry indicated that adequate right-of-way is likely available to ac<strong>com</strong>modate theproposed lane extension.Calvin, Giordano & Associates Page 93
City of <strong>Key</strong> <strong>West</strong> <strong>Carrying</strong> <strong>Capacity</strong> <strong>Traffic</strong> <strong>Study</strong>6. Plan and Implement a Sign Inventory and Improvement Program.The data collected as part of this study indicate that over the past five years, more than 25% ofthe parking violations occurred from unauthorized parking in a designated parking space or in ano parking zone. Since the City is host to a high volume of tourists who may be unfamiliar withlocal regulations, it may be beneficial to work to improve signage associated with local parkingrestrictions and regulations.Other deficiencies in the City’s traffic signage were also observed such as signage that is non<strong>com</strong>pliantwith the Manual of Uniform <strong>Traffic</strong> Control Devices (MUTCD). Ensuring that allroadway signage within the City is <strong>com</strong>pliant with current MUTCD standards will likelyimprove driving conditions for motorists and ultimately improve roadway capacity.7. Plan for and Construct Additional Off-Street Parking Facilities.<strong>Key</strong> <strong>West</strong> residents who participated in surveys associated with this study were strongly in favorof adding more off-street parking facilities. On-street parking facilities can contribute to roadwaycongestion as drivers search for and maneuver within available parking spaces. The addition ofoff-street parking facilities may reduce some roadway congestion by providing an alternative toon-street parking facilities.8. Consider Installing Shared Lane Markings for Bicycles in Accordance with NewlyAdopted MUTCD Standards.Bicycles accounted for approximately 8.3% of the overall traffic volumes collected as part of thisstudy and it is evident that bicycles are a popular mode of transportation for both residents andtourists. Although there are few opportunities for new dedicated bike lanes within the City due toexisting right-of-way limitations, alternative traffic signage and pavement markings couldgreatly improve the bicycling experience throughout the City. The 2009 Manual of Uniform<strong>Traffic</strong> Control Devices (MUTCD) allows for a shared lane marking to be used to:6. Assist bicyclists with lateral positioning in a shared lane with on-street parallel parking inorder to reduce the chance of a bicyclist’s impacting the open door of a parked vehicle,7. Assist bicyclists with lateral positioning in lanes that are too narrow for a motor vehicleand a bicycle to travel side by side within the same traffic lane,8. Alert road users of the lateral location bicyclists are likely to occupy within the traveledway,9. Encourage safe passing of bicyclists by motorists, and10. Reduce the incidence of wrong-way bicycling.If new bicycle routes are established on roadways without dedicated bike lanes, shared lanemarkings along with the applicable traffic signage (R4-11: “May Use Full Lane” and W16-1P:Calvin, Giordano & Associates Page 94
City of <strong>Key</strong> <strong>West</strong> <strong>Carrying</strong> <strong>Capacity</strong> <strong>Traffic</strong> <strong>Study</strong>“Share the Road”) should be considered. Related excerpts from the 2009 MUTCD identifyingthe proposed shared lane markings are included in Appendix Q.9. Complete All-Way Stop Warrant Analysis Prior to the Conversion of Two-Way StopControl (TWSC) Intersections to All-Way Stop Control (AWSC).The City receives numerous requests for additional stop control at intersections for variousreasons. The State of Florida has adopted standards set forth in the 2009 Manual on Uniform<strong>Traffic</strong> Control Devices (MUTCD) to address traffic control modifications, includingconversions of stop-controlled intersections. It is important that standards set forth in theMUTCD are followed when considering traffic operational changes.Calvin, Giordano & Associates Page 95