OptiMelt Automated Melting Point System - Stanford Research ...
OptiMelt Automated Melting Point System - Stanford Research ...
OptiMelt Automated Melting Point System - Stanford Research ...

You also want an ePaper? Increase the reach of your titles
YUMPU automatically turns print PDFs into web optimized ePapers that Google loves.
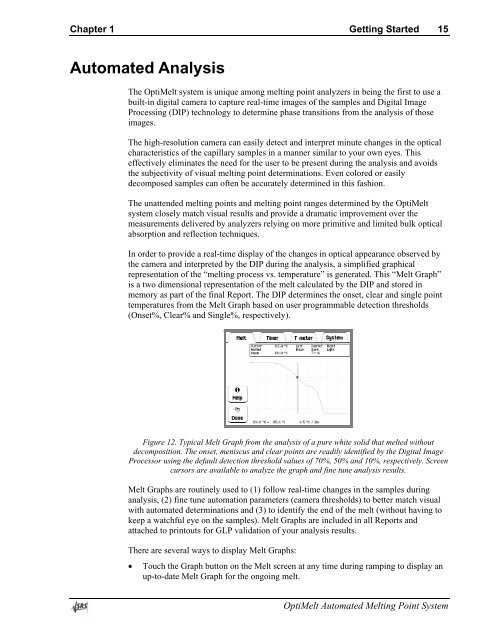
Chapter 1 Getting Started 15<strong>Automated</strong> AnalysisThe <strong>OptiMelt</strong> system is unique among melting point analyzers in being the first to use abuilt-in digital camera to capture real-time images of the samples and Digital ImageProcessing (DIP) technology to determine phase transitions from the analysis of thoseimages.The high-resolution camera can easily detect and interpret minute changes in the opticalcharacteristics of the capillary samples in a manner similar to your own eyes. Thiseffectively eliminates the need for the user to be present during the analysis and avoidsthe subjectivity of visual melting point determinations. Even colored or easilydecomposed samples can often be accurately determined in this fashion.The unattended melting points and melting point ranges determined by the <strong>OptiMelt</strong>system closely match visual results and provide a dramatic improvement over themeasurements delivered by analyzers relying on more primitive and limited bulk opticalabsorption and reflection techniques.In order to provide a real-time display of the changes in optical appearance observed bythe camera and interpreted by the DIP during the analysis, a simplified graphicalrepresentation of the “melting process vs. temperature” is generated. This “Melt Graph”is a two dimensional representation of the melt calculated by the DIP and stored inmemory as part of the final Report. The DIP determines the onset, clear and single pointtemperatures from the Melt Graph based on user programmable detection thresholds(Onset%, Clear% and Single%, respectively).Figure 12. Typical Melt Graph from the analysis of a pure white solid that melted withoutdecomposition. The onset, meniscus and clear points are readily identified by the Digital ImageProcessor using the default detection threshold values of 70%, 50% and 10%, respectively. Screencursors are available to analyze the graph and fine tune analysis results.Melt Graphs are routinely used to (1) follow real-time changes in the samples duringanalysis, (2) fine tune automation parameters (camera thresholds) to better match visualwith automated determinations and (3) to identify the end of the melt (without having tokeep a watchful eye on the samples). Melt Graphs are included in all Reports andattached to printouts for GLP validation of your analysis results.There are several ways to display Melt Graphs:• Touch the Graph button on the Melt screen at any time during ramping to display anup-to-date Melt Graph for the ongoing melt.<strong>OptiMelt</strong> <strong>Automated</strong> <strong>Melting</strong> <strong>Point</strong> <strong>System</strong>