You also want an ePaper? Increase the reach of your titles
YUMPU automatically turns print PDFs into web optimized ePapers that Google loves.
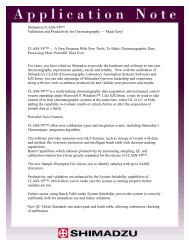
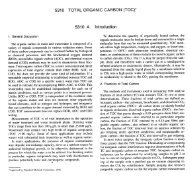
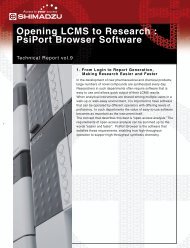
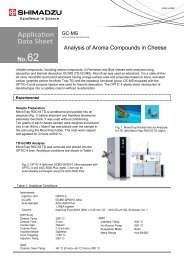
LAAN-A-LM-E042<strong>Application</strong> <strong>News</strong>Liquid Chromatography Mass SpectrometryNo.C71Analysis of Polymer Additives Using LCMS-2020Polymer materials such as plastic and rubber havebecome indispensable in our daily lives. Additivessuch as antioxidants and ultraviolet absorbers areadded in minute quantities to polymers to affectspecific properties. Conducting qualitative and/orquantitative analysis of the additives in these polymersmakes it possible to obtain information pertaining tomixing technology and new additives.Here we present an example of qualitative analysis ofseveral types of polymer additives included incommercial food containers and packaging materialsusing the LCMS-2020.■ In-Source CID Analysis of Polymer Additives using the LCMS-2020Typically, structural analysis is conducted using an and Fig. 2 and Fig. 3 show the in-source CID massMS/MS instrument, but due to the high voltage that spectra for Irganox 245 and Irganox 1010, respectively.can be applied to the lens system of the single The molecular structures were obtained using thequadrupole LCMS-2020, this instrument can be used deprotonated molecule observable using the ESInot only to obtain molecular weight information, but negative mode, and -100 to -150 V applied to DL andmolecular structure information as well. Fig. 1 shows Q-array DC.the chromatograms of 14 polymer additive substances,2.50.03.002.752.50(×100)PDA CH1 (210nm)4.0 5.0 6.0 7.0 8.0 9.0 10.0 11.0 min(×10,000,000)3.25(a)NormalInten.(×1,000,000)1.0H 3CHOH 3C CH 3 CH3OOOOOOH 3CCH 3CH3C34H50O80.5m/z 367Exact Mass: 586.35m/z 409Mol.Wt.:586.76 551.40.0100 200 300 400 500 600 m/z(b)DL, Q-array DC : -100 VInten.(×10,000)4.03.02.01.00.0OHCH 3[M-H] -585.3333.1 551.4409.3367.2291.2115.1 585.3276.1 495.3 648.4100 200 300 400 500 600 m/z2.252.00ESI(+) TICFig. 2 Mass Spectra of Irganox 245ESI(-) TIC1.75TinuvinP(-):224.05(78.19)Irganox2451.50IrganoxMD1024(-):585.30(2.80)(-):551.35(6.61)1.25Irganox1098(-):635.45(2.52)Cyanox2246(-):339.15(1.29)1.00Cyanox425(-):367.25(1.58)Irganox1035(-):641.35(3.40)0.75Tinuvin120(-):437.25(1.48)Tinuvin328(-):350.25(25.19)0.50Irganox1010(-):1175.70(72.88)Irganox1330(-):773.55(33.41)0.25Irgafos168 oxide(-):661.40(100.00)Irganox565(-):587.35(26.49)0.00Irganox1076(-):529.45(100.00)4.0 5.0 6.0 7.0 8.0 9.0 10.0 11.0 minFig. 1 Chromatograms of 14 Polymer Additives(a)NormalInten.(×10,000)5.02.550.8H 3CH 3CHOH 3CH 3C CH 3H 3CH 3CH 3CCH 3HOOH3COOOCH 3CH 3H 3COH 3COOCH 3O[M-H] -1175.71211.70.0250 500 750 1000 1250 m/z-A(b)DL, Q-array DC : -150 V-2×AInten.(×10,000)1.00739.5 957.60.75521.30.501176.80.25607.4277.1655.50.00250 500 750 1000 1250 m/zFig. 3 Mass Spectra of Irganox 1010AOHH 3CH 3CCH 3CH 3CH3CH 3CH3CH 3OHCH 3-3×AC73H108O12Exact Mass: 1176.78Mol.Wt.:1177.63
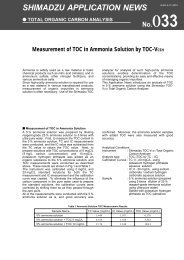
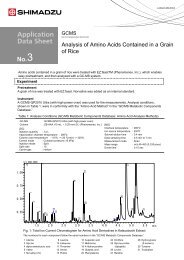
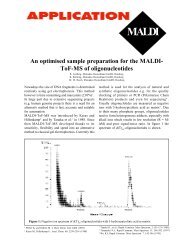
No.C71■ Analysis of Unknown Polymer Additives Using LCMS-2020After cutting a plastic food container into very finepieces, 1 mL of THF/MeOH was added to 0.1 g of thecontainer material and placed in an ultrasonic bath for30 minutes. The extract obtained was used as thesample. Fig. 4 shows the chromatograms obtained frommeasurement of the extract, and peaks determined tobe Cyanox 425, Irganox 1010, and Irgafos 168oxide based on their retention times and m/z valueswere detected. Peak at retention time 8 minutesshows the same CID mass spectrum as that of Fig. 3,and was therefore identified as Irganox 1010.Fig. 5 shows the CID mass spectra of Irgafos 168 oxideand Fig. 6 shows the CID mass spectra of peak atretention time 9.4 minutes. The deprotonated molecularion [M-H] - at m/z 661could not be observed in Fig. 6 (C)due to contaminant interference. However, peak wasultimately able to be identified as Irgafos 168 oxidebecause it has the same CID mass spectrum as thestandard, demonstrating the usefulness of CIDanalysis.7.06.05.0(×1,000,000)4.0ESI(+):TIC123.0ESI(-):TIC2.0(-):367.25(100.00)1.03(-):1175.70(100.00)0.0(-):473.25(100.00)4.0 5.0 6.0 7.0 8.0 9.0 10.0 11.0 minFig. 4 Mass Chromatograms of THF/Methanol Extract of PlasticFood Container(a)ESI-positive NormalInten.(×100,000)5.0[M+H] +663.5C42H63O4PExact Mass: 662.45O704.5Mol.Wt.:662.92O P O2.5O763.51342.8607.40.0250 500 750 1000 1250 m/z(b) ESI-positive DL, Q-array DC : +150 VInten.(×100,000)495.31.0551.40.5439.2663.50.0250 500 750 1000 1250 m/z(c) ESI-negative NormalInten.(×100,000)2.0 473.31.0[M-H] -661.4283.1 947.50.0250 500 750 1000 1250 m/z(d) ESI-negative DL, Q-array DC : -100 VInten.(×100,000)1.00.50.0OO POO267.1473.3457.3661.4250 500 750 1000 1250 m/zFig. 5 Mass Spectra of Irgafos 168 Oxide(a)ESI-positive NormalInten.(×100,000)1.0[M+H] +663.5704.50.5763.51343.0607.40.0250 500 750 1000 1250 m/z(b) ESI-positive DL, Q-array DC : +150 VInten.(×10,000)1.5495.31.0551.4439.20.5307.1 1050.5147.2 663.4 851.30.0250 500 750 1000 1250 m/z(c) ESI-negative NormalInten.(×10,000)54.01.00.50.0(d) ESI-negative DL, Q-array DC : -100 VInten.(×1,000)[M-H] -1.0 473.1 661.30.50.090.3250 500 750 1000 1250 m/zOO POO388.9473.3829.61094.8250 500 750 1000 1250 m/zFig. 6 Mass Spectra of Peak 1462.0Table 1 Analytical ConditionsColumn: Shim-pack XR-ODS (75 mmL. × 2.0 mmI.D., 2.2 μm)Mobile Phase A : 5 mmol/L ammonium acetate-waterMobile Phase B : acetonitrileGradient Program : 25 %B (0 min) - 100 %B (5-15 min) - 25 %B (15.01 - 20 min)Flow Rate: 0.5 mL/minInjection Volume : 2 μLColumn Temperature : 40 ˚CProbe Voltage: +4.5 kV (ESI-Positive mode),-3.5 kV (ESI-Negative mode)Nebulizing Gas Flow : 1.5 L/minDrying Gas Flow : 10 L/minDL Temperature : 250 ˚CBlock Heater Temperature : 450 ˚CSHIMADZU CORPORATION. International Marketing Division3. Kanda-Nishikicho 1-chome, Chiyoda-ku, Tokyo 101-8448, Japan Phone: 81(3)3219-5641 Fax. 81(3)3219-5710Cable Add.:SHIMADZU TOKYOPrinted in Japan 3295-06007-10A-IK