Ocean Optics USB4000 UV-VIS Spectrometer Ocean Optics Red ...
Ocean Optics USB4000 UV-VIS Spectrometer Ocean Optics Red ...
Ocean Optics USB4000 UV-VIS Spectrometer Ocean Optics Red ...

You also want an ePaper? Increase the reach of your titles
YUMPU automatically turns print PDFs into web optimized ePapers that Google loves.
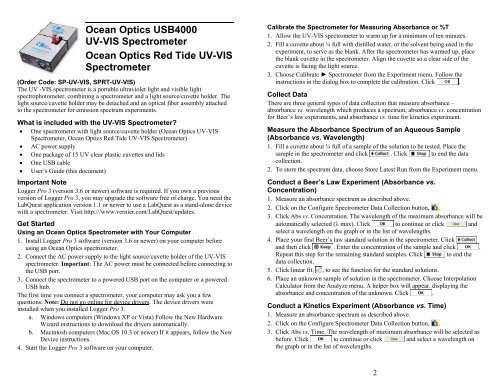
4. The default settings are 1 sample per second for 200 seconds. To change the datacollectionparameters for your experiment, choose Data Collection from theExperiment menu and make the necessary changes. Click .5. Mix the reactants. Transfer ~2 mL of the reaction mixture to a cuvette and placethe cuvette in the spectrometer. Click . Click if you wish to endthe data collection early.6. Click Curve Fit, , to calculate a function for your data.Using the <strong>Spectrometer</strong> to Measure Emission SpectraYou may use your spectrometer to measure the emission spectrum of a light sourcesuch as an LED or a gas discharge tube. To do so, you may want to purchase anoptical fiber assembly (order codes: <strong>UV</strong>-<strong>VIS</strong>).Measure an Emission Spectrum1. Use a small screwdriver to loosen the two screws that connect the cuvette holderto the spectrometer (see Figure 1). Remove the cuvette holder and connect anoptical fiber assembly to the spectrometer.Figure 12. Use a USB cable to connect the spectrometer to your computer.3. Start Logger Pro 3.4. Choose Change Units ► <strong>Spectrometer</strong> ► Intensity from the Experiment menu.Intensity is a relative measure. The spectrometer is not calibrated for measuringintensity.5. Aim the tip of the optical fiber cable at a light source. Click . Clickto end the data collection.If the spectrum maxes out (flat and wide peaks), increase the distance between thelight source and the tip of the optical fiber cable or reduce the sample time. To adjustthe data collection parameters, choose Set Up Sensors ► <strong>Spectrometer</strong> from theExperiment menu. Set the Sample Time to a suitable value and decrease the Samplesto Average to 1.Using the Stored Emissions Files in Logger Pro 3Logger Pro 3 contains a folder of emissions graphs from selected discharge tubes,including: argon, helium, hydrogen, mercury, oxygen, sodium, and xenon. You candisplay and analyze these graphs without a spectrometer connected to yourcomputer. Follow the steps below to view one of these graphs.1. Choose Open from the File menu.2. Open the Sample Data folder.3. In the Sample Data folder, open the Physics folder.4. In the Physics folder, open Gas Discharge Spectra. Open the desired file.Changing the Settings in Logger Pro 3<strong>Spectrometer</strong> Dialog BoxThe <strong>Spectrometer</strong> dialog box lists all the settings for the device. To display this boxchoose Set Up Sensors ► Show All Interfaces from the Experiment menu.For most experiments, the default settings work well.There are four parameters listed in the dialog box.• Sample Time: think shutter speed of a camera. Logger Pro 3 automaticallyselects the proper sample time during calibration. Note: For emission studies,you may need to change the sample time manually.• Wavelength Smoothing: the number of adjacent readings on either side of agiven value that is used to calculate an average value.• Samples to Average: the number of readings taken at a given wavelength tocalculate an average reading.• Wavelength Range: the range is determined by the type of spectrometer in use.By clicking on the picture of the spectrometer in this dialog box, you will gainaccess to four options: calibrate, configure data collection, go to support web page,and units of measure. Click on an item to select it.Configure <strong>Spectrometer</strong> Data Collection Dialog BoxTo display this box, click on the Configure Data Collection button, .There are three regions in this box and four buttons at the bottom.• Graph: The graph displays a full spectrum analysis of your sample. By default,the wavelength of greatest absorbance (λ max) will be marked with a box. Youmay select other wavelengths by clicking on the plot at the desired wavelength.• Set Collection Mode: Three options for data collection are offered.• Full Spectrum/Select Wavelength: This column of the available wavelengthsbecomes active when you select Abs vs. Concentration or Abs vs. Time. Checkthe box for each wavelength you wish to use in an experiment. When you selecta wavelength from the list, a box appears on the graph.• Use the button to remove all of the wavelengths selected on the graph.Determining the Wavelength(s) to Use in an ExperimentWhen you conduct a Beer’s law lab or a kinetics lab, it is common to select onewavelength at which to follow the experiment. However, in Logger Pro 3 you mayselect as many wavelengths as you wish. There are two ways to select thewavelength or wavelengths.34
1. Perform a Full Spectrum Analysis of the Solution to Be TestedMeasure the full spectrum of a sample of solution and then click ConfigureSpectrum Data Collection ( ). Select Abs vs. Concentration or Abs vs. Time.The wavelength of maximum absorbance (λ max) will be automatically selected.2. Use a Sample of Solution to Determine the Peak AbsorbanceThis is a variation of the previous method. After calibrating the <strong>Spectrometer</strong>,place a sample of solution in the <strong>Spectrometer</strong> and then click Configure SpectrumData Collection ( ). Select Abs vs. Time or Abs vs. Concentration. Thewavelength of maximum absorbance (λ max) will be automatically selected. Ifyou don’t want to use the λ max, click and select a wavelength on thegraph or in the list of wavelengths.Selecting a Range of Wavelengths to Use in an ExperimentYou may wish to measure the absorbance or %T of a sample over a group ofwavelengths rather than a single wavelength. There are two ways to select a group ofwavelengths from the Configure Spectrum Data Collection dialog box.• Select the wavelengths one at a time by checking the boxes in the SelectWavelength column.• Left click on the graph and drag your cursor across the region of wavelengthsto analyze. Check the “Treat Contiguous Wavelengths as a Single Range” box.MeasurementYou can set up the spectrometer to measure intensity, absorbance, or% transmittance. Choose Change Units ► <strong>Spectrometer</strong> from the Experiment menu.Click on the unit of choice from the list.Using an <strong>Ocean</strong> <strong>Optics</strong> <strong>Spectrometer</strong> with a LabQuest1. Connect the AC power supply to the spectrometer.2. Use the USB cable to connect the spectrometer to a LabQuest. Allow thespectrometer to warm up for fifteen minutes.3. Turn on the LabQuest. The LabQuest app will launch automatically and the meterscreen will be displayed.Calibrate the <strong>Spectrometer</strong>1. Fill a cuvette about ¾ full with distilled water and place it in the spectrometer.Align the cuvette so a clear side of the cuvette is facing the light source.2. Choose Calibrate ► USB:<strong>Spectrometer</strong> from the Sensors menu. At the prompt,select Finish Calibration. After the message “Calibration Completed” appears,select .Measure the Absorbance Spectrum of an Aqueous Sample(Absorbance vs. Wavelength)1. Fill a cuvette about ¾ full of the solution to be tested and place it in thespectrometer.2. Start the data collection. Tap the red Stop button to end the data collection.3. Note: The wavelength of maximum absorbance (λ max) is automatically selected.This λ max will be used for any subsequent data collection, such as a Beer’s Lawexperiment (abs vs. conc.) or a kinetics experiment (abs. vs. time). If you wish tochoose another wavelength, you can tap on the graph to select a new wavelengthor you can used the arrow keys on the keypad to move the cursor to a newwavelength.Conduct a Beer’s Law Experiment (Absorbance vs. Concentration)1. Measure an absorbance spectrum as described above. On the Meter screen, tapMode. Change the mode to Events with Entry.2. Enter the Name (Concentration) and Units (mol/L). Select OK.3. A message will appear warning you to either save or discard the full spectrumrun. Make your choice and proceed with the data collection.4. Place your first Beer’s law standard solution in the spectrometer. Start datacollection. After the absorbance reading stabilizes, tap Keep. Enter theconcentration of the solution and select OK.5. Place your second standard sample in the spectrometer. After the absorbancereadings stabilize, tap Keep. Enter the concentration of the second sample andselect OK.6. Repeat Step 5 for the remaining standard samples. After you have tested the finalstandard, tap the red Stop button to end the data collection.7. To calculate a best fit line equation for your standards, choose Curve Fit from theAnalyze menu. Select Linear for the Fit Equation, and then select OK. The graphscreen will appear again with the linear regression equation displayed.8. Place a cuvette containing an unknown sample of solution in the spectrometer.Tap the Meter tab and write down the displayed absorbance value. Tap the graphtab and trace the linear regression equation to determine the concentration of theunknown.Conduct a Kinetics Experiment (Absorbance vs. Time)1. Measure an absorbance spectrum as described above. On the Meter screen, tapMode. Change the data-collection mode to Time Based.2. You can change the rate, interval, and/or length of time of data collection, ifdesired. Select OK when you are ready to proceed.3. A message will appear warning you to either save or discard the full spectrumrun. Make your choice and proceed with data collection.56
4. Mix the reactants, transfer ~2 mL of the reaction mixture to a cuvette and placethe cuvette in the spectrometer. Start the data collection. You may tap the redStop button to end the data collection early.5. To calculate a function for your data, choose Curve Fit from the Analyze menu.Select the Fit Equation, and then select OK. The graph screen will appear again.Measure an Emission Spectrum1. Use a small screwdriver to loosen the two screws that connect the cuvette holderto the <strong>Spectrometer</strong> (see Figure 1). Remove the cuvette holder and connect anoptical fiber assembly to the spectrometer.2. Turn on the LabQuest. The LabQuest App will launch automatically and themeter screen will be displayed.3. On the meter screen, tap Change Units ► USB:<strong>Spectrometer</strong> ► Intensity fromthe Sensors menu. The spectrometer measures intensity in relative units.4. Aim the tip of the optical fiber cable at a light source. Start the data collection.Tap the red Stop button to end the data collection.If the spectrum maxes out (flat and wide peaks), increase the distance between thelight source and the tip of the optical fiber cable or reduce the sample time. To adjustthe data collection parameters, tap Sensors and choose Data Collection. Set theSample Time to a suitable value and decrease the Samples to Average to 1.Determining the Wavelength to Use in an ExperimentAfter you collect a full absorbance spectrum of a sample, LabQuest will identify thewavelength of maximum absorbance (λ max). If you wish to select a differentwavelength, tap on the full spectrum graph or use the arrow keys on the keypad toidentify the wavelength of choice. Another way to change the wavelength is tonavigate to the meter screen, tap on the meter itself, and select Change Wavelength.Enter the wavelength of your choice and select OK. If the wavelength you type in isnot measured by the <strong>UV</strong>-<strong>VIS</strong> unit, LabQuest will automatically choose thewavelength closest to your choice.MeasurementYou can set up the spectrometer to measure intensity, absorbance, or% transmittance. On the Meter screen, choose Change Units from the Sensors menu.Click on the unit of choice from the list.Sample ExperimentsThere are several experiments available for use with the spectrometer. You maydownload the labs from our web site (www.vernier.com/spectroscopy).Specifications<strong>Ocean</strong> <strong>Optics</strong> <strong>UV</strong>-<strong>VIS</strong> <strong>Spectrometer</strong> (order code: SP-<strong>UV</strong>-<strong>VIS</strong>)Dimensions: 14.2 cm × 8.7 cm × 3 cm (includes cuvette holder/light source)Power: AC adapter (included)Light Source: integrated deuterium tungsten halogen light sourceWavelength Range: 200 nm–850 nmPixel Resolution: 0.2 nm<strong>Ocean</strong> <strong>Optics</strong> <strong>Red</strong> Tide <strong>UV</strong>-<strong>VIS</strong> <strong>Spectrometer</strong> (order code: SPRT-<strong>UV</strong>-<strong>VIS</strong>)Dimensions: 14.2 cm × 8.7 cm × 3 cm (includes cuvette holder/light source)Power: AC adapter (included)Light Source: integrated deuterium tungsten halogen light sourceWavelength Range: 200 nm–850 nmPixel Resolution: 1 nmWarrantyVernier warrants this product to be free from defects in materials and workmanshipfor a period of three years (bulbs are one year) from the date of shipment to thecustomer. This warranty does not cover damage to the product caused by abuse orimproper use. This product is manufactured by <strong>Ocean</strong> <strong>Optics</strong>, Inc.Vernier Software & Technology13979 S.W. Millikan Way • Beaverton, OR 97005-2886Toll Free (888) 837-6437 • (503) 277-2299 • FAX (503) 277-2440info@vernier.com • www.vernier.comRev. 1.12.11Logger Pro, Vernier LabPro, Vernier LabQuest, Go! Link and other marks shown are our registered trademarks in theUnited States. All other marks not owned by us that appear herein are the property of their respective owners, who mayor may not be affiliated with, connected to, or sponsored by us.Printed on recycled paper.78