Classification of Edible Oils by Employing 31P and 1H NMR ...
Classification of Edible Oils by Employing 31P and 1H NMR ...
Classification of Edible Oils by Employing 31P and 1H NMR ...
- No tags were found...

Create successful ePaper yourself
Turn your PDF publications into a flip-book with our unique Google optimized e-Paper software.
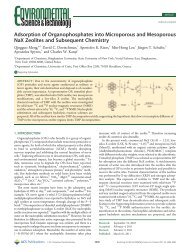
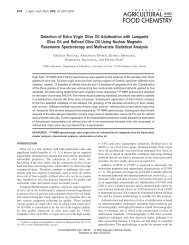
J. Agric. Food Chem. 2003, 51, 5715−5722 5715<strong>Classification</strong> <strong>of</strong> <strong>Edible</strong> <strong>Oils</strong> <strong>by</strong> <strong>Employing</strong> 31 P <strong>and</strong> 1 H <strong>NMR</strong>Spectroscopy in Combination with Multivariate StatisticalAnalysis. A Proposal for the Detection <strong>of</strong> Seed Oil Adulterationin Virgin Olive <strong>Oils</strong>GEORGIA VIGLI, ANGELOS PHILIPPIDIS, APOSTOLOS SPYROS, AND PHOTIS DAIS*<strong>NMR</strong> Laboratory, Department <strong>of</strong> Chemistry, University <strong>of</strong> Crete, 714 09 Iraklion, Crete, GreeceA combination <strong>of</strong> 1 H <strong>NMR</strong> <strong>and</strong> 31 P <strong>NMR</strong> spectroscopy <strong>and</strong> multivariate statistical analysis was usedto classify 192 samples from 13 types <strong>of</strong> vegetable oils, namely, hazelnut, sunflower, corn, soybean,sesame, walnut, rapeseed, almond, palm, groundnut, safflower, coconut, <strong>and</strong> virgin olive oils fromvarious regions <strong>of</strong> Greece. 1,2-Diglycerides, 1,3-diglycerides, the ratio <strong>of</strong> 1,2-diglycerides to totaldiglycerides, acidity, iodine value, <strong>and</strong> fatty acid composition determined upon analysis <strong>of</strong> therespective 1 H <strong>NMR</strong> <strong>and</strong> 31 P <strong>NMR</strong> spectra were selected as variables to establish a classification/prediction model <strong>by</strong> employing discriminant analysis. This model, obtained from the training set <strong>of</strong>128 samples, resulted in a significant discrimination among the different classes <strong>of</strong> oils, whereas100% <strong>of</strong> correct validated assignments for 64 samples were obtained. Different artificial mixtures <strong>of</strong>olive-hazelnut, olive-corn, olive-sunflower, <strong>and</strong> olive-soybean oils were prepared <strong>and</strong> analyzed<strong>by</strong> 1 H <strong>NMR</strong> <strong>and</strong> 31 P <strong>NMR</strong> spectroscopy. Subsequent discriminant analysis <strong>of</strong> the data allowed detection<strong>of</strong> adulteration as low as 5% w/w, provided that fresh virgin olive oil samples were used, as reflected<strong>by</strong> their high 1,2-diglycerides to total diglycerides ratio (D g 0.90).KEYWORDS:olive oil1 H <strong>NMR</strong> <strong>and</strong> 31 P <strong>NMR</strong> spectroscopy; vegetable oils; discriminant analysis; adulteration <strong>of</strong>INTRODUCTIONRecently, there has been an increasing interest in theclassification <strong>of</strong> edible oils as an effective means to examineauthentication <strong>and</strong> to detect possible adulteration <strong>of</strong> virgin oliveoils with seed oils or low-quality olive oils (1, 2). Such studiesare clustered according to the type <strong>of</strong> analytical parameters(variables) used <strong>and</strong> the kind <strong>of</strong> chemometric procedures applied.Classical methods based on gas chromatography (GC) <strong>and</strong> highperformanceliquid chromatography (HPLC) have been successfullyused to classify <strong>and</strong> authenticate the edible oils (1-5). These methods are more efficient <strong>and</strong> <strong>of</strong>fer better resultswhen a large number <strong>of</strong> compositional parameters are analyzed<strong>by</strong> statistical procedures. Other studies have demonstrated thatnonconventional methods, such as GC combined with massspectrometry (6, 7), infrared, <strong>and</strong> Raman spectroscopy (8-10),are able to <strong>of</strong>fer good results in combination with chemometricprocedures.In the past decade, high-resolution nuclear magnetic resonance(<strong>NMR</strong>) spectroscopy has been applied effectively in the analysis<strong>of</strong> virgin olive oil to evaluate quality <strong>and</strong> authentication (11,12). However, studies that use <strong>NMR</strong> spectroscopic data <strong>of</strong> oliveoil composition in combination with multivariate analysis <strong>of</strong>the chemical parameters are rather limited. Fauhl et al. (13) have* Author to whom correspondence should be addressed (e-maildais@chemistry.uoc.gr).separated virgin olive, sunflower, <strong>and</strong> hazelnut oils <strong>by</strong> selectingthe peak intensities <strong>of</strong> the unsaturated fatty acids <strong>and</strong> polyunsaturatedfatty acids, the ratio <strong>of</strong> linolenic to linoleic acid, <strong>and</strong>the ratio <strong>of</strong> linolenic acid to all other fatty acids. Mannina etal. (14) described a combined approach <strong>by</strong> using 1 H <strong>NMR</strong> <strong>and</strong>GC for the separation <strong>of</strong> virgin olive oil <strong>and</strong> hazelnut oil.Mavromoustakos et al. (15) reported a method based on 13 C<strong>NMR</strong> spectroscopy to detect the adulteration <strong>of</strong> virgin olive oil<strong>by</strong> cottonseed, sunflower, corn, <strong>and</strong> soybean oils. Vlachov (16)detected olive oil adulteration with soybean oil <strong>by</strong> employingthe 13 C <strong>NMR</strong> pulsed sequence DEPT. Finally, Zamora et al.(17) classified virgin olive oils from different cultivars <strong>and</strong>regions <strong>of</strong> Europe <strong>and</strong> North Africa, refined olive oils, pomaceoils, hazelnut, rapeseed, corn, grape seed, sunflower, <strong>and</strong>soybean oils on the basis <strong>of</strong> 13 C <strong>NMR</strong> chemical shifts <strong>and</strong> lineardiscriminant analysis. The oil samples used in this study werechromatographically fractionated to suppress the abundanttriglycerides <strong>and</strong> enhance the concentration <strong>of</strong> minor componentsthat define authenticity <strong>and</strong> quality (18).In a recent publication (19) we introduced a facile <strong>NMR</strong>method to determine the mono- <strong>and</strong> diglyceride compositionin olive oils. This method is based on the derivatization <strong>of</strong> thelabile hydrogens <strong>of</strong> the hydroxyl groups <strong>of</strong> the diglycerides with2-chloro-4,4,5,5-tetramethyldioxaphospholane (1) according tothe reaction shown in Figure 1 <strong>and</strong> the use <strong>of</strong> the 31 P chemicalshifts <strong>of</strong> the phosphitylated compounds 2 to identify the labile10.1021/jf030100z CCC: $25.00 © 2003 American Chemical SocietyPublished on Web 08/12/2003
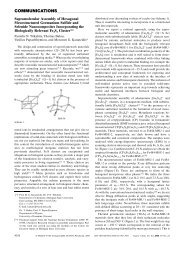
5716 J. Agric. Food Chem., Vol. 51, No. 19, 2003 Vigli et al.Figure 1. Reaction <strong>of</strong> hydroxyl groups <strong>of</strong> diglycerides with 2-chloro-4,4,5,5-tetramethyldioxaphospholane (1).centers. Compound 1 reacts rapidly <strong>and</strong> quantitatively undermild conditions with the hydroxyl groups. It should be notedthat reagent 1 also reacts quantitatively with other functionalgroups, such as carboxylic acids <strong>and</strong> aldehydes, replacing thecarboxylic <strong>and</strong> aldehydic hydrogens according to the reactionin Figure 1.This analytical approach was applied to a large number <strong>of</strong>virgin olive oils from various regions <strong>of</strong> Greece. as well as toseveral commercial virgin olive oils, refined olive oils, <strong>and</strong>pomace oils, in an attempt to examine virgin olive oil quality<strong>and</strong> freshness (20). It has been suggested (11, 20-22) that theratio <strong>of</strong> 1,2-diglycerides to the total diglycerides [D ) 1,2-diglycerides/(1,2-diglycerides + 1,3-diglycerides)] is a usefulindex to detect the quality <strong>and</strong> freshness <strong>of</strong> virgin olive oils.Moreover, the same index can distinguish fresh virgin olive oilsfrom refined oils, because the D ratio <strong>of</strong> the latter oils is muchsmaller (∼0.33) than that <strong>of</strong> the former. This is because theisomerization <strong>of</strong> 1,2-diglycerides (1,2-DGs) to 1,3-diglycerides(1,3-DGs) that usually occurs during prolonged olive oil storageis very rapid upon olive refinement.The diglyceride concentration in virgin olive oils <strong>and</strong> othercompositional parameters determined <strong>by</strong> 31 P <strong>NMR</strong> <strong>and</strong> 1 H <strong>NMR</strong>spectroscopy, respectively, were used in the present study toclassify a large number <strong>of</strong> vegetable oils including virgin oliveoils <strong>and</strong> to detect possible adulteration <strong>of</strong> virgin olive oils withother types <strong>of</strong> oils to limits below which the addition <strong>of</strong> seedoils becomes unpr<strong>of</strong>itable. This was achieved <strong>by</strong> employingmultivariate statistical procedures.MATERIALS AND METHODSSamples <strong>and</strong> Reagents. Fifty-six olive oil samples (years <strong>of</strong>harvesting 2000-2001 <strong>and</strong> 2001-2002) were collected from variousregions <strong>of</strong> Greece through local agricultural cooperatives. In particular,45 samples were collected from Crete (Peza, Kolymbari, Heraklion,<strong>and</strong> Sitia), 4 from Lesvos, 5 from Ilia, <strong>and</strong> 2 from Halkidiki. All samplesconsidered in this study were virgin olive oils according to the <strong>of</strong>ficialanalytical methods <strong>and</strong> limits (23, 24). A total <strong>of</strong> 136 samples <strong>of</strong> 12types <strong>of</strong> refined seed oils were purchased from Henry Lamotte GmbH(Bremen, Germany). All samples from Henry Lamotte were certified<strong>and</strong> used without further analysis. These oils were as follows (thenumber <strong>of</strong> samples analyzed for each type <strong>of</strong> oil is reported inparentheses): hazelnut (16), sunflower (12), corn (16), soybean (14),sesame (13), walnut (14), rapeseed (5), almond (10), palm (7),groundnut (9), coconut (10), <strong>and</strong> safflower (10). All samples were storedin brown screw-capped bottles at -20 °C prior to spectrum acquisition.For adulteration studies, fresh virgin olive oils were mixed withhazelnut, sunflower, corn, <strong>and</strong> soybean oils. Mixtures <strong>of</strong> 5, 10, 15, 20,35, <strong>and</strong> 50% w/w for each seed oil in virgin olive oils were prepared.Fresh virgin olive oil samples <strong>of</strong> different geographical origin <strong>and</strong>different samples <strong>of</strong> seed oils were used for the preparation <strong>of</strong> thevarious mixtures. One additional set <strong>of</strong> mixtures (5, 10, 15, <strong>and</strong> 20%)<strong>of</strong> different olive oils <strong>and</strong> hazelnut oils was prepared for the presentanalysis. All adulterated virgin olive oils were analyzed twice.All protonated <strong>and</strong> deuterated solvents were <strong>of</strong> analytical grade <strong>and</strong>were purchased from Sigma-Aldrich Ltd. (Athens, Greece). Thederivatizing reagent 1 was synthesized from pinacol <strong>and</strong> phosphorustrichloride in the presence <strong>of</strong> triethylamine following the methodpreviously described in the literature (25). For synthesis <strong>of</strong> reagent 1we utilized hexane solvent instead <strong>of</strong> benzene, as suggested in theoriginal method, in an attempt to increase the yield <strong>of</strong> the reaction.This modification resulted in ∼45% yield <strong>of</strong> the product against 19%obtained with the original method.Determination <strong>of</strong> Diglycerides, Acidity, <strong>and</strong> Total Sterols <strong>by</strong> 13 P<strong>NMR</strong> Spectroscopy. Samples <strong>of</strong> the various oils <strong>and</strong> the mixtures <strong>of</strong>olive oils with seed oils were prepared as follows: A stock solution(10 mL) composed <strong>of</strong> pyridine <strong>and</strong> CDCl 3 in a 1.6:1.0 volume ratiocontaining 0.6 mg <strong>of</strong> chromium acetylacetonate, Cr(acac) 3 (0.165 µM),<strong>and</strong> 13.5 mg cyclohexanol (13.47 mM) was prepared <strong>and</strong> protectedfrom moisture with 5A molecular sieves. One hundred <strong>and</strong> fiftymilligrams <strong>of</strong> the oil sample was placed in a5mm<strong>NMR</strong>tube. Therequired volumes <strong>of</strong> stock solution (0.4 mL) <strong>and</strong> the reagent 1 (15 µL)were added. The reaction mixture was left to react for about 20 min atroom temperature. Upon completion <strong>of</strong> the reaction, the solution wasused to obtain the 31 P <strong>NMR</strong> spectra.<strong>31P</strong> <strong>NMR</strong> spectra were obtained on a Bruker AMX500 spectrometeroperating at 202.2 MHz for the phosphorus-31 nucleus at roomtemperature. To neglect NOE effects, the inverse-gated decouplingtechnique was used. Typical parameters for quantitative studies wereas follows: 90° pulse width, 12.5 µs; sweep width, 10 kHz; relaxationdelay, 30 s; <strong>and</strong> memory size, 16K (zero-filled to 32K). Line broadening<strong>of</strong> 1 Hz was applied, <strong>and</strong> drift correction was performed prior to Fouriertransform. Polynomial fourth-order baseline correction was performedbefore integration. For each spectrum 32 transients were acquired. All<strong>31P</strong> chemical shifts are reported relative to the product <strong>of</strong> the reaction<strong>of</strong> 1 with water (moisture contained in all samples), which gives a sharpsignal in pyridine/CDCl 3 at 132.20 ppm. It should be noted that thepresence <strong>of</strong> the paramagnetic metal center <strong>of</strong> Cr(acac) 3 in the sampleslowers the relaxation times <strong>of</strong> the phosphorus nuclei, thus shorteningsignificantly the duration <strong>of</strong> the measurements. Figure 2 shows the202.2 MHz 31 P <strong>NMR</strong> spectrum <strong>of</strong> a virgin olive oil sample. Theexcellent resolution <strong>of</strong> the 31 P chemical shifts permits a reliable detection<strong>of</strong> the phosphitylated 1,2-diglycerides, 1,3-diglycerides, <strong>and</strong> total sterols.The concentration <strong>of</strong> these components was determined upon integration<strong>of</strong> their corresponding signals (Figure 2) with respect to the integral<strong>of</strong> the signal owing to the phosphitylated internal st<strong>and</strong>ard (cyclohexanol).The acidity was obtained from the integral <strong>of</strong> the signalcorresponding to the phosphitylated free fatty acids, which appears atδ 134.79.Usually monoglycerides cannot be detected <strong>by</strong> employing thismethod due to the very low concentration <strong>of</strong> these minor constituentsin olive oil (
Detection <strong>of</strong> Seed Oil Adulteration in Virgin Olive Oil J. Agric. Food Chem., Vol. 51, No. 19, 2003 5717Figure 2. 202.2 MHz 31 P <strong>NMR</strong> spectrum <strong>of</strong> virgin olive oil. The region where the phosphitylated total sterols, diglycerides, <strong>and</strong> free fatty acids absorbis illustrated. The phosphitylated cyclohexanol is used as internal st<strong>and</strong>ard.<strong>and</strong> performed eight measurements on different hazelnut oil samples,using the same experimental protocol for each measurement. Therepeatability <strong>of</strong> the 1 H <strong>NMR</strong> measurements ranged from 0.40 to 6.69%,whereas the reproducibility was 0.35-11.47%, depending on the S/N<strong>of</strong> the various signals in the spectra. High repeatability <strong>and</strong> reproducibilitywere obtained in the 1 H <strong>NMR</strong> spectrum (Figure 3) for the olefinicprotons (1.45 <strong>and</strong> 0.35%), signal A (1.45 <strong>and</strong> 1.54%), signal B (1.30<strong>and</strong> 0.65%), signal C (0.77 <strong>and</strong> 0.44%), <strong>and</strong> signal F (0.65 <strong>and</strong> 0.65%).The lowest repeatability (6.69%) <strong>and</strong> reproducibility (11.47%) werecalculated for signal E (linolenic acid) with the lowest S/N.Statistical Data Analysis. Analysis <strong>of</strong> the data was performed <strong>by</strong>classical multivariate procedures including one-way ANOVA <strong>and</strong> thesupervised technique discriminant analysis (DA). In the latter analysis,the total number <strong>of</strong> samples was r<strong>and</strong>omly divided into two separatesets, a training set (around two-thirds <strong>of</strong> the samples) <strong>and</strong> a test set(around one-third <strong>of</strong> the samples). The first set was employed toestablish a classification rule, which afterward allowed the attribution<strong>of</strong> unknown samples, whereas the second set was used to validate thepredictive ability <strong>of</strong> the optimized statistical model. The canonicaldiscrimination functions were built with the information <strong>of</strong> the trainingset, whereas validation <strong>of</strong> these functions was achieved through thetest set. The same statistical treatment <strong>of</strong> the data was used to detectadulteration. The statistical data processing was performed <strong>by</strong> usingStatistica for Windows 5.1B (StatS<strong>of</strong>t Inc.).RESULTS AND DISCUSSIONDetermination <strong>of</strong> Fatty Acid Composition <strong>and</strong> IodineValue (IV). Figure 3 shows a typical virgin olive oil 1 H <strong>NMR</strong>spectrum from which the fatty acid composition <strong>and</strong> the IV canbe determined. The spectrum is composed <strong>of</strong> 10 main signals,which have been assigned previously (11, 27). The chemicalshifts <strong>of</strong> these signals in the solvent pyridine/CDCl 3 aresummarized in Table 1. Most <strong>of</strong> these signals are assigned tononequivalent groups <strong>of</strong> protons that are common to fatty acylchains. Therefore, the concentration <strong>of</strong> the acids in the oils canbe calculated only <strong>by</strong> combination <strong>of</strong> various signal intensitiesin the 1 H <strong>NMR</strong> spectrum (11, 27). An exception is signal E atδ 0.98, which corresponds to the methyl protons <strong>of</strong> linolenicacid. Therefore, the concentration <strong>of</strong> this acid is obtained fromthe relationship (11, 27)[linolenic] )E(1)E + FF is the signal intensity <strong>of</strong> the methyl protons <strong>of</strong> all acids exceptlinolenic acid. Oleic, linoleic, <strong>and</strong> total saturated fatty acids(mainly palmitic <strong>and</strong> stearic acids) (SFA) are calculated fromsignal intensities A, C, <strong>and</strong> F <strong>and</strong> the following set <strong>of</strong>relationships:3A - 4E[linoleic] ) (2)2(E + F)[oleic] )3C - [linoleic] - [linolenic] (3)4(E + F)[SFA] )F - [linoleic] - [oleic] - [linolenic] (4)E + FSignal intensity B <strong>of</strong> the CH 2 protons <strong>of</strong> all acyl chains isrelated to signal intensities E <strong>and</strong> F <strong>by</strong> the following relationship:E + F) B 3 2Substituting the relationship 5 into eqs 2 <strong>and</strong> 3, we obtain twonew relationships, which can also be used for the calculation<strong>of</strong> the molar concentrations <strong>of</strong> linoleic <strong>and</strong> oleic acids.3A - 4E[linoleic] )3B(5)(6)[oleic] ) C - [linoleic] - [linolenic] (7)2B
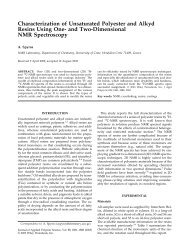
5718 J. Agric. Food Chem., Vol. 51, No. 19, 2003 Vigli et al.Figure 3. 500 MHz 1 H <strong>NMR</strong> spectrum <strong>of</strong> virgin olive oil. The inset shows expansion <strong>of</strong> the spectrum where the methyl protons (signal E) <strong>of</strong> the linolenylchain appear. The assignments <strong>of</strong> all signals are summarized in Table 1.Table 1. Chemical Shifts <strong>and</strong> Assignments <strong>of</strong> the Signals in the 1 H<strong>NMR</strong> Spectrum <strong>of</strong> Virgin Olive Oil in Pyridine-d 5 /Chlor<strong>of</strong>orm-d Solvent(Figure 3) According to Sacchi et al. (11, 27)signal δ protons attribution1 5.40 CHdCH all unsaturated fatty acids2 5.37 CHsOCOR triglycerides3 4.22, 4.42 CH 2sOCOR triglycerides4(A) 2.84 CHdCH−CH 2sCHdCH linolenyl <strong>and</strong> linoleyl chains5(B) 2.32 CH 2−COOH all acyl chains6(C) 2.06 CH 2sCHdCH all unsaturated acyl chains7(D) 1.63 CH 2sCH 2COOH all acyl chains8 1.30 (CH 2) n all acyl chains9(E) 0.95 CHdCHsCH 2sCH 3 linolenyl chain10 (F) 0.88 CH 2CH 2CH 2sCH 3 all acyl chains except linolenylThe validity <strong>of</strong> each set <strong>of</strong> relationships, namely, 1-4 <strong>and</strong> 1,4, 6, <strong>and</strong> 7, to calculate the fatty acid concentrations can bechecked independently <strong>by</strong> their ability to reproduce the intensity<strong>of</strong> signal 1, which belongs to the olefinic protons <strong>of</strong> allunsaturated acids in the 1 H <strong>NMR</strong> spectrum. The intensity <strong>of</strong>this signal, which depends on the degree <strong>of</strong> oil unsaturation, isrelated to the concentrations <strong>of</strong> the fatty acids <strong>and</strong> the signalintensity <strong>of</strong> the methylene protons <strong>of</strong> triacylglycerols (TG) inthe spectrum (δ 4.42) <strong>by</strong> the following relationship:[-CHd CH-] )2[oleic] + 4[linoleic] + 6[linolenic]0.5 × (E + F+ B 3 2)+ [TG]2(8)It should be noted that relationship 2 <strong>of</strong> the present study isdifferent from relationship 5 <strong>of</strong> previous reports (11, 27). Itappears that the latter relationship is erroneous for two reasons;first, the normalization factor (E + F) does not apply to the Aprotons, <strong>and</strong>, second, a factor <strong>of</strong> two-thirds is appropriate forthe intensity <strong>of</strong> the two diallylic protons (signal A at δ 2.84),which are compared with the intensity <strong>of</strong> the methyl protons <strong>of</strong>linolenic acid (signal E at δ 0.95).The iodine value is given <strong>by</strong> the relationship([-CHdCH-]2IV )E + F3- [TG]4where the concentrations [-CHdCH-] <strong>and</strong> [TG] were calculatedfrom the signal integrals at δ 5.40 <strong>and</strong> 4.42, respectively,<strong>and</strong> 86 represents the IV <strong>of</strong> oleic acid.Variables <strong>of</strong> the <strong>Oils</strong> Used for Statistical Analyses. Themean values <strong>and</strong> st<strong>and</strong>ard deviations <strong>of</strong> the variables used inthis study for the 192 samples <strong>of</strong> 13 types <strong>of</strong> vegetable oils asa whole are summarized in Table 2. The data for each individualsample are available as Supporting Information. We decided touse compositional parameters <strong>and</strong> the IV as variables for thestatistical analysis instead <strong>of</strong> <strong>NMR</strong> signal integrals for thefollowing reasons. First, the former pr<strong>of</strong>ile gives a first indication<strong>of</strong> the compositional differences among the various oils, whichmay be used subsequently for their differentiation. Second, thisvariables pr<strong>of</strong>ile resulted in a better discrimination <strong>of</strong> the oils)×86 (9)
Detection <strong>of</strong> Seed Oil Adulteration in Virgin Olive Oil J. Agric. Food Chem., Vol. 51, No. 19, 2003 5719Table 2. Mean Values <strong>and</strong> St<strong>and</strong>ard Deviations <strong>of</strong> the Variables for 13 Types <strong>of</strong> Vegetable <strong>Oils</strong>oil 1,2-DGs 1,3-DGs total DGs D total sterols acidity oleic acid linoleic acid linolenic acid SFA IV aolive 1.71 ± 0.29 0.17 ± 0.09 1.88 ± 0.31 0.91 ± 0.04 0.12 ± 0.03 0.21 ± 0.12 77.13 ± 2.48 7.89 ± 1.36 0.47 ± 0.10 14.51 ± 1.65 80.58 ± 1.93soybean 0. 33 ± 0.07 0.74 ± 0.20 1.08 ± 0.25 0.33 ± 0.04 0.21 ± 0.04 0.03 ± 0.01 24.63 ± 1.68 50.11 ± 0.94 7.30 ± 0.73 17.98 ± 0.68 127.35 ± 2.27sunflower 0.50 ± 0.08 1.01 ± 0.17 1.51 ± 0.24 0.33 ± 0.02 0.16 ± 0.04 0.01 ± 0.02 26.06 ± 1.79 60.78 ± 2.65 0.61 ± 0.26 12.37 ± 0.36 129.12 ± 1.82corn 0.98 ± 0.14 2.16 ± 0.19 3.14 ± 0.31 0.31 ± 0.02 0.33 ± 0.03 0.05 ± 0.03 31.14 ± 1.18 52.51 ± 1.91 1.83 ± 0.72 14.59 ± 0.90 120.49 ± 2.32hazelnut 0.87 ± 0.15 1.85 ± 0.36 2.72 ± 0.50 0.32 ± 0.02 0.07 ± 0.03 0.12 ± 0.07 77.04 ± 6.85 12.95 ± 6.13 0.29 ± 0.15 9.51 ± 0.82 89.91 ± 4.40sesame 0.74 ± 0.14 1.55 ± 0.23 2.29 ± 0.36 0.32 ± 0.01 0.17 ± 0.05 0.06 ± 0.02 42.68 ± 0.85 38.74 ± 0.91 0.88 ± 0.21 16.98 ± 2.98 105.81 ± 1.05groundnut 0.73 ± 0.07 1.62 ± 0.08 2.36 ± 0.15 0.31 ± 0.01 0.15 ± 0.02 0.04 ± 0.05 57.75 ± 0.24 20.65 ± 0.45 1.02 ± 0.22 20.59 ± 0.25 87.48 ± 0.49walnut 1.20 ± 0.16 2.27 ± 0.26 3.47 ± 0.47 0.35 ± 0.01 0.09 ± 0.02 0.00 16.81 ± 1.33 57.66 ± 1.59 13.69 ± 0.58 11.84 ± 0.52 150.09 ± 1.94rapeseed 0.30 ± 0.05 0.61 ± 0.11 0.91 ± 0.14 0.33 ± 0.03 0.21 ± 0.04 0.02 ± 0.02 62.82 ± 0.50 16.87 ± 0.29 11.93 ± 0.09 8.39 ± 0.29 112.99 ± 0.88almond 0.66 ± 0.09 1.16 ± 0.11 1.82 ± 0.18 0.33 ± 0.03 0.17 ± 0.04 0.00 57.51 ± 1.43 25.24 ± 0.61 0.63 ± 0.08 8.78 ± 0.89 94.42 ± 1.32safflower 0.52 ± 0.04 1.19 ± 0.07 1.71 ± 0.09 0.30 ± 0.02 0.10 ± 0.02 0.04 ± 0.03 13.92 ± 0.14 73.41 ± 0.18 0.71 ± 0.04 11.96 ± 0.18 139.80 ± 0.31palm 1.32 ± 0.18 5.61 ± 0.69 6.93 ± 0.87 0.19 ± 0.01 0.01 ± 0.01 0.14 ± 0.02 38.38 ± 1.12 8.26 ± 0.25 0.51 ± 0.09 52.84 ± 3.12 47.63 ± 0.48coconut 1.48 ± 0.51 3.07 ± 1.01 4.55 ± 1.52 0.33 ± 0.01 0.06 ± 0.03 0.04 ± 0.01 7.31 ± 2.30 0.32 ± 0.16 0.37 ± 0.06 92.00 ± 2.23 6.12 ± 0.47a Iodine value.upon statistical analysis. A third reason is the possibility thatthe present statistical analysis can be used with compositionalindices extracted <strong>by</strong> employing analytical methods other than<strong>NMR</strong>.Inspection <strong>of</strong> the data in Table 2 reveals that the parametersthat differentiate olive oils from the remaining seed oils are thediglyceride content <strong>and</strong> acidity. In the former oils the 1,3-DGsare much lower <strong>and</strong> the D ratio is much higher than thecorresponding values <strong>of</strong> the latter oils. This is due to therefinement <strong>of</strong> the seed oils as mentioned previously. The fattyacid composition is about the same in both olive <strong>and</strong> hazelnutoils except perhaps for the amount <strong>of</strong> saturated fatty acid (mainlypalmitic acid), which is lower for hazelnut oil. Olive <strong>and</strong>hazelnut oils are characterized <strong>by</strong> high amounts <strong>of</strong> monounsaturatedfatty acid (oleic acid), whereas lower concentrations areobserved for walnut, safflower, <strong>and</strong> coconut oils. The amount<strong>of</strong> polyunsaturated fatty acids (linoleic <strong>and</strong> linolenic) is highfor safflower, soybean, corn, sunflower, <strong>and</strong> walnut seed oils<strong>and</strong> low for olive, hazelnut, palm, <strong>and</strong> coconut oils. The degree<strong>of</strong> unsaturation is reflected in the iodine values (Table 2). Highconcentrations <strong>of</strong> saturated fatty acids are observed for palm,coconut, sesame, <strong>and</strong> walnut oils. Coconut oil contains thehighest amount <strong>of</strong> saturated fatty acids <strong>and</strong> is characterized <strong>by</strong>the lowest IV. Finally, high levels <strong>of</strong> linolenic acid are observedfor walnut, rapeseed, <strong>and</strong> soybean seed oils.<strong>Classification</strong> <strong>of</strong> Vegetable <strong>Oils</strong>. From the data in Table 2(mean values <strong>and</strong> st<strong>and</strong>ard deviations), it is possible to formulatean immediate judgment on the discrimination ability <strong>of</strong> a singlevariable. For instance, the diglyceride content differentiates oliveoils from the rest <strong>of</strong> the vegetable oils, whereas the concentration<strong>of</strong> saturated fatty acids discriminates coconut oil. Nevertheless,our aim is to discriminate among the 13 groups <strong>of</strong> oils <strong>and</strong> t<strong>of</strong>ind the necessary variables for this purpose. In other words,we seek the number <strong>of</strong> variables that should be included in aclassification/prediction statistical model without compromisingits discrimination ability. There are two ways to do this; principalcomponent analysis (PCA) <strong>and</strong> one-way ANOVA. The FisherF ratio <strong>of</strong>fered better results selecting variables for which F >1. These are (in parentheses are the F values with degrees <strong>of</strong>freedom <strong>of</strong> 12 <strong>and</strong> 179) 1,3-DGs (230.93), 1,2-DGs (81.46),total DGs (101.61), D (1231.95), sterols (73.52), acidity (19.99),oleic acid (1401.80), linoleic acid (1732.34), linolenic acid(1665.74), SFA (3303.18), <strong>and</strong> IV (4068.26) with the probability<strong>of</strong> the null hypothesis (no statistically significant differencesbetween the means <strong>of</strong> the groups) to be true at P < 0.000001for all variables. Moreover, the F ratios <strong>of</strong> these variables arehigher than the critical values obtained from st<strong>and</strong>ard statisticaltables at P ) 0.004, F critical (12, ∞) ) 2.48 or upon comparisonTable 3. Discriminant Analysis: Raw Coefficient, a Wilks’ λ Values, <strong>and</strong>Tolerance Levels for Each Variable Used for the <strong>Classification</strong> <strong>of</strong> 13Types <strong>of</strong> Vegetable <strong>Oils</strong>variable root 1 root 2 Wilks’ λ (× 10 10 ) tolerance level1,2-DGs −1.43 −0.83 2.21 0.461,3-DGs 1.30 0.81 5.77 0.48D 7.70 −13.71 8.15 0.76total sterols −2.74 −2.28 5.78 0.90oleic acid −0.40 −0.42 2.86 0.18linoleic acid −0.47 −0.24 1.86 0.11linolenic acid −1.20 1.07 3.63 0.74IV −0.33 −0.01 1.77 0.39constants 65.05 33.38eigenvalues 450.34 185.54a Only the raw coefficients for the two canonical functions (roots 1 <strong>and</strong> 2) thatdiscriminate the vegetable oils better are summarized.with F critical (12, 4) ) 5.91, four being the number <strong>of</strong> oil samplesminus one for the group <strong>of</strong> edible oils with the least number <strong>of</strong>samples (rapeseed with five samples). The strict criterion forthe chosen probability (usually P ) 0.05) was necessitated <strong>by</strong>the fact that the groups <strong>of</strong> edible oils contain different numbers<strong>of</strong> samples. The relatively low Fisher F ratio observed for acidityis indicative <strong>of</strong> its limited discriminatory power, <strong>and</strong> thus it isexcluded from further statistical analysis. The number <strong>of</strong>variables is further reduced to 9, because total DGs are the sum<strong>of</strong> 1,2-DGs <strong>and</strong> 1,3-DGs <strong>and</strong>, therefore, are completely redundant.Finally, after an investigation <strong>of</strong> their contribution to theclassification/prediction model, the most useful variables indifferentiating the different types <strong>of</strong> oils were 1,2-DGs, 1,3-DGs, D ratio, sterols, IV, <strong>and</strong> oleic, linoleic, <strong>and</strong> linolenic acid.Nevertheless, very good classification <strong>of</strong> the edible oils is alsoobtained upon replacing linolenic acid with saturated acids(SFA) in the assembly <strong>of</strong> the eight variables.The use <strong>of</strong> the two <strong>of</strong> the eight discriminant functions withthe highest discriminating power succeeded in classifying the192 oil samples into different groups. This is reflected <strong>by</strong> thelargest raw regression coefficients <strong>of</strong> the canonical function(roots), which in turn reflect the contribution <strong>of</strong> the respectivevariable to the discrimination between groups. The coefficientsassigned to each variable in the canonical functions, the tolerancevalue for each variable, <strong>and</strong> the Wilks’ λ criterion for thediscriminating power <strong>of</strong> the selected variables are shown inTable 3. The values <strong>of</strong> Wilks’ λ are very small, indicating thatthe eight selected variables are characterized <strong>by</strong> an almostperfect discriminatory power. We can visualize the discriminatingpower <strong>of</strong> the two canonical functions between groups (types)<strong>of</strong> oils <strong>by</strong> plotting the individual scores <strong>of</strong> the samples with the
5720 J. Agric. Food Chem., Vol. 51, No. 19, 2003 Vigli et al.Table 4. Discriminant Analysis: Raw Coefficient, a Wilks’ λ Values, <strong>and</strong>Tolerance Levels for Each Variable Used for the <strong>Classification</strong> <strong>of</strong> 5Types <strong>of</strong> Vegetable <strong>Oils</strong>variable root 1 root 2 Wilks’ λ (× 10 7 ) tolerance level1,2-DGs .002 0.39 4.04 0.691,3-DGs 2.18 −2.56 11.16 0.49D 43.16 16.70 25.60 0.73total sterols −6.39 2.25 8.91 0.79oleic acid −0.05 −0.16 5.28 0.08linoleic acid −0.13 −0.04 5.67 0.05linolenic acid −0.18 0.76 5.29 0.64IV −0.26 0.13 4.91 0.26constants 7.64 −12.16eigenvalues 353.17 39.26a Only the raw coefficients <strong>of</strong> the two canonical functions (roots 1 <strong>and</strong> 2) thatdiscriminate the vegetable oils better are summarized.Figure 4. Plot <strong>of</strong> discriminant functions roots 1 <strong>and</strong> 2 for 192 samples <strong>of</strong>13 types <strong>of</strong> vegetable oils.two functions. Such a plot for 13 types <strong>of</strong> oil samples is seenin Figure 4. It is evident that points are nicely grouped withinsingle types <strong>of</strong> edible oils. A much better separation <strong>of</strong> the edibleoils can be obtained <strong>by</strong> excluding from the statistical analysisthe palm <strong>and</strong> coconut oils, which are remotely grouped fromthe remaining groups <strong>of</strong> oils (not shown).The reliability <strong>of</strong> the system used to classify the edible oilshas been assessed <strong>by</strong> its ability to correctly classify unknownsamples. In this respect, the data set <strong>of</strong> all oils was split intothe training (128) <strong>and</strong> test (64) sets, with a 2:1 ratio. The samples<strong>of</strong> the training <strong>and</strong> test sets were selected three times at r<strong>and</strong>omfrom the 192 oil samples. Each time, different training <strong>and</strong> testsets were used. Application <strong>of</strong> the DA functions obtained forthe training set <strong>of</strong> oil samples in all three runs produced 100%correct assignments for the test set.Adulteration <strong>of</strong> Virgin Olive Oil. The aforementionedstatistical approach was also applied to the analysis <strong>of</strong> oilmixtures <strong>of</strong> virgin olive oil in an attempt to establish the lowestpossible detection level <strong>of</strong> adulteration <strong>of</strong> virgin olive oil withseed oils. Different mixtures <strong>of</strong> olive oil <strong>and</strong> hazelnut oil, oliveoil <strong>and</strong> corn oil, olive oil <strong>and</strong> sunflower oil, <strong>and</strong> olive oil <strong>and</strong>soybean oil were prepared <strong>and</strong> analyzed as unknowns. Theseseed oils, especially hazelnut oil, were selected because theyare frequent adulterants <strong>of</strong> olive oil. Figure 5 shows the plot<strong>of</strong> the individual scores <strong>of</strong> the two canonical functions uponapplying DA on 38 samples <strong>of</strong> fresh virgin olive oils (D g 0.90),16 samples <strong>of</strong> hazelnut oils, 12 samples <strong>of</strong> sunflower oil, 16samples <strong>of</strong> corn oil, <strong>and</strong> 14 samples <strong>of</strong> soybean oil. Table 4contains the coefficients assigned to each variable in thecanonical functions, the tolerance value, <strong>and</strong> the Wilks’ λ criteriafor each variable. The ellipses in Figure 5 delimit 95%confidence. To validate this model, we followed the sameprocedure with the training sets <strong>and</strong> test sets as mentioned above.All test samples were correctly classified in the appropriategroups.The same statistical approach was applied to the analysis <strong>of</strong>the oil mixtures (adulterated virgin olive oils), which have beenanalyzed <strong>by</strong> 1 H <strong>NMR</strong> <strong>and</strong> 31 P <strong>NMR</strong> spectroscopy <strong>and</strong> consideredas unknown samples. The results were obtained using themodel obtained <strong>by</strong> the training set <strong>and</strong> are depicted in Figure5. The adulterated virgin olive oils (open symbols) lie betweenthe group <strong>of</strong> virgin olive oils <strong>and</strong> the respective group <strong>of</strong> theseed oils, depending on the amount <strong>of</strong> seed oils in the mixtures.Even mixtures containing the lowest amount <strong>of</strong> seed oils in oliveFigure 5. Plot <strong>of</strong> discriminant functions roots 1 <strong>and</strong> 2 for five types <strong>of</strong> edible oils. Virgin olive oil, hazelnut oil, corn oil, <strong>and</strong> sunflower oil are shown <strong>by</strong>crosses <strong>and</strong> solid symbols. Four sets <strong>of</strong> mixtures <strong>of</strong> 5, 10, 15, 20, 35, <strong>and</strong> 50% w/w <strong>of</strong> virgin olive oils with hazelnut (mhazelnut), sunflower (msun),soybean (msoybean), <strong>and</strong> corn (mcorn) oils <strong>and</strong> one set <strong>of</strong> mixtures <strong>of</strong> 5, 10, 15, <strong>and</strong> 20% <strong>of</strong> virgin olive oils with hazelnut oils (mhazelnut) are denoted<strong>by</strong> open symbols. Arrows indicate mixtures <strong>of</strong> 5% w/w <strong>of</strong> seed oils in virgin olive oils.
Detection <strong>of</strong> Seed Oil Adulteration in Virgin Olive Oil J. Agric. Food Chem., Vol. 51, No. 19, 2003 5721Table 5. Squared Mahalanobis Distances <strong>of</strong> Adulterated Olive OilSamples from Olive Oil Centroidadulterant5%(w/w)10%(w/w)15%(w/w)20%(w/w)35%(w/w)50%(w/w)hazelnut a 16.97 48.41 39.24 43.98 151.77 299.86hazelnut b 15.30 24.20 53.42 106.77sunflower 8.83 44.25 40.19 153.84 177.21 379.73corn 14.31 44.69 51.86 123.52 233.16 487.16soybean 13.53 35.03 31.89 43.55 194.64 397.80a First set <strong>of</strong> mixtures (5−50%) <strong>of</strong> olive oils <strong>and</strong> hazelnut oils. b Second set <strong>of</strong>mixtures (5−20%) <strong>of</strong> olive oils <strong>and</strong> hazelnut oils.oil (5%) fall outside the ellipses, except perhaps the 5% mixture<strong>of</strong> olive oil <strong>and</strong> sunflower oil (Figure 5).Another means to examine the validity <strong>of</strong> the present DAmethod to detect adulteration is the Mahalanobis distance, whichmeasures the distance between each point <strong>and</strong> the groupcentroid. The calculated Mahalanobis distances for mixtures(Table 5) are to be compared with the Mahalanobis distances<strong>of</strong> virgin olive oils. Apart from 3 olive oil samples <strong>of</strong> 38 sampleswith Mahalanobis distances <strong>of</strong> 22.49, 19.14, <strong>and</strong> 17.89, whichfall outside the 95% olive oil ellipse, all other olive oil samplesare characterized <strong>by</strong> distances lower than those calculated forthe 5% adulterated olive oils, except perhaps the mixture <strong>of</strong>olive oil with sunflower. These data clearly show that thismethodology <strong>and</strong> the selected variables are able to detectadulteration as low as 5%.The selection <strong>of</strong> 38 samples <strong>of</strong> virgin olive oil <strong>of</strong> the 56originally used for the classification <strong>of</strong> edible oils was dictated<strong>by</strong> the freshness <strong>of</strong> olive oils as reflected <strong>by</strong> their D values.Previous studies (20-22) have demonstrated that fresh virginolive oils extracted from olives <strong>of</strong> normal ripeness are characterized<strong>by</strong> high values <strong>of</strong> the D ratio, which subsequently decreaseupon storage due to the isomerization <strong>of</strong> 1,2-diglycerides to 1,3-diglycerides. Although some other factors (olive variety, climaticconditions, fruit ripeness, <strong>and</strong> extraction methods) may play arole in determining the diglyceride content <strong>of</strong> olive oil, virginolive oils freshly extracted from olives <strong>of</strong> normal ripeness shouldhave high D ratios close to 1. In this respect, the virgin oliveoil samples with D g 0.90 were chosen for adulteration studies.Inclusion <strong>of</strong> olive oil samples with D ratios
5722 J. Agric. Food Chem., Vol. 51, No. 19, 2003 Vigli et al.(18) Zamora, R.; Gomez, G.; Dobarganes, M. C.; Hidalgo, F. J. Oilfractionation as a preliminary step in the characterization <strong>of</strong>vegetable oils <strong>by</strong> high-resolution 13 C <strong>NMR</strong> spectroscopy. J. Am.Oil Chem. Soc. 2002, 79, 261-266.(19) Spyros, A.; Dais, P. Application <strong>of</strong> 31 P <strong>NMR</strong> spectroscopy infood analysis. I. Quantitative determination <strong>of</strong> the mono- <strong>and</strong>diglyceride composition <strong>of</strong> olive oils. J. Agric. Food Chem. 2000,48, 802-805.(20) Fronimaki, P.; Spyros, A.; Christophoridou, S.; Dais, P. Determination<strong>of</strong> the diglyceride content in Greek virgin olive oils<strong>and</strong> some commercial olive oils <strong>by</strong> employing P31 <strong>NMR</strong>spectroscopy. J. Agric. Food Chem. 2002, 50, 2207-2213.(21) Perez-Camino, M. C.; Modera, W.; Cert, A. Effects <strong>of</strong> olive oilfruit quality <strong>and</strong> oil storage practices on the diacylglycerolscontent <strong>of</strong> virgin olive oils. J. Agric. Food Chem. 2001, 49, 699-704.(22) Mariani, C.; Fedeli, E. Determinazione delle forme gliceridichepresenti negli oli alimentary. Nota I: caso dell′ olio di oliva.RiV. Ital. Sostanze Grasse 1985, 62, 3-7.(23) European Communities. Regulation 2568/91. Off. J. Eur. Communities1991, L 248.(24) International Olive Oil Council. COI/T.15/NC n. 2/rev. 4 (June6), Madrid, 1996.(25) Zwierzak A. Cyclic organophosphorus compounds. I. Synthesis<strong>and</strong> infrared spectral studies <strong>of</strong> cyclic hydrogen phosphites <strong>and</strong>thiophosphites. Can J. Chem. 1967, 45, 2501-2512.(26) Christ<strong>of</strong>oridou, S.; Spyros, A.; Dais, P. 31 P Nuclear MagneticResonance Spectroscopy <strong>of</strong> Polyphenol-Containing Olive OilModel Compounds, Phosphorous, Sulfur Silicon Relat. Elem.2001, 170, 139-157.(27) Sacchi, R.; Patumi, M.; Fontanazza, G; Barone, P.; Fiordiponti,P.; Mannina, L.; Rossi, E.; Segre, A. A high field 1 H nuclearmagnetic resonance study <strong>of</strong> the minor components in virginolive oils. J. Am. Oil Chem. Soc. 1996, 73, 747-758.Received for review February 12, 2003. Revised manuscript receivedJune 23, 2003. Accepted June 23, 2003. We thank the Greek Ministry<strong>of</strong> Education for financial support through the B’ EPEAEK GraduateProgram.JF030100Z