Real Estate Brokers: Do they inflate housing prices? - CEREG
Real Estate Brokers: Do they inflate housing prices? - CEREG
Real Estate Brokers: Do they inflate housing prices? - CEREG

Create successful ePaper yourself
Turn your PDF publications into a flip-book with our unique Google optimized e-Paper software.
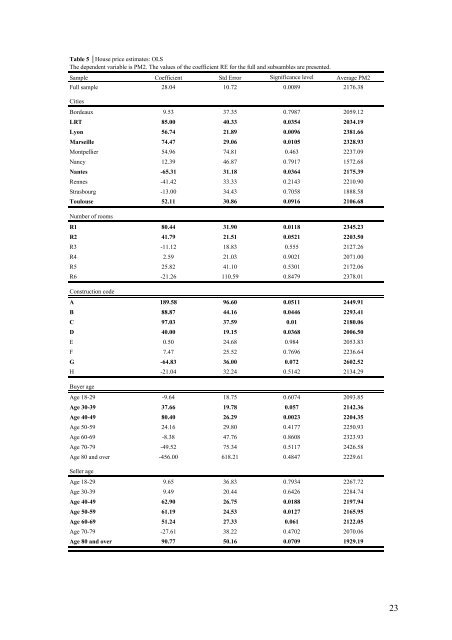
Table 5 │House price estimates: OLSThe dependent variable is PM2. The values of the coefficient RE for the full and subsambles are presented.Sample Coefficient Std Error Significance level Average PM2Full sample 28.04 10.72 0.0089 2176.38CitiesBordeaux 9.53 37.35 0.7987 2059.12LRT 85.00 40.33 0.0354 2034.19Lyon 56.74 21.89 0.0096 2381.66Marseille 74.47 29.06 0.0105 2328.93Montpellier 54.96 74.81 0.463 2237.09Nancy 12.39 46.87 0.7917 1572.68Nantes -65.31 31.18 0.0364 2175.39Rennes -41.42 33.33 0.2143 2210.90Strasbourg -13.00 34.43 0.7058 1888.58Toulouse 52.11 30.86 0.0916 2106.68Number of roomsR1 80.44 31.90 0.0118 2345.23R2 41.79 21.51 0.0521 2203.50R3 -11.12 18.83 0.555 2127.26R4 2.59 21.03 0.9021 2071.00R5 25.82 41.10 0.5301 2172.06R6 -21.26 110.59 0.8479 2378.01Construction codeA 189.58 96.60 0.0511 2449.91B 88.87 44.16 0.0446 2293.41C 97.03 37.59 0.01 2180.06D 40.00 19.15 0.0368 2006.50E 0.50 24.68 0.984 2053.83F 7.47 25.52 0.7696 2236.64G -64.83 36.00 0.072 2602.52H -21.04 32.24 0.5142 2134.29Buyer ageAge 18-29 -9.64 18.75 0.6074 2093.85Age 30-39 37.66 19.78 0.057 2142.36Age 40-49 80.40 26.29 0.0023 2204.35Age 50-59 24.16 29.80 0.4177 2250.93Age 60-69 -8.38 47.76 0.8608 2323.93Age 70-79 -49.52 75.34 0.5117 2426.58Age 80 and over -456.00 618.21 0.4847 2229.61Seller ageAge 18-29 9.65 36.83 0.7934 2267.72Age 30-39 9.49 20.44 0.6426 2284.74Age 40-49 62.90 26.75 0.0188 2197.94Age 50-59 61.19 24.53 0.0127 2165.95Age 60-69 51.24 27.33 0.061 2122.05Age 70-79 -27.61 38.22 0.4702 2070.06Age 80 and over 90.77 50.16 0.0709 1929.1923


![& 6 ] ^ F ]^ - CEREG - Université Paris-Dauphine](https://img.yumpu.com/33326502/1/184x260/-6-f-cereg-universitac-paris-dauphine.jpg?quality=85)