Sophisticated peak-based fraction collection – working with up and ...
Sophisticated peak-based fraction collection – working with up and ...
Sophisticated peak-based fraction collection – working with up and ...

Create successful ePaper yourself
Turn your PDF publications into a flip-book with our unique Google optimized e-Paper software.
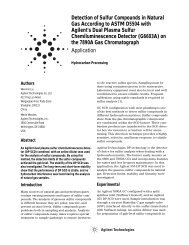
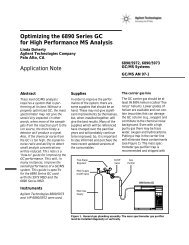
1. Fraction triggering decisionsUp <strong>and</strong> down slopeWhat is <strong>up</strong> <strong>and</strong> down slope?The slope is the first derivative ofthe signal as shown in figure 1.The slope value equals zero at thebaseline, rises to a maximumvalue at the first inflexion point,becomes zero at the <strong>peak</strong> apex,falls to a negative maximum at thesecond inflexion point <strong>and</strong>becomes zero again at the baselineafter the <strong>peak</strong>.Tip:Peak start <strong>and</strong> stop can only betriggered using <strong>up</strong> <strong>and</strong> downslope between the baseline <strong>and</strong>the inflexion points because atthe inflexion points the slopereaches its positive or negativemaximum. Also, always keep inmind that the slope maximum ofthe <strong>peak</strong>s strongly depends on the<strong>peak</strong> intensities.Fraction triggering decisionwhen using <strong>up</strong> <strong>and</strong> down slopeFigure 2 shows how the <strong>up</strong> <strong>and</strong>down slope set-<strong>up</strong> values are usedto decide whether a <strong>peak</strong> start orstop is triggered. To trigger a <strong>peak</strong>start the slope simply has to riseabove the value entered for <strong>up</strong>slope. As soon as a <strong>peak</strong> start isfound the system expects to find a<strong>peak</strong> stop. To find a <strong>peak</strong> stop theslope must first fall below the negativevalue of the down slopeentered <strong>and</strong> as soon as it risesagain above the negative value the<strong>peak</strong> stop is triggered. While <strong>fraction</strong>triggering on slope-only ispossible it can also be combined<strong>with</strong> the threshold using the WorkingMode Threshold/Slope in theAgilent ChemStation. Figure 3shows a chromatogram <strong>with</strong> thestart <strong>and</strong> stop tick marks for thecollected <strong>fraction</strong>s. The start of a<strong>fraction</strong> is triggered when the set<strong>up</strong> values for threshold <strong>and</strong> <strong>up</strong>slope are exceeded (tick mark 1).A <strong>peak</strong> stop is triggered when thesignal falls either below the0Up slopeFigure 1The slope is the first derivative of a <strong>peak</strong>0Up slopeStartFigure 2Using <strong>up</strong> <strong>and</strong> down slope values for <strong>fraction</strong> triggering2σ4σthreshold or meets the downslope criteria. At tick mark 2 the<strong>fraction</strong> was stopped since thedown slope criteria was metbecause the slope equals zero atthe local minimum. The thresholdwas still exceeded at this point.Down slopeInflexionpointStop1 st derivativeChromatogramDown slope(negative value!)3
terminated. Since the <strong>fraction</strong> triggeringparameters are activatedagain immediately after the maximum<strong>peak</strong> duration was exceededthis feature should not be usedwhen triggering on threshold only.If the end of the <strong>fraction</strong> couldnot be found when collecting onthreshold only indicates, that thesignal did not fall back below thespecified threshold. If the maximum<strong>peak</strong> duration terminatesthe <strong>fraction</strong> but the signal is stillabove the threshold means, thatthe <strong>collection</strong> of the next <strong>fraction</strong>starts immediately. To avoid this itis recommended to set MaximumPeak Duration to a relatively highvalue for <strong>fraction</strong> <strong>collection</strong> onthreshold only.Tip:When Threshold only was selectedas Working Mode for <strong>fraction</strong> <strong>collection</strong>the Maximum Peak Durationshould be set to a high value,for example the run time.Fraction preview toolThe <strong>fraction</strong> preview tool (figure 5)can be used to determine the optimal<strong>fraction</strong> <strong>collection</strong> parametersfor repetitive purification runs<strong>and</strong> to simulate <strong>fraction</strong> <strong>collection</strong>using these parameters. Afterloading a signal the <strong>fraction</strong> <strong>collection</strong>parameters threshold, <strong>up</strong><strong>and</strong> down slope, <strong>up</strong>per threshold<strong>and</strong> maximum <strong>peak</strong> duration canbe applied to the signal <strong>and</strong> theresulting <strong>fraction</strong> <strong>collection</strong> is displayed.With the buttons on theright h<strong>and</strong> side of the screen, severalcursors for <strong>up</strong> slope, downslope, <strong>up</strong>per threshold <strong>and</strong> threshold(from top to bottom) can beactivated <strong>and</strong> moved through theFigure 5Fraction preview toolchromatogram (black line at 1.20min). When moving the cursorthrough the chromatogram thevalue of the selected parameter isalso displayed at the bottom of thewindow. When the cursoris set to a specific point in thechromatogram a left-click <strong>with</strong> themouse copies the value at thispoint into the parameter sectionof the <strong>peak</strong> detector. While the<strong>fraction</strong> preview tool can be usedto optimize <strong>fraction</strong> <strong>collection</strong>parameter settings for repetitivepurification runs it can also beused to get familiar <strong>with</strong> the<strong>fraction</strong> <strong>collection</strong> parametersthreshold, <strong>up</strong> <strong>and</strong> down slope<strong>and</strong> <strong>up</strong>per threshold.2. ApplicationsSeparation of steep <strong>and</strong> shallow<strong>peak</strong>sBy using <strong>up</strong> <strong>and</strong> down slope it ispossible to separate steep <strong>peak</strong>sfrom shallow <strong>peak</strong>s. Figure 6shows that it is easy to separatesteeper <strong>peak</strong>s from more shallow<strong>peak</strong>s. To to do this the <strong>up</strong> <strong>and</strong>down slope values have to beknown before starting <strong>fraction</strong><strong>collection</strong>. This is only possible ifa pilot run is available. In manypurification applications, especiallyin the drug discovery phase, thisis not the case. Due to the largenumber of samples a genericmethod has to be set <strong>up</strong>. Optimum5
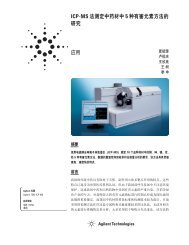
<strong>peak</strong> tail. This means that <strong>with</strong>the same values for <strong>up</strong> <strong>and</strong> downslope it can happen that a startcriteria for a <strong>peak</strong> was foundbut no stop criterion (figure 8a).Using a lower value for downslope than for <strong>up</strong> slope led to aproper <strong>collection</strong> of the two<strong>peak</strong>s at about 6.5 <strong>and</strong> 8 minutes(figure 8b).Tip:The down slope value should beset to a lower value then the <strong>up</strong>slope value. Most <strong>peak</strong>s are tailing<strong>and</strong> <strong>with</strong> identical <strong>up</strong> <strong>and</strong>down slope values a <strong>peak</strong> stopmay not be found.a) Absorbanceb)[mAU]Stop/startbecause wellwas full2000150010005000No stopfoundStopfound5.5 6.5 7.5 8.5 9.5Time [min]Absorbance[mAU]150010005000Stopfound5.5 6.5 7.5 8.5 9.5Time [min]Separation of non-baselineseparated <strong>peak</strong>sIf two <strong>peak</strong>s are not baseline-separatedthere are a few strategiesto collect the two compounds asseparate <strong>fraction</strong>s, usually <strong>with</strong>good recovery <strong>and</strong> purity 4 . One is<strong>peak</strong>-<strong>based</strong> <strong>fraction</strong> <strong>collection</strong>using <strong>up</strong> <strong>and</strong> down slope. Sincethe slope in the minimumbetween the <strong>peak</strong>s equals zero the<strong>peak</strong>s can be split into two <strong>fraction</strong>seven if the signal does notfall below the threshold value byusing a minimum down slopevalue of 1 mAU/s or even lower(figure 9). This means the <strong>peak</strong>stop criterion is found almost atthe valley point <strong>and</strong> the start ofthe next <strong>fraction</strong> is found immediatelyafterwards. However, ittakes some time for the <strong>fraction</strong><strong>collection</strong> needle to move to thenext position, which leads to thegap between the stop <strong>and</strong> starttick marks in figure 9. As a result<strong>fraction</strong> one contains someamount of the second compoundwhile in the second <strong>fraction</strong> someFigure 8a) Up <strong>and</strong> down slope: 100 mAU/s, b) Up slope: 100 mAU/s, down slope 1 mAU/sAbsorbance[mAU]100080060040020003 3.5 4 4.5 5 5.5 6 6.5Figure 9Up <strong>and</strong> down slope: 1 mAU/s,Time [min]7
ConclusionIn this Application Note weexplained what <strong>up</strong> <strong>and</strong> downslope is <strong>and</strong> how it is used totrigger <strong>fraction</strong>s in <strong>peak</strong>-<strong>based</strong><strong>fraction</strong> <strong>collection</strong>. We alsoshowed the advantages of beingable to specify two parameters, <strong>up</strong><strong>and</strong> down slope, rather than only asingle slope parameter. For manyapplications <strong>peak</strong>-<strong>based</strong> <strong>fraction</strong><strong>collection</strong> <strong>based</strong> on threshold onlyis sufficient, however, we alsoshowed some application examplesthat also require <strong>up</strong> <strong>and</strong> downslope. Examples are separation ofsteep <strong>and</strong> shallow <strong>peak</strong>s, separationof compounds showing nonbaselineseparated <strong>peak</strong>s <strong>and</strong>purification of compounds fromchromatograms <strong>with</strong> drifting baseline.We also explained how thetriggering of unwanted <strong>fraction</strong>sfor a <strong>peak</strong> in the detector saturationcan be avoided using the<strong>up</strong>per threshold parameter. Tosimulate a <strong>fraction</strong> <strong>collection</strong> runor to get familiar <strong>with</strong> parametersettings for threshold, <strong>up</strong> <strong>and</strong>down slope, <strong>up</strong>per threshold <strong>and</strong>the maximum <strong>peak</strong> duration the<strong>fraction</strong> preview tool wasdescribed. For those <strong>and</strong> all otherapplications requiring additional<strong>peak</strong> detection criteria <strong>up</strong> <strong>and</strong>down slope offers the possibilityof sophisticated <strong>peak</strong>-<strong>based</strong> <strong>fraction</strong><strong>collection</strong> <strong>with</strong> the Agilent1100 Series purificationsystem.10
References1.“New dimensions for HPLC applications”,Agilent TechnologiesBrochure, publication number5988-6707EN, 2002.2.“Fluorescence-<strong>based</strong> isolation offormononetin from red cloverextract <strong>with</strong> the Agilent 1100Series purification system”,Agilent Technologies ApplicationNote, publication number5988-5749EN, 2002.3.“Peak-<strong>based</strong> <strong>fraction</strong> <strong>collection</strong>using an evaporative light scatteringdetector <strong>with</strong> the Agilent 1100Series purification system”, AgilentTechnologies ApplicationNote, publication number5988-5816EN, 2002.4.“Strategies for purification of compoundsfrom non-baseline separated<strong>peak</strong>s”, Agilent TechnologiesApplication Note, publicationnumber 5988-7460EN,2002.11
Udo Huber is ApplicationChemist at Agilent Technologies,Waldbronn, Germany.www.agilent.com/chem/purification© 2004 - 2010 Agilent TechnologiesPublished June 15, 2010Publication Number 5989-0511EN