2.etapa atskaite - Elektronikas un datorzinÄtÅu institÅ«ts
2.etapa atskaite - Elektronikas un datorzinÄtÅu institÅ«ts
2.etapa atskaite - Elektronikas un datorzinÄtÅu institÅ«ts

You also want an ePaper? Increase the reach of your titles
YUMPU automatically turns print PDFs into web optimized ePapers that Google loves.
Valsts pētījumu programma“Informācijas tehnoloģiju zinātniskā bāze”Projekta Nr.3“Oriģinālu signālu apstrādes paņēmienu izveide <strong>un</strong>izpētekonkurētspējīgu IT tehnoloģiju radīšanai”INFORMATĪVĀ ATSKAITEPAR PROJEKTA OTRĀ ETAPA REALIZĀCIJU(2006. gada aprīlis - jūnijs)Atskaite sagatavota: 30.06.2006IZPILDĪTĀJA līguma uzskaites Nr. 1-23/36PASŪTĪTĀJA līguma uzskaites Nr. 1-23/36Programmas koordinators: Dr.habil.sc.comp. I. Biļinskis, Valsts aģentūra„<strong>Elektronikas</strong> <strong>un</strong> datorzinātņu institūts”Projekta vadītājs: Dr. sc. comp. M. Greitāns, Valsts aģentūra „<strong>Elektronikas</strong> <strong>un</strong>datorzinātņu institūts”Rīga - 2006
“Oriģinālu signālu apstrādes paņēmienu izveide <strong>un</strong> izpēte konkurētspējīgu IT tehnoloģiju radīšanai”SatursPROJEKTA OTRĀ ETAPA IZPILDES PAMATOJUMS UN KOPSAVILKUMS...................................... 4IEVADS................................................................................................................................................................. 91. LĪMEŅU-ŠĶĒRSOJUMA ANALOGS-CIPARU PĀRVEIDOTĀJU ĪPAŠĪBU ANALĪZE .................. 101.1. SIGNĀLS-KVANTĒŠANAS TROKSNIS ATTIECĪBA.................................................................................. 101.2. NOLAŠU BLĪVUMS.............................................................................................................................. 121.3. DISKRETIZĀCIJAS LAIKA INTERVĀLI .................................................................................................. 132. SIGNĀLA REKONSTRUKCIJA NO LĪMEŅU ŠĶĒRSOJUMA NOTIKUMA NOLASĒM ............... 152.1. EKSISTĒJOŠO METOŽU IZPĒTE, TO TRŪKUMI UN PRIEKŠROCĪBAS........................................................ 152.2. SINC FUNKCIJAS PARAMETRU ADAPTĀCIJA ATBILSTOŠI LOKĀLAM NOLAŠU BLĪVUMAM .................... 172.3. METOŽU DARBĪBAS MODELĒŠANA UN SALĪDZINOŠĀ ANALĪZE ........................................................... 193. NESTACIONĀRU SIGNĀLU APSTRĀDES BEZTAKTĒTĀJA SISTĒMAS MODELĒŠANA .......... 223.1. NESTACIONĀRU SIGNĀLU ANALOGS-CIPARU PĀRVEIDOŠANA IZMANTOJOT LĪMEŅU-ŠĶĒRSOJUMAPRINCIPU .......................................................................................................................................................... 223.2. LAIKA-FREKVENČU REPREZENTĀCIJU MODELĒŠANA ......................................................................... 233.2.1. Īssintervāla Furjē transformācijas pieeja................................................................................. 233.2.2. Vilnīša analīzes pieeja .............................................................................................................. 253.2.3. Vignera sadalījuma f<strong>un</strong>kcija ..................................................................................................... 264. DFT-VEIDA PĀRVEIDOJUMU IZSTRĀDE, KAS ATBILST UN ŅEM VĒRĀ AR LŠ-ACP IEGŪTOLAIKĀ NEVIENMĒRĪGO NOLAŠU SPECIFIKU....................................................................................... 294. 1. VISPĀRINĀTĀ DFT IZTEIKSME.......................................................................................................... 294.2. DFT UZLABOJUMS AR SIGNĀLA NOLAŠU INTERPOLĀCIJAS PALĪDZĪBU............................................... 314.3. DFT UZLABOJUMS AR ATJAUNOŠANAS KĻŪDAS NOLAŠU INTERPOLĀCIJAS PALĪDZĪBU. ..................... 334.4. UZLABOTO DFT-VEIDĪGO PĀRVEIDOJUMU MODELĒŠANAS REZULTĀTI. ............................................ 345. DASP VIRTUĀLO INSTRUMENTU ATTĪSTĪŠANA IZMANTOJOT MODIFICĒTOSALGORITMUS.................................................................................................................................................. 355.1. PLATJOSLĪGA UN PLAŠA DINAMISKĀ DIAPAZONA CIPAROTĀJA VADĪBA LABVIEW VIDĒ................... 355.2. JAUNRADĪTO SIGNĀLU APSTRĀDES ALGORITMU IMPLEMENTĀCIJA LABVIEW.................................. 365.3. GRAFISKO LIETOTĀJU INTERFEISU IZVEIDE....................................................................................... 376. ASINHRONO MIKROPROCESORU PIELIETOJAMĪBA AR BEZTAKTĒTĀJA ANALOGS-CIPARU PĀRVEIDOTĀJU IEGŪTU DATU ENERGO-EKONOMISKAI APSTRĀDEI........................ 386.1 ENERĢIJAS PATĒRIŅA MINIMIZĀCIJAS MODEĻI.................................................................................... 386.2 ASINHRONĀ PROCESORA ENERĢIJAS TAUPĪBAS IESPĒJAS.................................................................... 396.3 ASINHRONO PROCESORU RAKSTUROJUMI UN LIETOJUMS.................................................................... 407. PĒTĪJUMI DATU APSTRĀDES SISTĒMU REALIZĀCIJAI BEZTAKTĒTĀJA ELEKTRONISKĀSIEKĀRTĀS......................................................................................................................................................... 427.1 TRANSFORMĀCIJU AR TAISNSTŪRA FUNKCIJĀM PIELIETOJUMS........................................................... 427.2 GSM SIGNĀLU APSTRĀDES BEZTAKTĒTĀJA SISTĒMAS MODELIS......................................................... 45IZMANTOTĀS LITERATŪRAS SARAKSTS............................................................................................... 481. PIELIKUMS. PUBLIKĀCIJA ŽURNĀLĀ „ELECTRONICS AND ELECTRICAL ENGINEERING”, ISSN 1392-1215, NO. 4(68), 2006, M. GREITANS, I. HOMJAKOVS, ENHANCED DIGITAL SIGNAL PROCESSING OF SIGNAL-DEPENDENTLYSAMPLED SIGNALS.2. PIELIKUMS. PUBLIKĀCIJA ŽURNĀLĀ „ELECTRONICS AND ELECTRICAL ENGINEERING”, ISSN 1392-1215, NO. 4(68), 2006, A. BAUMS, ENERGY CONSUMPTION OPTIMISATION IN HARD REAL-TIME SYSTEM CMOS PROCESSORS.3. PIELIKUMS. PREZENTĀCIJA KONFERENCĒ „ELECTRONICS'2006, THE 10 TH INTERNATIONAL CONFERENCE.KAUNAS UNIVERSITY OF TECHNOLOGY, MAY 24, 2006” M. GREITANS, M.KALBERGS, ABILITIES ANDAPPLICATION OF LEVEL-CROSSING SAMPLING IN DIGITAL SIGNAL PROCESSING.2
“Oriģinālu signālu apstrādes paņēmienu izveide <strong>un</strong> izpēte konkurētspējīgu IT tehnoloģiju radīšanai”4. PIELIKUMS. PUBLIKĀCIJA KONFERENCES RAKSTOS, INTERNATIONAL REMOTE ENGINEERING VIRTUALINSTRUMENT SYMPOSIUM, „REV2006”, 29-30 JUNE 2006, MARIBOR, SLOVENIA. M. GREITANS, VIRTUALINSTRUMENTATION IN AN EXTENDED FREQUENCY RANGE USING DIGITAL ALIAS-FREE SIGNAL PROCESSING.5. PIELIKUMS. PUBLIKĀCIJA KONFERENCES RAKSTOS, INTERNATIONAL CONFERECE ON SIGNAL PROCESSING ANDMULTIMEDIA APPLICATIONS, „SIGMAP2006” M. GREITANS. PROCESSING OF NON-STATIONARY SIGNALUSING LEVEL-CROSSING SAMPLING6. PIELIKUMS. MAĢISTRA DARBA ANOTĀCIJA. R. ŠĀVELIS „SIGNĀLA LAIKFORMAS ATJAUNOŠANA NO LĪMEŅUŠĶĒRSOJUMA NOTIKUMU NOLASĒM”.7. PIELIKUMS. IZSTRĀDĀTĀS DATORPROGRAMAS.A LĪMEŅU-ŠĶĒRSOJUMA ANALOGS-CIPARU PĀRVEIDOTĀJU ĪPAŠĪBU ANALĪZEI..B SIGNĀLA REKONSTRUKCIJAI NO LĪMEŅU ŠĶĒRSOJUMA NOTIKUMA NOLASĒM.C NESTACIONĀRU SIGNĀLU APSTRĀDES BEZ TAKTĒTĀJA SISTĒMAS MODELĒŠANAI..D IZSTRĀDĀTO DFT – VEIDĪGO PĀRVEIDOJUMU MODELĒŠANAI.E PĒTĪJUMIEM DATU APSTRĀDES SISTĒMU REALIZĀCIJAI BEZTAKTĒTĀJA ELEKTRONISKĀS IEKĀRTĀS.3
“Oriģinālu signālu apstrādes paņēmienu izveide <strong>un</strong> izpēte konkurētspējīgu IT tehnoloģiju radīšanai”Projekta otrā etapa izpildes pamatojums <strong>un</strong> kopsavilkumsValsts pētījumu programmas mērķis ir veidot Latvijas informātikas industrijas zinātniskobāzi, dot būtisku ieguldījumu (pētījumus <strong>un</strong> izstrādes) ja<strong>un</strong>āko informācijas tehnoloģijuradīšanā, attīstībā <strong>un</strong> piemērošanā Latvijas vajadzībām, sagatavot augstākās kvalifikācijasspeciālistus <strong>un</strong> iepludināt tos Latvijas IT darba tirgū, kāpināt Latvijas IT industrijaskonkurētspēju pasaules tirgū, izstrādāt valsts nozīmes informatizācijas projektu zinātniskopamatu būtisku tautsaimniecības problēmu risināšanai, palielināt Latvijas zinātniekukonkurētspēju ES projektu izcīnīšanā IT jomā.Projekta mērķis ir oriģinālu signālu diskrētās apstrādes paņēmienu izveide <strong>un</strong> to darbībasizpēte, kas integrācijā ar modernām elektroniskām tehnoloģijām dod iespējas rast aktuālu ITproblēmu risinājumus <strong>un</strong> ļauj veidot uz zinātņu ietilpības rēķina konkurētspējīgaselektroniskās iekārtas.Projekta 2. etapa „Darba uzdevumā” definētie uzdevumi:1. Līmeņu-šķērsojumu analogs-ciparu pārveidotāju (LŠ-ACP) īpašību analīze, <strong>un</strong> šādā veidāpārveidotu signālu rekonstrukcijas paņēmienu izstrāde.2. Nestacionāru signālu apstrādes beztaktētāja sistēmas modeļa izveide, <strong>un</strong> iegūto ciparusignālu laika-frekvenču raksturošanas datorprogrammu izveide.3. DASP teorijas <strong>un</strong> uz tās bāzes veidotu virtuālo instrumentu attīstīšana, radot DFT-veidīguspārveidojumus, kas atbilstu <strong>un</strong> ņemtu vērā neregulāri izvietotas nolases (tajā skaitā iegūtas arlīmeņu-šķērsošanas diskretizāciju).4. Ja<strong>un</strong>radīto datu apstrādes paņēmienu realizācijas asinhronās elektronikas sistēmās <strong>un</strong>/vaimikroprocesoros iespēju izpēte.5. Izpildes laikā iegūtos rezultātus prezentēt starptautiskās zinātniskās konferencēs <strong>un</strong>publicēt LZP sarakstā iekļautajos zinātniskajos žurnālos (izdevumos).Projekta 2. etapa definēto uzdevumu izpildes rezultāti:1. Paveiktos darbus <strong>un</strong> 1.uzdevuma izpildes rezultātus nosacīti var iedalīt divās grupās:1) līmeņu-šķērsojuma analogs-ciparu pārveidotāja īpašības; 2) rekonstrukcija no signālanolasēm, kas iegūtas ar šāda veida ACP. Attiecībā uz pirmo daļu ir veikta līmeņu-šķērsojumaACP īpašību padziļināta analīze. Parādīts, kādā veidā šāda tipa pārveidojuma signāls-(kvantēšanas)troksnis attiecība ir atkarīga no ieejas signāla statistiskajiem parametriem <strong>un</strong> nolīmeņu-šķērsojuma laika momentu fiksēšanas precizitātes, kuru uzlabojot iespējams attiecīgipalielināt sasniedzamo SkTA. Iegūtas izteiksmes, kas saista līmeņu-šķērsojuma ACP veidotonolašu blīvumu ar signāla spektrālajām īpašībām divu veida signālu gadījumos: sinusoidālssignāls, frekvenču joslā ierobežots Gausa troksnis ar konstantu jaudas spektrālo blīvumu.Parādītas iespējas novērtēt laika intervālus starp signāla nolasēm sinusoidālam signālam <strong>un</strong>laika intervālu robežas vispārīga signāla gadījumā. Iegūtie rezultāti prezentēti konferencē“Electronics'2006” (Kauņa, Lietuva), izmantoti publikācijai, kas akceptēta prezentācijaikonferencē „Signal processing and multimedia applications SIGMAP'06” (Setubala,Portugāle). To zinātniskā <strong>un</strong> tautsaimnieciskā nozīmība raksturojas ar faktu, ka iepazīstot <strong>un</strong>apzinot LŠ-ACP īpašības, tiek palielināta to praktisko pielietojumu iespējamība, kas nozīmēbūtisku soli uz beztaktētāja elektronisko risinājumu veidošanu.Attiecībā uz 1. uzdevuma otro daļu ir izpētītas signāla rekonstrukcijas iespējas no tā līmeņušķērsojuma notikuma nolasēm. Aplūkota <strong>un</strong> modelēta (izstrādāta datorprogrammu kopa)literatūrā atrodamo (sinc, splainu <strong>un</strong> dažāda paveida iteratīvo (Voronova, lineārā, Marvasti,adaptīvo svaru)) metožu, kas radītas apzināti neregulāri diskretizētu signālu atja<strong>un</strong>ošanai,darbība. Piedāvātas oriģinālas rekonstrukcijas metodes, kas signāla atja<strong>un</strong>ošanu veic aruzlabotu sinc-f<strong>un</strong>kciju palīdzību, kuru parametri (amplitūda, nobīde <strong>un</strong> mērogošana) tiekadaptēti lokāliem signāla līmeņu šķērsojuma notikumu laika momentiem. Apskatīti divigadījumi – atja<strong>un</strong>ojošās f<strong>un</strong>kcijas tiek veidotas kā simetriskas <strong>un</strong> kā asimetriskas. Ja<strong>un</strong>radītāsmetodes ir pielāgotas specifiskajam ar LŠ-ACP neregulāri iegūto nolašu apstrādes gadījumam<strong>un</strong> ļauj uzlabot signālu rekonstrukcijas kvalitāti. Iegūtie rezultāti izmantoti R. Šāveļa maģistra4
“Oriģinālu signālu apstrādes paņēmienu izveide <strong>un</strong> izpēte konkurētspējīgu IT tehnoloģiju radīšanai”darbā, kas RTU ETF tika aizstāvēts ar vērtējumu “teicami”. Izpildītā uzdevuma zinātniskā <strong>un</strong>tautsaimnieciskā nozīmība pamatojas ar to, ka signāla rekonstrukcija ir viens no pašiemf<strong>un</strong>damentālākiem uzdevumiem signālu apstrādē, jo pēc korektas signālu rekonstrukcijas iriespējams analīzei pielietot praktiski visus citus zināmos paņēmienus. Piemēram, konkrētāgadījumā ir iespējams LŠ-ACP nevienmērīgi izvietotās nolases transformēt uz klasisko ACPnolašu kopu, <strong>un</strong> tad veikt apstrādi ar zināmām, vienmērīgai diskretizācijai pielietojamāmmetodēm.2. Izmantojot 1. etapā uzsāktās iestrādes nevienmērīgi diskretizētu nestacionāru signāluapstrādē, ir izveidots beztaktētāja sistēmas modelis nestacionāru signālu apstrādei, kas balstāsuz līmeņu-šķērsojuma analogs-ciparu pārveidojuma principu datu ieguvei. Radītadatorprogrammu kopa, kas modelē trīs populārāko nestacionāru signālu analīzes pieeju(īssintervāla Furjē transformācijas, vilnīšanalīzes <strong>un</strong> Vignera sadalījuma) darbību, <strong>un</strong> veiktipētījumi to pielietojamībai līmeņu-šķērsojuma nolašu apstrādei. Iegūti rezultāti, kas parādakatra paņēmiena priekšrocības <strong>un</strong> trūkumus, tādejādi norādot virzienus turpmākiempētījumiem. Uzsāktas iestrādes oriģinālu paņēmienu izveidei, kas ļautu Vignera sadalījumapieeju izmantot LŠ-ACP datu laika-frekvenču reprezentāciju iegūšanai, jo tiešā veidā šīpieeja ir izmantojama tikai vienmērīgi diskretizētiem signāliem, <strong>un</strong> literatūrā līdz šim navatrodami tās paplašināšanas veidi arī nevienmērīgas diskretizācijas gadījumam. Iegūtierezultāti izmantoti publikācijas sagatavošanai, kura akceptēta prezentācijai konferencē„Signal processing and multimedia applications SIGMAP'06” (Setubal, Portugāle). Tozinātnisko <strong>un</strong> praktisko nozīmību nosaka fakts, ka reālas dabas, piemēram, multimedijusignāli pēc savas būtības ir nestacionāri. No tautsaimniecības viedokļa nozīmība ir potenciālāmultimediju iekārtu izstrādē, tajā skaitā SoC (System on chip) tehnoloģijā, kuras spētuizmantot asinhrono elektronisko sistēmu priekšrocības.3. Paveiktos darbus <strong>un</strong> iegūtos rezultātus 3. uzdevuma izpildē nosacīti var iedalīt divāsgrupās. Pirmā attiecas uz DASP virtuālo instrumentu attīstīšanu, bet otrā uz uzlabotu DFTveidīgualgoritmu izstrādi, kurus perspektīvā var izmantot minētajos instrumentos. Attiecībāuz DASP teorijas balstītu virtuālo instrumentu attīstīšanu ir uzsāktas iestrādes ja<strong>un</strong>aspaaudzes DASP virtuālo instrumentu radīšanai, kas orientētos uz National Instrumentsprogrammēšanas rīka LabVIEW izmantošanu. Tā ir grafiskas programmēšanas vide, kurāveidotas instrumentu datorprogrammas gala lietotājs var viegli adaptēt <strong>un</strong> papildinātkonkrētu uzdevumu vajadzībām bez īpašām programmēšanas zināšanām. Virtuāloinstrumentu izveides sekmīgumu nosaka trīs aspekti:1) iespējas sadarbībai ar aparatūrasportiem, 2) efektīva apstrādes algoritmu implementācija <strong>un</strong> 3) ērta vide lietotāja grafiskointerfeisu radīšanai. Ir izpētītas <strong>un</strong> praktiski apgūtas iespējas LabVIEW sadarbībai arpersonālā datora aparatūras portiem <strong>un</strong> interfeisiem, izveidota programmatūra DASPciparotāja vadībai <strong>un</strong> kontrolei caur EPP interfeisu. Signālu apstrādes implementēšanai irizveidoti paņēmieni no ciparotāja nolasīto <strong>un</strong> apstrādei paredzēto datu noformēšanai masīvu<strong>un</strong> matricu struktūrās, kā arī iegūta praktiskā darba pieredze matricu <strong>un</strong>/vai masīvu algebrāformalizētu algoritmu realizācijai LabVIEW bloku diagrammās. Izmantojot LabVIEWpiedāvātās iespējas lietotāju grafisko interfeisu veidošanai, ir radīti instrumentu paneļuprototipi. Šīs uzdevuma daļas izpildes laikā iegūtie rezultāti ir prezentēti konferencē„Remote engineering and virtual instrumentation REV’06” (Maribova, Slovēnija) <strong>un</strong>publicēti konferences rakstos. To nozīmība varbūt ir mazāk zinātniska, bet ļoti vērtīga nopraktiskā pielietojuma viedokļa, jo parāda principiālās iespējas <strong>un</strong> veic iestrādes ja<strong>un</strong>aspaaudzes DASP virtuālo instrumentu veidošanai, kuru ražošana var būt interesanta LatvijasIT industrijai.Attiecībā uz 3. uzdevuma otro daļu ir izstrādāta virkne DFT-veidīgu pārveidojumu, kaspadziļināti ņem vērā signāla nevienmērīgi izvietotu nolašu laika momentus. Pārveidojumurezultāti pilnībā atbilst DFT būtībai, kas nozīmē to, ka tiem ir pielietojams inversais DFTpārveidojums signāla atja<strong>un</strong>ošanai laika prezentācijā. Piedāvāto modifikāciju pamatideja irminimizēt signāla atja<strong>un</strong>ošanas kļūdu ņemot vērā ne tikai tās vērtības signāla nolašu laika5
“Oriģinālu signālu apstrādes paņēmienu izveide <strong>un</strong> izpēte konkurētspējīgu IT tehnoloģiju radīšanai”momentos, bet arī starp tiem ar tik pat lielu svarīgumu. Lai to paveikti ir izvēlēti divirisinājuma ceļi: 1) signāla nolašu interpolācija, 2) atja<strong>un</strong>ošanas kļūdas nolašu interpolācija.Iegūtas izteiksmes gadījumiem, kad signāls tiek interpolēts ar nulltās kārtas <strong>un</strong> pirmās kārtaspolinomiem, kā arī, ja pielietota frekvenču joslā ierobežota interpolācija ar sinc f<strong>un</strong>kcijām.Kļūdas interpolācija aprakstīta gadījumiem, kad to veic ar nulltās <strong>un</strong> pirmās kārtaspolinomiem. Piedāvātie algoritmi simulēti, rezultāti apkopoti <strong>un</strong> salīdzināti, ja piedāvātieuzlabojumi ir pielietoti ar LŠ-ACP iegūtiem datiem. Iegūtie rezultāti prezentēti konferencēElectronics'2006” (Kauņa, Lietuva) <strong>un</strong> publicēti žurnālā „Electronics and ElectricalEngineering”. To zinātniskā nozīmība saistīta ar faktu, ka uzlabotās DFT-veidīgapārveidojuma izteiksmes padziļināti ņem vērā nolašu nevienmērīgumu <strong>un</strong> tādā veidākompensē neortogonalitāšu radītos artifaktus. Potenciālā tautsaimnieciskā nozīmība ir saistītaar pielietojumu apzināti <strong>un</strong>/vai neapzināti nevienmērīgi diskretizētu datu apstrādes sistēmās.4. Turpinot jau pirmajā projekta etapā iesākto darbību, kas vērsta uz ja<strong>un</strong>radīto signāluapstrādes pieeju virzību realizācijai praktiskās elektroniskās iekārtās, šajā projekta etapā irizdalījušies divi galvenie novirzieni: 1) implementācija ar <strong>un</strong>iversālu mikroprocesorupalīdzību <strong>un</strong> 2) implementācija ar specializēto mikroshēmu palīdzību. Pirmajā novirzienā irveikti darbi saistībā ar izpēti potenciāliem ieguvumiem, ko var dot asinhronomikroprocesoru izmantošana, īpašu vērtību pievēršot energo ekonomiskumam. Ir izstrādātienerģijas patēriņa minimizācijas modeļi <strong>un</strong> iegūti rezultāti, kas ļauj novērtēt, ka izmantojotasinhronu ACP <strong>un</strong> asinhronu datu apmaiņu ar mikroprocesoru ekonomija var būt aptuveni 5reizes. Ir apkopoti jau pieejamo asinhrono mikroprocesoru raksturojumi <strong>un</strong> lietojumaīpatnības, kā arī apzinātas to enerģijas patēriņa taupīšanas iespējas. Iegūtie rezultāti daļējiizmantoti publikācijai žurnālā „Electronics and Electrical Engineering” <strong>un</strong> prezentācijaikonferencē „Electronics'2006” (Kauņa, Lietuva). Paveiktais ir vēl tikai pašā sākuma fāzē <strong>un</strong>tā zinātnisko <strong>un</strong> tautsaimniecisko nozīmību vairāk rādīs darbu turpinājums nākamajosetapos. Tomēr ir jāatzīmē, ka tās potenciāls ir ārkārtīgi liels, jo var dod risinājumus kādāveidā iespējams radīt īpaši maz tērējošas iekārtas, kas ir svarīgi, gan mobilo iekārtu darbībaspaildzināšanai starp uzlādēm, gan kosmosa, gan militāros pielietojumos.Otrā novirzienā, kas saistīts ar specializēto mikroshēmu izveidi, ir turpināti pirmā etapāiesāktie pētījumi <strong>un</strong> čipu projekti, kas saistīti ar taisnstūra f<strong>un</strong>kciju pielietošanu elektroniskāaparatūrā reālā-laika apstrādes pārveidojumos. Ir apskatīts efekts, ko dod taisnstūra f<strong>un</strong>kcijusamēra veidošana pēc amplitūdā vienmērīga sadalījuma principa. Kā praktiska pielietojumapiemērs ir izveidots GSM signālu apstrādes beztaktētāja sistēmas modelis. Izveidotasdatorprogrammas, kas simulē datu bitu pārraidi. Šobrīd ir iegūti rezultāti, kas parāda sistēmasdarbību viena datu kanāla raidīšanas gadījumā bez <strong>un</strong> ar aditīva trokšņa klātbūtni. Rezultāt<strong>un</strong>ozīmība slēpjas faktā, ka šobrīdējie pētījumi ļauj izteikt pieņēmumu, ka pielietojot piedāvātosistēmas modeli būtu iespējams datu pārraidi veikt ar līdz pat vairāku simtu reižu lielākucaurlaidību, nekā to nosaka esošais GSM standarts. Tomēr, lai objektīvi novērtētu risinājumupraktisko pielietojamību ir jāveic papildus pētījumi <strong>un</strong> modelēšana, kā nākamo etapu minotvairāku kanālu vienlaicīgas darbības režīmu.5. Projekta 2. etapa darba uzdevumu izpildē iegūtie rezultāti ir izmantoti sekojošupublikāciju, maģistra darba <strong>un</strong> konferenču prezentāciju veidošanā:1. M. Greitans, I. Homjakovs, Enhanced Digital Signal Processing of Signal-DependentlySampled Signals. „ELECTRONICS AND ELECTRICAL ENGINEERING”, ISSN1392-1215, No. 4 (68), 2006 lpp. 9-14.2. A. Baums, Energy consumption Optimisation In Hard Real-Time System CMOSProcessors. „ELECTRONICS AND ELECTRICAL ENGINEERING”, ISSN 1392-1215, No. 4 (68), 2006, lpp. 19-22.3. M. Greitans, Virtual instrumentation in an extended frequency range using Digital AliasfreeSignal Processing. Proc. of International Remote Engineering Virtual InstrumentSymposium, „REV2006”, Maribor, Slovenia, 29-30. Jūnijs 2006.g. (published on CD).6
“Oriģinālu signālu apstrādes paņēmienu izveide <strong>un</strong> izpēte konkurētspējīgu IT tehnoloģiju radīšanai”4. M. Greitans. Processing of Non-Stationary Signal Using Level-Crossing Sampling.International Conferece on Signal Processing and Multimedia Applications,„SIGMAP2006” Setubal, Portugāle, 7-10. Augusts 2006.g. (akceptēts konferencei).5. R. Šāvelis, Signāla laikformas atja<strong>un</strong>ošana no līmeņu šķērsojuma notikumu nolasēm.Maģistra darbs, RTU <strong>Elektronikas</strong> <strong>un</strong> telekom<strong>un</strong>ikāciju fakultāte, Radioelektronikasinstitūts, Rīga, 2006.g., 70.lpp.6. M. Greitans, M. Kalbergs, Abilities and application of level-crossing sampling in digitalsignal processing. Prezentācija konferencē „ELECTRONICS'2006, the 10 th internationalconference”, Ka<strong>un</strong>as University of Technology, 24. Maijs, 2006.g.Kopsavilkums: Projekts ir vērsts uz ja<strong>un</strong>u signālu apstrādes paņēmienu radīšanu, kaskopā ar modernajām elektroniskām tehnoloģijām piedāvātu risinājumus uz zinātņu ietilpībasrēķina konkurētspējīgu elektronisko iekārtu ražošanai. Projekta pirmajā etapā tika uzsāktipētījumi <strong>un</strong> veiktas iestrādes, kuru pamatā ir ideja līdzšinējās zināšanas <strong>un</strong> pieredzi DASP(Digital Alias-free Signal Processing) signālu apstrādes jomā saistīt ar beztaktētājaelektronisko iekārtu projektēšanas principiem. Tika apzinātas asinhronu elektronisko sistēmupriekšrocības – pazemināts enerģijas patēriņš, samazināta siltuma izdalīšana, automātiskaadaptācija pie fizikālo apstākļu maiņas, neliels elektromagnētiskais izstarojums u.c. Taču, laisignālu apstrādes sistēmās varētu gūt labumu no šīm priekšrocībām, ir nepieciešams analogsciparupārveidojumu vadīt nevis kā klasiskajā gadījumā ar taktsimpulsiem, bet gan ar pašusignālu. Tas noved pie laikā specifiski nevienmērīgi izvietotām nolasēm <strong>un</strong> prasa radītatbilstošas apstrādes metodes. Pirmajā etapā tika aplūkoti <strong>un</strong> modelēti veidi kā beztaktētājarežīmā iespējams veikt analogs-ciparu pārveidojumus, kas otrajā etapā ir turpināts padziļinātiizpētot līmeņa-šķērsojuma diskretizācijas īpašības. Pirmajā etapā tika apzinātas iespējasiegūto signālu apstrādei pielietot esošās nevienmērīgi diskretizētu signālu apstrādei radītāsmetodes, kas otrajā etapā ir turpināts izpētot rezultātus attiecībā uz signālu rekonstrukciju. Iruzsāktas iestrādes ja<strong>un</strong>u uzlaboti paņēmienu radīšanai, kas izmantojot apgūtās LŠ-ACPīpatnības spētu uzlabot rekonstrukcijas kvalitāti. Izstrādes šajā virzienā ir plānots turpināt arīnākamos etapos. Iepriekšējā etapā notika darbs pie nevienmērīgi diskretizētu nestacionārusignālu analīzes, kas šajā etapā ir turpināts pievēršoties gadījumam, ja ciparu signāla nolasestiek iegūtas kā līmeņu šķērsojuma notikumi. Šajā jomā pētījumu turpinājums būtu saistāms arVignera sadalījuma pieejas pielietojamību nevienmērīgi diskretizētam signālam.Samērā liels akcents projekta ietvaros ir uz ja<strong>un</strong>radāmo oriģinālo ciparu signālu apstrādespaņēmienu saistību ar to realizāciju praktiskos risinājumos. Pirmajā etapā tika uzsāktasiestrādes saistībā ar taisnstūra f<strong>un</strong>kciju izmantošanu <strong>un</strong> specializētu mikroshēmuprojektēšanu. Šis novirziens ir turpināts otrajā etapā kā piemēru izvēloties GSM signālupārraides simulēšanu. Papildus tam ir uzsākta darbošanās pie cita novirziena – vispārējapielietojuma asinhronu mikroprocesoru izmantošanas. Apzināti pieejamie procesorurisinājumi <strong>un</strong> turpmākos etapos plānots tos asinhroni saistīt ar beztaktētāju ACP <strong>un</strong> šādāveidā veidot signālu apstrādes mezglus. Kā atsevišķs novirziens ir izceļams DASP virtuāloinstrumentu attīstība, kurā šajā etapā ir apgūti trīs stūrakmeņi sekmīgai virtuālo instrumenturadīšanai LabVIEW vidē: sadarbība ar aparatūras interfeisiem, signālu apstrādes algoritmurealizācija masīvu <strong>un</strong>/vai matricu formulējumā, kā ari lietotāju grafisko interfeisu izveide.Nākamajos etapos uz šo iestrāžu pamata ir plānots implementēt ja<strong>un</strong>radītos algoritmus <strong>un</strong>turpināt darbu uz praktisku instrumentu radīšanu.Konkrētais projekta otrā etapa izpildes mērķis bija pirmā etapā nosprausto ideju parasinhrono sistēmu priekšrocību <strong>un</strong> nevienmērīgi diskretizētu signālu apstrādes zināšanusakopošanu ja<strong>un</strong>u konkurētspējīgu risinājumu izveidei virzīt uz praktiski pielietojamu metožu<strong>un</strong> algoritmu, kā arī implementācijas paņēmienu veidošanu.Strādājot pie mērķa sasniegšanai nospraustajiem uzdevumiem ir iegūti sekojoši galvenierezultāti:• Iegūtas svarīgāko LŠ-ACP īpašību demonstrējošas izteiksmes,7
“Oriģinālu signālu apstrādes paņēmienu izveide <strong>un</strong> izpēte konkurētspējīgu IT tehnoloģiju radīšanai”Ievads.Šī <strong>atskaite</strong> ir veltīta projekta otrajā etapā paveiktajiem darbiem, kas ir likumsakarīgsturpinājums pirmajā etapā izvirzītām idejām ar mērķi padarīt tās tuvākas praktiskiempielietojumiem.Galvenie darbu virzieni ir saistīti ar• nolašu apstrādi, kuras iegūtas ar līmeņu šķērsojuma analogs-ciparu pārveidotāju, kāvienu no pamatlīdzekļiem datu iegūšanai priekš asinhronām sistēmām (1.nodaļa),• signālu laikformas atja<strong>un</strong>ošanu, kā vienu no f<strong>un</strong>damentālākiem uzdevumiem ciparusignālu apstrādē (2. nodaļa),• nestacionāru signālu apstrādi, jo reālie signāli pēc savas dabas tādi ir <strong>un</strong> arīsignālvadīti pārveidojumi (piem., LŠ-ACP) labi adaptējas šim nosacījumam(3. nodaļa),• DASP teorijas <strong>un</strong> paņēmienu attīstīšanu (4. nodaļa),• iestrādēm kā ja<strong>un</strong>piedāvātos signālu apstrādes paņēmienus var adaptēt praktiskiempielietojumiem trīs apakšnovirzienos:ovirtuālo instrumentu sistēmas (5. nodaļa),o iekārtu veidošana ar vispārēja pielietojuma mikroprocesoriem (6. nodaļa),o iekārtu veidošana radot specializētas mikroshēmas (7. nodaļa).9
“Oriģinālu signālu apstrādes paņēmienu izveide <strong>un</strong> izpēte konkurētspējīgu IT tehnoloģiju radīšanai”1. Līmeņu-šķērsojuma analogs-ciparu pārveidotāju īpašībuanalīzeIepriekšējā projekta etapā tika izveidots līmeņu-šķērsojošā analogs-ciparu pārveidotājamodelis MATLAB vidē. Noskaidrotas līmeņu-šķērsojošā ACP priekšrocības <strong>un</strong> trūkumisalīdzinājumā ar klasisko ACP. Turpinot iesākto darbu šai projekta etapā ir izpētītas līmeņušķērsojumaACP galvenās īpašības: signāls-kvantēšanas troksnis attiecība <strong>un</strong> kvantēšanaskļūdas sadalījums, nolašu blīvums, laika intervāli starp divām nolasēm.1.1. Signāls-kvantēšanas troksnis attiecībaKlasiskajiem ACP tiek izmantota sample-and-hold princips, pēc kura seko kvantēšanasvai noapaļošanas process. Tā kā ir ierobežots bitu skaits, tad nav iespējams izslēgtnoapaļošanas kļūdu, tāpēc klasiskajiem ACP ir ieviests jēdziens attiecība starp signāla <strong>un</strong>kvantēšanas trokšņa jaudām (Signal-to-(quantization)Noise Ratio, SNR). Klasiskiem ACPsignāls-kvantēšanas troksnis attiecību var noteikt kā [13]SNR dB= 1,76+ 6,02⋅n,(1.1)kur n – ACP bitu skaits.Kā var redzēt pēc formulas (1.1), tad klasiskajā ACP signāls-kvantēšanas troksnisattiecība ir atkarīgs tikai no ACP bitu skaita. Ja ir nepieciešams uzlabot signāls-kvantēšanastroksnis attiecību atliek tikai palielināt bitu skaitu.Līmeņu-šķērsojuma analogs-ciparu pārveidotāja gadījumā nolases tiek noteiktas tai laikamomentā, kad ieejas signāls šķērso noteiktu līmeni, tas ir, signāla amplitūda ir zināmaprecīzi. Ņemot vērā to faktu, ka nolases atrodas dažādos attālumos viena no otras, tad irnepieciešams zināt nolases laika momentus. Praksē laika momentus mēra ar taimerapalīdzību, kuram ir noteikta precizitāte T laika (Skat. zīm. 1.1).x( t)Δtl 3l 2l 1ΔutST laikaZīm. 1.1. Līmeņu-šķērsojošā ACP darbības princips.Kā var redzēt Zīm. 1.1. signāls krusto līmeni l 1 starp taimera laika momentiem, betnolasei tiek piešķirts tuvākais laika moments. Šāds algoritms noved pie laika kļūdas Δt, kā arīsignāla izmaiņas dēļ rodas amplitūdas nobīde Δu. Signāls-kvantēšanas troksnis attiecībalīmeņu-šķērsojuma ACP gadījumā ir [11]⎛ 3P⎞x1SNRdB= 10log⎜ + 20log( ),P ⎟ (1.2)⎝ x' ⎠ Tlaika10
“Oriģinālu signālu apstrādes paņēmienu izveide <strong>un</strong> izpēte konkurētspējīgu IT tehnoloģiju radīšanai”kur P x – ieejas signāla jauda, P x’ – ieejas signāla jaudas atvasinājums.No formulas var redzēt, ka signāls-kvantēšanas troksnis nav atkarīgs no bitu skaita, betgan no taimera precizitātes <strong>un</strong> ieejas signāla īpašībām. Lai uzlabotu signāls-kvantēšanastroksnis attiecību ir nepieciešams palielināt taimera precizitāti.Klasiskā ACP gadījumā līmeņu kļūdas sadalījums ir konstants, tas ir, kļūdas varbūtība irvienlīdz iespējama starp kvantēšanas līmeņiem (Skat. Zīm. 1.2 a <strong>un</strong> b).a) b)3.5Level error histogramm3.5Level error histogramm332.52.522, pts1.5, pts1.5110.50.50-q/2 0 q/210c) d)Distribution of quantization error0-q/2 0 q/212Quantization error histpts9876543211086420-q/2 0 q/2quantization error0-q/2 0 q/2quantization levelZīm. 1.2. a) klasiskā ACP līmeņu kļūdas sadalījums troksnim. b) līmeņu kļūdassadalījums sinudoidālam signālam. c) līmeņu kļūdas sadalījums trokšņveidīgam signālam,izmantojot līmeņu-šķērsojošo ACP. d) līmeņu kļūdas sadalījums sinusoidālam signālam,izmantojot līmeņu-šķērsojošo ACP.Grafiki, kas attēloti zīmējumā 1.2 c <strong>un</strong> d ir iegūti ar līmeņu-šķērsojošo diskretizāciju. Kāvar redzēt zīmējumā 1.2.c, ka pie 0 vērtības, kur ir vismazākā kļūdas varbūtības vērtības irlielākas <strong>un</strong> tuvojoties pusei no attāluma starp līmeņiem kļūdas varbūtība samazinās.Sinusoidāla signāla gadījumā (1.2.d zīm.) kļūda sadalās savādāk Pie 0 varbūtība ir mazāka <strong>un</strong>uz abām pusēm tā vispirms palielinās <strong>un</strong> tikai tad samazinās.Dotā projekta otrajā etapā ir apskatītas tikai līmeņu-šķērsojošā ACP īpašības, tadturpmākais darbs ir paredzēts šo īpašību izmantošanai <strong>un</strong> detalizētākai analīzei.11
“Oriģinālu signālu apstrādes paņēmienu izveide <strong>un</strong> izpēte konkurētspējīgu IT tehnoloģiju radīšanai”1.2. Nolašu blīvumsNolašu blīvums spēlē lielu lomu līmeņu-šķērsojošā ACP, jo tas ir atkarīgs no signālaīpašībām (Skat. zīm. 1.3). Klasiskajā ACP gadījumā nolašu skaits nemainās atkarībā nodiskretizētā signāla frekvences, bet pielietojot līmeņa-šķērsojošo diskretizāciju nolašu skaitsmainās atkarībā no signāla frekvences. Ja signāls mainās straujāk, tad nolases atrodas vienaotrai tuvāk <strong>un</strong> otrādi, ja signāla frekvence ir zema, tad arī nolases atrodas viena no otraslielākā attālumā.1800Sample density over signal frequency160014001200density, pts100080060040020000 0.05 0.1 0.15 0.2 0.25 0.3 0.35 0.4 0.45 0.5frequency, HzZīm. 1.3. Nolašu blīvums atkarībā no signāla frekvences klasiskajam ACP <strong>un</strong> līmeņu -šķērsojošajam ACP.Tā kā signāla forma ir saistīta ar signāla spektrālo saturu, tad izmantojot šo īpašību iriespējams noteikt signāla momentāno maksimālo frekvenci.Ja ieejā ir sinusoidāls signālsx ( t)= A⋅sin(2π f0t+ ϕ),(1.3)kur A – signāla amplitūda, f 0 – signāla frekvence, t – laiks, ϕ – sākuma fāze.Nolašu blīvumu var noteikt pēc formulasσ = 2 f , 0(1.4)R Δkur R Δ - dažādo šķērsoto līmeņu skaits.Kā var redzēt no formulas, tad nolašu blīvums harmoniskam signālam ir nemainīgs <strong>un</strong> iratkarīgs tikai no signāla augstākās frekvences <strong>un</strong> šķērsoto līmeņu skaita.Noteikt nolašu blīvumu platjoslas signālam nav tik vienkārši kā vienas harmoniskamsignālam. Analītiskā ceļā ir izvestas formulas, kas nosaka nolašu blīvumu signālam ar Gausasadalījumu, kura vidējā vērtība ir vienāda ar nulli <strong>un</strong> nemainīgu spektrālo blīvumu [12]⎧Sf ≤ f0x(f ) = ⎨ .(1.5)⎩0citurParedzamais l 0 līmeņa šķērsojumu skaitu laika vienībā ir iespējams noteikt22 f ⎛0− l[ ] exp0 .03 4 ⎟ ⎞E σ l=⎜(1.6)⎝ Sf0⎠12
“Oriģinālu signālu apstrādes paņēmienu izveide <strong>un</strong> izpēte konkurētspējīgu IT tehnoloģiju radīšanai”Lai noteikti nolašu blīvumu, ir nepieciešams summēt visus kvantēšanas līmeņus l kL2[ ] ∑ −=1E σ σ l(1.7)k = 1Turpmāk tiks apskatītas dažas līmeņu-šķērsojošā ACP īpašības. Kā vienu no pirmajāmīpašībām var minēt nolašu sadalījumu pa līmeņiem (Zīm. 1.3).a) b)60Sample density over levelsk .35Sample density over levels50304025pts3020points2015101050-2.5 -2 -1.5 -1 -0.5 0 0.5 1 1.5 2 2.5level value0-1.5 -1 -0.5 0 0.5 1 1.5level valueZīm. 1.4. Nolašu blīvuma sadalījums pa līmeņiem a) joslā ierobežotam troksnim, b)sinusoidālam signālam.Zīmējumā 1.4.a grafikā ir attēlots nolašu blīvuma sadalījums pa līmeņiem joslāierobežotam troksnim. Nolases sadalās pēc Gausa likuma, tas norāda uz to, ka signāls navperiodisks. Paskatoties uz zīmējumu 1.4.b, kurā ir attēlots sinusoidāls signāls, nolašu blīvumasadalījums ir konstants, kas norāda, ka signāls šķērso visus līmeņus vienādu skaitu reižu.Tātad signāls ir periodisks.1.3. Diskretizācijas laika intervāliKā vēl viens ļoti svarīgs process, kas raksturo diskretizācijas procesu ir laika intervālsstarp divām blakus nolasēmΔ t = t+(1.8)n, n 1− tn kur Δt n – laika intervāls starp divām nolasēm, t n+1 – nākošās nolases laika moments, t n –pašreizējās nolases laika moments. Vidējais nolašu laika intervāls ir saistīts ar nolašu blīvumu1t = .(1.9)σΔ nPrecīzu attālumu starp divām nolasēm Δt n var noteikt analītiski priekš konkrēta gadījuma.Ņemot par pamatu vienas harmonikas signālu (3) <strong>un</strong> ja signāls šķērso līmeni l k laika momentāt n <strong>un</strong> līmeni l k+1 laika momentā t n+1 , tad attālumu Δt n var aprēķināt13
“Oriģinālu signālu apstrādes paņēmienu izveide <strong>un</strong> izpēte konkurētspējīgu IT tehnoloģiju radīšanai”Δtn=2πf⎛ ⎛ lk⎞ ⎛ lk+⎜arcsin⎜⎟ − arcsin⎜⎝ ⎝ A ⎠ ⎝ A1 10⎞⎞⎟⎟.⎠⎠(1.10)Ekstrēmu tuvumā signāls vienu <strong>un</strong> to pašu līmeni šķērso divas reizes <strong>un</strong> attālums starpnolasēm irΔt n=⎛⎜ π ⎛ l− arcsin⎜⎜ 2 ⎜⎝ ⎝1 min| maxπf0A⎞⎞⎟⎟.⎟⎟⎠⎠(1.11)Ja attālumu starp divām nolasēm Δt n nevar noteikt analītiski, tad augstāko <strong>un</strong> zemākolaika intervālu robežas var noteikt balstoties uz signāla parametriem. Minimālo attālumu varnoteikt arΔlminTmin≥ ,(1.12)max( x'( t) )kur Δl min – minimālais attālums starp diviem kvantēšanas līmeņiem, x’(t) – ir signālapirmās kārtas atvasinājums.Gadījumā, kad signāls šķērso vienu <strong>un</strong> to pašu līmeni divas reizes T min var sasniegt nulli,jo Δl=0. Laika intervāls starp divām nolasēm Δt n ir bezgalīgs, jo līmeņu-šķērsojošādiskretizācija nevar kvantēt signālu, kas atrodas starp diviem līmeņiem. Lai novērstu šoproblēmu, attālumam starp kvantēšanas līmeņiem ir jābūt mazākiem nekā signāla amplitūda.14
“Oriģinālu signālu apstrādes paņēmienu izveide <strong>un</strong> izpēte konkurētspējīgu IT tehnoloģiju radīšanai”2. Signāla rekonstrukcija no līmeņu šķērsojuma notikumanolasēmVeicot signāla līmeņu-šķērsojuma diskretizāciju, vispārīgā gadījumā iegūst laikānevienmērīgi izvietotas signāla nolases, kuru skaitu ietekmē paša signāla īpašības – jostraujāk tas mainās, jo vairāk nolašu. Signāla rekonstrukcija ir pretējs process diskretizācijai –zinot signāla nolases s( t n) , n = 0,1,K , N −1, tiek iegūta tā sākotnējā analogā forma s(t) .Problēmas būtība ir izstrādāt metodes <strong>un</strong> algoritmus, kas šos procesus realizē.2.1. Eksistējošo metožu izpēte, to trūkumi <strong>un</strong> priekšrocībasLīdz šim jau publicētās signāla atja<strong>un</strong>ošanas metodes: Sinc f<strong>un</strong>kciju metode, Splainu metode, Iteratīvas signāla atja<strong>un</strong>ošanas metodes:• Voronova metode,• Lineāro f<strong>un</strong>kciju metode,• Marvasti metode,• Adaptīvo koeficientu metode.Sinc f<strong>un</strong>kciju metode ir veidota signāla atja<strong>un</strong>ošanai no tā vienmērīgi izvietotāmnolasēm. Saskaņā ar Šennona-Koteļņikova teorēmu visu informāciju par signālu arierobežotu spektru f ∈ 0, f ] satur tā nolases, kas fiksētas vienmērīgi izvietotos laika[max1momentos ar soli T ≤ , kur f maxir maksimālā frekvence signāla spektrā[14].2 fmaxIerobežota skaita N nolasēm, atja<strong>un</strong>otā signāla izteiksme ir:N∑ − 1⎛ ω0 ⎞s(t)= s(nT ) ⋅sinc⎜( t − nT ) ⎟ , (2.1)n=0 ⎝ 2 ⎠kur s(nT)- signāla nolases, bet ω0= 4πfmax. Izteiksmi (2.1) var vispārināt <strong>un</strong> pielietotnevienmērīgas diskretizācijas gadījumam. Zinot signāla s(t) nevienmērīgi izvietotās nolasess( t n) , n = 0,1,K , N −1, atja<strong>un</strong>otā signāla izteiksmi raksta:sˆ(t)=N∑ − 1n=0s(t⎛ ω0) ⋅ sinc⎜( t −⎝ 2nt n⎞) ⎟⎠(2.2)kurJa s t ) vietā izteiksmē (2.2) liek koeficientus D , tad iegūst (2.1) otru vispārinājumu,D n( ntādā gadījumā atrod, atrisinot lineāru N vienādojumu sistēmu, ko iegūst, ja izvirzanosacījumu s t ) = sˆ(t ) .(n nSinc f<strong>un</strong>kciju metodes trūkums ir tas, ka tā ir veidota vienmērīgi diskretizēta signālaatja<strong>un</strong>ošanai. Pēc līmeņu-šķērsojuma principa diskretizēta signāla nolases bieži vien būsnevienmērīgi izvietotas laikā, tāpēc atja<strong>un</strong>otais signāls būs nekorekts.Splainu metode līdzīgi sinc f<strong>un</strong>kciju metodei ir veidota signāla atja<strong>un</strong>ošanai no tāvienmērīgi izvietotām nolasēm. Atja<strong>un</strong>otā signāla izteiksme ierobežota skaita K nolasēm:n15
“Oriģinālu signālu apstrādes paņēmienu izveide <strong>un</strong> izpēte konkurētspējīgu IT tehnoloģiju radīšanai”K1nsˆ ( t)= ∑ − s(kT ) ⋅η 1( t − kT ) , (2.3)= 0knkur η1 ( t)ir n-tās kārtas pamat-splains[15]. Pieaugot pamat-splaina kārtai n, tas sākvairāk līdzināties sinc f<strong>un</strong>kcijai, <strong>un</strong> to galvenā priekšrocība ir īpašība strauji norimt. Izteiksmi(2.3) var vispārināt <strong>un</strong> pielietot nevienmērīgas diskretizācijas gadījumam, līdzīgi kā (2.2).Atja<strong>un</strong>otā signāla izteiksmi var rakstīt:K1nsˆ ( t)= ∑ − s(tk) ⋅⋅η 1( t − tk) , (2.4)k = 0kur s t ) vietā varētu likt arī koeficientus D , kurus atrod, izvirzot nosacījumu( ks ˆ(tk) = s(tk) .Splainu metodes priekšrocība ir splainu īpašība strauji norimt, tāpēc atja<strong>un</strong>otā signālamomentāno vērtību ietekmē mazāks skaits signāla nolašu. Savukārt trūkums ir tāds, ka arī šīmetode ir veidota vienmērīgi diskretizēta signāla atja<strong>un</strong>ošanai.Iteratīvas signāla atja<strong>un</strong>ošanas metodes. Jebkuru frekvenču joslā ierobežotu signāluiespējams atja<strong>un</strong>ot no tā nevienmērīgi izvietotām nolasēm, ja maksimālais attālumsstarp divām nolasēm nepārsniedz Naikvista solipēc iteratīva algoritma. Zinot nepārtraukta signālatiek konstruēts kontinuāls aproksimācijas signālss t)= A [ ]as nkmaxT max1T = [16]. Signāla atja<strong>un</strong>ošana norit2 fs (t) nolases s = s t ) , n = 0,2, K , N − 1 ,n( , (2.5)kur A apzīmē aproksimācijas operatoru. Tālāk s a(t) tiek filtrēts, vājinot liekās spektrakomponentes, kas neiekļaujas sākotnējā signāla s(t) spektrā. Filtra izejas signāls (atja<strong>un</strong>otaissignāls pēc nulltās iterācijas)sˆ0 ( t)= Π s ( t)= Π A , (2.6)[ ] [ [ ]]as nkur Π apzīmē projekcijas operatoru, no sākotnējā atšķirsies par ε ˆ0( t)= s(t)− s0( t),turklāt eksistē tāds pozitīvs koeficients q < 1, kurams( t)− sˆ0( t)< q ⋅ s(t)(2.7)Ja tālāk aproksimācijas <strong>un</strong> projekcijas operatorus pielieto kļūdas signāla nolasēm, tadatja<strong>un</strong>otais signāls pēc m-tās iterācijas:ˆ ( t)= sˆ( t)+ Π A s − s , (2.8)[ [ ]]s ˆm m−1 n m−1n( nbet kļūdas signālss(t)− sˆm( t)< qm+1⋅s(t), (2.9)pieaugot m, tiecas uz nulli, tāpēclim ˆs mm→∞( t)= s(t)(2.10)16
“Oriģinālu signālu apstrādes paņēmienu izveide <strong>un</strong> izpēte konkurētspējīgu IT tehnoloģiju radīšanai”Atkarībā no tā, kā tiek konstruēts aproksimācijas signāls (kāds ir aproksimācijasoperators A), izšķir dažādas signāla atja<strong>un</strong>ošanas metodes (2.1. zīm.), kas savā starpā atšķirasar konverģences ātrumu, aprēķinu sarežģītību <strong>un</strong> citiem parametriem[17].Zīm. 2.1. Signāla aproksimācija: a) Voronova, b) Lineāro f<strong>un</strong>kciju, c) Marvasti,d) Adaptīvo koeficientu metodeVoronova metodes gadījumā signālu aproksimē ar taisnstūrveida f<strong>un</strong>kcijām. Lineārof<strong>un</strong>kciju metodes gadījumā signāls tiek aproksimēts ar taisnēm. Marvasti metodeiaproksimācijas signālu veido signāla nolases, kas pareizinātas ar globālu relaksācijaskoeficientu, kurš nosaka signāla rekonstrukcijas algoritma konverģenci vai diverģenci.Adaptīvo koeficientu metodei aproksimācijas signālu veido tās pašas signāla nolases, tikaikatra no tām ir pareizināta ar tai atbilstošu svara koeficientu, kuru nosaka attālums starpblakus nolasēm.Iteratīvo metožu priekšrocība ir spēja veikt nevienmērīgi diskretizēta signāla precīzuatja<strong>un</strong>ošanu. Kā trūkums ir jāmin ierobežojums attiecībā uz maksimālo attālumu starp signālanolasēm, kas nedrīkst pārsniegt Naikvista soli. Pēc līmeņu šķērsojuma principa diskretizētamsignālam attālums starp blakus nolasēm var pārsniegt Naikvista soli vairākas reizes.2.2. Sinc f<strong>un</strong>kcijas parametru adaptācija atbilstoši lokālam nolašublīvumamSinc f<strong>un</strong>kciju metodes gadījumā atja<strong>un</strong>otā signāla izteiksme ierobežota skaita N nolasēmbija:N∑ − 1⎛ ω0 ⎞sˆ(t)= s(tn) ⋅ sinc⎜( t − t n) ⎟ , (2.11)n=0 ⎝ 2 ⎠kur lielumu ω0= 2ωmaxnoteica signāla spektra maksimālā frekvence ωmax. Ja tagadkatrai signāla nolasei piemeklē savu sinc f<strong>un</strong>kciju ar noteiktu svara koeficientu, galvenāsvāles platumu <strong>un</strong> laika nobīdi, tad atja<strong>un</strong>otā signāla izteiksme būs:sˆ(t)=N∑ − 1n=0Cn⎛ ωn⋅ sinc⎜⎝ 2⎞( t − t′n) ⎟ , (2.12)⎠17
“Oriģinālu signālu apstrādes paņēmienu izveide <strong>un</strong> izpēte konkurētspējīgu IT tehnoloģiju radīšanai”kur parametru Cn, ωn<strong>un</strong> t′nvērtības jāatrod tā, lai atja<strong>un</strong>otais signāls no sākotnējāatšķirtos pēc iespējas mazāk. Parastās <strong>un</strong> uzlabotās sinc f<strong>un</strong>kciju metodes atšķirību varnovērot 2.2. zīmējumā, kurā ilustrēta signāla rekonstrukcija no tā divām līmeņu-šķērsojumanolasēm.Zīm.2.2. Signāla rekonstrukcija ar a) parasto <strong>un</strong> b) uzlaboto sinc f<strong>un</strong>kciju metodiKā redzams, tad uzlabotās sinc f<strong>un</strong>kciju metodes gadījumā atja<strong>un</strong>otais signāls sˆavd( t)nosākotnējā s(t) atšķiras ar mazāku kļūdu.Pēc līmeņu šķērsojuma principa diskretizēta signāla nolašu skaitu ietekmē paša signālaīpašības – jo straujāk tas mainās (augstāka frekvence), jo vairāk nolašu, tāpēc loģiski būtuizteiksmē (2.12) sinc f<strong>un</strong>kciju parametru ωnsaistīt ar lokālu signāla nolašu blīvumu, kuru,vadoties pēc 2.3. zīmējuma, definēsim:2M2MρM( t′n)tn′∈(tn, t=n+1)vai ρM( t′n)tn′= t=(2.13)nt − tt − tn+Mn+1−Mkur 2 M – vērā ņemamo nolašu skaits, kas izvietotas uz abām pusēm no t′ .n+Mn−MnZīm. 2.3. Signāla nolašu laika momentiZinot ρ M( t′ n) , var aprēķināt sinc f<strong>un</strong>kciju parametru ωn:ωn= 2π⋅ ρM( t′n)(2.14)Atkarībā no M iegūst dažādas ωnvērtības, bet, lai saglabātu lokālā nolašu blīvuma ideju,šim skaitlim nevajadzētu būt pārāk lielam.Simetrisku sinc f<strong>un</strong>kciju amplitūdu aprēķins. Vienkāršojot uzdevumu, pieņem<strong>un</strong> izvirza nosacījumus ˆ(t ) = s(tnn) , no kura izriet:t ′ = tC = Ω− 1 ⋅S, (2.15)kur matrica C satur nezināmos koeficientus , matrica S satur signāla nolašu vērtībass( t n) , bet Ω matricas i-tās rindas <strong>un</strong> m-tās kolonnas elements būs:C nnnΩ⎛ ωm−1⎞= sinc⎜( ti−1− t−1) ⎟⎝ 2⎠i, mm(2.16)Nesimetrisku sinc f<strong>un</strong>kciju amplitūdu aprēķins. Šajā gadījumā matricas Ω i-tāsrindas <strong>un</strong> m-tās kolonnas elements būs divu sinc f<strong>un</strong>kciju summa:18
“Oriģinālu signālu apstrādes paņēmienu izveide <strong>un</strong> izpēte konkurētspējīgu IT tehnoloģiju radīšanai”kurbetΩ⎛ω( m−1)l ⎞⎛ω( m−1)r ⎞= α ⋅⎜ −⎟ + ⋅⎜ −⎟( m− 1) lsinc ( ti−1tm−1)α( m−1)rsinc ( ti−1t−1) ,(2.17)⎝ 2⎠⎝ 2⎠i, mm⎧1,ja t ≤ tn⎧0,ja t ≤ tnαnl= ⎨ , αnr= ⎨, (2.18)⎩0,ja t > tn⎩1,ja t > tnωnl<strong>un</strong> ωnratrod saskaņā ar (2.14), izmantojot lokālos nolašu blīvumus:MMρM l( t′n)ρ ′ =(2.19)nt − tt tM rtn′ == , (n)ntn′= ttn− tn−Mn+MnŠāds f<strong>un</strong>kciju summas piemērs ilustrēts 2.4. zīmējumā.Zīm.2.4. Divu sinc f<strong>un</strong>kciju summas piemērsPamatojums šādai nesimetrisku sinc f<strong>un</strong>kciju izvēlei ir tāds, ka nolašu blīvums pa labi <strong>un</strong>pa kreisi no var būt visai atšķirīgs.t n2.3. Metožu darbības modelēšana <strong>un</strong> salīdzinošā analīzeKad ir apgūtas metožu galvenās pamatidejas, var veikt signāla atja<strong>un</strong>ošanas simulācijuMATLAB vidē. Kā testa signāls ir izvēlēts frekvences modulēts (FM) signāls, kura frekvencelineāri pieaug no 0.05 Hz līdz 0.45 Hz. Pamatojums FM signālam ir tāds, ka tā frekvencelaikā mainās, tāpēc mainās arī pēc līmeņu šķērsojuma principa iegūto nolašu blīvums. Testasignāls attēlots 2.5. zīmējumā, bet atja<strong>un</strong>otais signāls, kas iegūts ar simetrisku sinc f<strong>un</strong>kcijumetodi, ir parādīts 2.6. zīmējumā.Zīm.2.5. Testa frekvences modulēts signāls s FMblīvums S( f )(t)<strong>un</strong> tam atbilstošais spektrālais19
“Oriģinālu signālu apstrādes paņēmienu izveide <strong>un</strong> izpēte konkurētspējīgu IT tehnoloģiju radīšanai”Zīm.2.6. Atja<strong>un</strong>otais signālssˆFM( t)<strong>un</strong> kļūda ε (t)simetrisku sinc f<strong>un</strong>kciju gadījumāVeicot frekvences modulēta signāla atja<strong>un</strong>ošanas simulāciju MATLAB vidē ar katru noapskatītajām metodēm, iegūtie rezultāti apkopoti tabulā, bet to grafisks laika-kvalitātesilustrējums dots 2.7. zīmējumā.Tabula 2.1. Metožu rezultātu salīdzinājumsε ( t),[ V ]max ef/ s FM eft mett sinc . f<strong>un</strong>kc.Metode L.v.d. A.v.d. L.v.d. A.v.d. L.v.d. A.v.d.Sinc f<strong>un</strong>kciju 0.24 1.25 0.022 0.64 1 1Uzlabotā simetrisku sinc f<strong>un</strong>kciju 0.24 0.17 0.022 0.044 12.67 18.52Uzlabotā nesimetrisku sinc f<strong>un</strong>kciju 0.24 0.19 0.022 0.042 15.84 24.41Splainu 0.58 1.04 0.14 0.49 9.8 10.26Voronova 0.23 1.23 0.027 0.14 40 27.90Lineāro koeficientu 0.23 0.74 0.027 0.074 39.96 27.81Marvasti 0.24 1.08 0.036 0.30 22.51 16.71Adaptīvo koeficientu 0.24 1.10 0.022 0.30 22.62 16.71ε / . met.L.v.d. – laikā vienmērīga diskretizācijaA.v.d. – amplitūdā vienmērīga diskretizācijaMetožu salīdzināšanai tiek izmantotas kļūdas signāla ε ( t)= s ( t)− sˆ( t)maksimālāsFM FMsFM ef= 0. 71vērtības ε (t) <strong>un</strong> efektīvo vērtību attiecības εmaxef/ s FM, kur V ir paša FMefsignāla vidējā kvadrātiskā vērtība. Salīdzināts tiek arī laiks, kas nepieciešams atja<strong>un</strong>otāsignāla aprēķinam ar izvēlēto metodi. Lai izvairītos no datora veiktspējas ietekmes uz laikanovērtējumu, tas tiek dots attiecībā pret to laiku, kas nepieciešams signāla aprēķinam ar sincf<strong>un</strong>kciju metodi.Zīm. 2.7. Metožu laika-kvalitātes novērtējums20
“Oriģinālu signālu apstrādes paņēmienu izveide <strong>un</strong> izpēte konkurētspējīgu IT tehnoloģiju radīšanai”Signāla atja<strong>un</strong>ošana ar visām metodēm tika realizēta gan laikā vienmērīgi, gan amplitūdāvienmērīgi diskretizētam FM signālam. Visu četru iteratīvo metožu rezultāts ir iegūts pēcdevītā cikla. Aplūkojot 2.7. zīmējumu, izriet šādi secinājumi:1) Visas apskatītās metodes ar vienlīdz labu rezultātu ļauj atja<strong>un</strong>ot vienmērīgidiskretizētu signālu, būtiski atšķiras tikai algoritmu izpildes laiki. Ar splainu metodiiegūtais kļūdas signāls ir lielāks, kas skaidrojams ar pārāk zemas kārtas pamat-splainaizmantošanu signāla rekonstrukcijā.2) Vismazāko signāla atja<strong>un</strong>ošanas kļūdu dod tieši uzlabotā sinc f<strong>un</strong>kciju metode, kas topadara visai interesantu no turpmāko nākotnes pētījumu viedokļa.3) Labs rezultāts ir sasniegts ar lineāro f<strong>un</strong>kciju metodi, kas skaidrojams ar samērāveiksmīgu signāla aproksimāciju no tā līmeņu-šķērsojuma nolasēm nulltajā iterācijā.Tāpēc būtu interesanti nākotnē apskatīt arī citus signāla aproksimācijas paņēmienus,piemēram, izmantojot otrās kārtas polinomus. Vēl pastāv iespēja dažādos ciklosizmantot atšķirīgus signāla aproksimācijas paņēmienus.4) Parasto sinc f<strong>un</strong>kciju <strong>un</strong> B-splainu metodes tomēr nav piemērojamas amplitūdāvienmērīgi diskretizēta signāla atja<strong>un</strong>ošanai, jo kļūdas signāls ir samērojams ar pašusignālu.21
“Oriģinālu signālu apstrādes paņēmienu izveide <strong>un</strong> izpēte konkurētspējīgu IT tehnoloģiju radīšanai”3. Nestacionāru signālu apstrādes beztaktētāja sistēmasmodelēšanaKlasiskais paņēmiens, kā pārveidot nepārtraukto signālu ciparu formā ir izdarīt nolasesnoteiktos laika momentos <strong>un</strong> pēc tam nokodēt šīs nolases amplitūdas vērtību ar noteikto bituskaitu. Laika momenti ir novietoti pa laika ass vienmērīgi, respektīvi, starp visam nolasēm irviens <strong>un</strong> tāds pats attālums, kuru sauc par diskretizācijas soli τ. Lai realizētu signālavienmērīgo diskretizāciju ir vajadzīgs pulkstenis, jeb taktētāja sistēma. Taktētāja sistēmasklātbūtne ierīcē pirmkārt prasa samērā lielu enerģijas patēriņu, kas nav īpaši labi, ja ierīcedarbojas autonomā režīmā ar baterijas palīdzību, otrkārt, ir vajadzīga stabila <strong>un</strong> precīzapulksteņa darbība. Cita pieeja ir izdarīt nepārtraukta signālu diskretizāciju nevienmērīgoslaika momentos. Viens no paņēmieniem, kā to var realizēt ir līmeņu-šķērsojuma princips. Šisprincips tiek realizēts beztaktētāja sistēmās, jo nolase tiek ņemta, laika momentā kad signālssasniedz kādu iepriekš izvēlēto vērtību, bet nevis takts impulsa pienākšanas brīdī. Apskatīsimšīs darbības principu.3.1. Nestacionāru signālu analogs-ciparu pārveidošana izmantojotlīmeņu-šķērsojuma principuUz frekvences modulēta signāla piemēra apskatīsim, kā notiek pārēja no analoganestacionāra signāla uz signālu ciparu formā, kad nolases tika ņemtas ar līmeņu-šķērsojumaprincipu.Mūsu izvēlēta signāla atkarība no laika var būt izteikta ar formulus ( t)= cos(2π (0.05 + t)t)(3.1)Sākuma fāze signālam s(t) ir nulle <strong>un</strong> amplitūda ir 1.Zīm. 3.1. ir dots grafiks, kur ir parādīts signāls <strong>un</strong> izdarītas nolases. Kā redzams, nolasesir novietotas nevienmērīgi uz laika ass.Zīm. 3.1. Frekvenču modulēta signāla nevienmērīga diskretizācija ar līmeņu-šķērsojumaprincipu.22
“Oriģinālu signālu apstrādes paņēmienu izveide <strong>un</strong> izpēte konkurētspējīgu IT tehnoloģiju radīšanai”3.2. Laika-frekvenču reprezentāciju modelēšanaPēc diskretizācijas mums ir nolašu plūsma, kura atbilst nestacionāram signālam,respektīvi, procesam ar laikā mainīgu spektrālo blīvumu. Lai iegūtu informāciju par diskrētosignālu mums ir jāpielieto kāda no speciālām signāla transformācijām. Klasiskā Furjētransformācija (nepārtrauktā <strong>un</strong> diskrēta) ir viens no pamatinstrumentiem signāla analīzē, bettā nav pietiekoši efektīva nestacionāru signālu apstrādē, jo ir balstīta uz stacionaritāteskoncepta. Tāpēc mēs šeit pievērsīsim uzmanību signāla laika-frekvenču reprezentācijai, kuraraksturojas ar p<strong>un</strong>ktu kopumu laika-frekvenču plaknē. Apskatīsim trīs klasiskos laikafrekvenčureprezentācijas veidus: 1. īssintervāla Furjē transformācija, 2. vilnīšanalīze, 3.Vignera sadalījumu.3.2.1. Īssintervāla Furjē transformācijas pieejaVēsturiski pirmais piedāvātais veids kā analizēt nestacionārus signālus ir īssintervālaFurjē transformācija (STFT). Tā ir bāzēta uz Furjē transformācijas. Pamatideja ir ievest laikalogu, kurš tiek bīdīts gar aplūkoto signālu. Matemātiskā izteiksme šai transformācijai irsekojoša [24, 25]kur,w ∗ ( t −τ )∞∗STFT ( t,f ) = ∫ x(τ ) w ( t −τ)exp( − j2πfτ) dτ(3.2)−∞ir laika logs <strong>un</strong> zvaigzne apzīmē kompleksi saistīto lielumu. Patvaļīgasdiskretizācijas gadījumā, kad nolašu skaits ir galīgs[ ]x = x , kur n = 1,N (N ir nolasesnt nskaits laikā intervālā θ ), STFR var būt izteikta sekojoši [26]STFTN[ k,m] = ∑n=1∗⎛kxnw⎜ − tn⎝ 2Ω⎞ ⎛ −⎟exp⎜⎠ ⎝j2πtnm⎞⎟θ ⎠(3.3)kur, Ω ir signāla spektra platums <strong>un</strong> m nosaka vienmērīgu soli frekvenču apgabalā.Pieņemsim, ka mūsu uzdevums ir pārveidot ar STFT nevienmērīgi diskretizētu frekvenčumodulētu kosinuss f<strong>un</strong>kciju⎛ ⎛ 0.2 ⎞ ⎞s( t)= cos⎜2π ⎜0.05+ t ⎟t⎟(3.4)⎝ ⎝ 256 ⎠ ⎠Par loga f<strong>un</strong>kciju izvēlamies “Hamminga” logu, kurš ir definēts sekojoši [25]⎧⎛ n ⎞⎪0.54− 0.46cos⎜2π⎟,0≤ n < Tw(n)= ⎨⎝ T −1⎠⎪⎩0,citur(3.5)kur T ir loga garums. Veicot attiecīgus aprēķinus ir iegūti sekojoši rezultāti: Zīm. 3.2. irparadīts signāls <strong>un</strong> nolases; Zīm. 3.3. ir dots nevienmērīgi diskrēta signāla spektrs <strong>un</strong> 3.4attēlā ir STFT nevienmērīgi diskrētam signālam ar līmeņa-šķērsojuma principu palīdzību.Līmeņu-šķērsojuma analogs-ciparu pārveidojumam ir izvēlēti 8 līmeņi. Lai novērstuartefaktus, kuri ir saistīti ar to, ka exp( − j2π tnm/θ ) pie nevienmērīgi izvietotiem t n23
“Oriģinālu signālu apstrādes paņēmienu izveide <strong>un</strong> izpēte konkurētspējīgu IT tehnoloģiju radīšanai”momentiem nedod ortogonālu transformāciju, ir izmantota neortogonāla transformācija [26].Tas nozīme to, ka aprēķinos matrica Enm= exp( − j2π tnm/θ ) ( n = 1 , N;m = 1,M ) iraizvietota ar matricu [26]G=(EE T ) -1 E (3.6)kur E T ir transponēta matrica <strong>un</strong> () –1 apzīmē inverso matricu.Zīm. 3.2. FM modulēts reāls signāls. Ar p<strong>un</strong>ktiem ir atzīmētas vietas, kur signāls krustoattiecīgo līmeni.Zīm.3.3. Aplūkota signāla spektrs. Frekvence ir atliekta normētas vienības.Zīm. 3.2. ir redzams, ka jo lielāk ir signāla frekvence, jo lielāk ir nolases skaits.Zīm.3.3. mums neko nevar pateikt par to, kā ar laiku maiņas spektrālais blīvums aplūkotaif<strong>un</strong>kcijai <strong>un</strong> jo sarežģītāk ir f<strong>un</strong>kcija, jo grūtāk kaut ko pēc tā spektra spriest par signālasastāvdaļām. Zīm. 3.4. ir dota laika-frekvenču reprezentācija. Kā redzams, tajā neparādāsartefakti, kas ir tipiski nevienmērīgai diskretizācijai, jo ir izmantota neortogonālatransformācija. Laika intervālā sākumā <strong>un</strong> beigas, spektrs ir neskaidri izplūdis gandrīz pa visufrekvenču skalu, kas izskaidrojams ar gala efektiem, kad analīzei ir nepietiekams nolašuskaits. Tas, ka STFT ir gan pie pozitīvām <strong>un</strong> negatīvām frekvencēm ir saistīts ar to, kareālajam signālam spektrāla blīvuma f<strong>un</strong>kcija ir simetriska pret frekvences nulles p<strong>un</strong>ktu.24
“Oriģinālu signālu apstrādes paņēmienu izveide <strong>un</strong> izpēte konkurētspējīgu IT tehnoloģiju radīšanai”Zīm. 3.4. STFT laika-frekvenču reprezentācija.3.2.2. Vilnīša analīzes pieejaPazīstama STFT problēma ir sakarība starp izšķirtspēju pēc laika <strong>un</strong> frekvencēm. Logagaruma paplašināšana uzlabo frekvenču izšķiršanu, bet tajā pašā laikā samazina laiciskoizšķirtspēju. Lai novērstu šāda veida problēmu, var tikt pielietota vilnīšanalīze.Laikā nepārtraukta signāla vilnīštransformācija ir izteikta ar integrāli [25, 26]∞1∗⎛ t −τ⎞= ∫ x(τ h ⎜ ⎟dτa −∞ ⎝ a ⎠WT ( t,a))(3.7)kur a ir mērogošanas faktors <strong>un</strong> h(t) ir analīzes vilnīša f<strong>un</strong>kcija. Mērogošanas faktors irf0saistīts ar frekvencēm ar sakarību a = . Vilnīšiem piemīt tāda īpatnība, ka frekvenčufizšķirtspēja samazinās pie lielām frekvencēm <strong>un</strong> izšķiršana laikā samazinās pie mazāmfrekvencēm.Praksē izmanto daudz dažādu h(t) vilnīša f<strong>un</strong>kciju. Mēs savā analīzē pielietosim tāsaucamu Morleta vilnīti [25]2⎧ t ⎫h(t)= exp{ jω 0t}exp⎨− ⎬(3.8)⎩ 2 ⎭kur ω0ir dominantā frekvence, ar kuras palīdzību var variēt bāzes selektivitāti.Diskrētā signāla gadījumā, vilnīšanalīze var būt izteikta ar summas formulu [26]WTN∗h⎜m n=1 ⎝ f0θ /0θ/[ k,m] = ∑ x[ tn]f1⎛ k / 2Ω− tmn⎞⎟⎠(3.9)Šī izteiksme ir spēkā gan vienmērīgi, gan nevienmērīgi novietotam nolasēm.25
“Oriģinālu signālu apstrādes paņēmienu izveide <strong>un</strong> izpēte konkurētspējīgu IT tehnoloģiju radīšanai”Zīm. 3.5. Laika-frekvenču reprezentācija lineāri FM kosinuss f<strong>un</strong>kcijai. Signāls bijadiskretizēts ar 8 līmeņu palīdzību.Zīm.3.5. ir paradīts modelēšanas rezultāts, kad p<strong>un</strong>ktā 3.2.1. aplūkotais signāls irdiskretizēts ar līmeņa-šķērsojuma principa palīdzību. Ir izmantoti 8 kodēšanas līmeņi. Kā irredzams, pie lielām frekvencēm samazinās spektrāla izšķirtspēja, savukārt pie zemāmfrekvencēm samazinās laika izšķirtspēja.3.2.3. Vignera sadalījuma f<strong>un</strong>kcijaViena no plaši pielietotām pieejām laika-frekvenču signāla reprezentācijā ir Vignerasadalījuma integrālis, kurš ir sastāvdaļa kopējai laika-frekvenču pārveidošanas pieejai.Vignera integrālis laika nepārtrauktai f<strong>un</strong>kcijai ir [24, 25, 27]∞∫−∞⎛ τ ⎞ ∗⎛ τ ⎞WVD( t,f ) = x⎜t+ ⎟x⎜t− ⎟ exp ( − j 2 πfτ) dτ(3.10)⎝ 2 ⎠ ⎝ 2 ⎠Par kodolu, mūsu gadījumā sauc exp( − j2πfτ) . Šis integrālis dod lielu izšķišanas spējulaikā <strong>un</strong> frekvencēm mono-komponentu signāliem. Tomēr, papildus interferences produktivar parādīties, ja signālam ir vairākas komponentes. Lai cīnīties ar šo efektu, ir izstrādātascitas kodola f<strong>un</strong>kcijas, bet tas tipiski noved pie izšķirtspējas samazināšanas gan laikā ganfrekvencēm.R<strong>un</strong>ājot par nevienmērīgi izvietotām nolasēm, paradās sekojoša problēma. Pieņemsim, kakatra nolase ir Dīraka delta f<strong>un</strong>kcija. Tad plūsmu no vairākām nolasēm varām uzrakstīt kādelta f<strong>un</strong>kciju summu, ierakstot argumentā nobīdes laiku. Tad Vignera integrālim būs forma∞⎧ ⎛ τ ⎞ ⎛ τ ⎞⎫WVD[t,f ) = ∫ ⎨a0δ⎜t+ − t0⎟ + ... + aNδ⎜t+ − tN ⎟⎬22−∞⎩⎝ ⎠ ⎝ ⎠⎭(3.11)⎧ ∗ ⎛ τ ⎞∗ ⎛ τ ⎞⎫⋅ ⎨a0δ⎜t− − t0⎟ + ... + aNδ⎜t− − tN ⎟⎬⋅ exp( − j2πfτ) dτ⎩ ⎝ 2 ⎠ ⎝ 2 ⎠⎭∗kur indeksi n = 1,N apzīmē attiecīgu laika momentu <strong>un</strong> nolases vērtību šajā brīdī <strong>un</strong> a ...Nirkompleksie koeficienti, gadījumā, ja nepārtrauktais signāls ir komplekss. Atverot vaļā026
“Oriģinālu signālu apstrādes paņēmienu izveide <strong>un</strong> izpēte konkurētspējīgu IT tehnoloģiju radīšanai”iekavas, iegūstam delta f<strong>un</strong>kciju reizinājumu summu. Apskatīsim divu delta f<strong>un</strong>kcijureizinājumu nolasēm laika momentos t <strong>un</strong> t .ij⎛ τ ⎞ ⎛ τ ⎞δ ⎜t+ − ti⎟δ⎜t− − tj ⎟ ≠ 0(3.12)⎝ 2 ⎠ ⎝ 2 ⎠Lai šis f<strong>un</strong>kcijas reizinājums nebūtu vienāds ar nulli, vienmērīgas diskretizācijasgadījumā, integrēšanas solim τ jābūtτ = t ( kt(3.13)i− tj= t0 i − j)=kur k = 0 , ± 1, ± 2... <strong>un</strong> t0ir diskretizācijas solis.Nevienmērīgas diskretizācijas gadījumā, starpībai starp j-to nolase <strong>un</strong> i-to nolase jābūt tikmazai, kā delta f<strong>un</strong>kcijas eksistēšanas argumenta robežaia n0t t ≤ ε(3.14)i− j∗Tas nozīme, ja koeficienti a n<strong>un</strong> ir atšķirīgi no nulles, tad lai Vignera integrālisbūtu korekti atrisināts, nevienmērīgas diskretizācijas gadījumā, nolasēm jāseko vienai aizotrai tik tuvu, ka nevar izšķirt vai signāls ir kontinuāls vai diskrēts.Šī doma noved pie secinājuma, ka diskrēta Vignera sadalījuma f<strong>un</strong>kcija irpielietojama tikai vienmērīgi diskretizētiem signāliem. Ja signāls ir nevienmērīgi diskrētspastāv iespēja nolases interpolēt ar nepārtrauktu f<strong>un</strong>kciju <strong>un</strong> pēc tam rēķināt Vignera integrāliinterpolētai f<strong>un</strong>kcijai.Zīm. 3.6. ir parādīts signāla, kurš ir uzdots ar f<strong>un</strong>kciju (3.4), fragments līdz 20sek<strong>un</strong>dēm. Nepārtraukta līnija atbilst sākuma f<strong>un</strong>kcijai s(t), bet p<strong>un</strong>ktaina – aproksimācijasf<strong>un</strong>kcijai. Šeit ir izmantots princips, kad aproksimācijas līnija sākas no nolases vērtības <strong>un</strong>uztur to līdz nākošajai vērtībai.Zīm. 3.7. ir dota uzlabota aproksimācijas pieeja. Tagad, līnijas nesākas no nolasesvērtības (nolases laika momenta), bet nolases vērtība atrodas pa vidu interpolācijas līnijasgabalam. Tīri vizuāli šī aproksimācija izskatās tuvāka signālam s(t).Un pēdējais piedāvātais variants, ir interpolācija ar lineārām f<strong>un</strong>kcijām. Respektīvi,nolases vērtības ir savienotas ir nākošo ar taisnas līnijas palīdzību. Neskatoties uz šīsinterpolācijas vienkāršību, tā ir diezgan tuva īstam signāla s(t), ja nolašu blīvums ir liels.Zīm. 3.6. Aproksimācijas piemērs ar taisnām līnijām, kuri ir paralēli laika ass <strong>un</strong> sakasno iepriekšējas nolases vērtības <strong>un</strong> tas laika momenta.27
“Oriģinālu signālu apstrādes paņēmienu izveide <strong>un</strong> izpēte konkurētspējīgu IT tehnoloģiju radīšanai”Zīm.3.7. Aproksimācijas piemērs ar taisnām līnijām, kuri ir paralēli laika ass <strong>un</strong> nolaseslaika momenti ir novietoti apmēram pa vidu aproksimācijas nogriežņiem.Zīm.3.8. Aproksimācija ar lineāru f<strong>un</strong>kciju palīdzību.Jebkurš aproksimācijas veids pilnībā neatbilst sākuma signālam s(t), vienmēr pastāv kādaaproksimācijas kļūda, bet, lai novērtētu laika-frekvenču analīzes rezultātu tas var būtpietiekošs tuvinājums. Literatūrā nav atrodami risinājumi kā izskatīsies Vignera integrāļarezultāts nevienmērīgi novietotām nolasēm, kā arī speciālam gadījumam, kad nolases irnovietotas ar līmeņa-šķērsojuma principa palīdzību. Projektā nākamos etapos ir plānotsizveidot efektīvu algoritmu Vignera sadalījuma f<strong>un</strong>kcijas aprēķināšanai nevienmērīgiizvietotām nolasēm, pirmkārt apskatot līmeņu šķērsojuma diskretizācijas gadījumu. Tas dosiespēju salīdzināt šīs pieejas rezultātus ar īssintervāla Furjē transformācijas <strong>un</strong> vilnīšanalīzeslaika-frekvenču sadalījumiem.Jo vairāk metodes būs zināmas laika-frekvenču analīzē nevienmērīgi diskretizētiemsignāliem ar līmeņa-šķērsojuma principa izmantošanu, jo adaptīvāk mēs varēsim izveidotierīci, kura veic signāla apstrādi vai uzrakstīt attiecīgo signālu apstrādes programmatūru.28
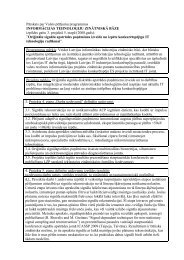
“Oriģinālu signālu apstrādes paņēmienu izveide <strong>un</strong> izpēte konkurētspējīgu IT tehnoloģiju radīšanai”4. DFT-veida pārveidojumu izstrāde, kas atbilst <strong>un</strong> ņemvērā ar LŠ-ACP iegūto laikā nevienmērīgo nolašuspecifiku.Klasiskā metode ciparu signālu apstrādē ir Furjē transformāciju pāris. Tiešā diskrētātransformācija ļauj no N laikā vienmērīgi izvietotām signāla nolasēm iegūt frekvencēsvienmērīgi izvietotus spektrālos koeficientus:N1X ( m)= ∑ − x(n)exp(− j2πmn/ N)(4.1)n=0Inversā DFT ļauj no vienmērīgi spektrā izvietotiem koeficientiem iegūt signāla nolasesvienmērīgi izvietotas laikā:N 11x(n)∑ − = X ( m)exp(j2πmn/ N)(4.2)N m=0Praktiskos pielietojumos tipiski eksistē divi ierobežojumi: signālu frekvenču joslasplatums nepārsniedz Ω , <strong>un</strong> signāla novērojuma laiks ir ierobežots ar Θ . Ciparu signālanolases x n= x( t n) , n = 0,N −1tiek iegūtas ar diskretizācijas palīdzību <strong>un</strong> vispārējāgadījumā tās var būt izvietotas nevienmērīgi uz laika ass.4. 1. Vispārinātā DFT izteiksmeVispārinātā DFT izteiksme, kas pieļauj nevienmērīgi izvietotu nolašu apstrādi var tiktizteikta kā:N⎛ ⎞= ∑ − 1mXmxnexp⎜− j2πtn⎟ . (4.3)n=0 ⎝ Θ ⎠mFrekvenču joslas ierobežojums nosaka prasību - m : ≤ Ω .ΘVienmērīgi izvietotām nolasēm izteiksme (4.3) sakrīt ar formulu (4.1). Ja ir izmantotapiemērota apzināti nevienmērīgas diskretizācijas plūsma, tad ar (4.3) var iegūt labusspektrālos novērtējumus gadījumos, kad nolašu blīvums nav mazāks par to ko nosakaNaikvista kritērijs vienmērīgai diskretizācijai. Vēl vairāk, ir iespējams apmierinoši novērtētsignāla spektrālo blīvumu arī tad, ja blīvums ir mazāks par Naikvista limitu <strong>un</strong> plūsmasīpašības ir izvēlētas tā, ka frekvenču uzklāšanās efekts tiek nospiests. Taču ja izteiksmi (4.3)pielieto nolasēm, kas iegūtas pēc līmeņu-šķērsojuma diskretizācijas principa, tad iegūtierezultāti ne vienmēr ir adekvāti pat neskatoties uz to, ka vienmēr signāls ir virsdiskretizēts(oversampled). Ilustrēsim to ar vienkāršu piemēru – mono harmonisks signāls ar frekvenci f 0ir diskretizēts pielietojot 3-bitu LŠ-ACP (7 līmeņi). Ar izteiksmi (4.3) iegūtais spektrālaisnovērtējums ir parādīts 4.1. zīm. Papildus patiesajai spektrālajai komponentei ar frekvenci~0.0955 Hz, parādās arī viltus izsitieni uz augstākām nepāra harmonikām. Tas nav dēļnepietiekama nolašu blīvuma, bet gan dēļ LŠ-ACP pieejas īpatnībām [5]. Līdz ar to rodasvajadzība pēc uzlabotiem DFT-veida pārveidojumiem, kas spētu novērst šāda veida artefaktuklātbūtni.Balstoties uz Furjē rindu, signāla laika formu no spektrāliem koeficientiem varatja<strong>un</strong>ot sekojošā veidā:M∑xˆ( t)= X exp( j2π tf ) , t ∈[ 0, Θ], (4.4)m=−Mmm29
“Oriģinālu signālu apstrādes paņēmienu izveide <strong>un</strong> izpēte konkurētspējīgu IT tehnoloģiju radīšanai”kurf = mm.Θ4.1. zīm. Spektrālais novērtējums sinusoidālam signālam ar f0= 12.22 / Θ ( Θ = 128 s. ),kurš diskretizēts izmantojot 7 līmeņu šķērsojumu momentus.Izmantojot informāciju par signālu x(t) , ir iespējams konstruēt atja<strong>un</strong>ošanas kļūdasf<strong>un</strong>kciju kā ε ( t)= x(t)− xˆ(t). Šīs f<strong>un</strong>kcijas sākumapgabals ir parādīts 4.2. zīm., kurāε n= ε ( t n) vērtības – atja<strong>un</strong>ošanas kļūda diskretizācijas laika momentos tn, ir ilustrētas artreknākiem p<strong>un</strong>ktiem. Var redzēt, ka atja<strong>un</strong>ošanas kļūda starp signāla nolašu laikamomentiem mēdz būt ievērojami lielāka nekā εnvērtības. Ja diskretizācija ir veidota pēctaktētāja izmantošanas principa, tad principā nav nekādu konkrētu nosacījumu par to, kas arsignāla vērtībām notiek starp tā nolasēm. Līmeņu-šķērsojuma diskretizācijas gadījumā katranolase ir definēta kā noteikta līmeņa šķērsojums <strong>un</strong> ir zināms, ka starp tām signāla vērtībaatrodas ierobežotā diapazonā . Tas ļauj izteikt ideju, ka signāla atja<strong>un</strong>ošanas kļūdu vajagminimizēt ne tikai nolašu p<strong>un</strong>ktos, bet arī starp tiem ar tik pat lielu svarīgumu. MinimizācijasuzdevumsΘ∫0() t2ε dt → min(4.5)var tik definēts paturot prātā, ka tā atrisināšanai ir zināmas tikai diskrētas oriģinālā signālavērtības <strong>un</strong> ka signāla atja<strong>un</strong>ošanai tiek izmantota izteiksme (4.4). Minimizācija ir jāveicattiecībā uz spektrāliem koeficientiem { X m} .4.2. zīm. Atja<strong>un</strong>ošanas kļūdas f<strong>un</strong>kcija (melnā līnija) <strong>un</strong> kļūdas nolašu ε n (trekniep<strong>un</strong>kti) interpolācija ar gabaliem konstantu f<strong>un</strong>kciju (sarkanā līnija).30
“Oriģinālu signālu apstrādes paņēmienu izveide <strong>un</strong> izpēte konkurētspējīgu IT tehnoloģiju radīšanai”Uzdevuma (4.5) risinājums var tikt balstīts uz divām pieejām:1) signāla nolases { x n} tiek interpolētas intervālā [ 0 Θ ] <strong>un</strong> atja<strong>un</strong>ošanas kļūda tiek izteikta( x)kā ε ( t ) = ~ x ( t)− X exp( j2πft), kur~ x ( t ) ir interpolētais signāls;∑mmm2) kļūdas nolases εn= xn− xˆntiek interpolētas intervālā [ 0 Θ ] , ņemot vērā, kax ˆn= ∑ Xmexp( j2πfmtn) .m4.2. DFT uzlabojums ar signāla nolašu interpolācijas palīdzību.Kā efektīvs signāla interpolācijas paņēmiens ir minams tā nolašu savienošana ar k -tāskārtas polinomiem p k n(t) , vai frekvenču joslā ierobežota interpolācija, kas tiek veikta arlaikā nobīdītu sinc f<strong>un</strong>kciju palīdzību.Pārrakstīsim izteiksmi (4.5) ņemot vērā, ka signāla nolases ir interpolētas:Θ∫0⎛⎜~ x⎝M( x)() t − X exp( j2f t) ⎟ dt → min∑m=−MLai atrastu minimumu, visus parciālos atvasinājumus pēcnullei. Tādejādi iegūstam 2 M +1 lineārus vienādojumuskur2Θ∫0⎛⎜~ x⎝M2⎞mπm(4.6)⎠X m( x)() t − X exp( j2f t)⎟⋅exp(j2πft)dt = 0∑k =−Mm = − M , M . Ņemot vērā, kaintervālā [ 0 Θ]. Līdz ar to varam rakstīt, ka:Θ∫0kir nepieciešams pielīdzināt⎞πkm(4.7)⎠f = mm, {exp( j2π fmt)}ir ortogonālu f<strong>un</strong>kciju kopaΘ( x)1X = ~mx ( t) exp( j2π fmt)dt . (4.8)ΘIzteiksme (4.8) ir līdzīga ar Furjē rindas koeficientu aprēķināšanas formulu signālam~ x ( t ) .Ja nolases tiek interpolētas ar nulltās kārtas polinomiem (gabaliem konstanta f<strong>un</strong>kcija,līdzīga tai kas atainota 4.2. zīm. ar sarkanu līniju), iegūstamkurX' t − n+ 1tn−1Δt n = .2( x0)mj=2πf=N −1∑n=0N −1∑m n=0xtn+ tn+ 12∫ntn+ tn−12nexp( j2πfx exp( j2πftmnmt)dt =)(1 − exp( − j2πfmΔt′)),(4.9)31
“Oriģinālu signālu apstrādes paņēmienu izveide <strong>un</strong> izpēte konkurētspējīgu IT tehnoloģiju radīšanai”4.3. zīm. Spektra novērtējums mono-harmoniskam signālam, ja pielietota pirmās kārtaspolinomu interpolācija.4.4. zīm. Spektra novērtējums mono-harmoniskam signālam, ja pielietota interpolācija arsinc f<strong>un</strong>kcijām.Gabaliem lineārai interpolācijai starp signāla nolasēm var izmantot polinomus1Δxnpn= αn( t − tn) + xn, kur αn= , Δx11Δt, n= xn− xn−Δtn= tn− tn−, kas dod:⋅X( x1)mN −1∑n=0i+2πfn= Xα expnN −1∑m n=0( x0)m+1( 2πf)( j2πft )( 1−exp( − j2f Δt))α Δtnnmnmexp2⋅( j2πft ) exp( − j2πfΔt).() t c sinc( 2Ω( t − kT ))mnmn+mn(4.10)Cita veida pieeja ir veikt { x n} interpolāciju ar sinc f<strong>un</strong>kcijām. Tā kā signāla frekvenčujoslas platums ir ierobežots ar Ω , varam rakstīt:~ x(sinc)K= ∑ −=k10k, (4.11)1kur T = , K : kT < Θ . Koeficientus c kvaram atrast no sekojošas vienādojumu2Ωsistēmas:~ (sinc)nt nx = x ( ) . (4.12)32
“Oriģinālu signālu apstrādes paņēmienu izveide <strong>un</strong> izpēte konkurētspējīgu IT tehnoloģiju radīšanai”Šajā gadījumā DFT-veidīgā transformācija ir nosakāma arK∑ − 1k=0( sinc) = c exp(X − j2π f kT ). (4.13)mkJāatzīmē, ka pēdējais apskatītais gadījums papildus DFT aprēķinu sarežģītībai pieprasaarī lineāras vienādojumu sistēmas ar N nezināmajiem <strong>un</strong> 2 M + 1 vienādojumiematrisināšanu.4.3. DFT uzlabojums ar atja<strong>un</strong>ošanas kļūdas nolašu interpolācijaspalīdzību.Līdzīgi signāla nolašu interpolācijai, arī atja<strong>un</strong>ošanas kļūdas laika f<strong>un</strong>kcija~ ε ( t ) var tiktiegūta no tās diskrētām nolasēm εn= xn− xˆnlaika momentos { t n } . Atgādināsim, kaatja<strong>un</strong>otā signāla nolases tiek aprēķinātas kā x ˆn= ∑ Xmexp( j2π fmtn) . Uzdevums (4.5) šajāmgadījumā var tikt interpretēts kā laukuma zem f<strong>un</strong>kcijas~ 2 2ε ( t)minimizācija. Ja ε nirinterpolēts ar nulltās kārtas polinomiem, tad minimizācijas uzdevums ir pierakstāms kā:kāN −1M⎛( ε 0)⎞∑⎜xn− ∑ Xmexp( j2πfmtn) ⎟n= 0 ⎝ m=−M⎠⋅ Δt′n→ min . (4.14)Pēc atvasinājumu pielīdzināšanas nullei, iegūstamNM⎛( ε 0)⎞2∑⎜x − ∑⎟Δ ′nXkexp( j2πfktn) exp( j2πfmtn) tn= 0n= 1 ⎝ k = −M⎠(4.15)Pārrakstot matricu formā, iegūstam(ε 0)Ψx = X ⋅ Φ ⋅ ΨΤ , (4.16)kur ϕmn= exp( j2πfmtn) <strong>un</strong> ψmn= ϕmn⋅ Δt′n. Izteiksmes (4.16) risinājums var tikt atrastsX(ε 0)Τ −1= ( Ψ ⋅ x)⋅ ( Φ ⋅ Ψ )m2, (4.17)T −1kur (⋅) <strong>un</strong> (⋅) attiecīgi apzīmē transponēšanas <strong>un</strong> invertēšanas operācijas.Interpolācija ar pirmās kārtas polinomiem noved pie sekojoša minimizācijas uzdevumanoformulēšanas:N −2N −11 ⎛ 22 ⎞⎜∑ε n⋅ Δtn+ ∑εn⋅ Δtn−1⎟ → min . (4.18)2 ⎝ n=0n=1 ⎠Tas ir uzskatāms līdzīgi kā divu nulltās kārtas problēmu summa. Risinājuma gaita šajāgadījumā ir līdzīga iepriekš aprakstītajai <strong>un</strong> varam iegūt::ΤΤ −( Ψ′′⋅x′+ Ψ′′⋅x′)( Φ′′⋅Ψ′′+ Φ′′⋅Ψ′′) 1(ε1)X =, (4.19)kur Φ ′,Ψ ′,x′<strong>un</strong> Φ ′ , Ψ′′, x′matricas ir veidotas no Φ, Ψ, x lietojot attiecīgi indeksācij<strong>un</strong> = 0,N − 2 <strong>un</strong> n = 1,N −1.33
“Oriģinālu signālu apstrādes paņēmienu izveide <strong>un</strong> izpēte konkurētspējīgu IT tehnoloģiju radīšanai”4.5. zīm. Spektra novērtējums mono-harmoniskam signālam, ja atja<strong>un</strong>ošanas kļūdasf<strong>un</strong>kcijai pielietota nulltās kārtas polinomu interpolācija.4.4. Uzlaboto DFT-veidīgo pārveidojumu modelēšanas rezultāti.Iepriekš aprakstīto algoritmu darbība tika novērtēta veicot datormodelēšanu. Šajāsakarībā valodā MATLAB ir uzrakstīta programmatūra, kuras izejas teksti ir pievienoti7.D pielikumā. Kā testa signāls tika izmantota mono-harmoniska signāla nolašu kopa, kasiegūta no Θ =128[sec] gara novērojuma izmantojot 7 līmeņu šķērsojuma notikumus. Testasignāla frekvence tika izvēlēta 12.22 / Θ ≈ 0.0955[Hz] , kas nozīmē, ka tā neatrodas uz Furjēanalīzes frekvenču režģa. Ar LŠ-ACP pieeju tika iegūtas N = 172 nolases.Ar vispārināto DFT (izteiksme (4.3)) iegūtais rezultāts paradīts 4.1. zīm. Tas var tiktsizmantots kā reference, lai salīdzinātu uzlabojumu kvalitāti. 4.3 zīm. rāda spektrālonovērtējumu, kas iegūts ar pirmās kārtas polinomu signāla interpolācijas algoritmu (izteiksme(4.10)). Lai gan viltus komponenšu amplitūdas ir samazinājušās (apmēram par 5dB), toklātbūtne spektrā tomēr ir jūtami ievērojama Aprēķinu sarežģītība ir dažas reizes lielāka parDFT. Nulltās kārtas polinomu interpolācijas izmantošana dod nedaudz sliktākus rezultātus.Frekvenču joslā ierobežota interpolācija ar sinc f<strong>un</strong>kcijām (izteiksme (4.13)) sniedzuzlabotāku spektrālo novērtējumu, kas ilustrēts 4.4. zīmējumā. Viltus komponenšu klātbūtneir pilnībā novērsta. Jāatzīmē, ka šī algoritma sarežģītība ir būtiski lielāka kā iepriekš minēto,jo ir nepieciešamība pēc lineāras vienādojumu sistēmas atrisināšanas.Līdzīgu kvalitāte <strong>un</strong> sarežģītība piemīt arī metodēm, kas balstās uz atja<strong>un</strong>ošanas kļūdasnolašu interpolāciju. Abos gadījumos (0-tās <strong>un</strong> 1-ās kārtas polinomi) iegūtie rezultāti irlīdzīgi, tāpēc te 4.5. attēlā ir parādītas tikai nulltās kārtas polinomu interpolācijas gadījums.Dažādu DFT-veidīgo pārveidojumu kvalitāte kvantitatīvi tikai novērtēta izmantojotintegrālās atja<strong>un</strong>ošanas kļūdas kritēriju. Iegūtie rezultāti apkopoti 4.1. tabulā.4.1. Tabula. Integrālā atja<strong>un</strong>ošanas kļūda dažādiem DFT-veida algoritmiem.Nulltās kārtas Pirmās kārtas xVispārinātaisnNulltās kārtasPirmās kārtasMetodeDFTx n x n interpolācija εεnninterpolācija interpolācija ar sincinterpolācijainterpolācijaΘ2∫ ε ( t)dt 835 811 803 3.00 2.35 2.290Visu DFT-veidīgo pārveidojumu kopīga iezīme ir tas, ka tie dod rezultātus uz Furjēfrekvenču režģa. Tas ierobežo spektrālo izšķiršanu. Lai to palielinātu var izmantotsarežģītākas metodes, piemēram, signālatkarīgo pārveidojumu [7]. Ar to būtu saistāminākamajos projekta etapos veicamie pētījumi, kuros apskatīt kā var paaugstināt rezultātukvalitāti, ja izmanto gan signālatkarīgu ACP, gan arī signālatkarīgas apstrādes metodes.34
“Oriģinālu signālu apstrādes paņēmienu izveide <strong>un</strong> izpēte konkurētspējīgu IT tehnoloģiju radīšanai”5. DASP virtuālo instrumentu attīstīšana izmantojotmodificētos algoritmusProjekta izpildes laika tiek radīti ja<strong>un</strong>i, oriģināli algoritmi. To veidošana nav pašmērķis,bet gan tie ir domāti kā līdzeklis dažādu signālu apstrādes uzdevumu risināšanai. Tāpēciegūtos algoritmus ir jācenšas ieviest praktiski pielietojamās sistēmās. Viens no šādiemnovirzieniem ir saistīts ar algoritmu implementēšanu LabVIEW. Tā ir ērti lietojama grafiskāprogrammēšanas vide, kas ir paredzēta beigu lietotājam, kura programmēšanas zināšanas navtik augstas. Iepriekšējo ciparotāju programmnodrošinājums tika veidots MatLab <strong>un</strong>LabWindows vidēs, kas prasa padziļinātas zināšanas programmēšanā. Pielietojot LabVIEW iriespējams veidot programmu izmantojot gatavos LabVIEW blokus, kas ir sadalīti divāskategorijās: grafiskā lietotāja interfeisa izveidei <strong>un</strong> algoritmu izveidei. Turpmāk ir apskatītsplatjoslas ciparotāja vadības bloka izveide, izmantojot gatavos blokus, kā arī ja<strong>un</strong>radītoalgoritmu implementācijas iespējas.5.1. Platjoslīga <strong>un</strong> plaša dinamiskā diapazona ciparotāja vadībaLabVIEW vidēLabVIEW jau ir iebūvēti vairāki gatavi bloki, kas darbojas ar standarta iekārtām <strong>un</strong>lietotājam, kas pielieto standarta risinājumus nav nepieciešams veidot savus vadības blokus.DIGITIZER B042 ar datoru tiek saslēgts caur paralēlo portu, kas darbojas EPP 1.9 režīmā,diemžēl LabVIEW neuztur EPP 1.9 režīmu. Šī iemesla dēļ ir izveidota dinamisko saišubibliotēka (DDL), kura ir importēta LabVIEW <strong>un</strong> ir izveidoti vadības bloki port_in <strong>un</strong>port_out. Pielietojot šos blokus ir iespējams datus nosūtīt <strong>un</strong> saņemt no ārējās iekārtas, kasstrādā EPP 1.9 režīmā.Pirms sākt ciparot datus ar DIGITIZER B042 ir nepieciešams iekārtu inicializēt, kopanāk nosūtīt sekojošas komandas:Tabula 5.1. Iekārtas parametru nomešanaDarbībasNr.Darbības nosaukums Adrese Dati1 Iestāda rakstīšanas režīmu BASE+2 0x012 Iestāda rakstīšanas režīmu BASE+2 0x053 Iestāda visu parametru nomešanas režīmu BASE+3 0x014 Visu iekārtas parametru nomešana BASE+4 0x005 Nolasa status reģistru BASE+1Tabula 5.2. Raksta datus FIFO atmiņāDarbībasNr.Darbības nosaukums Adrese Dati1 Iestāda EPP rakstīšanas režīmā BASE+2 0x052 Iestāda visu parametru nomešanas režīmu BASE+3 0x013 Visu iekārtas parametru nomešana BASE+4 0x004 Iestāda diskretizācijas režīmuUniformNonUniformBASE+30x0A0x025 Sāk datu ciparošanu BASE+4 0x0035
“Oriģinālu signālu apstrādes paņēmienu izveide <strong>un</strong> izpēte konkurētspējīgu IT tehnoloģiju radīšanai”Tabula 5.3. Lasīt datus no FIFO atmiņas uz datoruDarbībasNr.Darbības nosaukums Adrese Dati1 Iestāda EPP rakstīšanas režīmā BASE+2 0x052 Iestāda iekārtu FIFO lasīšanas režīmā BASE+3 0x403 Iestāda EPP lasīšanas režīmā BASE+2 0x044 Nolasa datus no FIFO atmiņas BASE+4Tā kā DIGITIZER B042 ir 12bitu ACP, bet paralēlais ports ir tikai 8 bitu, tad dati tiekspeciāli formēti, lai tos noraidītu uz datora. No sākuma noraida pirmos 8 bitus <strong>un</strong> pēc tamatlikušos 4, bet atlikušos 4 bitus aizpilda ar 0. Kad dators ir saņēmis datus, tad irnepieciešams datus konvertēt atpakaļ uz 12 bitu datiem. Pēc visām šīm darbībām notieksignāla attēlošana <strong>un</strong> apstrāde.Apstrādes algoritmu implementācija <strong>un</strong> grafiskā lietotāja interfeisa izveide ir aprakstītanākošajās apakšnodaļās.5.2. Ja<strong>un</strong>radīto signālu apstrādes algoritmu implementācijaLabVIEWLabVIEW ir plašs matemātisko darbību bloku skaits, ar kuru palīdzību var realizētjebkuru matemātisku darbību. Signālu apstrādes algoritmu pamatā ir darbības ar vektoriem,masīviem <strong>un</strong> matricām. Lai LAbVIEW sareizinātu divus vektorus tie ir jānoformē kāmatricas, kuru viena dimensija ir 1. To var panākt viendimensiju masīvu laižot cauri forciklam, kurš atkārtojas tikai vienu reizi (Skat zīm. 5.1.a). Tā kā for cikls vektoram piešķirindeksus, tad cikla izejā ir matrica. Pēc pārvēršanas pirmo matricu transponē <strong>un</strong> sareizina arotro matricu, izmantojot A x B bloku (Skat. zīm. 5.1.b). Lai matricu pārvērstu atpakaļvektorā, matricu nepieciešams laist cauri for ciklam, kuram izejā ir izslēgti indeksi.a) b)2903671ArrayABAxBZīm.5.1. a) vektora pārvēršana par viendimensiju matricu, b) matricu reizināšana.Pilnu DFT algoritma implementācijas grafisko shēmu var redzēt zīm. 5.2.81ArrayArray40962-10111Vizualization20errorZīm. 5.2. DFT grafiskā implementācija LabVIEW.36
“Oriģinālu signālu apstrādes paņēmienu izveide <strong>un</strong> izpēte konkurētspējīgu IT tehnoloģiju radīšanai”Ar LabVIEW palīdzību grafiskā veidā var realizēt jebkuru algoritmu. Diemžēl šis processir darbietilpīgāks, ja salīdzina tāda paša algoritma izveidi C/C++ valodā. Šai gadījumā ganjāpiemin cits pozitīvais aspekts. Gala lietotājam nav jāpatērē daudz laika, lai izprastualgoritma darbības principu <strong>un</strong> nepieciešamības gadījumā viņš var viegli <strong>un</strong> ērti uzlabotalgoritmu.5.3. Grafisko Lietotāju Interfeisu izveideLabVIEW ir ērti <strong>un</strong> vienkārši veidot grafisko lietotāja interfeisu. Atverot ja<strong>un</strong>u virtuālāinstrumenta priekšējo paneli <strong>un</strong> nospiežot labo peles pogu parādās izvēlne, kurā var izvēlētiesgrafiskās ierīces, tas ir, kontroles, indikatorus, izvēlnes utt. Izvietojot tās uz darba virsmasgrafiskā vide ātri <strong>un</strong> ērti ir izveidota. Zem grafiskās vides slēpjas visu grafisko elementusavienojumi ar vadības apstrādes algoritmu blokiem.Zīm. 5.3. Virtuālā instrumenta grafiskais interfeiss.37
“Oriģinālu signālu apstrādes paņēmienu izveide <strong>un</strong> izpēte konkurētspējīgu IT tehnoloģiju radīšanai”6. Asinhrono mikroprocesoru pielietojamība ar beztaktētājaanalogs-ciparu pārveidotāju iegūtu datu energoekonomiskaiapstrādei6.1 Enerģijas patēriņa minimizācijas modeļiEnerģijas patēriņa minimizācijai vienkāršā signālu apstrādes sistēmā (zīm.6.1),iespējamas vairākas alternatīvas:1. nepārtraukta periodiska datu plūsmas nolase no datu avota katrā analogo datupārveides ciklā, izmantojot katru ārējo procesora sinhronizācijas periodu, <strong>un</strong> datuapstrāde ar sinhrono (standarta) mikroprocesoru; ‘2. datu nolase atbilstoša p.1., bet datu apstrāde ar programmējamu DVS <strong>un</strong> DMmikroprocesoru;3. stohastiska datu nolase no datu avota momentos, kad ieejas signāla U a vērtībasizmaiņa ⎢Δ U a ⎢> δ , izmantojot asinhrona procesora rokspiešanas (handshaking)porta signālus req – ack, <strong>un</strong> datu apstrādi šajā procesorā, zīm. 6.1.a;4. datu nolase atbilstoša p.3.bet rokspiešanas <strong>un</strong> datu apstrāde organizācija asinhronārekonfigurējamā FPGA , zīm. 6.1.b.ClockACPμPcDatiZīm. 6.1reqreqACPackAμPcACPackAμPcFPGADatiDatiZīm. 6.1.aZīm. 6.1.bLai aptuveni novērtētu <strong>un</strong> salīdzinātu šās sistēmas pieņem, ka nosacījums ⎢Δ U a ⎢> δizpildās vienmērīgi izkliedētos laika intervālos τ = 1, 2, 3 , 4, 5 ms , bet katra pieprasījumaapstrāde t E = 1ms, kurās sistēmā 1. tiek patērēta enerģija 10×1. Sistēmā 1. <strong>un</strong> 2. ieejas signālaaptauja notiek ar 0,1ms garu strobējošu signālu pēc laika intervāla t S = 1ms, t.i., pie katrasstrobēšanas patērējot enerģiju 10×0,1. Vienā regulārā ciklā 1.sistēmā aprēķinam tiek patērētaenerģija 10×5=50 <strong>un</strong> strobēšanai 1×15=15 ΣE=65. Otrā tipa sistēmās izmantojot DVS,pamatojoties uz [18] veiktajiem aprēķiniem, var pieņemt ka laika intervālā τ 1 enerģijaspatēriņš 10×1 =10, τ 2 =4×2=8, τ 3 = 1×3=3, τ 4 = 0,5×4=2, τ 5 = 0,1×5=0,5 (E p = 23,5),strobēšanai E s =15: ΣE=38,5.Sistēmā 3., kurā izmantots asinhronais procesors, nav ieejas strobēšanas signālu <strong>un</strong>enerģija strobēšanai netiek tērēta E s = 0, bet instrukcijas izpildei patērētā enerģija aptuvenivar būt ×5 mazāka par enerģijas patēriņu analogā sinhronā procesorā [19].Tāpēc var uzskatīt, kopējais enerģijas patēriņš ΣE= 0 + 5× 10/5 = 10.38
“Oriģinālu signālu apstrādes paņēmienu izveide <strong>un</strong> izpēte konkurētspējīgu IT tehnoloģiju radīšanai”Sistēma 4. strobēšanai enerģija netiek tērēta E s = 0, bet pārējais pagaidām miglā tīts.6.2 Asinhronā procesora enerģijas taupības iespējasA. Asinhronās f<strong>un</strong>kcionālās ierīces patērē enerģiju tikai darot lietderīgu darbu. Turpretimsinhronajā procesorā takts frekvenci jāizvēlas tā, lai procesors varētu izpildīt uzdevumu piemaksimālās slodzes. Tāpēc procesora takts frekvence bieži ir augstāka kā nepieciešams, <strong>un</strong>rezultātā tiek lieki tērēta enerģija.B. Asinhronās f<strong>un</strong>kcionālās ierīces apmaiņas ar datiem izmantojot asinhrono„Micropipelines” rokspiešanas protokolu (zīm. 6.2.)DatiReqAckzīm. 6.2.Realizējot šo protokolu:1. Sūtītājs (Sender) uz kopnes uzliek datus (Data)2. Sūtītājs ģenerē signālu Req (Request)3. Saņēmējs (Receiver), kad ir tam gatavs, akceptē datus4. Saņēmējs ģenerē <strong>un</strong> noraida Sūtītājam signālu Ack (Acknowledge)5. Pēc Acknowledge saņemšanas Sūtītājs var noņemt no kopnes datus <strong>un</strong> ir gatavsja<strong>un</strong>u datu nosūtīšanaiAsinhronajam „Micropipelines” protokolam ir divi realizācijas varianti:a) Variantā, kas parādīts zīm.6.2. signālu ģenerēšana notiek pie sprieguma līmeņuaugošas vai krītošas izmaiņas, bet, kā redzams, Req <strong>un</strong> Ack var saglabāties arīlakā, kad datu pārraide nenotiek (lieks enerģijas patēriņš!) [20]b) Variantā, kas ieguvis nosaukumu ‘’līmeņa signalizācija’’, izmantojot krītošās <strong>un</strong>augošās spriegumu maiņas, tiek veidoti īsi Req <strong>un</strong> Ack signāli, kas ir aktīvi tikaidatu pārraides laikā <strong>un</strong> lieku enerģiju nepatērē [21].C. Visi asinhronā procesora mezgli (bloki) f<strong>un</strong>kcionē pēc konveijera principa (pipeline),bet šos konveijerus iespējams apstādināt jebkurā darbības posmā (fāzē), pēc kuras enerģijavairs netiek patērēta.D. Parasti netiek pielietota kešatmiņa, kuras darbināšana saistīta ar ievērojamu enerģijaspatēriņu reģistros <strong>un</strong> statiskajā brīvpiekļuves atmiņas (RAM) šūnās.E. Veidojot ātrdarbīgus (32 bitu) asinhronus RISC procesoru par bāzi izvēlēta populārāARM arhitektūra, kas pateicoties izdevīgajai instrukciju kopai, nodrošina visai mazuenerģijas patēriņu.39
“Oriģinālu signālu apstrādes paņēmienu izveide <strong>un</strong> izpēte konkurētspējīgu IT tehnoloģiju radīšanai”6.3 Asinhrono procesoru raksturojumi <strong>un</strong> lietojumsAMULET1 izstrāde Oksfordas Universitātē parādīja iespēju izveidot pilnīgi asinhronuARM arhitektūras procesoru. Tomēr enerģijas patēriņš 83mW pārsniedza sinhronā ARM6patēriņu 75mW [20].AMULET2e tiek pilnīgāk nekā -AMULET1 izmantotas asinhronās kopnes priekšrocības(augstāk apskatītais Micropipeline b) variants). Enerģijas patēriņš tika samazināts [21].AMULET3 kodolā izmantota ARM4T versija ar ja<strong>un</strong>u iekšējo mikroarhitektūru. Izpildeskārtības maiņas bufera ieviešana atļauj paaugstināt ātrdarbību līdz 100MIPS. Enerģijaspatēriņa ietaupījumu panāk:1. izmantojot speciālu HALT instrukciju, kas momentā pārtrauc instrukcijupriekšnolasīšanu (prefetching) <strong>un</strong> likvidē izpildmezgla enerģijas patēriņu,2. sadalot atmiņu mazos 1k blokos,3. ARM 32 bitu instrukciju vietā, izmantojot vienkāršotu 16 bitu Thumb instrukcijukopu [22].AMULET3i izveidota saglabājot AMULET3 kodolu <strong>un</strong> balstoties uz asinhrono kopniMARBLE. Paredzēts uz AMULET3i bāzes uzsākt ražot ierīci Draco - Radio Comm<strong>un</strong>isationController.Praktiskus risinājumus, kas novesti līdz ražošanas uzsākšanai devis firmas Philipsuzņēmums „Handshake Solution”. Te uzsākta divu veidu asinhronu procesoru ražošana.1) RISC arhitektūras 32 bitu ARM996HS:InstuctioninterfaceARM 9coreDatainterfaceDividecoprocessorARM996HSMemoryProtection<strong>un</strong>itWrite BufferControl Logic and Bus interface UnitInstuction MasterinterfaceData MasterinterfaceZīm. 6.340
“Oriģinālu signālu apstrādes paņēmienu izveide <strong>un</strong> izpēte konkurētspējīgu IT tehnoloģiju radīšanai”ARM996HS arhitektūra: 32 bitu <strong>un</strong> 16 bitu Thumb instrukciju kopas u.c. rādītāji atbilstpopulārajam sinhronajam procesoram ARMT9E, kas pats par sev ir ARM arhitektūrasprocesors ar mazāko enerģijas patēriņu <strong>un</strong> ir piemērots reālā laika lietojumiem[23].ARM996HS spēj automātiski adaptēties apkārtējās vides (temperatūras, barošanassprieguma) maiņām.Saskarne ar ārējām ierīcēm tiek nodrošināta izmantojot ar enerģiju maztērējošo interfeisamoduli (master) AMBA <strong>un</strong> rokspiešanas principu.Rokspiešanas testprogrammas realizācijas ir parādījusi, ka pie vienādas ātrdarbībasARM996HS enerģijas patēriņš ir bijis 0.045mW, bet sinhronā procesora ARMT9E sasniedzis0.13 mW [23].2) Mikrokontrollera HT80C51:ROMRAMexternal synchronouspheripherialsynchronous busHT80C5180C51coreInteruptControllersynchronousbrigeHT asynchronous busexternal handsakepheripherialZīm. 6.4HT80C51 atbilst vienam no populārākajiem mikrokontrolieriem 80C51 <strong>un</strong> var pildītvisas 80C51 izveidotās programmas, kā arī 80C51 atmiņas <strong>un</strong> ārējo iekārtu interfeisu.Bez zīm.4. parādījām komponentēm HT80C51, sastāvā ir arī 2 taimeri, kā arī UART, SPI<strong>un</strong> I 2 C kontrolleri [19].HT80C51var darbināt arī sinhronā režīmā.Instrukcijas veikšanai HT80C51 patērē 89pJ, bet sinhronais 80C51 patērē 500pJ.Miera stāvoklī (idle mode) HT80C51 enerģiju nepatērē.41
“Oriģinālu signālu apstrādes paņēmienu izveide <strong>un</strong> izpēte konkurētspējīgu IT tehnoloģiju radīšanai”7. Pētījumi datu apstrādes sistēmu realizācijai beztaktētājaelektroniskās iekārtās7.1 Transformāciju ar taisnstūra f<strong>un</strong>kcijām pielietojumsTradicionāli signāla spektra aprēķināšanai izmantojot Furjē transformāciju (FT). Šeitspektra aprēķināšanai lieto divas sinusoīdas, vienu no otras nobīdītu fāzē par 2π . FT aprēķinsir relatīvi sarežģīts <strong>un</strong> prasa daudz laika. Elektroniskajās shēmās FT izmantošana prasa lielustrāvās patēriņu, pie tam ir jāveic reizināšanas operācija, kas ir diezgan grūti realizējama. JaFT izmantotās sin <strong>un</strong> cos f<strong>un</strong>kcijas aizstāj ar taisnstūra f<strong>un</strong>kcijām, var saīsināt spektraaprēķina algoritmu, kā arī samazināt elektroniskās iekārtās enerģijas patēriņu, kas ir svarīgiiekārtām, kas darbojas ar enerģiju uzkrājošiem elementiem (baterijām, akumulatoriem utt.).Taisnstūrf<strong>un</strong>kciju FT koeficientus var novērtēt kā [8]:tba 1n= ∫ sign(t)⋅sin(2π ⋅ f ⋅tdtt − t)(7.1)ba takur t a - laiks aplūkojamā signāla sākuma momentāt b - laiks aplūkojamā signāla beigu momentāsign(t) – aplūkojamais signālsŠeit apskatīts tikai viens FT koeficients, otrs ir identisks tikai nobīdīts fāzē par 2π .Izmantojot spektra aprēķināšanai taisnstūra f<strong>un</strong>kciju, kura pieņem vērtībukoeficienta izteiksmi var pierakstīt [1]:±1, šī paša,antbt⎡ 1 t1t2t211= ⋅ = ⎢ − + −−∫ sig(t)R(f , t)dt−∫sign(t)dt ∫sign(t)dt ∫sign(t)dtt∫btattbta⎢a⎣tat2t3t3⎤sign(t)dt + ..... ⎥⎥⎦(7.2)kur R(f,t) – taisnstūra f<strong>un</strong>kcijaKā redzams no izteiksmes, ja izmanto taisnstūra f<strong>un</strong>kciju kā filtrējošo f<strong>un</strong>kciju, tadreizināšanas darbība tiek aizstāta ar saskaitīšanu, kas ir daudz vienkāršāk realizējamaoperācija.a) b)S mS mS m/2π 2πtS m/2π a 4a 5a 6a 1a 2a 32πt-S m/2a 1a 2a 3a 4a 5a 6…………..-S m/2-S ma 1=π/4a 2=π/2a 3=3π/4a 4=5π/4a 5=3π/2a 6=7π/4-S ma 1=π/6a 2=π/2a 3=11π/12a 4=13π/12a 5=3π/2a 6=23π/12Zīm. 7.1.1. Taisnstūra f<strong>un</strong>kcijas a) ar vienādu samēru, b) ar nevienādu samēru42
“Oriģinālu signālu apstrādes paņēmienu izveide <strong>un</strong> izpēte konkurētspējīgu IT tehnoloģiju radīšanai”Ja kā taisnstūra f<strong>un</strong>kciju izmanto f<strong>un</strong>kciju ar vērtībām ± 1 <strong>un</strong> 0, tad attiecīgajām pētāmāsignāla vērtībām jāpiešķir pluss vai mīnus zīme, bet tās vērtības, kuras atrodas nullesintervālā ir nulle <strong>un</strong> vispār nav jāņem vērā. Spektra aprēķināšanai tiek izmantotas divasidentiskas taisnstūra f<strong>un</strong>kcijas – viena attiecībā pret otru nobīdīta fāzē par 2π .Kā bāzes f<strong>un</strong>kcijas tika izmantotas:Klasiskais meandrsTaisnstūra f<strong>un</strong>kcijas ar vienādu samēru <strong>un</strong> vērtībām ± 1 <strong>un</strong> 0 (zīm. 7.1.1 a)Taisnstūra f<strong>un</strong>kcijas ar nevienādu samēru <strong>un</strong> vērtībām ± 1 <strong>un</strong> 0 (zīm. 7.1.1 b)Trepveidīgas f<strong>un</strong>kcijas ar vērtībām ± 1; ± 2 <strong>un</strong> 0Volša f<strong>un</strong>kcijasKā bāzes f<strong>un</strong>kcijas izmantojot Volša f<strong>un</strong>kcijas, signāla spektrā ir daudz viltuskomponentes. Tas skaidrojams ar to, ka Volša f<strong>un</strong>kciju spektrs ir lēni rimstošs, pie tam novisas Volša f<strong>un</strong>kciju saimes dažām f<strong>un</strong>kcijām ir gandrīz vienādas spektra blakuskomponentes. Arī meandra <strong>un</strong> trepveidīgo taisnstūra f<strong>un</strong>kciju ar vienādu samēru izmantošanapar bāzes f<strong>un</strong>kcijām dod sliktus rezultātus dēļ lēni rimstošā spektra. Veicot taisnstūraf<strong>un</strong>kcijas Furjē analīzi, redzams, ka šo f<strong>un</strong>kciju spektrā ir nepāra komponentes (zīm. 7.1.2 a),kas iespaido pētāmā signāla spektru (zīm.7.1.3 a).a) b)0.450.7Spektra novertejums, dB0.40.350.30.250.20.150.10.0500 5 10 15 20 25 30Frekvence, HzSpektra novertejums, dB0.60.50.40.30.20.100 5 10 15 20 25 30Frekvence, HzZīm. 7.1.2 Taisnstūra f<strong>un</strong>kciju spektrs a) ar vienādu samēru; b) ar nevienādu samēruZīm. 7.1.3 a attēlots spektrs sinusoīdai ar frekvenci 15 Hz, kas diskretizēta ar vienmērīgodiskretizāciju [9], spektra aprēķinam izmantojot taisnstūra f<strong>un</strong>kciju ar vienādu samēru <strong>un</strong>vērtībām ±1 <strong>un</strong> 0 (zīm. 7.1.1 a). Zīm. 7.1.3 b attēlots spektrs sinusoīdai, kas diskretizēta arlīmeņu šķērsošanas ACP, izmantojot 4 bitu līmeņus <strong>un</strong> iepriekš minēto taisnstūra f<strong>un</strong>kciju.Šeit spektrā parādās daudzas viltus komponentes ,kuras nav vienmērīgi diskretizēta signālaspektrā. Dažas no spektra viltus komponentēm var samazināt, izmantojot taisnstūra f<strong>un</strong>kcijasar nevienādu samēru (zīm. 7.1.1 b). Ja taisnstūra f<strong>un</strong>kcijai ar vērtībām ±1 <strong>un</strong> 0 vieniniekaattiecība (pret visu f<strong>un</strong>kcijas viena perioda garumu) ir 2/3, bet nulles attiecība 1/3, var iegūtspektru, kurā būs pazudušas 3, 9, 15 ... komponentes (zīm 7.1.2 b) [8]. Izmantojot šāduf<strong>un</strong>kciju kā bāzes f<strong>un</strong>kciju signāla spektra aprēķinam, pazūd attiecīgās viltus komponentesgan vienmērīgi diskretizēta signāla spektrā (1 <strong>un</strong> 5 komponente(zīm. 7.1.3 c)), gan ar līmeņušķērsošanu diskretizētā signāla spektrā (zīm 7.1.3 d). Bet pie līmeņu šķērsošanasdiskretizācijas paliek visas pārējās viltus komponentes, gan nedaudz samazinājušās. Tas liekdomāt, ka bāzes f<strong>un</strong>kcijas izvēle maz ietekmē tās viltus komponentes, kuras atrodas aizsignāla frekvences (šajā gadījumā 15 Hz). Palikušās viltus komponentes var vēl samazināt,ņemot vērā laukumu starp divām blakus esošajām diskretizētā signāla nolasēm (delta -43
“Oriģinālu signālu apstrādes paņēmienu izveide <strong>un</strong> izpēte konkurētspējīgu IT tehnoloģiju radīšanai”izmaiņa). Tas nozīmē: no pašreizējās nolases laika vērtības atņem iepriekšējās nolases laikavērtību <strong>un</strong> iegūto starpību reizina ar pašreizējās nolases amplitūdu:S = ( tt− tv) ⋅ A(7.3)kur t t – tekošais laika moments,t v – iepriekšējais laika moments;A – diskretizētā signāla amplitūda laika momentā t ta) b)Spektra novertejums10.90.80.70.60.50.40.30.20.1Spektra novertejums0.80.70.60.50.40.30.20.100 10 20 30 40 50 60 70Frekvence, Hzc) d)00 10 20 30 40 50 60 70Frekvence, Hz1.40.81.20.710.6Spektra novertejums0.80.6Spektra novertejums0.50.40.30.40.20.20.100 10 20 30 40 50 60 70Frekvence, Hze) f)00 10 20 30 40 50 60 70Frekvence, Hz0.091.4Spektra novertejums0.080.070.060.050.040.030.020.01Spektra novertejums1.210.80.60.40.200 10 20 30 40 50 60 70Frekvence, Hz00 10 20 30 40 50 60 70Frekvence, HzZīm. 7.1.3 Spektrs a) vienmērīgai diskretizācijai ar vienādu taisnstūra f<strong>un</strong>kcijassamēru; b)līmeņu šķērsošanas diskretizācijai ar vienādu taisnstūra f<strong>un</strong>kcijas samēru;c)vienmērīgai diskretizācijai ar nevienādu taisnstūra f<strong>un</strong>kcijas samēru; d) līmeņu šķērsošanasdiskretizācijai ar nevienādu taisnstūra f<strong>un</strong>kcijas samēru; e) līmeņu šķērsošanas diskretizācijaiar nevienāds taisnstūra f<strong>un</strong>kcijas samērs, ņemot vērā laukumu pirms spektra komponentes(delta-izmaiņa); f) nevienmērīgai diskretizācijai ar nevienādu taisnstūra f<strong>un</strong>kcijas samēru.44
“Oriģinālu signālu apstrādes paņēmienu izveide <strong>un</strong> izpēte konkurētspējīgu IT tehnoloģiju radīšanai”Izmantojot šādu paņēmienu, ievērojami samazinās kā viltus komponentes, tā arī signālaīstās komponentes (zīm. 7.1.3 e), pie kam viltus komponenšu samazināšanās ir daudzievērojamāka. Tas ļauj izdalīt no visa spektra īstās signāla komponentes.Veicot signāla (šajā gadījumā sinusoīdas) nevienmērīgo diskretizāciju, tas ir – laikamomenti, kad signāls tiek diskretizēts tiek izvēlēti nejauši (zīm. 7.1.3 f), spektrā pazūd visaskomponentes, kas nav saistītas ar taisnstūra f<strong>un</strong>kcijas spektru. Spektrs sāk līdzinātiesvienmērīgi diskretizēta signāla spektram, ar atšķirību, ka netiek novērota spektra pārklāšanās,kas parādās vienmērīgi diskretizēta signāla spektrā dēļ diskretizācijas soļa periodiskuma.Nevienmērīgās diskretizācijas realizēšana elektroniskajā aparatūrā ir sarežģīta, tādēļveiktajam pētījumam tā neder, jo mērķis ir radīt elektronisko aparatūru, kas patērētu mazākenerģiju nekā pašreiz esošās <strong>un</strong> būtu ar ātrāku darbības algoritmu.Daudzo viltus komponenšu parādīšanās pie līmeņu šķērsošanas diskretizācijasskaidrojama ar to, ka nolases ir regulāras (ja diskretizējamais signāls ir regulārs). Tās lieksecināt, ka līmeņu šķērsošanas diskretizācija ir efektīva, ja ieejas signāls ir nestacionārs.Stacionāru signālu gadījumā, taisnstūra f<strong>un</strong>kcijas <strong>un</strong> līmeņu šķērsošanas diskretizāciju varpielietot, ja ir zināms, kāda ir uztveramā signāla frekvence (apskata signāla spektru šaurājoslā) <strong>un</strong> pārējās spektra komponentes tad ir atmetamas. Ja izmanto delta – izmaiņa spektrarēķināšanas metodi <strong>un</strong> taisnstūra f<strong>un</strong>kcijas ar nevienādu samēru, līmeņu šķērsošanasdiskretizāciju var lietot arī signāla uztveršanai ar iepriekš nezināmu frekvenci, jo viltuskomponentes tiek ievērojami nospiesta.7.2 GSM signālu apstrādes beztaktētāja sistēmas modelisDarba mērķis ir izveidot Matlab vidē datu pārraides sistēmas modeli, kurš darbotos arlīmeņu šķērsošanas ACP <strong>un</strong> izmantotu taisnstūra f<strong>un</strong>kcijas. Kā datu pārraides sistēma irizvēlēta GSM sistēma, kurā izmanto GMSK modulāciju. Programmas ieejā ir dati binārāveidā (zīm. 7.2.1).FāzeTROKSNISDa ti101001ModulācijaLīmeņušķēsošanasACPNesējfrekvenceTaisn stūraf<strong>un</strong>kcijasFāzesaprēķināšanaDa ti101001Zīm. 7.2.1. Beztaktētāja sistēmas modeļa shēmaAtkarībā no ieejas datu (nuļļu <strong>un</strong> vieninieku) secības, tiek ģenerēta fāzes izmaiņa. Laifāzes izmaiņai (līdz ar to arī nesēj signāla izmaiņai) nebūru asu lēcienu, tiek izmantots Gausafiltrs. Fāzes izmaiņa tiek pieskaitīta nesējsignāla fāzei (tiek veikta fāzes modulācija).−8Nesējsignāla frekvence ir 890.2 MHz. Viena simbola pārraides laiks ir 1⋅10sek<strong>un</strong>des. Šeitir atšķirība no GSM sistēmas, kur viena simbola pārraides laiks ir 3,6923 mikrosek<strong>un</strong>des[10]. Samazinot simbola garumu, var iegūt daudz lielākus datu pārraides ātrumus. Šajā45
“Oriģinālu signālu apstrādes paņēmienu izveide <strong>un</strong> izpēte konkurētspējīgu IT tehnoloģiju radīšanai”gadījumā datu pārraides ātrums aptuveni nekā 360 reizes lielāks, kā GSM sistēmā. Lai modelipietuvinātu reālajiem apstākļiem, modulētajam signālam pārraides laikā tiek pievienotsbaltais troksnis. Uztvērējā signāls tiek diskretizēts ar līmeņu šķērsošanas ACP. Diskretizētāsignāla fāzes aprēķināšanai izmanto taisnstūra f<strong>un</strong>kcijas ar vienādu samēru. Taisnstūraf<strong>un</strong>kcijas pieņem vērtības ±1. Fāzi aprēķina nelielam signāla gabalam, kuru no visa kopējāsignāla izgriež ar logu. Tad logu pārbīda tālāk <strong>un</strong> atkal aprēķina signāla fāzi. Iegūtās fāzesvērtības salīdzina ar signālu, kuram ir tāda pati frekvence kā nesējsignālam, bet nemainīgafāze. Atkarībā no fāzes izmaiņas, tiek atkodēti pārraidītie dati. Izmantojot līmeņu šķērsošanasACP ar 5 bitiem, uztvertā signāla fāzes izmaiņa ir identiska raidītā signāla fāzes izmaiņai(zīm. 7.2.2a).a) b)4Raidita signala fazes izmainaUztverta signala fazes izmaina4Raidita signala fazes izmainaUztverta signala fazes izmaina3322Faze, rad1Faze, rad100-1-1-20 0.5 1 1.5 2 2.5 3 3.5 4 4.5laiks, sx 10 -7-20 0.5 1 1.5 2 2.5 3 3.5 4 4.5Laiks, sx 10 -7Zīm 7.2.2 Uztvertā <strong>un</strong> raidītā signāla fāzes izmaiņa a) ideālā kanālā b) kanālā ar troksniFāzes izmaiņu neietekmē taisnstūra f<strong>un</strong>kcijas veida izvēle, tādēļ ir izdevīgi izvēlētiesf<strong>un</strong>kciju, kura pieņem tikai divas vērtības (tas ir ± 1). Rezultātā diskretizētā signālaamplitūdas vērtībām piešķir “+” vai “-” zīmi <strong>un</strong> visas vienā logā ietvertās vērtības saskaita(nav nepieciešams izmantot reizināšanas operāciju). Šāds algoritms ievērojami varieekonomēt iekārtas elektroenerģijas patēriņu, kā arī samazināt datu apstrādes laiku.Minimālais bitu skaits, kas nepieciešams diskretizējot signālu ar līmeņu šķērsošanasdiskretizāciju, ir trīs. Izmantojot šādu ACP, signāla fāzes izmaiņu ir iespējams samērā precīziaprēķināt. Taču krietni labāki rezultāti ir, ja izmanto 4 bitu līmeņu šķērsošanas ACP. Jakanālam pievieno balto troksni ar SNR ir 67,7 dB (zīm. 7.2.2.b), fāzes izmaiņa tiekizkropļota, taču pārraidītos bitus ir iespējams atpazīt nekļūdīgi. Jāņem vērā, ka modeļa ieejānetiek izmantots filtrs, kas daļēji izfiltrētu uztveramo signālu no trokšņa.Turpmākie darba mērķi:1) Daudzkanālu GSM beztaktētāja sistēmas modeļa izstrāde.2) Izveidot uztverto datu atpazīšanu ar koriģējošajiem kodiem. Pašreiz izstrādātajāmodelī atkodējot kādu bitu kļūdaini, tālāk sekojošie biti tiek nepareizi atpazīti.3) Izveidot modeli, kura ieejā ir filtrs, kas izfiltrē signālu, tādējādi samazinot trokšņalīmeni.46
“Oriģinālu signālu apstrādes paņēmienu izveide <strong>un</strong> izpēte konkurētspējīgu IT tehnoloģiju radīšanai”SākumsIelādē datus no līmeņušķersošanas ACPIestāda loga garumu<strong>un</strong> loga pārvietošanassoliFormē logu skaitusignālāFormē logā ietilpstošāssignāla laika vērtībasFormē taisnstūrveidaf<strong>un</strong>kcijas zīmiRēķina logā ietvertāsignāla fāziVai signāla beigas?nējāKoriģē fāzes vērtībuUztvertā signālafāzes izmaiņaAtkodē datusAprēķina BERZīm 7.2.3. Fāzes atpazīšanas programmas shēma47
“Oriģinālu signālu apstrādes paņēmienu izveide <strong>un</strong> izpēte konkurētspējīgu IT tehnoloģiju radīšanai”Izmantotās literatūras saraksts[1] Proceedings of the 5th IEEE International Workshop on System-on-Chip for Real-TimeApplications (IWSOC 2005), 20-24 July 2005., Banff, Alberta, Canada. IEEE ComputerSociety 2005, ISBN 0-7695-2403-6.[2] Hauck S. Asynchronous Design Methodologies: An Overview // Proceedings of theIEEE, Vol. 83, No. 1, pp. 69-93, January, 1995.[3] Logan B. Information in zero crossings of bandpass signals // Bell Sys. Tech. J. 56, 487-510 (1977).[4] Nazario MA. Saloma C. Signal recovery in sinusoid-crossing sampling by use of theminimum-negativity constraint // Applied Optics. 37(14):2953-2963, 1998[5] F. Aeschlimann, E. Allier, L.Fesquet, M.Renaudin. Spectral analysis of level-crossingsampling scheme // Proc. of the 2005 International Conference on Sampling Theory andApplication (SampTA 2005), July 10-15, 2005, Sams<strong>un</strong>, Turkey (publ. on CD)[6] F. A. Marvasti. A <strong>un</strong>ified approach to zero-crossings and non<strong>un</strong>iform sampling //Department of Electrical Engineering, Illinois Insitute of Technology, Chicago, USA,1987.[7] M. Greitans. Spectral analysis based on signal dependent transformation // The 2005International Workshop on Spectral Methods and Multirate Signal Processing, (SMMSP2005), J<strong>un</strong>e 20-22, 2005, Riga, Latvia. pp. 179-184.[8] I.Bilinski , Yu. F. Borovik. and A.Mikelson (1982), “Use of rectangular periodicf<strong>un</strong>ctions for computing discrete Fourier transforms”, Autom. Control Comput. Sci., 281-86 (in Russian)[9] I.Bilinski, Yu. F.Borovik and A.Mikelson (1982), “Implementation of a DFT methodbased on the use of rectangular f<strong>un</strong>ctions”, Autom. Control Comput. Sci., 6 81-88 (inRussian).[10] Michel Mouly, Marie – Bernadette Pautet (1992), The GSM system for mobilecomm<strong>un</strong>ications.[11] E. Allier, G. Sicard, L.F. and Renaudin, M (2003). A new class of asynchronous a/dconverters based on time quantization. In Proc. Of International Symposium onAsynchronous Circuits ans Systems ASYNC’03, pages 196-205, Vancouver, Canada.[12] J. W.Mark, T.D.Todd, (1981). A non<strong>un</strong>iform sampling approach to data compression.IEEE Trans. On Comm., 29(1):24-32.[13] W. Kaster, Analog-Digital conversion, Analog Devices, Inc., 2004.[14] E. Beķeris Signālu teorijas elementi. – Rīga: IU ‘’Mācību apgāds’’, 1998. – 189. lpp.[15] M.Unser, A.Aldroubi, M.Eden B-Spline Signal Processing: Part I-Theory// IEEETransactions on Signal Processing. – 1993. – Vol. 41. – pp. 821-833[16] T.Werther "Reconstruction from irregular samples with improved locality", Master'sthesis, University of Vienna, Dec. 1999.[17] C. Cenker, Hans G. Feichtinger, Hermann M. Iterative algorithms in irregular samplingA first comparision of methods. – 1992.[18] A. Baums, Energy Consumption Optimization in Hard Real-Time System CMOSProcessors, Electronica and Electrical Engineering , N4 (68) , Ka<strong>un</strong>as 2006, pp.19-22.[19] HT80C51 User Manual, Philips Electronics N.V., 2005, pp. 1-133.[20] Furber S.B. , Day P., GarsideJ.D, Amulet1: A Micropiplined ARM, GompCon 94, S<strong>un</strong>Francisco, March 1994, pp.290-299.[21] Furber S.B. , GarsideJ.D, Temple S., Day P., Amulet2e: An Asyncheonous EmbeddedController, Proc. IEEE. 87(2), Febr, 1999, pp. 290-299.[22] Furber S.B. , Edvards D.A. , GarsideJ.D., Amulet3: Asyncheonous EmbeddedProcessor,Proc. Of the IEEE Intern.Conf on Computer Design, 2000.[23] www.handshakesolutions.com/Products_Services/ARM996HS/ - 20k..[24] M. Akay, Ed., Time-frequency and wavelets in biomedical signal processing, IEEE48
“Oriģinālu signālu apstrādes paņēmienu izveide <strong>un</strong> izpēte konkurētspējīgu IT tehnoloģiju radīšanai”Press, 1998.[25] Л.В. Новиков, Основы вейвлет анализа сигналов. Учебное пособие.http://neuroschool.narod.ru/.[26] M. Greitans, Signal dependent STFT-like Time-frequency analysis applicable for non<strong>un</strong>iformsampling. Submitted to the journal “Sampling theory in signal and imageprocessing” (preprint)[27] E. Wigner, On the quantum correction for thermodynamics equilibrium. Phys. Rev., vol.40, pp.749-759, 193249
1. PIELIKUMS. PUBLIKĀCIJA ŽURNĀLĀ „ELECTRONICS AND ELECTRICAL ENGINEERING”,ISSN 1392-1215, NO. 4 (68), 2006, M. GREITANS, I. HOMJAKOVS, ENHANCED DIGITALSIGNAL PROCESSING OF SIGNAL-DEPENDENTLY SAMPLED SIGNALS.
ELECTRONICS AND ELECTRICAL ENGINEERINGISSN 1392 – 1215 2006. Nr. 4(68)ELEKTRONIKA IR ELEKTROTECHNIKAT121SIGNAL TECHNOLOGYSIGNALŲ TECHNOLOGIJAEnhanced Digital Signal Processing of Signal-dependently SampledDataM. Greitāns, I. HomjakovsInstitute of Electronics and Computer Science, University of Latvia,14 Dzerbenes str., Riga, LV1006, Latvia, phone: +371-7558203, e-mail: modris_greitans@edi.lvIntroductionThe evolution of electronic circuits has beendrastically advanced during the recent years. Introductionof new nano-materials and technologies allows tominiaturize devices considerably. As a result, engineers aredeveloping much faster, more complex and smartersystems. This progress makes them attractive for expandedrange of applications. A System-on-Chip (SoC) technologyis considered as a revolutionary approach in electronics. Itmeans the packaging of all the necessary electronic circuitsand parts for a "system" on a single integrated circuit [1].For example, a system-on-chip for a so<strong>un</strong>d-detectingdevice might include an audio receiver, an analog-todigitalconverter (ADC), a digital signal processor,necessary memory as well as the input/output logic controlfor a user. Consequently, SoC may contain digital, analogand often mixed-signal f<strong>un</strong>ctions – all on one chip.Most of today's electronics systems are based onsynchronous paradigm - the work of a whole system isruled by a clock. All the states in a design have to bechanged at the same time. Since the systems constantlybecome more sophisticated and capacious, it is establishedthat 10-30% of their resources (size, power consumptionetc.) are wasted to circuits, which provide the synchronismof the device. Thus, it is relevant to explore otherparadigms for development of future microelectronicsbased on alternative and innovative solutions.One of the alternative approaches, which wasintroduced in the mid 50s and now receives increasinginterest, is asynchronous logic. The key benefits of theasynchronous system are lower power consumption,absence of the clock screw, reduced heat elimination,lower EMI, automatic adaptation to physical properties,etc. [2]. Asynchronous design is characterized by theabsence of a global clock, instead of that the system isdriven by events, which arise during the execution ofactual task. Such a change of paradigm leads to a drasticrearrangement in electronic designs by complete rethinkingtheir architecture and signal processing methods.Typically the information obtained from sensors hascontinuous time nature, while modern signal processingtechniques are based on digital methods. The conversionfrom analog (continuous) to digital (discrete) presentationof the source data is being performed by ADC. In systemsdesigned according to synchronous paradigm, ADC isdriven by system clock. If <strong>un</strong>iform sampling is used theADC clock frequency is determined by Nyquist theorem. Ifnon-<strong>un</strong>iform sampling is involved, the mean samplingdensity can be below the Nyquist rate, however thesampling point flow is still derived from the clock. Theasynchronous systems do not have a clock at all. That leadsto the question - how to manage the analog-to-digitalconversion in a case without clock? The asynchronouscircuits on its merits are event-driven, so also the signalsampling process should be organized by events, which aregot from the information presented in signal. New class ofADCs based on signal-dependent sampling schemes has tobe developed.The three most popular types of signal-dependentsampling – zero-crossing [3], reference signal crossing [4]and level-crossing [5] are illustrated in Fig. 1. Naturally,each of them has its own advantages and limitations,however there are some important joint features, whichhave to be taken into acco<strong>un</strong>t performing the processing ofsignal-dependently sampled data:1. in general case the signal samples are spaced non<strong>un</strong>iformly,2. it is impossible to determine the sampling timeinstants in advance,3. local sampling density depends on local statisticalcharacteristics of signal.In this paper the samples obtained by level-crossingapproach are chosen as an example of input data for digitalsignal processing. However, the developed methods areuseful also for other cases of signal-dependently sampleddata.Non-<strong>un</strong>iformly spaced dataThe techniques of non-<strong>un</strong>iform sampling are discussedin literature for many years [6]. In most cases the problemis stated from the following point of view - how tocalculate the sampling time instants in a way, which allows9
to gain some advantages during the processing. Thesuppression of frequency aliasing effect can be quoted asan example. In this case the sampling point flow isdeliberately pseudo-randomized, and it has to satisfycertain requirements. The statistical characteristics of sucha sampling process are independent of input signal. Inelectronic design that leads to the task to clock the“classical” ADC at predetermined, non-<strong>un</strong>iformly spacedtime instants with high accuracy.The signal-dependent sampling also provides signalsamples at the non-<strong>un</strong>iformly spaced time moments. Theirnature and properties can considerably differ fromdeliberately pseudo-randomized case. Let us discuss, as anexample, the level-crossing sampling approach. Higherfrequency in a spectral presentation of signal providesfaster changes in its waveform. If sampling is organized asevents of levels crossing that leads to the higher density ofsignal samples (see Fig.1.c). Statistical characteristics ofobtained sampling point flow directly depend on inputsignal. Furthermore, if a signal waveform has someregularity, the event flow of level-crossing sampling hasthe same regularity as well. As a result of this effect, thefollowing problem can be stated - the methods developedfor processing of deliberately non-<strong>un</strong>iformly sampled datacan be impracticable for signal-dependently non-<strong>un</strong>iformlysampled data. This situation will be illustrated in the nextsection.General Discrete Fourier transformThe classical method for digital signal analysis is apair of Discrete Fourier Transform (DFT). The direct DFTallows to obtain the spectral values from N signal samplesif they are equidistantly spaced in time:N 1X ( m)= ∑ − x(n) exp( − j2πmn/ N). (1)n=0The inverse DFT allows to reconstruct signal values intime from signal spectral values at equally spacedfrequencies:1 N 1x(n)= ∑ − X ( m) exp( j2πmn/ N). (2)N m=0In practical applications typically exist tworestrictions – the bandwidth of signal spectrum is limited tosome higher frequency Ω , and the observation of signalwaveform is limited to some duration Θ . The discretesignal samples x n = x( t n ) , n = 0,N −1are obtained bysampling procedure and they can be located arbitrary alongthe time axis. The general form of DFT, that enables theprocessing of non-equidistantly spaced data, can beexpressed as:N ⎛ ⎞= ∑ − 1mX m xnexp⎜−j2πtn⎟ . (3)n=0 ⎝ Θ ⎠The band-limited nature of the signal provides themrestriction for m : ≤ Ω .ΘFig. 1. Signal-dependent sampling schemes: a) zero-crossing; b)reference signal crossing; c) level-crossingIn the <strong>un</strong>iform sampling case expression (3) conformsto the formula (1). If appropriate deliberately non-<strong>un</strong>iformsampling scheme is used, expression (3) provides quitegood spectral estimation for the cases, where samplingdensity is equal or higher than the Nyquist rate. Moreover,it is possible satisfactorily to estimate the spectral contentof signal even if sampling density is below the Nyquistrate. The sampling point flow has to suppress thefrequency aliasing for that. However, if formula (3) isapplied to the data acquired by level-crossing sampling, theobtained result not always is adequate, despite the fact thatsignal always is oversampled. Let us illustrate thisstatement by a simple example. The mono-harmonic signalwith frequency f 0 is sampled by 3-bit level-crossing ADC(7 levels). The spectral estimate obtained by formula (3) isshown in the Fig. 2. In addition to the spectral componentat the true frequency (~0.0955 Hz) spurious components atthe higher odd harmonics appear as well. Note, the issue ofspurious components is not due to the frequency aliasingeffect connected with insufficient sampling density, butdue to specifics of signal and non-<strong>un</strong>iform samplesobtained by level-crossing approach [5]. It leads to theconclusion that specialized enhancement of DFT should bederived to process the data acquired in such a way.On the base of the Fourier series we can reconstructthe signal waveform from its spectral estimates by thefollowing formulaxˆ( t)=M∑ X m exp( j2π tfm) , t ∈[ 0, Θ], (4)m=−M10
The solution of (5) can be based on two differentapproaches:1) signal samples { x n } are interpolated within the timeinterval [ 0 Θ ] and the reconstruction error is( x)expressed as ε ( t ) =~x(t)− ∑ X m exp( j2πfmt),mwhere~ x ( t ) is interpolated signal;2) error samples ε n = xn− xˆn are interpolated within thetime interval [ 0 Θ ] , and x ˆn= ∑ X m exp( j2π fmtn).mFig. 2. Spectral estimate of sinusoidal signal withf 0 = 12.22 / Θ ( Θ =128 s. ) sampled by 7 levels-crossingswhere f = mm . Using the information about originalΘsignal x (t), we can construct a reconstruction error asε ( t)= x(t)− xˆ(t). The initial part of it is illustrated in theFig. 3. The values ε n = ε ( t n ) of reconstruction error atthe sampling point instants t n are shown by bold points.We can observe that the reconstruction error betweensamples used to be considerable higher than ε n values. Ifsampling is based on the classical scheme, where samplingpoints are determined in advance, there are no restriction tothe behavior of reconstructed signal between samples. Inthe case of level-crossing sampling the situation differs.Each level crossing is defined as an event andcharacterized by signal sample. Between them thewaveform of reconstructed signal should not cross anylevel. Consequently the reconstruction error has to beminimized not only at sampling time instants, but alsobetween them with the same accuracy. The minimizationtaskΘ2∫ ε () t dt → min(5)0can be defined on the <strong>un</strong>derstanding that the signal valuesare known only at sampling points and the reconstructedsignal is described by the expression (4). The minimizationproblem has to be solved with respect to spectralestimates { X m } .Enhanced DFT based on signal interpolation.Signal interpolation easily can be done by connectingthe sample points with polynomials pn k (t)of order k , or aband-limited interpolation can be performed as a sum oftime-shifted sinc f<strong>un</strong>ctions.Let us rewrite (5) taking into acco<strong>un</strong>t that signalsamples are interpolated:Θ⎛⎜ ~∫x0⎝2M⎞m π m ⎟. (6)m=−M⎠( x)() t − ∑ X exp( j2f t) ⎟ dt → minTo find the minimum, all the individual derivatives ofX m have to be considered as being equal to zero. Weobtain 2 M + 1 linear equationsΘ⎛2 ⎜ ~∫x0 ⎝Mkk=−M⎞π k ⎟m (7)⎠( x)() t − ∑ X exp( j2f t)⎟⋅exp(j2πft)dt = 0for m = − M , M . Taking into acco<strong>un</strong>t that f = mm , theΘ{exp( j2π fmt)}is a set of orthogonal f<strong>un</strong>ctions intointerval [ 0 Θ ] . Thus we can write:Θ( x)1X =~m ∫ x(t) exp( j2π f mt)dt . (8)Θ0The expression (8) is similar with the formula ofcalculation of Fourier series coefficients for signal~ x ( t ) .If signal samples { x n } are interpolated with zeroorderpolynomials (like a piece-wise constant line in theFig. 3), we obtainFig. 3. Reconstruction error f<strong>un</strong>ction (black curve) and zero-orderinterpolation (red piece-wise constant line) of ε n (bold dots)tn+ tn+1N −12( x0)X m = ∑ xn∫ exp( j2πfmt)dt =n=0 tn+ tn−12j N −1= ∑ xnexp( j2πfmtn)(1 − exp( − j2πfm∆t′)),2πfm n=0' tn+ 1 − tn−1where ∆t n = .2(9)11
ecomesK( )∑ − 1sincX m = ckexp( − j2π fmkT). (13)k = 0Note, the last method, besides the DFT complexity ofcalculations, requires the solution of linear system with Nequations and with 2 M + 1 <strong>un</strong>knowns.Enhancement of Discrete Fourier transform based oninterpolation of error samples.Fig. 4. Spectrum of mono-harmonic test-signal estimated by firstordersignal interpolation algorithmFig. 5. Spectrum of mono-harmonic test-signal estimated by sincinterpolation algorithmFor piece-wise linear interpolation between the1samples we can use polynomial p n = α n ( t − tn) + xn,∆xwhere αnn = , ∆xn = xn− xn−1, ∆tn= tn− tn−1, which∆tngives:( x1)( x0)X m = X m +12( 2πfm )( j2πft )( 1−exp( − j2f ∆t))N −1⋅ ∑αnexp m nn=0i N −1+ ∑αn∆tnexp2πfm n=0⋅( j2πft ) exp( − j2πf∆t).m nmn+mn(10)Another approach is based on interpolation of { x n }with sinc f<strong>un</strong>ctions. As the bandwidth of signal is limitedto Ω , we can write:~ (sinc)xK= ∑ − 1kk=0() t c sinc( 2Ω( t − kT )), (11)1where T = , K : kT < Θ . Amplitudes c k can be fo<strong>un</strong>d2Ωfrom a linear equation system:x n = ~(sinc) x ( t n ) . (12)In this case the enhanced discrete Fourier transformLike the interpolation of signal samples the continuestime reconstruction error f<strong>un</strong>ction~ ε ( t ) can be obtainedfrom its values ε n = xn− xˆn at time instants { t n } . Theestimates of reconstructed signal are calculated asx ˆn= ∑ X m exp( j2π fmtn) . The problem (5) in this casemcan be interpreted as minimization of area <strong>un</strong>der the~2f<strong>un</strong>ction ε ( t ) . If2ε n is interpolated by zero–orderpolynomial the minimization task becomes as:N −1⎛M⎞∑ ⎜( ε 0)∑⎟xn− X m exp( j2πfmtn)⋅ ∆tn′→ min . (14)n= 0⎝m=−M⎠After the derivation the system of linear equations isformedN ⎛ M( ε 0)⎞2 ⎜⎟∑ x − ∑×⎜ n X k exp( j2πfktn)exp( j2πf⎟ mtn)n= 1 ⎝ k=−M⎠× ∆t n ′ = 0(15)This system rewritten in matrix form is(ε 0)Ψx = X ⋅Φ⋅ ΨΤ , (16)where ϕ mn = exp( j2πfmtn) and ψ mn = ϕmn⋅ ∆t′n .Solution of (16) can be fo<strong>un</strong>d aswhereT(⋅)and(ε 0)Τ −1X = ( Ψ ⋅ x)⋅(Φ ⋅ Ψ ) , (17)2−1( ⋅) denotes the transpose and inverseoperation of matrix respectively.The first-order polynomial interpolation of errorf<strong>un</strong>ction samples provides the following minimizationtask:1 ⎛ N −2N −122 ⎞⎜1 ⎟ → min2∑ ε n ⋅ ∆tn+ ∑ ε n ⋅ ∆tn−. (18)⎝ n=0n=1 ⎠It looks like a sum of two zero-order interpolationproblems. The solution in this case is similar to theprevious one expressed as (17):(ε1)X =Τ Τ( Ψ′′⋅ x′+ Ψ′′⋅x′)( Φ ′′ ⋅ Ψ′′+ Φ ′′ ⋅ Ψ′′) 1−, (19)where Φ ′,Ψ ′,x′and Φ ′′ , Ψ′′, x ′′ matrices are formed fromΦ, Ψ, x by using indexes n = 0,N − 2 and n = 1,N −1respectively.12
Fig. 6. Spectrum of mono-harmonic test-signal estimated by zeroorderreconstruction error interpolation algorithmFig. 7. Spectrum of mono-harmonic test-signal estimated bysignal-dependent transformationSimulation resultsThe performance of described algorithms has beeninvestigated by computer simulations. The abovementioned single-tone sinusoid has been used as a testsignal.The input data are acquired from Θ = 128[ sec] longobservation as events of 7 levels-crossings. The frequencyof test-signal is 12.22 / Θ ≈ 0.0955[Hz]that does not lie onthe frequency grid of Fourier series. The number ofacquired samples is N = 172 .The spectral estimate obtained by General DFT(expression (3)) and illustrated in Fig. 2 can be used as areference, which allows identifying the improvement ofprocessing, when enhanced methods are exploited. TheFig. 4 shows spectral result obtained by first-order signalinterpolation algorithm (expression (10)). Although theamplitudes of higher spurious harmonics are decreased forabout 5dB, they are still considerable. The complexity ofthis algorithm is few times higher then DFT. The zeroordersignal interpolation gives slightly worse result.The band-limited interpolation with sinc f<strong>un</strong>ctions(expression (13)) provides improved spectral presentationof test signal, which is shown in the Fig. 5. The spuriousharmonics are suppressed. The drawback of this algorithmis that beside the DFT calculation it requires the solution ofthe linear equation system as well.The similar mathematical complexity is also formethods, which use reconstruction error interpolation byzero- or first-order polynomials. The results obtained inboth cases are quite similar, and therefore we present hereonly the simplest case – zero-order error interpolation, inthe Fig. 6.The common feature of all presented algorithms isspectral analysis on the grid of Fourier frequenciesf m = m / Θ . For the expressions (9) and (10) themotivation is to build the orthogonal basis oftransformation. The expressions (17) and (19) can beconsidered as <strong>un</strong>orthogonal transformations. That allows touse also frequency grid with higher density, which canimprove spectral resolution. However, the necessity tosolve the equations system limits the grid – the number ofanalysis frequencies has to be equal or less than thenumber of samples. Note, the number of samples in signaldependentsampling case is not known in advance, becauseit depends on actual signal properties. The method whichovercomes this problem is so called signal-dependentFourier transform described in [7]. The frequency grid ofthis algorithm is independent on number of samples andprovides high spectral resolution. The Fig. 7 demonstratesthe spectral estimate obtained by this method, whereanalysis grid is four times frequenter than in the DFT case.The quality of simulated algorithms can becharacterized by integral value of squared reconstructionerror. The estimated values, averaged over different signalphases, are summarized in the Table 1. It shows that allmethods decrease the reconstruction error in comparisonwith GDFT. The obtained improvement can vary frominsignificant to several thousand times.ConclusionsOne of the basic tools in digital signal processing isthe Discrete Fourier Transform. In this paper we presentedseveral enhancements of DFT to make it convenient foranalysis of signal-dependently sampled data, particularlypaying attention to the level-crossing sampling. In this casethe samples are not only spaced non-<strong>un</strong>iformly in time, butalso its distribution depends on signal properties. Theperiodical signal provides regularities into sampling pointflow, which leads to the appearance of spuriouscomponents (harmonics) in the spectrum estimated on thebases of conventional DFT analysis.The level-crossing sampling technique determines notonly signal value at sampling time instance, but also therule, that signal values between two samples should notcross any quantization level. This condition can be takeninto acco<strong>un</strong>t during development of processing methods.The proposed idea is to minimize the error betweenoriginal and reconstructed by Fourier series signals notonly at sampling time instants, but also between them withthe same accuracy. The problem lies in the fact that weknow original signal values only at sampling instants. Twodifferent approaches are considered. The first one is basedon obtaining continues time signal by interpolation ofknown signal samples. The expressions for enhanced DFTcalculation are proposed for zero-order and first orderpolynomial interpolation as well as for band-limitedinterpolation with sinc f<strong>un</strong>ctions. The second approach tominimize continues time reconstruction error is based on13
Table 1. Estimated reconstruction errors for different methodsMethodΘGDFTZero-orderx ninterpolationFirst-orderx ninterpolationx n interpolationwith sincZero-orderε ninterpolationFirst-orderε ninterpolationSignal-dependentDFT-like method∫ε ( t)dt 835 811 803 3.00 2.35 2.29 0.0702interpolation of error samples. The expressions forcalculation of spectral coefficients are proposed for zeroorderand first-order polynomial interpolation. Simulationresults show the improvement of data processing ifenhanced algorithms are used instead of classicalGeneral DFT. It should be mentioned that better results areachieved by algorithms, which require performing moremathematical operations. The best result can be reached bythe signal-dependent DFT-like method, however the highcomputing complexity makes it <strong>un</strong>practical for real-timeapplications.References1. Proceedings of the 5th IEEE International Workshop onSystem-on-Chip for Real-Time Applications (IWSOC2005), 20-24 July 2005., Banff, Alberta, Canada. IEEEComputer Society 2005, ISBN 0-7695-2403-6.2. Hauck S. Asynchronous Design Methodologies: AnOverview // Proceedings of the IEEE, Vol. 83, No. 1, pp.69-93, January, 1995.3. Logan B. Information in zero crossings of bandpass signals// Bell Sys. Tech. J. – 1977. – 56.– P. 487–510.4. Nazario MA. Saloma C. Signal recovery in sinusoidcrossingsampling by use of the minimum-negativityconstraint // Applied Optics. – 1988. – 37(14). – P. 2953–2963.5. Aeschlimann F., Allier E., Fesquet L., Renaudin M.Spectral analysis of level-crossing sampling scheme // Proc.of the 2005 International Conference on Sampling Theoryand Application (SampTA 2005).– Sams<strong>un</strong>, Turkey (publ.on CD), July 10-15, 2005.6. Marvasti F. A. A <strong>un</strong>ified approach to zero-crossings andnon<strong>un</strong>iform sampling / Department of ElectricalEngineering, Illinois Insitute of Technology, Chicago,USA, 1987.7. Greitans M. Spectral analysis based on signal dependenttransformation // The 2005 International Workshop onSpectral Methods and Multirate Signal Processing,(SMMSP 2005).– Riga, Latvia, J<strong>un</strong>e 20-22, 2005.– P. 179–184.Presented for publication 2006 02 10M. Greitans, I. Homjakovs. Enhanced Digital Signal Processing of Signal-Dependently Sampled Signals // Electronics andElectrical Engineering. – Ka<strong>un</strong>as: Technologija, 2006. – No. 4(68).– P. 9–14.Asynchronous circuits receive now an increasing interest. Their promising advantages can play a significant role in futureelectronics' development. One of the factors, which delay the wide spread of the clock-less systems, is incompatibility with classicalclock-driven analog to digital converters and processing algorithms. The new ADC approaches, which are based on signal-dependentsampling, are required, as well as convenient processing methods have to be developed. The paper presents the enhanced DFT-likealgorithms derived from the idea to minimize the signal reconstruction error not only at sampling points, but also between them with thesame accuracy. Two approaches for creating continuous time error f<strong>un</strong>ction from its discrete values are investigated: 1) interpolation ofsignal samples; 2) interpolation of error samples. Level-crossing sampling has been used as an example for signal digitizing. Achievedadvantages are demonstrated by simulations. Ill.7, bibl. 7 (in English; summaries in English, Russian and Lithuanian).М. Грейтанс, И. Хомяковс. Усовершенствованная цифровая обработка дискретизованных по уровню сигналов //Электроника и электротехника. – Каунас: Технология, 2006. – № 4(68). – С. 9–14.В настоящее время все больше внимания уделяется асинхронным системам. Однако для асинхронных систем обработкисигналов существует потребность в новых видах аналого-цифрового преобразования и соответствущих им алгоритмахобработки. Рассматривается подход к аналого-цифровому преобразованию сигналов, основанный на их дискретизации поуровню, и предлагаются усовершенствованные, ДФТ-подобные алгоритмы, позволяющие значительно уменьшитьпогрешность результатов цифрового анализа сигналов. Ил.7, библ. 7 (на английском языке; рефераты на английском, русскоми литовском яз.).M. Greitans, I. Homjakovs. Patobulintas adaptyviai diskretizuotų signalų skaitmeninis apdorojimas // Elektronika irElektrotechnika.– Ka<strong>un</strong>as: Technologija, 2006. – Nr. 4(68). – P. 9–14.Vis didesnį susidomėjimą kelia asinchroniniai grandynai. Dėl daug žadančių privalumų jie gali vaidinti reikšmingą vaidmenįateityje, tobulinant elektroniką. Vienas iš veiksnių, lėtinančių platų sistemų, nenaudojančių taktinio dažnio, paplitimą, yra jųnesuderinamumas su klasikiniais taktinio signalo valdomais analoginiais-kodiniais keitikliais ir apdorojimo algoritmais. Reikalinginaujų tipų keitikliai, kurių veikimas būtų grindžiamas adaptyviu (nuo signalo priklausančiu) diskretizavimu, taip pat turi būti sukurtipatogūs apdorojimo metodai. Pateikiami patobulinti DFT algoritmai, kurie sukurti remiantis idėja minimizuoti signalo atkūrimopaklaidą ne tik diskretizavimo taškuose, bet ir tarp jų, tuo pačiu tikslumu. Nagrinėti du metodai, skirti tolygiai laikinei klaidos f<strong>un</strong>kcijaisukurti iš jos diskretinių verčių: 1) diskretinių signalo verčių interpoliavimas; 2) diskretinių klaidos verčių interpoliavimas. Lygiokirtimo diskretizavimo būdas naudotas signalui skaitmenizuoti. Pasiekti patobulinimai demonstruojami naudojant modelius. Il. 7, bibl. 7(anglų kalba; santraukos anglų, rusų ir lietuvių k.).14
2. PIELIKUMS. PUBLIKĀCIJA ŽURNĀLĀ „ELECTRONICS AND ELECTRICAL ENGINEERING”,ISSN 1392-1215, NO. 4 (68), 2006, A. BAUMS, ENERGY CONSUMPTION OPTIMISATION INHARD REAL-TIME SYSTEM CMOS PROCESSORS.
ELECTRONICS AND ELECTRICAL ENGINEERINGISSN 1392 – 1215 2006. Nr. 4(68)ELEKTRONIKA IR ELEKTROTECHNIKAT 120SYSTEM ENGINEERING, COMPUTER TECHNOLOGYSISTEMŲ INŽINERIJA, KOMPIUTERINĖS TECHNOLOGIJOSEnergy Consumption Optimization in Hard Real-Time System CMOSProcessorsA. BaumsIntitute of Electronics and Computer Science,14 Dzerbenes st. LV-1006 Riga,Latvia; tel. +371 7558134, fax: +371 755337; e-mail: baum@edi.lvIntroductionPortable system energy consumption reduction is ofprimary importance in mobile embedded systems and SoCdesign [1]. Dynamic voltage scaling (DVS) for CMOSchips at this time is the most effective energy reductiontechnology [2–11]. Usually there are no or few problemsfor DVS using it for soft real-time system design or taskscheduling, where deadlines can be missed if the Qualityof Service is kept [9, 10]. In hard real-time systems it isnecessary to provide that the task never miss the deadlineand the energy saving is maximized. The problems arise inon-line systems when at the ordinary task starting momentthe task execution time is impossible to know and the bestenergy reduction regime can not be selected. In majorityinvestigations and publications periodic task executions areanalysed there with off-line determined execution timesand determined priorities. Then the popular hard real-timetask scheduling methods are earliest–deadlines first (EDF)or rate-monotonic scheduling (RMS) for DVS basedenergy consumption reduction is used [5, 6, 7, 8]. Fewinvestigations are made in the field of event drive singlestochastic hard real-time task energy consumptionreduction. In [12] there is a method of dividing the taskinto multiple smaller sub-tasks with checkpoints fordynamic power management or voltage scaling. By usingthis method the energy consumption is reduced, but thereare not guarantee that for the last sub-tasks execution stepthe deadline will not be reached. Method for the hard taskenergy consumption on-line minimisation which is named“mini-max” is proposed from author in article [11]. Byusing it the deadline is guaranteed for the task execution atthe minimal power till the critical time t cr , after which theexecution is finished at maximal clock frequency.Dynamic voltage scaling DVSPower consumption of CMOS has two maincomponents: Р sw– dynamic power consumption bycharging and discharging the capacitive load and P st–static power consumed, which is determined by leakagecurrent I leak and for CMOS technology below 0.1 µm cannot be taken into acco<strong>un</strong>t. Dynamic or switching powercan be estimated by: P ~ C sw ef V2 f = C sw ef V2 / τ c , where: V– supply voltage, C ef– capacitive load, f sw– switchingfrequency and τ c – cycle time.The time and energy consumption optimisation byusing dynamic voltage-time scaling DVS is based onpower ∆P i consumption minimization for task step i,duration the slack time s i . In cases when the real taskexecution time t i is smaller then the worst case executiontime WCET i :s i = WCET i – t i . (1)For hard real-time system: WCET i ≤ D (D deadline)WCET it i . s i .Fig. 1. Time connections for the task step iDFor voltage or (and) frequency scaling differentprogram controlled CMOS chips are designed and can beused: Intel XScale Technology (XA250, 80200) [14],Transmeta Co. Crusoe (TM5400÷TM5800) [15], XILINXCo. Virtex-Pro [16], Altera Co. NoisII [17].Mini-max method for hard real-time task energyconsumption on-line minimizationThe hard real-time single event driven stochastic taskenergy consumption on-line minimization method isdeveloped by consideration that CMOS processor has awide supply voltage and clock frequency borders forvoltage and frequency scaling. For the stochastic task it isnecessary to assess the clock cycle τ c number N maxat theWCET and at the best case execution time (BCET) τ cnumber Nmin. It can be made by simulation or executing19
the task at some nominal frequency f 0, clock cycle τ co andnominal voltage V 0 . By using the power cycle timecharacteristic P c (τ c ) the cycle time can be adjusted inregion τ cmin ÷τ cmax and the cycle power consumption inregion P cmax ÷ P cmin (Fig. 2.), where P co – cycle time powerconsumption at nominal frequency f 0 and nominal voltageV 0 .P cmaxP coP cminP cτ cminτ coFig. 2. Cycle time power consumptionτ cmaxτ cT D = D - τ cmax . N I . (8)From here the energy consumption at WCET:E max = τ cmax P cmin N I + P cmax T D . (9)The task energy consumption E ciat the dynamic (online)scheduling when τ cmax N i< D - T D :E =τ cicmax P cminNi , (10)E ci= τ cmax P cminN I + τ cmin P cmax( N i- N I ), (11)orE ci= τ cmin P cmaxN I + (τ cmax P - cmin- τ cmin P cmax) N (τ maxcmax - τ cmin )/(τ co -τ cmin ). (12)To estimate the benefits of the mini-max method it isnecessary to compare this energy consumption with theenergy consumption at task static (off-line) scheduling, i.e.that at every instant of task start it execution time t i isknown (for example calculate at task compilation). Fordifferent hard deadline situations the execution at differentt i can be estimated by using simple expressions representedin Fig. 4.Execution time characteristics at nominal voltage V cand frequency f co:t max = τ co N max= WCET, (2)t min = τ co N min = BCET, (3)s max= D - τ coN min . (4)P cminP ciP coE min= P cmin τ cmax N minE i= P ci τ ci N iE max= P co τ co N maxBy using mini-max method in the worst case,when : t i .= WCET i = D and s i = 0 , the task execution isstarted at minimal power P cmin and continued till instant t cr ,after which in time interval T D = D - t cr the execution isfinished at maximal frequency and min clock time τ cmin(Fig. 3 ).P cminτ cmax . N IFig. 3. The presentation of task execution critical time t crIn Fig. 3 by N I the number of instructions executed atmaximal long clock cycles is denoted. This number andtime intervals t cr and T D can be calculated from equation(5):τ cmax . N I +τ cmin ( N max - N I ) = D, (5)N I = ( D - τ cmin N max )/( τ cmax . - τ cmin ), (6)t cr =τ cmax N I , (7)t crT DDP cmaxFig. 4. Energy consumption at the task static schedulingUniform random distributed task execution time flowis proposed forthe mini-max method investigation. Forsimplicity <strong>un</strong>iform distributed by constant step ∆ N clockcycle discrete number N iand corresponding constant step∆ s slot time s i co values are used.The single task energy consumption E m-m includestwo components E 1 and E 2 for the task execution times t i .=t cr ≤ τ c max N I :E 1 =Σ k i P c min τ c max , (13)elseE 2 = (n-k)P c min τ c max + P c max τ c min Σ k+1 n (N max - N I –- (n-k-1) ∆ N ) (14)Mini-max method was proposed in [13] andquantitative estimation of an Example was made.Experimental obtained P(τ c ) characteristic was used andwork point τ co = 1 µs ( f = 1 MHz ), P = 6 nJ; τ co cocmax =3µs, P = 0.5 nJ; τ cmincmin = 0.4 µs, P = 14 nJ, N c max max=1000, N min= 100 and deadline D =1000 µs are selected.When WCET = D and BCET t imin = 100 µs, then by using(6), (7) and (8): N I = 230, t cr = 690 µs and T D = 310 µs. Theenergy consumption is calculated for ∆ N = 100 and for allcorresponding slot times s ico = {0,100, 200, ..., 800,D20
900 µs}and the results of estimation as E i din mini-max arerepresented in Fig. 5. For comparison there are representedcurved lines calculated using the same workload: for taskexecution at nominal clock frequency f co(E i co at τ co ) andfor task execution at off-line voltage scaling (E i st off-lineDVS).δ%301020E i600050004000300020001000E ico at τ coE ist off-line DVSE idin min-max10τ cmax01 2 3 4 5. δ st-10Fig. 6. Energy consumptions: δ st (τ cmax ) %δ co (τ cmax ) %δ co (τ cmax ) %0 100 300 500Fig. 5. The The graphical energy presentation consumption of the for task single energy consumptionat different schedulingThe joint energy consumptions for task cycleincluding 10 tasks with different slot times s ico = {0, 100,200, ...800, 900 µs} was calculated using (13) and (14):E m-m = E 1 + E 2 = 22000 nJ. For identical tasks andworkloads the energy consumptions for the task executionat nominal clock frequency E co = 26000 nJ and taskexecution at off-line voltage scaling, E st = 33000 nJ. Thegain from the mini-max method using for energyconsumptions in % can be estimated by using twocharacteristicsδ st = ( E st - E m-m )100 ⁄E stand δ co = ( E co - E m-m )100 ⁄ E co .For the above example: δ st = 15% and δ co = 33%.The mini-max method benefit bo<strong>un</strong>daries estimationAt first the influence of τ cmax on E m-m wasinvestigated. The value of τ cmax was adjusted from 1.5 µs to5 µs and the energy economy results in % were comparedwith energy consumptions E st and E co. The results ofestimation are presented in Table 1 and Fig. 6.Table 1. Results of estimation700 900No. τ cmax ,µsδ st ,%δ co ,%1 1.5 3.5 132 2.0 8.8 22.53 2.5 12.5 294 2.8 16.5 345 3.0 15.5 336 3.5 12.5 317 4.0 6.0 258 4.5 -1.5 209 5.0 -19.0 6.0s iThe value of τ cmax = 3 µs which was used in Exampleis close to the optimal value τ cmax = 2.8 µsAt second the influence of τ cmin on E m-m wasinvestigated. The value of τ cmin was adjusted from 0.2 to0.65 µs and the energy economy results in % comparedwith energy consumptions E st and E co. The results ofestimation are presented in Table 2. and Fig. 7.Table 2. Results of estimationNo. τ cmin ,µsδ st ,%1 0.2 31 752 0.3 24.5 403 0.4 15.5 334 0.45 13 315 0.5 10 286 0.6 -0.1 217 0.7 -4.0 20δ %403020100-10δ co. ,%0.2 0.4 0.6 0.8Fig. 7. Results of estimation: δ st (τ cmin ) %δ st (τ cmin ) %τ cminIt follows from Fig. 7, that by using mini-max methodthe energy economy can be a raised at task execution atsmall τ cmin or by increasing the maximal clock frequencyf cmax .21
ConclusionTo solve the on-line energy saving problem in thehard deadline task real-time systems mini-max method wasproposed. By using this method at <strong>un</strong>iform randomdistributed task execution time workload, the energysaving exceed more then 15% compared to off-line DVSscheduling. The gain from mini-max using it for energysaving is estimated by using f<strong>un</strong>ctions of τ cmax and τ cmin .The maximum energy saving can be obtained by selectingthe optimal value of minimal frequency.References1. Mudge T. Power: a first-class architectural design constraint// Computer.– 2001.– 34(4).– P. 52–58.2. Y<strong>un</strong> H. S., Kim J. On energy-optimal voltage scheduling forfixed-priority hard real-time systems - ACM Transactions onEmbedded Computing Systems.– 2003.– V. 2.– P. 393–429.3. Ishihara T., Yasuura H Voltage scheduling problem fordynamically variable voltage processors // Proc. Internationalsymposium on Low power electronics and design. –Monterey, 1998. – P. 197–202.4. Chandrasena L. H., Chandrasena P., Liebelt M. J. Anenergy efficient rate selection algorithm for voltage quantizeddynamic voltage scaling // Proc. International 14th symposiumon Systems synthesis. – Montréal, 2001. – P. 124–129.5. Jejurikal R., Gupta R. Energy Aware Task Schduling withTask Synchronization for Embedded Real Time Systems //Proceedings of the intrnational conference on Computers,architecture, and syntesis for embedded system. – Grenoble,2002. – P.164–169.6. Kuo J. L,, Chen T. F. Dynamic voltige sheduling for realtimeon low-power variable speed processors // Proc.International conference on Computers, architecture, andsynthesis for embedded systems.– Grenoble, 2002. – P. 147–154.7. Choi K., Soma R., Pedram M. Dynamic voltage andfrequency scaling based on workload Decomposition // Proc.International symposium on Low power electronics anddesign. – California, 2004. – P. 174–179.8. Gruian F. Hard real-time scheduling for low-energy usingstochastic data and DVS processors // Proceedings of the2001 international symposium on Low power electronics anddesign, H<strong>un</strong>tington, 2001.– P. 46–51.9. Hua. S., Qu G. Energy-efficient dual valtage soft real-timesystem with (m,k) – firm deadline guarantee // Proceedings ofthe 2004 international conference on Compilers, architecture,and synthesis for embedded systems. – Washington, 2004. –P. 116–123.10. Mosse D., Aydin H., Childers B., Melhem R. Compilerassisteddynamic power-aware scheduling for real-timeapplication // Workshop on Compilers and Operating Systemsfor Low Power. – 2000.– P. 11–2211. Rotenberg E. Using Variable – MHz Microprocessors toEfficently Handle Uncertainity in Real-Time Systems //Proceedings of the annual ACM/IEEE internationalsymposium on Microarchitecture. – Austin, 2000. – P. 28–39.12. Baums A. The Real–Time System Energy ConsumptionEstimation for the Task Dynamic and Statistic RealizationScheduling // Scientific proceedings of Riga TechnicalUniversity, Computer Science, 5 series, 2005. – Vol. 20. – P.36–41.Presented for publication 2006 02 10A. Baums. Energy Consumption Optimisation in Hard Real-Time System CMOS Processors // Electronics and ElectricalEngineering. − Ka<strong>un</strong>as: Tehnologija, 2006. − No. 4(68). − P. 19–22.Energy consumption reduction is of primary importance in mobile embedded systems and SoC design. Dynamic voltage scaling(DVS) for CMOS chips is the most effective energy reduction technology. For hard real–time system optimisation DVS based task onlinescheduling method “mini-max” was developed. By it using the deadline is guaranteed at the task execution at minimal power tillcritical time, after which task is finished at maximal clock frequency and speed. In paper the benefits of the mini-max method using forenergy saving is estimated and the optimal frequency selection for hard deadline task execution is analysed. Ill. 7, bibl. 16 (in English;summaries in English, Russian and Lithuanian).А. Баумс. Оптимизация энергопотребления CMOS процессорoв в системах реального времени с жесткими временнымиограничениями // Электроника и электротехника. − Каунас: Технология, 2006. − № 4(68). − C. 19–22.Mинимизация энергопотребления является первоочередной задачей при создании мобильных и однокристальных CMOSсистем. Наиболее эффективной технологией для этого является DVS (динамическое масштабирование напряжением). На ееоснове создан метод оптимизации энергопотребления для CMOS процессоров „mini-max”. Согласно c этим методом привыполнении задач можно оперативно гарантировать жесткие временные ограничения и оптимальное потребление энергии. Этодостигается реализацией задачи с минимальной частотой и энергопотреблением до определенного критического момента,после которого выполнение завершается на максимальной частоте. В работе представляются результаты анализа возможностейметода mini-max и принципы определения ее оптимального частотного режима. Ил. 7, библ. 16 (на английском языке;рефераты на английском, русском и литовском яз.).A. Baums. Energijos suvartojimo optimizavimas realaus laiko sistemų KMOP procesoriuose su griežtais laiko apribojimais //Elektronika ir elektrotechnika. – Ka<strong>un</strong>as: Technologija, 2006. – Nr. 4(68). – P. 19–22.Energijos sąnaudų minimizavimas yra ypač svarbus veiksnys projektuojant mobilios paskirties įterptines sistemas ir vienkristalesKMOP sistemas. Pati efektyviausia šiam tikslui technologija yra DVS (dinaminis įtampos keitimas). Jos pagrindu sukurtas CMOSprocesorių energijos sąnaudų optimizavimo minimumų ir maksimumų metodas. Atliekant šiuo metodu užduotis galima operatyviaigarantuoti griežtus laiko apribojimus ir optimalų energijos vartojimą. Tai pasiekiama atliekant užduotį esant minimaliam dažniui irenergijos suvartojimui iki nustatyto kritinio laiko, po kurio vykdymas užbaigiamas maksimaliu dažniu. Darbe pateikti metodo „minimax“galimybių analizės rezultatai ir jo optimalaus dažnio režimo nustatymo principai. Il. 7, bibl. 16 (anglų kalba; santraukos anglų,rusų ir lietuvių k.).22
3. PIELIKUMS. PREZENTĀCIJA KONFERENCĒ „ELECTRONICS'2006, THE 10 THINTERNATIONAL CONFERENCE. KAUNAS UNIVERSITY OF TECHNOLOGY, MAY 24, 2006”M. GREITANS, M.KALBERGS, ABILITIES AND APPLICATION OF LEVEL-CROSSINGSAMPLING IN DIGITAL SIGNAL PROCESSING.
Abilities and application of level-crossingsampling in digital signal processingM. Greitāns and M. KalbergsInstitute of Electronics and Computer Sciencekalbergs@edi.lvOUTLINESIntroductionLevel-crossing sampling principleFeatures – SQNR, sampling density, intervals, etc.Potential applicationsConclusionsELECTRONICS’2006 • Ka<strong>un</strong>as May 24 •#1abilities and application of level-crossing samplingINTRODUCTIONChips become more bigger and complicated. Complicated to provide qualitative synchronization in highfrequencies to all parts of chip.(10...30% of power consumption goes to distribute clock over chip) Alternative – clock-less systems.(benefits: low power, low EMI, less heat elimination, etc.) Clock-driven ADC can be substituted by level-crossing ADC.(event-based, signal-dependent sampling)ELECTRONICS’2006 • Ka<strong>un</strong>as May 24 •#21
abilities and application of level-crossing samplingl 6l 5l 4l 3l 2l 1LEVEL-CROSSING SAMPLING PRINCIPLESamplesInput signaltclock-driven ADCClockT samplsignal-driven ADCl 6l 5l 4l 3l 2l 1ΔtSamplesInput signalΔutT TimerSELECTRONICS’2006 • Ka<strong>un</strong>as May 24 •#3abilities and application of level-crossing samplingLC-sampling featuresSignal-to-(quantization) Noise Ratio:- classical ADCSNR dB= 1 ,76 + 6, 02nwhere n – number of bits- level-crossing samplingwhereSNRT timer– period of timerP x– power of signalP x’– power of derivative signaldB⎛ 3Px= 10log⎜⎝ P⎞ ⎛ 1⎟ + 20log⎜⎠ ⎝ Tx′ timer⎞⎟⎠Does not depend on the number of quantization levelsDepends on precision of timerDepends on properties of input signalELECTRONICS’2006 • Ka<strong>un</strong>as May 24 •#42
abilities and application of level-crossing samplingLC-sampling features Sampling density depends on spectral content of signalx( ω)x( ω)SE2 f⎛ − lUP1[ σ ] =⎜⎟ l 1exp3 ⎝ 4SfUP⎠L12[ ] ∑ −σ =E σ lkk = 1f upωf 0Single sinusoid signal30,016/THBand-limited Gaussian process withzero mean and constant PSD:For level l 1 :total2⎞( t) = Asin( 2π f t +ϕ)x0σ =30,016/TH2R Δf 0ωwhere R Δ – total number of differentlevelscrossedbysignal.ELECTRONICS’2006 • Ka<strong>un</strong>as May 24 •#5abilities and application of level-crossing samplingLC-sampling features Time intervals between two adjacent samples:Single sinusoid signal:1 ⎛ ⎛ lk⎞ ⎛ lk+ 1 ⎞⎞Δ tn= ⎜arcsin⎜⎟ − arcsin⎜⎟⎟2πf0 ⎝ ⎝ A ⎠ ⎝ A ⎠⎠aro<strong>un</strong>d extremes⎛ ⎛ ⎞⎞1 ⎜ π ⎜ lminmax ⎟⎟Δtn= ⎜ − arcsinπf⎜ ⎟⎟02A⎝ ⎝ ⎠⎠General case – the upper and lower bo<strong>un</strong>ds:TminΔl≥maxmin( x′() t )T max= ∞whereΔl minminimal distance between two quantization levelsx’(t) – derivative signalELECTRONICS’2006 • Ka<strong>un</strong>as May 24 •#63
abilities and application of level-crossing samplingdensity, pts18001600140012001000800600400200Sample density over signal frequencyLevel-crossing ADCClassic ADCSimulation results ISimulation parameters:Bit co<strong>un</strong>t: 4 bitSignal length: Θ=128sFrequency sweep from: 0 till 0.5 Hz step 0.05HzSample density in level-crossing ADCdepends from signal frequency, but intraditional ADC it remains constant.00 0.05 0.1 0.15 0.2 0.25 0.3 0.35 0.4 0.45 0.5frequency, HzTwo types of signals: band-limited noise and sinusoidalSignal length: Θ=128sFrequency: 30/ ΘNumber of bits: 4Amplitude of signal: 1VELECTRONICS’2006 • Ka<strong>un</strong>as May 24 •#7abilities and application of level-crossing sampling6050Band-limited noise signalSample density over levelsSimulation results IItheoreticalSample density of band-limited noise andsinusoidal signal using level-crossingsampling.Samples403035Sinusoidal signalSample density over levels2030100-2.5 -2 -1.5 -1 -0.5 0 0.5 1 1.5 2 2.5level valueSamples252015Increasing levels sample density is decreasing1050-1.5 -1 -0.5 0 0.5 1 1.5level valueELECTRONICS’2006 • Ka<strong>un</strong>as May 24 •#84
abilities and application of level-crossing samplingSimulation results IIIError distributed constantlybetween quantization levels3.532.5Level error histogrammClassic ADCSinusoidal signal23.532.52Level error histogrammClassic ADC1.510.50-q/2 0ptsptsNoise signalq/21.510.50-q/2 0 q/2ELECTRONICS’2006 • Ka<strong>un</strong>as May 24 •#9abilities and application of level-crossing samplingSimulation results IIITimer resolution T Times =0.2sIncreasing T Timer resolution quantization error decreases and width ofdistrebution decrease.10Distribution of quantization error12Quantization error hist9810786pts543210-q/2 0 q/2quantization error6420-q/2 0 q/2quantization levelELECTRONICS’2006 • Ka<strong>un</strong>as May 24 • #105
abilities and application of level-crossing samplingPotential applications Non-stationary (in time) signalsx(t)• Signal waveform changingrapidly samples are spaced closer.t Signals with rare peaks (in magnitude)In classic ADC case rare peaks introducequantization error.Level-crossing ADC have bigger distancebetween two samples.x(t)t Transient signalsx(t)tELECTRONICS’2006 • Ka<strong>un</strong>as May 24 • #11abilities and application of level-crossing samplingCONCLUSIONS The main abilities of level-crossing sampling discussed. SQNR can be improved by increasing the precision of timer. Sampling density reflects the spectral contents of signal:(if signal waveform is changing rapidly, the samples are spacedcloser) Samples are spaced non-equidistantly – specific DSP is required. Application for analysis of transient signals, non-stationary signalsand signals with rare peaksELECTRONICS’2006 • Ka<strong>un</strong>as May 24 • #126
4. PIELIKUMS. PUBLIKĀCIJA KONFERENCES RAKSTOS, INTERNATIONAL REMOTEENGINEERING VIRTUAL INSTRUMENT SYMPOSIUM, „REV2006”, 29-30 JUNE 2006,MARIBOR, SLOVENIA. M. GREITANS, VIRTUAL INSTRUMENTATION IN AN EXTENDEDFREQUENCY RANGE USING DIGITAL ALIAS-FREE SIGNAL PROCESSING.
Conference REV200629/30 J<strong>un</strong>e 2006 Maribor, SloveniaVirtual instrumentation in an extended frequency range usingDigital Alias-free Signal ProcessingModris GreitansInstitute of Electronics and Computer ScienceKey words: Virtual instrumentation, data acquisition, non-<strong>un</strong>iform sampling,digital signal processingAbstract:The paper presents an advanced Virtual instrumentation approach, which allows thehandling of radio-frequency and microwave signals in real-time using standard PCinterfaces for data transfer from data collection hardware. Signal acquisition is basedon a non-traditional data capturing method – non-<strong>un</strong>iform sampling, which allows thesuppression of frequency aliasing effect and, thus, the extension of the frequency rangeof processing. Appropriate algorithms of signal analysis have to be used to take intoacco<strong>un</strong>t non-<strong>un</strong>iformities of sampling and a priori information about signal. LabVIEWgraphical development system can be used for VI software designs. The proposedapproach could be effective for extending the use of virtual instrumentation principleto application areas, where this has not been possible so far.1. IntroductionA digital measurement system typically consists of sensors, which deliver an electric signal,signal conditioning, data acquisition and processing, as well as result visualization andinstrument control. Virtual instrumentation is a computer-based system that refers to the useof general purpose computer in combination with data collection hardware devices and virtualinstrument software. This approach is an interdisciplinary area that includes sensing, hardwareand software technologies in order to create flexible and sophisticated solutions. The typicalstructure of a personal computer based measurement system with virtual instruments isillustrated in Figure 1.PCSensorDataaqusitionhardwarecomm<strong>un</strong>icationinterfaceDriverVI softwareFigure1. Typical structure of virtual measurement system.1(8)
Conference REV200629/30 J<strong>un</strong>e 2006 Maribor, SloveniaTable 1.WiredInterface RS232 EPP PCI-E 16x USBFire Wire- IEEE1394bUltra 3SCSI802.11WirelessBluetoothZigBeeData rate 115kbps 1.8MB/s 250MB/s 480Mb/s 800Mb/s 320MB/s 54Mb/s 1Mb/s 250kbpsup toDistance ~15m 1.5m onboard 5m 4.5m 1m ~50m 10m100mA plug-in data acquisition board or externally connected data collection hardware transformsthe PC into a digital device capable of collecting continuous time signals from sensors andsending commands to actuators. Computer monitor and keyboard (and/or mouse) replace thefront panel of the traditional instruments and, in fact, with enhanced features. One canimagine that operating with more powerful PC, more sophisticated software tool and moreimproved hardware devices, engineers and scientists can create user-defined systems thatmeet their exact application needs. However, such a concept does not always comply withreality, because there is one more factor, which can influence the performance of the wholesystem. The data transfer rate of the interface for comm<strong>un</strong>ication between the data collectionhardware and the computer is limited.Depending on the type of connection to the PC, interfaces can be classified as wired andwireless. Wireless interfaces are increasingly used due to their convenience. Typically theyinclude 802.11 family of standards, Bluetooth and GPRS/GSM interface. Wired connectionsare serial buses (RS232, USB) or parallel interfaces, such as EPP, GPIB, SCSI and PC systembuses (i.e. ISA, PCI, PCI-X). Therefore, the throughput between data collection hardware andCPU of computer can be up to few h<strong>un</strong>dred MBps for integrated systems, up to several tens ofMBps for distributed wired systems and up to few MBps for wireless systems. The Table 1summarizes the basic parameters (data transfer rate and distance) of standard interfaces usedby computers.Traditional Digital Signal Processing (DSP) is based on analog-to-digital (A/D) conversionwhich provides <strong>un</strong>iformly spaced signal samples. The well-known Nyquist criterion statesthat the sampling rate must be at least twice as fast as the highest frequency component in theinput signal. In real-time system the bandwidth of interface has to ensure the transfer of allcaptured data without loss. Consequently, the data transfer rate of the interface determines thepossible sampling frequency of A/D converter. To prevent distortion due to frequencyaliasing, the analog anti-alias filter preceding an ADC have to be used. In such a way thelimited throughput of interface limits the frequency range of virtual instrumentation too, andits application for analyzing high frequency signals is restricted.2. Digital Alias-free signal processing technologyDigital signal processing operates with digital data. The representation of a continuous timesignal by sequences of their samples is based classically on the famous Shannon samplingtheorem, which determines that samples are spaced equidistantly. Such representationprovides the appearance of aliasing (periodicity of spectrum) into frequency domain. Thebandwidth of analysis is connected with the time period between samples. In the traditionalDSP case, the only way to expand the bandwidth of analysis is increasing the samplingfrequency. However this possibility is limited. In addition such an approach produces anincreased number of bits requiring more complicated operation of data transfer.An alternative way of achieving the capability of fully digital processing of wideband signalsis the elimination or suppression of aliasing. In this case the non-traditional principles ofanalog-to-digital conversion has to be involved and so called alias-free processing approacheshave to be exploited.2(8)
Conference REV200629/30 J<strong>un</strong>e 2006 Maribor, SloveniaDigital Alias-free Signal Processing (DASP) is an advanced DSP technology for processingradio-frequency and microwave signals in a direct digital way. The highest frequency of thesignals to be processed in this way is not necessarily limited by half the sampling rate. Thisextraordinary performance is achieved by sampling signals in a special non-<strong>un</strong>iform wayleading to suppression of frequency aliasing. The digital processing of signals withfrequencies up to GHz can be handled with mean sampling rate, which corresponds to theachievable data transfer rates of standard PC interfaces.The advantage of DASP technology is basically due to the usage of special signal digitizationand processing techniques. The substance of DASP Virtual instrumentation is determined bytwo blocks – the special sampling driver in hardware and specific DSP algorithms insoftware. While the essence of the idea of introducing non-<strong>un</strong>iformities into the samplingprocess seems to be elementary, its implementation is actually not so trivial.3. Data acquisition hardware with non-<strong>un</strong>iform sampling driver.The theoretical backgro<strong>un</strong>d of the possibility of suppressing frequency aliasing originated inthe 60th of the 20th century. However, the first intentions of implementing the theoreticalideas of non-<strong>un</strong>iform sampling into hardware systems appeared only after a few decades.An alias-free Signal Recorder & Analyzer built in 1995 can be named as the first system,which deliberately pseudo-randomized the sampling procedure and digitally processed signalsin the frequency range dc-350MHz while the mean sampling rate is about 100MSamples persecond (MSps) [1]. International recognition for such an approach was obtained by the DASPLab System [2], which was awarded the European IT Prize in 1997. DASP Lab Systemperforms fully digital analysis of signals in Time, Frequency and Modulation Domains in thefrequency range up to 1.2 GHz using the mean sampling frequency 80MSps. The widebandRF signal digitizer [3] can be mentioned as a recent development of data collection hardwaredevices, which are based on deliberately non-<strong>un</strong>iform sampling scheme. The main parametersof a digitizer are: the alias-free input signal bandwidth - 669MHz, spurious-free dynamicrange - >55dB, mean sampling rate -53.5 MSps, resolution - 12 bit. The hardware design ofthis data acquisition device is illustrated in the Figure 2. As can be seen, the board consists ofjust a few chips: ADC, FIFO memory, sampling driver and interface controller.Clock Divider ShaperFine t<strong>un</strong>ingSAMPLE PULSEFORMERDelayPRGInputADCFIFOFigure 2. Schematic block diagram of DASP acquisition hardware.3(8)
Conference REV200629/30 J<strong>un</strong>e 2006 Maribor, SloveniaTable 2.RateBits8101214161-10 Mb/sAD7400100MHz10-20Mb/sAD9237200MHz21-40 Mb/s 60-80 Mb/sAD9057120MHzAD9203390MHzAD9244650MHzAD9214300MHzAD9236500MHzAD6645270MHzAD10677210MHz81-100Mb/sAD9446540MHz101-120Mb/sAD9216500MHzAD9432500MHz121-140Mb/sAD9054380MHzAD9433750MHzAD9445615MHzAD9461610MHz141-200Mb/sAD9411700MHzAD9411700MHz201-250Mb/sAD9480750MHzAD9430700MHzAs an essential fact it should be stressed that the implementation of A/D conversion of DASPdigitizer can be based on conventional ADC chips, because their input bandwidth typically ismuch wider than the maximum sampling rate. This feature allows the carrying out of theprinciple that the frequency range of analysis exceeds the mean sampling rate, whichdetermines also the data transfer rate. The Table 2 shows the examples of available ADCs,which are grouped according to the data transfer rates in different columns and according tothe resolution bits in different rows. The actual input bandwidth of each ADC is displayedinto the cell below the ADC model. It can be fo<strong>un</strong>d that the possible frequency rangeextension varies about 4-12 times.Unlike the traditional instruments, DASP digitizers perform pseudorandom sampling of inputsignal. Sample values have to be taken at time instants predetermined with high accuracy(picoseconds range). This requirement presents a serious engineering problem, because themain hardware error, causing the noise like artifacts in processing results is sampling pointflow fluctuations or jitter error. To control the operation of pseudorandom sampling, specialsampling driver has to be developed. The Figure 3 illustrates the structure of the DASPdigitizer [3]. The sampling pulses are formed combining digital (clock frequency dividing)and analog (pulse delaying) operations, which are managed by the use of pseudo-randomnumber generator (PRG). It should be stressed that all circuits used have to be extremelyprecise to provide very accurate timing. For example, the device presented in [3] uses theclock frequency 669.3266 MHz, which ensures low-jitter timing grid with 1.494 ns step.Figure 3. Hardware design of DASP digitizer.4(8)
Conference REV200629/30 J<strong>un</strong>e 2006 Maribor, SloveniaThat supports alias-free analog bandwidth only up to 335 MHz. To reach wider bandwidth forDASP applications an additional one-step controllable delay block is applied. It is designedon the basis of an adjustable delay line with 33 ps/step. The mentioned structural solutionresults in the actual sampling rate 53.546 MSps, where sampling instants are taken from thesupposed timing grid with 1338.653 MHz frequency. In such a way the alias-free analogbandwidth 669.326 MHz is guaranteed.In addition to the above-mentioned structure a test-signal source can be built into thehardware, to provide the capability of calibration procedure.4. Processing of non-<strong>un</strong>iformly sampled signalsParticular attention within DASP virtual instrumentation is focused on optimal signalprocessing from its non-<strong>un</strong>iform samples. One way is to modify traditional algorithms (forexample, Discrete Fourier Transform) to take into acco<strong>un</strong>t the variety of sampling intervals.However, the achieved results are not satisfactory, if the sampling density is lower than twicethe bandwidth of the signal. To improve processing any a priori information about signalproperties should be taken into acco<strong>un</strong>t.4.1 Sequential component extraction (SECOEX)An effective approach to analyzing the signals with discrete spectra is the so-called SECOEXmethod [4]. Quite often the goal of spectral estimation is focused on the search for discrete(sinusoidal) components. Commonly used DFT does not solve the task precisely, because itacts on the predefined equally spaced frequency grid. If the signal contains discretecomponent with the frequency located between the analysis frequencies, the result is notalways obvious.The SECOEX approach is cyclic and based on the extraction of one discrete spectralcomponent in each cycle. The cycle includes frequency estimation of most powerful spectralline, estimation of components parameters, and subtraction of this component from the signal.Cycles are continued <strong>un</strong>til the predefined limits (number of components or residual power)are reached.4.2 Spectrum support f<strong>un</strong>ctionThe estimation of continuous spectra in the extended frequency range, which exceed Nyquistlimit several times, is a more complicated task. Obviously, there can be many signals withdifferent characteristics that occupy the same spectral bandwidth, for example, multitonesignal, chirps, different impulses, variously “colored” or “white” noise etc. Each of thesesignals has its own spectral characteristics. The basic idea of enhanced processing is notsupporting the whole frequency range equally, but of concentrating more processing on theregions with more powerful spectral parts of the signal. To realize it the concept of spectrumsupport f<strong>un</strong>ction (SSF) can be introduced. This f<strong>un</strong>ction determines the “weight ofimportance” for each frequency of analysis. It can be considered that the traditional spectralanalysis approaches (for example, Fourier transform) typically operates with a constant SSFin the whole frequency range of analysis. They do not separate the regions where the actualcomponents of the signal are to be fo<strong>un</strong>d. If a signal to be processed consists of severalsubcomponents placed within various separate locations in the frequency domain, it is notreasonable to support the whole frequency band equivalently. Instead of that the processingshould be concentrated on the frequency regions of signal components. In this case thespectrum support f<strong>un</strong>ction can be constructed as a binary f<strong>un</strong>ction, which has the value “0”for frequency subsets that are not carried by the signal and the value “1” for the frequencysubsets that can be carried by the signal. If a signal spectrum is continuous in the whole5(8)
Conference REV200629/30 J<strong>un</strong>e 2006 Maribor, Sloveniafrequency range, and there are several regions of differently powerful subcomponents, thestepwise constant f<strong>un</strong>ction can be used as spectrum support f<strong>un</strong>ction.4.3 Signal-dependent analysisAs a consequence of the above considerations we can assume that each frequency of spectralanalysis can be supported with a different weight. The question arises - how to select the exactform of spectrum support f<strong>un</strong>ction for each signal to be processed. The signal-dependentanalysis approach theoretically assumes an equivalence between the spectral support andspectral density f<strong>un</strong>ctions of a signal, or in the practical applications the spectrum support ofanalysis is adapted to the power spectral density of signal. In the method described in [5], thesignal dependent spectral transformation method involves statistical characteristics of thesignal into transformation kernel through values of signal autocorrelation f<strong>un</strong>ction, which isinverse Fourier transform from power spectral density f<strong>un</strong>ction. If there is no a prioriinformation about spectral content before analysis, the spectrum support f<strong>un</strong>ction can beestimated in an iterative way.5. Software environments for virtual instruments buildingTo develop a complete measurement system, the data acquisition hardware and appropriatesignal processing algorithms have to be integrated with virtual instrument software thatprovides a graphical user interface for device control and result visualization. The basicrequirement for the software environment, in which the virtual instrument is developed, is:high computation performance has to be combined with a comfortable platform for building auser interface and with the possibility of managing hardware ports.Initially the DASP virtual instrument development was orientated towards the use ofMATLAB computation and data visualization software package. The module for operationswith comm<strong>un</strong>ication ports has been written in C and implemented in MATLAB MEX-fileformat. The user interface is implemented using MATLAB Handle Graphics system. Thepanels of DASP-Lab virtual instruments are shown in Figure 4.Figure 4. Instrument panels of DASP-Lab system programmed in MATLAB.6(8)
Conference REV200629/30 J<strong>un</strong>e 2006 Maribor, SloveniaThe virtual instrument building on the bases of NI LabWindows/CVI package can beconsidered as the next stage. In this case the programming has to be done in language C thatallows the compilation of fast and effective code including simple low level management ofhardware ports. Two central instruments for signal analysis are the oscilloscope in the timedomain and the spectral analyzer for processing in frequency domain. As an example, in theFigure 5 the spectrum analyzer is demonstrated. The drawback to the use of NILabWindows/CVI is its orientation only to the MS Windows, which is not always best suitedto real-time application.Figure 5. DASP spectrum analyzer designed in LabWindows/CVI.NI LabVIEW software package is a convenient tool for creating virtual instruments anddesigning graphical user interfaces on several platforms. Although it is a graphicalprogramming language, its versatility allows the easy incorporation of modules written inother languages. If standard PC interfaces are used for comm<strong>un</strong>ication with DASP digitizer,there is no necessity to develop special driver for attached hardware. These are argumentswhy the latest developments in the framework of DASP VI are designed using NI LabVIEW.Graphical programming approach is more easily available for wider range of end-users. Theblock diagram of spectrum analyzer is shown in Figure 6. It demonstrates the simplicity ofbuilding virtual instruments and the possibility of adapting them to specific requirements ofeach end-user.Figure 6. DASP Virtual instrumentation software in LabVIEW.7(8)
Conference REV200629/30 J<strong>un</strong>e 2006 Maribor, Slovenia6. ConclusionsThe virtual instrumentation approach is an effective way of building flexible measurementsystems. The significant advantage is the possibility of utilizing the PC resources for datavisualization and storage, as well as to simulate the system controls on the bases of keyboardand mouse. The drawback of such systems is the limited capacity of data transfer channelbetween the acquisition hardware and the PC interface. If standard <strong>un</strong>iform samplingapproach is used, that limits the frequency range of measurement system in real-timeapplications, and leads to the restricted use of virtual instruments in the field of radiofrequencies and microwaves.The paper demonstrates an advanced approach of the analog-to-digital conversion, which isbased on non-<strong>un</strong>iform sampling. Such sampling strategy allows the suppression of frequencyaliasing and extends the frequency range of digital processing. From the practical point ofview the problem resolves into two directions – special sampling driver in hardware andspecific algorithms in software. The ADC chips typically have the feature that their inputbandwidth is wider then the maximal allowable sampling rate, and that is exploited in designsof DASP digitizers.Non-<strong>un</strong>iform sampling technique requires the appropriate digital signal processing, whichtakes into acco<strong>un</strong>t the exact location of each sample point. In addition, it is essential toinvolve a priori information about signal properties into analysis. That leads to the concept ofspectrum support f<strong>un</strong>ction and to the construction of signal-dependent transformation.The software environment for designs of a virtual instrument has to integrate the highcomputation performance with the comfortable building of a user interface and with theconvenient management of hardware ports. As examples MATLAB, NI LabWindows/CVIand NI LabVIEW can be mentioned. The latest developments of DASP VI are orientatedtowards the use of NI LabVIEW, because it is multi-platform graphical programmingenvironment comfortable for virtual instrument building and does not require high-level skillsin programming.References:[1] Artyukh, Yu.; Bilinskis, I.; Rybakov, A.; Vedin. V.: “Alias-free Signal Recorder & Analyser”, Proc. ofthe Workshop on Sampling Theory and Application, Jurmala, Latvia, Sep., 1995, pp. 220-222.[2] Artyukh, Y.; Bilinskis, I.; Greitans, M.; Mednieks, I.; Rybakov, A.: “DASP-Lab System – ademonstrator of the new DSP technology”, Automatic Control and Computer Science, Nr.6, 2000,pp. 3-21.[3] Artyukh, Yu.; Bilinskis, I.; Boole, E.; Rybakov, A.; Vedin, V.: “Wideband RF signal digitising forhigh purity spectral analysis”, Proc. of the International Workshop on Spectral Methods andMultirate Signal Processing, Riga, Latvia, J<strong>un</strong>., 2005, pp. 123-128.[4] Mikelsons, A.: “Alias-free spectral estimation of signals with components of arbitrary frequencies”,Proc. of Cost #229 workshop on Adaptive Methods and Emergent Techniques for SignalProcessing and Comm<strong>un</strong>ications, Ljubljana, Slovenia, 1994, pp. 105-108.[5] Greitans, M.: “Spectral analysis based on signal dependent transformation”, Proc. of theInternational Workshop on Spectral Methods and Multirate Signal Processing, Riga, Latvia, J<strong>un</strong>.,2005, pp. 179-184.Author:Modris, Greitans, Dr.sc.comp.Institute of Electronics and Computer Science14 Dzerbenes str., Riga, LV1006, LATVIAEmail: modris_greitans@edi.lv8(8)
5. PIELIKUMS. PUBLIKĀCIJA KONFERENCES RAKSTOS, INTERNATIONAL CONFERECE ONSIGNAL PROCESSING AND MULTIMEDIA APPLICATIONS, „SIGMAP2006” M. GREITANS.PROCESSING OF NON-STATIONARY SIGNAL USING LEVEL-CROSSINGSAMPLING
PROCESSING OF NON-STATIONARY SIGNAL USINGLEVEL-CROSSING SAMPLINGModris GreitansInstitute of Electronics and Computer Science14 Dzerbenes str., Riga, LV1006, LATVIAEmail: modris greitans@edi.lvKeywords:Abstract:Clock-less design, non-stationary signal, level-crossing sampling, time-frequency representation.The spectral characteristics of multimedia signals typically vary with time. Preferably, the sampling density ofthem would comply with instantaneous bandwidth of signal. The paper discusses the level-crossing samplingprinciple, which provides such capability for analog-to-digital conversion. As the captured samples are spacednon-<strong>un</strong>iformly, the appropriate digital signal processing is required. The non-stationary signal is characterizedby time-frequency representation. Its classical approaches are inspected for applicability to analyze the dataobtained by level-crossing sampling. Several enhancements of short-time Fourier transform approach areproposed, which are based on the idea to minimize the reconstruction error not only at sampling instants,but also between them with the same accuracy. Additional benefits are gained if the instantaneous spectralrange of analysis is complied with local sampling density: artifacts are removed, complexity of calculationsis decreased. The performance of algorithms is demonstrated by simulations. Presented research can beattractive for clock-less designs, which receive now an increasing interest. Their promising advantages canplay a significant role in future electronics’ development.1 INTRODUCTIONConventional digital signal processing techniques oftenconsider the stationarity of a signal within a frameof analysis. It is assumed that the statistical characteristicsof signal do not change with time. The conceptof stationarity provides the possibility of fixingthe sampling rate (it should be at least twice as highas the maximum signal frequency), as well as of constructingeffective processing methods, for examplethe Discrete Fourier transform (DFT). However, naturalsignals typically are time-varying, and they canbe a mixture of events localized both in time and frequency(Akay, 1998).Intuitively speaking, the non-stationarity of a signalshould be reflected in the process of analog-todigital(A/D) conversion. For example, let us inspect asignal with high instantaneous frequency regions andlow instantaneous frequency in other regions. It ismore efficient to sample the low frequency regions ata lower rate than the high frequency regions. Consequently,with appropriate non-equidistantly spacedsamples one might approximate a signal with fewersamples per interval than in the <strong>un</strong>iform samplingcase, where sampling frequency is defined taking intoacco<strong>un</strong>t only the highest signal component. Two conclusionsfollow: non-<strong>un</strong>iform sampling is the naturalchoice for the discrete representation of a nonstationarysignal, and the non-<strong>un</strong>iformity of samplingprocess has to be caused by the local properties of signal.The work presented in this paper is based on theidea of abandoning traditional clock-driven A/D conversionand the <strong>un</strong>iform digital signal processing,which typically follows it. Instead of that, a clocklessstructure of data processing system is suggested,where the A/D conversion is signal-driven. To illustratethe difference, the processing chains of both approachesare illustrated in the Fig.1. Let us emphasizethe key benefits of the asynchronous electronics:lower power consumption, absence of the clockscrew, reduced heat elimination, lower EMI, automaticadaptation to physical properties, etc. (Hauck,1995). The popular types of signal-dependent samplingare based on zero-crossing, reference signalcrossing, level-crossing or send-on-delta concepts.Each of them has its own advantages and limitations,however joint features are: the signal samples canbe spaced non-<strong>un</strong>iformly, local sampling density dependson local properties of signal, and it is impos-
(a)(a)(b)Figure 1: Structures of DSP system based on differentparadigm: synchronous (a), asynchronous (b).sible to determine the sampling time instants in advance.The paper discusses digital signal processingif the level-crossing sampling scheme is used to capturedigital data from a continuous time signal.2 LEVEL-CROSSING SAMPLINGThe principle of <strong>un</strong>iform sampling is illustrated inFig.2a: sampling is driven by an external clockwith fixed period T sampl that gives the equidistantlyspaced samples. The level-crossing sampling (LCS)scheme is based on the principle that samples are capturedwhen the continuous time input signal crossespredefined levels. Typically, the quantization levelsare <strong>un</strong>iformly disposed along the amplitude range ofthe signal as is shown in Fig.2b.Such a sampling strategy is not new and has beenknown at least since the late 1950s (Ellis, 1959). Variousterms are used to name it: event-based sampling,level-crossing sampling, magnitude-driven sampling,and sometimes, sampling in the amplitude domain.The variety of existing terminology shows that it is reallya generic concept adapted to a broad spectrum oftechnology and applications. It has been shown thatlevel-crossing sampling has several interesting propertiesand is more efficient then traditional samplingin many respects (E. Allier and Renaudin, 2003).Classical A/D conversion implements clock-drivensample-and-hold (S/H) operation, which is followedby quantization operation. Considering an ideal clockand an ideal S/H, anyway there is imprecision of conversiondue to the limited number of quantization bitsL. The Signal-to-(quantization)Noise Ratio (SNR) ofclassical ADC can be expressed asSNR dB = 1, 76 + 6, 02L, (1)and it depends only on the resolution of the converter.(b)Figure 2: Analog-to-Digital conversion: clock-driven (a)vs. signal-driven level-crossing sampling case (b).In the level-crossing based A/D converter, since asample is taken only when a level is crossed, the amplitudevalue of the sample is exact. Due to the factthat samples are spaced non-equidistantly, the applicationof LCS often requires that the time instant ofthe sample also be known. In practice, the time intervalis measured by a timer that quantizes the timewith certain resolution T timer . The SNR in this casecan be estimated as (E. Allier and Renaudin, 2003):( 3PxSNR dB = 10logP x ′)+ 20log( 1T timer), (2)where P x is power of the random input signal, andP x ′ is power of it’s derivative. In this case SNR doesnot depend on the number of quantization levels, butdepends on the properties of the input signal and onthe precision of the timer. Signal-to-noise ratio can beimproved simply by decreasing T timer .The goal of the proposed paper is to explore theuse of the level-crossing sampling technique for analysisof a non-stationary signal. In this context, theevaluation of the local sampling density can play asignificant role, because it is connected with the localstatistical characteristics of a signal. If a signal ischanging rapidly, the samples are spaced closer, andconversely - if a signal is varying slowly, the samplesare spaced sparsely. The variability of waveformis linked with spectral content, and thereby the localsampling density can be used to estimate the instantaneousmaximum frequency of signal.If the input signal is single sinusoidx(t) = Asin(2πf 0 t + ϕ), (3)
where A is the amplitude, f 0 - the frequency andϕ - the initial phase, the sampling density can be expressedasσ = 2R ∆ f 0 , (4)where R ∆ is the total number of different levelscrossed by the signal.Determining the sampling density of a broadbandprocess is not as elementary as for a mono-harmonicsignal. Analytically it is investigated for band-limitedGaussian process with zero mean and constant spectraldensity{S |f| ≤ fUPP x (f) =0 otherwise . (5)The expected number of level l 0 crossings per time<strong>un</strong>it can be expressed as (Mark and Todd, 1981)E[σ l0 ] = 2f ( )UP −l2√ exp 0. (6)3 4Sf UPTo calculate the sampling density, it is necessary tosum up the sampling instants of all the quantizationlevels l k2∑L −1E[σ] = σ lk . (7)k=1One more of the main parameters describing thesampling process is the time interval between twoadjacent samples ∆t n = t n+1 − t n . The meanvalue of the interval is tied with sampling density as|∆t n | = 1 σ . The exact ∆t n values can be estimatedanalytically only for special cases, i.e., for the monoharmonicsignal (3). If the signal crosses the level l kat the time instant t n and the level l k+1 at the timeinstant t n+1 , the ∆t n can be calculated as∆t n = 12πf 0∣ ∣∣∣(arcsin(lkA)− arcsin(lk+1))∣ ∣∣∣.A(8)Aro<strong>un</strong>d extremes the signal crosses the same leveltwice and the distance between crossings is∆t n = 1 ( ( ππf 0 2 − arcsin |lmin | max |A)). (9)If ∆t n cannot be estimated analytically, the upper andlower bo<strong>un</strong>ds of time interval can be evaluated basedon the signal parameters. The minimum distance isdetermined asT min ≥∆l minmax(|x ′ (t)|) , (10)where ∆l min is the minimal distance between twoquantization levels, and x ′ (t) is first derivative of thesignal. The case, where the signal crosses the samelevel twice, is distinct, because ∆l = 0 and T min canreach zero. The upper bo<strong>un</strong>d of ∆t n is infinity, becausethe level-crossing sampling might not be triggeredif the signal waveform is located between twoconsecutive quantization levels. To avoid this, the distancebetween quantization levels has to be less thanthe amplitude of the signal.In addition, the following facts should be noted -if a signal waveform has some regularities, the sampleflow has the same regularities as well. This effectoften leads to a problem that the methods, which arederived for deliberately non-<strong>un</strong>iform sampling, do notalways work satisfactorily for a particular case - levelcrossingsampling, which provides signal-dependentnon-<strong>un</strong>iform data. The level-crossing based analogto-digitalconversion is asynchronous in the sense thatit does not have the clock that determines the positionsof samples. That leads to a drastic change inthe standard signal and data processing and initiates anew research area - asynchronous signal processing.3 CLASSICAL TFRs ANDNON-UNIFORM SAMPLINGThe non-stationary signal is characterized by timefrequencyrepresentation (TFR). As the signal samplescaptured according to the level-crossing principleare spaced non-<strong>un</strong>iformly, the appropriate digital signalprocessing is required. In this section, the applicabilityof classical TFR approaches to analyze LCSdata is inspected. The time-frequency representationis characterized by points on a time-frequency gram.For practical applications it is assumed that a finiteduration Θ of bandlimited to Ω signal is observed.The traditional approaches for TFR calculations arebased on Short-time Fourier transform (STFT) (Gabor,1946), joint time-frequency distribution (Cohen,1995) and wavelet transform (WT) (Chui, 1992).3.1 Short-time Fourier transformThe classical method for analyzing non-stationarysignals is short-time Fourier transform. It was proposedby Gabor (Gabor, 1946). STFT is based onthe well known Fourier transform. The basic idea ofSTFT is to introduce a time window, which is movedalong the signal, and in such a way the time indexedspectrogram of x(t) is defined asSTFT(t, f) =∫ ∞−∞x(τ)w ∗ (t−τ)exp(−j2πfτ)dτ,(11)where w(t) is a time window and ·∗ denotes the complexconjugates.In the case of finite number of discrete samplesx n = x(t n ), n = 1, N (N is a number of samples
Figure 3: STFT based time-frequency representation oftest-signal sampled by crossing 7 levels.Figure 4: WT based time-frequency representation of testsignalsampled by crossing 7 levels.within time interval Θ), the STFT based TFR on the<strong>un</strong>iformly spaced time-frequency grid with frequencystep 1 1Θand time step2Ωcan be calculated asTFR STFT (k, m)N∑=x∣ n w ∗ (k/2Ω − t n )exp(−j2πt n m/Θ)∣ .n=1(12)The expression (12) uses the general form of DFT, inwhich the restriction, that requires the <strong>un</strong>iform spacingof samples x n = nT , can be ignored. To examinewhat happens if this expression is used for analysisof level-crossing samples, the single chirp (parametersof it will be described in the Section 6) is chosenas a test-signal. The Fig.3 illustrates the fact that inaddition to the true component, spurious componentsappear at the higher odd harmonics. These artifactsare due to the use of LCS approach for signal withregularities in the waveform. The additional sourceof artifacts can be the absence of the orthogonality oftransformation f<strong>un</strong>ctions exp(−j2πt n m/Θ) if t n arenot placed <strong>un</strong>iformly.A well-known problem inherent in STFT is the inverserelationship between time and frequency resolutions.Extension of the window’s w(t) length improvesthe frequency resolution, but at the same timedegrades the temporal selectivity. To overcome thisdifficulty of short time Fourier transform, alternativemethods of time-frequency analysis have been developed.The two most popular of them are a wavelettransform and a Wigner-Ville distribution.3.2 Wavelet transformThe wavelet transform of a continuous-time signalx(t) is defined asWT(t, a) = √ 1 ∫ ∞( ) t − τx(τ)h ∗ dτ, (13)a a−∞where a is the scaling factor and h(t) is the so-calledanalyzing wavelet. The time-frequency version is obtainedby making the substitution a = f 0 /f. Theanalysis can be viewed as a filter bank comprisingbandpass filters with bandwidths proportional to frequency.The multi-resolution nature of wavelet analysisleads to some limitations. Wavelet transform usesa scaling profile such that frequency resolution decreasesat high frequencies, and temporal resolutiondecreases at low frequencies. While this choice ofscaling leads to nice mathematical structures and algorithms,there is no physical reason to assume that itcorresponds to natural structure behavior. For discreteWT, in order to get the best performance of analysis,the time- and scale-sampling grid often should beconsiderably over-sampled, that introduces the red<strong>un</strong>dancyin the TFR.The general form of time-frequency representationbased on discrete wavelet transform can be expressedasTFR WT (k, m)1N∑( ) ∣ k/2Ω −=√ x(t n )h ∗ tn∣∣∣.∣ f0 Θ/mfn=10 Θ/m(14)Such a notation enables the processing of both <strong>un</strong>iformlyand non-<strong>un</strong>iformly sampled data. The nicemathematical feature of WT for equidistantly spacedsamples states: for any k and a = 2 m (k, m ∈ Z)the {h(t h )} (m,k) is a subset of one discreet wavelet,which is <strong>un</strong>iformly sampled at the sampling frequencyof the signal. In the case of non-equidistantlyspaced samples this property is lost, because the valuesof wavelet h(t) have to be calculated at differentpoints set {t h } (m,k) for each scaling factor a (or frequencyof analysis f = f 0 /a). Due to this fact, thecomputation complexity of WT in the non-<strong>un</strong>iformsampling case considerably exceeds the complexityof the <strong>un</strong>iform sampling case.The time-frequency representation obtained by(14), if level-crossing sampling is used, is demonstratedin Fig.4. It shows the reduction of the temporalresolution in the low frequency region and diminishedspectral resolution in the high frequency region. Theadditional artifacts appear as well.
3.3 Wigner-Ville distributionTime-frequency analysis, based on the use of Wigner-Ville f<strong>un</strong>ction, is defined asWV D(t, f)=∫ ∞−∞x(t + τ ) ( x ∗ t − τ )exp(−j2πfτ)dτ.2 2(15)It provides high-resolution representation in time andin frequency for mono-component signals. However,if the signal consists of several subcomponents, additionalinterference or cross-terms appear due to thequadratic nature of kernel and non-linear propertiesof it. In order to mitigate this deleterious effect, a varietyof modified kernels have been introduced. Oneway to remove the interference is by smoothing thetime-frequency plane, but this will be at the expenseof decreased resolution in both time, and frequency.A promising approach of how to suppress cross-termsand improve resolution is the use of signal-dependentkernels (Baraniuk and Jones, 1993).A discrete form of the Wigner-Ville distribution(WVD) can be expressed asTFR WV D (k, m)N∑= 2x(k/2Ω + t∣n )x ∗ (k/2Ω − t n )n=1· exp(−j4πt n m/Θ)|.(16)The necessity of knowing signal values at time instantsτ + t n and τ − t n for all n = 1, N leadsto the fact that the expression (16) can be used onlyfor <strong>un</strong>iform and specifically regular sampling series.Therefore it is impossible to use the WVD approachfor processing data captured by the level-crossings.4 ENHANCEMENTS OF DFTIt can be concluded from the discussion above, thatthe most useful approach for practical applicationsusing the level-crossing sampling is based on STFT.However it has to be enhanced and adjusted to theLCS to suppress the presence of spurious components.The key operation of discrete STFT is the DFTalgorithm, which is applied to the windowed signalsamples. Thus the STFT enhancement can be reducedto the development of DFT-like methods, which takeinto acco<strong>un</strong>t LCS features. The level-crossing samplingprinciple provides not only samples at certainevents, but also the rule that the signal between twosampling instants does not cross any quantizationlevel. This information can be exploited in the processing.The proposed idea is to minimize the errorbetween the original signal and that reconstructed bythe Fourier series, not only at sampling time instants,but also between them with the same accuracy. Theproblem lies in the fact that the reconstruction errorcan be obtained only at the time moments in whichthe signal samples are known.Basing on the Fourier series the signal waveformcan be reconstructed from its spectral estimates by thefollowing formulaˆx(t) = ∑ X m exp(j2πtf m ), t ∈ [0, Θ], (17)mwhere X m are Fourier coefficients at frequenciesf m = m/Θ. If the original continues-time signal isx(t), the reconstruction error isε(t) = x(t) − ˆx(t), (18)and the following minimization task∫ Θ0|ε(t)| 2 dt → min (19)can be established on the <strong>un</strong>derstandings, that the signalvalues are known only at sampling points, and thereconstructed signal is defined by (17). The problem(19) has to be resolved with respect to the coefficients{X m }. Two approaches can be considered: the firstone is based on setting up the continuous time signalby interpolation of known samples, while the secondapproach, which minimizes the continuous timereconstruction error, is based on the interpolation oferror samples.4.1 Signal interpolationIf signal samples {x n } are interpolated within thetime interval [0, Θ], the problem (19) can be rewrittenas∫ Θ∣∣˜x(t) − ∑ 2X m exp(j2πtf m )dt → min,0∣m(20)where ˜x(t) is the interpolated signal. To find the minimum,all the individual derivatives of X m have to beconsidered as being equal to zero. Taking into acco<strong>un</strong>tthat {exp(j2πf m t)} is a set of orthogonal f<strong>un</strong>ctionsinto interval [0, Θ] if frequencies f m = m/Θ, aftersome algebra the following formula for X m(x) ( (x) denotesthat signal samples are interpolated) estimationcan be obtained:X (x)m= 1 Θ∫ Θ0˜x(t)exp(−j2πtf m )dt. (21)The expression (21) is similar to the formula for thecalculation of the Fourier series coefficients for signal˜x(t).
Signal interpolation can easily be done by connectingthe samples with polynomials p k n (t) of order k as˜x(t) = ∑ n pk n(t), or a band-limited interpolation canbe performed using a sum of time-shifted sinc f<strong>un</strong>ctions.If signal samples are interpolated with zero-orderpolynomials (piece-wise constant line changing valueat midpoints between samples):X (x0)m == j2πf mN∑n=1∑N∫ tn+t n+12x ntn+t n−12exp(j2πf m t)dt(22)x n exp(j2πf m t n )n=1· (1 − exp(−j2πf m ∆t ′ n )),where ∆t ′ n = (t n+1 − t n−1 )/2, t 0 = 0, t N+1 = Θ.For piece-wise linear interpolation the polynomialp 1 n(t) = α n (t − t n ) + x n can be used, where α n =∆x n /∆t n , ∆x n = x n − x n−1 , ∆t n = t n − t n−1 ,which gives:X (x1)m= X (x0)m +1 ∑N(2πf m ) 2 α n exp(j2πf m t n )n=1· (1 − exp(−j2πf m ∆t n )) + j2πf mN ∑n=1· exp(j2πf m t n )exp(−j2πf m ∆t n ).α n ∆t n(23)Band-limited interpolation of samples can be describedas:K∑˜x (sinc) (t) = c k sinc(2Ωt − k). (24)k=0In this case DFT transform gives:K∑X m (sinc) = c k exp(−jπf m k/Ω), (25)k=0where c k are coefficients that can be fo<strong>un</strong>d from a linearequation systemK∑x n = c k sinc(2Ωt n − k). (26)k=0Such an approach, besides the complexity of DFT,also requires the solution of linear system with Nequations and with K +1 <strong>un</strong>knowns. Interpolation bysinc f<strong>un</strong>ctions can be effectively done for the stationarysignal and if the gaps between samples do not exceed1/2Ω. In this case the appropriate width of f<strong>un</strong>ctioncan be fixed. However, for the non-stationary signal,the sinc f<strong>un</strong>ctions should be stretched and timeshiftedin accordance with instantaneous signal bandwidthand local sampling density.4.2 Error interpolationLike the interpolation of signal samples, thecontinuous-time reconstruction error f<strong>un</strong>ction ˜ε(t)can be constructed from its values ε n = x n − ˆx n , andthe problem (19) can be interpreted as minimizationof area <strong>un</strong>der the f<strong>un</strong>ction |˜ε(t)| 2 .Using zero-order polynomial interpolation the minimizationtask becomes:N∑∣ x n − ∑ 2X m (ε0)exp(j2πf m t n )∆t ′ n → min .∣n=1 m(27)After the derivation and some algebra the solution canbe expressed in the matrix form:X (ε0) = Ψx(ΦΨ T ) −1 , (28)where φ mn = exp(j2πf m t n ), ψ mn = φ mn ∆t ′ n, and·T , ·−1 denotes the transpose and inverse operation ofmatrix respectively.The first-order polynomial interpolation of errorsamples provides the problem, which looks like a sumof two zero-order interpolation tasks:12( N−1 ∑n=1|ε n | 2 ∆t n +)N∑|ε n | 2 ∆t n−1 ) → min .n=2The solution is similar to the expression (28):(29)X (ε1) = (Ψ ′ x ′ + Ψ ′′ x ′′ )(Φ ′ Ψ ′ T + Φ ′′ Ψ ′′ T ) −1 ,(30)where Φ ′ , Ψ ′ , x ′ and Φ ′′ , Ψ ′′ , x ′′ matrices areformed from Φ, Ψ, x by using indexes n ′ = 1, N − 1and n ′′ = 2, N respectively.5 PROPOSED APPROACHThe proposed approach is based on the same timewindowing principle as in the STFT case. However,instead of general DFT more sophisticated methodsare used, which have been described in the Section4. Enhanced algorithms have increased mathematicalcomplexity, particularly the error interpolationcase, because the solving of linear system withN equations and M <strong>un</strong>knowns is required. M representsa number of frequencies in the Fourier series.The equation system can be solved correctly, if thenumber of samples is equal or greater than the numberof frequencies. The greater the N/M ratio, the higherthe stability of the solution. It has been shown, that,using the level-crossing sampling approach, the numberof samples depends on the signal properties. Relationshipsbetween the local sampling density and theinstantaneous upper spectral frequency of signal have
een derived. Performing the time-frequency analysis,these interdependencies can be exploited from another point of view. The bandwidth of analysis canbe limited using information about the local samplingdensity. The number of frequencies, as well as thedimensions of matrices vary with the time. For simulations,which will follow in the next section, the analysisbandwidth is selected as a minimum value of twofrequencies: total bandwidth Ω or highest signal frequencyestimated from the sampling density:( )Nw (t)Ω a (t) = min + Ω ∆ , Ω , (31)2R ∆ T wwhere N w (t) is the number of signal samples in thetime interval with length T w , and Ω ∆ is necessary toensure the coverage of actual signal bandwidth. Thefrequencies of analysis are f m = m/Θ : |f m | ≤ Ω a .Figure 5: STFT approach in combination with zero-orderinterpolation of signal samples (dashed line shows instantaneousbandwidth estimate from local sampling density).6 SIMULATION RESULTSThe computer simulation has been carried out todemonstrate the performance of approaches, whichhave been developed for time-frequency analysis ofdata captured by level-crossings. As a test-signala chirp has been selected, which in the first halfof observation diminishes from middle frequency tolow frequency region (down to the normalized frequency0.05), while in the second half rises back tothe normalized frequency 0.25. Seven quantizationlevels have been placed equidistantly to cover the inputrange of the test-signal. The observation time isΘ = 256, and 536 samples in total are obtained.Time-frequency representations calculated bySTFT and WT approaches have been already illustratedin the Section 3 (see Fig.3 and Fig.4).Let us inspect the enhanced algorithms, which arebased on interpolation (expressions (22) and (23)).Fig.5 shows TFR obtained in the case, where timewindowed test-signal samples are interpolated byzero-order polynomials. The spurious componentsare attenuated, however the presence of them is stillobservable. If the first-order polynomials are usedfor interpolation, the result is slightly improved, butthe complexity of calculations is higher. Fig.6 showstime-frequency representation of test-signal if errorsamples are interpolated by zero-order polynomials(28). The spurious harmonics are completelysuppressed, however other artifacts are observablein the time region, where the frequency of chirpis low. Reduction of the instantaneous frequencyresults in the decreasing of local sampling density.As the grid of temporal analysis and length of timewindow w(t) are fixed, the number of the significantsamples can fall below the number of frequenciesof analysis. Such a situation causes the problem ofFigure 6: STFT approach in combination with zero-orderinterpolation of error samples (dashed line shows instantaneousbandwidth estimate from local sampling density).Figure 7: TFR of test-signal if approach of varying therange of analysis is used.matrix inversion quality and leads to the appearanceof artifacts. The use of interpolation by first-orderpolynomials does not have an impact on this effect.To improve the quality of TFR in the region, wheresampling density is low, the bandwidth of analysis hasbeen cut down according to the expression (31). Theestimated bandwidth of signal is illustrated in Fig.6and Fig.5 by dashed line (Ω ∆ = 0.1). The coherencebetween the sampling density of a signal andthe frequency range of an analysis gives several benefits- the stability of the algorithm is increased, thecomplexity of calculations is decreased and the presenceof artifacts is eliminated. Fig.7 demonstrates the
time-frequency representation obtained by the algorithmbased on the expression (28) in the case, wherethe number of analysis frequencies are varied accordingto the sampling density. The chirp can be trackedwithout any presence of artifacts.7 CONCLUSIONThe processing of non-stationary signal using levelcrossingsampling approach has been investigated.On the one hand, such a sampling strategy providesseveral interesting properties - signal to quantizationnoise ratio does not depend on the number of quantizationbits, local sampling density reflects the instantaneousbandwidth of signal, etc. On the otherhand, the captured samples are placed non-<strong>un</strong>iformlyand that requires rethinking of the processing methodology.The classical approaches of time-frequencyanalysis have been discussed. Time-frequency representationshave been obtained using general forms ofthem, which are suitable also for processing of non<strong>un</strong>iformlysampled signals. The simulation showsthat the main drawback of STFT is the appearance ofspurious components, while wavelet transform giveslow spectral resolution at high frequencies and lowtemporal resolution at low frequencies.Several enhancements have been proposed, whichare based on the idea of minimizing the error betweenthe original signal and that reconstructed bythe Fourier series, not only at sampling time instants,but also between them with the same accuracy. Theproblem lies in the fact that the original signal valuesare known only at sampling instants. One solution isbased on the consideration, that the continuous timesignal is constructed by interpolation of known signalsamples. The expressions for zero-order and firstorder polynomial interpolation as well as for bandlimitedinterpolation with sinc f<strong>un</strong>ctions have beenestablished. The other approach is to interpolate theerror samples in the same manner.Simulation results show the improvement of TFRsif enhanced algorithms are used instead of classicalones. Additional benefits can be gained if the bandwidthof analysis is varied along the time axis accordingto changes in local sampling density: the artifactsare removed, the complexity of calculations can bedecreased. The common drawback of STFT basedmethods is restrictions on the resolution. Extension ofthe windows w(t) length improves the frequency resolutionbut at the same time degrades the temporal selectivity.To overcome this rule, the signal-dependenttransformation described in (Greitans, 2005) can beused. Due to the limited size of the paper, this methodis not discussed above, however the TFR obtained bysignal-dependent algorithm is shown in the Fig.8 forFigure 8: TFR of test-signal if signal-dependent transformationis used.the illustration. The increased resolution is achievedby adapting the transformation f<strong>un</strong>ctions to the localspectral characteristics of the signal. As it is beingdone in an iterative way, the mathematical complexityis higher than for STFT based algorithms.The proposed approach of processing nonstationarysignals using level-crossing sampling isattractive for clock-less designs, which are now receivingincreasing interest. Their advantages can playa significant role in future electronics’ development.REFERENCESAkay, M., editor (1998). Time frequency and wavelets inbiomedical signal processing. IEEE Press.Baraniuk, R. G. and Jones, D. L. (1993). A signaldependenttime-frequency representation: Optimalkernel design. IEEE Trans. Signal Proc., 41(4):1589–1602.Chui, C. K. (1992). Wavelet Analysis and its Applications.Academic Press, Boston, MA.Cohen, L. (1995). Time-frequency analysis. Prentice-Hall.E. Allier, G. Sicard, L. F. and Renaudin, M. (2003). A newclass of asynchronous a/d converters based on timequantization. In Proc. of International Symposium onAsynchronous Circuits and Systems ASYNC’03, pages196–205, Vancouver, Canada.Ellis, P. H. (1959). Extension of phase plane analysis toquantized systems. IRE Transactions on AutomaticControl, AC(4):43–59.Gabor, D. (1946). Theory of comm<strong>un</strong>ication. Journal ofthe IEE, 93(3):429–457.Greitans, M. (2005). Spectral analysis based on signal dependenttransformation. In Proc. of the InternationalWorkshop on Spectral methods and multirate signalprocessing, pages 179–184, Riga, Latvia.Hauck, S. (1995). Asynchronous design methodologies: Anoverview. Proc. of the IEEE, 83(1):69–93.Mark, J. W. and Todd, T. D. (1981). A non<strong>un</strong>iform samplingapproach to data compression. IEEE Trans. onComm., 29(1):24–32.
6. PIELIKUMS. MAĢISTRA DARBA ANOTĀCIJA. R. ŠĀVELIS „SIGNĀLA LAIKFORMASATJAUNOŠANA NO LĪMEŅU ŠĶĒRSOJUMA NOTIKUMU NOLASĒM”.
• ANOTĀCIJASignālu atja<strong>un</strong>ošana no nolasēm, kas iegūtas signālatkarīgu analogs-ciparupārveidojumu rezultātā, ir aktuāla problēma asinhronās jeb beztaktēšanas sistēmās.Pie šādiem signālatkarīgiem pārveidojumiem pieder darbā apskatītais līmeņušķērsojumaanalogs-ciparu pārveidojums, kura rezultāts ir laikā nevienmērīgiizvietotas signāla nolases. Darba mērķis ir apgūt dažādas signāla atja<strong>un</strong>ošanasmetodes, to priekšrocības <strong>un</strong> trūkumus. Mērķa sasniegšanai tiek:• īsumā apskatīti analogs-ciparu pārveidojumi,• veikts līdz šim jau publicēto signāla atja<strong>un</strong>ošanas metožu principu apskats• piedāvāts ja<strong>un</strong>s signāla atja<strong>un</strong>ošanas paņēmiens uzlabotās sinc f<strong>un</strong>kcijumetodes veidā,• veikta signāla atja<strong>un</strong>ošanas simulācija MATLAB vidē ar visām iepriekšapskatītajām metodēm.Darba nobeigumā sniegts iegūto rezultātu novērtējums <strong>un</strong> secinājumi. Darbarezultātus var pielietot signālatkarīgā datu apstrādē, turklāt apskatītā uzlabotā sincf<strong>un</strong>kciju metode ir labs aizsākums turpmākajiem pētījumiem.Darbā: 70 lpp. teksts, 56 attēli, 2 tabulas, 5 pielikumi <strong>un</strong> 16 nosaukumuinformācijas avoti.
7. PIELIKUMS. A
%**************************************************************************% F<strong>un</strong>kcijas, kas paredzeeta dazhaadu signaalu genereeshanai%**************************************************************************f<strong>un</strong>ction Uno=noise(t, amp, f, ph)U=[];for vv=1:length(t)usig=sum(amp.*sin(2*pi*f*t(vv)+ph)); % katram mazajam gabalinjam tiekapreekjinaatas signaala vertiibasU=[U usig+0.5];end;%Uno=U/max(abs(hi), abs(lo));Uno=U/sqrt(length(f));%hold on;%plot(Uno);
clc;close all;clear all;amp=1; %amplituda, VT=30; % periodu skaits peetaamaa signaala garumaa.TH=128; % signaala garumsa=T/TH;% trokshveida signaala joslas patums, Hz%b=0.001;% frekvences pieaugums, Hz/sqbit=4; % kvanteeshanas bitu skaits, gabfsk=TH*4;rand('state', 1);ph=rand(1,fsk)*2*pi;dt=1024;f=linspace(0, a, fsk);signal='noise(t, amp, f, ph)';r<strong>un</strong> level_crossing%**************************************************************************% LEVEL VALUE HISTOGRAMM%**************************************************************************lvd=[];cnt=[];for ss=1:length(lv)lvd=[lvd lv(ss)];cnt=[cnt length(lv3(lv3==lv(ss)))];end;%set(gca, 'xlim', [0 TH]);figure;stem(lvd, cnt, '.', 'k');title('Sample density over levels');xlabel('level value');ylabel('pts');%**************************************************************************% THEORETICAL LEVEL VALUE HISTOGRAMM%**************************************************************************N=[];for ii=1:length(lv)E=((2*max(f)/sqrt(3))*TH)*exp(((-lv(ii)^2)/4*amp*max(f))*sqrt(TH));N=[N E];end;hold on;plot(lv, N);%**************************************************************************% trokshnja jauda%**************************************************************************S=0;lve=lv3.^2;Preg=1/TH*sum(lve)for xx=1:length(t3)-1dt=(t3(xx+1)-t3(xx))/2;s=lve(xx)*dt+lve(xx+1)*dt;
S=S+abs(s);end;1/TH*S%**************************************************************************% delta t histogrammas apreekjins%**************************************************************************dtt=[];for xx=1:length(t3)-1a1=t3(xx+1)-t3(xx);dtt=[dtt a1];end;figure;[x,y]=hist(dtt, linspace(min(dtt), max(dtt), 100));stem(y,x, 'k', '.');title('delta t hist');xlabel('time, s');ylabel('pts');%**************************************************************************% QUANTIZATION ERROR%**************************************************************************figure;stem(t3, lvdu, '.', 'k');set(gca, 'xlim', [0 TH]);title('Quantization error');xlabel('time, s');ylabel('quantization level');figure;x2=histc(lvdu, linspace(min(lvdu), max(lvdu), 100));stem(x2, 'k', '.');title('Quantization error hist');xlabel('quantization level');ylabel('pts');set(gca, 'xtick', [0 length(x2)/2 length(x2)]);set(gca, 'xTickLabelMode', 'manual');set(gca, 'xticklabel', ['-T/2'; ' 0 '; ' T/2']);
%**************************************************************************% Limenju-shkjersojoshais ACP modelis%**************************************************************************U=[];hi=0;lo=0;%for xx=1:THt=linspace(0,TH-1,fsk);U=eval(signal);%usig=sum(amp.*sin(2*pi*f*t(xx)+ph)); % katram mazajam gabalinjam tiekapreekjinaatas signaala vertiibas%U=[U usig];%end;Ulidz=1/TH*sum(U);if himin(U)lo=min(U);end;R=max(abs(U));deltaR=(R*2)/(2^qbit-1);lv=[];lvx=(-R)-deltaR/2;lv=lvx;for xx=0:2^qbit-1lvx=lvx+deltaR;lv=[lv lvx];end;%lv=[lv(1)-deltaR lv lv(length(lv))+deltaR];%lv=lv+deltaR/2% lv=linspace(lo, hi, 2.^qbit);% %lv=[-1 -0.75 -0.25 0.25 0.75 1];% % tiek panjemtas ari galejas vertibas.% qlev=(max(lv)-min(lv))/(length(lv)-1);% lv=[lv(1)-qlev lv lv(length(lv))+qlev];% lv=lv+qlev/2;%**************************************************************************% ACP modelis%**************************************************************************lv3=[];t3=[];lvdu=[];for xx=0:TH-1; % Signaals tiek sadaliits 128 mazos gabalinjost=linspace(xx, xx+1, dt);%f=b*t+a;%**********************************************************************% Generee signaalu%**********************************************************************U=eval(signal);%U=amp*sin(2*pi*f.*t+ph); % katram mazajam gabalinjam tiek apreekjinaatassignaala vertiibashold on;plot(t, U);%**********************************************************************for jj=1:dt;for ii=1:length(lv)-1;
if ((U(jj)>=lv(ii)) && (U(jj)=lv2) && (U(jj)lovt3=[t3 t(jj-1)];lv3=[lv3 lv2];lvdu=[lvdu lv2-U(jj)];lv2=lv(ii);lv21=lv(ii+1);break;elset3=[t3 t(jj)];lv3=[lv3 lv2];lvdu=[lvdu lv2-U(jj)];lv2=lv(ii);lv21=lv(ii+1);break;end;end;else % krusto augsheejo liiniju. Signaala virziens augoshif U(jj)lovt3=[t3 t(jj-1)];lv3=[lv3 lv21];lvdu=[lvdu lv21-U(jj)];lv2=lv(ii);lv21=lv(ii+1);break;elset3=[t3 t(jj)];lv3=[lv3 lv21];lvdu=[lvdu lv21-U(jj)];lv2=lv(ii);
lv21=lv(ii+1);break;end;end;end;end;U2=U(jj);lv2=lv(ii);lv21=lv(ii+1);end;end;end;end;hold on;plot (t3, lv3, '.-r');set(gca, 'xlim', [0 TH]);title('Signal');xlabel('time, s');ylabel('amplitude, V');
7. PIELIKUMS. B
DATORPROGRAMMA SIGNĀLALĪMEŅU-ŠĶĒRSOJUMA NOLAŠUIEGŪŠANAI MATLAB VIDĒf<strong>un</strong>ction[uu,tt]=lvcrossing(TH,dt,Sigt,N,R)%TH - uzdotā signāla beigu laiksu(1)=-R/2; u(2^N)=R/2;%dt - signāla nolašu sekošanas solisfor k=2:2^N-1%Sigt – uzdotā signāla izteiksmeu(k)=u(k-1)+R/(2^N-1);tt=[tt, t(k)];uu=[uu, u(p)];end;if p>1&&S(k+1)~=u(p);p=p-1;end;end;end;s1=S(length(S)-1);end;%F<strong>un</strong>kcijas izsaukuma piemērs FMsignāla diskretizācijai:%N – bitu skaits līmeņu kodēšanai [Sn,tn]=lvcrossing(256,1eend;4,'cos(2*pi*(0.05+0.2/256*t).*t)',2,%R – AACP dinamiskais diapazons2);plot(tn,Sn,'.')%uu – līmeņu-šķērsojuma nolasestt=[]; uu=[]; t=0;%tt – nolašu laika momentis1=eval(Sigt);for k=1:length(u)-1if s1==u(k)p=k; uu=[uu, s1]; tt=[tt,t]; break;elseif s1=u(b)tt=[tt, t(k)]; uu=[uu,u(b)];p=b;elseifS(k+1)>S(k)&&S(k+2)
DATORPROGRAMMAS SIGNĀLAATJAUNOŠANAI AR SPLAINUMETODI MATLAB VIDĒf<strong>un</strong>ction Satj=SplRec(Sn,tn,t)%Sn - signāla nolases%tn – nolašu laika momenti%Satj – atja<strong>un</strong>otais signāls kā laikat f<strong>un</strong>kcija%F<strong>un</strong>kcijas izsaukuma piemērsamplitūdā vienmērīgi diskretizēta FMsignāla %atja<strong>un</strong>ošanai:[Sn,tn]=lvcrossing(256,1e-5,'cos(2*pi*(0.05+0.2/256*t).*t)',2,2);t=0:0.1:256;Satj=SplRec(Sn,tn,t);plot(t,Satj)Satj=zeros(size(t));for k=1:length(tn)Satj=Satj+Sn(k)*CardSpl(ttn(k),[-10:1:10]);end;%F<strong>un</strong>kcija CardSpl paredzēta kubiskāpamat-splaina aprēķinamf<strong>un</strong>ction n=CardSpl(t,p)%t - laika vērtību vektors%p - pakāpju vektors%n - pamat-splaina vērtībasp1=p(length(p));tt=t(t>=-p1-2&t
DATORPROGRAMMAS SIGNĀLAITERATĪVAI ATJAUNOŠANAIMATLAB VIDĒf<strong>un</strong>ction[t,Siz_i]=ItRec(tn,Sn,it_skaits,metode)%Sn – signāla nolases%tn – nolasēm atbilstošie laikamomenti%it_skaits – uzdotais iterācijuskaits%metode - uzdotā metode%Siz_i – atja<strong>un</strong>otais signāls kālaika t f<strong>un</strong>kcijadt=0.1; TH=256; fmin=0; fmax=0.5;t=0:dt:TH;Siz=zeros(size(t));Siz_i=zeros(it_skaits,length(t));for k=1:it_skaits;if strcmp(metode,'Vor')==1;Sa=Vor_apr(Sn,tn,TH,dt);tt=t;elseif strcmp(metode,'Lin')==1;Sa=Lin_apr(Sn,tn,TH,dt);tt=t;elseif strcmp(metode,'Marv')==1;Sa=Marv_apr(Sn,0.3);dt=1;tt=tn;elseifstrcmp(metode,'Adkoef')==1;Sa=Ad_koef_apr(Sn,tn,0.5);dt=1;tt=tn;end;[f,FT]=furjtrans(Sa,tt,dt,fmin,fmax);S0t=invfurjtrans(FT,f,t);S0n=invfurjtrans(FT,f,tn);Siz=Siz+real(S0t);Siz_i(k,:)=Siz;Sn=Sn-real(S0n);end;%F<strong>un</strong>kcija Vor_apr paredzēta signālaaproksimācijai ar taisnstūraf<strong>un</strong>kcijām.f<strong>un</strong>ction u=Vor_apr(U,T,TH,dt)%U – signāla nolases%T – nolašu laika momenti%TH – signāla beigu laiks%dt – aproksimācijas signāla laikadiskretizācijas solis%u – aproksimācijas signālstvid=zeros(length(T)-1);for k=1:length(T)-1;tvid(k)=(T(k)+T(k+1))/2;end;t=0:dt:TH;u=zeros(size(t));a=1;s=1;for k=1:length(tvid);for n=a:length(t);if t(n)tvid(length(tvid));u(n)=U(length(U));elseif t(n)>tvid(k)break;end;end;a=s;end;%F<strong>un</strong>kcija Lin_apr paredzēta signālaaproksimācijai ar lineārāmf<strong>un</strong>kcijām.f<strong>un</strong>ction u=Lin_apr(U,T,TH,dt)%U – signāla nolases%T – nolašu laika momenti%TH – signāla beigu laiks%dt – aproksimācijas signāla laikadiskretizācijas solis%u – aproksimācijas signālst=0:dt:TH;u=zeros(size(t));b=length(T);for k=1:b-1;tga(k)=(U(k+1)-U(k))/(T(k+1)-T(k));end;if t(length(t))-T(b)>0tga=[tga, U(b)/2/(t(length(t))-T(b))];end;a=1;s=1;for k=1:length(T)-1;for n=a:length(t);if t(n)T(k+1)break;
elseif t(n)>T(b);u(n)=U(b)+(t(n)-T(b))*tga(b);end;end;a=s;end;%F<strong>un</strong>kcija Marv_apr paredzēta signālaaproksimācijai ar vienības nolasēm.f<strong>un</strong>ction u=Marv_apr(U,lamda)%U – signāla nolases%lamda – globālais relaksācijaskoeficientsu% - aproksimācijas signālsu=lamda*U;%F<strong>un</strong>kcija Ad_koef_apr paredzētasignāla aproksimācijai ar vienībasnolasēm.f<strong>un</strong>ction u=Ad_koef_apr(U,T,gamma)%U – signāla nolases%T – nolašu laika momenti%gamma – koeficientsu% - aproksimācijas signālsFT=zeros(size(f));for k=1:length(f);for n=1:length(Sn)FT(k)=FT(k)+Sn(n)*exp(-j*2*pi*f(k)*tn(n));end;end;FT=2*dt*FT;%F<strong>un</strong>kcija invfurjtrans paredzētasignāla aprēķinam no tā spektra, kasiegūts %ar f<strong>un</strong>kciju furjtrans.f<strong>un</strong>ction s=invfurjtrans(FT,f,t)%FT – spektra kompleksās vērtībasatkarībā no frekvences f%s – aprēķinātais signāls atkarībāno laika ts=zeros(size(t));for k=1:length(t);for n=1:length(f)s(k)=s(k)+FT(n)*exp(j*2*pi*f(n)*t(k));end;end;s=1/300*s;dt=zeros(size(T));dt(1)=T(2)-T(1);for k=2:length(T)-1;dt(k)=(T(k+1)-T(k-1))/2;end;dt(length(T))=T(length(T))-T(k);u=gamma*U.*dt;%F<strong>un</strong>kcija furjtrans paredzētasignāla vienpusīgā spektra iegūšanaif<strong>un</strong>ction[f,FT]=furjtrans(Sn,tn,dt,fmin,fmax)%Sn – signāla nolases%tn – nolašu laika momenti%dt – diskretizācijas solisvienmērīgas diskretizācijasgadījumam, ja nolases %irnevienmērīgi izvietotas, tad dt=1%fmin – aprēķināmā spektra minimālāfrekvence%fmax – spektra maksimālā frekvence%FT – spektra kompleksās vērtībasatkarībā no frekvences f%FM Signāla atja<strong>un</strong>ošanas piemērs notā līmeņu-šķērsojuma nolasēm arvisām %četrām metodēm:[Sn,tn]=lvcrossing(256,1e-5,'cos(2*pi*(0.05+0.2/256*t).*t)',2,2);[t,SatjV]=ItRec(tn,Sn,5,'Vor');[t,SatjL]=ItRec(tn,Sn,5,'Lin');[t,SatjM]=ItRec(tn,Sn,5,'Marv');[t,SatjA]=ItRec(tn,Sn,5,'Adkoef');plot(t,SatjV(1,:));plot(t,SatjV(5,:));plot(t,SatjL(5,:));plot(t,SatjM(5,:));plot(t,SatjA(5,:));f=fmin:1/300:fmax;
DATORPROGRAMMAS SIGNĀLAATJAUNOŠANAI AR UZLABOTOSINC FUNKCIJU METODIMATLAB VIDĒ%F<strong>un</strong>kcija ImpSsincRec paredzētasignāla atja<strong>un</strong>ošanai ar simetriskusinc %f<strong>un</strong>kciju metodi.f<strong>un</strong>ction Satj=ImpSsincRec(Sn,tn,t,M)%Sn – signāla nolases%tn – nolasēm atbilstošie laikamomenti%M – nolašu skaits lokālā nolašublīvuma aprēķinā%Satj– atja<strong>un</strong>otais signāls kā laikat f<strong>un</strong>kcijaomega=zeros(1,length(tn));Avdt=Averdt1(tn,2*M);for k=1:length(tn);omega(k)=pi/Avdt(k);end;OMEGA=zeros(length(tn),length(tn));for k=1:length(tn)for n=1:length(tn)OMEGA(n,k)=sinc(omega(k)*(tn(n)-tn(k)));end;end;C=OMEGA\Sn';Satj=zeros(size(t));for k=1:length(C)Satj=Satj+C(k)*sinc(omega(k)*(ttn(k)));end;%F<strong>un</strong>kcija Averdt1 paredzēta lokālānolašu blīvuma aprēķinam.f<strong>un</strong>ction Avdt=Averdt1(tn,numb)%tn – nolašu laika momenti%numb – nolašu skaits 2*M%Avdt– sinc f<strong>un</strong>kciju galvenās vālespus platumiAvdt=zeros(size(tn));for k=1:numbAvdt(k)=(tn(k+numb)-tn(1))/(numb+k-1);end;d=2*numb-1;for k=length(tn)-numb+1:length(tn)Avdt(k)=(tn(length(tn))-tn(knumb))/d;d=d-1;end;for k=numb+1:length(tn)-numbAvdt(k)=(tn(k+numb)-tn(knumb))/(2*numb);end;%F<strong>un</strong>kcija ImpAsincRec paredzētasignāla atja<strong>un</strong>ošanai ar nesimetriskusinc %f<strong>un</strong>kciju metodi.f<strong>un</strong>ction Satj=ImpAsincRec(Sn,tn,t,M)%Sn – signāla nolases%tn – nolasēm atbilstošie laikamomenti%M – nolašu skaits lokālā nolašublīvuma aprēķinā%Satj– atja<strong>un</strong>otais signāls kā laikat f<strong>un</strong>kcijafor k=1:length(tn)[dtl, dtr]=Averdt2(tn(k),tn,M);for n=1:length(tn)if tn(n)
%numb – nolašu skaits lokālā nolašublīvuma aprēķinā%dtl, dtr– kreisās <strong>un</strong> labās pusessinc f<strong>un</strong>kciju galvenās vāles pusplatumifor k=1:length(tn)if tn(k)==tkind=k;break;end;end;if ind>numbdtl=(tk-tn(ind-numb))/numb;elseif ind==1dtl=tn(2)-tn(1);elsedtl=(tk-tn(1))/(ind-1);end;end;if ind
7. PIELIKUMS. C
% Nolases seciibas aproksimaacija ar taisnstuuriem% lai peec tam ieguuto aproksimeeto f<strong>un</strong>kciju apstraadaatu ar Wignera% sadaliijuma integraaliclear allclose all%***delta=0.01; % aproksimaacijas f<strong>un</strong>kcijas konstatais solistime=20; % laika beigu momentsi=0; % matricu koeficients aproksimaacijas laika <strong>un</strong> veertiibu vektoriemj=1; % matricu koeficients diskretai seciibai laika <strong>un</strong> veertiibu vektoriemtt=0:delta:time; % laika vektorsy=cos(2*pi*(0.05+0.2/256*tt).*tt); % saakuma f<strong>un</strong>kcija%Liimenju shkersojuma diskretizaacija tiek viekta ar R.Shaavelja izveidotu%f<strong>un</strong>kciju lvcrossing. tn ir nolases laika moments, sn ir nolases%amplituudas veertiiba. Diskretizaacijas precizitaate 10.e-4; ACP bitu%skaits ir 4 <strong>un</strong> ACP amplituudu diapazons R=Umax-Umin ir 4[sn,tn]=lvcrossing(20,1e-4,'cos(2*pi*(0.05+0.2/256*t).*t)',2,2);% grafiskais atteelojumsplot(tt,y),hold onstem(tn,sn,'r')xlabel('laiks,t')ylabel('x(t),sn[tn]')xx=[]; % aproksimaacijas f<strong>un</strong>kcijas matricatn(:,length(tn)+1)=time+1; % laika momenta length(tn)+1 veertiibasn(:,length(sn)+1)=1+1; % nolases length(sn)+1 veertiiba% ciklaa ir aprakstiits aproksimaacijas processfor i=1:time/delta+1if tn(:,j+1)
% Nolases seciibas aproksimaacija ar taisnstuuriem, kad nolases vertiiba ir% apmeeram pa vidu starp divam blakus esosham nolaseemclear allclose all%***delta=0.01; % aproksimaacijas f<strong>un</strong>kcijas konstatais solistime=20; % laika beigu momentsi=0; % matricu koeficients aproksimaacijas laika <strong>un</strong> veertiibu vektoriemj=1; % matricu koeficients diskretai seciibai laika <strong>un</strong> veertiibu vektoriemtt=0:delta:time; % laika vektorsy=cos(2*pi*(0.05+0.2/256*tt).*tt); % saakuma f<strong>un</strong>kcija%Liimenju shkersojuma diskretizaacija tiek viekta ar R.Shaavelja izveidotu%f<strong>un</strong>kciju lvcrossing. tn ir nolases laika moments, sn ir nolases%amplituudas veertiiba. Diskretizaacijas precizitaate 10.e-4; ACP bitu%skaits ir 4 <strong>un</strong> ACP amplituudu diapazons R=Umax-Umin ir 4[sn,tn]=lvcrossing(20,1e-4,'cos(2*pi*(0.05+0.2/256*t).*t)',2,2);% grafiskais atteelojumsplot(tt,y),hold onstem(tn,sn,'r')xlabel('laiks,t')ylabel('x(t),sn[tn]')xx=[]; % aproksimaacijas f<strong>un</strong>kcijas matricatn(:,length(tn)+1)=time+1; % laika momenta length(tn)+1 veertiibasn(:,length(sn)+1)=1+1; % nolases length(sn)+1 veertiiba% ciklaa ir aprakstiits aproksimaacijas processfor i=1:time/delta+1if (tn(:,j+1)+tn(:,j))/2
% Nolases seciibas aproksimaacija ar liinijam, kurie savieno katru nolasi% ar naakosho.clear allclose all%***delta=0.01; % aproksimaacijas f<strong>un</strong>kcijas konstatais solistime=20; % laika beigu momentsi=0; % matricu koeficients aproksimaacijas laika <strong>un</strong> veertiibu vektoriemj=1; % matricu koeficients diskretai seciibai laika <strong>un</strong> veertiibu vektoriemtt=0:delta:time; % laika vektorsy=cos(2*pi*(0.05+0.2/256*tt).*tt); % saakuma f<strong>un</strong>kcija%Liimenju shkersojuma diskretizaacija tiek viekta ar R.Shaavelja izveidotu%f<strong>un</strong>kciju lvcrossing. tn ir nolases laika moments, sn ir nolases%amplituudas veertiiba. Diskretizaacijas precizitaate 10.e-4; ACP bitu%skaits ir 4 <strong>un</strong> ACP amplituudu diapazons R=Umax-Umin ir 4[sn,tn]=lvcrossing(20,1e-4,'cos(2*pi*(0.05+0.2/256*t).*t)',2,2);% grafiskais atteelojumsplot(tt,y),hold onstem(tn,sn,'r')xlabel('laiks,t')ylabel('x(t),sn[tn]')xx=[]; % aproksimaacijas f<strong>un</strong>kcijas matricatn(:,length(tn)+1)=time+1; % laika momenta length(tn)+1 veertiibasn(:,length(sn)+1)=1+1; % nolases length(sn)+1 veertiibafor i=1:time/delta+1if tn(:,j+1)
%Ar liimenja-skeersojuma primcipu diskretizeeta signaala vilnishanaliize%(Waveler analiize)close allclear all%Izveidojam laika momentu vektoruN=256; %nolasu skaits%signaals ir defineets laika intervalaat=0:.01:256;%Piemeera signaals ir FM kosinusoida.%Signala veertiibu aprekinsx=cos(2*pi*(0.05+0.2/256*t).*t);%Liimenju shkersojuma diskretizaacija tiek viekta ar R.Shaavelja izveidotu%f<strong>un</strong>kciju lvcrossing. tn ir nolases laika moments, sn ir nolases%amplituudas veertiiba. Diskretizaacijas precizitaate 10.e-4; ACP bitu%skaits ir 4 <strong>un</strong> ACP amplituudu diapazons R=Umax-Umin ir 4[sn,tn]=lvcrossing(256,1e-4,'cos(2*pi*(0.05+0.2/256*t).*t)',4,4);%signaala, kaa laika f<strong>un</strong>kcijas grafiska reprezentaacijaplot(t,x,tn,sn,'.')xlabel('laiks')ylabel('s(t)')%***%Wavelet'a formeeshana%***wave=sqrt(N)/4;fmin=1/N;fmax=0.5;f = logspace(log10(fmin),log10(fmax),N/2); % logaritmiskaa merogoshanafrekvenceemf=[fliplr(-f) f];a = logspace(log10(fmax/fmin),log10(1),N/2); % logaritmiskaa merogoshanaWavelet'a a paremetrama=[fliplr(a) a];ta=0:1:N-1; %analizes laika momenti% cikls:for r=1:length(f);%mainam wavelet'a platum<strong>un</strong>ha = wave*a(r); % => wave*[a(r(1)), a(r(2)), ..., a(r(length(f)))]for tnob = 1:length(ta) %biidam wavelet'utt=tn-ta(tnob);% tiek pielietots Morlet'a Waveletha1(tnob,:) = sqrt(nha).*exp(-(2*log(10)/nha^2)*(tt.^2)).*exp(j*2*pi*f(r)*tt);endplot(real(ha1(50,:)));reizinajumuendha2(r,:) =sn*ha1'./sqrt(a(r));ha3=(ha2).*conj(ha2);tfr=ha3;%Veidojam krasu gammu 3D bildemL=16; %limenu tonu skaitsac=[1-1/L 1-1/L 1-1/L];for ii=3*L/4:-1:1/L,ac=[ac; [ii./L ii./L ii./L]];end% zimeejam rezultaatufiguremesh(ta, f, tfr);%integrejam signaala <strong>un</strong> waveleta
colormap(ac);set (gca, 'xlim', [0 length(ta)], 'fontsize', 14)set (gca, 'ylim', [-0.5 0.5], 'fontsize', 14)set (gca, 'zlim', [0 max(max(abs(tfr)))], 'fontsize', 14)xlabel('Laiks', 'fontsize', 16)ylabel('Frekvence', 'fontsize', 16)view(0, 90);N=length(f);%set(gca, 'ytick', [0 .2*N 0.4*N 0.5*N 0.6*N .8*N N]);%set(gca, 'yticklabel', [-0.5 -0.3 -0.1 0 0.1 0.3 0.5]);set(gca, 'xgrid', 'off', 'ygrid', 'off', 'zgrid', 'off');set(gca, 'ztick', [], 'zcolor', [1 1 1]);set(gcf, 'color', [1 1 1]);
% MATLAB programma Iisintervala Furje transformaacijas aprekinashanai,% gadiijumaa, kad signaals ir diskretizeets ar liimenja-shkersojuma% principuclose allclear all%signaals ir defineets laika intervalaat=0:.01:256;%Piemeera signaals ir FM kosinusoida.%Signala veertiibu aprekinsx=cos(2*pi*(0.05+0.2/256*t).*t);%Liimenju shkersojuma diskretizaacija tiek viekta ar R.Shaavelja izveidotu%f<strong>un</strong>kciju lvcrossing. tn ir nolases laika moments, sn ir nolases%amplituudas veertiiba. Diskretizaacijas precizitaate 10.e-4; ACP bitu%skaits ir 4 <strong>un</strong> ACP amplituudu diapazons R=Umax-Umin ir 4[sn,tn]=lvcrossing(256,1e-4,'cos(2*pi*(0.05+0.2/256*t).*t)',4,4);%signaala, kaa laika f<strong>un</strong>kcijas grafiska reprezentaacijaplot(t,x,tn,sn,'.')xlabel('laiks')ylabel('s(t)')%***%Laika <strong>un</strong> frekvences analizes rezgis%***N=256;ta=0:N-1;%analizes laika momentifa=[-.5+1/N:1/N:0.5]; %analizes frekvencesN=length(fa);%***%DFT analize bez laika ass (spektrs)%***figuredftp=(1/length(sn)).*abs(sn*exp(i*2*pi*tn'*fa));plot(fa, dftp,'k');set (gca, 'xlim', [-0.5 0.5], 'fontsize', 14)set (gca, 'ylim', [0 max(dftp)], 'fontsize', 14)xlabel('frekvence', 'fontsize', 16)ylabel('spektrs', 'fontsize', 16)NN=length(fa);set(gca, 'xtick', [-0.5 -0.3 -0.1 0 0.1 0.3 0.5]);set(gca, 'ytick', []);set(gca, 'xgrid', 'off', 'ygrid', 'off');set(gcf, 'color', [1 1 1]);%***%Laika analiizes loga f<strong>un</strong>kcijas aprekins.%lietojam n_window(N,'rect'|'hamming'(default)|'hanning',t) f<strong>un</strong>kciju%***T=32; %loga garums%Izveidojam signals.*logs matricutfr=zeros(length(tn),length(ta));%ciklaa ir aprakstiita loga bidishana pa visu signaala laika garumufor icol=1:length(ta),tau=ta(icol);ha=n_window(T,'hamming',tn+T/2-tau); % tn+L/2-tau ir laika momenti logamtfr(:,icol)=sn'.*conj(ha'); % reizinaajums signaals <strong>un</strong> kompleksa saistitaHamminga loga f-jaend;%***%Veidojam krasu gammu 3D bildem%***L=16;%limenu tonu skaits
ac=[1-1/L 1-1/L 1-1/L];for ii=3*L/4:-1:1/L,ac=[ac; [ii./L ii./L ii./L]];end%***%Lai ieguutu precizaako rezultaatu, mees pielietosim DFT ne-ortogonalastransformaciju%***non_exp=exp(-i*2*pi*tn'*fa);non_tmp=non_exp*inv(non_exp'*non_exp+.2*eye(size(non_exp'*non_exp))); %notiekinversija ar satbilizacij<strong>un</strong>on_tfr=tfr'*non_tmp/length(tn);figuremesh(abs(non_tfr'));colormap(ac);set (gca, 'xlim', [0 length(ta)], 'fontsize', 14)set (gca, 'ylim', [0 length(fa)], 'fontsize', 14)set (gca, 'zlim', [0 max(max(abs(non_tfr)))], 'fontsize', 14)xlabel('Laiks', 'fontsize', 16)ylabel('Frekvence', 'fontsize', 16)view(0, 90);NN=length(fa);set(gca, 'ytick', [0 .2*NN 0.4*NN 0.5*NN 0.6*NN .8*NN NN]);set(gca, 'yticklabel', [-0.5 -0.3 -0.1 0 0.1 0.3 0.5]);set(gca, 'xgrid', 'off', 'ygrid', 'off', 'zgrid', 'off');set(gca, 'ztick', [], 'zcolor', [1 1 1]);set(gcf, 'color', [1 1 1]);
7. PIELIKUMS. D.
%Programma DFT-veidigu parveidojumu modelesanai%no analiitiski noteiktam level-crossing sampling sinusoidalamstacionaram signalam%%VPP "IT zinātniska baze" 3.projekts%Autors M.Greitans%2006.gada 26.j<strong>un</strong>ijs%%Signals aprakstams formaa x(t)=amp*cos(2*pi*fr*t+ph)clear allclose all%%Tiek analizets signala intervaals [0...TH[ (sek<strong>un</strong>des)TH=128;amp=1; %amplituda =constfr=12.22/128; %frekvence normalizeeta attiecibaa pret Fsamp=1%fr=0.09;rand('seed', 931316785);ph=rand*2*pi;%ph=2*pi*ll/1000;%saakuma faaze%%Qlev[] satur kvanteshanas limenus%Qlev=[-1 -1./3 1./3 1];%%alternatiiva aprekinaam limenus vienmerigi sadalot diapozonuqbit=3; %bitu skaits liimenu kodeshanaiQlev=linspace(-amp+(amp./2.^qbit),amp-(amp./2.^qbit),2.^qbit-1);K=ceil(TH*fr)+1; %max signala periodu skaits laika intervaalaa THtlev=[];xlev=[];%tlev ieguto laika momentu vektors%xlev ieguto limenu vertibu vektorsfor k=0:K,tlev=[tlev (k*2*pi-acos(Qlev./amp)-ph)./(2*pi*fr)];xlev=[xlev Qlev];tlev=[tlev (k*2*pi+acos(Qlev./amp)-ph)./(2*pi*fr)];xlev=[xlev Qlev];end%%atstajam tikai taas nolases kas ietilpst [0..TH]tlc=tlev(tlev>=0&tlev=0&tlev
tt=linspace(0,TH,1000);xx=amp*cos(2*pi*fr*tt+ph);hold onplot(tt,xx,'r')dtlc=0.5*([tlc(2:length(tlc)) TH]-[0 tlc(1:length(tlc)-1)]);%%ieguustam General DFT no signaalafra=-0.5+1/TH:1/TH:0.5; %analiizes frekvencu vektorsn_exp=exp(-i*2*pi*tlc'*fra);ndft=1./diag(n_exp'*n_exp)'.*(xlc*n_exp);figure(2)stem(fra(64:128),10*log10(abs(ndft(64:128))), 'color', 'k','marker','no', 'ShowBaseLine', 'off', 'BaseValue', -30);%floor(min(10*log10(abs(ndft)))));xlabel('Frequency [Hz]')ylabel('|GDFT| [dB]')set(gca, 'ylim', [-30 0]);hold on%%Modifikaacija ar svertaam nolaseemndft_m=1./diag(n_exp'*n_exp)'.*((xlc.*dtlc)*n_exp);stem(fra,10*log10(abs(ndft_m)), 'color', 'r','marker', '+','ShowBaseLine', 'off', 'BaseValue', min(10*log10(abs(ndft))));%Modifikacija ar 0-kartas signala interpolacij<strong>un</strong>idft=i./(2.*pi.*fra).*(xlc*(n_exp.*(1.-exp(i.*2.*pi.*dtlc'*fra))));figure(3)stem(fra(64:128),10*log10(abs(nidft(64:128))), 'marker', 'no','ShowBaseLine', 'off', 'BaseValue', min(10*log10(abs(nidft))));hold onfigure%Modifikacija ar 1-kartas signala interpolacijutlcm=tlc-tlc(1);dtlcm=[tlcm(2:length(tlcm)) TH]-tlcm;alc=([xlc(2:length(xlc)) xlc(1)]-xlc)./dtlcm;n_expm=exp(-i*2*pi*tlcm'*fra);dn_expm=exp(i*2*pi*dtlcm'*fra);nidft_m=i./(2.*pi.*fra).*(xlc*(n_expm.*(1.-dn_expm)))+1./(2.*pi.*fra).^2.*(alc*(n_expm.*(1.-dn_expm)))+i./(2.*pi.*fra).*((xlc.*dtlcm)*(n_expm.*dn_expm));stem(fra(64:128),10*log10(abs(1/length(tlc)*nidft_m(64:128))),'color', 'k','marker', 'no', 'ShowBaseLine', 'off', 'BaseValue', -30);xlabel('Frequency [Hz]')ylabel('|X| [dB]')set(gca, 'ylim', [-30 0]);figure%Modifikacija ar SINC interpolaciju signalamt_si=.5:1:TH;n_sinc=sinc(ones(size(t_si))'*tlc-t_si'*ones(size(tlc)));nsincft=1./TH.*(xlc/n_sinc)*exp(-i*2*pi*t_si'*fra);figure(4)stem(fra(64:128),10*log10(abs(nsincft(64:128))), 'color','k','marker', 'no', 'ShowBaseLine', 'off', 'BaseValue', -30);%min(10*log10(abs(nsincft))));xlabel('Frequency [Hz]')ylabel('|X| [dB]')
set(gca, 'ylim', [-30 0]);hold on%Modifikacija ar neortogonalu parveidojumufran=-0.5+1/TH:1/TH:0.5;non_exp=exp(-i*2*pi*tlc'*fran);%nondft=xlc*pinv(non_exp');nondft=xlc/non_exp';%Modifikacija ar 0-kartas kludas interpolacijufor kk=1:length(fran),non_exp_dt(:,kk)=dtlc'.*non_exp(:,kk);endnondft_m=(non_exp'*(xlc.*dtlc)')'*inv(non_exp'*non_exp_dt);%Modifikacija ar 1-kartas kludas interpolacijufor kk=1:length(fran),non_exp_dt2(:,kk)=(dtlc.^2)'.*non_exp(:,kk);endnondft_m2=(non_exp'*(xlc.*(dtlc.^2))')'*inv(non_exp'*non_exp_dt2);dtlcml=tlc(2:length(tlc))-tlc(1:length(tlc)-1);nondft_ml=(non_exp(1:length(xlc)-1,:)'*(xlc(1:length(xlc)-1).*dtlcml)'+non_exp(2:length(xlc),:)'*(xlc(2:length(xlc)).*dtlcml)')'*inv(non_exp(1:length(xlc)-1,:)'*non_exp_dt(1:length(xlc)-1,:)+non_exp(2:length(xlc),:)'*non_exp_dt(2:length(xlc),:));%plot(fran,10*log10(abs(nondft)));%stem(fra,10*log10(abs(nondft)), 'color', 'b', 'marker', 's','ShowBaseLine', 'off', 'BaseValue', min(10*log10(abs(nondft))));figurestem(fra(64:128),10*log10(abs(nondft_m(64:128))), 'color', 'k','marker', 'no', 'ShowBaseLine', 'off', 'BaseValue', -30);%min(10*log10(abs(nondft))));%stem(fra,10*log10(abs(nondft_m2)), 'color', 'c', 'marker', 'x','ShowBaseLine', 'off', 'BaseValue', min(10*log10(abs(nondft))));%stem(fra,10*log10(abs(nondft_ml)), 'color', 'r', 'marker', '*','ShowBaseLine', 'off', 'BaseValue', min(10*log10(abs(nondft))));xlabel('Frequency [Hz]')ylabel('|NO-DFT| [dB]')%Salīdzinajums ar signalatkariigu DFT-veidigu analiizifrasd=-0.5+1/TH/4:1/TH/4:0.5;adft=nft_m(xlc, tlc, frasd);figure(5)stem(frasd(64*4:128*4),10*log10(abs(adft(64*4:128*4))), 'color', 'k','marker', 'no', 'ShowBaseLine', 'off', 'BaseValue', -100);%min(10*log10(abs(nondft))));xlabel('Frequency [Hz]')ylabel('|SD-DFT| [dB]')%Signala rekonstrukcijas kludu aprekinitt=linspace(4,TH-4,5000);xx=amp*cos(2*pi*fr*tt+ph);figure(6)plot(tt, xx, 'r')hold onx_ndft=real(ndft*exp(i*2*pi*(tt'*fra)'));plot(tt, x_ndft)x_ndft_m=real(ndft_m*exp(i*2*pi*(tt'*fra)'));plot(tt, x_ndft_m,'k')x_nondft=real(nondft*exp(i*2*pi*(tt'*fran)'));
plot(tt, x_nondft, 'm')x_nondftm=real(nondft_m*exp(i*2*pi*(tt'*fran)'));plot(tt, x_nondftm, 'g')x_nondftm2=real(nondft_m2*exp(i*2*pi*(tt'*fran)'));plot(tt, x_nondftm2, 'c')x_nondftml=real(nondft_ml*exp(i*2*pi*(tt'*fran)'));plot(tt, x_nondftml, 'y')x_nsincft=real(nsincft*exp(i*2*pi*(tt'*fra)'));plot(tt, x_nsincft, 'r')x_sdft=real(adft'*exp(-i*2*pi*(tt'*frasd)'));plot(tt, x_sdft)e_ndft=sum((x_ndft-xx).^2)e1_ndftm=sum((x_ndft_m-xx).^2)e_nondft=sum((x_nondft-xx).^2)e3_nondftm=sum((x_nondftm-xx).^2)e4_nondftm2=sum((x_nondftm2-xx).^2)e5_nondftl=sum((x_nondftml-xx).^2)e_sinc=sum((x_nsincft-xx).^2)e_sd=sum((x_sdft-xx).^2)%atja<strong>un</strong>osanas kludas zimesanatt=linspace(0,TH,1000);xx=amp*cos(2*pi*fr*tt+ph);x_ndft=real(ndft*exp(i*2*pi*(tt'*fra)'));x_nondftm2=real(nondft_m2*exp(i*2*pi*(tt'*fra)'));figure(7)plot(tt, (xx-x_ndft), 'k')hold onstem(tlc, (xlc-real(ndft*exp(i*2*pi*(tlc'*fra)'))), 'color', 'k','marker', '.');%set(gca,'ylim',[0 1]);set(gca, 'xlim', [0 5]);xlabel('Time [s]')ylabel('Reconstruction error \epsilon(t)')plot(tt, xx-x_nondftm2, 'm')stem(tlc, xlc-real(nondft_m2*exp(i*2*pi*(tlc'*fra)')), 'marker', '*','color', 'm');
7. PIELIKUMS. E
%Apreekina faazi GSM signaalam (signals moduleets ar GMSK) peec%uztvershanas <strong>un</strong> diskretizaacijas ar level crossing metodi. Ieejaslielumi%ir laika <strong>un</strong> amplitudas vektori.%*************************************************************************%clear all;close all;r<strong>un</strong> level_crossing;clear all;load prz1;load prz2;t=[]; tt3=[]; tt33=[]; lvv3=[];phase=[];t_phase=[];C=[]; A=[]; B=[]; D=[]; guga=[];phr=[];PH=[];X=(1/fr)*9; %Loga garumsSOLIS=(1/fr)*1; %Loga paarvietoshanaas solis%solim jaabuut vienaadam ar vesalu skaitu signaala perioduSOL=0; %Uzkraajamaa sola veertiibasolis=X/4; %Ziimes mainas sola veertiiba%*************************************************************************% Formee laika logu no vektora t3%*************************************************************************for zb=0:SOLIS:t3(end)-X;%X-t3(end)/d-SOLIS;zz=[];for zz=1:length(t3);ver=X+SOL; %Loga saakuma veertibaif (t3(zz)>=ver-X)&&(t3(zz)ver;break;end;end;t_phase=[t_phase,t(ro<strong>un</strong>d(length(t)/2))];%iestada fazes laikavertiibu%*************************************************************************% Formee t3 laika loga veertiibu ziimi%*************************************************************************%Katram laika t3 logam X formee katras nolases ziimi,atkariibaa no%taisnstuurveida f<strong>un</strong>kcijas ziimes.Vienaa logaa ietilps vienstaisnstura%f-cas periods.Otra taisnstura fca ir nobiidiita faazee parpi/2.Kaa%taisnstuura fcu izmanto fcu +1; -1.Attieciigi, ja nolase iekriit%+ apgabalaa, amplituudas veertiibai tiek pieskirta "+" veertiiba,%bet,ja iekriit "-" apgabala - miinuss vertiiba.for gar=1:length(t);bin=[];if (t(gar)(ver-(solis*3)))&&(t(gar)(ver-(solis*2)))&&(t(gar)(ver-solis))&&(t(gar)
guga=[];p=(B/A);A=[];B=[];pp=atan(p);phr=[phr,pp];a=ones(1,length(phr));phase=phr(1).*a; %Signals ar nemainigu faziend;%**************************************************************************% Korigee faazes izmainu%**************************************************************************gmph=phr-phase; %Faazu starpiibaepsi=pi/3; %Pielaujamaa kluudas robezafor ee=1:length(gmph);if ee==1;if (gmph(ee)0+epsi);gm=-pi+gmph(ee);PH=[PH,gm];k=gm;elsegm=gmph(ee);PH=[PH,gm];k=gm;end;continue;end;if ee>1;if k>0;if (gmph(ee)k+epsi);gm=pi-gmph(ee);PH=[PH,gm];k=gm;elsegm=gmph(ee);PH=[PH,gm];k=gm;end;continue;end;if kk+epsi);gm=gmph(ee)-pi;PH=[PH,gm];k=gm;elseif (gmph(ee)k+epsi);gm=gmph(ee)-pi;PH=[PH,gm];k=gm;elseif (gmph(ee)ii+epsi;break;end;if (t_phase(gg)>=ii-epsi)&&(t_phase(gg)
end;end;for mm=1:length(m);if (abs(m(mm)-sy))>(abs(m(mm+1)-sy));continue;elsebit=[bit,m(mm)]; %Bitu laika vertibast_adr=[t_adr,adr(mm)]; %Atilstosaas adresesm=[];adr=[];end;break;end;sy=sy+symb_per;if ii==length(data)-2;break;end;end;pii=[];%Faazes veertiibas simbola mainas p<strong>un</strong>ktosfor mm=1:length(t_adr);for nn=1:length(PH);if t_adr(mm)==nn;pii=[pii,PH(nn)];break;end;end;end;bits=[];%Atkodeetie bitifor mm=1:length(pii);if mm==1;bi=0;bits=[bits,bi];ko=pii(mm);continue;end;if pii(mm)>ko;if bi==0;a=0;bits=[bits,a];bi=a;ko=pii(mm);continue;elsea=1;bits=[bits,a];bi=a;ko=pii(mm);continue;end;end;if pii(mm)