a new correlation for prediction of undersaturated crude oil viscosity
a new correlation for prediction of undersaturated crude oil viscosity
a new correlation for prediction of undersaturated crude oil viscosity

Create successful ePaper yourself
Turn your PDF publications into a flip-book with our unique Google optimized e-Paper software.
Petroleum & CoalISSN 1337-7027Available online at www.vurup.sk/pcPetroleum & Coal 52 (1) 50-55, 2010A NEW CORRELATION FOR PREDICTION OF UNDERSATURATEDCRUDE OIL VISCOSITYR. Abedini 1, *, A. Abedini 2 , N. Eslami Yakhfrouzan 11Department <strong>of</strong> Chemical Engineering, Ferdowsi University <strong>of</strong> Mashhad,Mashhad, Iran, 2 Department <strong>of</strong> Petroleum Engineering,Petroleum University <strong>of</strong>Technology, Ahwaz, IranReceived November 13, 2009, Accepted February 1, 2010AbstractViscosity is one <strong>of</strong> the most important governing parameters <strong>of</strong> the fluid flow, either in the porous media or inpipelines. So it is <strong>of</strong> great importance to use an accurate <strong>correlation</strong> to calculate the <strong>oil</strong> <strong>viscosity</strong> at variousoperating conditions. Whenever laboratory data are obtained, ef<strong>for</strong>ts are made to find a best-fit <strong>correlation</strong>,because demand <strong>for</strong> mathematical equation <strong>of</strong> fluid flow <strong>for</strong> reservoir simulation, pressure traverse calculationand so on compel the person to use empirical and semi-empirical <strong>correlation</strong>s to find <strong>viscosity</strong> at variouspoints <strong>of</strong> the flow path (along which T, P, R s and other parameters may vary). In the literature, severalempirical <strong>correlation</strong>s have been proposed <strong>for</strong> predicting <strong>undersaturated</strong> <strong>oil</strong> <strong>viscosity</strong>. Here, based on Iranian<strong>oil</strong> reservoirs data; <strong>new</strong> <strong>correlation</strong> has been developed <strong>for</strong> <strong>prediction</strong> <strong>of</strong> <strong>undersaturated</strong> <strong>oil</strong> <strong>viscosity</strong>. Validityand accuracy <strong>of</strong> this <strong>correlation</strong> has been confirmed by comparing the obtained results <strong>of</strong> this <strong>correlation</strong> andother ones with experimental data <strong>for</strong> Iranian <strong>oil</strong> samples. Checking the results <strong>of</strong> this <strong>correlation</strong> shows thatthe obtained results <strong>of</strong> Iranian <strong>oil</strong> viscosities in this work are in agreement with experimental data comparedwith other <strong>correlation</strong>s.Keywords: Oil Viscosity, Correlation, Undersaturated, Saturated, Dead, API gravity.1. IntroductionCrude <strong>oil</strong> <strong>viscosity</strong> is an important physical property that controls and influences the flow <strong>of</strong> <strong>oil</strong>through porous media and pipes. The <strong>viscosity</strong>, in general, is defined as the internal resistance <strong>of</strong>the fluid to flow. Oil <strong>viscosity</strong> is a strong function <strong>of</strong> many thermodynamic and physical propertiessuch as pressure, temperature, solution gas-<strong>oil</strong> ratio, bubble point pressure, gas gravity and <strong>oil</strong>gravity. Usually <strong>oil</strong> <strong>viscosity</strong> is determined by laboratory measurements at reservoir temperature.Viscosity is usually reported in standard PVT analyses. Increasing pressure always causes increasein <strong>viscosity</strong> above the bubble point. However below the bubble point, increasing pressure causesan increase in solution gas, which in turn decreases the <strong>oil</strong> <strong>viscosity</strong>. Thus, <strong>oil</strong> <strong>viscosity</strong> <strong>correlation</strong>sall belong to three categories: dead <strong>oil</strong>, saturated <strong>oil</strong> and <strong>undersaturated</strong> <strong>oil</strong> <strong>viscosity</strong> <strong>correlation</strong>.Numerous <strong>correlation</strong>s have been proposed to calculate the <strong>oil</strong> <strong>viscosity</strong>. These <strong>correlation</strong>sare categorized into two types. The first type which refers to black <strong>oil</strong> type <strong>correlation</strong>s predictviscosities from available field-measured variables include reservoir temperature, <strong>oil</strong> API gravity,solution gas- <strong>oil</strong> ratio, saturation pressure and pressure [1-9] . The second type which refers tocompositional models derives mostly from the principle <strong>of</strong> corresponding states and its extensions.In these <strong>correlation</strong>s beside previous properties, other properties such as reservoir fluidcomposition, pour point temperature, molar mass, normal b<strong>oil</strong>ing point, critical temperature andacentric factor <strong>of</strong> components are used [ 9, 10] .2. Undersaturated <strong>oil</strong> <strong>viscosity</strong> <strong>correlation</strong>sUndersaturated <strong>oil</strong> <strong>viscosity</strong> <strong>correlation</strong>s, which usually use saturated <strong>crude</strong> <strong>oil</strong> <strong>viscosity</strong> andpressure above the bubble point to predict <strong>viscosity</strong> <strong>of</strong> <strong>undersaturated</strong> <strong>oil</strong> reservoirs. These<strong>correlation</strong>s are Beal [1] , Vasquez and Beggs [2] , Khan [4 ], and Kartoatmodjo and Schmidt [7] .
R. Abedini et al./Petroleum& Coal 52(1) 46-51, 2010 512.1. Beal <strong>correlation</strong> [1]This <strong>correlation</strong> proposes that <strong>for</strong> any specified <strong>oil</strong>, when only pressure is the variable, <strong>viscosity</strong>varies linearly with the pressure.2.2. Vasquez-Beggs Correlation [2]This <strong>correlation</strong> ignores the effect <strong>of</strong> μ ob on the coefficient which is multiplied by μ ob to predict μ o .m⎛ p ⎞μo= μob⎜ ⎟⎝pb⎠Where:−5a = ⎡−3.9 ( 10 ) P⎤−5⎣⎦a( ) ( )m= 2.6 P 1.187 102.3. Khan Correlation [4]Like the previous case, this <strong>correlation</strong> ignores the effect <strong>of</strong> μ ob on the coefficient which ismultiplied by μ ob to predict μ o .μο= μ exp(9.6 × 10 ( P − P ))(5)ob−52.4. Kartoatmodjo and Schmidt Correlation [7]bLike beal one, this <strong>correlation</strong> proposes that <strong>for</strong> any specified <strong>oil</strong>, when only pressure is thevariable, <strong>viscosity</strong> varies linearly with the pressure.1.8148 1.59(6)μ = 1.00081μ + 0.001127 P − P − 0.006517μ + 0.038μ3. Experimental Data1.6 0.56( P P )( )μ = μ + 0.001 − 0.024μ + 0.038μo ob b ob ob( )( )o ob b ob obIn this study, PVT experimental data <strong>of</strong> five sample <strong>oil</strong>s from Iranian <strong>oil</strong> reservoirs have beenused. These data include <strong>oil</strong> reservoir temperature, saturation pressure, API gravity and solutiongas-<strong>oil</strong> ratio at reservoir temperature. Reservoir <strong>oil</strong> viscosities have been measured at variouspressures above and below the bubble point pressure <strong>for</strong> different temperatures. Statisticalexperimental data are shown in Table 1.Table 1. Statistical experimental data <strong>of</strong> sample <strong>oil</strong>s.Oil properties Oil 1 Oil 2 Oil 3 Oil 4 Oil 5API 15.4 24.2 30.3 36.7 41.6Temperature (ºF) 134-272 134-272 134-272 134-272 134-272Solution gas-<strong>oil</strong> ratio (SCF/STB) 647 823 954 1167 1542Saturation pressure (psia) 2490-35002520-33281340-20401585-29141638-4513Undersaturated <strong>viscosity</strong> (cp) 0.394-2.2110.374-0.7260.683-18.4350.316-8.2530.341-1.146The accuracy and ability <strong>of</strong> each mentioned <strong>correlation</strong> <strong>for</strong> predicting <strong>oil</strong> <strong>viscosity</strong> was checkedwith experimental data and Figs. 1, 2, 3 and 4 show this comparison. These figures confirm thedisability <strong>of</strong> <strong>correlation</strong>s <strong>for</strong> accurate <strong>prediction</strong> <strong>of</strong> <strong>oil</strong> viscosities.(1)(2)(3)(4)
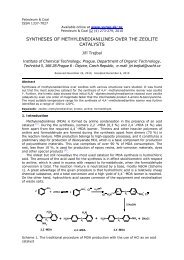
R. Abedini et al./Petroleum& Coal 52(1) 46-51, 2010 52Fig. 1. Oil <strong>viscosity</strong> as a function <strong>of</strong>pressure.Fig. 2. Experimental values compared with calculated valuescalculated by Beal <strong>correlation</strong>Fig. 3. Experimental values compared with calculatedvalues calculated based on the Vasquez-Beggs<strong>correlation</strong>4. Development <strong>of</strong> the proposed <strong>correlation</strong>sFig. 4. Experimental values compared with calculatedvalues calculated based on the khan <strong>correlation</strong>Proposed <strong>correlation</strong> is based on real data, which almost covers Iranian <strong>oil</strong> types. At pressuresabove bubble point pressure, <strong>oil</strong> is at single-phase state, while its solution gas–<strong>oil</strong> is constant andit seems that pressure will be the most effective in <strong>oil</strong> <strong>viscosity</strong>. By increasing pressure above thebubble point, <strong>oil</strong> density and <strong>oil</strong> <strong>viscosity</strong> will be increased (Fig. 1). Several function <strong>for</strong>ms havebeen tested to correlate <strong>undersaturated</strong> <strong>oil</strong> <strong>viscosity</strong> (μ o ) to saturated <strong>oil</strong> <strong>viscosity</strong> (μ ob ), and pressureincrement above the bubble point (P-P b ). Proposed <strong>correlation</strong> in this work (<strong>for</strong> under-saturated<strong>oil</strong>) is as follows:b1 b2 b3 b4 b5 b6 b7( ) ( )μ = μ + 0.001 P − P a μ + a μ + a μ + a P + a P + a P + a P (7)o ob b 1 ob 2 ob 3 ob 4 b 5 b 6 b 7 bWhere:a 1 =0.05601 a 2 =0.47557 a 3 =-0.2257 a 4 =-0.29598 a 5 =-0.07734 a 6 =-0.42436 a 7 =-1.64149b 1 =1.45198 b 2 =0.35997 b 3 =0.86389 b 4 =-0.41866 b 5 =-0.29981 b 6 =-0.1946 b 7 =-0.313395. Results and Discussion5.1. Validation <strong>of</strong> the proposed <strong>correlation</strong>The accuracy and ability <strong>of</strong> each mentioned <strong>correlation</strong> <strong>for</strong> predicting <strong>oil</strong> <strong>viscosity</strong> was checkedwith experimental data and Figs. 2, 3, 4 and 5 show this comparison. These figures confirm thedisability <strong>of</strong> <strong>correlation</strong>s <strong>for</strong> accurate <strong>prediction</strong> <strong>of</strong> <strong>oil</strong> viscosities.Fig. 6 depicts the comparison <strong>of</strong> experimental values <strong>of</strong> <strong>viscosity</strong> with predicted ones by twodimensions plot <strong>for</strong> <strong>undersaturated</strong> <strong>oil</strong> respectively. It is obvious from the figure that the <strong>new</strong><strong>correlation</strong> provides results in good agreement with experimental values.Table 2 reveals average relative error (ARE), absolute average relative error (AARE) andstandard deviation (SD) <strong>for</strong> <strong>undersaturated</strong> <strong>oil</strong> <strong>viscosity</strong> <strong>correlation</strong>s respectively. ARE, AARE andSD are defined as below.
R. Abedini et al./Petroleum& Coal 52(1) 46-51, 2010 53Fig. 5. Experimental values compared withcalculated values calculated based on theKartoatmodjo and Schmidt <strong>correlation</strong>Fig. 6. Experimental values compared withcalculated values calculated based on the NewModelTable 2. Accuracy <strong>of</strong> <strong>viscosity</strong> <strong>correlation</strong>s <strong>for</strong> <strong>prediction</strong> <strong>of</strong> <strong>undersaturated</strong> <strong>oil</strong> viscosities.Correlation ARE (%) AARE (%) SD (%)Undersaturated <strong>oil</strong> Beal, 1946 1.33 4.21 5.92Vasquez and Beggs, 1980 7.83 9.12 13.83Khan,1987 -2.44 4.64 6.48Kartoatmodjo and Schmidt, 1994 4.13 6.43 9.94New Model 0.85 2.58 4.27AREN1 ⎛ Xexp erimental( i) − Xcalculated( i)⎞=N∑⎜ X⎟i = 1 ⎝exp erimental( i)⎠(8)N1 ⎛ X∑⎟ ⎟ ⎞⎜exp erimental ( i)− Xcalculated ( i)AARE =N ⎜i= 1⎝Xexp erimental(i)⎠SD =N1 ⎛ X∑⎟ ⎟ ⎞⎜exp erimental− Xcalculated− AAREN −1⎜i= 1⎝Xexp erimental ( i)⎠2(9)(10)New <strong>viscosity</strong> <strong>correlation</strong> derived based on Iranian field data which does not requirecompositional in<strong>for</strong>mation and can be used <strong>for</strong> black <strong>oil</strong> type fluids. The <strong>correlation</strong> can be used inblack <strong>oil</strong> reservoir simulators, it can be easily tuned, and it provides better estimates <strong>of</strong> <strong>oil</strong><strong>viscosity</strong> than the previous existing <strong>correlation</strong>s. This is shown in the figure 7.Fig. 7. Comparison between all introduced <strong>correlation</strong>s
R. Abedini et al./Petroleum& Coal 52(1) 46-51, 2010 545.2. Accuracy <strong>of</strong> the proposed <strong>correlation</strong>Here, the accuracy <strong>of</strong> the proposed <strong>correlation</strong>s in this work, as well as the <strong>correlation</strong>s previouslydiscussed, is checked. Using the 86 real cases data series <strong>of</strong> Iranian <strong>oil</strong>s, the results <strong>of</strong> this workand other ones <strong>for</strong> estimating the <strong>oil</strong> <strong>viscosity</strong> are compared. Table 2and Fig.8 shows all <strong>of</strong> thesecomparisons.Fig. 8. Percent relative error distribution <strong>for</strong> <strong>undersaturated</strong> <strong>oil</strong> <strong>viscosity</strong> <strong>correlation</strong>sFig. 8 shows percent relative error distribution <strong>for</strong> all <strong>correlation</strong>s.⎛ Xexp erimental(i)− Xcalculated(i)⎞Where: Ei = ⎜⎟ × 100 (i= 1, 2, 3…,n d ) (11)⎝ Xexp erimental(i)⎠At this point, it should be mentioned the proposed <strong>correlation</strong>s are only applicable to Iranian<strong>oil</strong>s and their applicability to other regions should be checked.6. ConclusionGenerally the most common method <strong>for</strong> calculating <strong>viscosity</strong> <strong>of</strong> <strong>crude</strong> <strong>oil</strong>s is <strong>viscosity</strong><strong>correlation</strong>s. However these <strong>correlation</strong>s fail to predict <strong>oil</strong> viscosities at wide range <strong>of</strong> operatingconditions such as pressure and temperature. In this work a <strong>new</strong> <strong>correlation</strong> <strong>for</strong> estimation <strong>of</strong><strong>undersaturated</strong> Iranian <strong>oil</strong>s has been proposed. This <strong>correlation</strong> is based on real data <strong>of</strong> thedifferent types <strong>of</strong> Iranian <strong>oil</strong>s. Input parameters <strong>for</strong> this <strong>correlation</strong> are <strong>oil</strong> API gravity, saturationpressure, reservoir temperature and pressure, which are easily measured in <strong>oil</strong> fields. Incomparison with <strong>correlation</strong>s previously published in the literature, <strong>new</strong> <strong>correlation</strong> has a betteraccuracy and per<strong>for</strong>mance <strong>for</strong> predicting the <strong>viscosity</strong> <strong>of</strong> Iranian <strong>oil</strong>s. It should be mentioned that,
R. Abedini et al./Petroleum& Coal 52(1) 46-51, 2010 55this proposed <strong>correlation</strong> might be used <strong>for</strong> the <strong>prediction</strong> <strong>of</strong> Iranian <strong>oil</strong> <strong>viscosity</strong>. Application <strong>of</strong>this <strong>correlation</strong> <strong>for</strong> other <strong>oil</strong> samples can result in errors.NomenclatureSymbolsGreeksAPI Oil API gravity μ ob Saturated <strong>oil</strong> <strong>viscosity</strong> (cp)R s Solution gas-<strong>oil</strong> ratio (SCF/STB) μ o Undersaturated <strong>oil</strong> <strong>viscosity</strong> (cp)T Temperature (R, F)AbbreviationsP Pressure (psia) ARE Average relative errorP b Saturation pressure <strong>oil</strong> bubble point AARE Average absolute relative errorpressure (psia)Ei Percent relative error SD Standard deviationn d Number <strong>of</strong> data pointsReferences[1] Beal, C., 1946. Viscosity <strong>of</strong> air, water, natural gas, <strong>crude</strong> <strong>oil</strong> and its associated gases at <strong>oil</strong>field temperature and pressures. Trans. AIME 165, 114– 127.[2] Beggs, H.D., Robinson, J.R., 1975. Estimating the <strong>viscosity</strong> <strong>of</strong> <strong>crude</strong> <strong>oil</strong> systems. JPT 9,1140– 1141.[3] Chew, J., Connally, C.A., 1959. Viscosity <strong>correlation</strong> <strong>for</strong> gassaturated <strong>crude</strong> <strong>oil</strong>. Trans.AIME 216, 23–25.[4] Khan, S. A., et al., “Viscosity Correlations <strong>for</strong> Saudi Arabian Crude Oils,” SPE Paper 15720,Presented at the Fifth SPE Middle East Conference held in Manama, Bahrain, March 7-10,1987.[5] Elsharkawy, A.M., Alikhan, A.A., 1999. Models <strong>for</strong> predicting the <strong>viscosity</strong> <strong>of</strong> Middle East<strong>crude</strong> <strong>oil</strong>s. Fuel 78, 891– 903.[6] Glaso, O., 1980. Generalized pressure–volume–temperature <strong>correlation</strong> <strong>for</strong> <strong>crude</strong> <strong>oil</strong>system. JPT 2, 785– 795.[7] Kartoatmodjo, F., Schmidt, Z., 1994. Large data bank improves <strong>crude</strong> physical property<strong>correlation</strong>. Oil Gas J. 4, 51–55.[8] Labedi, R., 1992. Improved <strong>correlation</strong>s <strong>for</strong> predicting the <strong>viscosity</strong> <strong>of</strong> light <strong>crude</strong>s. J. Pet.Sci. Eng. 8, 221– 234.[9] Little, J.E., Kennedy, H.T., 1968. Calculating the <strong>viscosity</strong> <strong>of</strong> hydrocarbon systems withpressure temperature and composition. Soc. Pet. Eng. J. 6, 157– 162.[10] Lohrenz, J., Bray, B.C., Clark, C.R., 1964. Calculating viscosities <strong>of</strong> reservoir fluids fromtheir composition. JPT 10, 1170– 1176.