Understanding the Course Experience Survey - RMIT University
Understanding the Course Experience Survey - RMIT University
Understanding the Course Experience Survey - RMIT University
- No tags were found...

You also want an ePaper? Increase the reach of your titles
YUMPU automatically turns print PDFs into web optimized ePapers that Google loves.
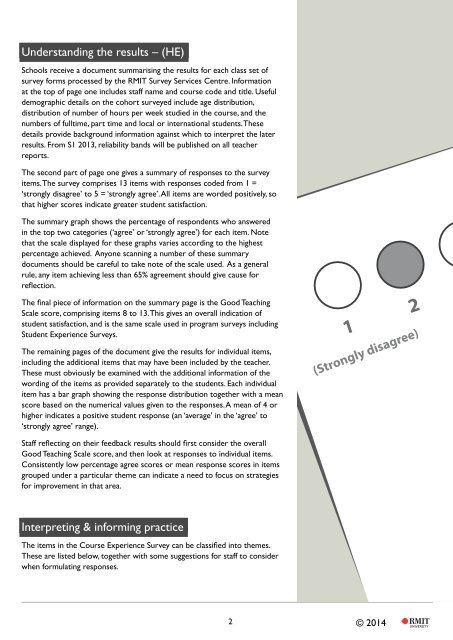
<strong>Understanding</strong> <strong>the</strong> results – (HE)Schools receive a document summarising <strong>the</strong> results for each class set ofsurvey forms processed by <strong>the</strong> <strong>RMIT</strong> <strong>Survey</strong> Services Centre. Informationat <strong>the</strong> top of page one includes staff name and course code and title. Usefuldemographic details on <strong>the</strong> cohort surveyed include age distribution,distribution of number of hours per week studied in <strong>the</strong> course, and <strong>the</strong>numbers of fulltime, part time and local or international students. Thesedetails provide background information against which to interpret <strong>the</strong> laterresults. From S1 2013, reliability bands will be published on all teacherreports.The second part of page one gives a summary of responses to <strong>the</strong> surveyitems. The survey comprises 13 items with responses coded from 1 =‘strongly disagree’ to 5 = ‘strongly agree’. All items are worded positively, sothat higher scores indicate greater student satisfaction.The summary graph shows <strong>the</strong> percentage of respondents who answeredin <strong>the</strong> top two categories (‘agree’ or ‘strongly agree’) for each item. Notethat <strong>the</strong> scale displayed for <strong>the</strong>se graphs varies according to <strong>the</strong> highestpercentage achieved. Anyone scanning a number of <strong>the</strong>se summarydocuments should be careful to take note of <strong>the</strong> scale used. As a generalrule, any item achieving less than 65% agreement should give cause forreflection.The final piece of information on <strong>the</strong> summary page is <strong>the</strong> Good TeachingScale score, comprising items 8 to 13. This gives an overall indication ofstudent satisfaction, and is <strong>the</strong> same scale used in program surveys includingStudent <strong>Experience</strong> <strong>Survey</strong>s.The remaining pages of <strong>the</strong> document give <strong>the</strong> results for individual items,including <strong>the</strong> additional items that may have been included by <strong>the</strong> teacher.These must obviously be examined with <strong>the</strong> additional information of <strong>the</strong>wording of <strong>the</strong> items as provided separately to <strong>the</strong> students. Each individualitem has a bar graph showing <strong>the</strong> response distribution toge<strong>the</strong>r with a meanscore based on <strong>the</strong> numerical values given to <strong>the</strong> responses. A mean of 4 orhigher indicates a positive student response (an ‘average’ in <strong>the</strong> ‘agree’ to‘strongly agree’ range).1 2(Strongly disagree)Staff reflecting on <strong>the</strong>ir feedback results should first consider <strong>the</strong> overallGood Teaching Scale score, and <strong>the</strong>n look at responses to individual items.Consistently low percentage agree scores or mean response scores in itemsgrouped under a particular <strong>the</strong>me can indicate a need to focus on strategiesfor improvement in that area.Interpreting & informing practiceThe items in <strong>the</strong> <strong>Course</strong> <strong>Experience</strong> <strong>Survey</strong> can be classified into <strong>the</strong>mes.These are listed below, toge<strong>the</strong>r with some suggestions for staff to considerwhen formulating responses.2 © © 2014