National Audit of Angioplasty Procedures - HQIP
National Audit of Angioplasty Procedures - HQIP
National Audit of Angioplasty Procedures - HQIP

You also want an ePaper? Increase the reach of your titles
YUMPU automatically turns print PDFs into web optimized ePapers that Google loves.
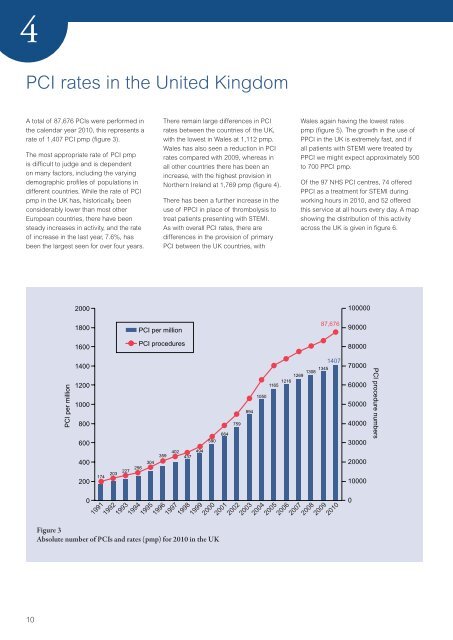
4PCI rates in the United KingdomA total <strong>of</strong> 87,676 PCIs were performed inthe calendar year 2010, this represents arate <strong>of</strong> 1,407 PCI pmp (figure 3).The most appropriate rate <strong>of</strong> PCI pmpis difficult to judge and is dependenton many factors, including the varyingdemographic pr<strong>of</strong>iles <strong>of</strong> populations indifferent countries. While the rate <strong>of</strong> PCIpmp in the UK has, historically, beenconsiderably lower than most otherEuropean countries, there have beensteady increases in activity, and the rate<strong>of</strong> increase in the last year, 7.6%, hasbeen the largest seen for over four years.There remain large differences in PCIrates between the countries <strong>of</strong> the UK,with the lowest in Wales at 1,112 pmp.Wales has also seen a reduction in PCIrates compared with 2009, whereas inall other countries there has been anincrease, with the highest provision inNorthern Ireland at 1,769 pmp (figure 4).There has been a further increase in theuse <strong>of</strong> PPCI in place <strong>of</strong> thrombolysis totreat patients presenting with STEMI.As with overall PCI rates, there aredifferences in the provision <strong>of</strong> primaryPCI between the UK countries, withWales again having the lowest ratespmp (figure 5). The growth in the use <strong>of</strong>PPCI in the UK is extremely fast, and ifall patients with STEMI were treated byPPCI we might expect approximately 500to 700 PPCI pmp.Of the 97 NHS PCI centres, 74 <strong>of</strong>feredPPCI as a treatment for STEMI duringworking hours in 2010, and 52 <strong>of</strong>feredthis service at all hours every day. A mapshowing the distribution <strong>of</strong> this activityacross the UK is given in figure 6.20001000001800PCI per million87,676900001600PCI procedures80000PCI per million140012001000800600400200017420322725630419911992199319941995Figure 3Absolute number <strong>of</strong> PCIs and rates (pmp) for 2010 in the UK35940243749459066419961997199819992000200120022003759894105014071308 13451269121611652004200520062007200820092010700006000050000400003000020000100000PCI procedure numbers10