National Audit of Angioplasty Procedures - HQIP
National Audit of Angioplasty Procedures - HQIP
National Audit of Angioplasty Procedures - HQIP

You also want an ePaper? Increase the reach of your titles
YUMPU automatically turns print PDFs into web optimized ePapers that Google loves.
NICOR: NATIONAL INSTITUTE FORCARDIOVASCULAR OUTCOMES RESEARCH<strong>National</strong> <strong>Audit</strong> <strong>of</strong>PercutaneousCoronaryInterventional<strong>Procedures</strong>Annual Report 20111
This is the sixth written report <strong>of</strong> the United Kingdom’s <strong>National</strong> <strong>Audit</strong> <strong>of</strong> PercutaneousCoronary Interventional <strong>Procedures</strong>. The audit uses mechanisms developed incollaboration with the Central <strong>Audit</strong> Cardiac Database to collect procedure-specific databased on the current minimum British Cardiovascular Interventional Society (BCIS) dataset(www.bcis.org.uk). Annual audits from 1992 are available for download from the BCIS website, where a more detailed set <strong>of</strong> analyses relating to this report can also be found.The main objective <strong>of</strong> this audit is to help improve the care <strong>of</strong> patients who undergopercutaneous coronary interventional procedures in the UK. The audit allows clinicians toassess key aspects <strong>of</strong> the quality <strong>of</strong> their care when performing these procedures, andcompare their results with those from across the UK. The audit is led by the <strong>Audit</strong> Lead <strong>of</strong>the British Cardiovascular Intervention Society (BCIS) with participation from all hospitalsperforming PCI procedures. The data included in this report relates to proceduresperformed between 1st January and 31st December 2010.Aimed at healthcare pr<strong>of</strong>essionals, medical directors, managers and clinical governanceleads, the report describes progress to date, key clinical findings and patient outcomes.Electronic copies <strong>of</strong> this report can be found at www.ucl.ac.uk/nicor/bcisFor further information about this report please contact d.marlee@ucl.ac.ukAcknowledgementsThe <strong>National</strong> <strong>Audit</strong> <strong>of</strong> Percutaneous Coronary Intervention has been developed and ledby the British Cardiovascular Intervention Society (BCIS) since 1988 and more recentlybeen managed by the <strong>National</strong> Institute for Cardiovascular Outcomes Research(NICOR). The analysis on which this report is based was undertaken by the BCIS <strong>Audit</strong>Lead, Dr Peter Ludman, on behalf <strong>of</strong> BCIS.Peter F Ludman MA MD FRCP FESCConsultant Cardiologist,Queen Elizabeth Hospital,Birmingham, UK<strong>Audit</strong> Lead for the British Cardiovascular Intervention SocietyWe would like to acknowledge the important contribution <strong>of</strong> NHS Trusts and theindividual clinicians, nurses and audit teams who are participating in this audit.This audit was prepared in close collaboration with the Central Cardiac <strong>Audit</strong> Database(CCAD) team, who are now part <strong>of</strong> NICOR, and who performed the data management,Andy Donald (database and s<strong>of</strong>tware developer) has been particularly involved.The <strong>National</strong> <strong>Audit</strong> <strong>of</strong> Percutaneous Coronary Intervention is commissioned and fundedby the Health Quality Improvement Partnership (<strong>HQIP</strong>) www.hqip.org.ukIMAGESFRONT COVER: ©Alain Pol; ISM/Science Photo LibraryFalse-colour arteriograph (angiograph) <strong>of</strong> the human heart, showing evidence <strong>of</strong> multiple stenosis (narrowing) in the left coronary artery (top right <strong>of</strong> heart on image).Unaffected blood vessels appear as continuous pink ribbons; the stenosed artery has a small diameter with a consequently reduced blood flow (ischaemia). Theobstruction is due to formation <strong>of</strong> fatty atheroma plaques on the arterial wall; the presence <strong>of</strong> a blood clot (thrombosis) in such an obstructed region would lead to thetotal blockage <strong>of</strong> the artery and subsequent death <strong>of</strong> the section <strong>of</strong> heart muscle it services - an event known as an acute myocardial infarction or heart attack.PAGE 23: ©Zephyr/Science Photo LibraryCoronary angioplasty. Coloured X-ray angiogram <strong>of</strong> a stent (orange) within and supporting a coronary artery <strong>of</strong> a heart. It was placed there during a coronaryangioplasty to treat stenosis (narrowing) <strong>of</strong> the artery. The flexible catheter used to place it and a balloon catheter (not seen), is seen running down from upper left.The inflation <strong>of</strong> the balloon catheter expanded the artery and restored normal blood flow. The stent was expanded by the balloon catheter and remains afterits withdrawal. Arterial stenosis may arise from arterial disease. X-ray angiography injects a radio-opaque contrast medium to highlight blood vessels on X-rays.This report may not be published or used commercially without permission.
<strong>National</strong> <strong>Audit</strong> <strong>of</strong>PercutaneousCoronaryInterventional<strong>Procedures</strong>Annual Report 2011
ContentsForeword 31 Executive summary 42 Data completeness 63 Infrastructure 94 PCI rates in the United Kingdom 105 Demographics 136 Stents 147 Arterial access route 158 Outcome 169 Delays to treatment 1910 The future 2211 Glossary 2412 References 252
ForewordThe United Kingdom is unique in having such a comprehensiveaudit <strong>of</strong> percutaneous coronary intervention procedures.We have seen a number <strong>of</strong> important changes over the years. The number <strong>of</strong> PCIs permillion population continues to rise and the rate <strong>of</strong> increase was the highest last year forfour years, although there are still marked geographical variations which may need to beaddressed.There has been continued rollout <strong>of</strong> primary angioplasty for acute ST elevation myocardialinfarction with a year on year reduction in call to balloon and door to balloon times, suchthat we now compare very favourably with our international colleagues. Radial access nowaccounts for half <strong>of</strong> all PCI procedures and the use <strong>of</strong> drug eluting stents has risen further.Although overall death rate following PCI has risen; this is almost certainly a reflection <strong>of</strong>increasing case complexity and case mix, with a higher proportion <strong>of</strong> urgent/emergencycases. Overall risk-adjusted outcome shows that all units are performing as predicted.The issue <strong>of</strong> variation in outcome according to unit volume is not directly addressed in thisreport and is subject to ongoing analysis.The number <strong>of</strong> centres sending data for analysis to the Central Cardiac <strong>Audit</strong> Databaseand the quality <strong>of</strong> the data submitted continues to improve, and this is down to the efforts<strong>of</strong> individual operators, numerous audit leads <strong>of</strong> individual centres, the staff at CCAD andNICOR and <strong>of</strong> course the enormous efforts <strong>of</strong> Peter Ludman for collation and analysis <strong>of</strong>these data.Simon RedwoodPresident, British Cardiovascular Intervention Society3
1Executive summaryCoronary heart disease accounts forabout one in five deaths in men and onein six deaths in women. The British HeartFoundation estimate that angina affectsapproximately two million people living inthe United Kingdom.Percutaneous coronary intervention (PCI)is a rapidly evolving technique used totreat patients with narrowed or blockedarteries that supply the heart musclewith blood. The procedure mechanicallyimproves blood flow to the heart. Initiallythe patient has a ‘coronary angiogram’,x-ray images <strong>of</strong> the heart arteries arecreated, to visualise the position andshape <strong>of</strong> any narrowing or blockages.If the clinical circumstances and theangiogram findings suggest blood flow tothe heart must be modified, the majority <strong>of</strong>patients will be treated by PCI (a minoritywill be treated by coronary artery bypasssurgery). During PCI, a small balloon isinserted in to the narrowed artery andinflated. This squashes the fatty tissuecausing the blockage and widens theartery. In most cases a ‘stent’, a metalmesh scaffold, is implanted. The stentremains permanently in place and keepsthe artery wall open. Treatment aimsto prevent the arteries blocking (whichmight cause a heart attack) and improveflow to the heart muscle to alleviate thesymptoms <strong>of</strong> angina.The audit described here allows cliniciansto assess key aspects <strong>of</strong> the patternsand quality <strong>of</strong> their care when performingcoronary angiogram and PCI. This is a UKwide audit led by the <strong>Audit</strong> Lead <strong>of</strong> theBritish Cardiovascular Intervention Society(BCIS). Data collection and analysis forcentres in England and Wales has projectmanagement and specialist IT supportprovided by NICOR which is part <strong>of</strong> theUCL Institute <strong>of</strong> Cardiovascular Science.4
Key findings include:• There are now 114 PCI centres in theUK.• The number <strong>of</strong> PCIs in the UK was1,407 per million population (pmp).• There has been an increase in PCIactivity in all the UK countries except forWales which also has the lowest rate at1,112 pmp compared with the highestin Northern Ireland at 1,769 pmp.• In the last year the rate <strong>of</strong> increase inPCI pmp has been the highest for fouryears at 7.6%• The rate <strong>of</strong> primary PCI (to treat STelevation Myocardial Infarction (STEMI)in place <strong>of</strong> thrombolysis) continues torise and reached 287 pmp in 2010. Thistreatment option was provided 24/7 by52 <strong>of</strong> the 97 NHS PCI centres• Centre size: there is evidence thatsuggests improved outcomes forpatients being treated in higher volumePCI centres, particularly those thatperform at least 400 procedures perannum (pa). This forms part <strong>of</strong> therecommendations <strong>of</strong> the Joint WorkingGroup on PCI <strong>of</strong> BCIS and the BritishCardiovascular Society. 1 In 2010 25%<strong>of</strong> PCI units were performing 400 orless cases pa, but the majority <strong>of</strong> thesewere new units undertaking a graduallyincreasing volume <strong>of</strong> work.• The <strong>National</strong> Institute for health andClinical Excellence (NICE) recommendthat “Stents should be used routinelywhere PCI is the clinically appropriateprocedure for patients with eitherstable or unstable angina or with acutemyocardial infarction”. 2 The greatmajority <strong>of</strong> procedures do now involvestent insertion (92%), suggesting thatthis aspect <strong>of</strong> good practice is beingmet.• Following concerns about the safety<strong>of</strong> drug eluting stents (DES) inSeptember 2006, there was a fall intheir use to 55% across the UK. Datafrom 2010 suggest an increase in theiruse now that safety issues are betterunderstood, and are not dissimilar fromwhat might be predicted from the NICEupdated guidelines. 3,4 Neverthelessthere are large differences in therate <strong>of</strong> DES use in the different UKcountries.• The use <strong>of</strong> the radial artery for accesshas increased progressively from10% in 2004 to over 50% in 2010. Thisaudit analysis supports the literaturedemonstrating a lower complicationrate when PCI is performed viathe radial artey, with approximatelya halving <strong>of</strong> access site relatedcomplications.• The overall rate <strong>of</strong> death beforedischarge from hospital following PCIhas gradually risen over the past fewyears. This is due to a change in casemix. There has been no evidence <strong>of</strong> achange in the outcomes when patientsin similar clinical presentations arecompared. For stable elective patients,in hospital mortality is less than 0.15%.For patients with unstable angina orNSTEMI (non-ST elevation MyocardialInfarction), the in hospital mortality isless than 0.6%. For patients with STEMIthe mortality is higher at about 4%.• Analysis <strong>of</strong> risk adjusted outcome(major adverse cardiac andcerebrovascular events) from the 2008,2009 and 2010 data combined showsthat all units in the UK are performingas well as would be predicted from themodel used for risk adjustment, butdifficulties with risk adjusted analyseswere identified.• <strong>National</strong> and international guidelinesrecommend that in the emergencytreatment <strong>of</strong> patients with STEMI,angioplasty treatment should beperformed within 90 minutes <strong>of</strong> arrival<strong>of</strong> the patient at the angioplasty site,door to balloon (DTB) time, and within150 minutes <strong>of</strong> a patient’s call forhelp, call to balloon (CTB) time. Thedata for units performing primary PCI(PPCI) for STEMI are presented asfunnel plots. There has been a yearon year improvement. A DTB < 90minutes was achieved in 89.7%, andCTB < 150 minutes in 77.3% <strong>of</strong> cases.This compares very favourably withinternational statistics.• Patients who need to be transferredbetween hospitals for primary PCI hadlonger delays than those admitteddirect to a PCI centre, the transferadding about 50 minutes.• There has been a further improvementin the number <strong>of</strong> centres sending datato CCAD for electronic collection andanalysis, and a marked improvement inthe quality <strong>of</strong> data submitted.The rest <strong>of</strong> this report contains moredetails and graphs <strong>of</strong> the audit findings.The complete set <strong>of</strong> data from the2010 audit was presented at the BritishCardiovascular Intervention Society’sannual meeting (BCIS) in autumn 2011and is available for download at thesociety’s web site www.bcis.org.uk.5
2Data completenessOf 97 NHS PCI centres in the UK, all butthree submitted data for 2010 activity toCCAD. The centres that failed to submitwere Hairmyers Hospital (Scotland) andBelfast City Hospital (Northern Ireland).Six <strong>of</strong> 17 private hospitals in the UK alsosubmitted data.There has been further improvement in thecompleteness <strong>of</strong> the 2010 data submittedfor analysis in this report. The actualpercentage completeness for hospitals inthe UK is listed below:completeness 50–90%completeness less than 50%Table 1Data completeness for PCI units in UK 2010 (% complete)Hospital nameDate <strong>of</strong>birthSexMedicalhistoryPreprocedureshockProcedureurgencyVesselstreatedRenaldiseaseDiabetesDischargedateDischargestatusPCIhospitaloutcomeNHSnumberEngland and Wales (NHS)AEI. Royal Albert Edward Infirmary 99.5 98.8 99.2 100 100 97.1 100 100 100 100 99.7 98.5AMG. Wycombe General Hospital 100 99.8 66.4 99.4 100 100 98.5 98.1 55.2 56.9 100 99.4BAL. Barts and the London 100 98.9 95.5 98.3 99.9 99.3 93.2 96.8 99.3 99 97.3 95.1BAS. Basildon Hospital 100 100 89.5 98 100 100 67 98.6 100 99.5 100 99.7BAT. Royal United Hospital Bath 100 100 39.1 99 100 100 83.2 80.4 69.3 70.2 100 98.7BED. Bedford 100 100 89.3 100 100 100 96.4 75 100 100 100 100BHH. Rochdale Infirmary 100 100 99.8 100 100 99.8 100 100 99.2 100 99.1 100BHL. Liverpool Heart and Chest Hospital 100 100 100 100 100 100 99.5 99.9 99.9 99.9 100 99.7BHR. Royal Berkshire Hospital 100 100 100 100 100 100 100 100 100 100 100 99.2BLA. Royal Blackburn 100 100 100 100 100 99 99 99.7 93.2 99.3 100 99.7BOU. Royal Bournemouth General Hospital 100 100 94.2 100 100 100 97.8 99.2 99.2 100 100 99.6BRD. Bradford Royal Infirmary 100 100 100 100 100 99.6 99.6 99.6 100 100 70.1 97BRI. Bristol Royal Infirmary 100 99.7 95.2 99.4 99.8 99.6 99.4 99.5 99.4 99.4 99.4 99.4CGH. Conquest Hospital 100 100 100 100 100 100 100 100 100 100 100 99.7CHG. Cheltenham General Hospital 99.9 99.6 99.9 100 99.7 90.9 98.9 98.7 99.3 99.4 56.1 99.7CHH. Castle Hill Hospital 100 100 98.6 100 100 100 100 100 100 100 99.8 98.3CHN. Nottingham City Hospital 100 100 64 97.9 100 100 89.3 90.5 99.8 99.3 100 99.8CLW. Glan Clwyd DGH Trust 100 100 96.3 100 100 100 99.6 98.8 97.6 99.2 100 99.2DER. Derby Royal Infirmary 100 100 96.1 99.6 99.2 100 99 98.9 96.3 99.7 99.7 100DGE. Eastbourne DGH 100 100 100 100 100 100 100 100 100 100 100 98.9DUD. City Hospital 100 100 100 100 100 100 100 100 100 100 100 98.8DVH. Darent Valley Hospital 100 100 99 100 100 100 89.1 100 92.7 93.8 100 100EAL. Ealing Hospital 100 100 100 100 98.8 100 82.6 96.5 100 100 100 98.8EBH. Birmingham Heartlands Hospital 99.5 96.4 98 99.1 100 92.4 91.5 94.1 99.4 99.4 98.8 97.7ESU. East Surrey Hospital 100 100 100 86 99.8 97.6 85.2 79.5 100 98.4 100 97.1FRE. Freeman Hospital 100 100 98.9 99.2 100 99 95.1 98.9 100 100 100 99.8FRM. Frimley Park Hospital 100 100 100 100 100 100 100 100 100 100 100 99.2FRY. Frenchay Hospital 100 100 98.9 100 100 100 99.4 100 100 100 99.4 100GEO. St George's Hospital 100 99.9 98.8 98.9 100 100 99.3 99.5 100 99.9 100 96GRL. Glenfield Hospital 100 100 97 99.7 100 99.8 96.2 98.1 98.2 98.2 17.1 99.3GWH. Queen Elizabeth Hospital, Woolwich 100 98.3 100 100 100 97.8 97.2 94.5 96.7 97.8 100 99.4HAM. Hammersmith Hospital 100 99.8 100 96.9 94.8 98 99.4 99.4 99 100 100 98HH. Harefield Hospital 100 99.8 94.6 98.3 100 98.5 96 97.4 99.3 98.9 90.3 98.16
Hospital nameDate <strong>of</strong>birthSexMedicalhistoryPreprocedureshockProcedureurgencyVesselstreatedRenaldiseaseDiabetesDischargedateDischargestatusPCIhospitaloutcomeNHSnumberKCH. King's College Hospital 100 100 97.6 99.9 99.9 93.9 95.5 98.3 99.5 93.2 99.8 99KGH. Kettering General Hospital 100 99.9 99.8 99.1 100 99.9 99.8 99.9 99.9 100 100 99.6KMH. Kings Mill Hospital 99.6 99.6 99.6 100 100 99.6 100 96.7 100 100 99.6 100KSX. Kent & Sussex Hospital 100 99.3 90.9 99.2 100 100 99.6 88.4 11.6 11.6 100 99.6LGI. Yorkshire Heart Centre 100 99.7 96.3 100 100 99.2 92.5 98 99.4 99.6 99.4 99.1LIN. Lincoln County Hospital 100 100 100 86.2 100 99.4 88.2 66 100 100 100 99.4LIS. Lister Hospital 100 98.9 100 100 100 99.8 100 100 99.8 100 100 100MAY. Mayday University Hospital 100 99.7 98.3 92.8 100 98.3 100 93.6 100 100 99.7 98.3MDW. Medway Maritime Hospital 99.5 100 100 44.3 100 96.9 92.7 92.7 99.5 99 100 96.9MOR. Morriston Hospital 100 99.9 94.7 99.5 100 98.8 94.6 98.9 99.3 99.4 96.8 99.2MPH. Taunton & Somerset 100 99.4 97.8 100 100 98.4 94.5 99.9 99.4 98.5 97.8 99.4MRI. Manchester Royal Infirmary 100 100 100 99.9 100 99.7 96.4 96.5 100 100 87.3 96.9NCR. New Cross Hospital 100 100 99.6 100 100 100 99.8 100 100 100 100 99.5NGS. Northern General Hospital 100 100 100 100 100 100 99.9 97.5 99.2 99.8 99.8 98.9NHB. Royal Brompton Hospital 100 100 97.8 98.4 100 99.9 98.6 97.7 98.6 98.6 98.6 80.7NHH. North Hampshire Hospital 100 100 100 97.4 100 100 98.1 59 100 100 100 99.2NOR. Norfolk & Norwich Hospital 100 100 97.8 100 99.4 99.8 98.8 99.3 97.1 100 95.3 99.4NPH. Northwick Park Hospital 100 99.1 99.1 11.2 98.9 89.1 60.3 70.3 51.9 90.5 99.3 91.8NTH. Northampton General Hospital 100 100 100 42.5 97.8 99.2 96.2 95.6 86.1 97.5 100 99.5PAP. Papworth Hospital 100 99.9 90.8 100 100 100 93.2 99.5 92.2 99.8 100 98.3PIN. Pinderfield 100 100 100 95 100 100 98 92.9 100 100 100 100PLY. Derriford Hospital 100 100 99.8 99.8 100 99.8 98.4 99.8 100 100 99.7 99.5PMS. The Great Western Hospital 100 100 99.7 100 99.5 100 95.7 98.7 98.2 98.7 98.1 99.7QAP. Queen Alexandra Hospital 100 100 100 100 100 99 100 99.6 99.6 99.8 99.6 100QEB. Queen Elizabeth Hospital Edgbaston 99.9 100 100 100 100 100 100 99.5 100 100 100 99.7RAD. John Radcliffe Hospital 100 100 100 100 100 100 100 81.4 100 99.9 100 97RCH. Royal Cornwall Hospital 100 100 99.6 100 100 100 99.6 99.9 99 99.1 100 99.1RDE. Royal Devon & Exeter Hospital 100 100 100 100 100 98.1 100 100 100 100 100 100RFH. Royal Free Hospital 100 100 100 100 100 96.1 100 100 100 100 100 99.4RSC. Royal Sussex County Hospital 100 100 96.5 99.8 100 99.9 93.2 98.3 100 99.7 97.5 99.2SAL. Salisbury 100 100 67.6 100 100 100 94.1 85.3 100 100 100 100SAN. Sandwell District General Hospital 100 99.8 100 100 100 98.4 100 100 100 100 100 99.8SCM. James Cook University Hospital 100 100 100 100 100 100 99.9 100 100 100 99.9 100SCU. Scunthorpe 100 100 75.8 93.3 98.4 100 83.3 59.1 92.4 98.5 100 100SGH. Southampton General Hospital 100 98.6 95.2 100 100 99.2 99.5 99.9 99.5 99.6 97.2 100SPH. St Peter's Hospital 100 100 100 100 100 100 100 100 100 100 100 97.6STH. St Thomas' Hospital 100 100 99.6 100 100 100 96.7 96.9 99.9 99.9 100 95.4STM. St Mary's Hospital Stopped PCI during 2010STO. North Staffordshire Hospital 99.6 98.6 99.7 100 100 98.1 94 97.9 97.6 98.8 65.8 99.1SUN. Sunderland Royal Hospital 100 100 100 100 100 100 100 100 100 100 100 100TOR. Torbay Hospital 100 99.7 100 100 100 99.4 100 100 100 100 100 98.8UCH. University College Hospital 100 100 96.8 99.3 100 100 99.1 93.2 99 99.6 100 94.6UHW. University Hospital <strong>of</strong> Wales 100 100 98.1 99.8 100 100 99.3 99.7 95.9 99.1 97.9 94.9VIC. Victoria Hospital 100 99.9 100 99.7 99.7 93.8 100 99.9 95.7 100 100 99.3WAL. Walsgrave Hospital 100 100 96 99.5 100 99.9 95.5 97.1 99.5 99.6 99 99.2WAT. Watford General Hospital 100 100 100 100 100 100 100 100 98.8 98.8 100 100WDH. Dorset County Hospital 100 100 92.3 100 99.8 97.2 100 100 99.4 99.2 97.2 99.2WEX. Wexham Park Hospital 100 100 100 100 100 100 100 100 100 100 100 99WHC. Whipps Cross University Hospital 100 100 96 100 100 100 100 68 99 100 100 96WHH. William Harvey Hospital 100 99.7 67.5 95.9 99.9 98.7 68.4 77.6 79.9 86.1 86.9 98.27
Hospital nameDate <strong>of</strong>birthSexMedicalhistoryPreprocedureshockProcedureurgencyVesselstreatedRenaldiseaseDiabetesDischargedateDischargestatusPCIhospitaloutcomeNHSnumberWRC. Worcestershire Royal Hospital 100 100 100 100 100 99.1 100 100 100 100 99.8 99.8WRG. Worthing Hospital 100 99.5 74.7 100 100 100 96.8 98.7 98.7 98.7 100 99.5WYT. Wythenshawe Hospital 100 100 100 100 100 100 100 100 100 100 100 99.5YDH. York District 100 100 79.4 97.2 100 75.5 93.5 92.5 94.4 97.2 98.1 100England PrivateAHM. BMI Alexandra Hospital 100 100 33.3 n/a 100 100 50 50 50 83.3 66.7 100ANT. St Anthony's Hospital 100 100 83.6 0 100 99.2 29.3 96.4 97.9 99.3 46.4 55BMI. BMI Meriden HospitalCRO. Cromwell HospitalHBP. BUPA Hospital, Hull & East RidingNo dataNo dataNo dataHHW. Wellington Hospital 100 100 89.2 97.1 100 0 0 0 100 100 100 0HSC. Harley Street Clinic 100 100 92.8 100 98.4 0 0 0 100 100 100 3.2IND. London Independent HospitalNo dataLBH. London Bridge Hospital 100 100 100 100 100 0 0 0 100 100 100 0LEB. BUPA Hospital LeedsLNH. Leeds Nuffield HospitalMHO. Manor HospitalNo dataNo dataNo dataPHB. BMI Priory Hospital 97.1 100 85.7 100 100 96.6 94.3 100 85.7 85.7 96.6 68.6PHN. BMI Park HospitalNo dataNorthern IrelandBFT. Belfast City HospitalNo dataCRG. Craigavon Area Hospital 100 100 100 100 100 100 97.3 99.9 100 99.7 100 NARVB. Royal Victoria Hospital 100 99.8 90.4 100 100 99.9 93.7 97 96.9 97.7 100 NAScotlandERI. Royal infirmary <strong>of</strong> Edinburgh 100 100 70.5 100 100 100 89.5 94 100 100 100 NAGJH. Golden Jubilee Hospital 100 100 99.6 100 100 100 99.6 99.7 100 100 95.8 NAHAI. Hairmyres HospitalNo dataNIN. Ninewells Hospital 100 100 97.5 100 100 100 100 100 99.4 100 99.4 NARAI. Raigmore Hospital 100 100 96.9 100 100 100 97.3 96.9 91.4 100 98.8 NARHH. Ross Hall HospitalNo dataRIA. Aberdeen Royal Infirmary 100 100 99.2 100 100 100 99.1 99.1 99.4 100 98.9 NAThe following hospitals started up in 2010 and were not yet connected to CCAD at time <strong>of</strong> auditALT. Altnagelvin HospitalLBP. BUPA Hospital LeicesterSSP. Spire Shawfair Park Hospital8
3InfrastructureThe number <strong>of</strong> sites performingpercutaneous coronary interventionhas increased and there has been afall in the number <strong>of</strong> sites performingangiography only. In the UK therewere a total <strong>of</strong> 114 PCI centres, and69 angiography only centres in 2010.There are data from many countriesthat suggest improved outcomes forpatients being treated in higher volumecentres, particularly those that performat least 400 procedures pa. Thisrecommendation therefore forms part <strong>of</strong>the report by the Joint Working Group onPercutaneous Coronary Intervention <strong>of</strong>the British Cardiovascular InterventionSociety and the British CardiovascularSociety entitled ‘Recommendations forgood practice and training’. 1The majority <strong>of</strong> units perform considerablygreater numbers than 400 pa. Thepercentage performing fewer than 400has risen since 2009 to 25%, and theseunits are shown in figures 1 and 2 below.In the majority <strong>of</strong> cases this is becausethe unit is new, and undertaking agradually increasing volume <strong>of</strong> work. Thestart date for the unit’s PCI program canbe seen in the figures.Queen Elizabeth Hospital Woolwich (2007)Ealing Hospital (2009)Darent Valley Hospital (2008)Frenchay Hospital (2008)Pinderfields General Hospital (2010)York District General Hospital (2010)Scunthorpe General Hospital (2010)St Mary's Hospital (program end)Salisbury District Hospital (2010)Bedford Hospital (2010)0 50 100 150 200Figure 1Centres performing fewer than 200 PCI procedures in 2010, and the start year <strong>of</strong> the PCI program for that centreWorthing Hospital (2006)Northampton General Hospital (2009)Mayday University Hospital (2006)Wigan Royal Infirmary (2007)Torbay Hospital (2004)Conquest Hospital (2007)Lincoln County Hospital (2008)Watford General Hospital (2009)Royal United Hospital Bath (2006)Royal Blackburn Hospital (2010)Wexham Park Hospital (2006)Altnagelvin Hospital (2010)Kings Mill Hospital (2008)Raigmore Hospital (2010)Eastbourne Hospital (2006)Kent and Sussex Hospital (2008)Bradford Royal Infirmary (2005)Medway Maritime Hospital (2010)Whipps Cross University Hospital (2005)0 50 100 150 200 250 300 350 400Figure 2Centres performing between 200 and 400 PCI procedures in 2010, and the start year <strong>of</strong> the PCI program for that centre9
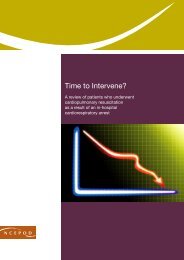
4PCI rates in the United KingdomA total <strong>of</strong> 87,676 PCIs were performed inthe calendar year 2010, this represents arate <strong>of</strong> 1,407 PCI pmp (figure 3).The most appropriate rate <strong>of</strong> PCI pmpis difficult to judge and is dependenton many factors, including the varyingdemographic pr<strong>of</strong>iles <strong>of</strong> populations indifferent countries. While the rate <strong>of</strong> PCIpmp in the UK has, historically, beenconsiderably lower than most otherEuropean countries, there have beensteady increases in activity, and the rate<strong>of</strong> increase in the last year, 7.6%, hasbeen the largest seen for over four years.There remain large differences in PCIrates between the countries <strong>of</strong> the UK,with the lowest in Wales at 1,112 pmp.Wales has also seen a reduction in PCIrates compared with 2009, whereas inall other countries there has been anincrease, with the highest provision inNorthern Ireland at 1,769 pmp (figure 4).There has been a further increase in theuse <strong>of</strong> PPCI in place <strong>of</strong> thrombolysis totreat patients presenting with STEMI.As with overall PCI rates, there aredifferences in the provision <strong>of</strong> primaryPCI between the UK countries, withWales again having the lowest ratespmp (figure 5). The growth in the use <strong>of</strong>PPCI in the UK is extremely fast, and ifall patients with STEMI were treated byPPCI we might expect approximately 500to 700 PPCI pmp.Of the 97 NHS PCI centres, 74 <strong>of</strong>feredPPCI as a treatment for STEMI duringworking hours in 2010, and 52 <strong>of</strong>feredthis service at all hours every day. A mapshowing the distribution <strong>of</strong> this activityacross the UK is given in figure 6.20001000001800PCI per million87,676900001600PCI procedures80000PCI per million140012001000800600400200017420322725630419911992199319941995Figure 3Absolute number <strong>of</strong> PCIs and rates (pmp) for 2010 in the UK35940243749459066419961997199819992000200120022003759894105014071308 13451269121611652004200520062007200820092010700006000050000400003000020000100000PCI procedure numbers10
1800England Scotland N. IrelandWales17691600140014011510PCI per million population12001000800600400111220002000200120022003200420052006200720082009201020002001Figure 4PCI activity per million population in the countries <strong>of</strong> the UK2002200320042005200620072008200920102000200120022003200420052006200720082009201020002001200220032004200520062007200820092010350England Scotland Wales UK Total300302270287PCI per million population250200150100156.2229.8 226.2181115.911115022150020072008200920102007200820092010Figure 5Rates <strong>of</strong> primary PCI activity for STEMI, per million population in the countries <strong>of</strong> the UK46.8200720082009201020082009201011
No PPCIPPCI day onlyPPCI 24/7Figure 6Availability <strong>of</strong> PPCI in the UK, based on those centres submitting data in 201012
7Arterial access routeWhen performing coronary interventioncatheters are introduced to the patient’sarterial system so the coronary arteriescan be reached and treated. Initialaccess to the coronary arteries wastraditionally achieved using the femoralartery at the top <strong>of</strong> the leg. However,some <strong>of</strong> the commonest complicationsafter PCI relate to the difficulty in stoppingthis artery from bleeding after removing theequipment at the end <strong>of</strong> the procedure.As PCI equipment has become smaller,it has been possible to perform almostall PCI from the radial artery at the wrist.Robust data shows this is associated witha reduction in complication rate; it is easierto stop any bleeding, and there are fewernearby structures that can be damaged.There are particular methods needed touse the radial artery. Therefore, training isneeded for those only familiar with the femoralapproach. Nevertheless there has been anincreasing adoption <strong>of</strong> this method which isnow used for more than half <strong>of</strong> all proceduresas can be seen from figure 10. The hoped forreduction in complication rates does appearto be borne out (figure 11).100% cases using radial accessFigure 10The increasing adoption <strong>of</strong>the radial artery as accesssite for PCI in the UK80604020050.942.834.6128.121.315.710.22004 2005 2006 2007 2008 2009 20101.21.01.10.90.971Access site complications assessed up to time <strong>of</strong> discharge:• False aneurysm• Haemorrhage (retroperitoneal, delay discharge, surgery)• Arterial occlusion/dissection• Any need for surgery0.8% <strong>of</strong> all cases0.60.40.60.50.430.43Figure 11Access site complicationrates in PCI using femoralaccess versus radial access0.202007 2008 2009 2010 2007 2008 2009 2010FemoralRadial15
8OutcomeThe complications from PCI haveprogressively fallen as techniques haveevolved. Nevertheless, this has alsomeant the procedure can be <strong>of</strong>fered topatients who are considerably sicker, andin whom a higher risk <strong>of</strong> complicationsis expected. The rate <strong>of</strong> requirement foremergency coronary artery bypass graft(CABG) remains very low at less than 1%.The overall rate <strong>of</strong> death before dischargefrom hospital following PCI has, however,gradually increased over the past few years.Patients are treated by PCI for a number <strong>of</strong>reasons. The mortality risk for each <strong>of</strong> themajor reasons for PCI treatment shows thatthe outcome for each <strong>of</strong> these remainedstable (figure 12).The increase in overall mortality is due toan increasing proportion <strong>of</strong> sicker patientsbeing treated by PCI. This change in casemix is driven by the increasing use <strong>of</strong>emergency PCI to treat STEMI, (known asprimary PCI) (figure 13).654.44.9Mortality (%)4321.610200320042005200620072008200920102003200420052006200720082009All Elective Unstable angina/NSTEMI Primary PCI RescueFigure 12Mortality following PCI according to presenting clinical syndrome0.14201020032004200520062007200820090.61201020032004200520062007200820092010200320042005200620072008200920102000019469178671500016Number <strong>of</strong> PCIs10000500002001200220032004Figure 13Increase in primary PCI2005200620072008200920102001200220032004200520062007200820092010All STEMI Primary PCI Rescue20012002200320042005200620072008200916022010
Overall, the percentage <strong>of</strong> PCI for STEMIhas doubled over the last four years; thepercentage <strong>of</strong> patients with stable anginahas decreased from approximately 50%to 40%, while those with Non ST elevationacute coronary syndromes has remainedlevel at approximately 38% (Figure 14).This analysis clearly demonstrates theimportance <strong>of</strong> risk adjustment in theassessment <strong>of</strong> outcome to help avoidmisleading conclusions. To assess theperformance <strong>of</strong> all UK units PCI centres,the outcome data for a 3 year period(2008, 2009 and 2010 data combined)were analysed. The North West QualityImprovement Program (NQWIP) 5 modelwas used to adjust for varied case mix.The results <strong>of</strong> this analysis are shown infigure 15.100%10.9613.2416.3120.2524.2STEMINSTEMI/UA80%StableOther60%37.840.4837.9538.337.740%20%50.0745.1 44.3839.836.2Figure 14Changing case mix0%2006 2007 2008 2009 20104.0Risk adjusted MACCE (%)3.53.02.52.01.51.00.5Each point represents the risk adjusted MACCE for each unit,this is calculated from:Observed MACCE <strong>of</strong> each unitUK Mean MACCE rate xPredicted MACCE <strong>of</strong> each unit+3 SD-3 SD00 1000 2000 3000 4000 5000 6000 7000 8000 9000 10000Total number <strong>of</strong> PCIs performedFigure 15Risk adjusted major adverse cardiac and cerebrovascular events (MACCE) for each UK unit17
All models have limitations and thesesorts <strong>of</strong> results must be interpretedwith caution. The results are not onlydependent on the risk model butalso on the accuracy <strong>of</strong> data entry; apatient’s risk factors, as well as theadverse outcomes must be recordedand captured correctly. In addition,when comparing a large number<strong>of</strong> observations, statistical variationmay cause units to appear to beoutliers when their performance isactually satisfactory. Finally, althoughgrouping all units into a single plotmakes assessment easier, units thatunder report adverse outcomes willtend to cause the entire funnel to shiftto lower major adverse cardiac andcerebrovascular events (MACCE) values.This, potentially, incorrectly exposesunits with higher reported MACCE whoare performing well and are carefulto make sure all complications areaccurately reported.This funnel plot appears to show threeunits performing statistically less wellthan would have been predicted bythe risk model. Closer analysis <strong>of</strong> theindividual units was performed. In two,cumulative funnel plots demonstratedthat they were in fact performing asexpected. In the third mistakes indata entry were identified (incorrectreporting <strong>of</strong> complications that did notoccur).To attempt to avoid under reporting <strong>of</strong>adverse outcomes we plan to use amortality only model, with the data linkedto Medical Research Information Service(MRIS) to validate outcomes.Mortality tracking has been used inthis audit to assess the outcomes<strong>of</strong> relatively homogenous groups <strong>of</strong>patients. For example, the validated 30day mortality <strong>of</strong> all patients treated byPPCI for STEMI is shown in the funnelplot figure 16. In this figure, each unitis represented by a point on the graphaccording to the total number <strong>of</strong> primaryPCI procedures performed against their30 day mortality. No unit has a mortalityabove the 3 significant difference (SD)line, suggesting that no unit’s outcomesare statistically significantly worse thanthe average.3025BETTER% mortality at 30 days2015103 SD2 SDMean55.7%00100 200 300 400 500 600 700 800 900 1000Number <strong>of</strong> PPCI proceduresFigure 16Independently validated 30 day mortality following primary PCIincludes shock and ventilation (England and Wales only)18
9Delays to treatmentIn the treatment <strong>of</strong> STEMI by PCI, anydelay in the performance <strong>of</strong> PCI isassociated with a worse outcome forthe patient. There are two importantprocedural measures:• The time the patient calls for helpto the time <strong>of</strong> PCI treatment (call toballoon time) measures the entireprocess <strong>of</strong> care.• The time a patient arrives at a PCIcentre to the time <strong>of</strong> PCI treatment(door to balloon time) which assesseshow quickly the PCI unit can respondto the emergency.There are two routes into a PCI centrefor emegency PCI:• The patient is brought directly tothe centre by ambulance.• The patient is transferred from ahospital not capable <strong>of</strong> performingPCI to the centre that performs thePCI. This is known as interhospitaltransfer (IHT).The transfer process engendersadditional delays as can be seen inthe overall summary data in figure 17.A strategy to try to avoid interhospitaltransfers results in quicker and thereforebetter treatment. Figure 18 shows itsaves approximately 50 minutes <strong>of</strong> delay.The units that have performed more than5 primary PCIs during 2010 and theircodes are shown in table 3.The percentage <strong>of</strong> cases treated withintarget times by each PCI centre arepresented in figures 19 and 20.1009080Call to balloon time < 150 min (%) Door to balloon time < 90 min (%)94.392.285.1 86.987.985.681.378.87060BETTER504045.14830201002008200920102009201020082009201020092010Direct Interhospital transfer Direct Interhospital transferFigure 17Average time delays to emergency treatment in patients admitted to PCI centres directlyversus transferred from another hospital to the PCI centre19
250BETTERMedian CTB min (+/- IQR)20015010050106 105161154114 1120Direct2009Direct2010IHT2009Figure 18Median CTB times by admission route, direct to PCI centre or by IHTIHT2010All2009All2010Table 3Units performing > 5 primary PCI procedures in 2010AEI. Royal Albert Edward Infirmary GJH. Golden Jubilee Hospital PMS. The Great Western HospitalAHM. BMI Alexandra Hospital GRL. Glenfield Hospital QAP. Queen Alexandra HospitalAMG. Wycombe General Hospital GWH. Queen Elizabeth Hospital, Woolwich QEB. Queen Elizabeth Hospital EdgbastonANT. St Anthony’s Hospital HAM. Hammersmith Hospital RAD. John Radcliffe HospitalBAL. Barts and the London HH. Harefield Hospital RAI. Raigmore HospitalBAS. Basildon Hospital HHW. Wellington Hospital RCH. Royal Cornwall HospitalBAT. Royal United Hospital Bath HSC. Harley Street Clinic RDE. Royal Devon & Exeter HospitalBHH. Rochdale Infirmary KCH. King’s College Hospital RFH. Royal Free HospitalBHL. Liverpool Heart and Chest Hospital KGH. Kettering General Hospital RIA. Aberdeen Royal InfirmaryBHR. Royal Berkshire Hospital KMH. Kings Mill Hospital RSC. Royal Sussex County HospitalBOU. Royal Bournemouth General Hospital KSX. Kent & Sussex Hospital RVB. Royal Victoria HospitalBRD. Bradford Royal Infirmary LBH. London Bridge Hospital SAN. Sandwell District General HospitalBRI. Bristol Royal Infirmary LGI. Yorkshire Heart Centre SCM. James Cook University HospitalCGH. Conquest Hospital LIN. Lincoln County Hospital SGH. Southampton General HospitalCHG. Cheltenham General Hospital LIS. Lister Hospital SPH. St Peter’s HospitalCHH. Castle Hill Hospital MAY. Mayday University Hospital STH. St Thomas’ HospitalCHN. Nottingham City Hospital MDW. Medway Maritime Hospital STO. North Staffordshire HospitalCLW. Glan Clwyd DGH Trust MOR. Morriston Hospital SUN. Sunderland Royal HospitalCRG. Craigavon Area Hospital MPH. Taunton & Somerset TOR. Torbay HospitalDER. Derby Royal Infirmary MRI. Manchester Royal Infirmary UCH. University College HospitalDGE. Eastbourne DGH NCR. New Cross Hospital UHW. University Hospital <strong>of</strong> WalesDUD. City Hospital NGS. Northern General Hospital VIC. Victoria HospitalDVH. Darent Valley Hospital NHB. Royal Brompton Hospital WAL. Walsgrave HospitalEAL. Ealing Hospital NHH. North Hampshire Hospital WAT. Watford General HospitalEBH. Birmingham Heartlands Hospital NIN. Ninewells Hospital WDH. Dorset County HospitalERI. Royal Infirmary <strong>of</strong> Edinburgh NOR. Norfolk & Norwich Hospital WEX. Wexham Park HospitalESU. East Surrey Hospital NPH. Northwick Park Hospital WHC. Whipps Cross University HospitalFRE. Freeman Hospital NTH. Northampton General Hospital WHH. William Harvey HospitalFRM. Frimley Park Hospital PAP. Papworth Hospital WRC. Worcestershire Royal HospitalFRY. Frenchay Hospital PHB. BMI Priory Hospital WRG. Worthing HospitalGEO. St George’s Hospital PLY. Derriford Hospital WYT. Wythenshawe Hospital20
100SPHBETTER% CTB
10The futureIn addition to annual analysis <strong>of</strong> theBCIS audit data, reports <strong>of</strong> speed <strong>of</strong>treatment <strong>of</strong> patients with STEMI are sentto each PCI centre monthly. Reports <strong>of</strong>risk adjusted outcomes for each unit aresent to each unit every three months.We have developed an informationgovernance framework that will allowthe BCIS audit dataset to be analysedin more detail so that it can be usedto answer more complex audit andresearch questions, and we hope tosee the output from these investigationsin the near future.Links with the MINAP audit will bestrengthened, including work on ajoint dataset so that data from bothaudits can be combined to enhancethe completeness <strong>of</strong> the descriptionand measurement <strong>of</strong> patient care.22
11GlossaryAbbreviations in alphabetical orderBCS:BCIS:CABG:CCAD:CTB:DES:DTB:IHT:MINAP:NICE:British Cardiovascular SocietyBritish Cardiovascular Intervention SocietyCoronary artery bypass surgeryCentral Cardiac <strong>Audit</strong> DatabaseCall to balloon timeDrug eluting stentDoor to balloon timeInter hospital transferMyocardial Ischaemia <strong>National</strong> <strong>Audit</strong> Project<strong>National</strong> institute for health and Clinical ExcellenceNICOR: <strong>National</strong> Institute <strong>of</strong> Cardiovascular Outcomes ResearchNSTEMI: Non ST elevation myocardial infarctionPA:PCI:PMP:SD:STEMI:UK:Per annumPercutaneous coronary interventionper million populationStandard deviationST elevation myocardial infarctionUnited Kingdom24
12References(1) Dawkins KD, Gershlick T, de BM et al.Percutaneous coronary intervention: recommendations forgood practice and training. Heart 2005; 91 Suppl 6:vi1-27.(2) Ischaemic Heart Disease – Coronary Artery Stents.NICE Guidance 2003;TA 71.(3) Drug-eluting stents for the treatment <strong>of</strong> coronary arterydisease. NICE Guidance 2008; TA 152.(4) Doshi SN, Ludman PF, Townend JN, Buller N.Estimated annual requirement for drug eluting stents in alarge tertiary referal centre, according to new NICE criteria.Heart 2004; 90(Suppl II): A41.(5) Grayson AD, Moore RK, Jackson M et al.Multivariate prediction <strong>of</strong> major adverse cardiac eventsafter 9914 percutaneous coronary interventions in the northwest <strong>of</strong> England. Heart 2006; 92(5): 658–663.25