The agency work industry around the world - Eurociett
The agency work industry around the world - Eurociett
The agency work industry around the world - Eurociett

You also want an ePaper? Increase the reach of your titles
YUMPU automatically turns print PDFs into web optimized ePapers that Google loves.
assignment to <strong>the</strong> next. In addition,<strong>agency</strong> prepared <strong>the</strong> ground for ajob-creating economic upturn, helpingcompanies face <strong>the</strong> ongoing globalcompetitive pressure, increasing labourmarket participation, and fur<strong>the</strong>rmore,accelerating and increasing <strong>the</strong> numberof jobs created as <strong>the</strong> economyrecovers.Now more than ever, <strong>the</strong> <strong>agency</strong> <strong>work</strong><strong>industry</strong> plays a key role in improving<strong>the</strong> functioning of <strong>the</strong> labour market,by facilitating a better and faster matchbetween supply and demand of labour,by securing upwards transitions for<strong>agency</strong> <strong>work</strong>ers, and by providing more<strong>work</strong> opportunities for more people.5
Content1. <strong>The</strong> players 112. Agency <strong>work</strong> and <strong>the</strong> economic recovery 193. Agency <strong>work</strong>ers in numbers 194. <strong>The</strong> profile of <strong>agency</strong> <strong>work</strong>ers 28a. General trendsb. Inclusion and diversity7
<strong>The</strong> key facts & figures<strong>The</strong> players• <strong>The</strong>re are 128,000 private employmentagencies 3 and 176,000 branches 4<strong>world</strong>wide, employing 908,000 internalstaff• In 2010 <strong>the</strong> total annual sales revenues of<strong>the</strong> top 10 private employment agencies<strong>world</strong>wide accounted for 28% of <strong>the</strong> total<strong>agency</strong> <strong>work</strong> market• <strong>The</strong> USA is <strong>the</strong> <strong>world</strong> leader with 27%• In 2010 <strong>the</strong> global total annual salesof total annual sales. Japan representsrevenues amounted to €247 billion 5 19% of <strong>the</strong> global <strong>agency</strong> <strong>work</strong> market,followed by <strong>the</strong> UK at 9%• Europe is <strong>the</strong> leading regional entity bytotal annual sales revenues, accountingfor 38% of global total annual salesrevenuesAgency <strong>work</strong>ersin numbers• 10.4 million <strong>agency</strong> <strong>work</strong>ers in full-timeequivalents were employed by privateemployment agencies across <strong>the</strong> globein 2010 6• <strong>The</strong> <strong>agency</strong> <strong>work</strong> penetration rate is 1.5%in Japan and 1.6% in Europe 7 and 1.8% in<strong>the</strong> USA• On average <strong>agency</strong> <strong>work</strong>ers <strong>work</strong><strong>around</strong> half as many hours as full-timepermanent employees 8• Most <strong>agency</strong> <strong>work</strong> assignments are morethan one month long8
<strong>The</strong> profile of <strong>agency</strong> <strong>work</strong>ers• On average, 57% of <strong>agency</strong> <strong>work</strong>ers inEurope are aged less than 30 9 comparedwith 55% outside Europe 10• 77% <strong>agency</strong> <strong>work</strong>ers have at best finished<strong>the</strong>ir secondary education 11• Agency <strong>work</strong>ers <strong>work</strong> in a wide rangeof sectors represented most strongly inservices and manufacturingAgency <strong>work</strong> and <strong>the</strong> economicrecovery• Agency <strong>work</strong> is a bellwe<strong>the</strong>r of <strong>the</strong>economic situation• <strong>The</strong> private employment <strong>agency</strong> <strong>industry</strong>has rebounded sharply since <strong>the</strong>recession but <strong>industry</strong> growth has slowed3. based on data from 37 countries4. based on data from 29 countries5. based on data from 34 countries6. based on data from 43 countries7. based on data from 29 countries. If Russia is included in calculations,penetration rate for Europe would be 1.2%8. based on data from 29 countries9. based on data from 17 countries10. based on data from 9 countries11. based on data from 19 countries9
1. <strong>The</strong> players• <strong>The</strong>re are 128,000 private employment agencies 12and 176,000 branches 13 <strong>world</strong>wide, employing908,000 internal staff 14• In 2010 <strong>the</strong> total annual sales revenues of <strong>the</strong>top 10 private employment agencies <strong>world</strong>wideaccounted for 28% of <strong>the</strong> total <strong>agency</strong> <strong>work</strong> market• In 2010 <strong>the</strong> global total annual sales revenuesamounted to €247 billion 15• <strong>The</strong> USA is <strong>the</strong> <strong>world</strong> leader with 27% of totalannual sales. Japan represents 19% of <strong>the</strong> global<strong>agency</strong> <strong>work</strong> market, followed by <strong>the</strong> UK at 9%• Europe is <strong>the</strong> leading regional entity by totalannual sales revenues, accounting for 38% ofglobal total annual sales revenues12. based on data from 37 countries13. based on data from 29 countries14. based on data from 34 countries15. based on data from 35 countries11
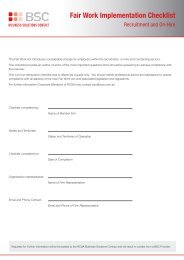
<strong>The</strong>re are 128,000 privateemployment agencies...In 2010 <strong>the</strong>re was a recorded128,000 private employmentagencies globally 16 . <strong>The</strong> Asia/Pacificregion accounts for 57% of all privateemployment agencies (PrEAs).Europe accounts for 26% of all PrEAs,with North America for accountingfor 12%. China, Japan and <strong>the</strong> USAare <strong>the</strong> top three countries in termsof number of PrEAs, accountingcollectively for 65% of all agencies<strong>world</strong>wide. As recognised by <strong>the</strong> ILO:“Private employment agencies playan important role in <strong>the</strong> functioningof contemporary labour markets.For <strong>the</strong> past three decades, <strong>the</strong>increasing need to provide <strong>work</strong>ersand services to a rapidly growingand flexible labour market has ledto <strong>the</strong> spectacular development of<strong>the</strong>se agencies.”*ChinaJapanUSAUKGermanyAustraliaNe<strong>the</strong>rlandsSouth AfricaPolandBrazilCzech RepublicSouth Korea*DenmarkFranceAustriaColombiaMexicoHungary*CanadaNorwaySwedenFinland*Slovenia*SpainPortugalChilePeruBelgiumSlovakia*Romania*ArgentinaItalyLuxembourg*LithuaniaEstoniaMacedonia*Greece6,0493,5003,2603,1502,9981,7721,6501,4191,3471,2001,2007167006676506005004503553502651881701421291299070413030279Number of private employment agencies**13,91011,50020,0000 10,000 20,000 30,000 40,000 50,000 60,00049,000* ILO - Private employment agencies, temporary <strong>agency</strong> <strong>work</strong>ersand <strong>the</strong>ir contribution to <strong>the</strong> labour market | 20091216. Based on data from 37 countriesSource: Ciett national federations 2010*Source: Ciett national federations 2009**Based on figures from 37 countries
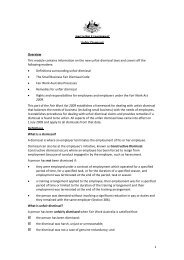
In 2010, <strong>the</strong> USA and Japan are global <strong>agency</strong> <strong>work</strong>market leaders by total annual sales revenuesIn 2010, <strong>the</strong> global market for Agency<strong>work</strong> accounted for 247 billionEuros. <strong>The</strong> USA is <strong>the</strong> <strong>world</strong> leaderwith 27% of global annual sales. <strong>The</strong>Japan represents 19% of <strong>the</strong> global<strong>agency</strong> <strong>work</strong> market. <strong>The</strong> UK remains<strong>the</strong> third largest market <strong>world</strong>widewith 9% of global total annual salesrevenues. Europe accounts for 38%of global total annual sales revenues,North America for 29% and Asia/Pacific for 26%.Percentage of total annual sales revenues in 2010UK 9%France 7%Rest of World18%Japan 19%Germany 6%USA 27%Australia 5%Ne<strong>the</strong>rlands 4%Brazil 3%16
Agency <strong>work</strong> continues to displaya relationship with GDP growth<strong>The</strong> use of <strong>agency</strong> <strong>work</strong> echoes <strong>the</strong>behaviour of <strong>the</strong> general economy.Various studies have confirmed that<strong>the</strong>re is a direct correlation betweenvariations in GDP and <strong>the</strong> level of useof <strong>agency</strong> <strong>work</strong>. In years of growth,<strong>the</strong> supply and demand of <strong>agency</strong><strong>work</strong>ers increase proportionally,and diminish when <strong>the</strong> economyfalters. As a precise indicator of <strong>the</strong>economic situation, <strong>the</strong> evolutionof <strong>the</strong> <strong>agency</strong> <strong>work</strong> <strong>industry</strong> is<strong>the</strong>refore monitored as such, asprivate employment agencies are<strong>the</strong> first impacted by <strong>the</strong> crisis.30%20%10%0%-10%-20%Evolution of number of hours <strong>work</strong>ed by <strong>agency</strong> <strong>work</strong>ers (year on year)versus EU 27 GDP growth rate (year on year)6%4%2%0%-2%-4%-30%-6%Q1-08 Q2-08 Q3-08 Q4-08 Q1-09 Q2-09 Q3-09 Q4-09 Q1-10 Q2-10 Q3-10 Q4-10 Q1-11 Q2-11 Q3-11Change in hours <strong>work</strong>ed (European average)Growth rate of GDP volume18Note: <strong>The</strong> weighted European Average is <strong>the</strong> year on year change of <strong>agency</strong> <strong>work</strong>ers in full-time equivalent employment on a daily basis (except where notedo<strong>the</strong>rwise). <strong>The</strong> weighted average determined by <strong>the</strong> surveyed countries share of <strong>the</strong> European <strong>agency</strong> <strong>work</strong> market in 2009. <strong>The</strong> countries contributing to<strong>the</strong> weighted European Average account for 58% of <strong>the</strong> <strong>agency</strong> <strong>work</strong> market in Europe. <strong>The</strong> EU average is calculated by adding <strong>the</strong> individual country figuresmultiplied by <strong>the</strong>ir percentage of <strong>the</strong> <strong>agency</strong> <strong>work</strong> <strong>industry</strong> in Europe, <strong>the</strong>n scaling <strong>the</strong> figures to one hundred percent.
Agency <strong>work</strong> is a bellwea<strong>the</strong>rfor <strong>the</strong> economic environmentIn October, EU 27 unemploymentlevels rose by +2.4% compared with<strong>the</strong> same period in 2010. At <strong>the</strong> sametime <strong>agency</strong> <strong>work</strong> posted a +1.1% risein hours <strong>work</strong>ed.From <strong>the</strong> beginning of <strong>the</strong> timeseries in 2008, an inverse relationshipbetween unemployment levels in<strong>the</strong> EU and <strong>the</strong> amount of <strong>agency</strong><strong>work</strong> being carried out is on display.Recent months have shown <strong>the</strong>growth of <strong>the</strong> <strong>agency</strong> <strong>work</strong> <strong>industry</strong>to have slowed considerably, whileat <strong>the</strong> same time year on yearunemployment levels have began torise again.40%30%20%10%0%-10%-20%-30%-40%Evolution of <strong>the</strong> number of hours <strong>work</strong>ed by <strong>agency</strong> <strong>work</strong>ers (year on year)versus average EU 27 unemployment change (year on year)Jan Feb Mar Apr May Jun Jul Aug Sep Oct Nov Dec Jan Feb Mar Apr May Jun Jul Aug Sep Oct Nov Dec Jan Feb Mar Apr May Jun Jul Aug Sep Oct Jan Feb Mar Apr May Jun Jul Aug Sep Oct08 08 08 08 08 08 08 08 08 08 08 08 09 09 09 09 09 09 09 09 09 09 09 09 10 10 10 10 10 10 10 10 10 10 11 11 11 11 11 11 11 11 11 11Germany’s <strong>agency</strong> <strong>work</strong> <strong>industry</strong>began to grow again as early as May2009 and in July 2010, <strong>the</strong> German<strong>agency</strong> <strong>work</strong> <strong>industry</strong> returned topre-crisis levels of employment.20Changes in hours <strong>work</strong>ed (European Average) Y-O-Y Change in unemployment (EU 27)This can be partly attributed toGermany obtaining more appropriateregulations later than in o<strong>the</strong>rEuropean countries.
<strong>The</strong> American <strong>agency</strong> <strong>work</strong> market beganto recover earlier than <strong>the</strong> <strong>industry</strong> in EuropeAgency <strong>work</strong>and <strong>the</strong> economic recoveryAmerican economic activitymeasured by employment peakedin December 2007. Since <strong>the</strong>n, ithas lost jobs until mid 2009 whenit began to grow again. But eventhough <strong>the</strong> decline in <strong>agency</strong> <strong>work</strong>occurred later, it rapidly outpacedthat of <strong>the</strong> American <strong>work</strong>forceat large, as it played its role ofbuffer, cushioning <strong>the</strong> impact onpermanent staff. <strong>The</strong> sustainedrecovery of <strong>the</strong> <strong>industry</strong> points thatin <strong>the</strong> economic recovery, <strong>agency</strong><strong>work</strong>ers are among <strong>the</strong> first to behired.15.00%10.00%5.00%0.00%-5.00%-10.00%-15.00%US staffing employment index since 2006120110100908070-20.00%606/18/2006 6/18/2007 6/18/2008 6/18/2009 6/18/2010 6/18/2011Week-to-Week Change ASA Staffing Index (Set at 100 on 6/12/2006)21
3. Agency <strong>work</strong>ers in numbers• 10.4 million <strong>agency</strong> <strong>work</strong>ers in full-timeequivalents were employed by privateemployment agencies across <strong>the</strong> globe in2010• <strong>The</strong> <strong>agency</strong> <strong>work</strong> penetration rate is 1.5% inJapan and 1.6% in Europe and 1.8% in <strong>the</strong> USA• On average <strong>agency</strong> <strong>work</strong>ers <strong>work</strong> nearly halfas much as full-time permanent employees• Most <strong>agency</strong> <strong>work</strong> assignments are morethan one month long22
10.4 million <strong>agency</strong> <strong>work</strong>erswere employed daily in 2010 20In 2010 <strong>the</strong> total number of <strong>agency</strong><strong>work</strong>ers <strong>world</strong>wide amounted to10.4 million in full-time equivalents 21 .Europe accounts for 35%, NorthAmerica for 25%, and <strong>the</strong> Asia/Pacificregion for 13%.<strong>The</strong> USA employs nearly as many<strong>agency</strong> <strong>work</strong>ers in full-timeequivalents [2.58 million] than <strong>the</strong>second and third biggest suppliersof <strong>agency</strong> <strong>work</strong>ers combined.South Africa has <strong>the</strong> second highestnumber of <strong>agency</strong> <strong>work</strong>ers in fulltimeequivalents [967,000], aheadof Brazil [965,000], Japan [960,000]and <strong>the</strong> UK [860,000], (UK figuresare representative of <strong>the</strong> 2009/2010financial year). Toge<strong>the</strong>r, <strong>the</strong> USA,South Africa, and Brazil account for44% of all <strong>agency</strong> <strong>work</strong>ers assigned<strong>world</strong>wide.24USASouth AfricaBrazilJapanUKGermanyFranceColombiaAustraliaNe<strong>the</strong>rlandsItalyMexicoPolandCanadaSouth KoreaSpainPortugal*PeruBelgiumHungary*SwitzerlandAustriaArgentinaRussia*SwedenRomania*Macedonia*Slovenia *IrelandCzech RepublicChileNorwayFinlandDenmarkSlovakia*Uruguay*Bulgaria*New ZealandGreeceLuxembourg*EstoniaLatviaLithuania308,250208,000197,000132,350114,00099,00090,68287,00087,00085,00081,84868,00068,00066,00063,00062,00060,00050,00048,95948,00035,00032,00031,68921,81121,64921,22718,50016,2378,0007,5675,0004,3003,0002,5002,11020. based on data from 43 countries21. ibidDaily average number of <strong>agency</strong> <strong>work</strong>ers (FTE)520,000514,190967,000965,000960,000880,000793,0002,584,000Source: Ciett National Federations*Source: Ciett estimate**Based on figures from 43 Countries
Evolution of <strong>the</strong> numberof <strong>agency</strong> <strong>work</strong>ers in Europe [FTE]Agency <strong>work</strong>ersin numbersIn <strong>the</strong> last fifteen years, <strong>the</strong> numberof <strong>agency</strong> <strong>work</strong>ers in Europe hasgreatly increased, partially as a resultof more appropriate regulationbeing put in place in formerly tightlyregulated labour markets, notablyin Italy, Germany, and <strong>the</strong> Nordiccountries, and <strong>the</strong> opening up ofnew markets in Central and EasternEurope.It is important to note that wi<strong>the</strong>ach passing year <strong>the</strong> level ofinformation available on <strong>the</strong> numberof <strong>agency</strong> <strong>work</strong>ers has improvedleading to more countries beingrepresented. Care should be takento only make direct comparisonsto previous years where data isavailable.* Denotes Ciett estimate based on <strong>the</strong> overall evolution ofcomparable markets between 2009 and 2010 of 8.52%**Denotes Eurostat estimate (Nace code 78.2)Evolution of <strong>agency</strong> <strong>work</strong> penetration in Europe1996 1997 1998 1999 2000 2001 2002 2003 2004 2005 2006 2007 2008 2009 2010Austria 0,4% 0,5% 0,6% 0,7% 0,8% 0,9% 0,8% 1,0%w 1,2% 1,2% 1,5% 1,6% 1,6% 1,4% 1,6%Belgium 1,2% 1,3% 1,6% 1,6% 1,7% 1,7% 1,6% 1,6% 1,8% 1,8% 2,1% 2,2% 2,1% 1,6% 1,9%Bulgaria - - - - - - - - - - - - 0,1% 0,2% 0,3%*Czech Republic - - - - - - - - - - - - 0,7% 0,7% 0,7%Denmark 0,2% 0,2% 0,3% 0,3% 0,3% 0,4% 0,4% 0,4% 0,5% 0,6% 0,7% 0,7% 0,7% 0,7% 0,8%Estonia 0,5%* 0,5%Finland 0,4% 0,4% 0,4% 0,3% 0,4% 0,5% 0,4% 0,5% 0,6% 0,7% 0,7% 1,1% 1,3% 0,8% 0,9%France 1,3% 1,6% 2,0% 2,2% 2,5% 2,5% 2,3% 2,2% 2,3% 2,3% 2,4% 2,5% 2,3% 1,7% 2,0%Germany 0,5% 0,6% 0,7% 0,7% 0,9% 0,9% 0,9% 0,9% 1,1% 1,2% 1,5% 1,9% 1,9% 1,6% 2,0%Greece - - - - - - - - - - - 0,2% 0,0% 0,1% 0,1%Hungary - - - - - - 0,8% 1,0% 1,3% 1,4% 1,4% 1,4% 1,4% 1,2% 1,8%*Ireland 0,2% 0,3% 0,6% 0,6% 1,5% 1,4% 1,4% 1,4% 1,3% 1,3% 1,5% 1,7% 1,7% 0,9% 1,9%Italy - - 0,0% 0,1% 0,3% 0,3% 0,4% 0,6% 0,7% 0,7% 0,8% 1,0% 0,9% 0,7% 0,9%Latvia 0,2%* 0,3%*Lithuania 0,2%* 0,2%*Luxembourg 1,2% 1,2% 1,2% 1,7% 2,2% 2,1% 2,1% 2,1% 2,1% 2,0% 2,5% 2,4% 1,9% 1,9% 1,9%Macedonia - - - - - - - - - - 0,4% 0,3% 0,3% 0,8% 0,8%*Ne<strong>the</strong>rlands 2,1% 2,2% 2,4% 2,4% 2,3% 2,2% 2,1% 1,9% 1,9% 2,2% 2,5% 2,8% 2,9% 2,4% 2,5%Norway 0,3% 0,4% 0,5% 0,5% 0,5% 0,5% 0,5% 0,4% 0,5% 0,6% 1,0% 1,0% 1,0% 0,8% 0,9%Poland - - - - - - - 0,1% 0,2% 0,2% 0,2% 0,4% 0,5% 0,5% 0,7%Portugal 0,6% 0,6% 0,7% 0,9% 0,9% 0,9% 0,9% 0,9% 0,9% 0,9% 0,9% 0,9% 1,6%** 1,6%** 1,7%*Romania - - - - - - - - - - - - 0,3% 0,3% 0,5%Russia 0,1%” 0,1%”Slovakia - - - - - - - - - - - - 0,6% 0,6% 0,8%*Slovenia - - - - - - - - - - - - 0,3% 0,3% 0,5%*Spain 0,5% 0,7% 0,8% 0,9% 0,7% 0,7% 0,6% 0,6% 0,7% 0,7% 0,7% 0,8% 0,6% 0,4% 0,5%Sweden 0,2% 0,3% 0,4% 0,6% 1,0% 0,9% 0,8% 0,7% 0,7% 0,7% 0,8% 1,3% 1,3% 1,0% 1,3%Switzerland 0,6% 0,6% 0,8% 0,9% 1,0% 1,0% 0,9% 0,9% 1,0% 1,2% 1,5% 1,7% 1,7% 1,4% 1,6%UK 2,6% 2,9% 2,6% 2,8% 3,7% 3,7% 3,7% 3,9% 4,1% 4,2% 4,3% 4,7% 4,1% 3,7% 3,0%Source: Ciett national federations*Source: Ciett estimate**Source: Eurostat (Nace Code 78.2)25
Agency <strong>work</strong> nears its 2008 highin 2010 throughout EuropeAcross Europe, <strong>the</strong> penetrationrate for <strong>agency</strong> <strong>work</strong> rose. Germanywith a penetration rate of 2% andSweden with 1.3% are notable forhaving reached all time highs for<strong>agency</strong> <strong>work</strong> penetration. <strong>The</strong> fall inpenetration rate in <strong>the</strong> UK to 3.0% canbe attributed data <strong>the</strong>re referring to<strong>the</strong> financial year of 2009/2010 ra<strong>the</strong>rthan 2010 as <strong>the</strong> o<strong>the</strong>r countries arereporting. <strong>The</strong> average penetrationrate in Europe was 1.6% in 2010 22 , upfrom 1.4% in 2009 23 but still a littleshort of <strong>the</strong> 2008 average of 1.7% 24 .Never<strong>the</strong>less, this average hidesenormous differences from countryto country, ranging from 3.0% in <strong>the</strong>UK to 0.1% in Greece. Mature marketsin Western Europe, namely <strong>the</strong> UK,France, Germany and <strong>the</strong> Beneluxcountries, are all above average;whereas <strong>the</strong> markets in Sou<strong>the</strong>rn andEastern Europe are all below average.264.5%4.0%3.5%3.0%2.5%2.0%1.5%1.0%0.5%0.0%UKNe<strong>the</strong>rlandsGermanyFranceIrelandLuxembourgBelgiumComparative penetration rate 2008-2010HungaryPortugal2008 2009 201022. based on data from 29 countries23. based on data from 29 countries24. based on data from 27 countriesAustriaSwitzerlandSwedenFinlandNorwayItalySlovakiaDenmarkMacedoniaPoland2008 average 1.7%Czech Republic2010 average 1.6%2009 average 1.4%Note: estimate for Russia not used in calculating European Average. If included, penetration rate in 2010 would be 1.2%RomaniaEstoniaSloveniaSpainLatviaBulgariaLithuaniaGreeceRussia
Evolution of <strong>the</strong> number of <strong>agency</strong> <strong>work</strong>ersin <strong>the</strong> rest of <strong>the</strong> <strong>world</strong> [FTE]Agency <strong>work</strong>ersin numbersOutside Europe <strong>the</strong> number of<strong>agency</strong> <strong>work</strong>ers has also markedlyincreased between 1996 and2010, on account of <strong>the</strong> gradualderegulation of <strong>the</strong> Japanese labourmarket, and <strong>the</strong> advent of emergingmarkets, such as Brazil and SouthAfrica, on <strong>the</strong> global scene.It is important to note that wi<strong>the</strong>ach passing year <strong>the</strong> level ofinformation available on <strong>the</strong> numberof <strong>agency</strong> <strong>work</strong>ers has improvedleading to more countries beingrepresented. Care should be takento only make direct comparisonsto previous years where data isavailable.Evolution of Agency <strong>work</strong> in <strong>the</strong> Rest of <strong>the</strong> World1996 1997 1998 1999 2000 2001 2002 2003 2004 2005 2006 2007 2008 2009 2010Argentina** 0,3% 0,3% 0,3% 0,3% 0,3% 0,3% 0,2% 0,3% 0,4% 0,4% 0,4% 0,4% 0,4% 0,3% 0,4%Australia - - - - - - - - - - - - - 2,8% 2,7%Brazil - - - - - - - - - - 0,9% 1,0% 0,9% 1,0% 1,0%Chile - - - - - - - - - - 1,3% 0,5% 0,4% 0,4% 0,4%Colombia - - - - - - - - - - - - - 3,3% 2,7%Japan 0,5% 0,5% 0,5% 0,6% 0,8% 1,0% 1,1% 1,2% 1,4% 1,7% 1,9% 2,1% 2,2% 1,8% 1,5%Mexico - - - - - - - - - - - - - 0,1% 0,3%New Zealand - - - - - - - - - 0,5% 0,5% 0,4% 0,6% 0,6% 0,3%Peru - - - - - - - - - - - - - 0,3% 0,6%South Africa* - - - - - - - - - 2,3% 2,2% 2,1% 3,4% 6,4% 7,1%South Korea - - - - - - - - 0,2% 0,3% 0,3% 0,3% 0,3% 0,4% 0,4%*USA** 1,9% 2,1% 2,1% 2,2% 2,2% 1,9% 1,8% 1,9% 2,1% 2,2% 2,1% 2,0% 1,8% 1,5% 1,8%Denotes Ciett estimate based on <strong>the</strong> overall evolution ofcomparable markets between 2009 and 2010 of 8.52%Source: Ciett National Federations*Source: Ciett Estimate**Time series revised compared to previous editions***Change of methodology in 2009 for calculating FTE <strong>work</strong>ers27
Outside Europe <strong>agency</strong> <strong>work</strong>penetration rates vary widelyAgency <strong>work</strong> penetration rates aredetermined in part by <strong>the</strong> level ofmaturity of <strong>the</strong> market in which<strong>the</strong>y evolve. Mature <strong>agency</strong> <strong>work</strong>markets are characterised by highpenetration rates, indicating apotent blend of large user bases,strong economic growth, andgenerally relevantly regulatedmarkets. At a mere 0.9% 25 of <strong>the</strong> totalregional active <strong>work</strong>ing population,<strong>the</strong> relatively low penetration rateof <strong>agency</strong> <strong>work</strong> in South Americancountries reveals <strong>the</strong> region’sconsiderable potential for growth.8.0%7.0%6.0%5.0%4.0%3.0%2.0%1.0%Evolution of penetration rate 2008-20100.0%ArgentinaAustraliaBrazilChileColombiaJapanMexicoNew ZealandPeruSouth KoreaUSA2008 2009 201025. based on data from 6 countriesNote: estimate for Russia not used in calculating European Average. If included, penetration rate in 2010 would be 1.2%28
Differences in gender balance dependon <strong>the</strong> socio-economic fabric of a countryFrom country to country, differencesin gender balance in <strong>agency</strong> <strong>work</strong>are determined by <strong>the</strong> particularsocio-economic fabric andeconomic history of each country,as well as by <strong>the</strong> sectors allowedto use <strong>agency</strong> <strong>work</strong>. More servicesorientedmarkets tend to employmore women, such as Sweden[60% of women and 57% in <strong>the</strong>services sector], whereas marketswith a strong industrial historyusually employ more men, such asGermany [70% of men and 48% in<strong>the</strong> manufacturing sector].100%90%80%70%60%50%40%30%20%10%0%Gender balance of <strong>agency</strong> <strong>work</strong>ersAustriaFranceGermanyMacedoniaSwitzerlandBelgiumSlovakiaSpainSloveniaMexicoItalyNe<strong>the</strong>rlandsRomaniaPolandSouth AfricaCzech RepublicGreeceArgentinaBrazilColombiaPeruUSAUKChinaNew ZealandSwedenJapanFinlandAustraliaMaleFemale34
Most <strong>agency</strong> <strong>work</strong>ers in Europeare aged below 30<strong>The</strong> profileof <strong>agency</strong> <strong>work</strong>ersYoung people make up a highproportion of <strong>agency</strong> <strong>work</strong>erscompared to <strong>the</strong> total active<strong>work</strong>ing population with a majorityof <strong>agency</strong> <strong>work</strong>ers being over 30years of age. On average, 10% of<strong>agency</strong> <strong>work</strong>ers are under 21 yearsold with 22% are between 21 and 25years old. A fur<strong>the</strong>r 25% are between25 and 30 Years old. This means thaton average, 57% of <strong>agency</strong> <strong>work</strong>ersare under 30 years old. Agency <strong>work</strong>often serves as a first professionalexperience for first-time entrantsinto <strong>the</strong> labour market, providing<strong>the</strong>m with a valuable initialexperience or serving as a steppingstoneto permanent employment.Notable exceptions to this trendare Denmark [70% over 30], andMacedonia [69% over 30].100%90%80%70%60%50%40%30%20%10%0%Average age of <strong>agency</strong> <strong>work</strong>ers in EuropeSwedenPolandMacedoniaDenmarkFranceSpainHungaryGreeceRomaniaSlovakiaGermanySloveniaCzech Republic< 21 21 - 25 26 - 30 31 - 45 > 45BelgiumNe<strong>the</strong>rlandsNorwayItaly35
Agency <strong>work</strong>erstend to be older outside EuropeAgency <strong>work</strong>ers tend to be older inJapan, where 58% of <strong>agency</strong> <strong>work</strong>ersare over 30 and in <strong>the</strong> US, where 68%of Agency <strong>work</strong>ers are aged over 30.100%90%Average age of <strong>agency</strong> <strong>work</strong>ers in <strong>the</strong> rest of <strong>the</strong> <strong>world</strong>This can be explained by <strong>the</strong> factthat in some of <strong>the</strong>se countries<strong>agency</strong> <strong>work</strong> is culturally acceptedas a viable alternative to permanentemployment.80%70%60%50%40%30%20%10%0%ChinaJapanUSANew ZealandMexicoColombiaArgentinaSouth AfricaBrazil< 21 21 - 25 26 - 30 31 - 45 > 4536
More than a quarter of <strong>agency</strong> <strong>work</strong>ershave completed higher education<strong>The</strong> profileof <strong>agency</strong> <strong>work</strong>ersOn average, 27% of <strong>agency</strong> <strong>work</strong>ershave completed higher education.In Sweden and Australia, morethan half of <strong>agency</strong> <strong>work</strong>ers havecompleted higher education. Inmost countries, <strong>the</strong> majority of<strong>agency</strong> <strong>work</strong>ers have a low tomedium initial education level. Onaverage, 50% of <strong>agency</strong> <strong>work</strong>ers<strong>world</strong>wide have finished secondaryschool, and 23% have not. <strong>The</strong> CzechRepublic [60%] is <strong>the</strong> only countryto report <strong>the</strong> majority of <strong>agency</strong><strong>work</strong>ers having not completed <strong>the</strong>irsecondary education. Agency <strong>work</strong>can play an important role in helping<strong>the</strong>se low-skilled <strong>work</strong>ers enter <strong>the</strong>labour market and gain valuableexperience.100%90%80%70%60%50%40%30%20%10%0%Education level of <strong>agency</strong> <strong>work</strong>ersSwedenAustraliaNorwayUKFinlandUSABelgiumGreecePeruArgentinaItalyColombiaNe<strong>the</strong>rlandsSouth KoreaSpainSwitzerlandBrazilCzech RepublicSouth AfricaLow [not completed secondary education] Medium [completed secondary education] High [completed higher education]37
Sectoral distributionof <strong>agency</strong> <strong>work</strong>Reflecting <strong>the</strong> ongoing mutationsof <strong>the</strong> European economies, <strong>the</strong>sectoral distribution of <strong>agency</strong> <strong>work</strong>in Europe has seen a recent trendaway from usage in <strong>the</strong> industrialsector [31% average], towards agrowing use in <strong>the</strong> services sector[37% average]. Manufacturingremains an important user of <strong>agency</strong><strong>work</strong> in traditionally industrialeconomies, such as Poland [70%]and Czech Republic [65%]. Mexico[29%], Norway [15%] and Peru [15%],make important use of <strong>agency</strong><strong>work</strong> in public administration, as doPeru [43%] and France [23%] in <strong>the</strong>construction sector. More than threein four Chilean <strong>agency</strong> <strong>work</strong>ers <strong>work</strong>in <strong>the</strong> services sector, and 45% ofArgentinian <strong>agency</strong> <strong>work</strong>ers <strong>work</strong> in<strong>the</strong> manufacturing sector.100%90%80%70%60%50%40%30%20%10%0%Sectoral distribution of <strong>agency</strong> <strong>work</strong>PeruGreeceChileNorwaySouth AfricaBrazilNe<strong>the</strong>rlandsColombiaMexicoSpainSwitzerlandAustraliaBelgiumSouth KoreaFranceItalyArgentinaGermanyCzech RepublicAgriculture Manufacturing Construction Services Public Administration O<strong>the</strong>rPoland38
. Diversity39
Agency <strong>work</strong>ers from target groupsare on <strong>the</strong> rise in <strong>the</strong> Ne<strong>the</strong>rlands<strong>The</strong> profileof <strong>agency</strong> <strong>work</strong>ersAgency <strong>work</strong> gives target groups aviable access to <strong>the</strong> labour market,<strong>the</strong>reby increasing labour marketparticipation and diversity. Ethnicminorities, older people, labourincapacitated and <strong>the</strong> long termunemployed accounted for 31% of<strong>agency</strong> <strong>work</strong>ers in <strong>the</strong> Ne<strong>the</strong>rlandsin 2008. This is up from 27% in2006. Agency <strong>work</strong> increaseslabour market flexibility, whilstproviding basic rights and <strong>work</strong>ingconditions to <strong>agency</strong> <strong>work</strong>ers.Because <strong>the</strong> <strong>agency</strong> remains <strong>the</strong><strong>work</strong>er’s employer, his rights arecapitalised from one assignmentto <strong>the</strong> next. Agency <strong>work</strong> thusintegrates “outsiders” in <strong>the</strong> labourmarket, who <strong>the</strong>n benefit from <strong>the</strong>same <strong>work</strong>ing conditions as thoseprovided to o<strong>the</strong>r <strong>agency</strong> <strong>work</strong>ers.<strong>The</strong> percentage of special target groups among temporary employees in <strong>the</strong> Ne<strong>the</strong>rlands2006200835%30%25%20%15%10%5%0%14%18%12%13%Ethnic minorities Older <strong>work</strong>ers (45+) Labour incapacitated Long-termunemployed2%1%3%2%27%31%Total (corrected foroverlap)41
Disabled temporary <strong>agency</strong> <strong>work</strong>erstake on a range of positionsIn France, 43% of disabled <strong>work</strong>ersare classified as skilled blue collar<strong>work</strong>ers, while 7% occupy middlemanagement positions. 16% arewhite collar employees and 34%are unskilled blue collar <strong>work</strong>ers.Through private employmentagencies, disabled <strong>agency</strong> <strong>work</strong>ersare integrated at every level ofcompanies.Employment of disabled <strong>agency</strong> <strong>work</strong>ers in FranceWhitecollar16%Unskilled bluecollar 34%Skilledblue collar43%Middlemanagement7%42
Notes43
Notes45
About CiettAs <strong>the</strong> International Confederation ofPrivate Employment Agencies, Ciett is<strong>the</strong> authoritative voice representing <strong>the</strong>interests of private employment <strong>agency</strong><strong>industry</strong> across <strong>the</strong> <strong>world</strong>.Founded in 1967, Ciett consists of 47national federations of private employmentagencies and six of <strong>the</strong> largest staffingcompanies <strong>world</strong>wide: Adecco, GI Group,Kelly Services, Manpower, Randstad, andUSG People.Its main objective is to help its membersconduct <strong>the</strong>ir businesses in a legal andregulatory environment that is positive andsupportive.Ciett is divided into 6 regionalorganisations: Africa & Near East, Nor<strong>the</strong>rnand Sou<strong>the</strong>rn Asia, North America, SouthAmerica [CLETT&A], and Europe [<strong>Eurociett</strong>].46
Ciett National Federation MembersAfricaMorocco | FNETTSouth Africa | APSONor<strong>the</strong>rn AsiaChina | CAFSTJapan | JASSASouth Korea | KOSASou<strong>the</strong>rn AsiaAustralia & NewZealand | RCSAIndia | ISFSingapore | SSANorth AmericaCanada | ACSESSMexico | AMECHUSA | ASASouth AmericaArgentina | FAETTBrazil | SINDEPRESTEMChile | AGESTColombia | ACOSETPerú | AETT PerúEuropeAustria | VZABelgium | FEDERGONBulgaria | BG StaffingCzech Republic | APPSDenmark | Dansk ErhvervEstonia | ESAAFinland | HPLFrance | PRISMEGermany | BAPGreece | ENIDEAHungary | SZTMSZIreland | NRFItaly | ASSOLAVOROLatvia | LASALithuania | LIIALuxembourg | ULEDIMacedonia | NFTWAMNe<strong>the</strong>rlands | ABUNorway | NHO ServicePoland | Polskie Forum HRPortugal | APESPERomania | ARAMTRussia | APEASlovakia | APASSlovenia | ZAZSpain | AGETT & AETTSweden |BemanningsförtagenSwitzerland | Swiss StaffingTurkey | OIBDUK | REC
www.inextremis.beTour & Taxis buildingAvenue du Port 86c - Box 302B 1000 - Brusselswww.ciett.orginfo@ciett.org<strong>The</strong> Voice of Labour Choice