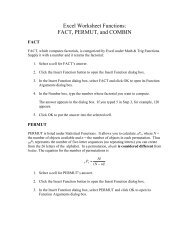
1 CHE 341 Restriction Endonuclease Digestion of DNA and ...
1 CHE 341 Restriction Endonuclease Digestion of DNA and ...
1 CHE 341 Restriction Endonuclease Digestion of DNA and ...

You also want an ePaper? Increase the reach of your titles
YUMPU automatically turns print PDFs into web optimized ePapers that Google loves.
1<strong>CHE</strong> <strong>341</strong><strong>Restriction</strong> <strong>Endonuclease</strong> <strong>Digestion</strong> <strong>of</strong> <strong>DNA</strong> <strong>and</strong> Analysis by Agarose Gel ElectrophoresisSynopsis: In this exercise, your objective is to make a restriction map <strong>of</strong> an unknown <strong>DNA</strong>plasmid. You will run restriction endonuclease reactions on an isolated <strong>DNA</strong> plasmid, analyzethe results <strong>of</strong> this reaction by running an agarose gel to separate the fragments, <strong>and</strong> bycomparing your results to reference <strong>DNA</strong> fragments, you will estimate the length <strong>of</strong> thefragments from digestion. This will allow you to construct a partial map <strong>of</strong> the endonuclease cutsites.Pre‐lab assignment: Read the background <strong>and</strong> Boyer reading assignment below under“Background.” In your notebook, outline a plan for eight single <strong>and</strong> double digests that willmaximize your chances <strong>of</strong> successfully mapping the relative locations <strong>of</strong> restriction sites on theplasmid. The background contains information on the enzymes we will use.Objectives: Upon successful completion <strong>of</strong> this lab, you will be able to: Conduct a restriction digestion reaction. Prepare agarose gels <strong>and</strong> load <strong>DNA</strong> samples. Stain gels with ethidium bromide (EtBr) to visualize <strong>DNA</strong>. Analyze <strong>DNA</strong> fragments <strong>and</strong> determine the molecular weight <strong>of</strong> the fragments. Draw a partial restriction enzyme map.BackgroundIntroduction to the use <strong>of</strong> plasmids <strong>and</strong> enzymes in molecular biology. This backgroundinformation is found in Boyer pages 289 – 297. This section introduces the common uses <strong>of</strong>restriction endonucleases <strong>and</strong> plasmids in molecular cloning.<strong>Restriction</strong> endonucleases. Boyer pages 297 – 300.Electrophoresis <strong>of</strong> <strong>DNA</strong> Fragments in an Agarose Gel. Boyer pages 280 – 282. Electrophoresis isthe process <strong>of</strong> separating particles in an electric field. Like SDS‐PAGE, nearly all <strong>of</strong> the commonforms <strong>of</strong> electrophoresis conduct separation in a semisolid gel matrix in which the. The gelconsists <strong>of</strong> an aqueous phase (buffer) <strong>and</strong> a solid phase composed <strong>of</strong> a natural or artificialpolymer (agarose, polyacrylamide, starch, etc.). The solid phase has two roles: 1) it acts as asieve to separate molecules according to a specific physical or chemical property <strong>and</strong> 2) it actsas a "trap" to keep separated molecules from diffusing at the conclusion <strong>of</strong> the electrophoretictreatment. In an electric field E, a particle <strong>of</strong> charge q experiences a force <strong>of</strong> F = qE. That is, anegatively charged molecule will "feel" a force pushing it against the positive‐to‐negativeelectric field lines. So, any negatively charged molecule migrates toward the "anode" (+) end <strong>of</strong>
3eukaryotic organisms. You will be given a tube <strong>of</strong> plasmid <strong>DNA</strong>. Using the information providedbelow, you will map the restriction sites <strong>of</strong> four different enzymes: EcoRI, AvaI, HincII, <strong>and</strong> RsaI.We will use the single EcoRI site as “base pair zero” for numbering purposes; all otherrestriction sites should be mapped relative to the EcoRI site. To help you plan, I will tell you thatthe plasmid <strong>DNA</strong> is circular <strong>and</strong> contains: one cut site for EcoRI <strong>and</strong> AvaI, two cut sites for HincII,<strong>and</strong> three cut sites for RsaI.Your agarose gel will have a total <strong>of</strong> ten lanes. Be sure to run appropriate controls on each gel,including single digests to compare with double digests or double digests to be compared witheach other. The more digests you have on your gel, the more information you will obtain bycomparing fragment sizes directly. A st<strong>and</strong>ard curve <strong>of</strong> fragment sizes will be obtained byrunning marker <strong>DNA</strong> on each gel. Each gel will generate a st<strong>and</strong>ard curve for use with that gelonly. Note that very small fragments may not be visible <strong>and</strong> their presence might need to beinferred. The markers available will be “100 bp <strong>DNA</strong> Ladder” (New Engl<strong>and</strong> Biolabs productN3231S) <strong>and</strong> “λ <strong>DNA</strong>‐HindIII Digest” (New Engl<strong>and</strong> Biolabs product N3012S). Visit themanufacturer’s website for more information on the composition <strong>of</strong> these <strong>DNA</strong> referencemixtures.Materials Agarose Ethidium bromide solution (10 mg/mL in DMSO) 5X tracking dye (50% glycerol, 0.3% bromophenol blue, in 5X TAE) 0.5X TBE reservoir buffer (0.4 M TRIS‐borate, 0.01 M EDTA, pH 8.0) EcoRI (100 units/μL) AvaI (10 units/μL) HincII (10 units/μl) RsaI (10 units/μL) 10X NEB Enzyme Buffer 4 (1X is 20 mM Tris‐acetate, 50 mM potassium acetate, 10 mMMagnesium Acetate, 1 mM Dithiothreitol, pH = 7.9 @ 25°C) BSA (10 mg/ml) Sterile water Plasmid <strong>DNA</strong> isolated from E.coli (X μg/μL, concentration determined last week) 2 log <strong>DNA</strong> Ladder marker pre‐mixed with tracking dye (0.5 μg for 5 μL load)
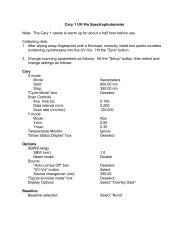
4Procedures<strong>Restriction</strong> digests1. Plan your reactions as shown but do not mix until you have read steps 2 & 3. Yourinstructor will help you decide how much plasmid to add based on your concentration fromlast week.Component (μL) Single digests Double digests10X reaction buffer 1 1BSA 1 1sterile DI H 2 O 7 – X 6 – XPlasmid <strong>DNA</strong> X XEnzyme 1 1 1Enzyme 2 1Total 10 102. You should add the components in the order shown in the above chart. All enzyme <strong>and</strong> <strong>DNA</strong>samples will be on ice in a shared desktop cooler. Take out a tube only when you want topipet the sample. Do not remove the tubes from the cooler for more than a few seconds.3. Flick capped tube to mix. Spin the tubes in a microcentrifuge for a few seconds. Take themto the instructor or teaching assistant before adding enzymes. Mix <strong>and</strong> spin again.4. Incubate the tubes in 37 °C incubator for 30 – 60 minutes. While you are waiting, prepareyour agarose gel.5. When the incubation is over, add 2 μL <strong>of</strong> bromophenol blue/xylene cyanol tracking dye toeach sample.Agarose Gel Electrophoresis1. While the digestion is proceeding, prepare 60 – 75 mL <strong>of</strong> 0.7% agarose in TBE buffer for thegel.a. Weigh 0.35 g <strong>of</strong> agarose. Transfer to a beaker <strong>and</strong> add 50 mL <strong>of</strong> 0.5X TBE buffer to a finalvolume is 50 mL.b. Heat in microwave for 1 minute, swirl, heat for another 30 seconds, swirl, <strong>and</strong> heat foranother 30 seconds.c. Assemble a casting tray, pour the gel, insert the comb, <strong>and</strong> let the gel harden for 20 min.
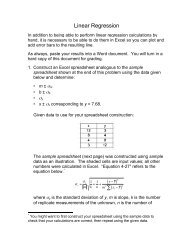
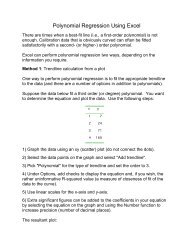
5d. Position the gel for electrophoresis.e. Pour the 0.5X TBE buffer into the reservoir such that it is just covers the gel. Make surethe positive pole is pointed away from the wells.f. Carefully remove the comb.2. Load your samples into the wells, record the identity <strong>of</strong> each well. Load 4 μL <strong>of</strong> the premixed2log <strong>DNA</strong> ladder. Load a unique colored solution into one well to make your gel easyto identify later (instructor will explain).3. Set the voltage to 90 Volts. Run for approximately 60 minutes.4. When electrophoresis is complete, transfer the gel to the ethidium bromide stainingsolution. Soak for 30 minutes. Note: Ethidium bromide potentially carcinogenic! Alwayswear gloves when working around ethidium bromide. Dispose any tips, solutions, gels,<strong>and</strong> gloves contaminated with ethidium bromide into the proper waste containers! Takecare not to spread contamination.5. Next, place the gel in a plastic bag <strong>and</strong> carry it to the gel imager. Follow imaginginstructions, save the image to the computer, <strong>and</strong> print a copy.Waste DisposalDispose all waste (gel, gel buffer etc) into the labeled waste container. All materials that comein contact with ethidium bromide must be discarded in the ethidium bromide waste container.Analysis <strong>of</strong> Results1. Make a table <strong>of</strong> raw data containing the migration distances <strong>of</strong> every b<strong>and</strong> in each lane. UseSI units for all measurements.2. Visit the New Engl<strong>and</strong> Biolabs website to interpret the fragment lengths <strong>of</strong> the two markers.Add your assignments <strong>of</strong> fragment lengths for known markers to the figure <strong>of</strong> your gel.3. In Excel, graph log 10 <strong>of</strong> base pairs versus the migration distance for all markers. Add a lineartrendline to the graph. If your gel had problems, you may need to apply another function tothe data (use the trendline that gives the best results). Include the equation <strong>and</strong> thetrendline on your labeled figure.4. Use the trendline to determine the number <strong>of</strong> base pairs for the fragment(s) from single<strong>and</strong> double digests. Prepare a table <strong>of</strong> these results for each digest. Round fragment lengthsto the nearest 50 or 100 bp, depending on the confidence in your resolution.