Ministry of Commerce And Supplies - Enhanced Integrated ...
Ministry of Commerce And Supplies - Enhanced Integrated ... Ministry of Commerce And Supplies - Enhanced Integrated ...
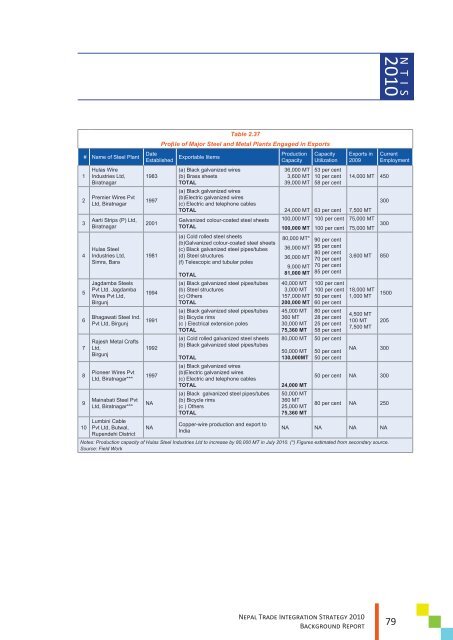
N T I S201012345678910# Name of Steel PlantHulas WireIndustries Ltd,BiratnagarPremier Wires PvtLtd, BiratnagarAarti Strips (P) Ltd,BiratnagarHulas SteelIndustries Ltd,Simra, BaraJagdamba SteelsPvt Ltd. JagdambaWires Pvt Ltd,BirgunjBhagawati Steel Ind.Pvt Ltd, BirgunjRajesh Metal CraftsLtd,BirgunjPioneer Wires PvtLtd, Biratnagar***Mainabati Steel PvtLtd, Biratnagar***Lumbini CablePvt Ltd, Butwal,Rupendehi DistrictTable 2.37Profile of Major Steel and Metal Plants Engaged in ExportsDateEstablished Exportable Iitems ProductionCapacity19831997200119811994199119921997NANA(a) Black galvanized wires(b) Brass sheetsTOTAL36,000 MT3,600 MT39,000 MTCapacityUtilization53 per cent10 per cent58 per centExports in200914,000 MT 450(a) Black galvanized wires(b)Electric galvanized wires(c) Electric and telephone cablesTOTAL 24,000 MT 63 per cent 7,500 MTGalvanized colour-coated steel sheetsTOTAL(a) Cold rolled steel sheets(b)Galvanized colour-coated steel sheets(c) Black galvanized steel pipes/tubes(d) Steel structures(f) Telescopic and tubular polesTOTAL(a) Black galvanized steel pipes/tubes(b) Steel structures(c) OthersTOTAL(a) Black galvanized steel pipes/tubes(b) Bicycle rims(c ) Electrical extension polesTOTAL(a) Cold rolled galvanized steel sheets(b) Black galvanized steel pipes/tubesTOTAL(a) Black galvanized wires(b)Electric galvanized wires(c) Electric and telephone cablesTOTAL(a) Black galvanized steel pipes/tubes(b) Bicycle rims(c ) OthersTOTALCopper-wire production and export toIndia100,000 MT 100 per cent100,000 MT 100 per cent80,000 MT*36,000 MT36,000 MT9,000 MT81,000 MT40,000 MT3,000 MT157,000 MT200,000 MT45,000 MT360 MT30,000 MT75,360 MT80,000 MT50,000 MT130,000MT24,000 MT50,000 MT360 MT25,000 MT75,360 MT90 per cent95 per cent80 per cent70 per cent70 per cent85 per cent100 per cent100 per cent50 per cent60 per cent80 per cent28 per cent25 per cent58 per cent50 per cent50 per cent50 per centCurrentEmployment30075,000 MT75,000 MT 3003,600 MT 85018,000 MT1,000 MT4,500 MT100 MT7,500 MT1500205NA 30050 per cent NA 30080 per cent NA 250NA NA NA NANotes: Production capacity of Hulas Steel Industries Ltd to increase by 80,000 MT in July 2010. (*) Figures estimated from secondary source.Source: Field WorkNEPAL TRADE INTEGRATION STRATEGY 2010BACKGROUND REPORT79
N T I S201011) Chyangra Pashmina ProductsBackgroundPashmina, now commonly known in Nepal as Chyangra Pashmina, is a fine hair fibre from the inner downcoat of Capra Hircus, a mountain goat called ‘Chyangra’ in Nepal, which inhabits the Himalayas in areas above2,300 m. 69 The fibre is well known for its uniform quality and fineness. It is soft, warm, and very light. Itis sometimes called ‘Diamond Fibre’ or ‘Soft Gold of High Asia’. Pashmina products, such as shawls, areusually produced using a blend of Pashmina and the cheaper silk yarn. Exports of Pashmina products likeshawls, stoles, blankets, sweaters, and other accessories boomed in the late 1990s to record high level ofUS$80 million in 2000/01, but then declined again to around US$22 million in 2008. A major reason for thedecline is seen in increased competition from other countries, which often use cheaper imitation materials.ITC published an extensive study on the sector in 2007. 70Index 1: Export PerformanceTable 2.38Export Value of Pashmina Products, 2005-2009 (US$1,000)2005 2006 2007 2008 200919,091 15,530 15,790 22,074 n/aSource: TradeMap (mirror data). Data covers products 6214.10/20/90 and6301.20.Types of Exported Products: The main products are Pashmina shawls, but also other items such as blankets.Current Export Destinations (share of exports): The main markets for Pashmina shawls are the EU (61 percent), USA (12 per cent), India (9 per cent), and Japan (7 per cent), which together account for 90 per cent ofexports.Potential Export Destinations: Fast-growing markets are China and UAE. According to industry sources, otherpromising new markets are Russia and South Africa.Nepal’s World Market Share: Nepal’s share for the major product (6214.20, shawls of fine animal hair),is around 3 per cent. However, the world market share is difficult to assess using trade data because therelevant product codes cover not only Pashmina products but also other products . China, Mongolia, India,and Pakistan are also large producers of cashmere, which is similar to Chyangra wool.Trade Balance: There are negligible recorded imports of such products. Raw materials have to be imported,such as silk and dyeing materials. Annual imports of silk and silk products, at least some of which will be usedin Pashmina production, are around US$4-5 million.Dynamism of Exports: Exports have been relatively stable over the last four years (see data above). However,they are lower today than in the late 1990s, when they were reported to be about US$80 million per year.69“Chyangra Pashmina” is similar to other fine animal hairs like “Cashmere”, “Merino”, “Alpaca”, and “Mohair”. During the early 2000’s, theword “Pashmina” was often misrepresented in the western markets by a low-value shawl woven out of cheap materials like acrylic or viscoseyarns.70ITC (2007b). Chyangra Cashmere and Silk Products – Export Performance and Potential. ITC, Geneva.80NEPAL TRADE INTEGRATION STRATEGY 2010BACKGROUND REPORT
- Page 41 and 42: N T I S2010Index 1: Export Performa
- Page 43 and 44: N T I S2010exporters. Nepal permits
- Page 46: N T I S2010RankCountryExports Nepal
- Page 49 and 50: N T I S2010like China and Australia
- Page 51 and 52: N T I S2010The opportunities for pr
- Page 53 and 54: N T I S2010Lentils are subject to o
- Page 55 and 56: N T I S2010Production Capacity: Nat
- Page 57 and 58: N T I S2010Gender Impact: This sect
- Page 60 and 61: N T I S2010Export Prospect: Accordi
- Page 62 and 63: N T I S2010Cost and Quality of Infr
- Page 64 and 65: N T I S2010Attractive markets for T
- Page 66 and 67: N T I S2010Market Access Conditions
- Page 68 and 69: N T I S2010Gender Impact: The respo
- Page 70 and 71: N T I S2010Information from industr
- Page 72 and 73: N T I S2010Cost and Quality of Infr
- Page 74 and 75: N T I S2010RankCountryTable 2.26Att
- Page 76 and 77: N T I S2010# Botanical Name 41 Spec
- Page 78 and 79: N T I S2010Current Export Destinati
- Page 80 and 81: N T I S2010significant attention fr
- Page 82 and 83: N T I S20109) Silver JewelryBackgro
- Page 84 and 85: N T I S2010Availability and Quality
- Page 86 and 87: N T I S2010Attractive Markets for S
- Page 88 and 89: N T I S2010Production Capacity: Nep
- Page 90 and 91: N T I S2010ii.iii.required for the
- Page 94 and 95: N T I S2010Export Prospect: Accordi
- Page 96 and 97: N T I S2010Gender Impact: Female wo
- Page 98 and 99: N T I S2010The value added of those
- Page 100 and 101: N T I S2010sheep population, which
- Page 102 and 103: N T I S201013) TourismBackgroundTou
- Page 104 and 105: N T I S2010Index 2: World Market Co
- Page 106 and 107: N T I S2010There are also about 24
- Page 108 and 109: N T I S2010Index 1: Export Performa
- Page 110 and 111: N T I S2010Index 2: World Market Co
- Page 112 and 113: N T I S2010Contribution to Skill De
- Page 114 and 115: N T I S2010Types of Exported Servic
- Page 116 and 117: N T I S2010Cost and Quality of Infr
- Page 118 and 119: N T I S201016) Health ServicesBackg
- Page 120 and 121: N T I S2010medical services are bei
- Page 122 and 123: N T I S201017) Education ServicesBa
- Page 124 and 125: N T I S2010should be interpreted ca
- Page 126 and 127: N T I S2010foreign students. The me
- Page 128 and 129: N T I S2010Under mode 4 (presence o
- Page 130 and 131: N T I S2010Index 4: Socio-economic
- Page 132 and 133: N T I S2010generate revenue of US$3
- Page 134 and 135: N T I S2010monopsony power. Several
- Page 136 and 137: N T I S2010The possibility of direc
- Page 138 and 139: N T I S2010Dairy Products, specific
- Page 140 and 141: Chapter 3Access to the Indian Marke
N T I S201012345678910# Name <strong>of</strong> Steel PlantHulas WireIndustries Ltd,BiratnagarPremier Wires PvtLtd, BiratnagarAarti Strips (P) Ltd,BiratnagarHulas SteelIndustries Ltd,Simra, BaraJagdamba SteelsPvt Ltd. JagdambaWires Pvt Ltd,BirgunjBhagawati Steel Ind.Pvt Ltd, BirgunjRajesh Metal CraftsLtd,BirgunjPioneer Wires PvtLtd, Biratnagar***Mainabati Steel PvtLtd, Biratnagar***Lumbini CablePvt Ltd, Butwal,Rupendehi DistrictTable 2.37Pr<strong>of</strong>ile <strong>of</strong> Major Steel and Metal Plants Engaged in ExportsDateEstablished Exportable Iitems ProductionCapacity19831997200119811994199119921997NANA(a) Black galvanized wires(b) Brass sheetsTOTAL36,000 MT3,600 MT39,000 MTCapacityUtilization53 per cent10 per cent58 per centExports in200914,000 MT 450(a) Black galvanized wires(b)Electric galvanized wires(c) Electric and telephone cablesTOTAL 24,000 MT 63 per cent 7,500 MTGalvanized colour-coated steel sheetsTOTAL(a) Cold rolled steel sheets(b)Galvanized colour-coated steel sheets(c) Black galvanized steel pipes/tubes(d) Steel structures(f) Telescopic and tubular polesTOTAL(a) Black galvanized steel pipes/tubes(b) Steel structures(c) OthersTOTAL(a) Black galvanized steel pipes/tubes(b) Bicycle rims(c ) Electrical extension polesTOTAL(a) Cold rolled galvanized steel sheets(b) Black galvanized steel pipes/tubesTOTAL(a) Black galvanized wires(b)Electric galvanized wires(c) Electric and telephone cablesTOTAL(a) Black galvanized steel pipes/tubes(b) Bicycle rims(c ) OthersTOTALCopper-wire production and export toIndia100,000 MT 100 per cent100,000 MT 100 per cent80,000 MT*36,000 MT36,000 MT9,000 MT81,000 MT40,000 MT3,000 MT157,000 MT200,000 MT45,000 MT360 MT30,000 MT75,360 MT80,000 MT50,000 MT130,000MT24,000 MT50,000 MT360 MT25,000 MT75,360 MT90 per cent95 per cent80 per cent70 per cent70 per cent85 per cent100 per cent100 per cent50 per cent60 per cent80 per cent28 per cent25 per cent58 per cent50 per cent50 per cent50 per centCurrentEmployment30075,000 MT75,000 MT 3003,600 MT 85018,000 MT1,000 MT4,500 MT100 MT7,500 MT1500205NA 30050 per cent NA 30080 per cent NA 250NA NA NA NANotes: Production capacity <strong>of</strong> Hulas Steel Industries Ltd to increase by 80,000 MT in July 2010. (*) Figures estimated from secondary source.Source: Field WorkNEPAL TRADE INTEGRATION STRATEGY 2010BACKGROUND REPORT79


