- Page 2 and 3:
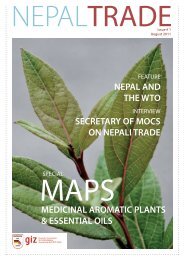
Nepal Trade Integration Strategy 20
- Page 5 and 6:
Table of ContentsForewordAbbreviati
- Page 7 and 8:
Table 2.17 Acreage and Production o
- Page 9 and 10:
List of BoxesBox 2.1 A Nepalese IT
- Page 11:
LoD Limit of DetectionM&E Monitorin
- Page 14 and 15:
Chapter 1Trading Environment, Expor
- Page 16 and 17:
N T I S20101.3 Capacity Development
- Page 18 and 19:
N T I S2010Table 1.1Balance of Paym
- Page 20 and 21:
N T I S2010Changes in the Nepalese
- Page 22 and 23:
N T I S20101.5 Expanding an ‘Incl
- Page 24 and 25:
N T I S2010 Index 4 measures the po
- Page 26 and 27:
N T I S2010Table 1.9Impact of 19 Ex
- Page 28 and 29:
N T I S2010Table 1.10Geographical D
- Page 30 and 31:
N T I S20101.7 Declining Importance
- Page 32:
N T I S2010negotiate for the inclus
- Page 35 and 36:
N T I S2010Types of Exported Produc
- Page 37 and 38:
N T I S2010Table 2.2Large Cardamom:
- Page 39 and 40:
N T I S2010Index 4: Socio-economic
- Page 41 and 42:
N T I S2010Index 1: Export Performa
- Page 43 and 44:
N T I S2010exporters. Nepal permits
- Page 46:
N T I S2010RankCountryExports Nepal
- Page 49 and 50:
N T I S2010like China and Australia
- Page 51 and 52:
N T I S2010The opportunities for pr
- Page 53 and 54:
N T I S2010Lentils are subject to o
- Page 55 and 56:
N T I S2010Production Capacity: Nat
- Page 57 and 58:
N T I S2010Gender Impact: This sect
- Page 60 and 61:
N T I S2010Export Prospect: Accordi
- Page 62 and 63:
N T I S2010Cost and Quality of Infr
- Page 64 and 65:
N T I S2010Attractive markets for T
- Page 66 and 67:
N T I S2010Market Access Conditions
- Page 68 and 69:
N T I S2010Gender Impact: The respo
- Page 70 and 71:
N T I S2010Information from industr
- Page 72 and 73:
N T I S2010Cost and Quality of Infr
- Page 74 and 75:
N T I S2010RankCountryTable 2.26Att
- Page 76 and 77:
N T I S2010# Botanical Name 41 Spec
- Page 78 and 79:
N T I S2010Current Export Destinati
- Page 80 and 81:
N T I S2010significant attention fr
- Page 82 and 83:
N T I S20109) Silver JewelryBackgro
- Page 84 and 85:
N T I S2010Availability and Quality
- Page 86 and 87:
N T I S2010Attractive Markets for S
- Page 88 and 89:
N T I S2010Production Capacity: Nep
- Page 90 and 91:
N T I S2010ii.iii.required for the
- Page 92 and 93:
N T I S201012345678910# Name of Ste
- Page 94 and 95:
N T I S2010Export Prospect: Accordi
- Page 96 and 97:
N T I S2010Gender Impact: Female wo
- Page 98 and 99:
N T I S2010The value added of those
- Page 100 and 101:
N T I S2010sheep population, which
- Page 102 and 103:
N T I S201013) TourismBackgroundTou
- Page 104 and 105:
N T I S2010Index 2: World Market Co
- Page 106 and 107:
N T I S2010There are also about 24
- Page 108 and 109:
N T I S2010Index 1: Export Performa
- Page 110 and 111:
N T I S2010Index 2: World Market Co
- Page 112 and 113:
N T I S2010Contribution to Skill De
- Page 114 and 115:
N T I S2010Types of Exported Servic
- Page 116 and 117:
N T I S2010Cost and Quality of Infr
- Page 118 and 119:
N T I S201016) Health ServicesBackg
- Page 120 and 121:
N T I S2010medical services are bei
- Page 122 and 123:
N T I S201017) Education ServicesBa
- Page 124 and 125:
N T I S2010should be interpreted ca
- Page 126 and 127:
N T I S2010foreign students. The me
- Page 128 and 129:
N T I S2010Under mode 4 (presence o
- Page 130 and 131:
N T I S2010Index 4: Socio-economic
- Page 132 and 133:
N T I S2010generate revenue of US$3
- Page 134 and 135:
N T I S2010monopsony power. Several
- Page 136 and 137:
N T I S2010The possibility of direc
- Page 138 and 139:
N T I S2010Dairy Products, specific
- Page 140 and 141:
Chapter 3Access to the Indian Marke
- Page 142 and 143:
N T I S2010The Nepal-India Trade Tr
- Page 144 and 145:
N T I S2010Most issues reported abo
- Page 146 and 147:
N T I S2010Nepalese Domestic Issues
- Page 148 and 149:
N T I S2010India’s view is that t
- Page 150 and 151:
Chapter 4Access to the Chinese Mark
- Page 152 and 153:
N T I S2010products must be wholly
- Page 154 and 155:
N T I S2010The findings discussed h
- Page 156 and 157:
N T I S20104.5 Other Impediments to
- Page 158:
N T I S20104.7 Recommendations: Cha
- Page 161 and 162:
N T I S2010inflow between 2000 and
- Page 163 and 164:
N T I S2010Industrial Parks and SEZ
- Page 165 and 166:
N T I S2010Lack of up-to-date polic
- Page 167 and 168:
N T I S2010Apart from the critical
- Page 169 and 170:
N T I S2010capabilities in all five
- Page 171 and 172:
N T I S20105.5. Combining Investmen
- Page 174 and 175:
Chapter 6Trade FacilitationN T I S2
- Page 176 and 177:
N T I S2010In the 2005 Trade Facili
- Page 178 and 179:
N T I S2010The latest phase of impl
- Page 180:
N T I S2010improve efficiency. Few
- Page 183 and 184:
N T I S2010Figure 7.1Future Organog
- Page 185 and 186:
N T I S2010EU countries, special pr
- Page 187 and 188:
N T I S2010Act 1980. So far, 130 fi
- Page 189 and 190:
N T I S2010The current projects inc
- Page 191 and 192:
N T I S2010The NBSM as a secretaria
- Page 193 and 194:
N T I S2010Many more organizations
- Page 195 and 196:
N T I S2010Table 7.8Existing Nepal
- Page 197 and 198:
Table 7.9Standards Issues for Ten E
- Page 199 and 200:
N T I S20107.14 Priority Actions an
- Page 201 and 202:
N T I S2010It is not clear what amo
- Page 203 and 204:
N T I S2010GeneralNepal’s general
- Page 205 and 206:
N T I S2010a crucial part of the PR
- Page 207 and 208:
N T I S2010residue limits (MRLs) ar
- Page 209 and 210:
N T I S2010The viral diseases chirk
- Page 211 and 212:
N T I S2010SPS issues Affecting Tra
- Page 213 and 214:
N T I S2010Indian phytosanitary sta
- Page 215 and 216:
N T I S20108.5 Conclusions and Reco
- Page 217 and 218:
N T I S2010Simpler requirements suc
- Page 219 and 220:
Table 8.4Summary of Export Environm
- Page 221 and 222:
N T I S2010To register a patent, a
- Page 223 and 224:
N T I S2010breaches of law. The Nep
- Page 225 and 226:
N T I S2010Intellectual Property is
- Page 228 and 229:
Chapter 10Barriers to Service Trade
- Page 230 and 231:
N T I S2010Constraints in the touri
- Page 232 and 233:
N T I S2010Table 10.2Nepal GATS Com
- Page 234 and 235:
N T I S2010locations favourable for
- Page 236 and 237:
N T I S2010Barriers to Exports of H
- Page 238:
N T I S2010Institutional IssueThe s
- Page 241 and 242:
N T I S2010 Strengthening sub-natio
- Page 243 and 244:
N T I S2010Observations from enterp
- Page 245 and 246:
N T I S2010Nepal Ginger Producers a
- Page 247 and 248:
N T I S2010 Helping paper manufactu
- Page 249 and 250:
N T I S2010Computer Association of
- Page 251 and 252:
N T I S20105. Also related to the a
- Page 253 and 254:
N T I S2010The key principles inclu
- Page 255 and 256:
N T I S2010That being said, Nepal h
- Page 257 and 258:
N T I S2010Nepal Business ForumOn M
- Page 259 and 260: N T I S2010Third, capacity developm
- Page 261 and 262: N T I S2010expected to emerge from
- Page 263 and 264: N T I S201012.7 Possible Options fo
- Page 265 and 266: N T I S201012.8 RecommendationsThe
- Page 267 and 268: N T I S2010GoN / MoF (2009), Econom
- Page 269 and 270: N T I S2010Thapa, Ajit N.S. (2006).
- Page 272 and 273: N T I S2010NEPAL TRADE INTEGRATION
- Page 274 and 275: N T I S2010MainOutcomes Recommended
- Page 276 and 277: N T I S2010MainOutcomes Recommended
- Page 278 and 279: N T I S2010MainOutcomes Recommended
- Page 280: N T I S2010NEPAL TRADE INTEGRATION
- Page 283 and 284: N T I S20102. GINGERStrengths Tradi
- Page 285 and 286: N T I S20104. LENTILSStrengths High
- Page 287 and 288: N T I S20105. TEAStrengths Very fav
- Page 289 and 290: N T I S20106. INSTANT NOODLESStreng
- Page 291 and 292: N T I S2010 Review, simplify, and i
- Page 293 and 294: N T I S20109. SILVER JEWELRYStrengt
- Page 295 and 296: N T I S201011. CHYANGRA PASHMINA PR
- Page 297 and 298: N T I S201013. TOURISMStrengthsNatu
- Page 299 and 300: N T I S201015. IT AND BPO SERVICESS
- Page 301 and 302: N T I S201017. EDUCATION SERVICESSt
- Page 303 and 304: N T I S201019. HYDRO-ELECTRICITYStr
- Page 306 and 307: Appendix 1Methodology for Export Po
- Page 308 and 309: N T I S2010B. Data SourcesThe analy
- Page 312 and 313: N T I S2010Rank13) Tourism1 Germany
- Page 314 and 315: Appendix 3Updated Legislative Actio
- Page 316 and 317: N T I S2010specified management sys
- Page 318 and 319: N T I S2010than pesticide residues
- Page 320 and 321: Appendix 5Malaysia GAP (Skim Amalam
- Page 322 and 323: N T I S2010E. Document ControlQMS d
- Page 324 and 325: Appendix 7Good Agricultural Practic


