Benelux Real Estate - Vastgoedjournaal
Benelux Real Estate - Vastgoedjournaal
Benelux Real Estate - Vastgoedjournaal
- No tags were found...

Create successful ePaper yourself
Turn your PDF publications into a flip-book with our unique Google optimized e-Paper software.
<strong>Benelux</strong> <strong>Real</strong> <strong>Estate</strong> February 2010ContentsSummary 3Belgium vs the Netherlands 8Dutch property companies 10Belgian property companies 12Diversification effects of regions and sectors 14Highlights per company 15The Dutch property markets 20The Belgian property markets 26Brussels, EU political capital 32Belgian nursing homes 38<strong>Real</strong> estate investment markets 42The outlook for retail property 45The macro economy 54Companies 63Arjan KnibbeAmsterdam(31 20) 563 8780arjan.knibbe@ing.comJean-Yves DevlooAmsterdam(31 20) 563 8745jean-yves.devloo@ing.comCover photograph courtesy ofistockphotoPricing date 05/02/10 unless statedotherwiseAedifica....................................................................................................................65Befimmo ..................................................................................................................79Cofinimmo ...............................................................................................................93Corio......................................................................................................................113Eurocommercial Properties ...................................................................................137Home Invest ..........................................................................................................151Leasinvest <strong>Real</strong> <strong>Estate</strong>..........................................................................................161Nieuwe Steen Investments (NSI) ..........................................................................173VastNed O&I .........................................................................................................185VastNed Retail ......................................................................................................201WDP ......................................................................................................................217Wereldhave ...........................................................................................................229Appendices 245Disclosures Appendix 257Publication date 8 February 20101
<strong>Benelux</strong> <strong>Real</strong> <strong>Estate</strong> February 2010Our cover picture shows the Oosterscheldekering (the Eastern Scheldt storm surge barrier),between the Schouwen-Duiveland and Noord-Beveland islands, which is the largest of the 13ambitious Delta works series of dams, designed to protect the Netherlands from flooding. Theconstruction of the Delta Works was in response to the North Sea Flood of 1953. The ninekilometre-long Oosterscheldekering (kering meaning barrier) was initially designed, and partlybuilt, as a closed dam, but after public protest huge sluice-gate-type doors were installed inthe remaining four kilometres. These doors are normally open, but can be closed underadverse weather conditions. In this way the saltwater marine life behind the dam is preservedand fishing can continue, while the land behind the dam is safe from the water.On 4 October 1986, Queen Beatrix officially opened the dam for use by saying Destormvloedkering is gesloten. De Deltawerken zijn voltooid. Zeeland is veilig. (The floodbarrier is closed. The Delta Works are completed. Zealand is safe.) At the Neeltje-Jansartificial island, at one end of the barrier, a plaque is installed with the words "Hier gaan overhet tij, de wind, de maan en wij" ("Here the tide is ruled, by the wind, the moon and us (theDutch)").Source: WikipediaWe believe that after the flood of equity and convertible bond raisings, <strong>Benelux</strong> propertycompanies have built sufficient surge barriers of capital and have become masters of theirown destiny. The property companies are unlikely to be surprised again by a spring-tide ofadverse property and finance conditions which destroyed most of the returns in 2008 and2009. It is time to look forward.2
<strong>Benelux</strong> <strong>Real</strong> <strong>Estate</strong> February 2010SummaryOur target discountsrange from -5% to +10%to 2010F IFRS NAVOur valuation frameworkWe introduce a valuation framework which bases our price targets on target discountsor premiums to 2010F IFRS NAV. A large number of the Belgian companies,Wereldhave and NSI, do not provide EPRA NNNAV numbers, and this methodologytackles that problem. The target discounts range from -10% for VastNed Offices andIndustrial to +10% for Corio and Cofinimmo. Factors that drive the target discounts aremanagement track record, development exposure, flexibility of the business model,corporate governance, disclosure and quality of the assets and outlook for thesemarkets. We will initiate on Unibail-Rodamco shortly.We believe our target discount model is simple and straightforward and is moreattractive than DCF-based models, which often resemble black boxes, or PE ratioswhich favour gearing and fail to discriminate between prime and secondary property. Asum of the parts approach would become interesting as well when investors want toattach value to development pipelines, but this is currently not really the case.Average Belgian targetdiscount equals Dutchdiscount todayBear in mind that the EPRA NAVs are higher than the IFRS NAVs, as they add backall or parts of transfer tax, capital gains tax and differences between nominal valuesand market values of debt and derivatives. Drivers of the NAVs are propertyvaluations, retentions of earnings, currency results and dilutive or positive effects ofcapital raisings. The average market cap-weighted target premium to 2010F IFRS forBelgian property companies is 5%, which equals our Dutch weighted average targetdiscount.Fig 1 Valuation frameworkNameIFRS TargetPriceTotal MarketNAV Premium(+) Target price Price upside DPS 2009 return Rating cap2010F Discount(-) (€) (€) (%) (€) (%) (€m)Aedifica 35.66 -5 33.9 40.55 -16 1.88 -12 Sell 189Befimmo 58.28 5 61.2 59.27 3 3.90 10 Hold 152Cofinimmo 99.32 10 109.3 98.34 11 6.50 18 Buy 1,246Corio 45.07 10 49.6 44.37 12 2.64 18 Buy 3,379Eurocommercial properties 30.25 5 31.8 28.69 11 1.78 17 Buy 1,164Home Invest Belgium 50.55 -5 48.0 54.20 -11 2.43 -7 Sell 151Leasinvest 63.21 -5 60.0 63.00 -5 4.01 2 Hold 252NSI 13.75 0 13.1 14.34 -9 1.34 0 Hold 565VastNed Office&I 17.06 -10 15.4 12.81 20 1.62 32 Buy 240VastNed Retail 50.65 0 50.7 46.60 9 4.05 17 Buy 851WDP 26.90 5 28.2 32.62 -13 2.94 -4 Hold 409Wereldhave 72.71 0 72.7 63.50 15 4.59 22 Buy 1,382Average unweighted Belgium 0.8 0 4Average M Cap weighted Belgium 5.1 1 8Avg unweighted Netherlands 2.9 4 10Avg M Cap weighted Netherlands 5.1 10 17Avg unweighted total 1.3 2 9Avg M Cap weighted total 5.1 8 15Source: ING estimates3
_<strong>Benelux</strong> <strong>Real</strong> <strong>Estate</strong> February 2010Fig 2 Valuation sensitivitiesName IFRS NAV Sensitivity to target discount/premium Target Premium(+)2010F -10% -5% 0% 5% 10% 15% Discount (-)Aedifica 35.66 32.09 33.88 35.66 37.44 39.23 41.01 -5Befimmo 58.28 52.45 55.37 58.28 61.19 64.11 67.02 0Cofinimmo 99.32 89.38 94.35 99.32 104.28 109.25 114.21 0Corio 45.07 40.56 42.82 45.07 47.33 49.58 51.83 10Eurocommercial properties 30.25 27.23 28.74 30.25 31.76 33.28 34.79 5Home Invest Belgium 50.55 45.49 48.02 50.55 53.08 55.6 58.13 -5Leasinvest 63.21 56.89 60.05 63.21 66.37 69.53 72.69 -5NSI 13.75 12.37 13.06 13.75 14.44 15.12 15.81 0VastNed Office&I 17.06 15.35 16.2 17.06 17.91 18.76 19.61 -5VastNed Retail 50.65 45.59 48.12 50.65 53.19 55.72 58.25 0WDP 26.9 24.21 25.55 26.9 28.24 29.59 30.93 5Wereldhave 72.71 65.44 69.07 72.71 76.35 79.98 83.62 0Source: ING estimatesSix Buys, two Sells_Our recommendationsWe have six Buys, which we expect to post total returns of more than 15%, four Holdsand two Sells, which we expect to post negative returns of less than -5%. We haveBuy recommendations on Corio (upgraded from Hold, PT unchanged), Cofinimmo,Eurocommercial, VastNed Offices and Industrial, VastNed Retail and Wereldhave.The Sell recommendations are on the Belgian residential specialists, Aedifica andHome Invest Belgium, which we believe are currently expensive.The shape of the recoveryWe believe many Belgian companies will perform well in a W-shaped recovery whereanother dip will occur later this year or in 2011. Despite recent financial turmoiltriggered by Greece, we do not expect this to happen. In a V-shaped recovery wewould add upside through vacancy, more secondary real estate, more office space,and more financial gearing. We illustrate our recommendations for different shapes ofthe recovery in the figure below.Fig 3 Shapes of recoveryBUYNSIVastned O&IWDPWereldhaveCorioUnibail-RodamcoUnibail-RodamcoCorioCofinimmoBefimmoWereldhaveHomeInvestAedificaEurocommercialVastNed RetailV U WSELLUnibail RodamcoCorioCofinimmoBefimmoWereldhaveLeaseinvestCofinimmoBefimmoEurocommercialNSIVastned O&IWDPVastNed RetailSource: ING4
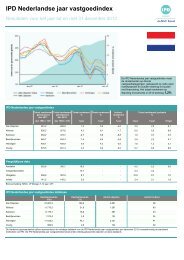
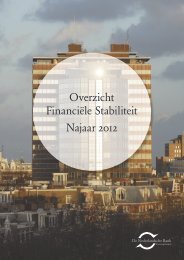
<strong>Benelux</strong> <strong>Real</strong> <strong>Estate</strong> February 2010The investment market for real estate is picking upTransaction volume upsharply in NL andFranceThe chart below clearly illustrates that the investment markets have picked up, inparticular in the Netherlands and France. We do not think the real estate markets willquickly return to normality.Fig 4<strong>Benelux</strong> and France investment markets in 2009 (€m)4,0003,5003,5003,0002,5002,0001,5001,00050006061,9401,7661,5861,0151,143748519325352761Q09 2Q09 3Q09 4Q9Netherlands Belgium FranceSource: CBRE 2010_Reasons to be carefulTerminations of realestate funds are an€18bn dark cloud over2010We think there are a number of reasons not to become too bullish in the short term. Amajor concern is the termination of a number of highly geared non-listed propertyfunds. The graph below breaks down these liquidations by sector and year. Disposal oflarge portfolios could put pressure on real estate prices. In the event of restructuringand/or refinancing, cash flows will look significantly different as the cost of interest willbe higher.Fig 5Termination of non-listed real estate funds by sector252015€Bn10502009 2010 2011 2012 2013 2014 2015 2016 2017 2018 2019Diversified Industrial / logistics Office Other Residential RetailSource: Inrev, ING Research_Indexation is weakeningIndexation comes to anear haltMost commercial property leases in Continental Europe are indexed to inflation or anadjusted type of inflation. In France and Sweden, this indexation is going to be below1% to negative for 2010. That means that a large proportion of the rental growth inthese markets will come to a halt.5
<strong>Benelux</strong> <strong>Real</strong> <strong>Estate</strong> February 2010Retail property catch-up may come to an endRetail property catch-upwith offices is overWe believe that the relative strength of the retail property markets in comparison tooffice real estate markets will decrease as the yield catch-up seen in recent years hascome to an end, and most institutional investors have reached their desired retailweighting. Retail is still the sector where much more value can be added throughactive management, but the performance race with offices has become harder.Retail trends hardly in favour of shopping centresRetail property risks onthe riseWe believe that there are a number of potential trends that will lower future returns ofretail property. We see the following important changes ahead:• The end of the growth era of multiples.• French Food retailers internalise and beef up development.• E-commerce depresses footfall and turnover.• Proximity and authenticity gain in importance.• SRI does not fit with the traffic of a regional mall.• Multiples opening in smaller centres, eroding the exclusivity of larger centres.• Physical presence is declining in importance as social networks move to the web.• Random meetings have become less important with the use of mobile phones.• Sports, culture, and the internet are all competing for consumers’ time budget.• Food retailers are trying to find the right web-based format.We discuss these changes in depth later in this report. We believe that retail propertyrisk is increasing and that these risks have not been adequately presented by the realestate investment industry.Portfolio weighted GDP averages: 3.1 – 3.6%We have calculated the average portfolio-weighted GDP growth numbers for theinternational Dutch companies. They range from 3.1% to 3.6% compound for 2010 and2011. Strongest GDP performance will be shown for Unibail-Rodamco, Wereldhave(despite its Finnish weighting) and NSI. VastNed Retail’s portfolio will see the lowesteconomic growth, 3.1%, as a result of its Spanish exposure.Portfolios of the Belgian majors comparedWe calculatedoverweight andunderweight positionsin relation to the marketIn Belgium we have compared the portfolio breakdowns of the majors, Cofinimmo andBefimmo. The breakdown is shown in the chart below and illustrates Befimmo’soverweight in Brussels-North and Cofinimmo’s overweight in the Decentralised area.We also analysed the differences of impact on gearing between off-balance sheet(Cofinimmo) and on-balance sheet (Befimmo) sale of receivables.6
<strong>Benelux</strong> <strong>Real</strong> <strong>Estate</strong> February 2010Fig 6 Cofinimmo and Befimmo overweight and underweight areasPeripheryDecentralisedLouiseLeopoldNorthMidiCentre-15.0 -10.0 -5.0 0.0 5.0 10.0 15.0 20.0 25.0%CofinimmoBefimmoSource: Company data, ING estimates_Retail portfolios mappedUtrecht, Flevoland andNoord-Holland expectedto show strongestpopulation growthWe have mapped the top 10 Dutch retail assets of our universe on a map withpopulation growth indicated by colour on page 19. We believe this is a powerful tool tocompare Dutch retail portfolios. Utrecht, Flevoland and Noord-Holland are expected toshow the strongest growth in population. Corio and Unibail-Rodamco are the dominantplayers in these regions. The map positions 18% of the total holdings of Corio.7
_<strong>Benelux</strong> <strong>Real</strong> <strong>Estate</strong> February 2010Belgium vs the NetherlandsRemarkably similarperformancesUnibail-Rodamcodeserves a premiumThe table below shows the returns from our Belgian and Dutch universes. It is strikingto see that all the differences in strategies and portfolios have lead to such similarperformances. The 10-year unweighted averages of the companies have been 3%higher in our Dutch universe then in our Belgian universe. Over the past three years,the Belgian companies have shown their defensive strengths and outperformed theDutch companies on average by three percentage points. In the 12 months to 1February 2010, the Dutch showed their strong recovery potential markedly.The most successful company by a large distance is Unibail-Rodamco. We believethat this management team clearly deserves to trade at a premium to its <strong>Benelux</strong>peers, even if the French retail property market underperforms a number of othermarkets for reasons discussed elsewhere in the report.Fig 7 Average total returns at 1 February 2010 (%)1 year 3 year 5 year 10 yearAedifica 10 -1 N/A N/ABefimmo -5 -5 1 6Cofinimmo 13 -8 0 5Home Invest Belgium 22 2 5 9Leaseinvest 22 -5 6 6WDP 12 -7 5 12Belgian unweighted average 12 -4 3 8Corio 33 -6 5 12Eurocommercial properties 29 -6 6 11NSI 22 -7 2 8Unibail-Rodamco 59 -2 16 20VastNed Office&I 64 -13 -2 1VastNed Retail 62 -6 5 10Wereldhave 29 -8 2 11Dutch unweighted average 43 -7 5 11<strong>Benelux</strong> unweighted average 29 -5 4 9Source: DatastreamIn Belgium, the larger companies seem to have underperformed the smaller ones. Inthe Netherlands, the pack is extremely close. Over 10 years VastNed Retail,Wereldhave, Corio and Eurocommercial have each returned between 10% and 12%per annum, on average. WDP is the only Belgian company that produced a similarperformance.Dutch take more riskWe believe that the risk of the property companies in the Netherlands is also higher.Apart from currency risk that is present at a number of companies, the developmentrisk is substantially higher, on average.8
_<strong>Benelux</strong> <strong>Real</strong> <strong>Estate</strong> February 2010Fig 8 Unweighted average total returns (%)45403530252015105042.612.210.56.87.93.9 3.54.81 year 3 year 5 year 10 yearBelgium unweighted averageDutch unweighted averageSource: Datastream9
_<strong>Benelux</strong> <strong>Real</strong> <strong>Estate</strong> February 2010Dutch property companiesAlthough the debt markets are still very discriminating, they have opened up for solventlenders which bring equity to the table. At the same time, banks have not yet started toforce borrowers to liquidate, at least not on a large scale. However, the refinancing ofloans that come to an end is a significant issue for a broader recovery of the propertymarkets.Although in the UK a more pronounced bounce in values is taking place, investorsshould take into account that the downward valuations in the UK have also been muchsteeper. The UK value decreases were particularly steeper than in Belgium, wherevalues fell by less than 5%.Management teamsDutch property companies operate a two-tier board. The table below lists the executiveboards of the property companies and a number of individuals we would regard as keyto the company, as far as we can assess. Eurocommercial has by far the most stablemanagement team, as the average director has been at the company since 1993. NSIand Wereldhave have seen most turmoil in the boardroom recently. Unibail Rodamcohas the youngest CEO and Eurocommercial the oldest.Fig 9 Board composition of Dutch property companiesCompany, title Name, average Year* Age* At company Employees NoteUnibail Average 1959 50 2001 1,673 Avg 2008CEO Poitrinal 1967 42 1995CFO van Rossum 1956 53 2006OBM** Dessolain 1956 53 1997OBM Julien-Laferriere 1958 51 1997OBM Pourre 1957 52 2002OBM Tonckens 1962 47 2009Corio Average 1956 53 2002 348 Avg FTE 2008CEO Groener 1958 51 1996CFO Haars*** 1951 58 2007OBM Fontaine 1958 51 2003ECP Average 1958 51 1993 48 Avg FTE 2008/09CEO Lewis 1945 64 1991CFO van Garderen 1962 47 1994Country head Mills 1959 50 1993Country head Newton 1958 51 1992Country head Santini 1966 43 1994Wereldhave Average 1961 48 2004 104 Avg FTE 2008 - 130 in 2009CEO Pars 1961 48 2009MD Anbeek 1964 45 2009Group treasurer Bloema 1958 51 1994VastNed Average 1961 48 2002 104 FTE avg 2008CEO van Gerrevink 1950 59 2002CFO de Witte 1966 43 2003General council du Pont 1966 43 2000NSI Average 1968 41 2009 27 FTE 30/12/2008CEO Buijs 1965 44 2008CFO van Dongen 1971 38 2009Avg Netherlands 1960 49 2002 384* Due to rounding we could be off one year.** Other board member*** Corio CFO Jan Haars has announced his intention to retire in 2010Source: ING Research10
_<strong>Benelux</strong> <strong>Real</strong> <strong>Estate</strong> February 2010The chart below highlights the average age of the board members and other keyindividuals, and the number of people at the company. NSI has the youngest board.With 1,673 full-time equivalent staff, Unibail employs more than four times as manypeople as Corio, with 348.Fig 10 Board characteristics and number of employees605040302010050535148 4841168 7571Unibail Corio ECP Wereldhave VastNed NSI1,8001,6001,4001,2001,0008006004002000Average age Av. years at company Employees rhsSource: ING Research11
_<strong>Benelux</strong> <strong>Real</strong> <strong>Estate</strong> February 2010Belgian property companiesBelgium currently has 14 quoted property companies that operate the REIT 1 structure.These property companies are ranked below, according to portfolio valuation.Fig 11 Belgian REIT overview in terms of portfolio value (€m)3,5003,0002,5002,0001,5001,0005000CofinimmoBefimmoWDPIntervest OfficesLeasinvest <strong>Real</strong> <strong>Estate</strong>Retail <strong>Estate</strong>sWereldhave BelgiumAedificaIntervest RetailAscencioHome Invest BelgiumMonteaWarehouse <strong>Estate</strong>s BelgiumServiceflats InvestIntervest Offices, Intervest Retail and Wereldhave Belgium are the Belgian subsidiaries of Dutch property companiesVastNed Offices/Industrial, VastNed Retail and Wereldhave NV, which are discussed further in this report.Source: ING ResearchOn average, Belgianboard members areolder than Dutch boardmembersIn the table below, we show an overview of the board composition of Belgium’sprincipal REITs. When compared to the Dutch companies (see below), Belgianproperty companies’ board members are 9 years older on average, but havecomparable experience at the company (7 years).1 The REIT structure has been implemented in Belgian law as a Sicafi (Frenchequivalent) or a Bevak (Flemish equivalent)12
__<strong>Benelux</strong> <strong>Real</strong> <strong>Estate</strong> February 2010Fig 12 Board composition of Belgian property companiesCompany, title Name, average Birth year * Age * At company Employees<strong>Real</strong> estate assets/employee (€m)Aedifica average 1951 59 2006 25 14Chairman Duplat 1937 73 2005CEO Gielens 1965 45 2005CFO Kotarakos 1973 37 2007Befimmo average 1947 63 2000 34 56Chairman De Vos 1953 57 2002CEO De Blieck 1957 53 1999OBM ** Vandewalle 1944 66 1995Cofinimmo average 1952 58 2003 108 28Chairman Dirckx 1936 74 2001CEO Fautré 1960 50 2002CFO Carbonnelle 1953 57 1999Home Invest Belgium average N/A N/A 2007 10 20Chairman Pleeck N/A N/A 2004CEO Mertens 1956 54 2002Leasinvest <strong>Real</strong> <strong>Estate</strong> average N/A N/A 2001 17 31Chairman Bertrand 1951 59 1999CEO Appelmans 1953 57 1999WDP average 1958 52 2002 25 32Chairman Duyck 1950 60 1999CEO De Pauw 1954 56 1999CFO Uwents 1969 41 1999Average Belgium 1952 58 2003 30* Due to rounding we could be off one year** Other board memberSource: ING researchCofinimmo is Belgium’slargest in terms ofassets, employees andyears sinceestablishmentAedifica is the youngest Belgian property company (founded in 2005) and Cofinimmois the oldest (founded in 1983) and the largest. Befimmo has the oldest and mostseasoned board members.Fig 13 Board characteristics and number of employees706059635852120100504030201039638 88060402000Aedifica Befimmo Cofinimmo Home InvestBelgiumLeasinvest<strong>Real</strong> <strong>Estate</strong>WDPAverage age Average years at company Employees RHSSource: ING research13
<strong>Benelux</strong> <strong>Real</strong> <strong>Estate</strong> February 2010Diversification effects ofregions and sectorsMerits of geographicaldiversification areexaggeratedCorrelation betweenContinental and Dutchretail: 0.98Several property companies are diversifying across Europe, and Wereldhave is evendiversifying into the US. We believe the merits of geographical diversification areexaggerated. Companies should focus on choosing the most attractively priced marketand take into account its risk.The most strikingly high correlation is that between Continental and Dutch retail: 0.98.This means that the addition of continental retail to a Dutch portfolio does not reducethe risk in any significant way. Lowest correlations are those between Dutch officesand Non European retail: 0.51 and Non European office space and Anglo-Saxon retail:0.47. Wereldhave’s statement that it wants to diversify by having UK and US assetsmakes sense. The real question is whether investors want to give it the mandate to doso or keep that decision in-house.Fig 14 Correlations between office and retail market returnsOffice Retail Anglo-Saxon Outside of Europe Continental Netherlands RetailAnglo-Saxon 0.85 0.79 0.54 0.52 Anglo-SaxonOutside of Europe 0.47 0.61 0.86 0.80 Outside of EuropeContinental 0.72 0.81 0.87 0.98 ContinentalNetherlands 0.59 0.51 0.85 0.68 NetherlandsAnglo-Saxon Outside of Europe Continental NetherlandsSource: Company data, ING estimates14
<strong>Benelux</strong> <strong>Real</strong> <strong>Estate</strong> February 2010Highlights per companyBelgiumAedificaAedifica is the second-largest nursing homes REIT in Belgium, after its larger peerCofinimmo. While the nursing homes (c.46% of the portfolio) add stability to thebusiness model, Aedifica still has considerable cyclical exposure in hotels (10% of theportfolio) and Brussels-based furnished apartments (12% of the portfolio), which relyon short-term rentals. Trading at c.21x FY09/10F PER, we find Aedifica overboughtand expect this cyclical exposure to largely offset nursing homes resilience. Showingoperating margins of c.70% 2009/10F, we believe Aedifica must grow to become moreefficient, gain more international recognition and improve the shares’ liquidity. We findthe young management team very ambitious in achieving more growth and expectfurther nursing home deals, potentially with additional equity issuance. We initiatewith a Sell rating and a target price of €33.7.BefimmoBefimmo is Belgium’s pure play investor in prime offices, and forms part of the BEL-20index. We believe Befimmo will underperform the offices market in the next 12 months,as it has a large exposure to the c.400,000m² of speculative office space coming on tothe market and also has a number of key renovations that will come on stream over2010-11, which have not yet been let. In addition, the Axento Luxembourg officecomplex which was recently acquired (value c.€100m) will have its rental guaranteeexpire at end-2010. We would not be surprised to see considerable lease incentivesbeing used to keep occupancy at decent levels. The weak outlook for the Brusselsoffices market was confirmed during the FY08/09 results presentation, whenmanagement stated it expects decreasing CFPS. We expect a 16% drop in EPS YoY.We prefer Cofinimmo over Befimmo, for a number of reasons put forward below. Wemaintain a Hold rating, and lower our target price to €60.7.CofinimmoCofinimmo is Belgium’s largest REIT and is also a member of the BEL-20 index. It hasan office portfolio that is comparable in size with Befimmo’s. Cofinimmo has anoverweight offices position in the Brussels decentralised district, while Befimmo isoverweight in the Brussels North district. We would not be surprised if Cofinimmodecreased this overweight position and moved more into nursing homes (currentlyc.25% of the portfolio), potentially doubling the size of this portfolio. We expectCofinimmo to outperform Befimmo because of its favourable diversification into nursinghomes and pubs, its innovative financing strategy, which has obviated the need for adilutive rights issue (unlike Befimmo), its corporate governance structure which allowsit more flexibility than Befimmo (where AG Insurance has some influence), and theproven management track record. We upgrade to Buy and increase our target priceto €109.2.Home Invest BelgiumHome Invest Belgium is Belgium’s focused apartment REIT, and is active primarily inthe Brussels area. Unlike its peer, Aedifica, it does not intend to expand into nursinghome assets. Trading at c.26x 2010F PER, we believe Home Invest Belgium isovervalued. The current premium valuation to IFRS NAV is not justified, in our view,15
<strong>Benelux</strong> <strong>Real</strong> <strong>Estate</strong> February 2010and does not reflect the low liquidity of the stock and the small size of the portfolio(valued at c.€210m) and the low operating margin at c.66%. Home Invest Belgiumshould present results in English. We initiate with a Sell rating and a target price of€48.0.Leaseinvest <strong>Real</strong> <strong>Estate</strong>Leasinvest <strong>Real</strong> <strong>Estate</strong> is Belgium’s diversified offices, retail and logistics company,looking to establish a balanced portfolio of retail assets and offices, spread overBelgium and Luxembourg. In this process, we would not be surprised if the Belgianoffices portfolio of c.€160m was sold, to the advantage of retail assets. We like theresilient effect of the addition of committed developments, but are somewhat hesitantabout the potentially large influence of Ackermans & van Haaren on the managementteam. We initiate with a Hold rating and a target price of €60.0.WDPWDP is Belgium’s leading semi-industrial and logistics player. It has a strongreputation in property development, which has allowed a historical premium valuationto IFRS NAV. It has a c.€50m land reserve and all important building permits in place,making it geared to seize opportunities. WDP currently still has to renegotiate anumber of lease expiries and has temporarily halted any speculative developments,limiting the potential for near-term development gains. We do not think WDP currentlydeserves a premium valuation as high as its historical average and stick to a 5%premium valuation to IFRS NAV 2010F. We downgrade to Hold from Buy andreduce our target price to €28.2.Upgrade to Buy, PTunchangedNetherlandsCorioAll eyes are on the deal with Multi, in particular on the size and the entry yield. Also itwill be interesting to see if the parties can reach agreement over assets outsideGermany. In our recent note we have calculated the impact on EPS and NAV of thedeal, when financed with debt. CFO Jan Haars will leave the company in May.We have analysed the sensitivities of EPS and NAV per share for a number of Multiportfolio sizes and acquisition yields. The table below highlights Corio’s 2010F EPSsensitivity to vacancy rate and like for like rental growth.Sensitivity of our 2010F EPS adj to vacancy rates and LfL (€)0% 1% 2% 3% 4% 5% 6% 7%-1% 0.09 0.05 0.00 -0.05 -0.09 -0.14 -0.18 -0.230% 0.14 0.09 0.04 0.00 -0.05 -0.09 -0.14 -0.191% 0.18 0.13 0.09 0.04 0.00 -0.05 -0.10 -0.142% 0.22 0.18 0.13 0.09 0.04 -0.01 -0.05 -0.103% 0.27 0.22 0.18 0.13 0.08 0.04 -0.01 -0.054% 0.31 0.27 0.22 0.17 0.13 0.08 0.04 -0.015% 0.36 0.31 0.26 0.22 0.17 0.13 0.08 0.036% 0.40 0.35 0.31 0.26 0.22 0.17 0.12 0.08Source: INGWe upgrade Corio from Hold to Buy, PT unchanged at €50.Eurocommercial PropertiesEurocommercial is going to maintain its steady course. It has such a low vacancy ratethat it may underperform in a V-shaped recovery. Also it will feel the effect of a sharpdrop in indexation in France and Sweden. Our model has not been updated for the16
_<strong>Benelux</strong> <strong>Real</strong> <strong>Estate</strong> February 2010reported numbers, but investors will hardly notice the difference. Investors with apessimistic outlook should overweight this stock in their real estate stock portfolio. Weinitiate with a Buy rating and a price target of €31.80.NSINSI is looking for sizeable acquisition opportunities, primarily in France, and potentiallyneeds additional equity to grow, in our view. The new CEO wants to achieve aturnaround by adding and in-sourcing development and creating a balanced portfolioover the Netherlands, Switzerland and France. We look forward to hearing more aboutthe letting progress at NSI. We initiate with a Hold rating and a price target of €13.Unibail-RodamcoWe believe that Unibail demonstrated it had the strongest company and the winningbusiness model in the downturn. If Unibail aims to outperform in an upturn, it probablyneeds to change its portfolio or business model. The split of Liberty may be an idea toconsider, so that highly lucrative office opportunities do not compete for capital withstrategic retail acquisitions.The recent €715m deal with Simon is hard to interpret as yields have not beendisclosed. Excluding the capital expenditure on the stakes in the six developments, thecapital outlay is below 4% off the balance sheet. The crucial question for Unibail is atwhat stage size becomes a handicap as the flexibility decreases. We will initiate onUnibail Rodamco shortly.VastNed Office & IndustrialVastNed Office and Industrial is the stock with the highest vacancy rate in theNetherlands. Although we believe that the Dutch office markets are going to recoververy slowly, we believe that the stock offers good value at 26% below IFRS 2010F. Weinitiate with a Buy rating and a price target of €16.20.VastNed RetailVastNed Retail offers good operational upside from the retail property companies as aresult of its 3% vacancy rate and 6% reversionary potential. The Spanish weighting of26% will hold back a strong recovery. This is a good stock for the optimistic investor. Thedividend yield of 8.7% seems unsustainable to us but consensus is already pointing inthis direction. With €4.06, we are more optimist about 2009 EPS then consensus (€3.95)and the company (€4.00). We initiate with a Buy and a price target of €50.65.WereldhaveThe new management team of Wereldhave has announced its new strategy. Wecomment extensively on the elements in the note later in this report. Below we providea table with the verdict on the main elements.Fig 15 Wereldhave strategy changes and ING verdictVerdictCommentIncrease retail to 50-60% +/- Too late and potentially too littleNine submarkets +/- Conveniently close to heritageTwo continents -- Lacks credible Pan-US scanMinimal size of presence €400m - Seems low, especially for retailOne sector per submarket +/- Inflexible but good focusDisposal of sub €20m assets and industrial property ++ Cost and management time efficientRetail focus on value-add through management + Is there another way? New for WereldhaveOffice and apartment value add by timing ++ Timing is more than half the returnDevelopments adds 5–10% (€180-360m) per annum ++ Cost conscious, new and SRI- and timing-gripSource: ING17
<strong>Benelux</strong> <strong>Real</strong> <strong>Estate</strong> February 2010Despite its US, UK and greenfield development exposure, Wereldhave is a very riskaversecompany. Execution of strategy will be key to results, more than the propertymarkets. We initiate with a Buy rating and a price target of €72.70.Fig 16 Dividend yields of <strong>Benelux</strong> real estate stocks (%)14.0%12.0%10.0%8.0%6.0%4.0%2.0%0.0%AedificaBefimmoCofinimmoCorioEurocommercial propertiesHome Invest BelgiumLeasinvestNSIUnibail RodamcoVastNed Office&IVastNed RetailWDPWereldhaveSource: Company data, ING estimates, 5 Feb. 2010_The Dutch retail holdingsDarker shadingrepresents growthMap locates 18% ofCorio’s total portfolioand 56% of its Dutchretail portfolioThe map on the next page reflects the retail positions of the listed sector in theNetherlands. The colour of the map indicates the population growth, the darker theshading, the greater the population growth. Utrecht, Flevoland and Noord-Holland areexpected to show the strongest growth in population.Corio and Unibail-Rodamco are the dominant players in these regions. Wereldhavehas three centres in the Netherlands today: Leiderdorp, Etten Leur and Arnhem. TheVastNed positions in the larger cities are all in high street retail; as a result they are notindicated on the map.As indicated in the tables on the map, Corio is the biggest owner of retail property, bysurface area, with a portfolio of 339,100 sqm. Second comes Unibail-Rodamco, thenNSI, VastNed and Wereldhave. We have chosen to put the top 10 assets on the map.As a result the map reflects 56% of Corio’s Dutch retail property portfolio. AS Corio hasa 32% weighting to Dutch retail, the map reflects 18% of total assets of Corio.We believe that Corio has the strongest cluster with the Utrecht positions, in particularif we include the Leidsche Rijn development (not on map). Next would be theRotterdam suburban cities cluster of Unibail-Rodamco. In Amsterdam, both companieshave reached comparable positions, if we exclude Almere. Unibail has sold theVendex portfolio some years ago and that contained very significant Amsterdam primedepartment store assets.18
_Fig 17 Dutch retail holdings of the Dutch companies19Owner Name centre (Location)sqmOwner Name centre (Location)sqmCorio Hoog Catherijne (Utrecht)67300 NSINovicenter (Alphen a/d Rijn) 9360Villa ArenA (Amsterdam)50400Het Rietveld (Apeldoorn) 23890Alexandrium I (Rotterdam)46100Hoofddorp 1958Presikhaaf (Arnhem)31500Leiderdorp 5807Cityplaza (Nieuwegein)29100Middenwaard (Heerhugowaard)28900Middelburg 20363Oostplein (Roosendaal) 10366Pieter Vreedeplein (Tilburg)27900Veenendaal 19539In de Bogaard (Rijswijk)19800Emiclaer (Amersfoort)19700Hagenborgh (Almelo) 9215Corio Center (Heerlen)18400t Loon (Heerlen) 25177Zevenkamp (Rotterdam) 9943WereldhaveWinkelcentrum Kronenburg (Arnhem) 31752Winkelcentrum Etten-Leur (Etten-Leur) 22146Winkelcentrum Winkelhof (Leiderdorp) 17857Kerk (Geldrop) 4537Source: INGOwner Name centre (Location) sqmUnibail- Stadshart (Almere) 19900Stadshart (Zoetermeer) 50300Stadshart (Amstelveen) 48200De Bossche Boulevard (Den Bosch) 39200Vier Meren (Hoofddorp) 31600Piazza Center (Eindhoven) 23900Leidsenhage (Leidschendam) 21700Eggert Winkelcentrum (Purmerend 19900St. Jorisplein (Amersfoort) Carnisse Veste (Barendrecht) 171730015900Owner Name centre (Location) sqmVastNedRoermond 34098RetailHet rond (Houten) 27991Capelle a/d Ijssel 13702Wageningen 6058Vuldersbrink (Harderwijk) 4735Eindhoven 3102Doorwerth 2854Tilburg 2696Zoetermeer 2482Zoetermeer 2274<strong>Benelux</strong> <strong>Real</strong> <strong>Estate</strong> February 2010
__<strong>Benelux</strong> <strong>Real</strong> <strong>Estate</strong> February 2010The Dutch property marketsWeak Dutch propertyperformance does notnecessarily suffocatereturnsWe believe that the Dutch retail and office markets may underperform most othermarkets in Europe for a number of reasons. Retail markets will feel the pressure ofexisting and on-stream oversupply. In addition, Dutch internet literacy is likely to beabove the European average, resulting in a greater e-commerce impact. Dutchproperty companies have limited exposure to the Dutch retail markets, as illustrated inthe table below. ECP has no exposure.Fig 18 Dutch retail weightings of property companies50%45%40%35%30%25%20%15%10%5%0%Corio VastNed Retail Unibail-RodamcoWereldhaveNSISource: Company data, ING estimatesFrom location, location,location to LETTING,LETTING, LETTINGA very strong decadeThe office markets also suffer from occupants that have too much space and will notlet additional space even when they are hiring. Subletting is another factor slowing therecovery. The Dutch office players VastNed O&I and NSI therefore need to focus ontheir vacancies and reduce these numbers.The Dutch property markets have performed well in the past 10 years. According toROZ/IPD, no single real estate category posted negative returns in any year since2000. 2009 is set to become the worst year of the past decade, but after three quartersall categories were still posting positive total returns. The other weak year was 2003,when retail posted 9.2% and office space produced a 5.2% total return.The quality of the numbers is sometimes in doubt, as the institutional holders of realestate that contribute to the database have interest in the outcome and are oftenrewarded partly on the basis of their relative performance. Nevertheless, we believethat these data offer a valuable view of historic returns.Fig 19 ROZ/IPD property returns 2001-09 (%)Total returns 2001 2002 2003 2004 2005 2006 2007 2008 1Q09 2Q09 3Q09 9M09Retail 9.9 9.8 9.2 10.3 13.5 14.9 13.4 5.5 0.5 0.1 0.9 1.5Office 12.0 8.3 5.2 5.5 7.0 11.5 11.3 0.9 0.6 0.5 0.6 1.7Industrial 10.5 9.5 6.4 8.5 11.1 13.0 11.7 4.0 1.0 0.4 1.1 2.5Residential 12.1 8.4 7.1 7.6 10.1 11.4 9.6 2.8 0.5 1.6 0.3 2.4Mixed use 11.1 10.5 10.1 8.6 11.9 13.2 13.1 8.5 1.5 0.4 1.1 3.0All property 11.4 8.8 7.1 7.8 10.2 12.5 11.3 3.3 0.2 0.9 0.6 1.7Source: ROZ/IPD20
__<strong>Benelux</strong> <strong>Real</strong> <strong>Estate</strong> February 2010Retail outperformedoffice space by 2.7% onaverageCatch up is over,underweight iscorrectedRetail outperformancedrivers are changingFor the listed sector, the relevant question is whether to overweight office or retailspace. The chart below gives the different returns over the past 10 years. It is clearthat retail has dramatically outperformed office space in the Netherlands. The averageoutperformance has been c 2.7% per annum.One underlying factor has no doubt been that 10 years ago retail was valued at ahigher yield than office space and that gap has been closed or even reversed inseveral cases. Another reason is that institutional portfolios were likely to beunderweight retail 10 years ago and the catch up resulted in a re-pricing.We believe that the outperformance may have come to an end as the yield catch upeffect is over and institutional investors have had ample time to reach their desiredweightings.Fig 20 Retail Total Return -/- Office Total Return (%)7.06.05.04.03.02.01.00.0-1.0-2.0-3.02001 2002 2003 2004 2005 2006 2007 2008 2009 9mRetail TR -/- Office TRSource: ROZ/IPD, ING ResearchOffice underperformedall other sectors in theNetherlands in the past10 yearsIf we look at the rebased compound returns per real estate sector the picture belowemerges. Mixed use and other property have outperformed, closely followed by retail.The office sector performed worst in the Netherlands.Fig 21 Rebased total returns Dutch real estate 2000-092602402202001801601401201002000 2001 2002 2003 2004 2005 2006 2007 2008 20099mRetail Office Industrial Residential Mixed use/otherSource: ROZ/IPD21
_<strong>Benelux</strong> <strong>Real</strong> <strong>Estate</strong> February 2010Industrial outperformed offices every year but 2001, on average by c 1.5%. So theheavy Wereldhave distribution weighting in the Netherlands seems reasonably wellfounded.Dutch retail marketsBelgium and Germanylowest number ofshopping centre sqm/capitaThe Dutch and the Swedes enjoy one of the highest number of sqm of shopping spacein Europe, as can be seen in the bar chart below. Germany, where Corio wants togrow its portfolio, and Belgium have the lowest number of sqm per capita. Highestrecent growth (2003 – 2008) of the stock per capita took place in Czech Republic, c17%, Poland, c11%, and Italy, 10%.Fig 22 European shopping centre stock and growthSource: ING <strong>Real</strong> <strong>Estate</strong> Investment ManagementUtrecht and NoordHolland lowest retailvacanciesThe table below shows the breakdown of total vacancy by province. Zuid-Holland isdoing less well than Noord-Holland, which has the lowest vacancy rate. Utrecht alsoscores below the national average of c 5%. The vacancy rate is particularly high insecondary locations, where the listed property companies are not present, orunderweight. We believe that VastNed Retail and NSI have the highest exposure tosecondary retail.22
__<strong>Benelux</strong> <strong>Real</strong> <strong>Estate</strong> February 2010Fig 23 Vacancy rates by Dutch provinceLimburgZeelandOverijsselNoord-BrabantZuid-HollandGroningenTotal/averageGelderlandDrentheFlevolandUtrecht ProvincieFrieslandNoord-Holland0 20 40 60 80 100 120 140 160 180Vacancy rate (national average = 100)Source: LocatusLarger cities have lowerretail vacanciesRetail vacancies in larger cities are lower than those in the provinces. The chart belowshows that in particular Rotterdam has retail space is seeing a lot of vacancy. Utrecht,where Corio has its Hoog Catharijne re-development, has a low vacancy, also whentaken into account that it is the smallest of the four cities. Further Corio positions in theUtrecht region are the Nieuwegein extension and the Leidsche Rijn shopping centre.Fig 24 Retail vacancies (in sqm) in larger Dutch cities807060504030201002001 2002 2003 2004 2005 2006 2007 2008 2009 Q3Amsterdam Rotterdam the Hague UtrechtSource: Locatus23
_<strong>Benelux</strong> <strong>Real</strong> <strong>Estate</strong> February 2010Very significant retailsupply ahead in NLBelgium and Germanyvery restrictiveFrom a supply point of view, the Dutch situation hardly seems attractive for investorsas The Netherlands has 80sqm per 1,000 inhabitants in the pipeline, either underconstruction or planned with full/outline planning permission or building permit.Germany and Belgium have the smallest pipeline per capita. This makes thosemarkets attractive. Wereldhave is one of the larger retail developers in Belgium.Fig 25 Shopping centre pipeline per capitaSource: ING <strong>Real</strong> <strong>Estate</strong> Investment ManagementRelaxed planning andhigh vacancy rates_Office marketsThe Dutch office markets are characterised by a fairly relaxed planning regime and aconsequently high vacancy rate. In 2009 take up fell in Amsterdam and Rotterdam butrose in Utrecht and The Hague, which are dominated by government-relatedoccupiers. Supply continued to come onto to the market in Amsterdam, which addedmore than 10% to stock. In the other cities additional supply was limited.Fig 26 Big four take up Fig 27 Big four supply300250200150100501400120010008006004002000Amsterdam Rotterdam The Hague Utrecht0Amsterdam Rotterdam The Hague Utrecht2008 20092008 2009Source: CBRE February 2010 Source: CBRE February 2010Subletting andoversized contracts willslow recoveryWe do not expect to see a sharp recovery in office space as many occupants are likelyto have too much space, and even if they start to hire, they will not rent more space. Inaddition, the numbers below do not reflect the subletting market, where quality spacecan often be rented for attractive rents.24
_<strong>Benelux</strong> <strong>Real</strong> <strong>Estate</strong> February 2010Fig 28 Vacant office space since 2005 (sqm *1,000)2005 2006 2007 2008 1Q09 2Q09 3Q09Region Amsterdam 1,361 1,240 1,141 1,049 1,122 1,065 1,121Region Rotterdam 511 491 464 339 408 340 354Region Den Haag 460 463 464 546 580 533 544Region Utrecht 313 361 365 303 305 315 305Groningen 160 137 128 132 132 132 135Friesland 65 53 43 48 48 46 46Drenthe 58 63 31 44 44 46 45Overijssel 218 236 228 274 273 272 272Gelderland 449 455 446 448 448 458 473Utrecht Provincie 500 515 457 546 546 547 552Flevoland 104 84 127 154 154 151 145Noord-Holland 561 523 501 593 592 569 534Zuid-Holland 378 413 365 387 387 417 431Zeeland 20 21 10 12 12 12 11Noord-Brabant 639 619 564 534 534 495 519Limburg 161 165 180 202 202 216 223Total 5,958 5,836 5,511 5,608 5,786 5,614 5,710Source: We're AmsterdamTotal vacant space stayed more or less stable around 5.7m sqm. From the table belowit can be seen that the take up is slowly moving up on a national level.Fig 29 Dutch office space take-up (sqm *1,000)1Q09 2Q09 3Q09Region Amsterdam 85 97 29Region Rotterdam 30 23 27Region Den Haag 97 - 10Region Utrecht 17 12 16Groningen 9 3 5Friesland 1 14 6Drenthe 3 1 17Overijssel 9 23 4Gelderland 35 81 110Utrecht Provincie 40 67 26Flevoland 3 4 37Noord-Holland 21 16 45Zuid-Holland 38 23 36Zeeland - - 2Noord-Brabant 28 130 200Limburg 33 60 18Total 445 553 587Source: We're Amsterdam25
__<strong>Benelux</strong> <strong>Real</strong> <strong>Estate</strong> February 2010The Belgian property marketsBelgium has a relatively short history of IPD data. We outline the results below.Fig 30 IPD Belgian property returns 2005-08 (%)16Total return per annum (%)141210864202005 2006 2007 2008All property Retail Offices Logistics/Industrial OtherSource: IPDIPD historicalperformanceAnnualised IPD returns per asset type are depicted above. Retail showed thestrongest performance, generating a total annualised return of 10% in 2008. Officesand logistics/industrial property showed strong income returns, but took large hits incapital growth over 2008. No 2009 figures have been published yet.Fig 31IPD Belgian property return 2008: incomeversus capital growthFig 32 IPD Belgian property index compositionAnnualized return (%)1086420-2ResidentialLogistics/Indu 6%strial4%Other3%Retail22%-4All propertyRetailOfficeLogistics/IndustrialIncome return Capital growthOtherOffices65%Source: IPDSource: IPDLower retail stock andhigher offices stockcompared to theNetherlandsThe composition of the Belgian IPD index shows a large weighting of the officesproperty market and a low weighting of the retail property market. Compared to theNetherlands, which has c.300-350 sqm of retail property per 1,000 inhabitants,Belgium has a substantially lower retail property stock of 100-150 sqm per 1,000inhabitants (see “The Dutch retail markets” for a full overview).26
_<strong>Benelux</strong> <strong>Real</strong> <strong>Estate</strong> February 2010The Brussels offices marketThe Brussels office market is touching record high vacancy rates at >12%.Large speculative delivery of additional office space, significant lease incentivesand decreasing like-for-like rental growth are the key issues for 2010-11.Stabilising valuationsfor prime officesFocus will be onletting……at decent rental levelsWe believe property values are stabilising, looking at key players Cofinimmo andBefimmo showing property fair value adjustments of -0.5% and +0.9% respectivelyduring the quarter to end-September.Large speculative deliveries and a persistently increasing market vacancy rate havebeen favourable for tenants, who have been able to negotiate lower rental levels andlease incentives. Taking into account a Brussels offices market stock of c.12.9m sqm,we estimate there is c.400,000 sqm to be added over 2010-2011, most of which isspeculative.We strongly believe landowners will have to give additional lease incentives to theirtenants in order to prevent vacancy rates rising (even further). An example is theletting of the recently delivered 27,000 sqm City Link office project of Cofinimmo in theEast Singel district (south of the Antwerp centre district) during 4Q09 to severaltenants, for which we believe attractive incentives must have been offered.During the communication of its FY08/09 results November 2009, Befimmo expressedconcern about the deteriorating Brussels offices market - primarily driven by the highspeculative deliveries - by decreasing its outlook for CFPS by 5% from €5.15 FY08/09to €4.88 FY09/10 and €4.24 FY10/11 (-13% Y-o-Y).Cofinimmo and Befimmo’s positioningWe have calculated that Cofinimmo has an overweight position in the BrusselsDecentralised district, while Befimmo is overweight in the Brussels North district. For acomplete comparison of both companies, please refer to the investment case sectionof Cofinimmo.Fig 33 Cofinimmo and Befimmo overweight and underweight areasPeripheryDecentralisedLouiseLeopoldNorthMidiCentre-15.0 -10.0 -5.0 0.0 5.0 10.0 15.0 20.0 25.0%CofinimmoBefimmoSource: Company data, ING estimatesIn the appendix, we have provided an overview of the Belgian and Dutch Cofinimmoportfolio, the Brussels Befimmo portfolio and the Brussels Leasinvest <strong>Real</strong> <strong>Estate</strong>portfolio. In our view, the Belgian Leasinvest <strong>Real</strong> <strong>Estate</strong> portfolio is more focused on27
_<strong>Benelux</strong> <strong>Real</strong> <strong>Estate</strong> February 2010smaller offices and retail assets in secondary cities, which makes it not comparable toCofinimmo and Befimmo.Crisis brought disparityin transaction yields,resulting in an absenceof transactionsTake up levels arestarting to regainground…Market overviewSince the beginning of the financial crisis at end 2008, the Brussels market has beencharacterised by a plummeting take-up of office space, along with a persistent supplyof speculative office space. The lack of confidence has led to a disparity in opinions ontransaction yields between buyers and sellers, resulting in one of the lowestinvestment market take-up levels since records began.Total take up volume in the Brussels offices market to >220,000 sqm during 4Q09(compared to an annual 2009 take-up of c.400,000 sqm). The take up was particularlystrong in the Northern and Central districts, and is due to a limited number of largetransactions.Fig 34 Brussels central districts take up, 4Q09Source: DTZ…vacancy rates are atrecord highs…Market vacancy rates are touching historical levels. Taking into account a largeuncommitted speculative development pipeline, these vacancy rates may rise evenfurther.28
__<strong>Benelux</strong> <strong>Real</strong> <strong>Estate</strong> February 2010Fig 35 Brussels central districts take up (sqm) Fig 36 Brussels central districts vacancy rates (%)sq m240,000200,000160,000120,00080,00040,0000Q204Q404Q205Q405Q206Q406Q207Q407Q208Q408Q209Q40914%13%12%11%10%9%8%7%6%5%4%3%2%1%0%Q204Q404Q205Q405Q206Q406Q207Q407Q208Q408Q209Q409Leopold Midi Centre North LouiseLeopold Midi Centre North LouiseSource: DTZSource: DTZ…prime rents do nottake incentives intoaccountAlthough headline prime rents seem to have decreased just a little over the last fewquarters, these face-value rents should be compensated by a large number of leaseincentives that are often given in return for long-term lease contracts.Below, we illustrate the longer-term trend of office rents in Brussels. In the past fiveyears, rents have hardly ever moved up in any of the submarkets. This is also true ofthe ‘good years’ in 2004-2007. The highest rents are being paid in the Leopold quarter.Fig 37 Brussels pipeline overview (sqm) Fig 38 Central Brussels prime rents (€/sqm/year)sq m€/sq m/year180,000160,000140,000120,000100,00080,00060,00040,00020,00002008, 42009, 12009, 22009, 32009, 42010, 12010, 22010, 3320300280260240220200180160140120100Q204Q404Q205Q405Q206Q406Q207Q407Q208Q408Q209Q409SpeculativeCommittedLeopold Midi Centre North LouiseSource: DTZSource: DTZIn the decentralised district, take up has also increased in 4Q09, but is still much belowaverage. Activity was strongest in the South district. Vacancy levels here are alsotouching historical levels.29
_<strong>Benelux</strong> <strong>Real</strong> <strong>Estate</strong> February 2010Fig 39 Brussels decentralised take up (sqm) Fig 40 Brussels decentralised vacancy rates (%)sq m60,00022%20%50,00040,00030,00018%16%14%12%10%20,00010,0000Q204Q404Q205Q405Q206Q406Q207Q407Q208Q408Q209Q4098%6%4%2%0%Q204Q404Q205Q405Q206Q406Q207Q407Q208Q408Q209Q409South North-East WestSouth North-East WestSource: DTZSource: DTZ30
<strong>Benelux</strong> <strong>Real</strong> <strong>Estate</strong> February 2010Fig 41 Brussels offices: key metrics4Q08 1Q09 2Q09 3Q09 4Q09CentreStock (m m²) 2.3 2.31 2.35 2.36 2.35Take-up (m²) 11,340 8,639 5,352 8,790 63,942Availability (m²) 140,570 137,896 167,341 181,793 168,842Availability ratio (%) 6.12 5.97 7.12 7.69 7.18New supply (m²) 0 16,931 41,372 14,934 0Prime rents (€/m²/year) 210 200 200 200 195MidiStock (m m²) 0.54 0.54 0.53 0.54 0.54Take-up (m²) 0 0 0 0 270Availability (m²) 24,298 24,298 24,298 36,298 38,198Availability ratio (%) 4.53 4.53 4.58 6.69 7.02New supply (m²) 0 0 0 12,000 0Prime rents (€/m²/year) 180 175 175 175 170NorthStock (m m²) 1.42 1.46 1.46 1.46 1.46Take-up (m²) 1,077 1,850 3,300 6,000 78,270Availability (m²) 91,433 120,945 119,149 119,149 112,826Availability ratio (%) 6.43 8.3 8.17 8.17 7.73New supply (m²) 0 29,512 0 0 0Prime rents (€/m²/year) 200 190 190 185 180LeopoldStock (m m²) 3.11 3.11 3.16 3.16 3.21Take-up (m²) 45,270 6,076 17,459 7,928 13,671Availability (m²) 261,503 261,517 295,246 310,439 353,077Availability ratio (%) 8.41 8.4 9.36 9.83 11.01New supply (m²) 22,325 4,078 58,636 35,127 44,442Prime rents (€/m²/year) 275 265 260 260 260LouiseStock (m m²) 0.83 0.83 0.8 0.8 0.79Take-up (m²) 4,994 4,254 11,181 4,965 16,834Availability (m²) 94,003 94,879 88,678 102,910 101,421Availability ratio (%) 11.33 10.99 11.14 12.94 12.81New supply (m²) 2,500 0 3,500 0 0Prime rents (€/m²/year) 215 215 205 200 200DecentralisedStock (m m²) 2.62 2.62 2.61 2.65 2.65Take-up (m²) 24,624 10,202 14,415 19,790 26,238Availability (m²) 381,183 375,824 390,689 403,350 434,001Availability ratio (%) 14.57 14.37 14.95 15.23 16.35New supply (m²) 0 0 15,479 29,000 0Prime rents (€/m²/year) 185 180 180 190 190PeripheryStock (m m²) 1.79 1.79 1.82 1.84 1.86Take-up (m²) 35,235 14,579 15,135 16,629 24,787Availability (m²) 290,363 287,795 315,782 352,783 350,389Availability ratio (%) 16.21 16.07 17.31 19.14 18.81New supply (m²) 3,355 3,000 30,336 17,616 17,056Prime rents (€/m²/year) 165 165 165 165 165Source: DTZ31
<strong>Benelux</strong> <strong>Real</strong> <strong>Estate</strong> February 2010Brussels, EU political capitalThe European institutions occupy c.1.7m sqm of the total available office spacein the Brussels Leopold district, which is also known as the “European district”.This is more than half of the total market stock. Below, we provide a briefoverview.Brussels is a key location for European institutions, from both a political and a tradeand legal standpoint. Having housed nearly all the important European politicalinstitutions for many years, Brussels is increasingly attracting interest from companies,associations and trade groups. The Belgian authorities have attracted the privatesector with the introduction of the notional interest deduction, prompting multinationalcompanies to establish their European headquarters in or near Brussels.A leading example from the real estate industry is the recent relocation of EPRA fromAmsterdam towards the Brussels periphery in the Woluwelaan in 2009. The maindriver of this relocation was EPRA’s desire to be closer to the European institutions inorder to facilitate its lobbying efforts towards more concrete European legislation forREITs.In appendix, we have provided an overview of all buildings occupied by the EuropeanCommission in Brussels.Brussels andWashington have a lotin common…A cross reference to Washington DCA recent market insight report from DTZ compared Brussels and Washington DC asthe political capitals of their respective continents. The main conclusions from anoffices investment perspective are:• Both cities are home to the most important political institutions of their continent;• The diplomatic presence in Washington is about twice the size of that in Brussels;• The Washington offices market is much more periphery-based than the Brusselsoffices market; and• Correcting for the number of inhabitants in the CBD area, both markets tend tohave a comparable supply of office space per inhabitant.32
_<strong>Benelux</strong> <strong>Real</strong> <strong>Estate</strong> February 2010Fig 42 Brussels vs Washington DCWDCBXLGeneral facts Population CBD 500,000 1,000,000Population (including periphery) 3,940,000 2,490,000Area (m²) 177 162Political and diplomaticorganisationsNational institutionsWhite House, Senate, House ofRepresentatives, PentagonBelgian government and parliament, Regional governmentsand parliaments (Flemish, Walloon and Brussels)International institutions IMF, World Bank EU Commission, EU Parliament, EU Council, EUCommittee of the Regions, NATOEmbassies 174 178Lobbyists >30,000 15,000Airport Number 2 12008 passengers 42,000,000 18,500,000Office market Stock (m²) CBD 4,630,000 10,860,000Stock (m², including periphery) 14,600,000 12,650,000Prime rents (per m² per year) $511 265Prime yields (%) 4.8 6.3Average office space per inhabitant 9.26 10.86(m², CBD)Average office space per inhabitant(m², including periphery)3.7 5.1Source: DTZ…but Washingtonprofits from higherrents and lower supplyPrime rents seem much higher in the Washington CBD than in the Brussels CBD. Apossible explanation is the relatively low stock of office space in the Washington CBDarea combined with a relatively high presence of lobbyists and the large speculativepipeline in the Brussels CBD, which we estimate at c.400,000 sqm being added overthe next two years.Location of EU politics related institutionsEuropean politicalinstitutions are locatedacross three main areasIn this section we look at the most important locations of institutions related toEuropean politics, divided into European member state representations, embassiesand lobbyists. We distinguish three large clusters of institutions:• The Leopold district, located in the west of the Brussels CBD;• The Beaulieu area in the South;• The Evere area in the North East.33
_<strong>Benelux</strong> <strong>Real</strong> <strong>Estate</strong> February 2010Fig 43 European political institutions’ locationSource: DTZThe Leopold district isbecoming a trueEuropean districtThe Leopold area is by far the most important location for European politics. It is hometo around 80% of the European Commission’s offices and also houses the EuropeanParliament, the Council and the Committee of the Regions. Its importance will increasein the future, especially with the European Commission’s plans to further centralise itsoffices by adding an extra c.230,000 sqm of offices in the “Rue de la Loi”, the mainartery of Belgian and international politics together with the “Place de Luxembourg”.Hence, the Leopold district is often referred to as the “European district”. Located atthe very heart of the Leopold district, the Schuman square (location of the EuropeanCommission) has been dictating prime rents in Brussels for years. Current prime rentlevels are estimated at c.€260/sqm/year 2 .We estimate that the EU Institutions occupy c.1.7m sqm of the total office spaceavailable in the Leopold district (total office space is c.3.2m sqm).Proximity to EUinstitutions is keydeterminant of locationEU member state representationsThe Leopold district houses all of the 27 EU member states’ permanentrepresentations, except for France (located in the Central District) and Poland (locatedin the “avenue Tervuren”). These permanent representations clearly want to near tothe EU institutions, in order to facilitate access during EU summits and meetingsbetween different countries’ representations.2 Source : DTZ, 200934
__<strong>Benelux</strong> <strong>Real</strong> <strong>Estate</strong> February 2010EmbassiesFig 44 Embassy distribution by areaDispersed18%Roosevelt area20%Molière area13%Leopold area19%Louise area13%Tervuren area17%Source: DTZEmbassies areclustered based onsimilarities betweencountriesClearly differing from the representations, embassies have a much lower requirementto be near the EU institutions. They tend to be located in clusters according to theculture or geographical presence of the countries they represent. The most popularlocation is the Roosevelt area, housing 35 out of 178 embassies in Brussels. Africanembassies are the most important ones in this area, with 34% of the embassies in thisarea.Fig 45 Embassies in BrusselsSource: DTZ35
<strong>Benelux</strong> <strong>Real</strong> <strong>Estate</strong> February 2010« Place Lux » has c.63%of all lobbyists within 15minutes’ walkLobbyistsA recent inquiry by the European Parliament into the lobbying industry showed thatthere are nearly 390 lobbyists in Brussels. They are mainly located around the “Placede Luxembourg”, the main square in front of the European Parliament in the Leopolddistrict. The main attraction of this square is the proximity of numerous bars andrestaurants and its informal and cosy character, which allows for informal meetingsand its location is within walking distance of nearly all the major EU institutions. DTZestimates that approximately 63% of all lobbyists in Brussels are situated less than 15minutes by foot away from this square.Fig 46Lobbyists in BrusselsSource: DTZ74% of market evidencerelates to “QuartierLéopold”_Market transaction evidenceSince 2000, the Leopold district has been the leading area for property transactionsrelated to representations (also including embassies) and lobbyists, accounting for74% of total market transactions. Estimates suggest an average annual 5% oftransactions related to representations and lobbies in the Brussels market (averageannual total market take up in the larger Brussels area is estimated at 550,000-600,000 sqm on a total current stock of c.12.8m sqm 3 ). There are a number ofdifferences between transactions related to representations (including lobbyists) andlobbyists, summarised in the table below.3 Source : DTZ, 200936
__<strong>Benelux</strong> <strong>Real</strong> <strong>Estate</strong> February 2010Fig 47 Representations (including embassies) vs lobbyists in BrusselsRepresentationsLobbyistsAverage size of a transaction (sqm) 1,250 457Purchase or lease? Even distribution Mostly leasesLocationDetermined by EU institution’s proximity Determined by rentsDuration Long-term vision FlexibleTransactions 2000-2009 (sqm) 200,000 74,400Source: DTZRepresentations preferlocations over cost andhave a long-term viewA key difference between representations and lobbyists is the term of their residence:representations often have a much longer term of residence and generally preferlocation over level of rents when compared to lobbies. Their average transaction sizeis also c.2.5 times higher than the size of transactions related to lobbyists.Fig 48Take-up distribution of representations,embassies and lobbyistsFig 49 Proportions of letting and purchasesLouise district5%Woluwe/Tervurendistrict5%EastPentagon8%Madoux/Orban district2%Other districts6%100%90%80%70%60%50%40%30%20%10%Europeandistrict74%0%LobbiesRepresentationsLettingPurchasesSource: DTZSource: DTZLeopold districtpreferred byrepresentations,reflected in the highestrentsThe proximity to EU institutions’ preference of representations and embassies isclearly reflected in the highest level of rents, estimated at €207/sqm/year in theLeopold district. As lobbyists are more cost-conscious than representations, they tendto seek areas neighbouring the European district, yet still close to Place Luxembourg.37
<strong>Benelux</strong> <strong>Real</strong> <strong>Estate</strong> February 2010Belgian nursing homesCash flow securityIn recent years, Belgian property investors Cofinimmo and Aedifica haveincreasingly invested in nursing homes. We believe there is more to come,thanks to a number of key attractions and – currently – limited risks.Key investmentdriversNursing homes have emerged as a new diversification method for leading real estateinvestors in Belgium. We believe the main drivers from a real estate investmentperspective are:• Overall ageing demographic structure in Belgium (estimates suggest that there willbe three times as many people in nursing homes by 2050);• Structural shortage in the number of beds: considerable capacity for extra beds(c.9,000 by 2012), despite the heavily-regulated nature of the sector;• Separation of roles and consolidation: nursing home operators need to increase theaverage size per home as well as the overall size of their portfolio in order tobecome more efficient. A partnership with a private investor in the form of a saleand lease back is a commonly-used method to achieve such efficiencies;• Full occupation is guaranteed thanks to strict government planning in terms ofissuing limited licences to nursing home operators;• Sustainable rents thanks to a government subsidy system roughly equal to half ofthe nursing home operators’ expenses; and• Long-term lease contracts running up to 24 years.These drivers should be weighed against the sustainability of the favourable regulatorysystem and the modest yields which, taken together with overall long-term fixedleases, allow for little rent reversion.Main risksWe have identified the main risks of investing in nursing homes as:• Permits and subsidies are given to the nursing home operators, not to theinvestors. As more real estate investors step in, the market might becomesaturated over the longer term. Requiring custom-designed buildings, conversion ofa nursing home to e.g. residential assets may become expensive when operatorsdecide to move. Nevertheless, we point out that there is still a structural undersupplyof nursing homes in the next few years.• Sustainability of public authorities’ subsidies may become more difficult infuture, particularly when taking into account increasing budget deficits. Lowersubsidies could in turn start to affect sustainability of rents that are paid by theoperators.38
_<strong>Benelux</strong> <strong>Real</strong> <strong>Estate</strong> February 2010Fig 50 Key nursing home operators mid-2009 Fig 51 Main property investors mid 2009Futuro (BE)5%Palmir (BE)7%Orpea (FR)9%Noble Age(FR)3%Armonea (BE)33%DexiaImmorent7%KBC6%Aedifica25%Senior AssistGroup (BE)20%Cofinimmo62%Senior LivingGroup (BE)23%Source: DTZ, ING estimatesSource: DTZ, ING estimates39
__<strong>Benelux</strong> <strong>Real</strong> <strong>Estate</strong> February 2010Fig 52 Nursing homes portfolio overviewCofinimmoAedificaJun-07 Mar-09 Jun-07 Mar-09Beds 2,163 8,659 1,348 2,073Value (€m) 212 721 111 161Portfolio share (%) 11 23 37 45Source: Company dataRental level and yieldsThe estimated rents paid by nursing home operators vary between €80 and €120€/sqm/year, depending on a range of diverse criteria including location, standing, thequality of facilities and the array of available services. Prime yields were standing atc.5.9% at the top of the cycle, but are now estimated to have corrected to a levelbetween 6.4% and 6.6%.Fig 53 Sicafi beds capacitySource: DTZBelgian demographicoverviewThe Belgian Statistics Bureau 4 calculated that there will be about 1,350,000 individualsolder than 80 by 2050, estimated at more than 10% of the expected total population.4 www.nis.be40
<strong>Benelux</strong> <strong>Real</strong> <strong>Estate</strong> February 2010Taken together with the lower proportion of families taking care of their older relatives,the need for external residential care facilities for elderly people is estimated by thenational economic study bureau 5 to be 318,000 individuals, which is substantiallyhigher than the current figure. As a comparison, some 130,000 beds have beencounted in nursing and care homes across Belgium (mid 2009).The need for additional elderly care facilities will be highest in the Flemish region,characterised by a structurally older population and a lower current supply of carefacilities relative to the total number of elderly people.5 www.plan.be41
__<strong>Benelux</strong> <strong>Real</strong> <strong>Estate</strong> February 2010<strong>Real</strong> estate investment marketsH2 European REinvestments were up75% to €43bnThe investment markets picked up considerably in H2 2009. CBRE reports thatEuropean investments in H2 were 75% higher than in H1, with <strong>Benelux</strong> outperformingthis figure with a 95% rise in investment activity. Spain seems to remain inactive so farand CEE and Germany have experienced the sharpest growth.Fig 54 European investment activity 2009 (€bn)1H09 2H09 (%ch)UK 9.4 15.4 64Germany 3.3 7.1 115France 2.5 5.0 100Nordics 2.7 4.4 63<strong>Benelux</strong> 2.1 4.1 95Italy 2.1 3.0 43Iberia 1.9 2.2 16CEE 0.5 1.6 229Europe 24.5 42.8 75Source: CB Richard Ellis, January 2010From the chart below it can be seen that investment market volumes are picking up.The chart includes the UK which, with a transaction volume of €8.3bn in 2009 4Q,accounted for a third of European turnover.Fig 55 European investment turnover (€bn)9080706050495955775968 6760424030201029 30201214182601Q062Q063Q064Q061Q072Q073Q074Q071Q082Q083Q084Q081Q092Q093Q094Q09Source: CBRE, Jan 2010If we focus on the <strong>Benelux</strong>, it emerges that Belgian real estate turnover was very weakin Q2, with only €76m in completed transactions. In addition, we see that Belgium andSpain (not shown in the chart) were the only countries where Q4 volume lagged Q3.42
__<strong>Benelux</strong> <strong>Real</strong> <strong>Estate</strong> February 2010Fig 56 <strong>Benelux</strong> and France investment markets in 2009 (€m)4,0003,5003,5003,0002,5002,0001,5001,00050006061,9401,7661,5861,0151,143748519325352761Q09 2Q09 3Q09 4Q9Netherlands Belgium FranceSource: CBRE 2010The chart below provides a breakdown of investors in European property by type offund strategy. As a result of better availability of debt and a more attractive marketoutlook, we believe that deal flow will improve further in 2010.Half of the 2010terminations expectedto be value added oropportunistic fundsA large number of funds are members of Inrev, the European Association for Investorsin Non-listed <strong>Real</strong> <strong>Estate</strong> Vehicles. Inrev has produced very relevant research toanalyse selling pressure from funds that are terminated. Clearly, termination is oftenused as a reason to restructure a fund or continue under the same or differentmanagement. Inrev has separated the funds into three categories: Core, Value Addedand Opportunity. As a result of the economic crisis and the resulting loss of riskappetite, interest in non-core funds has dropped considerably in the past 18 months.Fig 57 Termination of real estate funds by style (€bn)252015€Bn10502009 2010 2011 2012 2013 2014 2015 2016 2017 2018 2019Core Value Added OpportunitySource: Inrev, ING researchThe listed companies in the <strong>Benelux</strong> invest mostly in Retail, Office and Industrialproperty. The table below illustrates potential deal flow per real estate sector by year.The retail component of the terminations is the highest block of the stacked bar. In2010, €2.4bn and in 2011 €5.2bn of retail property of non-listed funds is expected to beput on the market.43
_<strong>Benelux</strong> <strong>Real</strong> <strong>Estate</strong> February 2010Fig 58 Termination of non-listed real estate funds by sector2520€Bn1510502009 2010 2011 2012 2013 2014 2015 2016 2017 2018 2019Source: Inrev, ING ResearchDiversified Industrial / logistics Office Other Residential Retail44
<strong>Benelux</strong> <strong>Real</strong> <strong>Estate</strong> February 2010The outlook for retail propertyA number of trends mayweaken shoppingcentres’ positionGrey is goodPower of consumerswill grow, middle-menunder pressureWe believe there are a number of material changes currently underway in retailingwhich will likely weaken the position of shopping centres. In addition, the place of thesuper-regional mall in the retail hierarchy is under attack from expansive food retailersand the declining exclusivity of multiples, increased SRI consciousness about travel-tobuyand a social function of retail that is eroding.Consumers’ time budgets are under increasing pressure and this may lead to areduced number of trips. A greying population may have a growing time budget, and atsome stage may offset the previous trend.In a recent presentation about the future of the city of The Hague, Carl Rhode, a trendwatcherstated: “In the past businesses determined what customers need and thenmanipulate demand to meet their offerings. A shopping centre plays a role here. Thefuture consumers and producers jointly create value. This could come at the expenseof the middle man, who is the tenant in the shopping centre.”We see the following important changes ahead:• The end of the growth era of multiples.• French Food retailers internalise and beef up development.• E-commerce depresses footfall and turnover.• Proximity and authenticity gain in importance.• SRI does not fit with the traffic of a regional mall.• Multiples opening in smaller centres, eroding the exclusivity of larger centres.• Physical presence is declining in importance as social networks move to the web.• Random meetings have become less important with the use of mobile phones.• Sports, culture, and the internet are all competing for consumers’ time budget.• Food retailers are trying to find the right web-based format.We believe that in 10 years’ time, a smaller number of consumers will spend less timein shopping centres and will also spend less once they are in there. These effectscould be partially offset if the grey wave spends much of its new spare time inshopping centres.The end of the growth era of multiples?The proposition of allbrands under one roofis losing relevanceA number of social studies point to the reversal of the trend of consumers wanting toshop at the same shops. Good examples of this are the several different shoppingdistricts in larger cities such as The Hague, Milan and Amsterdam, where clusters ofnew independent and exclusive, but not necessarily expensive, shops have poppedup. Clients value the authenticity of the offer and the service and passion of thepersonnel who are often the co-owner. Consumers seem to be less concerned aboutthe comfort brought by wearing a particular brand, possibly also because theproduction of most fashion brands is now globalised.45
_<strong>Benelux</strong> <strong>Real</strong> <strong>Estate</strong> February 2010If this trend strengthens and becomes mainstream, the value proposition of all brandsunder one roof, a key attraction of larger shopping centres, will become less relevant.Companies’ initiatives80 pop concerts in oneshopping centreThe listed property companies have introduced a number of initiatives to tackle theabove trends. Corio, for example, organised 80 pop concerts in its Turin Le Grushopping centre in 2009. Unibail-Rodamco has a number of elements that are aimedat making the centres a more attractive place to spend time, such as baby care,comfortable seating, good signing and information and clean and safe facilities. Thereare also some very new initiatives aimed at creating a social web-based communitywith the shopping centre as a pivotal physical place. Corio has a radio station linked tothe Le Gru shopping centre.French food retailers internalise developmentFrance is an important market for the Dutch property companies. The chart below isbased on reported numbers at 30 September 2009.Fig 59 French weightings of the Dutch property companies (%)70606050403020333722100Corio ECP VastNedRetVastNedO&IUnibail-R Wereldhave NSI7Source: Company data, ING estimatesCarrefour and Casinoare professionalisingand growingdevelopmentRecently, Casino and Carrefour have substantially increased their focus on propertydevelopment and extension gains as a strategic source of income. Casino has used itssuccessful listed Mercialys subsidiary to manage investment property. But both groupsare now showing more interest in property development gains and they are becomingpotentially much more serious competitors to the portfolios of the listed retail investors.The roles of these two players have changed from tenant to creator of space. This isan explosive cocktail as French retail planning has recently been relaxed, and thepreferred hyper- and supermarket size seems to be smaller than is currently the case.As a result, the supply of retail space in France will increase. Frequently, this newconverted or extended space will be close to the consumer, and the required rent willbe just a small percentage of the rent in a super-regional mall.The new Carrefour real estate planDevelopment insourced,shopping trips analysedCarrefour is the leading food retailer in France and one of the largest food retailers inthe world, with 2009 turnover that we estimate at €85.6bn. Previously, its extensionand development activities were outsourced to Klépierre. This trend has now beencompletely reversed and Carrefour recognises that retail and property actually havesignificant synergies. Creative analysts may even ask themselves why asuccessful mall owner wouldn’t buy an upcoming retailer? Carrefour has a very46
_<strong>Benelux</strong> <strong>Real</strong> <strong>Estate</strong> February 2010good understanding of consumer behaviour, both inside and outside France. This isillustrated in the graphic below, which distinguishes between four types of shoppingmission, and allocates the favourite store format and internet relevance.Fig 60 Carrefour’s shopping trip segmentationSource: CarrefourCarrefour is going tocreate a large number ofnew communitiesCarrefour will roll outthe programme inFrance, Spain, Belgiumand ItalyCarrefour’s second chart must have sent shivers down the spines of the manysuccessful developers of French retail space. It illustrates the upside when too-largehypermarkets are shrunk and the surplus space is converted to smaller units,sometimes with an extension to the parking. This is a direct threat to the existingshopping centres, in our view, particularly because some of the hypers offer aproximity that, if well exploited, could form a (new) heart of a small community. Acommunity based on proximity would fit well with new sociological trends.Carrefour intends to roll out the hypermarket repositioning programme in France,Spain, Italy and Belgium. Deployment is planned to start in 2011 and the companywants to have everything completed by the end of 2012. It will test prototypes in 2010.Carrefour has decided to dispose of all southern Italian hypermarkets. The graphicbelow illustrates how Carrefour has created additional return from the conversion ofhypermarket space, on top of the rental increase.47
<strong>Benelux</strong> <strong>Real</strong> <strong>Estate</strong> February 2010Fig 61 Upside from redevelopment according to CarrefourSource: Carrefour_Casino’s real estate ambitionsCasino broadens realestate activities and willalso create newcompetitionWith the creation of Mercyalys, Casino has already experienced many of the blessingsthat come with listed real estate. Casino has recently announced a further growth pathfor its real estate arm. This plan encompasses a broadening of the real estate activitiesfrom investment, as done by Mercialys, to a better focus on development andconversion of space. The chart below outlines the philosophy behind the project, whichis called Alcudia.This project will create considerable additional floor space in France, which will in turnput pressure on current rent levels - particularly non-prime retail rents. The listedproperty companies in French retail markets tend to focus on the larger centres, but wewould argue that they would also feel the impact. As neighbourhood retailingundergoes a massive national clean-up and broadens its offer with more boutiquespace and better bars, cafes and food offer, trips to the bigger malls could be expectedto come down.48
__<strong>Benelux</strong> <strong>Real</strong> <strong>Estate</strong> February 2010Fig 62 Outline of Casino’s Alcudia projectSource: CasinoCasino intends to create445,000 sqm new space,50% before end of 2012,excluding conversion ofhypersCasino has already quantified many of its plans, as shown in the chart below. We thinkthe numbers mentioned in the chart are substantial. In addition, the timescale seemsambitious but achievable; 445,000 sqm means 45 retail galleries of 10,000 sqm eachadded in the next three years, in addition to the existing retail pipeline. These numbersdo not yet include any shrinkage of Casino hypermarkets.Fig 63 Casino’s development plans quantifiedSource: Casino49
__<strong>Benelux</strong> <strong>Real</strong> <strong>Estate</strong> February 2010French retail will have achallenging timeAs a result of these plans, we believe that French retail property may not perform aswell as it has in the past. Bear in mind that indexation in France has also come downvery considerably, from above 5% in 2008 to below 1% for 2010.E-commerce depresses footfall and turnoverConsumer-to-consumertrading comes out ofretailers’ walletsBoth French and Dutch e-commerce is rising rapidly. In France, e-commerce has risenby 25% to €45bn, in the 12 months to June 2009. Apart from business to consumerretailing, we believe that consumer to consumer trading poses a threat to the shoppingcentre as a physical place to buy goods. Not only do tenants approach consumersdirectly, but consumers are increasingly selling goods to other consumers. The graphbelow illustrates the Dutch market.Fig 64 Dutch E-Commerce as a percentage of total non-food turnoverconsumption6.0%5.0%4.0%3.0%2.0%1.0%0.0%2000 2001 2002 2003 2004 2005 2006 2007 2008 2009H1Source: Blaauw, Thuiswinkel.orgThe internet isespecially dominantbefore the actualtransaction takes placeIt is useful to analyse internet usage during the three phases of shopping: orientation(comparison), acquisition, and after sales. In the orientation phase, the internet hasbecome more important that the physical shop, in the Netherlands. The numbersbelow are based on a June 2009 analysis of 1706 Dutch consumers aged between 16and 65. In the acquisition phase consumers still prefer the shop, as illustrated by thestrong lead of 72% over the 23% acquisition over the internet. In after sales theinternet is used by 4% of respondents and actual shops by 11%.Fig 65 Distribution channel usage by shopping phase in the Netherlands2009 (%) Orientation Acquisition After-salesInternet 41 23 4Retail 35 72 11Print 33 0 0Telephone/ mail 1 1 5110 96 20Source: Blaauw, 2009The internet is replacingpart of the comparisonfunction of the mallOne of the traditional roles of a larger shopping centre is comparison. Consumers liketo compare competing products, brands and prices before they buy. This important firststep is increasingly being done via the internet, as illustrated in the chart below.50
_<strong>Benelux</strong> <strong>Real</strong> <strong>Estate</strong> February 2010Fig 66 Channel use in orientation phase by product (%)Animal carePlants/flowersOpticalGroceriesPers careClothing shoesDIYBooks, magazinesSports articlesGarden equipmentToysDVDsBicycleHome entert softwareInteriorMusicEroticsInsuranceWhitegoods(Mob) TelecomCarComp hardwareAudio/videoTicketsOther Cons electrPhoto/filSoftwareTravel14151822192324171416162417383530302831293233433839404242304331384133355248525161505154545755555760566364656577830 10 20 30 40 50 60 70 80 90InternetRetailSource: Blaauw 2009, ING ResearchThe chart above breaks down the comparison phase by favourite distribution channel,for example, 51% of the consumers that are willing to buy music are using the internetwhen deciding what to buy, and only 31 percent use actual stores to compare beforethey buy music. The internet is mostly used to compare what is on offer by consumersplanning to buy travel (83%), software (77%), photographic and film accessories (65%)and other consumer electronics (65%).The next decade is notabout multiples butabout smaller,differentiating retailProximity and authenticity gain in importanceIf the past decade has seen the rolling-out of multiples across Europe, notably H&Mand Zara and its Inditex sister retailers, we think the next decade may well lookdifferent. There seems to be a trend whereby consumers want to differentiatethemselves from the masses. The large multiples are not well positioned to cater tothese wishes. The shopping patterns of the new consumers are used to expressthemselves, not to conform. Being on the mailing list of a particular chocolate shop orsecond-hand vintage children’s clothing shop may be a small part of the identity of thenew consumer. Buying from the owners of these unique shops creates differenttransactions to doing so in a multiple.51
<strong>Benelux</strong> <strong>Real</strong> <strong>Estate</strong> February 2010After a period ofindividualisation,consumers increasinglywant to belongSome sociological researchers believe that after a period of individualisation,consumers are increasingly looking to be part of communities. If true, this may alsolead to an adoption of shopping patterns toward shops closer to home, in order to‘support’ the local community. On the other hand, a regional mall seems a logicalstarting point for a community, as illustrated in some larger Swedish centres, whichhave a City Hall, post office and even a church integrated in the mall.The web can be used increasingly effectively for tracking down desirable physicalshops, or clusters. We would not be surprised if larger shopping centres offered lesswell located space to the new type of entrepreneur that is able to attract the youngpioneering and early adopting consumers. Obsolete department store space can alsobe used as a breeding ground for clusters of new retail entrepreneurs.Owners will have towork hard to remain onconsumers’ mindsThe message of the consumer change that is affecting the retail markets is not that theshopping centre is going to be obsolete. But owners and investors will have to workharder to retain clients. We think the low risk perception of a large shopping centre,which was appropriate in the past two decades, may change.Socially-responsible investment clashes with traffic of a regional mallMeans of transportshould be in the SRIboxConsumers’ preference shifts to socially responsible behaviour. It is hard to argue thattaking the car to a shopping centre 15 km down the road is socially responsiblebehaviour. The number of consumers that visit a centre on foot or by bicycle will be anincreasingly important factor in the success of a centre. Unibail Rodamco hasaddressed this issue a number of times, for example in Spain. In addition, we believethat larger centres may well be more efficient than smaller centres in usage of waterand energy.Multiples are opening everywhere, eroding exclusivity of larger centresNow that a large number of multiples have decided to open shops in smaller centres,part of the attraction of the large centres is diluted. In addition, the selection of anumber of goods is now made over the internet and no longer in physical shops. Largecentres need to find other ways to attract visitors in order to keep turnover healthy.‘See and be seen’ partly replaced by mobile social behaviourAttention shift fromlargest place to mostattractive placeApart from buying goods, one of the traditional roles of a shopping centre is to meetand look at other people and be looked at. In recent years, a number of alternativesocial networks have been created. Facebook, LinkedIn, Hyves, and other web- ormobile phone-based communities are moving the focus of the consumer away fromthe largest physical meeting place to the most attractive place. In past years, the useof mobile phones has probably had a deep impact on footfall patterns in centresbecause it has reduced the random strolling (and let’s see who we meet) and replacedit with a more targeted and efficient approach. Sports, culture, and the internet are allcompeting for the consumer’s time budget.Food retailers are searching for a web-based format to gain market shareTo date, most retailers have been unsuccessful as they struggle to get paid for the costof the logistics and in particular the picking (the assemblage of the ordered baskets ofgoods), while the high-margin foods are mostly fresh so delivery is time-critical. If theyfind a good format, this will reduce the pulling power of traditional food retailers, whichoften anchor shopping centres.We believe that the yields of the shopping centres have not really been tested inContinental Europe. The oligopolistic ownership structure of larger shopping centres,52
<strong>Benelux</strong> <strong>Real</strong> <strong>Estate</strong> February 2010coupled with an lack of transparency, has led to semi-stable yields for the top end ofthe investment market for larger shopping centres.Smaller centres easier to double in sizeDevelopment potentialof small centres is moreattractiveIt is easier to add 5,000sqm to a small centre of 5,000 sqm than 50,000 sqm to a50,000 sqm centre. As a result, the potential development earnings growth from aportfolio of small centres is often larger than that of a portfolio consisting of a smallnumber of larger centres. This effect is further enhanced by the fact that lower rentsfrom the smaller centres are easier to increase when the size has doubled, than therents of already large centres, where rents are at their local peak.The recent relaxation of retail planning in France, whereby the threshold for which apermit is required rose from 300 sqm to 1,000 sqm, benefits smaller centres more thanlarger ones.On the other hand, in general smaller centres are much more likely to be not as wellmanaged, and in the current downturn they may be suffering more than prime centres.53
_<strong>Benelux</strong> <strong>Real</strong> <strong>Estate</strong> February 2010The macro economy<strong>Real</strong> estate returns have a strong correlation with growth of gross domesticproduct. In this chapter we analyse the distribution of expected GDP growthover European countries and the weightings of the international companies’portfolios. The strongest growth is expected in Turkey, Russia, Poland, Norwayand the Czech Republic; we expect compound GDP to grow by 6% or more in2010 and 2011. This top five is followed closely by Sweden, Slovakia and theUS. With forecast 2010 – 2011 compound GDP growth of 3.6% and 3.4%respectively, the Netherlands and Belgium are both expected to underperformthe Eurozone and EMEA.Dutch and Belgian economic growth is fairly comparable. The Dutch economy seemsslightly more volatile, reflecting its open economy and the heavier weight of the EU onthe Belgian economy. We will illustrate later that inflation presents a different picture.Fig 67 GDP growth Belgium and the Netherlands 2009–11F5.04.03.02.01.00.0-1.0-2.0-3.0-4.0-5.02009F 2010F 2011F 2009-11F 2010F - 11FNetherlandsBelgiumSource: ING estimatesFinland is the surpriseunderperformerOne of the most striking outcomes is the wide difference between Finland, which is astrong underperformer, and Norway and Sweden, which are both expected to postvery strong GDP growth. Wereldhave has a 22% portfolio weighting to Finland, whileUnibail-Rodamco (8%) and Eurocommercial (22%) offer strong Swedish exposure.Klépierre (not rated) has c.9% of its portfolio in Norway and another 9% in Sweden andDenmark. Spain is at the bottom of the pack, as expected. VastNed Retail has a 23%exposure to that market. Italy, where Eurocommercial has 41% of its investments andCorio 18%, is also expected to post disappointing GDP growth.54
_<strong>Benelux</strong> <strong>Real</strong> <strong>Estate</strong> February 2010HighlightsFig 68 Compound GDP forecasts 2010-11TurkeyRussia8.07.9PolandNorwayCzech RepublicUS6.16.06.05.9SwedenSlovakia5.55.4Germany4.1EurozoneNetherlandsFranceBelgiumUK3.73.63.53.43.3AustriaSwitzerland2.92.9Italy2.1Finland1.7Spain1.30.0 1.0 2.0 3.0 4.0 5.0 6.0 7.0 8.0 9.0Compound GDP growth forecasts 2010 - 2011Source: ING estimatesOver the next two years, the worst-performing economy in Europe is likely to be Spain.The chart below highlights the exposure of the <strong>Benelux</strong> stocks to Spain. VastNedRetail is worst affected with 23%.55
__<strong>Benelux</strong> <strong>Real</strong> <strong>Estate</strong> February 2010Fig 69 Spanish exposure of Dutch property companies (%)2520151050Corio ECP VastNedRetVastNedO&IUnibail- R Wereldhave NSISource: Company data, ING estimatesCountry-weighted GDPgrowth 2010 – 2011ranges between 3.1%and 3.6%In the table below we have calculated the country-weighted average GDP growth ofthe portfolios of the Dutch property companies. The outcomes range from 3.1% forVastNed Retail, as a result of its high Spanish exposure, to 3.6% for Unibail-Rodamco,Wereldhave and Nieuwe Steen Investment.Fig 70 Country-weighted average GDP growth 2010-11 (%)Company Corio ECP VastNed Ret VastNed O&I Unibail- R Wereldhave NSI GDPDate of breakdown 30 Sep 09 30 Jun 09 30 Sep 09 30 Sep 09 30 Jun 09 30 Sep 09 30 Sep 09 2010 -11FAustria 5 2.9Belgium 16 47 16 3.4Czech Republic 1 6.0Eurozone 3.7Finland 22 1.7France 33 37 22 60 7 3.5Germany 10 4.1Italy 18 41 2.1Netherlands 33 37 42 13 15 92 3.6Norway 6.0Poland 3 6.1Russia 7.9Slovakia 1 5.4Spain 9 23 9 6 1.3Sweden 22 8 5.5Switzerland 8 2.9Turkey 7 1 8.0UK 8 3.3US 26 5.9Value (€m) 6,000 2,137 1,871 1,090 22,794 2,413 1,330Average GDP growth 3.4 3.4 3.1 3.6 3.6 3.6 3.6Source: Company data, ING estimatesSpanish exposureopens window to‘Rabajas’In the medium term, we believe that Spanish exposure could be positive as the marketis likely to remain a source of property bargains. A recent example is the acquisition byCorio of 95% of the shares of Principe Pio, from Riofisa, the subsidiary of Colonial, at anet yield of 7.8%, for a price of €127m. In the summer of 2008, Unibail-Rodamcobought the 74,400 sqm La Maquinista shopping centre in Barcelona and the 24,000sqm Habaneras S.C in Torrevieja from Metrovacesa, for €434 million, at a net yield of6.0%. La Maquinista has a 15,200 sqm extension possibility.56
_<strong>Benelux</strong> <strong>Real</strong> <strong>Estate</strong> February 2010The table below lists the top 10 players in Spanish retail investment.Fig 71 Owners of Spanish shopping centresNo. of GLA (sqm 1,000)Investor centres Total AverageUnibail-Rodamco 14 821 59ING 15 565 38Sonae Sierra 12 545 45Klépierre 71 1,496 21GGC 4 278 70LSGIE 6 329 55Metrovacesa 5 244 49VastNed 9 273 30Gruppo Lar/ M Stanley 8 297 37Corio 10 274 27Source: Unibail-Rodamco researchWe expect Euro and USdollar rates to risesharply in Q410_Interest rate forecastsWe have looked at both short-term and long-term interest rates. In addition, we haveanalysed debt markets to see when the BBB spreads are expected to come down.This is useful for profit and loss account projections and capital value estimates. In ourestimates we have consistently extrapolated the last published cost of debt. We inviteclients to adapt our models if they want to test other interest cost scenarios.Three-month interest rate forecastsThere is a broad consensus that interest rates are going to rise. Our economistsbelieve that 2011 will see particularly steep rises in short-term interest rates. The chartbelow clearly illustrates how Norway is trying to control its inflation by keeping theshort-term interest rates much higher than in the other Western economies (andJapan). We expect sharp rises in three-month rates from both the US Fed (with 100bpto 2.05%) and the ECB (with 50bp to 1.75% in 4Q10).Fig 72 Three-month interest rate forecasts (%, end period)6.005.004.003.002.001.000.001Q10F 2Q10F 3Q10F 4Q10F 2011F 2012FUS Euro rate Japan UKSwitzerland Sweden NorwaySource: ING estimatesThree-month interestrates expected to riseless in EMEA than inWestern EuropeInterest rates in EMEA markets are higher, with the exception of the Czech Republic,where Unibail-Rodamco has c. 1% of its assets. The Ukraine currency has the highestinterest rate of 22%. Turkey and Romania are in a second group, with 7.06% and8.10% expected at end-March 2010 respectively. Interest levels are expected to rise57
_<strong>Benelux</strong> <strong>Real</strong> <strong>Estate</strong> February 2010less in EMEA than in Western Europe and Japan. As a result, interest rates areconverging among most of the European countries.Fig 73 EMEA three-month interest rate forecasts (%, end period)1Q10F 2Q10F 3Q10F 4Q10F 2011F 2012FBulgaria 4.35 4.15 4.25 4.35 4.35 5.10Croatia 3.85 3.95 4.05 4.25 4.65 5.10Czech Republic 1.50 1.50 1.75 2.00 3.00 3.50Hungary 5.80 5.80 5.70 5.80 6.10 5.60Poland 4.08 4.13 4.08 4.10 4.82 5.15Romania 8.10 7.50 7.00 7.25 8.75 7.75Russia 6.50 6.00 6.20 6.50 6.50 -Turkey 7.06 7.26 7.26 9.04 10.05 9.95Ukraine 22.00 19.00 17.00 17.00 15.00 12.50Source: ING estimates_10-year interest rates forecastsBond rates are forecast to be less volatile than the money market discussed above.Fig 74 10yr bond yield forecasts (%)5.505.004.504.003.503.002.502.001Q10F 2Q10F 3Q10F 4Q10F 2011F 2012FUS: Fed funds EU12: ECB refi UKSwitzerland Sweden NorwaySource: ING estimatesEMEA yield curves areflatter than those inWestern EuropeAs can be seen from the table below, EMEA yield curves are flatter than those inWestern Europe. We expect 10-year bond rates to fall in most of the EMEA markets,with the exception of the Czech Republic and Slovakia. This will no doubt have apositive effect on prime property values after vacancies have stabilised, and on theassumption that some of these countries start to manage the supply of real estate in astricter manner.58
__<strong>Benelux</strong> <strong>Real</strong> <strong>Estate</strong> February 2010Fig 75 10yr bond yield forecasts EMEA (%)1Q10F 2Q10F 3Q10F 4Q10F 2011F 2012FBulgaria 6.80 6.70 6.30 5.90 5.40 5.60Croatia 6.10 6.20 5.80 5.60 5.40 5.60Czech Republic 4.40 4.50 4.80 4.90 5.60 5.50Hungary 8.00 8.20 7.70 7.30 6.50 6.20Poland 5.88 5.71 5.96 5.88 6.05 5.72Romania (5Y) 8.75 8.00 7.80 8.00 8.50 7.00Russia 8.00 7.50 7.80 8.00 8.00 -Slovakia 4.60 4.70 4.75 4.80 4.90 4.90Ukraine (5Y) 10.80 10.50 10.10 9.80 9.70 9.70Source: ING estimatesWe expect most EMEA10-year rates to fall andall Western Europeanones to riseThe charts below illustrate the striking difference between our forecast WesternEuropean and EMEA 10-year bond rates. The strongest bond rate increase isexpected in Switzerland, where 10-year bond rates are expected to rise by 160bp inthe period between March 2010 and December 2012. NSI wants to grow substantiallyin Switzerland and should lock in the cost of debt, in our view. In EMEA, 10-year bondrates are expected to fall in most countries, with the exception of Slovakia and theCzech Republic. Russia is expected to have flat 10-year interest rates over the period.Fig 76 10y bond Dec 2012F - Mar 2010F (%) Fig 77 10y bond Dec 2012F - Mar 2010F (%)SwitzerlandHungaryRomania (5Y)SwedenNorwayBulgariaUkraine (5Y)CroatiaEU12: ECB refiUKPolandRussiaSlovakiaUS: Fed funds0.00 0.50 1.00 1.50 2.00Czech Republic-2.00 -1.50 -1.00 -0.50 0.00 0.50 1.00 1.50Source: ING estimatesSource: ING estimates59
_<strong>Benelux</strong> <strong>Real</strong> <strong>Estate</strong> February 2010Inflation – CPI forecastsEurozone expected toshow lowest inflation in2010 and 2011The table below shows our CPI forecasts. We believe that the Eurozone will havelower inflation than the global economy, the US and the UK, in both 2010 and 2011.EMEA is expected to show the highest inflation rates, illustrated in the table below.Fig 78 CPI forecasts 2009 – 2011 (%YoY)4Q09 1Q10 2Q10 3Q10 2009F 2010F 2011FG7World 1.4 2.0 2.1 1.9 1.0 2.0 1.9US 1.5 2.8 3.0 2.6 -0.3 2.7 2.0Japan -2.0 -1.6 -1.3 -0.8 -1.3 -1.0 0.2Germany 0.4 1.1 1.3 1.5 0.3 1.4 1.7France 0.2 1.0 1.3 1.6 0.1 1.5 1.9UK 2.0 2.9 2.4 2.0 2.2 2.3 2.2Italy 0.7 1.5 1.4 1.7 0.8 1.6 1.7Canada 0.6 0.6 0.5 0.6 0.5 1.9 2.2Western EuropeEurozone 0.5 1.2 1.4 1.4 0.3 1.4 1.8Spain 0.4 1.0 1.3 1.6 -0.3 1.4 1.6Netherlands 0.9 1.1 0.9 1.6 1.2 1.2 1.1Belgium -0.3 1.1 1.8 1.5 -0.1 1.5 2.0Greece 1.9 2.5 2.5 2.3 1.3 2.4 2.0Switzerland -0.2 0.7 1.7 1.0 -0.5 1.0 1.3Sweden -0.4 1.1 1.3 1.4 -0.3 1.4 1.8Norway 1.3 1.6 1.5 1.9 2.2 1.8 2.0Iceland 8.6 7.3 6.2 3.7 12.2 4.7 1.6EMEABulgaria 0.0 0.4 0.0 1.2 2.8 1.1 3.0Croatia 1.8 1.6 1.2 1.9 2.4 1.9 2.8Czech Republic 1.0 1.3 1.5 2.0 2.4 1.6 2.5Hungary 5.6 4.8 3.9 3.2 4.2 3.8 3.0Kazakhstan 6.0 7.5 7.1 - 7.4 7.2 8.0Poland 3.4 2.9 1.8 1.6 3.5 2.1 2.1Romania 4.7 3.9 4.4 5.3 5.6 4.7 4.5Russi 9.3 7.1 5.9 - 11.8 6.1 8.2Slovakia 0.3 0.0 0.3 0.6 1.0 0.2 2.1Turkey 6.5 7.7 8.6 8.8 6.3 7.9 6.2Ukraine 12.3 11.8 12.9 12.7 16.0 12.6 11.7Source: ING estimatesNo such thing as<strong>Benelux</strong> inflationThe CPI outliers are the Ukraine, Russia, Kazakhstan and Turkey (7.9% in 2010 and6.2% in 2011). Norway and Sweden, which are expected to post strong GDP growth,are not expected to see strong inflation. Belgian inflation is forecast to be 2% in 2011versus just 1.1% in the Netherlands. This reverses the 2009 inflation number whereBelgium showed deflation of 0.1% and the Netherlands suffered inflation of 1.2%.Belgian inflation expectations outlookOil sensitive andindexed wagesOur Belgium economists believe that the strong historic link of automatic wageindexation to inflation will trigger price rises. In addition, the Belgian economy seems tobe more sensitive to oil price rises than most of the surrounding countries. Thisexplains why our economists believe that Belgian inflation will run 20bp above theEurozone average of 1.8%.60
_<strong>Benelux</strong> <strong>Real</strong> <strong>Estate</strong> February 2010Dutch inflation expectationsUnder-utilisation ofcapacity and 2011 lowinflation spill overOur Netherlands Economist believes that in 2011, although the recovery will havestarted, the economy will still be a long way from running at full capacity. Companiesare monitoring costs closely and competing on price in an effort to retain market share.It will take several years of above-average growth to close the gap between actual andpotential production. Sustained under-utilisation will therefore ensure that inflationremains modest in the coming years. In addition, rents have a weight of 15-20% inCPI. So low inflation in 2010 (1.2%) spills over into 2011.Credit marketsAsset swap spreadshave come down to2008 levelsFrom October 2008 the credit markets were shut down for a large part of the year, inparticular for the insolvent lenders, with a low credit rating. From April 2009 the debtmarket slowly began to open up again, and recently asset swap spreads (thedifference between a bond yield and the IBOR curve in basis points) have come downto early 2008 levels. This is illustrated by the charts below.Fig 79 Asset swap spread AAA, AA & A rated bondsFig 80 Asset swap spread BBB, BB & B rated bonds3002502001800160014001200bp150100500-50Feb-08 May-08 Aug-08 Nov-08 Feb-09 May-09 Aug-09 Nov-09 Feb-10AAA AA Abp10008006004002000Feb-08 May-08 Aug-08 Nov-08 Feb-09 May-09 Aug-09 Nov-09 Feb-10BBB BB BSource: INGIn the appendices we reproduce full tables of our macro expectations for the G7,Western Europe and EMEA.61
<strong>Benelux</strong> <strong>Real</strong> <strong>Estate</strong> February 2010This page is left blank intentionally62
<strong>Benelux</strong> <strong>Real</strong> <strong>Estate</strong> February 2010Companies63
<strong>Benelux</strong> <strong>Real</strong> <strong>Estate</strong> February 2010This page is left blank intentionally64
___<strong>Benelux</strong> <strong>Real</strong> <strong>Estate</strong> February 2010BelgiumAedificaEx-expats?Jean-Yves DevlooAmsterdam (31) 20 563 8745jean-yves.devloo@ing.comArjan KnibbeAmsterdam (31) 20 563 8780arjan.knibbe@ing.comInitiating coverageSell<strong>Real</strong> <strong>Estate</strong>5 February 2010€40.55Target price (12 month)€33.88ReutersAOO.BRAedifica shares have performed well, up c.20% since Aprillows. The results in the apartments and hotels division arelikely to offset resilience in nursing homes, leading to afall of nearly 20% in 2010F EPS. SELL.We believe the furnished part of the portfolio will disappoint, relying on shorttermBrussels CBD corporate rentals. Nursing homes (currently c.46% of theportfolio’s value) will only partly limit the damage. The FY08/09 dividend of€1.80 might be at risk. Valued at a FY09/10F PER of c.21x, we prefer to takeprofits and wait for further nursing home deals to add stability.Sensitivity of 2010F EPS to vacancy and total like-for-like (€)Vacancy rate (%)2.5 3.5 4.5 5.5 6.5 7.5 8.5 9.5-1 1.83 1.78 1.73 1.68 1.62 1.57 1.52 1.470 1.88 1.83 1.78 1.72 1.67 1.62 1.57 1.521 1.93 1.88 1.82 1.77 1.72 1.67 1.62 1.57LFL (%) 2 1.98 1.92 1.87 1.82 1.77 1.72 1.67 1.623 2.03 1.97 1.92 1.87 1.82 1.77 1.72 1.674 2.07 2.02 1.97 1.92 1.87 1.82 1.77 1.725 2.12 2.07 2.02 1.97 1.92 1.87 1.82 1.776 2.17 2.12 2.07 2.02 1.97 1.92 1.87 1.82Source: ING estimatesKey ratios and forecastsYr to June 2008/09 2009/10F 2010/11F 2011/12F 2012/13F12-month forecast returns (%)Share price -16.0Dividend 4.712m f'cst total return -11.3Key ratios (%)2008/09 2009/10FRental growth 20.5 1.2Operating margin 70.8 69.7Occupancy rate 96.2 95.5Share dataNo of shares (€m) 4.7Daily turnover (shares, 3M) 3,700Free float (%) 100Enterprise value (€m) 367.96Market cap (€m) 188.61Share price performance454035302520151/08 7/08 1/09 7/09 1/10EPS adj (€) 2.09 1.91 2.38 2.61 2.74PER (x) 19.1 20.9 16.9 15.3 14.6Net yield (%) 6.5 6.4 5.7 5.8 6.0IFRS NAV per share (€) 37.7 35.4 35.7 36.4 37.0EPRA NNNAV per share (€) N/A N/A N/A N/A N/AP/IFRS NAV (%) 1.06 1.13 1.12 1.10 1.08DPS (€) 1.80 1.82 2.14 2.35 2.46Dividend yield (%) 4.5 4.5 5.3 5.9 6.1CFPS (€) 2.09 1.91 2.38 2.61 2.74LTV (%) 53.0 55.8 60.6 59.9 59.3Source: Company data, ING estimatesSource: INGPriceBEL 20 (rebased)65
_<strong>Benelux</strong> <strong>Real</strong> <strong>Estate</strong> February 2010Investment caseAedifica owns a c.€351m portfolio and has a strong track record in the nursinghomes segment, valued at 46% of total portfolio. Aedifica has nearly 2,100beds, on triple-net long-term rental contracts to solvent operators. The mostimportant value drivers are Belgium’s population demographics, favourablelegislation regarding nursing homes, the need for more consolidation amongnursing home operators and (longer term) value-driven investments. We findmanagement very ambitious and focused on achieving cash-flow growth, fuelledby nursing home acquisitions, likely to be combined with the issuance ofadditional equity. Value-based investments in the apartments segment are likelyto add growth in the longer run given the short maturity profile of the portfolio.The current business model is likely to suffer from a cyclical downturn in theBrussels short-term rental market. The dividend only looks sustainable basedon a 94% payout rate (86% in FY08/09). We believe Aedifica is currentlyoverbought and prefer to cash in. Sell on strength.SWOTFig 81 SWOT analysisStrengthsDiversified portfolio (albeit that short-term apartment leases will sufferin coming quarters)Independent corporate governance structure allows quick expansionof the portfolio without controlling shareholders’ interferenceResidential REIT: no withholding tax is imposed on the dividendsAmbitious and commercial managementAedifica is a small and flexible companyOpportunitiesStrong equity story for future growth with nursing home acquisitionsSupportive macro economic and legal environment regarding nursinghome investmentsStudent housingPublic private partnerships in the undersupplied Brussels socialhousing segmentLimited tax advantages for Belgian households buying their housecompared with other countries leads to a stronger tenant marketAddition of more growth should allow a fully internalised managementstructure in furnished apartments and an improving operating marginNeed for more consolidation among nursing home operators createsample opportunities for real estate partnershipsAdd value by adding nursing home developmentsWeaknessesShort-debt maturityLack of implementation of the EPRA best practicerecommendationsUnfurnished apartments will hurt EPSSmall liquidity and market cap limits visibility for institutionalinvestorsApartments portfolio is too young to allow value creation from lotfor-lotsalesLow operating marginThreats/RisksPersistence of the economic crisis may cause a slump in theBrussels short rental marketAccording to our model, he dividend FY09/10 is only sustainable ona 98% payout basisChange in the favourable government attitude regarding subsidiesto nursing home operatorsSource: ING66
<strong>Benelux</strong> <strong>Real</strong> <strong>Estate</strong> February 2010RisksBecause of the contractual nature of a large part of the recurring cash flows, propertycompanies are usually considered to have less risk than most other equity sectors.The risks for any property company bear a strong relationship with the amount ofdevelopment exposure, the geographical and sector breakdown, corporate governanceand the alignment of interest between management and shareholders.Principally an investorWe believe that Aedifica carries low risk as it is principally an investor, which is theleast risky activity of the four core real estate company activities: investment,development, trading and asset management. The current business model carriessome cyclical risk with the furnished apartments (which are generally short-term let toCentral Brussels-based expats), a market that is expected to suffer heavily from theeconomic crisis. We expect additional nursing homes to remove some cyclicality.Tenant riskApproximately 40% of FY08/09 rents was derived from nursing home operators, whohave long-term, triple-net, indexed rental contracts. We believe these rental inflowscarry low risk as c.50% of the nursing home operators’ income is secured bygovernment subsidies.Accounting for leasesThere are accounting initiatives that may lead to the obligation of tenants to accountlong leases as a liability in their balance sheets. This could, in the future, put pressureon the average lease lengths of real estate companies and Aedifica.No currency risksAll rents and expenses are made in euro, so there are no currency risks.CatalystsWe see the following catalysts:• performance of the furnished apartments versus our expectations• increase in the proportion of nursing homes in the current portfolio• effect of the economic crisis on the Brussels rental market• Half-year results on 16 February• Diversification into student housing• Public-private partnership in the undersupplied social housing sector• Change in the government’s attitude towards nursing home careOutlookWe believe dividendcould be at riskAedifica said it hopes to maintain the FY08/09 dividend of €1.80. We believe thisguidance could be at risk (it would involve a 94% payout according to our model), onthe back of limited indexation and increasing vacancies, primarily in the unfurnishedapartments segment.67
__<strong>Benelux</strong> <strong>Real</strong> <strong>Estate</strong> February 2010ValuationPremium unjustifiedgiven vulnerableapartment markets andlimited liquidityWe value Aedifica on a 5% discount to its FY09/10F IFRS NAV of €35.4. We do notbelieve a premium valuation is justified given the cyclical exposure to the furnishedapartments segment, the anticipated decrease in earnings, which is not priced in, inour view, the limited liquidity and small market capitalisation. The dividend yield is4.7%.We expect Aedifica to spend €7.1m on operational cost in FY09/10F, but net rents arerunning just below €23m. We are not advocates of the ‘large is beautiful’ fashion butAedifica must grow to become more efficient.ConsensusFig 82 Consensus EPS overview (€)2008/09 2009/10F 2010/11FConsensus 2.09 1.93 2.44ING 2.09 1.91 2.38Difference 0.00 -0.02 -0.06Difference (%) 0.2 -0.9 -2.7Source: Reuters, ING estimates_Our estimates and assumptions1) Vacancies: we expect the furnished apartment vacancy rate to pass 16% inFY09/10F, slowing thereafter.Fig 83 Our vacancy assumptions (%)2009/10F 2010/11F 2011/12F 2012/13FUnfurnished 4.5 5.0 4.5 3.0Furnished 16.0 16.0 14.0 12.0Senior homes 0.0 0.0 0.0 0.0Hotels & other 0.0 0.0 0.0 0.0Intersegment N/A N/A N/A N/ATotal 4.5 4.6 4.1 3.4Source: ING estimates2) Total like-for-like rental growth: also includes incentives and renegotiations, butdoes not include vacancy movements.Fig 84 Our total indexation estimates (%)2009/10F 2010/11F 2011/12F 2012/13FUnfurnished 0.4 1.4 2 2Furnished 2.5 2.5 3 3Senior homes 0.4 1.4 2 2Hotels & other 0.9 1.9 2.5 2.5Intersegment N/A N/A N/A N/ATotal 0.9 1.7 2.3 2.3Source: ING estimates3) Portfolio valuations: we expect cap rates to stabilise, albeit at a relatively slow ratein the furnished and hotels segment.68
_<strong>Benelux</strong> <strong>Real</strong> <strong>Estate</strong> February 2010Fig 85 Our valuation assumptions (%)2009/10F 2010/11F 2011/12F 2012/13FUnfurnished -1.5 0.0 1.0 1.0Furnished -4.7 -1.0 0.0 0.0Senior homes -0.5 0.0 0.0 0.0Hotels & other -4.9 -2.0 -0.5 0.0Total -1.7 -0.3 0.2 0.3Source: ING estimates69
_<strong>Benelux</strong> <strong>Real</strong> <strong>Estate</strong> February 2010Company profileBelgian residentialplayerAedifica was founded at the end of 2005 by the Belgian bank, Degroof, and theBrussels-based real estate broker, GVA finance, with the strategy of developing aBelgium-based residential real estate portfolio. This was done according to a threepointinvestment strategy:• Presence in large and important city centres in Belgium as people tend to prefercities over less urbanised areas;• Address the living needs of an overall ageing population;• Focus on niche opportunities, such as temporary furnished apartments on shorttermlets with several add on servicesAfter being recognised as a Bevak/Sicafi (Belgian REIT structure) shortly after itsfoundation, Aedifica was quoted at end-2006. At the time of writing, Aedifica isoperating as the foremost quoted investor in residential real estate in Belgium with aportfolio valued at €351m as at end-September 2009, spread over nursing homes,furnished and unfurnished apartments and hotels.Fig 86 Breakdown per type of asset Fig 87 Breakdown per locationOther10%Unfurnishedapartments32%Wallonia21%Senior homes46%Furnishedapartments12%Flanders16%Brussels63%Source: Company dataSource: Company dataResidential Sicafi paysno witholding tax ondividendsCash flow growthversus value growthAedifica is recognised as a residential Sicafi, and therefore must be distinguished fromother, general Sicafi’s in that there is no withholding tax levied on the dividendsdistributed. This is because the registration rights cannot be deferred on the tenants,but must be paid by the owner, which is not the case with Sicafi’s that invest in otherasset classes.Aedifica’s growth is primarily based on the generation of stable and growing cashflows. Lot-for-lot apartment sales should add additional value. Given the portfolio’syoung profile, we believe growth will especially come from the nursing homes as theapartment buildings are too young to be suited for lot-for-lot sales.70
_<strong>Benelux</strong> <strong>Real</strong> <strong>Estate</strong> February 2010Fig 88 Gross yield per asset type (%) Fig 89 Lease duration overview (%)121086420June 2007 June 2008 June 2009Unfurnished Furnished Nursing homes Hotels and other10080604020010 years Triple netNature of contractsSource: Company dataSource: Company dataUnfurnishedapartments: averagerotation of two yearsThe unfurnished part of the portfolio comprises
__<strong>Benelux</strong> <strong>Real</strong> <strong>Estate</strong> February 2010advantageous regulatory system that ensures full occupancy, and triple-net lettingcontracts pushing all operating costs towards the tenant and thus ensuring anoperating margin of 100%. 6Fig 91 Key nursing home tenants according to FY08/09 total nursing homerental income (%)Armonea7%New Philip13%Senior LivingGroup23%Château ChenoisGestion18%Futuro9%Medibelge30%Source: Company dataHotels are notstrategically ownedAedifica currently has two hotels, which are fully let on a triple net basis and have beenpart of the portfolio since the start of the company. Given the limited size of theseassets (c.10% of the portfolio’s contractual rents), there is no risk that the residentialstatus of the Sicafi would be lost, resulting in taxability of the dividends distributed(residential Sicafi’s must have at least 60% of funds invested in residential real estate).Fig 92 Top-ten assets according to FY08/09 estimated rental valueName Type Location Floor area(000m²)ResidentialunitsOccupancyrate(%)Estimatedrental value(€m)% of groupERVComplex Opperstraat Furnished appt Brussels 11.9 116.0 84.2 1.4 6.2Hotel Martin's Brugge Hotel Bruges 11.4 - 100.0 1.1 4.9Residentie Parc Palace Senior home Brussels 6.7 180.0 100.0 1.1 4.8Zavel Unfurnished appt Brussels 4.7 30.0 92.7 1.0 4.7Résidence du Golf Senior home Brussels 6.4 202.0 100.0 1.0 4.5Residentie Service Senior home Brussels 8.7 200.0 100.0 0.9 4.2Ring Unfurnished appt Antwerp 10.2 82.0 100.0 0.8 3.7Château Chenois Senior home Waterloo 6.4 75.0 100.0 0.8 3.6Residentie Palace Unfurnished appt Brussels 6.4 57.0 82.9 0.7 3.1Tervuren 13 A/B Unfurnished appt Brussels 4.6 3.0 84.1 0.7 3.0Total 77.4 9.5 42.7Portfolio total 184.9 22.0 100.0% of portfolio total 41.9 43.2Source: Company data6 For a general overview of the nursing homes business, refer to the front section of this book72
_<strong>Benelux</strong> <strong>Real</strong> <strong>Estate</strong> February 2010Corporate governanceManagementCEO Stefaan Gielens• CEO since 2005• Previously CEO at Almafin <strong>Real</strong> <strong>Estate</strong> (now KBC <strong>Real</strong> <strong>Estate</strong>)• Masters degree in Law and post graduate in real estateCFO Jean Kotarakos• CFO since 2007• Formerly financial manager at D’Ieteren Lease and auditor at KPMG• Holds a masters degree in managementShareholder structureThe major shareholders are depicted in Figure 13. Degroof has been a shareholdersince the company was established. We have no indication that any of theparticipations are strategic. As a consequence, the free float adds up to 100%.Fig 93 Shareholder overviewDegroof holdingLuxembourg12%Degroof globalSicav6%Jubeal Foundation7%Other69%StichtingAdministratie Tikva6%Source: Bloomberg73
_<strong>Benelux</strong> <strong>Real</strong> <strong>Estate</strong> February 2010FinancialsFig 94 Balance sheet (€m)As at 30 June 2008/09 2009/10F 2010/11F 2011/12F 2012/13F 2014/15FGoodwill 1.9 1.9 1.9 1.9 1.9 1.9Intangible fixed assets 0.1 0.1 0.1 0.1 0.1 0.1Investment properties 351.1 361.2 410.1 411.0 412.2 413.3Project developments 5.2 5.2 5.2 5.2 5.2 5.2Other fixed assets 1.7 1.7 1.7 1.7 1.7 1.7Financial fixed assets 3.2 3.2 3.2 3.2 3.2 3.2Financial lease receivables 0.0 0.0 0.0 0.0 0.0 0.0Participations 0.0 0.0 0.0 0.0 0.0 0.0Receivables and other 0.0 0.0 0.0 0.0 0.0 0.0Deferred taxes 0.0 0.0 0.0 0.0 0.0 0.0Total fixed assets 363.1 373.2 422.1 423.1 424.2 425.4Assets held for sale 0.0 0.0 0.0 0.0 0.0 0.0Current financial assets 0.0 0.0 0.0 0.0 0.0 0.0Financial lease receivables 0.0 0.0 0.0 0.0 0.0 0.0Trade debtors 1.1 1.2 1.4 1.4 1.5 1.5Deferred taxes 2.9 3.0 3.5 3.6 3.7 3.8Cash and equivalent 1.0 (14.6) (61.8) (59.6) (57.8) (56.0)Accruals 0.4 0.4 0.4 0.4 0.4 0.5Total current assets 5.3 (10.0) (56.6) (54.2) (52.3) (50.3)Total assets 368.4 363.2 365.6 368.8 371.9 375.1Total equity to shareholders 172.7 167.1 168.5 171.6 174.5 177.4Minority interests 0.0 0.0 0.0 0.0 0.0 0.0Total equity 172.7 167.1 168.5 171.6 174.5 177.4Provisions 0.0 0.0 0.0 0.0 0.0 0.0Long-term financial debt 176.3 176.3 176.3 176.3 176.3 176.3Other long-term financial debt 13.5 13.5 13.5 13.5 13.5 13.5Trade debt and others 0.0 0.0 0.0 0.0 0.0 0.0Other long-term debt 0.0 0.0 0.0 0.0 0.0 0.0Deferred taxes 0.0 0.0 0.0 0.0 0.0 0.0Total long-term liabilities 189.8 189.8 189.8 189.8 189.8 189.8Provisions 0.0 0.0 0.0 0.0 0.0 0.0Current financial debt 0.0 0.0 0.0 0.0 0.0 0.0Other short-term financial debt 0.0 0.0 0.0 0.0 0.0 0.0Trade debt and other 4.0 4.2 4.9 5.0 5.1 5.3Other short-term debts 0.0 0.0 0.0 0.0 0.0 0.0Accruals 1.9 2.1 2.4 2.4 2.5 2.6Total short-term liabilities 5.9 6.3 7.2 7.4 7.6 7.8Total liabilities 195.7 196.1 197.0 197.2 197.5 197.7Total equity and liabilities 368.4 363.2 365.6 368.8 371.9 375.1Source: Company data, ING estimates74
__<strong>Benelux</strong> <strong>Real</strong> <strong>Estate</strong> February 2010Fig 95 Profit and loss (€m)Yr to June 2008/09 2009/10F 2010/11F 2011/12F 2012/13F 2014/15FGross rents 23.1 23.9 26.9 28.4 29.2 30.1Rent expenses (0.1) (0.1) (0.1) (0.1) (0.1) (0.1)Net rents 22.9 22.9 23.3 24.0 24.7 25.4Subtotal operational costs ex portfolio result (6.6) (7.1) (8.0) (8.5) (8.7) (9.0)Operational property result before portfolio result 16.3 16.7 18.8 19.8 20.4 21.0Gain on sales 0.0 0.0 0.0 0.0 0.0 0.0Gain on sales other non financial assets 0.0 0.0 0.0 0.0 0.0 0.0FV on property (9.7) (6.1) (1.1) 1.0 1.1 1.1Total operational result 6.6 10.5 17.6 20.8 21.5 22.1Financial gains 1.3 0.0 0.0 0.0 0.0 0.0Interest costs (7.9) (8.0) (8.0) (8.0) (8.0) (8.0)Net interest costs (6.5) (8.0) (8.0) (8.0) (8.0) (8.0)Net financial result (15.4) (8.0) (8.0) (8.0) (8.0) (8.0)Result before taxes (8.8) 2.5 9.7 12.8 13.5 14.1Corporation tax 0.0 0.0 (0.1) (0.1) (0.1) (0.1)Total taxes 0.0 0.0 (0.1) (0.1) (0.1) (0.1)Net result (8.9) 2.5 9.6 12.7 13.5 14.1Net result attributed to shareholders (8.9) 2.5 9.6 12.7 13.5 14.1Source: Company data, ING estimatesFig 96 Cash flow statement (€m)Yr to June 2008/09 2009/10F 2010/11F 2011/12F 2012/13F 2014/15FNet result (8.9) 2.5 9.6 12.7 13.5 14.1Minority interest 0.0 0.0 0.0 0.0 0.0 0.0Taxes 0.0 0.0 0.0 0.0 0.0 0.0Depreciations 0.3 0.0 0.0 0.0 0.0 0.0Amortisations 0.1 0.0 0.0 0.0 0.0 0.0FV changes on investment properties and developments 9.7 6.1 1.1 (1.0) (1.1) (1.1)Gains on sales 0.0 0.0 0.0 0.0 0.0 0.0Financial result 15.4 0.0 0.0 0.0 0.0 0.0Change in trade debtors (0.5) (0.1) (0.2) 0.0 0.0 0.0Change in tax debts and other current assets 0.5 (0.1) (0.5) (0.1) (0.1) (0.1)Change in accruals (asset items) 0.3 0.0 (0.1) 0.0 0.0 0.0Change in trade debts and other current debts (except exit tax) 0.3 0.2 0.6 0.1 0.1 0.1Change in accruals (liability items) 0.4 0.2 0.3 0.1 0.1 0.1Total cash from operating activities 17.8 8.8 11.0 11.8 12.4 13.0Taxes paid (0.1) 0.0 0.0 0.0 0.0 0.0CF from operating activities (net) 17.8 8.8 11.0 11.8 12.4 13.0Financial fixed asset purchases 0.0 0.0 0.0 0.0 0.0 0.0Purchases of investment companies (7.4) (16.2) (50.0) 0.0 0.0 0.0Purchases of other fixed assets (0.1) 0.0 0.0 0.0 0.0 0.0Purchases of project developments (2.4) 0.0 0.0 0.0 0.0 0.0Sale of investment properties 0.0 0.0 0.0 0.0 0.0 0.0Payment of non current debtors 1.2 0.0 0.0 0.0 0.0 0.0Net investment in other fixed assets 0.0 0.0 0.0 0.0 0.0 0.0CF from Investment activities (8.7) (16.2) (50.0) 0.0 0.0 0.0Capital raise (net of expenses) 0.0 0.0 0.0 0.0 0.0 0.0Sale of own shares 0.0 0.0 0.0 0.0 0.0 0.0Dividend of previous year (7.5) (8.1) (8.2) (9.6) (10.6) (11.1)Net change in bank credit lines 14.3 0.0 0.0 0.0 0.0 0.0Net change in other loans 0.0 0.0 0.0 0.0 0.0 0.0Net financial expenses paid (7.0) 0.0 0.0 0.0 0.0 0.0Redemption of financial debt of companies acquired (2.5) 0.0 0.0 0.0 0.0 0.0Redemption of working capital needs of companies acquired (5.8) 0.0 0.0 0.0 0.0 0.0CF from financing activities (8.5) (8.1) (8.2) (9.6) (10.6) (11.1)Total cash flow 0.6 (15.6) (47.2) 2.2 1.8 1.9Cash BOP 0.4 1.0 (14.6) (61.8) (59.6) (57.8)Cash EOP 1.0 (14.6) (61.8) (59.6) (57.8) (56.0)Source: Company data, ING estimates75
__<strong>Benelux</strong> <strong>Real</strong> <strong>Estate</strong> February 2010Fig 97 Per share data (€)Yr to June 2008/09 2009/10F 2010/11F 2011/12F 2012/13F 2014/15FShares issued 4,576,797 4,716,926 4,716,926 4,716,926 4,716,926 4,716,926Result per share (€) (1.97) 0.55 2.13 2.82 2.99 3.12Diluted result per share (€) (1.97) 0.55 2.13 2.82 2.99 3.12EPS recurring 2.09 1.91 2.38 2.61 2.74 2.86Dividend per share 1.80 1.82 2.14 2.35 2.46 2.58IFRS NAVPS 37.7 35.4 35.7 36.4 37.0 37.6Recurring CFPS 2.09 1.91 2.38 2.61 2.74 2.86Source: Company data, ING estimatesFig 98 Half-year profit and loss (€m)Yr to June 1H08/09 2H08/09 1H09/10F 2H09/10F 1H10/11F 2H10/11FGross rents 11.6 11.5 11.8 12.1 13.0 13.9Rent expenses 0.0 (0.1) 0.0 0.0 (0.1) (0.1)Net rents 11.5 11.4 11.7 12.1 12.9 13.9Subtotal operational costs ex portfolio result (3.4) (3.2) (3.5) (3.6) (3.9) (4.2)Operational property result before portfolio result 8.1 8.2 8.2 8.5 9.0 9.7Gain on sales 0.0 0.0 0.0 0.0 0.0 0.0Gain on sales other non financial assets 0.0 0.0 0.0 0.0 0.0 0.0FV on property (1.3) (8.5) (4.2) (1.9) (0.8) (0.3)Total operational result 6.8 (0.2) 4.0 6.5 8.2 9.4Financial gains 1.1 0.3 0.0 0.0 0.0 0.0Interest costs (4.3) (3.5) (4.0) (4.0) (4.0) (4.0)Net interest costs (3.3) (3.3) (4.0) (4.0) (4.0) (4.0)Other financial costs (9.0) 0.1 0.0 0.0 0.0 0.0Net financial result (12.2) (3.2) (4.0) (4.0) (4.0) (4.0)Result before taxes (5.4) (3.4) 0.0 2.5 4.3 5.4Corporation tax 0.0 0.0 0.0 0.0 0.0 0.0Total taxes 0.0 0.0 0.0 0.0 0.0 0.0Net result (5.4) (3.4) 0.0 2.5 4.2 5.4Net result attributed to shareholders (5.4) (3.4) 0.0 2.5 4.2 5.4Source: Company data, ING estimates76
__<strong>Benelux</strong> <strong>Real</strong> <strong>Estate</strong> February 2010Fig 99 Half-year cash flow statement (€m)Yr to June 1H08/09 2H08/09 1H09/10F 2H09/10F 1H10/11F 2H10/11FNet result (5.4) (3.4) 0.0 2.5 4.2 5.4Minority interest 0.0 0.0 0.0 0.0 0.0 0.0Taxes 0.0 0.0 0.0 0.0 0.0 0.0Depreciations 0.2 0.2 0.0 0.0 0.0 0.0Amortisations 0.0 0.1 0.0 0.0 0.0 0.0FV changes on investment properties and developments 1.3 8.5 4.2 1.9 0.8 0.3Gains on sales 0.0 0.0 0.0 0.0 0.0 0.0Financial result 12.2 3.2 0.0 0.0 0.0 0.0Change in trade debtors (0.5) 0.0 (0.1) 0.0 (0.1) (0.1)Change in tax debts and other current assets 0.3 0.2 (0.1) (0.1) (0.2) (0.2)Change in accruals (asset items) 0.2 0.1 0.0 0.0 0.0 0.0Change in trade debts and other current debts (except exit tax) (0.2) 0.5 0.1 0.1 0.3 0.3Change in accruals (liability items) (0.7) 1.1 0.1 0.1 0.1 0.2Total cash from operating activities 7.4 10.4 4.3 4.5 5.1 5.8CF from operating activities (net) 7.4 10.4 4.3 4.5 5.1 5.8Financial fixed asset purchases 0.0 0.0 0.0 0.0 0.0 0.0Purchases of investment companies (6.9) (0.5) (16.2) 0.0 (25.0) (25.0)Purchases of other fixed assets 0.0 0.0 0.0 0.0 0.0 0.0Purchases of project developments (1.7) (0.7) 0.0 0.0 0.0 0.0Sale of investment properties 0.0 0.0 0.0 0.0 0.0 0.0Payment of non current debtors 1.2 0.0 0.0 0.0 0.0 0.0Net investment in other fixed assets 0.0 0.0 0.0 0.0 0.0 0.0CF from investment activities (7.5) (1.2) (16.2) 0.0 (25.0) (25.0)Capital raise (net of expenses) 0.0 0.0 0.0 0.0 0.0 0.0Sale of own shares 0.0 0.0 0.0 0.0 0.0 0.0Dividend of previous year (7.5) 0.0 (8.1) 0.0 (8.2) 0.0Net change in bank credit lines 21.7 (7.4) 0.0 0.0 0.0 0.0Net change in other loans 0.0 0.0 0.0 0.0 0.0 0.0Net financial expenses paid (3.5) (3.5) 0.0 0.0 0.0 0.0Redemption of financial debt of companies acquired (2.5) 0.0 0.0 0.0 0.0 0.0Redemption of working capital needs of companies acquired (8.2) 2.3 0.0 0.0 0.0 0.0CF from financing activities 0.1 (8.5) (8.1) 0.0 (8.2) 0.0Total cash flow (0.1) 0.6 (20.0) 4.5 (28.1) (19.2)Cash BOP 0.4 0.3 1.0 (19.1) (14.6) (42.7)Cash EOP 0.3 1.0 (19.1) (14.6) (42.7) (61.8)Source: Company data, ING estimatesFig 100 Half-year per share data (€)Yr to June 1H08/09 2H08/09 1H09/10F 2H09/10F 1H10/11F 2H10/11FShares issued 4,436,668 4,576,797 4,716,926 4,716,926 4,716,926 4,716,926Result per share (€) (1.21) (0.76) 0.00 0.56 0.94 1.19EPS recurring 1.07 1.09 0.93 0.98 1.11 1.26Dividend per share 1.71 0.00 1.80 0.00 1.82 0.00IFRS NAVPS 39.4 37.7 34.9 35.4 34.6 35.7Recurring CFPS 1.07 1.09 0.93 0.98 1.11 1.26Source: Company data, ING estimates77
<strong>Benelux</strong> <strong>Real</strong> <strong>Estate</strong> February 2010This page is left blank intentionally78
_<strong>Benelux</strong> <strong>Real</strong> <strong>Estate</strong> February 2010BelgiumBefimmoQuality offices in weakening marketJean-Yves DevlooAmsterdam (31) 20 563 8745jean-yves.devloo@ing.comArjan KnibbeAmsterdam (31) 20 563 8780arjan.knibbe@ing.comMaintainedHold<strong>Real</strong> <strong>Estate</strong>5 February 2010€59.3Target price (12 month): Previously: €57.8€61.19ReutersBFB.BRDespite its focused quality portfolio, we believe Befimmowill underperform the European real estate market. Weexpect substantial lease incentives to hurt like-for-like rentalgrowth in a deteriorating Brussels offices market. HOLD.We expect EPS to drop 16% YoY, on the back of the recent rightsissue proceeds that have not materialised in accretive acquisitions andincentives used to fill current renovations. We see limited near-term growth:our 2010-11F EPS are 3-14% and 3-7% below company guidance andconsensus.Sensitivity of our 2010F EPS to vacancy rate and total like-for-like (€)Vacancy rate (%)4.5 5.5 6.5 7.5 8.5 9.5 10.5 11.5-4 4.35 4.27 4.20 4.12 4.05 3.97 3.89 3.82-3 4.42 4.34 4.27 4.19 4.12 4.04 3.97 3.89-2 4.49 4.41 4.34 4.26 4.19 4.11 4.04 3.96LFL (%) -1 4.56 4.48 4.41 4.33 4.26 4.18 4.11 4.030 4.63 4.56 4.48 4.40 4.33 4.25 4.18 4.101 4.70 4.63 4.55 4.48 4.40 4.32 4.25 4.172 4.77 4.70 4.62 4.55 4.47 4.39 4.32 4.243 4.84 4.77 4.69 4.62 4.54 4.47 4.39 4.31Source: ING estimatesKey ratios and forecastsYear to Sep FY08/09 FY09/10F FY10/11F FY11/12F FY12/13F12-month forecast returns (%)Share price 3.0Dividend 6.612m f'cst total return 9.6Key ratios (%)Yr to SepFY08/09 FY09/10FRental growth 8.7 -0.2Operating margin 89.1 88.7Occupancy rate 93.7 93.4Share datano of shares (m) 16.8Daily turnover (shares, 3M) 25,000Free float (%) 81Enterprise value (€m) 1940.7Market cap (€m) 992.63Share price performance90807060504030201/08 7/08 1/09 7/09 1/10EPS adj (€) 5.16 4.36 4.45 4.56 4.69PER (x) 11.5 13.6 13.3 13.0 12.6Net yield (%) 6.2 6.3 6.4 6.5 6.6IFRS NAV per share (€) 58.9 57.8 58.3 59.0 59.6EPRA NNNAV per share (€) N/A N/A N/A N/A N/AP/IFRS NAV (%) 1.0 1.0 1.0 1.0 1.0DPS (€) 4.40 3.90 4.02 4.14 4.26Dividend yield (%) 7.4 6.6 6.8 7.0 7.2CFPS (€) 5.16 4.36 4.46 4.57 4.70LTV (%) 40.9 41.1 40.5 39.8 39.1Source: Company data, ING estimatesSource: INGPriceBEL 20 (rebased)79
_<strong>Benelux</strong> <strong>Real</strong> <strong>Estate</strong> February 2010Investment caseWith its €1.9bn portfolio of quality office space, Befimmo has a leading marketposition in the Brussels offices market. Befimmo has a number of keyrenovations that will come on stream during 2010-11. In addition, the leaseguarantee related to the recently delivered Axento office project in Luxembourg(valued at c.€100m) will expire at end-2010.With c.400,000m² of speculative deliveries coming on stream, the Brusselsoffices market (which has stock of 12.9m m²) will see vacancy levels passcurrent historical highs at >12%. We expect lease incentives will be used inorder to maintain decent occupancy levels, resulting in negative like-for-likerental levels and a 2% decrease in FY09/10 IFRS NAV. This was reflected inBefimmo’s outlook for the FY09/10 cash flow per share (CFPS) during itscommunication of the FY08/09 results. We expect Befimmo’s share price todrop on the back of the overheated supply and prefer an underweight position inBrussels offices. We expect a 6.6% dividend yield after the cut in gross DPSfrom €4.55 to €3.90. We maintain our HOLD recommendation.Befimmo is overweightin the North districtWe have calculated that Befimmo has an overweight position in the Brussels Northoffices district, while Cofinimmo has an overweight position in the Decentraliseddistrict. For a more in-depth comparison between both companies, see the InvestmentCase discussion in our note on Cofinimmo.Fig 1 Cofinimmo and Befimmo overweight and underweight areasPeripheryDecentralisedLouiseLeopoldNorthMidiCentre-15.0 -10.0 -5.0 0.0 5.0 10.0 15.0 20.0 25.0%CofinimmoBefimmoSource: Company data, ING estimates80
<strong>Benelux</strong> <strong>Real</strong> <strong>Estate</strong> February 2010SWOTFig 2 SWOT analysisStrengthsVirtually no corporate taxation thanks to SICAFI statusExposure to Brussels’ CBD, a less volatile and speculative marketthan most office markets in other countriesLong-term duration of rental contractsDiversified and prime tenant baseStrong exposure to public tenants: ensures long-term and stablecash flowInflation-protected investmentLow rental reversion limits the risk of rents dropping sharply in afalling property marketNo speculative project developmentOpportunitiesAcquisitions in foreign markets at fire-sale pricesIn source property management and other functionsStart managing assets for third partiesWeaknessesLack of EPRA best practices guidance despite size and prestigeLow level of detail in interim financial reportingAbsence of accretive acquisitions after the large capital increaseLimited experience and networking in foreign offices marketLittle diversification of assetsLong-term contracts limit the downside, but also the upsidepotential should there be a fast recoveryLegal from (“commanditair vennootschap”) enables potential stronginfluence of AG Insurance on management, at the expense of othershareholdersThreatsDelivery of speculative projects in the Brussels market will increasethe overall vacancy riskSource: ING_RisksProperty companies arelow risk, on averageBecause of the contractual nature of a large part of the recurring cash flows, propertycompanies are usually considered to have less risk than most other equity sectors.The risk of property companies bears a strong relation to the amount of developmentexposure, the geographical and sector breakdown, corporate governance andalignment of interest between management and shareholders.Principally an investor, but in an oversupplied marketBefimmo’s main activityis the least risky:investmentPure play Brusselsoffices is not always asadvantageousWe believe that Befimmo is a low risk property company. It is principally an investor,which is the least risky activity of the four core real estate company activities:investment, development, trading and asset management.The focus on Brussels offices together with some key renovations increases the riskgiven the overheated supply. This could result in long-term rental contractssubstantially below the lucrative rental levels seen a couple of years ago, and whichcould become visible again after a full recovery.Development riskNo speculativedevelopmentsBefimmo has no exposure to speculative developments. The only major developmentthat is currently in the pipeline is Liège Paradis, the development of a fully pre-let officebuilding in Liège, Belgium (capex €60m).Accounting for leasesPotential pressure onlease lengthThere are accounting initiatives that may lead to the obligation of tenants to accountlong leases as a liability in their balance sheets. In the future this could put pressure onthe average lease lengths of real estate companies and Befimmo.Tenant risk is limitedPublic institutions takec.60% of the rent payrollThe largest group of Befimmo’s tenants is formed by the Belgian national and regionalgovernment and the EU institutions, together representing c.60% of the rent payroll ona long-term basis. The next biggest tenant is BNP Paribas Fortis bank, representing81
_<strong>Benelux</strong> <strong>Real</strong> <strong>Estate</strong> February 20103.8% of the rent payroll. We believe the risk here again remains small as this concernssome Belgian regional headquarters that are essential for the bank.Currency risks are absentAll costs and revenues are in euro.CatalystsWe see the following catalysts that could provide some share price upside:• Letting of the current renovation pipeline and the Axento complex in Luxembourg atdecent rental levels, and with few incentives.• Additional pre-let developments to government institutions.• Accretive acquisitions using the proceeds of the capital increase (June, €167mgross).• Results publication on 17 February: book value as of 31 December 2009, halfyearlyresults published 25 May.We are sceptical on the last two catalysts as we believe Befimmo will postpone itsforeign acquisition plans communicated during the capital increase because it does notwant to dilute its pure player strategy. On top of this, we do not see lots of acquisitionopportunities of prime office buildings in the Brussels CBD in the near future.OutlookDuring the FY08/09 results analyst meeting, Befimmo expressed its concern on thecondition of the Brussels offices market by decreasing its outlook for earnings andcash flow per share (see Figure 3).We expect a furtherdeterioration in theBrussels offices marketto lead to a lowerFY09/10 EPS figurecompared withBefimmo’s expectationsClearly, we are more pessimistic than Befimmo on 2010 as we expect limitedindexation and lease incentives to result in a total negative like-for-like rental growth.We expect the Brussels offices market vacancy rate to increase even further into 2010,resulting in lower average rents/m².Fig 3 Outlook: Befimmo versus ING (€)Sep 2009F Sep 2010F Sep 2011F Sep 2012FEPS Befimmo 5.16 5.10 4.60 4.31ING 5.16 4.36 4.45 4.56Difference 0.00 -0.74 -0.15 0.25Difference (%) 0.00 -14.56 -3.21 5.89CFPS Befimmo 5.15 4.88 4.24 3.99ING 5.15 4.36 4.46 4.57Difference 0.00 -0.52 0.22 0.58Difference (%) 0.00 -10.76 5.26 14.65DPS Befimmo 4.40 3.90 3.94 3.98ING 4.40 3.90 4.02 4.14Difference 0.00 0.00 0.08 0.16Difference (%) 0.00 0.00 1.95 3.96Source: Company data, ING estimates82
_<strong>Benelux</strong> <strong>Real</strong> <strong>Estate</strong> February 2010ValuationBefimmo looks 10% tooexpensiveWe value Befimmo at 1.05x 2010F IFRS NAV of €57.8, resulting in a new target priceof €61.2. We believe Befimmo deserves a lower premium valuation than Cofinimmo(which we value at 1.1x 2010F NAV) for a number of reasons:• The large exposure to the weakening Brussels offices market, while Cofinimmo isdiversified into low-risk, long-term let nursing homes and pubs, which will add moreresilience to its business model.• Cofinimmo’s less dilutive recent deleveraging compared with Befimmo.• Absence of acquisition opportunities for Befimmo, despite the recent rights issuewhich was partly “opportunistic”, yet quite expensive, in our view.• Corporate governance: Befimmo is a commanditaire vennootschap, whileCofinimmo is an NV. Befimmo carries large influence from AG Insurance, while wefind Cofinimmo more flexible.ConsensusWe are 4-7% belowconsensus on EPSFigure 4 depicts the consensus overview for EPS. We are 4% more conservative forthe FY09/10F EPS outlook. This can be partly explained by the increase in incentivesthat we expect and the deteriorating offices market, which may not be fullyincorporated in consensus estimates.Fig 4 Consensus overview EPS (€)Year to Sep FY09/10 FY10/11 FY11/12Consensus 4.54 4.64 4.91ING 4.36 4.45 4.56Difference (0.18) (0.19) (0.35)Difference (%) -4.0 -4.0 -7.1Source: Reuters, ING estimates_Our estimates and assumptionsOur earnings and valuation estimates are based on the following assumptions:1) Vacancy rates: we do not expect vacancy levels to move much given the longtermlease contracts. Additional incentives related to current renovations should beable to support current occupancy levels.Fig 5 Our vacancy assumptions (%)Year to Sep FY09/10F FY10/11F FY11/12F FY12/13FBrussels CBD 8.0 6.0 6.0 6.0Brussels decentralised 4.0 3.0 3.0 3.0Brussels periphery 20.0 18.0 18.0 18.0Wallonia 0.0 0.0 0.0 0.0Flanders 5.0 5.0 5.0 5.0Luxembourg 0.0 5.0 5.0 5.0Total 6.6 5.3 5.3 5.3Source: ING estimates2) Total like-for-like rental growth (including incentives, but not vacancymovements): we rely on the forecasts of the ING economics department for the CPIindexation forecast, but apply a penalty in 2010 and 2011 for lease incentives,83
__<strong>Benelux</strong> <strong>Real</strong> <strong>Estate</strong> February 2010which we expect to occur if Befimmo maintains its occupancy rate in line withcurrent levels.Fig 6 Our total like-for-like rental growth estimates (%)Year to Sep FY09/10F FY10/11F FY11/12F FY12/13FBrussels CBD -1.8 0.0 2.0 2.0Brussels decentralised -1.8 0.0 2.0 2.0Brussels periphery -1.8 0.0 2.0 2.0Wallonia -1.8 0.0 2.0 2.0Flanders -1.8 0.0 2.0 2.0Luxembourg -1.8 0.0 2.0 2.0Total -1.8 0.0 2.0 2.0Source: ING estimates3) Portfolio movements: in line with the trend of previous quarters, we expect overallportfolio valuations to stabilise into 2010 and 2011. We believe this trend ofstabilisation will be slower for the decentralised and the peripheral area, wherelease durations are shorter and the vacancy levels of both the portfolio and marketare higher.Fig 7 Portfolio valuation movements (%)Year to Sep FY09/10F FY10/11F FY11/12F FY12/13FBrussels CBD -1.5 0.0 0.0 0.0Brussels decentralised -4.5 -1.0 0.0 0.0Brussels periphery -3.0 -1.0 0.0 0.0Wallonia -4.5 0.0 0.0 0.0Flanders -1.5 0.0 0.0 0.0Luxembourg -0.8 0.0 0.0 0.0Total -2.0 -0.2 0.0 0.0Source: ING estimates84
_<strong>Benelux</strong> <strong>Real</strong> <strong>Estate</strong> February 2010Company profilePure-play investorBefimmo is the second-largest SICAFI in Belgium, with a portfolio worth €1.9bn.Berheim-Comofi (later acquired by Fortis <strong>Real</strong> <strong>Estate</strong> Asset Management and currentlyknown as AG Insurance) founded the company in 1995, and is still the largestshareholder, owning almost 19% of the shares. The remainder of the shares is freefloat. Even though it was initially founded as a mixed-asset investor, it currentlydistinguishes itself from the other Belgian SICAFIs as a pure-play investor:• its investment strategy is to focus solely on office buildings.• assets must be in prime and central locations.• a low-risk tenant base with long-term contracts.Fig 8 Geographic breakdown of the portfolioFlanders20%Wallonia5%Centre18%Periphery10%Leopold17%Decentralised8%North22%Source: Company dataFocus on low-riskoffices, looking to divestdecentralised andperipheral portfolioStrong exposure topublic tenants thanks tothe FedimmoacquisitionConsistent with this pure-play strategy, Befimmo is set to further streamline itsoperations by divesting non-core assets that do not comply with these criteria. Webelieve Befimmo will divest its decentralised and peripheral portfolio (almost a fifth ofthe total portfolio) if opportunities arise.Befimmo won the tender for the Fedimmo portfolio in 2006 with an initial investmentvalue of €725m and an initial yield of 5.5%. This portfolio consists of governmentbuildings located across Belgium with an initial duration of 17 years (currently c.13years remaining), and has significantly enhanced Befimmo’s defensive profile.Befimmo currently holds 90% of the portfolio, with the remainder held by the Belgiangovernment.85
_<strong>Benelux</strong> <strong>Real</strong> <strong>Estate</strong> February 2010Fig 9 Vacancy rate of the Brussels office market versus Cofinimmo andBefimmo (%)20%18%16%14%12%10%8%6%4%2%0%Centre Leopold North Decentralised Periphery Totalmarket Befimmo CofinimmoNote: the Centre vacancy rate of Befimmo includes the Telex (Impératrice) building, which is currently underrenovationSource: Company dataFirst steps towardsinternationalisationtaken in 2009Internal assetmanagementAs a result of rising competition for quality assets in Brussels, Befimmo is looking todiversify its asset base into other countries in the Eurozone that have a similartransparent legal and fiscal system to Belgium. In line with this strategy, Befimmomade its first investment abroad with the Axento project in Luxembourg in mid-2009(12,100m², at an investment consideration of €96m), a market characterised by a largedemand potential. This newly developed office complex is not let at the moment, but arent guarantee is paid by the developer until end-2010. A second step towardsinternationalisation was taken in 2008 with the listing at Euronext Paris, meaning it nowhas all the requirements necessary to acquire SIIC status, the French equivalent ofSICAFI status. This gives the company the opportunity to invest in the French market.Management of the property portfolio is carried out internally, while property facilitymanagement is entirely outsourced.Corporate governanceManagementThe company is managed by CEO Benoît De Blieck, COO Martine Rorif and CFOLaurent Carlier, whose profiles are summarised below.CEO Benoît De Blieck• CEO of Befimmo since 1999.• 25+ years’ experience in various businesses across the real estate value chain(Building, development, asset ownership and management), with experience atBernheim-Comofi, Galliford, Codic and CFE.• Director of UPSI (Union Professionnelle du Secteur Immobilier).CFO Laurent Carlier• CFO of Befimmo since 2006.• Ten years’ experience as Finance Director, with experience at Sodexho and Sanofi.• Board member of FEIB (Financial Executive Institute of Belgium).86
_<strong>Benelux</strong> <strong>Real</strong> <strong>Estate</strong> February 2010COO Martine Rorif• COO of Befimmo since 1997.• Formerly member of the operations staff of Devimmo.• Formerly member of the real estate development team at Entreprises JacquesDelens.Shareholders and stock liquidityClose relation with itsfounder AG InsuranceBefimmo was launched in 1995 by Berheim-Comofi (later acquired by Fortis InsuranceBelgium and currently known as AG Insurance). This explains the longstandingshareholder relationship with AG Insurance, which according to Bloomberg currentlyholds a 14% stake in Befimmo and has participated in the recent rights issue.Fig 10 ShareholdersFortis *14%Free float86%* Fortis element refers to part held by AG Insurance (formerly Fortis Insurance, 8.8%) and Fortis <strong>Real</strong> <strong>Estate</strong> (5.7%)Source: Bloomberg87
_<strong>Benelux</strong> <strong>Real</strong> <strong>Estate</strong> February 2010FinancialsFig 11 Balance sheet (€m)Year to Sep FY08/09 FY09/10F FY10/11F FY11/12F FY12/13F FY13/14F FY14/15FGoodwill 15.9 15.9 15.9 15.9 15.9 15.9 15.9Investment properties 1,918.3 1,885.4 1,882.4 1,882.4 1,882.4 1,882.4 1,882.4Other PP&E 0.6 0.6 0.6 0.6 0.6 0.6 0.6Fixed assets 1,939.7 1,906.8 1,903.8 1,903.8 1,903.8 1,903.8 1,903.8Assets held for sale 4.6 4.8 4.8 4.9 5.0 5.1 5.2Current financial assets 0.6 0.6 0.6 0.6 0.6 0.6 0.7Finance lease receivables 7.3 7.2 7.3 7.4 7.6 7.7 7.9Trade receivables 23.5 23.9 24.2 24.7 25.2 25.7 26.2Tax receivables and other current assets 3.3 3.0 3.0 3.1 3.1 3.2 3.3Cash and cash equivalents 6.1 14.6 27.9 41.8 55.9 70.2 84.7Deferred charges and accrued income 4.4 4.2 4.2 4.3 4.4 4.5 4.6Current assets 49.7 58.2 72.1 86.9 101.9 117.1 132.5Total assets 1,989.4 1,964.9 1,975.9 1,990.7 2,005.7 2,020.9 2,036.3Equity to Befb SH 988.4 970.0 978.5 989.9 1,001.5 1,013.1 1,025.0Minority interest 61.6 60.7 60.6 60.6 60.5 60.4 60.4Total equity 1,050.0 1,030.7 1,039.1 1,050.5 1,062.0 1,073.6 1,085.3Credit institutions 529.1 529.1 529.1 529.1 529.1 529.1 529.1Finance leases 0.0 0.0 0.0 0.0 0.0 0.0 0.0Other financial debt 216.3 216.3 216.3 216.3 216.3 216.3 216.3Trade debts and other fixed debts 18.9 18.9 18.9 18.9 18.9 18.9 18.9Long term liabilities 764.3 764.3 764.3 764.3 764.3 764.3 764.3Provisions 2.4 2.4 2.4 2.5 2.5 2.6 2.6Short term credit institutions 1.9 1.8 1.8 1.9 1.9 1.9 2.0Financing leases 45.1 43.5 44.2 45.1 46.0 46.9 47.8Other current financial debt 0.0 0.0 0.0 0.0 0.0 0.0 0.0Trade debt and other current debt 110.5 107.3 108.9 111.1 113.4 115.6 118.0Accrued charges and deferred income 15.2 14.9 15.1 15.4 15.7 16.1 16.4Current liabilities 175.1 169.9 172.5 175.9 179.5 183.1 186.8Total equity and liabilities 1,989.4 1,964.9 1,975.9 1,990.7 2,005.7 2,020.9 2,036.3Source: Company data, ING estimates88
_<strong>Benelux</strong> <strong>Real</strong> <strong>Estate</strong> February 2010Fig 12 Profit and loss (€m)Year to Sep FY08/09 FY09/10F FY10/11F FY11/12F FY12/13F FY13/14F FY14/15FRental income 119.1 118.8 120.7 122.9 125.3 127.8 130.4Charges linked to letting (0.4) (0.4) (0.4) (0.4) (0.4) (0.4) (0.4)Net rental income 118.6 118.5 120.3 122.5 124.9 127.5 130.0Property result 131.8 130.4 132.4 134.8 137.5 140.2 143.1Technical costs (14.5) (14.3) (14.5) (14.7) (15.0) (15.3) (15.6)Other costs (commercial, property mngt, etc) (3.1) (3.0) (3.0) (3.1) (3.1) (3.2) (3.3)Total property charges (17.7) (17.2) (17.5) (17.8) (18.2) (18.5) (18.9)Property operating result 114.1 113.1 114.9 117.0 119.3 121.7 124.2Corporate management costs (9.8) (9.5) (9.7) (9.8) (10.0) (10.2) (10.4)Other income and charges 1.9 1.8 1.8 1.8 1.9 1.9 2.0Operating result before result on portfolio 106.1 105.4 107.0 109.0 111.2 113.4 115.7Gains or losses on disposals of investment property 0.2 0.0 0.0 0.0 0.0 0.0 0.0FV on investment property (75.0) (37.5) (2.9) 0.0 0.0 0.0 0.0Operating result 31.4 67.9 104.1 109.0 111.2 113.4 115.7Financial income 5.0 0.0 0.2 0.2 0.2 0.2 0.2Interest charges (30.0) (29.9) (29.9) (29.9) (29.9) (29.9) (29.9)Total interest (25.0) (29.9) (29.7) (29.7) (29.7) (29.7) (29.7)FV on derivatives (39.3) 0.0 0.0 0.0 0.0 0.0 0.0Net financing expenses (64.3) (29.9) (29.7) (29.7) (29.7) (29.7) (29.7)Pre tax result (32.9) 38.0 74.4 79.3 81.5 83.7 86.0Corporation tax (0.5) (0.5) (0.5) (0.5) (0.5) (0.5) (0.5)Net result (33.4) 37.5 73.9 78.8 81.0 83.2 85.4Total direct result 75.7 75.0 76.7 78.6 80.8 83.0 85.3Group share 73.8 73.2 74.8 76.6 78.8 80.9 83.1Minorities 1.9 1.9 1.9 2.0 2.0 2.1 2.1Total indirect result (109.0) (37.5) (2.8) 0.2 0.2 0.2 0.2Group share (106.3) (36.6) (2.7) 0.2 0.2 0.2 0.2Minorities (2.7) (0.9) (0.1) 0.0 0.0 0.0 0.0Source: Company data, ING estimates89
__<strong>Benelux</strong> <strong>Real</strong> <strong>Estate</strong> February 2010Fig 13 Cash flow statement (€m)Year to Sep FY08/09 FY09/10F FY10/11F FY11/12F FY12/13F FY13/14F FY14/15FOperating income 31.4 67.9 104.1 109.0 111.2 113.4 115.7Interest paid (24.3) (29.9) (29.9) (29.9) (29.9) (29.9) (29.9)Interest received 2.6 0.0 0.2 0.2 0.2 0.2 0.2Dividends received 0.4 0.0 0.0 0.0 0.0 0.0 0.0Taxes paid (0.5) (0.5) (0.5) (0.5) (0.5) (0.5) (0.5)Fair value adjustments (35.0) 0.0 0.0 0.0 0.0 0.0 0.0Other income (8.0) 0.0 0.0 0.0 0.0 0.0 0.0Non cash adjustments 0.0 0.0 0.0 0.0 0.0 0.0 0.0Change in value of trade receivables 0.2 (0.3) (0.4) (0.5) (0.5) (0.5) (0.5)Change in value of PP&E 0.2 0.0 0.0 0.0 0.0 0.0 0.0FV on investment portfolio 75.0 37.5 2.9 0.0 0.0 0.0 0.0FV on fixed financial assets booked to earnings 35.0 0.0 0.0 0.0 0.0 0.0 0.0Other items 6.0 0.0 0.0 0.0 0.0 0.0 0.0Gain on sales (0.2) 0.0 0.0 0.0 0.0 0.0 0.0Change in working capital assets (1.7) 0.4 (0.3) (0.4) (0.4) (0.4) (0.4)Change in working capital liabilities 6.5 (5.5) 2.3 3.0 3.1 3.1 3.2CF from operations 87.6 69.6 78.5 80.9 83.1 85.4 87.7Acquisition of Fedimmo 0.0 0.0 0.0 0.0 0.0 0.0 0.0Acquisition of Meir and Vital 0.0 0.0 0.0 0.0 0.0 0.0 0.0Acquisition of Axento (1.8) 0.0 0.0 0.0 0.0 0.0 0.0Downpayment on buildings and similar 0.0 0.0 0.0 0.0 0.0 0.0 0.0Liquidation of La Hulpe certificates 0.0 0.0 0.0 0.0 0.0 0.0 0.0Investment in investment properties (29.8) 0.0 0.0 0.0 0.0 0.0 0.0Disposals of investment properties 4.2 0.0 0.0 0.0 0.0 0.0 0.0Other PP&E (0.1) 0.0 0.0 0.0 0.0 0.0 0.0Hedging instruments and other financial assets (1.8) 0.0 0.0 0.0 0.0 0.0 0.0CF from investing (29.4) 0.0 0.0 0.0 0.0 0.0 0.0Change in financial debt (142.5) 0.0 0.0 0.0 0.0 0.0 0.0Change in financial lease debt (12.9) 0.3 0.3 0.4 0.5 0.5 0.5Change in non-current debt 0.0 0.0 0.0 0.0 0.0 0.0 0.0Capital increase/decrease 159.5 0.0 0.0 0.0 0.0 0.0 0.0Dividend for the previous fiscal year (60.6) (61.3) (65.5) (67.4) (69.5) (71.6) (73.7)CF from financing (56.7) (61.0) (65.2) (67.0) (69.0) (71.1) (73.2)Net change in cash 1.5 8.6 13.3 13.9 14.1 14.3 14.5Cash BOP 4.6 6.1 14.6 27.9 41.8 55.9 70.2Cash EOP 6.1 14.6 27.9 41.8 55.9 70.2 84.7Source: Company data, ING estimatesFig 14 Per share data (€)Year to Sep FY08/09 FY09/10F FY10/11F FY11/12F FY12/13F FY13/14F FY14/15FNumber of shares (m) 16,790,103 16,790,103 16,790,103 16,790,103 16,790,103 16,790,103 16,790,103Total number of shares (m) 16,790,103 16,790,103 16,790,103 16,790,103 16,790,103 16,790,103 16,790,103Average no of shares (m) 14,302,680 16,790,103 16,790,103 16,790,103 16,790,103 16,790,103 16,790,103Direct result per share 5.16 4.36 4.45 4.56 4.69 4.82 4.95Indirect result per share (7.43) (2.18) (0.16) 0.01 0.01 0.01 0.01Total result per share (2.28) 2.18 4.29 4.57 4.70 4.83 4.96DPS 4.40 3.90 4.02 4.14 4.26 4.39 4.52IFRS NAV 58.9 57.8 58.3 59.0 59.6 60.3 61.0Recurring CFPS 5.16 4.36 4.46 4.57 4.70 4.83 4.96Recurring EPS 5.16 4.36 4.46 4.57 4.70 4.83 4.96Source: Company data, ING estimates90
_<strong>Benelux</strong> <strong>Real</strong> <strong>Estate</strong> February 2010Fig 15 Half-year profit and loss (€m)Year to Sep 1H08/09 2H08/09 1H09/10F 2H09/10F 1H10/11F 2H10/11F 1H11/12F 2H11/12FRental income 57.8 61.3 59.2 59.6 60.2 60.5 61.1 61.7Charges linked to letting (0.3) (0.1) (0.2) (0.2) (0.2) (0.2) (0.2) (0.2)Net rental income 57.5 61.2 59.0 59.5 60.0 60.3 60.9 61.5Property result 65.6 66.2 64.9 65.4 66.0 66.4 67.1 67.7Technical costs (8.1) (6.5) (7.1) (7.2) (7.2) (7.3) (7.3) (7.4)Other costs (commercial, property mngt, etc) (2.2) (1.0) (1.5) (1.5) (1.5) (1.5) (1.5) (1.5)Total property charges (10.2) (7.4) (8.6) (8.6) (8.7) (8.8) (8.9) (9.0)Property operating result 55.4 58.7 56.4 56.8 57.3 57.6 58.2 58.8Corporate management costs (5.1) (4.8) (4.7) (4.8) (4.8) (4.8) (4.9) (4.9)Other income and charges 0.7 1.2 0.9 0.9 0.9 0.9 0.9 0.9Operating result before result on portfolio 51.0 55.1 52.5 52.9 53.4 53.7 54.2 54.8Gains or losses on disposals of investment property 0.2 0.0 0.0 0.0 0.0 0.0 0.0 0.0FV on investment property (50.3) (24.6) (25.1) (12.4) (2.9) 0.0 0.0 0.0Operating result 0.9 30.5 27.4 40.5 50.4 53.7 54.2 54.8Financial income 2.7 2.3 (0.1) 0.0 0.1 0.1 0.1 0.1Interest charges (18.1) (11.9) (14.9) (14.9) (14.9) (14.9) (14.9) (14.9)Total interest (15.4) (9.6) (15.0) (14.9) (14.9) (14.8) (14.9) (14.8)FV on derivatives (34.7) (4.6) 0.0 0.0 0.0 0.0 0.0 0.0Net financing expenses (50.1) (14.1) (15.0) (14.9) (14.9) (14.8) (14.9) (14.8)Pre tax result (49.3) 16.4 12.4 25.6 35.5 38.8 39.3 39.9Corporation tax (0.2) (0.3) (0.2) (0.2) (0.2) (0.2) (0.2) (0.2)Net result (49.4) 16.1 12.1 25.4 35.3 38.6 39.1 39.7Total direct result 32.7 43.0 37.3 37.7 38.2 38.5 39.0 39.6Group share 32.9 40.8 36.4 36.8 37.2 37.5 38.0 38.6Minorities (0.2) 2.2 0.9 0.9 1.0 1.0 1.0 1.0Total indirect result (82.1) (26.9) (25.2) (12.3) (2.9) 0.1 0.1 0.1Group share (82.6) (25.5) (24.6) (12.0) (2.8) 0.1 0.1 0.1Minorities 0.5 (1.4) (0.6) (0.3) (0.1) 0.0 0.0 0.0Source: Company data, ING estimates91
__<strong>Benelux</strong> <strong>Real</strong> <strong>Estate</strong> February 2010Fig 16 Half-year cash flow statement (€m)Year to Sep 1H08/09 2H08/09 1H09/10F 2H09/10F 1H10/11F 2H10/11F 1H11/12F 2H11/12FOperating income 0.9 30.5 27.4 40.5 50.4 53.7 54.2 54.8Interest paid (15.2) (9.1) (14.9) (14.9) (14.9) (14.9) (14.9) (14.9)Interest received 2.0 0.6 (0.1) 0.0 0.1 0.1 0.1 0.1Dividends received 0.4 0.0 0.0 0.0 0.0 0.0 0.0 0.0Taxes paid (0.2) (0.4) (0.2) (0.2) (0.2) (0.2) (0.2) (0.2)Fair value adjustments 0.0 (35.0) 0.0 0.0 0.0 0.0 0.0 0.0Other income (37.4) 29.5 0.0 0.0 0.0 0.0 0.0 0.0Non cash adjustments 0.0 0.0 0.0 0.0 0.0 0.0 0.0 0.0Change in value of trade receivables 0.2 0.0 (0.2) (0.2) (0.2) (0.1) (0.2) (0.2)Change in value of PP&E 0.1 0.1 0.0 0.0 0.0 0.0 0.0 0.0FV on investment portfolio 50.3 24.6 25.1 12.4 2.9 0.0 0.0 0.0FV on fixed financial assets booked to earnings 33.2 1.8 0.0 0.0 0.0 0.0 0.0 0.0Other items 3.0 3.0 0.0 0.0 0.0 0.0 0.0 0.0Gain on sales (0.2) 0.0 0.0 0.0 0.0 0.0 0.0 0.0Change in working capital assets (9.0) 7.3 0.6 (0.1) (0.2) (0.1) (0.2) (0.2)Change in working capital liabilities 9.4 (2.9) (6.4) 0.9 1.5 0.7 1.7 1.3CF from operations 37.6 50.0 31.2 38.3 39.4 39.1 40.4 40.5Acquisition of Fedimmo 0.0 0.0 0.0 0.0 0.0 0.0 0.0 0.0Acquisition of Meir and Vital 0.0 0.0 0.0 0.0 0.0 0.0 0.0 0.0Acquisition of Axento 0.0 (1.8) 0.0 0.0 0.0 0.0 0.0 0.0Downpayment on buildings and similar 0.0 0.0 0.0 0.0 0.0 0.0 0.0 0.0Liquidation of La Hulpe certificates 0.0 0.0 0.0 0.0 0.0 0.0 0.0 0.0Investment in investment properties (17.0) (12.9) 0.0 0.0 0.0 0.0 0.0 0.0Disposals of investment properties 4.2 0.0 0.0 0.0 0.0 0.0 0.0 0.0Other PP&E (0.1) 0.0 0.0 0.0 0.0 0.0 0.0 0.0Hedging instruments and other financial assets 0.0 (1.8) 0.0 0.0 0.0 0.0 0.0 0.0CF from investing (12.9) (16.5) 0.0 0.0 0.0 0.0 0.0 0.0Change in financial debt 44.0 (186.6) 0.0 0.0 0.0 0.0 0.0 0.0Change in financial lease debt 0.0 (12.9) 0.0 0.3 0.0 0.3 0.0 0.4Change in non-current debt 0.1 (0.1) 0.0 0.0 0.0 0.0 0.0 0.0Capital increase/decrease 0.0 159.5 0.0 0.0 0.0 0.0 0.0 0.0Dividend for the previous fiscal year (60.6) 0.0 (61.3) 0.0 (65.5) 0.0 (67.4) 0.0CF from financing (16.5) (40.2) (61.3) 0.3 (65.5) 0.3 (67.4) 0.5Net change in cash 8.2 (6.7) (30.1) 38.7 (26.1) 39.3 (27.1) 41.0Cash BOP 4.6 12.8 6.1 (24.0) 14.6 (11.4) 27.9 0.8Cash EOP 12.8 6.1 (24.0) 14.6 (11.4) 27.9 0.8 41.8Source: Company data, ING estimatesFig 17 Half-year per share data (€)Year to Sep 1H08/09 2H08/09 1H09/10F 2H09/10F 1H10/11F 2H10/11F 1H11/12F 2H11/12FNo. of shares (m) 13,058,969 16,790,103 16,790,103 16,790,103 16,790,103 16,790,103 16,790,103 16,790,103Average no of shares (m) 13,058,969 15,546,392 16,790,103 16,790,103 16,790,103 16,790,103 16,790,103 16,790,103Direct result per share 2.52 2.62 2.17 2.19 2.22 2.24 2.27 2.30Indirect result per share (6.33) (1.64) (1.46) (0.72) (0.17) 0.01 0.00 0.01Total result per share (3.81) 0.98 0.70 1.47 2.05 2.24 2.27 2.30DPS 0.00 4.40 4.40 0.00 3.90 0.00 4.02 0.00IFRS NAV 65.7 58.9 56.3 57.8 56.0 58.3 56.7 59.0Recurring CFPS 2.52 2.64 2.16 2.19 2.22 2.24 2.27 2.30Recurring EPS 2.52 2.64 2.16 2.19 2.22 2.24 2.27 2.30Source: Company data, ING estimates92
___<strong>Benelux</strong> <strong>Real</strong> <strong>Estate</strong> February 2010BelgiumCofinimmoA continuation of outperformance?Jean-Yves DevlooAmsterdam (31) 20 563 8745jean-yves.devloo@ing.comArjan KnibbeAmsterdam (31) 20 563 8780arjan.knibbe@ing.comPreviously: HoldBuy<strong>Real</strong> <strong>Estate</strong>5 February 2010€98.1Target price (12 month): Previously €99.3€109.2ReutersCOFB.BRHaving performed strongly during the crisis, we expectCofinimmo to outperform further. Its proven creativity infinancing and diversification makes us believe Cofinimmo willhold up well in the deteriorating Brussels offices market. BUY.We prefer Cofinimmo over Befimmo for its innovative portfoliodiversification and financing strategy. Cash EPS is expected to decrease onthe back of the recent capital raisings, incentives and receivables sales (Egmontstarting 2011), but should be high enough to offer a dividend yield of 6.8%.Sensitivity of our 2010F EPS to vacancy and total like-for-like (€)Vacancy rate (%)0.0 1.5 3.5 5.5 7.5 9.5 11.5 13.5-2 7.17 6.95 6.65 6.35 6.06 5.76 5.46 5.17-1 7.31 7.09 6.79 6.50 6.20 5.90 5.61 5.310 7.39 7.16 6.87 6.57 6.27 5.98 5.68 5.38LFL (%) 1 7.53 7.31 7.01 6.71 6.42 6.12 5.82 5.532 7.67 7.45 7.16 6.86 6.56 6.27 5.97 5.673 7.82 7.60 7.30 7.00 6.71 6.41 6.11 5.824 7.96 7.74 7.44 7.15 6.85 6.55 6.26 5.965 8.11 7.89 7.59 7.29 7.00 6.70 6.40 6.11Source: ING estimatesKey ratios and forecasts2008 2009F 2010F 2011F 2012F12-month forecast returns (%)Share price 11.4Dividend 6.812m f'cst total return 18.1Key ratios (%)2008 2009FRental growth 36.7 6.7Operating margin 89.8 92.6Occupancy rate 97.9 97.8Share dataNo. of shares (m) 13.8Daily turnover (shares) 30,000Free float (%) 100Enterprise value (€m) 2989.5Market cap (€m) 1246.9Share price performance1601401201008060401/08 7/08 1/09 7/09 1/10EPS adj (€) 8.05 7.45 6.91 7.15 7.35PER (x) 12.2 13.2 14.2 13.7 13.3Net yield (%) 6.5 7.2 7.3 7.4 7.5IFRS NAV per share (€) 109.6 97.7 99.3 101.3 103.4EPRA NNNAV per share (€) N/A N/A N/A N/A N/AP/IFRS NAV (%) 0.90 1.00 0.99 0.97 0.95DPS (€) 7.80 6.50 6.63 6.76 6.90Dividend yield (%) 8.0 6.6 6.8 6.9 7.0CFPS (€) 8.38 7.45 6.97 6.97 7.41LTV (%) 57.3 52.7 52.2 51.5 50.9Source: Company data, ING estimatesSource: INGPriceBEL 20 (rebased)93
_<strong>Benelux</strong> <strong>Real</strong> <strong>Estate</strong> February 2010Investment caseWe believe Cofinimmo may be looking to reduce its overweight position in theBrussels decentralised area in order to increase its financial headroom andpossibly diversify into other offices markets and asset classes, and increase itsweight in nursing homes. We are positive on Cofinimmo’s diversificationstrategy, which leads us to believe it will outperform Befimmo and its officespeers in a deteriorating Brussels offices market. Cofinimmo has creatively reengineeredits balance sheet, and may be looking to further deleverage bymaking a number of smaller disposals and realising contributions in kind, eg,property for share swaps. Cash EPS is expected to decrease on the back oflease incentives, limited indexation, the recent shares issued, while starting in2011 the effect of the sale of receivables related to the Egmont buildings will befelt.SWOTFig 1 SWOT analysisStrengthsWeaknessesCofinimmo’s creativity has allowed diversification into attractivealternative real estate asset classesStrong tenant profile (public sector and nursing home operators) andlease duration (12 years)Market leader in Belgian real estate investing; high visibility towardsinvestorsFiscal transparency thanks to SICAFI and SIIC statusCreativeLow vacancy and small pipeline may hamper outperformanceOff balance sheet sale of receivables lower the cash EPS, theEgmont complex sale of receivables will only impact cash EPSstarting in 2011Quality of financial reporting from an EPRA best practices point ofviewConsistency of financial reporting (missing cash flow statement)OpportunitiesIts good reputation may allow it to become a real estate partner ofbusinesses that want to focus on their core businessFurther expansion into other asset classes or countriesThreats/RisksBrussels offices market: large delivery of speculative projectsSource: ING94
_<strong>Benelux</strong> <strong>Real</strong> <strong>Estate</strong> February 2010Positioning of Cofinimmo andBefimmoWe preferdiversification over pureplayerBefimmo and Cofinimmo are the two most important players in the Brussels officesmarket, with office portfolios of comparable sizes. As we believe secondary officemarkets may underperform primary markets, Befimmo’s portfolio is likely to show morestability than Cofinimmo’s office portfolio. Nevertheless, we prefer Cofinimmo overBefimmo for a number of reasons:• Favourable diversification in long-term let, low risk nursing homes and pubs.• Cofinimmo’s less dilutive deleveraging compared to Befimmo.• Low likelihood of Befimmo being able to make accretive acquisitions in its field ofinterest in the near future, despite its dilutive rights issue.• Corporate governance structure is more favourable in the case of Cofinimmo andwill allow more flexibility going forward. We believe Befimmo is too exposed to theinfluence of AG Insurance.Offices portfolioFig 2 Brussels offices market versus Cofinimmo and Befimmom m²4.003.503.002.502.001.501.000.500.00Centre Midi North Leopold Louise Decentralised PeripheryBefimmo 0.13 0.00 0.19 0.08 0.00 0.06 0.11Cofinimmo 0.08 0.00 0.06 0.15 0.02 0.31 0.09Market stock 2.35 0.54 1.46 3.21 0.79 2.65 1.86Market stock excludes area held by Cofinimmo and BefimmoSource: Company data, ING estimatesComparable officesportfolio in size…Befimmo tends to selldecentralised andperipheral assets…Leopold district is themost lucrativeCofinimmo and Befimmo had a portfolio of c.€3bn and c.€1.9bn, respectively, at end-September 2009. Adjusting for AB Inbev’s <strong>Benelux</strong> Pubstone portfolio and a largenumber of nursing homes, the offices portfolio of Cofinimmo totalled c.€1.8bn at end-September 2009.As a pure-play investor in well-located high quality office buildings, Befimmo has alarger proportion of its assets located in the Central Business District. During theFY08/09 results communication, Befimmo also expressed its desire to sell itsdecentralised and peripheral offices portfolio (total value of c.€0.6bn, 32% of portfolio).Despite the higher proportion of decentralised and peripheral office buildings, webelieve Cofinimmo has a more attractive Central Business District mix than Befimmo95
_<strong>Benelux</strong> <strong>Real</strong> <strong>Estate</strong> February 2010by having an overweight position in the highly lucrative Leopold district (a.k.a. theEuropean district, where we estimate EU institutions alone take c.50% of total officespace on very long term, indexed leases).Fig 3 Cofinimmo offices spread (%) Fig 4 Befimmo offices spread (%)Periphery13%Centre11% Midi0%Periphery19%Centre22%Decentralised43%North9%Louise3%Leopold21%Decentralised11%Louise0%Leopold14%North34%Midi0%Source: ING estimatesSource: ING estimatesUnequal portfoliocomposition…When comparing the market compositions of Cofinimmo and Befimmo, we concludethat Cofinimmo is primarily overweight in the decentralised district and underweight inthe Central district, while Befimmo is overweight in the North district and underweightin the Leopold district.Fig 5 Cofinimmo and Befimmo: overweight and underweight areasPeripheryDecentralisedLouiseLeopoldNorthMidiCentre-15.0 -10.0 -5.0 0.0 5.0 10.0 15.0 20.0 25.0%CofinimmoBefimmoSource: Company data, ING estimatesHigh quality leasesthanks to thegovernment andnursing homesLooking at the average length of leases, both Cofinimmo and Befimmo score well, withan average lease maturity of c.12 years and >9 years, respectively. Looking at thecomposition of tenants, Befimmo has c.60% of its leases from government institutions(duration of 12 years), which is more than double the amount of Cofinimmo.Cofinimmo, on the other hand, has more than 20% of its rents derived from nursinghome operators (average duration of c.16 years), which enjoy a very favourablegovernment subsidy and regulatory system (see the market overview section onnursing homes).96
_<strong>Benelux</strong> <strong>Real</strong> <strong>Estate</strong> February 2010Financing strategyKey difference lies inthe financing policyBefimmo’s prudence ledto a dilutive rights issueCofinimmo showedmore creativity, eg, byannouncing a dividendcut, which we expectedApart from the differences in portfolio structure, a key distinction between Cofinimmoand Befimmo lies in the recent financing policy.Befimmo clearly has a more prudent financing strategy, as was demonstrated by theJune 2009 rights issue of €167m in order to decrease its debt ratio to 45%, so as to beready when market opportunities arise. At an issue price of €44 per share, we believethis transaction was not cheap for Befimmo. Taking into account the pure playerstrategy, we are not sure if attractive acquisition opportunities are likely to arise in thenear future.After the communication of its 1H09 results, Cofinimmo reported a breach in its 55%soft loan-to-value covenant by 1%. This has led to a series of actions (see Figure 6),which have enabled Cofinimmo to avoid a large dilutive rights issue and havedemonstrated the company’s ability to find solutions to its financing problems.Fig 6 Cofinimmo’s deleveraging strategy, in chronological orderTime and eventDescription1Q09: accelerated book build 962,485 treasury shares sold at 5% discount to last trading price, raising €72m. Discountto NAV 2010F c.25%1Q09: sale of receivables Off balance sheet sale of receivables related to four buildings, raising a net €71m2Q09: accelerated book build 330,000 treasury shares sold at a 5.5% discount to the last trading price, raising €26m3Q09: dividend cut, in line with our estimates During the 1H09 results, Cofinimmo communicated a breach in soft covenant and adividend cut from €7.8 to €6.5, which was in line with our expectations*. This savedc.€18m in cash.3Q09: sale of receivables Off balance sheet sale of receivables related to the Egmont buildings, generating €200min cash. Cofinimmo retains ownership of the cash leases during 2009 and 2010, implyingunaffected CFPS during this period.4Q09: share-based acquisition Property for share swap of four nursing homes, resulting in the issuance of 224,967 newshares4Q09: sale of buildings Several buildings in the Brussels periphery and Central Business District have been sold,generating €55m in cash.Current status: Cofinimmo has a debt ratio of c.50% and a LTV of 53%. Even though Cofinimmo has acted quickly to successfully avoidpenalties relating to its covenant breach, we would not be surprised if additional delivering measures were to follow.2010F? Our expectations in order of likelihood: 1. property for share acquisition of nursing homes* See our initiation report on Cofinimmo, 14 July 2009Source: ING2. sale of smaller, decentralised and peripheral assetsSpecial attention mustbe given to the sale ofreceivables technique……and Cofinimmo’s EPSmust be reconciledBoth Cofinimmo and Befimmo have used the sale of receivables as a disposalstrategy, but using different techniques. The key difference is that Befimmo traditionallyparticipates in on-balance sheet sale of receivables, while Cofinimmo always usesoff-balance sheet sale of receivables. Two landmark transactions done byCofinimmo involve the off balance sheet sale of receivables related to the NorthGalaxy complex in 2005 (generating €312m) and the receivables related to the Egmontbuildings in late 2009 (generating €200m).The key difference between both techniques is that the building, of which thereceivables are sold, is reconstituted on the balance sheet as the maturity date of thelease approaches. As this happens through the P&L (through a non-cash leasereception and a cash interest income, see Figure 7 below), a difference must be madebetween cash EPS and non cash EPS, which is the case for Cofinimmo.97
__<strong>Benelux</strong> <strong>Real</strong> <strong>Estate</strong> February 2010Fig 7 Overview of the fair value of the Egmont buildings before and after the sale of receivables35025300250200150100500Source: ING estimates20082009201020112012201320142015201620172018201920202021Fair value overview Egmont (€ m) LHS2022202320242025202620272028202920302031Annual ownership reconstitution (€m) RHSFig 8 Write back of the value of Egmont via P&L Fig 9 Write back of the value of North Galaxy viaP&L20151050253502030025015200101505100500020092011201320152017201920212023202520272029203120062007200820092010201120122013201420152016201720182019202020212022Source: ING estimatesFinancial income part - aggregate writeback (€m)Lease part - aggregate writeback (€m)Source: ING estimatesFinancial income part - aggregate writeback (€m)Lease part - aggregate writeback (€m)Key differencesbetween on- and offbalance sheet sale ofreceivablesGiven the importance of an off balance sheet sale of receivables for Cofinimmo andgiven the reconciliations that must be made, we have summarised the maindifferences between a hypothetical on-balance sheet sale and off-balance sheet saleof receivables of two REIT’s that were identical prior to the transaction (see Figure 10).98
_<strong>Benelux</strong> <strong>Real</strong> <strong>Estate</strong> February 2010Fig 10On balance sheet versus off balance sheet sale of receivablesOn balance sheetOff balance sheetEconomic owner of the building REIT REITLegal owner of the building REIT REITEffect on investment properties value No difference Subtract the difference between last appraisal value andPV of lease payments soldREIT guarantees rental income collectionby bank?Risk of lessee default for financialinstitution (FI)?YesYes, but mitigated by full recourseof financial institution on the lessorNoFinancial institution has no recourse on lessor; andtherefore carries the full solvency risk of the lesseePV of leases sold Higher Lower, depending on discount rateProvisions by REIT?Magnitude of lease receivables bought byfinancial institutionExtra provisions for bad debts arebookedCan be up to 100%Not necessarilyNever entirely in order to limit risk; the difference is paidto REIT as cash interest incomeFinancial income booked by REIT? No Yes: cash interest income (c.5-10%) is paid by bank anddepends on the quality of payments of the lesseeReconstitution of building on balance? Not applicable Through P&L: (1) non cash write back of leasereceivables; (2) cash reception of interest income (c.5-10%), the magnitude of which depends on the quality ofthe lessee’s lease paymentsDifference between reported EPS andcash EPS?No difference, total EPS decreasesMake a distinction between cash and non cash EPS.Cash EPS will be lowerCash flow statement reconciliation? No effect Adjust for non cash writeback of lease receivables, noadjustment for cash interest received by financialinstitutionMarginal net cost of debt compared toon/off balance sheet peer?Likely higherLikely lower: (1) lower gearing; (2) higher interest incomeEffect on LTV? * No effect LowerEffect on debt ratio? * Small deleveraging Substantial deleveraging, depending on the disparity ofdiscount rate with on balance sheet saleEffect on balance sheet total? Grows No effectAdditional advantages?Disadvantages?• longer duration of debt financing compared with traditional bank• financingmostly cheaper than traditional bank debt financingHigher discount rate is applied by the financial institution on discounting the lease receivables.The spread with the discount rate used in an on balance sheet sale of receivables largelydepends on the credit quality of the tenantSource: INGOff balance sheet saleof receivables is themost effectivedeleveraging methodAs demonstrated in the intuitive approach below, an off balance sheet sale ofreceivables results in a more effective deleveraging compared with an on balancesheet sale of receivables.99
<strong>Benelux</strong> <strong>Real</strong> <strong>Estate</strong> February 2010Fig 11 Effect on loan-to-value and debt ratio of on- versus off-balance sheet sale of receivablesOn balance sheet sale of receivables of 10BeforeAfterInvestments 50 Equity 30 Investments 50 Equity 30Cash 20 Debt 40 Cash 30 Debt 5070 70 80 80LtV40-2040%LtV50-3040%50 50debt ratio40-2029%debt ratio50-3025%70 80Off balance sheet sale of receivables of 10BeforeAfterInvestments 50 Equity 30 Investments 40 Equity 30Cash 20 Debt 40 Cash 30 Debt 4070 70 70 70LtV40-2040%LtV40-3025%50 40debt ratio40-2029% debt ratio40-3014%70 70Note: According to Belgian REIT legislation, the debt ratio is calculated by dividing total debt by total assets instead of total net debt by total assets.Source: INGProperty companies arelow risk, on averageCofinimmo’s mainactivity is the leastrisky: investment_RisksBecause of the contractual nature of a large part of the recurring cash flows, propertycompanies are usually considered to have less risk than most other equity sectors.The risk of property companies bears a strong relation with the amount of developmentexposure, the geographical and sector breakdown, corporate governance andalignment of interests between management and shareholders.Principally an investorWe believe that Cofinimmo is a low risk property company. It is principally an investor,which is the least risky activity of the four core real estate company activities:investment, development, trading and asset management. Cofinimmo has primarilyfocussed on offices property (60%) in Brussels, which carries higher risk comparedwith retail, certainly in a market that will be in oversupply in the coming two years.100
<strong>Benelux</strong> <strong>Real</strong> <strong>Estate</strong> February 2010Brussels offices riskhas been diversifiedThe offices risk has been lowered by diversification into pubs (ABInbev’s <strong>Benelux</strong> pubsportfolio 7 (13% of portfolio, 21 years duration)) and nursing homes (25% of portfolio, 16years duration).Tenant riskLow risk long-termleases, but we arecautious on ABInbevThe largest tenant is the Belgian state, paying c.20% of the total rent roll on a longtermbasis. The second largest tenant is ABInbev, paying c.13% of rents on a longtermbasis. Given ABInbev’s strong reputation for cutting costs, we believe thisexposure is not without risk, despite the long-term and indexed nature of the leasecontract. The next largest tenants are nursing home operator Korian and the EUInstitution, paying c.7% of the rent roll each. We believe the risk here remains limitedgiven the heavily subsidised business model of nursing home operators in Belgiumand France (c.40-50% of their top line is subsidised) and the highest credit quality ofthe EU institutions.Accounting for leasesPotential pressure onlease lengthThere are accounting initiatives that may lead to the obligation of tenants to accountlong leases as a liability in their balance sheets. In the future this may put pressure onthe average lease lengths of real estate companies and Cofinimmo.No currency risksAll rents and expenses are made in euro, so there are no currency risks.CatalystsWe see the following catalysts:• Increase in its firepower, eg, by decreasing its overweight position in the Brusselsdecentralised area or a minority stake disposal in its nursing homes subsidiary incombination with accretive acquisitions.• Diversification into another asset class.• Increase in committed development exposure.• Full year results on February 12.OutlookThe August 2009dividend cut was in linewith our expectationsFor outperformance tocontinue, Cofinimmoneeds more growthanglesWe expect EPS to decrease by 7% YoY by 2010F. The dividend was cut last Augustfrom €7.8 to €6.5, which is in line with our estimates and is part of the deleveragingprogramme. This dividend yield of 6.8% is sustainable, in our view.When the economy recovers in 2011, we believe that the Brussels office market willlag a European recovery because of very limited supply constraints and a userbreakdown that is less volatile, both up- and downward, as a result of the largepresence of the EU and EU-related office space users. We believe that in order forCofinimmo to continue its outperformance over the coming years, it shouldsubstantially beef up its growth angles, for example through development or furtherinternational expansion. We would not be surprised if Cofinimmo were to sell additionalassets in the Brussels decentralised and peripheral area, and increase its weight innursing homes.7 Note that ABInbev acts as the master tenant towards Cofinimmo101
_<strong>Benelux</strong> <strong>Real</strong> <strong>Estate</strong> February 2010ValuationTarget premium : 10%We have changed our valuation methodology and now value the <strong>Benelux</strong> propertyinvestment companies primarily based on a target discount or premium to NAV. Our10% target premium for Cofinimmo reflects the strength of the office leases, the lowrisks of the pubs sale and lease back, the strong outlook for the nursing homes market,and our confidence in management. As a result, we increase our target price to €109.2per share. Current financial reporting does not allow reconciliation to EPRA NNNAV,which is why we cannot adjust for deferred capital gains tax and fair market value ofdebt. The dividend yield is 6.8% and is sustainable.ConsensusFig 12 Consensus EPS overview (€)2009F 2010F 2011FConsensus 7.41 8.05 7.88ING 7.45 6.91 7.15Difference 0.04 (1.14) (0.73)Difference (%) 0.5 -14.2 -9.2Source: Reuters, ING estimates_Comparisons with BefimmoCofinimmo isoverweightdecentralised officeswhereas Befimmo isoverweight the NorthCofinimmo’s closest peer is Befimmo. We have made extensive comparisons betweenCofinimmo and Befimmo in the earlier chapters. Cofinimmo is overweightdecentralised offices whereas Befimmo is overweight in the North of Brussels officemarket. We favour the Brussels CBD composition of Cofinimmo over Befimmo. Inaddition, we have analysed the differences between the impact on balance sheets andgearing of on- and off-balance sheet sales of receivables.Furthermore, we note that Cofinimmo is a NV (limited liability) and Befimmo is a CV, orcommanditair vennootschap. This means that shareholders of Cofinimmo have morepower than those of Befimmo.Our estimates and assumptions1) Vacancies: We expect a small increase in vacancy from 2.2% in 2009F to 3.4% in2010F, mainly on the back of activity in the decentralised and peripheral Brusselsoffices market. Such a best-in-class occupancy rate looks sustainable, but webelieve it takes into account some incentives. Nursing homes and pubs are fully letby contractual nature.Fig 13 Our vacancy assumptions (%)2009F 2010F 2011F 2012FOffices – Brussels CBD 0.7 2.0 1.1 1.0Offices – Brussels decentralised 6.5 9.1 8.0 8.0Offices – Brussels periphery 9.5 12.0 10.0 10.0Offices – Antwerp 2.9 4.1 4.5 4.5Offices – other 0.7 5.0 2.0 2.0Other 0.0 0.0 0.0 0.0Nursing homes – Belgium 0.0 0.0 0.0 0.0Nursing homes – France 0.0 0.0 0.0 0.0Pubstone – Belgium 0.0 0.0 0.0 0.0Pubstone – Netherlands 0.0 0.0 0.0 0.0Total 2.2 3.4 2.7 2.7Source: ING estimates102
__<strong>Benelux</strong> <strong>Real</strong> <strong>Estate</strong> February 20102) Like for like rental growth (this includes indexation and incentives): Expected tobe -1.5% for 2009 and close to zero in 2010F.Fig 14 Our total like-for-like rental growth assumptions (%)2009F 2010F 2011F 2012FOffices – total -3.1 -0.8 2.0 2.5Nursing homes – Belgium 1.5 2.0 2.0 2.0Nursing homes – France 1.5 2.0 2.0 2.0Pubstone – Belgium 1.5 2.0 2.0 2.0Pubstone – Netherlands 1.5 2.0 2.0 2.0Total -1.5 0.2 2.0 2.3Source: ING estimates3) Portfolio valuations: We primarily expect the decentralised and peripheral areato take some additional hits on the back of a higher vacancy rate and shorterleases. Note that the Brussels CBD valuation includes the on balance sheetreconstitution of recent off balance sheet receivables (notably North Galaxy, butalso a number of other smaller transactions) 8 .Fig 15 Our portfolio valuation assumptions (%)2009F 2010F 2011F 2012FOffices – Brussels CBD -0.4 3.5 3.4 3.2Offices – Brussels decentralised -4.0 -0.2 0.0 0.0Offices – Brussels periphery -0.9 -0.2 0.0 0.0Offices – Antwerp -2.1 -0.2 0.0 0.0Offices – other 0.4 -0.3 0.0 0.0Other -2.9 -0.3 0.0 0.0Nursing homes – Belgium -1.1 -0.2 0.0 0.0Nursing homes – France -3.5 -0.3 0.0 0.0Pubstone – Belgium -1.1 0.3 0.0 0.0Pubstone – Netherlands -1.9 -0.3 0.0 0.0Total 0.0 0.6 0.7 0.7Source: ING estimates8 See the chapter on Brussels offices in the main section for more explanation.103
_<strong>Benelux</strong> <strong>Real</strong> <strong>Estate</strong> February 2010Company profileDiversified real estate investorSuccessfuldiversification intonursing homes, pubs,niche offices……without losing track ofreal estatefundamentalsOriginally founded as an office investor, Cofinimmo has recently diversified its portfoliointo other real estate asset classes characterised by long-term leases and strongresidual value appreciation potential. In 2005, Cofinimmo started buying real estateassets from leading nursing home operators, and in 2007 it bought AB InBev’s <strong>Benelux</strong>pubs real estate portfolio (Pubstone), significantly enhancing its portfolio duration(currently c.12 years) and occupancy rate. Cofinimmo bears no operational risk on thePubstone portfolio as AB InBev acts as the master tenant, and is responsible forleasing the pubs individually. Cofinimmo has also bought various office projectsrequiring renovation from international investors lacking the local know-how and theteam to carry out the necessary work.Apart from the attractive lease profile associated with the recent portfoliodiversification, its main advantage lies in residual value appreciation potential. Weestimate that the nursing homes have been purchased at an average 30% discount toresidential real estate, while the pubs with prime locations (we estimate that c.25% ofthe total pub portfolio has a prime retail location) could easily be converted into retailshops, characterised by much higher investment value/m². The average rent of the pubportfolio is €70/m² and €270/m² for the Belgian part and the Dutch part of the portfolio,respectively. These contract rents are well below market rents for comparable retailassets.Fig 16 Overview of assets, September 2009Nursinghomes23%Pubs13%Other2%Office62%Fig 17 Lease maturity profileyears141210864202003 2004 2005 2006 2007 2008 2009Source: Company dataSource: Company dataMore acquisitions ofnursing homes areexpected, financed byshare issuanceFavourable regulatoryenvironment secures afull occupancy rateSince 2005, Cofinimmo has successfully partnered with leading nursing homeoperators in Belgium and France by buying real estate assets and further supportingthe consolidation potential in the market for elderly care in Belgium and France.Cofinimmo is currently one of the largest owners of nursing homes in ContinentalEurope. Having traditionally made share-based acquisitions of nursing homes, weexpect more nursing home acquisitions to come. 9We see the favourable regulatory environment as the nursing home portfolio’s mainattraction: c.50% and c.40% of the nursing home operators’ income is secured bygovernment subsidies in Belgium and France, respectively. Moreover, both countries’governments impose a strict quota on the number of nursing homes, ensuring fulloccupation.9 For a general overview of nursing homes, refer the front piece of this book104
_<strong>Benelux</strong> <strong>Real</strong> <strong>Estate</strong> February 2010Fig 18 Revenues from nursing home operatorsCalidus (BE)1%Senior LivingGroup (BE)21%Senior Assist (BE)2%Armonea (BE)24%Medibelge (BE)4%Mediter (FR)11%Korian (FR)37%Source: Company dataHigh occupancy ratecompared withBefimmo and themarketCofinimmo scores better than Befimmo in terms of overall occupancy rates. We expectthe overall vacancy rate to go from >2% to >3% at end-2010, which is acceptable, butin our view has to be taken with some lease incentives. No major renovations areplanned, while Befimmo has the Impératrice building in renovation (c.€22m investmentover 2010-11), adding c.3% to its vacancy rate.Fig 19 Vacancy rate of the Brussels offices market versus Cofinimmo andBefimmo (%)20%18%16%14%12%10%8%6%4%2%0%Centre Leopold North Decentralised Periphery Totalmarket Befimmo CofinimmoNote that the Centre vacancy rate of Befimmo contains the Telex (Impératrice) building, which is currently inrenovationSource: Company data105
<strong>Benelux</strong> <strong>Real</strong> <strong>Estate</strong> February 2010Fig 20 Ten most important assets according to FY08 contractual rentsName Location TypeContractual OccupancyShare ofrents FY08 rate FY08 Tenantportfolio rents Floorspace rent/m²(€m) (%) (%) (m²) (€)North Galaxy Brussels North Office 11.1 100 Belgian government 5 105,418 105Souverain 25 Brussels Decentralised Office 10.5 100 Axa 5 57,415 184Egmont 1 Centre Office 10.2 100 Belgian government 5 36,674 278Livingstone 6 Leopold Office 7.6 100 Dexia 4 34,777 217Bourget 42 Leopold Square Brussels Decentralised Office 5.4 100 IBM 2 25,753 209Park Lane Brussels Periphery Office 4.8 86 Multi tenant 2 31,863 149Mechelen Station Mechelen Other 4.1 100 Multi tenant 2 28,711 143Montoyer Science Leopold Office 3.5 99 European Commission 2 12,798 277Tervuren 270-272 Brussels Decentralised Office 3.3 100 Multitenant 2 20,773 157Albert 1 Charleroi Office 3.1 100 Belgian government 1 18,823 165Source: Company data_Corporate governanceManagementCEO Serge Fautré• Aged 49.• Cofinimmo CEO since 2002.• Former chairman of the European Public <strong>Real</strong> <strong>Estate</strong> Association (EPRA) anddirector of Union Professionnelle du Secteur Immobilier (UPSI).• Former Director, Corporate Finance at Glaverbel and former Treasury and FinanceDirector at Belgacom.• Former member of the executive committee of JP Morgan’s investment bankingdepartment.• Holds a masters degree in economics and an MBA.CFO Jean-Eduard Carbonnelle• Aged 56.• Joined Cofinimmo in 1998.• Former CFO of Diamand Boart, former member of the executive committee ofSibéka, and former Investor Relations Manager at Union Minière.• Holds a masters degree in commercial engineering and an MBA.COO Jean Franken• Aged 61.• COO since 1996.• Active in the real estate sector since the beginning of his career.• Extensive experience in construction, development and management of real estateassets.• Is a civil engineer.106
_<strong>Benelux</strong> <strong>Real</strong> <strong>Estate</strong> February 2010100% free floatShareholder structureInvestors holding >5% of Cofinimmo’s outstanding shares are depicted below. Noshareholder agreement has been made. All shares are free float.Fig 21 Shareholder structureDIB Invest5% Allianz5%Other90%Source: Bloomberg107
__<strong>Benelux</strong> <strong>Real</strong> <strong>Estate</strong> February 2010FinancialsFig 22 Balance sheet (€m)2008 2009F 2010F 2011F 2012F 2013F 2014FInvestment properties 3,075.3 2,801.9 2,816.9 2,839.5 2,862.0 2,884.5 2,907.0Total fixed assets 3,436.1 3,072.1 3,087.2 3,109.8 3,132.3 3,154.8 3,177.3Assets held for sale 0.5 0.2 0.2 0.2 0.2 0.2 0.2Cash and equivalent 25.4 50.2 54.9 71.3 86.5 82.5 99.6Deferred charges and accrued income 18.4 22.7 22.5 23.1 23.7 24.2 24.8Total current assets 114.0 155.5 159.2 178.6 196.3 194.8 214.5Total assets 3,550.1 3,227.6 3,246.4 3,288.3 3,328.6 3,349.6 3,391.8Equity attributable to Cofb SH 1,368.6 1,371.6 1,393.6 1,421.9 1,450.7 1,479.9 1,510.0Minority interest 8.7 8.8 9.5 10.5 11.5 12.6 13.7Total equity 1,377.2 1,380.4 1,403.1 1,432.4 1,462.2 1,492.5 1,523.7Provisions 11.9 18.1 18.1 18.1 18.1 18.1 18.1Long-term financial debt 1,579.8 1,200.0 1,200.0 1,200.0 1,200.0 1,180.0 1,180.0Other long-term financial debt 32.9 43.4 43.4 43.4 43.4 43.4 43.4Deferred taxes 152.2 142.7 142.7 142.7 142.7 142.7 142.7Total long-term liabilities 1,776.7 1,404.2 1,404.2 1,404.2 1,404.2 1,384.2 1,384.2Total current liabilities 396.1 443.0 439.1 451.7 462.2 472.9 483.9Total equity and liabilities 3,550.1 3,227.6 3,246.4 3,288.3 3,328.6 3,349.6 3,391.8Source: Company data, ING estimatesFig 23 Profit and loss (€m)2008 2009F 2010F 2011F 2012F 2013F 2014FRental income 190.0 202.8 205.4 209.5 213.2 217.2 221.2Writeback of lease payments sold and discounted (rent part-NG) 11.1 16.9 14.2 14.7 16.0 17.3 18.7Writeback of lease payments sold and discounted (rent part-Egmont) 0.0 0.0 0.0 2.7 3.2 3.6 4.1Rental related expenses (2.2) (2.7) (2.6) (2.7) (2.7) (2.8) (2.8)Net rental income 198.9 217.1 216.9 221.5 226.5 231.7 237.1Property result 198.4 215.5 215.4 220.0 224.9 230.1 235.4Technical costs (2.6) (3.4) (4.0) (4.1) (4.2) (4.3) (4.4)Commercial costs (1.1) (0.9) (1.0) (1.0) (1.0) (1.0) (1.1)Taxes and charges on unlet properties (2.4) (2.0) (2.8) (2.9) (3.0) (3.0) (3.1)Property result after direct property costs 192.4 209.2 207.6 212.0 216.7 221.7 226.9Property management costs (14.5) (15.0) (13.4) (13.7) (14.0) (14.3) (14.7)Property operating result 177.9 194.2 194.2 198.3 202.7 207.4 212.2Corporate management costs (7.3) (6.4) (6.3) (6.4) (6.6) (6.7) (6.9)Operating result before result on the portfolio 170.6 187.8 187.9 191.8 196.1 200.7 205.3Gains or losses on disposals 5.8 0.0 0.0 0.0 0.0 0.0 0.0FV changes on portfolio (incl NG and Egmont revaluation) (63.8) (57.5) 15.1 22.6 22.5 22.5 22.5Operating result 112.5 130.3 202.9 214.4 218.6 223.2 227.9Financial income 29.5 8.6 0.8 0.8 1.1 1.5 1.5Interest income related to NG 0.0 0.3 1.2 1.4 1.5 1.6 1.7Interest income related to Egmont 0.0 0.0 0.0 0.3 0.4 0.4 0.5Interest charges (89.3) (80.3) (68.7) (68.3) (68.7) (69.2) (69.0)Total interest (59.7) (71.4) (66.6) (65.9) (65.8) (65.8) (65.3)Bank costs and commissions (2.1) (0.6) (2.4) (2.4) (2.5) (2.5) (2.6)Total other financial charges (48.4) (19.7) (2.4) (2.4) (2.5) (2.5) (2.6)Financial result (108.1) (91.0) (69.0) (68.3) (68.3) (68.3) (67.9)Pre tax result 4.4 39.2 133.9 146.1 150.4 154.9 160.0Total taxes (9.7) (5.5) (4.6) (4.7) (4.8) (4.9) (5.0)Net result (5.3) 33.7 129.4 141.4 145.6 150.0 155.0Minority interests 0.0 0.5 2.6 2.8 2.9 3.0 3.1Direct part 0.3 0.0 1.9 2.1 2.2 2.3 2.3Indirect part (0.3) 0.0 0.6 0.6 0.6 0.7 0.7Total result-group share (14.8) 13.6 126.8 138.6 142.7 147.0 151.9Source: Company data, ING estimates108
__<strong>Benelux</strong> <strong>Real</strong> <strong>Estate</strong> February 2010Fig 24 Cash flow statement (€m)2008 2009F 2010F 2011F 2012F 2013F 2014FNet result-group share (including pref dividend) (14.8) 33.7 129.4 141.4 145.6 150.0 155.0Depreciations/writedowns 0.8 0.0 0.0 0.0 0.0 0.0 0.0FV change on investment properties 62.0 55.1 (15.1) (22.6) (22.5) (22.5) (22.5)Writeback of lease payments discounted and sold (11.1) (17.2) (15.4) (19.1) (21.0) (22.9) (25.0)Working capital adjustmentsTrade receivables (7.2) 0.0 0.3 (0.9) (0.8) (0.8) (0.8)Tax receivables (22.2) 0.0 0.4 (1.4) (1.1) (1.2) (1.2)Deferred charges and accrued income (9.2) 0.0 0.2 (0.6) (0.5) (0.5) (0.6)Current finance lease receivables 76.2 0.0 0.0 (0.1) (0.1) (0.1) (0.1)Trade debts (0.9) 0.0 (0.6) 2.0 1.7 1.7 1.7Taxes, social charges and salaries debts (12.0) 0.0 0.0 0.0 0.0 0.0 0.0Accrued charges and deferred income 19.8 0.0 (0.5) 1.5 1.3 1.3 1.3CF from operations 132.6 71.6 98.7 100.3 102.6 105.0 107.9Investment properties (26.6) 0.0 0.0 0.0 0.0 0.0 0.0Development projects (1.9) 0.0 0.0 0.0 0.0 0.0 0.0Acquisition & investment in real estate companies (131.7) 0.0 0.0 0.0 0.0 0.0 0.0Disposal of assets held for sale 2.2 0.0 0.0 0.0 0.0 0.0 0.0CF from Investing (196.6) 0.0 0.0 0.0 0.0 0.0 0.0Change in financial debt 118.1 0.0 (2.2) 6.9 5.8 (14.1) 6.0Change in other financial debt (5.7) 0.0 (0.7) 2.2 1.8 1.8 1.9Dividend paid (and profit sharing scheme) (86.7) 0.0 (91.2) (93.0) (94.9) (96.8) (98.7)CF from Financing 77.4 0.0 (94.1) (83.9) (87.3) (109.1) (90.8)Free cash flow (64.0) 71.6 98.7 100.3 102.6 105.0 107.9Net cash flow 13.4 71.6 4.7 16.3 15.3 (4.0) 17.1Cash BOP 2.5 15.9 50.2 54.9 71.3 86.5 82.5Cash EOP 15.9 50.2 54.9 71.3 86.5 82.5 99.6Source: Company data, ING estimatesFig 25 Per share data (€)2008 2009F 2010F 2011F 2012F 2013F 2014FTotal number of shares entitled to share in the result 12,487,435 14,031,763 14,031,763 14,031,763 14,031,763 14,031,763 14,031,763Net current result 8.05 7.45 6.91 7.15 7.35 7.55 7.78Dividend to ordinary shares 7.80 6.50 6.63 6.76 6.90 7.04 7.18IFRS NAV 109.6 97.7 99.3 101.3 103.4 105.5 107.6Recurring cash flow per share 8.38 7.45 6.97 7.21 7.41 7.61 7.85Recurring EPS 9.43 7.45 8.11 8.41 8.70 9.00 9.34Source: Company data, ING estimates109
__<strong>Benelux</strong> <strong>Real</strong> <strong>Estate</strong> February 2010Fig 26 Quarterly profit and loss (€m)1Q09 2Q09 3Q09 4Q09F 1Q10F 2Q10F 3Q10F 4Q10FRental income 49.3 50.4 51.4 51.7 51.8 50.8 51.3 51.5Writeback of lease payments sold and discounted (rent part-NG) 4.4 4.5 4.4 3.7 3.4 4.0 3.4 3.4Writeback of lease payments sold and discounted (rent part-Egmont) 0.0 0.0 0.0 0.0 0.0 0.0 0.0 0.0Rental related expenses (0.8) (0.6) (0.6) (0.7) (0.7) (0.7) (0.6) (0.7)Net rental income 52.9 54.3 55.2 54.7 54.5 54.2 54.0 54.3Subtotal recoveries etc. (0.7) (0.4) (0.2) (0.4) (0.4) (0.4) (0.4) (0.4)Property result 52.2 53.9 55.0 54.4 54.1 53.8 53.6 53.9Technical costs (0.5) (0.9) (1.0) (1.0) (1.0) (1.0) (1.0) (1.0)Commercial costs (0.2) (0.2) (0.2) (0.2) (0.2) (0.2) (0.2) (0.2)Taxes and charges on unlet properties (0.2) (0.4) (0.7) (0.7) (0.7) (0.7) (0.7) (0.7)Property result after direct property costs 51.4 52.4 53.0 52.4 52.1 51.9 51.7 51.9Property management costs (4.0) (4.2) (3.4) (3.4) (3.4) (3.4) (3.3) (3.4)Property operating result 47.4 48.1 49.6 49.0 48.8 48.5 48.3 48.6Corporate management costs (1.7) (1.5) (1.6) (1.6) (1.6) (1.6) (1.6) (1.6)Operating result before result on the portfolio 45.7 46.7 48.0 47.4 47.2 46.9 46.8 47.0Gains or losses on disposals 0.5 (0.3) 0.5 0.0 0.0 0.0 0.0 0.0FV changes on portfolio (incl NG and Egmont revaluation) (20.6) (19.7) (15.4) (1.8) 2.3 2.7 5.0 5.0Operating result 25.5 26.7 33.1 45.6 49.5 49.7 51.8 52.0Financial income 1.3 3.6 3.6 0.1 0.2 0.2 0.2 0.2Interest income related to NG 0.0 0.0 0.0 0.3 0.3 0.3 0.3 0.3Interest income related to Egmont 0.0 0.0 0.0 0.0 0.0 0.0 0.0 0.0Interest charges (19.2) (20.1) (23.4) (18.1) (16.9) (17.2) (17.4) (17.2)Total interest (17.9) (16.6) (19.8) (17.7) (16.4) (16.7) (16.9) (16.6)Financial result (29.5) (13.2) (30.0) (18.3) (17.0) (17.3) (17.5) (17.2)Pre tax result (4.0) 13.5 3.2 27.3 32.5 32.4 34.3 34.8Total taxes (1.4) (1.7) (1.2) (1.2) (1.1) (1.1) (1.1) (1.1)Net result (5.4) 11.7 2.0 26.1 31.3 31.3 33.1 33.6Minority interests (0.1) 0.4 (0.2) 0.5 0.6 0.6 0.7 0.7Direct part 0.0 0.0 0.0 0.4 0.5 0.5 0.5 0.5Indirect part 0.0 0.0 0.0 0.1 0.1 0.1 0.2 0.2Total result-group share (32.6) 17.0 4.8 25.6 30.7 30.7 32.5 33.0Source: Company data, ING estimatesFig 27 Quarterly cash flow statement (€m)1Q09 2Q09 3Q09 4Q09F 1Q10F 2Q10F 3Q10F 4Q10F(5.5) 12.1 0.0 26.1 31.3 31.3 33.1 33.6FV change on investment properties 0.0 0.0 0.0 1.8 (2.3) (2.7) (5.0) (5.0)Writeback of lease payments sold and discounted (rent and int part) 0.0 0.0 0.0 (4.0) (3.7) (4.4) (3.7) (3.7)Others 0.0 0.0 0.0 0.0 0.0 0.0 0.0 0.0Working capital adjustmentsTrade receivables 0.0 0.0 0.0 0.3 0.2 0.2 0.1 (0.2)Tax receivables 0.0 0.0 0.0 0.4 0.2 0.2 0.2 (0.2)Deferred charges and accrued income 0.0 0.0 0.0 0.2 0.1 0.1 0.1 (0.1)Trade debts 0.0 0.0 0.0 (0.6) (0.3) (0.3) (0.3) 0.3Taxes, social charges and salaries debts 0.0 0.0 0.0 0.0 0.0 0.0 0.0 0.0Accrued charges and deferred income 0.0 0.0 0.0 (0.4) (0.3) (0.3) (0.2) 0.3CF from Operations (5.5) 12.1 0.0 27.8 25.2 24.1 24.4 25.0Investment properties 0.0 0.0 0.0 0.0 0.0 0.0 0.0 0.0Development projects 0.0 0.0 0.0 0.0 0.0 0.0 0.0 0.0Acquisition & investment in real estate companies 0.0 0.0 0.0 0.0 0.0 0.0 0.0 0.0Disposal of assets held for sale 0.0 0.0 0.0 194.0 0.0 0.0 0.0 0.0CF from Investing 0.0 0.0 0.0 194.0 0.0 0.0 0.0 0.0Change in financial debt 0.0 0.0 0.0 (172.2) (51.2) 98.8 (51.0) 1.2Change in other financial debt 0.0 0.0 0.0 (0.6) (0.4) (0.4) (0.3) 0.4Dividend paid (and profit sharing scheme) 0.0 0.0 0.0 0.0 0.0 (91.2) 0.0 0.0CF from Financing 0.0 0.0 0.0 (172.8) (51.6) 7.2 (51.2) 1.5Free cash flow (5.5) 12.1 0.0 221.8 25.2 24.1 24.4 25.0Net cash flow (5.5) 12.1 0.0 48.9 (26.3) 31.4 (26.9) 26.5Cash BOP 0.0 0.0 1.4 1.3 50.2 23.9 55.3 28.4Cash EOP 2.9 1.4 1.4 50.2 23.9 55.3 28.4 54.9Source: Company data, ING estimates110
<strong>Benelux</strong> <strong>Real</strong> <strong>Estate</strong> February 2010Fig 28 Quarterly per share data (€)1Q09 2Q09 3Q09 4Q09F 1Q10F 2Q10F 3Q10F 4Q10FTotal number of shares entitled to share in the result 13,454,422 13,784,422 13,784,422 13,784,422 14,031,763 14,031,763 14,031,763 14,031,763Net current result 1.84 1.92 1.64 1.73 1.77 1.69 1.71 1.74Dividend to ordinary shares 0 7.8 0 0 0 6.5 0 0IFRS NAV 104.5 97.7 97.9 99.5 99.7 95.2 97.2 99.3Recurring cash flow per share 2.21 2.24 1.98 1.72 1.79 1.71 1.72 1.75Source: Company data, ING estimates111
<strong>Benelux</strong> <strong>Real</strong> <strong>Estate</strong> February 2010This page is left blank intentionally112
<strong>Benelux</strong> <strong>Real</strong> <strong>Estate</strong> February 2010NetherlandsCorioTransforming at bottom of the cycle?Arjan KnibbeAmsterdam (31) 20 563 8780arjan.knibbe@ing.comJean-Yves DevlooAmsterdam (31) 20 563 8745jean-yves.devloo@ing.comPreviously: HoldBuy<strong>Real</strong> <strong>Estate</strong>5 February 2010€44.3Target price (12 mth)€49.6ReutersCOR.ASWe investigate the impact of a potential Multi deal. EPScould rise by €0.20 if portfolio size is above €1.5bn and theyield is >6%. We upgrade to BUY; our TP of €49.6 is basedon a target premium of 10% to IFRS NAV 2010F.12-month forecast returns (%)Share price 12.0Dividend 6.012m f'cst total return 18.0Key ratios (%)2008 2009FSensitivity of our 2010F EPS adj to vacancy rates and LFL (€)Vacancy rate (%)0 1 2 3 4 5 6 7-1 0.09 0.05 0.00 -0.05 -0.09 -0.14 -0.18 -0.230 0.14 0.09 0.04 0.00 -0.05 -0.09 -0.14 -0.191 0.18 0.13 0.09 0.04 0.00 -0.05 -0.10 -0.14LFL (%) 2 0.22 0.18 0.13 0.09 0.04 -0.01 -0.05 -0.103 0.27 0.22 0.18 0.13 0.08 0.04 -0.01 -0.054 0.31 0.27 0.22 0.17 0.13 0.08 0.04 -0.015 0.36 0.31 0.26 0.22 0.17 0.13 0.08 0.036 0.40 0.35 0.31 0.26 0.22 0.17 0.12 0.08Source: ING_EPS sensitivity. Our 2010F EPS estimate is based on a vacancy rate of4% and a like-for-like excluding vacancy impact of 1.1%. The table aboveillustrates the sensitivity of our 2010F EPS to those drivers.We upgrade Corio to a BUY as our target price of €49.6 now gives totalupside of 18%. Detail on the Multi deal is lacking. Our target price is based ona 10% target premium on our 2010F IFRS NAVE of €50. We believe this isconservative as this does not reflect any value for the pipeline.Key ratios and forecasts2008 2009F 2010F 2011F 2012FRental growth 22.5 7.1Operating margin 90.8 79.4Occupancy rate 97.7 96.0Share dataNo. of shares (m) 76.4Daily turnover (shares, 3M) 225,000Free float (%) 100Enterprise value (€m) 5,737.1Market cap (€m) 3,379.1Share price performance7060504030201/08 7/08 1/09 7/09 1/10Source: INGPriceAEX All Share (rebased)EPS adj (€) 3.08 3.02 2.73 2.79 3.15IFRS NAV (€) 52.2 44.8 45.1 46.2 48.1EPRA NNNAV per share (€) 57.9 49.7 50.0 51.0 52.6P/EPRA NNNAV (%) 0.76 0.89 0.89 0.87 0.84DPS (€) 2.64 2.64 2.69 2.75 2.80Dividend yield (%) 6.0% 6.0% 6.1% 6.2% 6.3%LTV (%) 40.6 38.3 42.2 43.0 42.5Source: Company data, ING estimates113
<strong>Benelux</strong> <strong>Real</strong> <strong>Estate</strong> February 2010Investment caseCorio is a leading retail property investor and developer in Europe. The groupowns a €6bn portfolio of investments in its five home markets: the Netherlands,France, Italy, Spain and Turkey. In addition, Corio has a €2.4bn developmentpipeline, €784m of which is committed.HighlightsWe investigate theimpact of a Multi dealDeal could be attractiveand the company istransformingIf a deal takes placeEPS could increase byas much as €0.20Corio is unlikely tooverpayStress testing forvacancy and LFL rentalgrowthCorio has announced it is in exclusive talks with one of the largest retail developers inEurope, Multi Development. In this report we investigate the impact of an acquisition ofMulti‘s assets on the profitability of Corio.We believe that Multi Development has an impressive track record and owns veryattractive assets. If Corio can acquire assets at liquidation prices, this could be veryattractive. If Corio were to acquire a large proportion of the assets, this could be acompany-transforming deal. Corio primarily wants to add Germany as a sixth homemarket with this deal and stated it is focused on Multi’s Western European assets. Inaddition, Multi has very substantial exposure to Turkey and Italy that offer attractiveopportunities for Corio as it strengthens its existing clusters of centres.The earnings impact will be bigger than the NAV impact. The impact of a potential dealis primarily dependent on the size and yield of the acquired investment portfolio. Webelieve that the 413,600m² German portfolio of investments and developments is likelyto be valued at above €1.6bn. The acquisition of such a portfolio, at a net yield of 6%,when financed with debt, would add more then €0.20 per share to 2010F EPS, evenbased on a 5% cost of debt (Corio currently pays c.4.0%).We believe the market fails to appreciate the quality of Multi’s assets and has not fullypriced in this once-in-a-lifetime growth opportunity. On the other hand, investors mayfear that Corio will overpay. We believe that Corio has excellent pure property skillsand is well positioned to make sure it does not overpay. In addition earn-outconstructions and JV’s can further secure a good outcome for Corio. Lastly, Corio doesnot have to do a deal; if it does not consider the deal to be attractive it can walk awayand wait for another portfolio.We have also stress tested EPS for vacancy rates and like-for-like rental growth. Ourfindings are shown on the front page of this report. In a worst case scenario, withvacancies rising from our estimate of c.4% to 7% and like-for-like rents dropping fromour estimate of 1.1% to -1%, we forecast that 2010F EPS would fall by €0.23 to €2.50.114
<strong>Benelux</strong> <strong>Real</strong> <strong>Estate</strong> February 2010SWOTFig 1 SWOT analysisStrengthsWeaknessesStrong balance sheet with 40% Loan to value at 30 Sept 2009 Yield on cost of the €893m variable waivable pipeline of 6.3%The interest cover ratio stands at 3.1xShort in-house development track recordCorio has strong local management teamsInternational, seasoned and hands-on management teamAverage asset size increasedSRI consciousness above averageOpportunitiesEnter new marketsCross sell best practice between countriesThreats/RisksTurkish exposure: currency, oversupply of retail spaceCommitted development pipelineE-commerceSource: INGProperty companies arelow risk, on averageCorio’s main activity isthe least risky:investmentBut the developmentrisk has increasedPotential pressure onlease lengthAhold seems a soundtenant, today_RisksBecause of the contractual nature of a large part of the recurring cash flows, propertycompanies are usually considered to have less risk than most other equity sectors.The risk of property companies bears a strong relation to the amount of developmentexposure, the geographical and sectoral breakdown, corporate governance and thealignment of interests between management and shareholders.Principally an investorWe believe that Corio is a low risk property company. It is principally an investor, whichis the least risky activity of the four core real estate company activities: investment,development, trading and asset management. Corio has focused on retail property,which we consider to be a low risk real estate sector. We doubt that adding moresectors to the portfolio would lower risk. Total return correlations of ContinentalEuropean retail property are high. Therefore, we believe that the diversificationthroughout the five home markets – Netherlands, France, Italy, Spain and Turkey –with the exception of the latter, does little to reduce risk. Adding Germany as a homemarket will not change this.Development risk has increasedCorio has a €2.4bn development pipeline which is roughly 1/3 committed, 1/3deferrable and 1/3 waivable. We believe that the recent in-sourcing of developmentand extension activities does bear a risk. On the other hand, we believe that the labourmarket for good and experienced retail developers offers ample opportunities for Corioto hire some seasoned hands. In addition Corio always hedges risks of costs ofconstruction. Nevertheless, adding development activity adds risk, when comparedwith buying turn-key developments. Over the whole cycle we believe that the additionof development makes Corio a more attractive company.Accounting for leasesThere are accounting initiatives that may lead to an obligation for tenants to accountlong leases as a liability in their balance sheets. In the future, this may put pressure onthe average lease lengths of real estate companies and Corio.Tenant risk limitedCorio’s largest tenant is Ahold, which pays €10.4m or 2.8% of the rent roll. We believethat this is a limited risk. Management notes that Ahold is a listed company and the115
<strong>Benelux</strong> <strong>Real</strong> <strong>Estate</strong> February 2010consequent transparency should in principle lead to early warning signs if there is apossibility that Ahold is unable to pay its rent. Ahold’s credit rating is BBB.Currency risks are manageableDollar loans do notremove Turkish Lira riskCorio has a c.€397m gross exposure to the Turkish lira, excluding the c.€380mplanned Turkish developments, after the cancelation of the Akozza and Akasyadevelopments in December. Although rents are paid in hard currencies (Euro and USdollars) we believe that the value component of the Turkish exposure bears currencyrisk. These currency risks are not removed by the US dollar borrowings.E-commerceWe believe e-commerce will continue to change consumer shopping patterns. Theimportance of a physical shop in the total distribution will diminish further. As a result,footfall may fall in shopping centres. In addition consumer-to-consumer trading hasdramatically increased with E-Bay and similar sites. To a large extent, consumer-toconsumertrading comes at the expense of retail turnover. Lastly, virtual socialnetworks are more likely to decrease than to increase the social function of a shoppingcentre.CatalystsWe see five potential short-term catalysts.• A Multi Development deal• Succession of the CFO Jan Haars• Full-year results on 18 February• Other acquisitions and disposals• Further trimming of the development pipelineWe believe the outcome of announced negotiations with Multi Development is by farthe most important catalyst for Corio.The Multi announcementThis deal could becompanytransformingGermany as sixth homemarket……and very substantialTurkish, French andItalian potentialCorio has announced that it has entered into exclusive negotiations about a part of theMulti Development portfolio. According to the press release there can be no assurancethat a transaction of any kind will take place. This deal could turn out to be companytransforming if Corio carves out a large proportion of Multi’s assets.Multi is a leading developer of shopping centres in Europe. Multi operates in 14European countries and Corio announced it is in talks about its Western Europeanoperations, in particular Germany, with the aim of opening a new sixth home market.Financial disclosure of Multi is not up to listed standards. In 2006 Multi changed itsstrategy to become a developer-investor. We would not be surprised if the financingbanks are pushing Multi to cash in on recent shopping centre completions.This deal could be substantial as Multi has a multi billion euro portfolio. In Germanyalone we would estimate the portfolio to be valued at above €1.5bn. Corio currentlyhas a €6bn portfolio and has virtually no German presence. As Multi is also a veryimportant developer in Turkey, a market where Corio is also a pioneer, thesenegotiations could be seen as the opening move of a longer game.116
<strong>Benelux</strong> <strong>Real</strong> <strong>Estate</strong> February 2010Multi opened a very large shopping centre in Palermo in November 2009 and Corio willfeel they are well positioned to assess the risk of southern Italian centres, after theirNaples experience with La Marcianise shopping centre. Multi is also the developer ofthe largest mall in Europe – the 175,000m² Forum Istanbul – which opened a fewmonths ago.Figure 2 illustrates the breakdown of Multi Development’s German portfolio. Over halfof the m² have been delivered and are in operation.Fig 2 Multi's German portfolio by statusIn development15%Under construction30%Completed55%Source: Multi Development, ING estimates, based on m²Figure 3 provides a full overview of the German portfolio. Bear in mind that not all ofthe centres are 100% owned and Multi does not disclose its holdings. We believe thecentres are generally well located. The regional spread of the portfolio also gives noreason for concern. In the appendix we have included a full list of Multi Development’scompletions.Fig 3 Multi's German portfolioCity Name GLA (m²) Completion CommentUnder construction 122,500- Hildesheim Arneken Galerie 26,500 2011 Mixed- Berlin Boulevard Berlin 76,000 3Q11 Mixed- Duisburg Konings Allee 20,000 3Q10 3,500 office spaceCompleted 227,100- Dresden Centrum Galerie 62,000 Sep 09 4 floors, 1,000 parkings- Duisburg Forum Duisburg 57,000 Sep 08 Very good according to Breaam- Osnabruck Kamp Promenade 16,300 Sep 04 3,200m² offices- Wiesbaden Lilien Carre 36,000 Mar 07 10,000m² office- Pforzheim Schlossle Galerie 22,400 Mar 05 2,400m² office- Hagen Volme-Galerie am Rathaus 33,400 Mar 03 2,400m² officeIn development 64,000- Recklinghausen Quartier am Markt 42,000 2H12 12,000m² Karstadt- Bamberg Quartier an der Stadtmauer 11,000 1H12 Construction start 2010- Duisburg Stadtfenster 11,000 4Q11 Mixed incl 1,200m² retailTotal 413,600Source: Multi development, ING estimatesNot all centres havereached ‘cruisingspeed’_Not all investors will be happy with Corio gaining a strong German presence, unlessthe company manages to buy at a low price. Dresden and Duisburg have only recentlybeen delivered so the performance has not reached ‘cruising speed’. The opening of a117
_<strong>Benelux</strong> <strong>Real</strong> <strong>Estate</strong> February 2010larger shopping centre changes footfall, routing and rental levels in an existing towncentre. It may take years before a new equilibrium is found. As a result it may be hardto know whether the current contract rents of Multi’s recent completions aresustainable longer term.Recent lettings unlikelyto be inflatedThe shopping centres that have recently been let have the advantage that letting tookplace in particularly difficult markets. As a result the contract rents may be below thenormal ‘mid-cycle rent’ (if such a level exists), creating reversionary potential.We believe a standing portfolio of prime German assets would be attractive if it couldbe acquired at a net yield of above 6%.2010 market evidence ofGerman retail hard toanalyseDeutsche Euroshop, which invests in the retail developments of ECE, the retaildeveloper controlled by the Otto family, has its €2.6bn portfolio valued at a net initialyield of 5.64%. A map of the German centres is shown in Figure 4.Deutsche Euroshop recently acquired the 666,000 GLA retail space A10 shoppingcentre in Wildau, near Berlin, containing 180 shops. The company reports a 2012expected net initial yield (NOI) of 6.5%. This includes the impact of an extension and acapturing of reversionary potential. We do not believe this deal is very relevant to thecurrent negotiations between Corio and Multi. In particular, we would need abreakdown of the total capex of €265m, into current price and future capex, in order tocalculate the current yield.The reasons why Germany was traditionally seen by most investors as a not soattractive market are: (1) the weak demographics (although birth rates seem to berising slightly in recent times); (2) the strong culture of high street shopping; (3) tenantprotection; and (4) property yields, which traditionally were very low.Fig 4 German portfolio Deutsche EuroshopSource: Deutsche Euroshop118
<strong>Benelux</strong> <strong>Real</strong> <strong>Estate</strong> February 2010One of the attractions of German retail investment is the high barrier to entry, asplanning is very strict.Sensitivity analysis of a potential Multi dealWe believe the acquisition impact would be two-fold.1) Firstly there would be an immediate positive earnings impact as cost of debt wouldbe below yield on property. This would have a positive effect on direct investmentresult (DIR) per share.2) Secondly we believe that as the assets would no longer be in the hands of a semidistressedseller, valuers would adjust the property yield downward. This wouldhave a positive impact on NAV.1) Earnings impact sensitivityIn our analysis we have calculated the impact on recurring EPS or direct investmentresult (DIR) for a deal size of €600m to €2bn and property portfolio yields of 5.4% to6.6%. The average cost of debt in 3Q09 dropped to 4.0%. We have calculated theearnings sensitivity using a cost of debt of 4.5% and 5.0%. Our findings are shown inFigures 5 and 6.119
__<strong>Benelux</strong> <strong>Real</strong> <strong>Estate</strong> February 2010Fig 5 Earnings sensitivity with cost of debt at 5.0% (€ per share)Deal size (€m)600 800 1,000 1,200 1,400 1,600 1,800 2,0006.60 0.13 0.17 0.21 0.25 0.29 0.34 0.38 0.426.40 0.11 0.15 0.18 0.22 0.26 0.29 0.33 0.376.20 0.09 0.13 0.16 0.19 0.22 0.25 0.28 0.31Yield (%) 6.00 0.08 0.10 0.13 0.16 0.18 0.21 0.24 0.265.80 0.06 0.08 0.10 0.13 0.15 0.17 0.19 0.215.60 0.05 0.06 0.08 0.09 0.11 0.13 0.14 0.165.40 0.03 0.04 0.05 0.06 0.07 0.08 0.09 0.10Source: ING estimatesIf Corio does a smaller deal, this is likely to lead to a lower cost of additional debt.Figure 6 illustrates the earnings impact when cost of debt is 4.5%. We believe that ifCorio acquires a portfolio of €1.2bn, at a yield of 6.2% and a cost of debt of 4.5%, therecurring impact on earnings would be €0.27 per share (10% of our 2010F EPS of€2.73).Fig 6 Earnings sensitivity with cost of debt at 4.5% (€ per share)Deal size (€m)600 800 1,000 1,200 1,400 1,600 1,800 2,0006.60 0.16 0.22 0.27 0.33 0.38 0.44 0.49 0.556.40 0.15 0.20 0.25 0.30 0.35 0.40 0.45 0.506.20 0.13 0.18 0.22 0.27 0.31 0.36 0.40 0.45Yield (%) 6.00 0.12 0.16 0.20 0.24 0.27 0.31 0.35 0.395.80 0.10 0.14 0.17 0.20 0.24 0.27 0.31 0.345.60 0.09 0.12 0.14 0.17 0.20 0.23 0.26 0.295.40 0.07 0.09 0.12 0.14 0.16 0.19 0.21 0.24Source: ING estimates_2) NAV impact sensitivityWe believe that valuers will put a non-distressed yield on the portfolio after acquisitionand we expect that yield to be below the acquisition yield. Figure 7 shows the impact ofthis effect on the NAV per share for scenarios of 5bp to 50bp and deal values ofbetween €600m and €2bn. If Corio makes a €1.2bn acquisition on a yield of 6.0% andthe valuers lower the yield by 30bp, NAV per share will rise by €0.83. As long as equityis issued around NAV, dilution will be limited.Fig 7 Impact on NAV per share based on 6.0% property yield for 5-50bp yield adjustment (€)Deal size (€m)600 800 1,000 1,200 1,400 1,600 1,800 2,0005 0.07 0.09 0.11 0.13 0.15 0.18 0.20 0.2210 0.13 0.18 0.22 0.27 0.31 0.35 0.40 0.44Yield (bp) 20 0.27 0.36 0.45 0.54 0.63 0.72 0.81 0.9030 0.41 0.55 0.69 0.83 0.96 1.10 1.24 1.3840 0.56 0.75 0.93 1.12 1.31 1.50 1.68 1.8750 0.71 0.95 1.19 1.43 1.67 1.90 2.14 2.38Source: ING estimatesAnother NAV impact could come from equity issuance. If Corio decides to issue equitybelow NAV then this will clearly have a dilutive effect. Currently the share price tradesabove the IFRS NAV. If the share price were to drop significantly, the discount to NAVat which the issue takes place would widen with a negative effect on the NAV pershare.120
<strong>Benelux</strong> <strong>Real</strong> <strong>Estate</strong> February 2010Financing an acquisitionCorio’s current firepower is reported to be €550m. Corio raised €258m this summer inan equity raising. We believe that Corio could easily raise more equity if they are ableto explain that Multi is offering its assets at semi-distressed prices.Figure 8 gives an overview of the capital raising in the real estate sector in the<strong>Benelux</strong>. The sector raised a total of €832m in nine deals. Corio made the largest dealwith its €258m issue in June 2009.Fig 8 Equity issuance in <strong>Benelux</strong> real estate sector 2009Issuer Country Pricing date Size(€m)Cofinimmo SA/NV Belgium 26 Mar 2009 72Warehouses De Pauw Sicafi – WDP Belgium 1 Apr 2009 20Befimmo SCA Belgium 22 Jun 2009 166Warehouses De Pauw Sicafi – WDP Belgium 26 Jun 2009 76Nieuwe Steen Investments NV Netherlands 2 Jun 2009 39Corio NV Netherlands 4 Jun 2009 258Cofinimmo SA/NV Belgium 9 Jun 2009 26VastNed Retail NV Netherlands 11 Sep 2009 76Eurocommercial Properties NV Netherlands 17 Nov 2009 99Total <strong>Benelux</strong> 2009 832Source: ING estimates, Dealogic_OutlookManagement has stated it will improve its direct investment result modestly. Note thisis not a per share statement. Were a deal to actually take place, then it is likely to beimmediately earnings enhancing. We expect the property yield of the Multi portfolio torun at above 6% net. In addition, the distressed selling price may be correctedupwards when the assets have stabilised and are in the hands of a non-distressedowner such as Corio.French office disposalwill reduce earnings by€0.11-0.16 per shareCorio has repeatedly indicated it wants to sell its French offices. We believe thedisposal of the €322m portfolio that is valued at a net yield of 7.7% and almost fully(99.6% at 30 September 2009) occupied, would lead to a loss of earnings of between€8.5m and €5.2m. This is based on the repayment of debt at interest rates of 4.0-5.0%.As a result the disposal would decrease EPS by €0.11-0.16.ValuationCorio trades just below its recently reported IFRS NAV per share of €44.24 and isslightly more expensive compared to its Continental European peers. The reported socalledEPRA triple net asset value (NNNAV) of €47.21 (-19% YoY) adds back c.85% ofthe deferred capital gains tax (c.€300m or €c.2.60 per share), that must be deducted inIFRS and it adds back the increase in the market value of the debt, (€0.39 per share),which leads to a lower IFRS NAV. Dividend yield 6.0%, slightly above the ContinentalEuropean average of 5.5%.121
_<strong>Benelux</strong> <strong>Real</strong> <strong>Estate</strong> February 2010Fig 9 European REIT overviewCompanyShareprice(€)Mktcap(€m)Discount tolast reportedNAV(%)Latestreportednet yield(%)ReferencedateImplied netyield(%)LTVcalculated (1)(%)ImpliedLTV (2)(%)Prospectivedividend(€)Divyield(%)Netherlands Corio (Buy) 44.25 3,379 -6 6.7 30/06/09 7.0 42.4 41.8 2.64 6.0Eurocommercial 28.81 1,165 -9 5.6 30/06/09 5.9 37.1 44.9 1.82 6.2properties (Buy)VastNed Retail (Buy) 46.61 851 -9 6.7 30/09/09 7.0 28.2 38.8 3.84 8.7Wereldhave (Buy) 64.96 1,382 -11 6.6 30/09/09 7.1 37.3 30.3 4.70 7.1France Unibail Rodamco (NR) 156.25 1,426 19 6.1 30/06/08 5.5 37.3 33.7 8.31 5.3Klepierre (NR) 27.10 4,931 3 6.9 30/06/09 6.8 66.3 65.5 1.25 4.6Mercialys (NR) 24.98 2,297 -5 6.3 30/06/09 6.8 0.6 0.6 1.03 4.1Germany Deutsche Euroshop (NR) 22.41 989 -19 5.6 31/12/08 6.3 42.7 47.6 1.10 4.9Finland Citycon (NR) 3.00 663 -18 6.6 30/09/09 7.1 58.3 62.4 0.14 4.7Italy IGD (NR) 1.51 466 -37 7.5 30/09/09 9.4 66.0 82.9 0.05 3.3Average -9 6.5 6.9 41.6 44.9 5.5Min -37 5.6 5.5 0.6 0.6 3.3Max 19 7.5 9.4 66.3 82.9 8.71Total net debt divided by total real estate assets, (2) Total net debt divided by real estate portfolio value corrected for discount implied by stock exchange.Pricing date: 5 February 2010Source: Datastream_ConsensusThe market expects falling earnings from Corio, both in 2009 and 2010, beforeearnings rise again in 2011. We have not factored in the potential Multi deal in ourestimates.Fig 10 EPS consensus estimates (€)2008 2009F 2010F 2011FConsensus 3.08 3.00 2.73 3.01ING 3.08 3.02 2.73 2.79Difference N/A 0.02 0 -0.22Difference (%) N/A 1 0 -7Source: Reuters, ING Estimates_Surprise historyDifference betweenestimates and reportedEPS widenedFigure 11 illustrates the size of the deviations of the earnings estimates from thereported number. It increased from 2% for the full year number to 7% on the 3Qnumber in September 2009. This may be a coincidence or the result of the equity issuein June, which was not included in the numbers for all models.Fig 11 Surprise history of quarterly earnings (EPS, €)Dec 2008 Mar 2009 Jun 2009 Sep 2009Mean consensus 0.744 0.715 0.726 0.735Actual 0.730 0.750 0.767 0.790Difference (0.014) 0.035 0.041 0.055As a percentage (%) -2 5 5 7Source: Reuters122
_<strong>Benelux</strong> <strong>Real</strong> <strong>Estate</strong> February 2010Our estimates and assumptionsOur earnings and valuation estimates are based on the following assumptions:1) We have not factored in any Multi deal. We expect that the earnings impact of a€1bn plus deal may be above €0.20 per share, depending on the entry yield. Seeour sensitivity analysis elsewhere in the report.2) We have not factored in the French office disposal. We believe this woulddecrease 2010F EPS by c.€0.11-0.16.3) Vacancies will edge up by one percent to 5% in 2010 and then come back downagain. We expect the highest vacancy in Spain on the back of the economicsituation and its effect on retail sales.Fig 12 Our vacancy assumptions overview (%)2009F 2010F 2011F 2012FNetherlands 1.8 2.0 2.0 1.5France 5.3 6.0 4.0 2.0Italy 0.8 1.0 1.0 1.0Spain 7.1 9.0 7.0 4.0Turkey 8.2 6.0 4.0 2.0Source: ING estimates_4) Other like-for-like rental growth is likely to slow down in 2010 and pick upthereafter. Adjusting for account incentives, renegotiations and re-lettings, weexpect Spain to be worst hit in 2009 and 2010.Fig 13 Our like-for-like rental growth assumptions (%)2009F 2010F 2011F 2012FNetherlands 1.8 2.0 3.0 3.0France 3.4 1.0 3.0 3.0Italy 2.7 3.0 3.0 3.0Spain -7.8 -4.0 0.0 3.0Turkey 0.0 0.0 2.0 4.0Source: ING estimates_5) We have only taken the €533m committed developments into account.Development gains are pencilled in at on average 10% of capital expenditure. Thatmeans we have not calculated margins over the €251m already spent.6) Portfolio valuations are assumed to come out at 0.3% in 2010 and 1.7% in 2011.Full details are provided in Figure 14.Fig 14 Our valuation estimates 2009-12 (%)2009F 2010F 2011F 2012FNetherlands -4.6 1.0 2.0 2.0France -6.6 1.0 2.0 2.0Italy -5.7 0.0 1.0 2.0Spain -12.4 -4.0 0.0 2.0Turkey -25.6 0.0 2.0 4.1Other -1.6 0.0 0.0 0.5Total -6.5 0.3 1.7 2.0Source: ING estimates123
<strong>Benelux</strong> <strong>Real</strong> <strong>Estate</strong> February 2010Risks to our recommendationOur scenario is not based on a deep second dip in the economy. If such aneventuality were to occur then vacancies would rise further and like-for-like rents mightdecline further as retailers slow down expansion plans and demand-pull inflation partlydisappears.Our development gains are still positive. That may prove to be too optimistic incertain cases. Factored in development gains are c.€53m or €0.70 per share over thenext few years. The net yield on cost, which we estimate to be 7.24%, gives usconfidence that we are not too optimistic.124
_<strong>Benelux</strong> <strong>Real</strong> <strong>Estate</strong> February 2010Company profileInvestment portfolioCorio has a well-balanced portfolio of larger shopping centres in five countries, with themajority in France.Fig 15 Geographical breakdown: 30 Sept 2009 Fig 16 Breakdown by sector: 30 Sept 2009TheNetherlands33%France33%Other inclGermany0%Retail93%Offices6%Other1%Spain9%Turkey7%Italy18%Source: Company dataSource: Company dataFig 17 Top ten assets in Corio’s portfolio: 2006-09 (€m)31 Dec 2006 31 Dec 2007 %ch 31 Dec 2008 %ch 30 Sep 2009 %chGrand' Littoral, Marseille 350.4 330.0 -6Hoog Catharijne (incl. offices), Utrecht* 311.6 341.4 10 296.5 -13 328.4 11Le Gru, Turin 265.6 291.2 10 327 12 304.8 -7Campania, Marcianise In pipeline 312 297.4 -5 276.5 -7Grand'Place, Grenoble 230.1 298.3 30 273.6 -8 258.4 -6Alexandrium I, Rotterdam 236.4 253.5 7 244.8 -3 241.7 -1Akmerkez GYO, Istanbul (46.92%) 192.8 244.1 27 186.2 -24 157.6 -15Mondeville 2, Caen 108.4 159.9 48 149.8 -6 140.3 -6Principe Pio, Madrid 131.6 N/AGrandEmilia, Modena 134 145.1 8 138.8 -4 131.0 -6Maremagnum, Barcelona 126.1 136.1 8 129.7 -5 121.2 -7Globo, Busnago 106.5 116.4 9 N/A N/A N/A N/ACity Plaza, Nieuwegein 94.7 N/A N/A N/A N/A N/A N/ATotal top ten 1,806 2,298 2,300 2,386Top ten as % of total portfolio 33.10 35.60 39.00 39.00Source: Company data, ING estimates* Includes IPUC for €28.7 from 30 Sept 2009Figure 17 highlights the Corio’s top ten assets in the past three years. Valuations willhave been impacted by capex and as a result the valuation percentages are notalways comparable. For example, the 48% increase in value of the Caen holding in2007 was the result of both capital expenditure on an extension and a valuationincrease. We believe the Turkish valuations, +27% in 2007 and -24% in 2008, arestrikingly volatile. We note that in the first nine months of 2009 six of the top ten assetsfailed to match the company’s average retail valuation result.125
__<strong>Benelux</strong> <strong>Real</strong> <strong>Estate</strong> February 2010VacanciesFig 18 Breakdown of vacancy 2006-09 (%)Figure 18 illustrates the breakdown of Corio’s vacancies. We believe these numbersillustrate the resilience of the portfolio in the current crisis.2006 2007 2008 9M09 Rental Income lost during 9M09(€m)Financial (total) average occupancy 93.5 93.9 94.7 94.0 18.5Signed & not yet occupied 0.9 0.6 0.1 0.0 -Rent-free periods 1.6 2.3 2.1 2.2 6.8EPRA occupancy 96.0 96.8 96.8 96.8 11.7Strategic vacancy 1.5 0.6 0.5 0.9 2.7Leasable vacancy 2.5 2.3 2.5 2.9 9.0Source: Company data, ING estimates_Development pipelineCorio has an attractive €2.4bn development pipeline. It was traditionally divided intoalready paid, fixed, and variable. Fixed projects refer to developments in which allparties are committed ‘as far as necessary’. When the focus shifted from opportunitiesto risk, management added a useful new dimension, as outlined in the columns below.We believe that part of the deferrable pipeline may well be committed as well.Fig 19 Corio’s development pipeline (€m)Committed Deferrable Waivable TotalAlready paid 251 88 23 361Fixed 533 157 690Variable 502 870 1,372Total 784 747 893 2,423Net yields- Fixed (%) 6.9 8.4 7.2- Variable (%) 6.6 6.3 6.4Source: Company data, ING estimatesMost of the development pipeline is related to extensions and redevelopments ofexisting assets. These carry a lower risk then the full-fledged developments.Fig 20 Breakdown of developments: 30 Sept 2009 Fig 21 Pipeline by country: 30 Sept 2009Deveopment s andacquisitions34% TheNetherlands36%Turkey19%Spain1%Ext ensions andredevelopment s66%Italy38%France6%Source: Company dataSource: Company data126
<strong>Benelux</strong> <strong>Real</strong> <strong>Estate</strong> February 2010Fig 22 Breakdown of pipeline by commitment: 30 Sep 2009100090080070060050040030020010005335028702511578823Committed Deferrable WaivableAlready paid Fixed VariableSource: Company data_Corporate governanceManagementCEO: Gerard GroenerEducation: Building Engineer 1982, Master <strong>Real</strong> <strong>Estate</strong> 1997.Previous career: Mr Groener’s career started in 1985, when he worked for Akzo inseveral functions, ultimately as acquisition manager real estate for the Akzo pensionfund until 1993. Between 1993 and 1996 Gerard worked for Van Wijnen, acontractor/developer, as a developer.Career within Corio: Mr Groener has been Managing Director of Corio NederlandRetail since the merger in December 2000 between VIB and Winkel BeleggingenNederland (WBN), the firm where he started in 1996 and joined the ManagementBoard in 1998. In May 2006 Mr Groener joined the Management Board of Corio N.V.and on 1 May 2008 he was appointed CEO of Corio N.V.Additional positions: Mr Groener is chairman of ULI (Urban Land Institute) Nederlandand chairman for the NRW (Dutch council of shopping centres).CFO Haars hasannounced his intentionto retireCFO: Jan HaarsJan Haars has been the CFO of Corio since May 2007. He has recently announced hisintention to retire and will step down at the AGM in March 2010. This probably makeshim the longest serving CFO of Corio since 2000.Previous career: Jan Haars has been CFO and a member of TPG’s ManagementBoard from August 2002 to March 2006. Before joining TPG, Mr Haars worked for ABNAMRO Bank N.V., Thyssen Bornemisza Group, Royal Boskalis Westminster N.V.,Rabobank Nederland and Unilever N.V., where he was worldwide group treasurer.Mr Haars is a member of the supervisory board of Delta Lloyd that was recently listed.He is also a member of the supervisory board of Ajax football club, which has won twoDutch national titles in the past ten years.Member of the board: Frédéric FontaineFunction: CEO Corio France, member of Management Board of Corio N.V.Education: Ecole supérieure de commerce Nantes 1981127
<strong>Benelux</strong> <strong>Real</strong> <strong>Estate</strong> February 2010Previous career: Mr Fontaine started his professional career in France Construction(Bouygues) in 1983. In 1985 he joined COPRA, a multi products developer, where hespent nine years until 1993. In 1994 Mr Fontaine joined Trema where he specialised inretail development. In 1998 he joined Hammerson France in the position of retaildevelopment director, where he stayed until May 2003.Career within Corio: Mr Fontaine was appointed Managing Director of Corio Francein May 2003. He joined the Management Board of Corio N.V. in May 2006.128
<strong>Benelux</strong> <strong>Real</strong> <strong>Estate</strong> February 2010FinancialsRecent 9M09 resultsIFRS NAV per share came in at €44.24 (-15.2% ytd) and NNNAV was €47.21 (-18.6%YTD). Recurring EPS per share was down €0.07 to €2.29 as a result of the recent€254m net equity issue. Like-for-like rental growth fell to just 1.8% as Spanish rents fell7.8%, like for like (Netherlands 0.7%, France 7.9%, Italy 2.7%, Turkey N/A). Averageoccupancy stands at 96.2%, including c.1% tactical vacancy for upgrades etc. 3Q09valuations were only €17m or below 0.3%. 3Q revaluations were done internally andmanagement has consulted its valuers for input on recent yield movements.Management expects yields to stabilise in the near future in its home countries. Weagree with this view for all home countries except Turkey. We trust the internalvaluations of Corio. YTD retail valuations are -5.7%.Net theoretical (with vacant space let at market rents) retail yields now stand at 6.6%up 60bp from 31 Dec 2008 and seem to be close to their peak. In the UK, where thedecline started earlier and values have fallen more, yields are falling again. We believethat consumer spending may very well take another hit. Vacancies seem to be fairlystable but we would like to see the spot vacancy numbers and not just the averages.Corio has good disclosure on its €2.4bn development portfolio, which is divided intothree parts: (1) a committed pipeline of €783m with a yield on cost of 6.9%, whichseems rather meagre to us in the current market and given Corio’s standing theoreticalnet yield of 6.6%. A 30bp development margin is not sufficient, but we agree that inparticular Hoog Catarijne should be valued at a significantly lower yield than Corio’saverage; (2) a deferrable pipeline of €747m at a yield on cost of 8.4% for the fixed partand only 6.6% for the variable part; and (3) a waivable development pipeline of €870m,which is not very valuable in current markets given its 6.3% yield on cost.Full year results are due out on 18 February 2010 after market close.129
__<strong>Benelux</strong> <strong>Real</strong> <strong>Estate</strong> February 2010Fig 23 Balance sheet (€m)Annual results and forecasts2008 2009F 2010F 2011F 2012F 2013F 2014FInvestment property 5,563 5,512 5,529 5,962 6,412 6,535 6,660Investment property under development 248 219 629 429 129 129 129Investments in associates 221 166 168 171 175 178 182Total investment property 6,032 5,898 6,326 6,562 6,716 6,842 6,971Total non-current assets 125 139 139 139 139 139 139Other receivables 241 200 201 219 236 244 251Cash and cash equivalents 11 90 36 31 53 59 62Total current assets 252 290 237 250 288 302 313Assets of discontinued operations 0 0 0 0 0 0 0Total assets 6,409 6,326 6,702 6,950 7,143 7,283 7,423Shareholders equity-group share 3,459 3,423 3,447 3,536 3,673 3,821 3,979Shareholders equity-minorities 0 34 34 34 34 34 34Total shareholders equity 3,459 3,457 3,481 3,570 3,707 3,855 4,013Interest-bearing long-term loans and borrowings 2,363 2,347 2,700 2,850 2,900 2,900 2,890Employee benefits 1 1 1 1 1 1 1Provisions 2 3 3 3 3 3 3Deferred tax liabilities 288 250 248 234 216 198 179Financial lease 0 1 1 1 1 1 1Total non-current liabilities 2,654 2,601 2,952 3,088 3,120 3,102 3,073Interest-bearing short-term loans and borrowings 97 3 3 3 4 4 4Other payables 199 265 266 290 312 323 333Total current liabilities 296 268 269 293 316 326 337Liabilities of discontinued operations 0 0 0 0 0 0 0Total liabilities 2,950 2,869 3,221 3,381 3,436 3,428 3,409Total equity and liabilities 6,409 6,326 6,702 6,950 7,143 7,283 7,423Source: Company data, ING estimatesFig 24 Profit and loss (€m)2008 2009F 2010F 2011F 2012F 2013F 2014FGross rental income 365 391 400 422 464 482 497Property operating expenses (47) (54) (56) (60) (68) (70) (73)Net rental income 318 337 345 362 397 411 424Administrative expenses (30) (36) (36) (38) (42) (43) (45)Operating income 288 301 309 324 355 368 379Share of profit of associates (direct) 15 9 7 7 7 7 8EBIT continuing operations 303 310 315 331 362 375 387Operating income discontinued operations 29 0 0 0 0 0 0EBIT 331 310 315 331 362 375 387Net financing expenses (127) (95) (106) (117) (120) (121) (120)Corporate income tax 0 3 0 0 0 0 0Direct result 204 218 209 214 241 254 266Minority share (direct) 0 0 0 0 0 1 1Direct result (excluding minority share) 204 218 208 213 241 254 266Net valuation on investment property (337) (359) 17 91 120 123 126Profit on disposal of investment property (3) 0 0 0 0 0 0Share of profit of associates (indirect) (97) (15) 2 3 3 4 4Deferred tax expense 22 63 (3) (14) (18) (18) (19)Net other income (13) 0 0 0 0 0 0Indirect result continuing operations (428) (311) 16 81 106 108 110Indirect result discontinued operations (16) 0 0 0 0 0 0Indirect result (444) (311) 16 81 106 108 110Minority share (indirect) 0 (3) 0 1 1 1 1Indirect results (excluding minority share) (444) (309) 16 80 105 107 109Net profit (including minority) (240) (93) 225 295 347 362 377Net profit (excluding minority) (240) (91) 224 294 346 361 375Source: Company data, ING estimates130
__<strong>Benelux</strong> <strong>Real</strong> <strong>Estate</strong> February 2010Fig 25 Cash flow statement (€m)2008* 2009F 2010F 2011F 2012F 2013F 2014FNet profit 0 (93) 225 295 347 362 377Net result before tax (261) 0 0 0 0 0 0Share of results of associates 81 9 0 0 0 0 0Net finance expense 127 49 0 0 0 0 0Adj for unrealised valuation gains and losses 337 354 (19) (126) (154) (126) (129)<strong>Real</strong>ised gains and losses on disposals 18 1 0 0 0 0 0Depreciation 12 6 0 0 0 0 0Movement in receivables 45 15 (1) (17) (17) (8) (8)Movement in payables (24) 22 2 23 23 10 10Movements in provisions (1) 0 0 0 0 0 0Finance expenses (140) (52) 0 0 0 0 0Finance income 5 3 0 0 0 0 0Tax paid (2) (1) 0 0 0 0 0CF from operations 199 218 207 175 199 238 250Proceeds from sale of investment property 106 38 0 0 0 0 0Proceeds from sale of discontinued operations 632 0 0 0 0 0 0Acquisition of investment property (543) (201) 0 0 0 0 0Investment in investment property (115) (12) 0 0 0 0 0Investment in other investments of a non current nature (69) 7 0 0 0 0 0Investment in investment property under development (156) (37) (410) (110) 0 0 0Investment in property, plant and equipment (3) (3) 0 0 0 0 0Investment in subsidiaries and associates (6) 0 0 0 0 0 0Dividends received 11 9 0 0 0 0 0CF from Investments (143) (222) (410) (110) 0 0 0Proceeds from loans and borrowings 678 176 350 137 32 (18) (29)Repayments of loans and borrowings (564) (265) 0 0 0 0 0Dividends paid (172) (105) (202) (206) (210) (214) (218)Issue of shares 0 254 0 0 0 0 0CF from financing (58) 84 149 (69) (178) (232) (247)Net cash flow (2) 80 (55) (4) 21 6 3Opening cash balance 13 11 90 36 31 53 59Closing cash balance 11 90 36 31 53 59 62* We calculate our estimates on a quarterly cycle. As Corio does not provide a breakdown of its quarterly cash flow we have opted for a different cash flowstatement model for our 2009 estimates and further.Source: Company data, ING estimatesFig 26 Per share data(€)2008 2009F 2010F 2011F 2012F 2013F 2014FNumber of shares EOP (m) 66.3 76.4 76.4 76.4 76.4 76.4 76.4Average weighted no of shares (m) 66.3 72.1 76.4 76.4 76.4 76.4 76.4Direct result per share-group share 3.08 3.02 2.73 2.79 3.15 3.32 3.48Indirect result per share-group share (6.69) (4.28) 0.21 1.05 1.37 1.40 1.43Net result per share-group share (3.61) (1.28) 2.84 3.87 4.65 4.78 4.96Shareholders equity reported (group share) 52.2 44.8 45.1 46.3 48.1 50.0 52.1Deferred tax 4.1 5.0 4.9 4.7 4.5 4.3 4.0Change loans to market value 2.2 0.4 0.4 0.4 0.4 0.4 0.4Deferred tax (nominal) (0.5) (0.4) (0.4) (0.4) (0.4) (0.4) (0.4)EPRA NNNAV 57.9 49.7 50.0 51.0 52.6 54.3 56.1Dividend per share (€) 2.64 2.64 2.69 2.75 2.80 2.86 2.91Source: Company data, ING estimates131
_<strong>Benelux</strong> <strong>Real</strong> <strong>Estate</strong> February 2010Fig 27 Quarterly profit and loss (€m)4Q08 1Q09 2Q09 3Q09 4Q09F 1Q10F 2Q10F 3Q10F 4Q10FGross rental income 109 96 95 100 100 100 100 100 101Property operating expenses (12) (14) (13) (14) (14) (14) (14) (14) (14)Net rental income 98 82 83 86 86 86 86 86 87Administrative expenses (8) (10) (9) (8) (9) (9) (9) (9) (9)Operating income 90 72 74 78 77 77 77 77 77Share of profit of associates (direct) 4 2 3 2 2 2 2 2 2EBIT continuing operations 93 74 77 80 79 78 79 79 79Operating income discontinued operations (15) 0 0 0 0 0 0 0 0EBIT 78 74 77 80 79 78 79 79 79Interest income 0 0 0 0 0 0 0 0 0Interest expense 0 0 0 0 0 0 0 0 0Interest capitalized 0 0 0 0 0 0 0 0 0Net financing expenses (31) (22) (27) (23) (23) (24) (26) (28) (28)Corporate income tax 1 0 0 4 0 0 0 0 0Direct result 48 52 50 61 56 54 53 51 51Minority share (direct) 0 0 0 0 0 0 0 0 0Direct result (excluding minority share) 48 52 50 60 56 54 52 51 51Net valuation on investment property (274) (171) (170) (16) (12) (10) (10) 18 18Profit on disposal of investment property (3) (1) 0 (1) 0 0 0 0 0Share of profit of associates (indirect) (73) (15) 0 0 0 0 0 1 1Deferred tax expense 24 43 17 1 2 1 1 (3) (3)Net other income (18) 0 (3) (1) 0 0 0 0 0Indirect result continuing operations (346) (143) (156) (17) (11) (8) (8) 16 16Indirect result discontinued operations 26 0 0 0 0 0 0 0 0Indirect result (320) (143) (156) (17) (11) (8) (8) 16 16Minority share (indirect) 0 0 (2) (1) 0 0 0 0 0Indirect results (excluding minority share) (320) (143) (155) (16) (11) (8) (8) 16 16Net profit (including minority) (272) (91) (107) 44 45 46 44 67 67Net profit (excluding minority) (272) (91) (105) 45 45 46 44 67 67Source: Company data, ING estimates132
__<strong>Benelux</strong> <strong>Real</strong> <strong>Estate</strong> February 2010Fig 28 Quarterly cash flow statement (€m)4Q08 1Q09 2Q09 3Q09 4Q09F 1Q10F 2Q10F 3Q10F 4Q10FNet profit 0 0 0 0 45 46 44 67 67Net result before tax 0 0 0 0 0 0 0 0 0Share of results of associates 0 0 0 0 0 0 0 0 0Net finance expense 0 0 0 0 0 0 0 0 0Adj for unrealised valuation gains and losses 0 0 0 0 13 10 10 (19) (19)<strong>Real</strong>ised gains and losses on disposals 0 0 0 0 0 0 0 0 0Depreciation 0 0 0 0 0 0 0 0 0Movement in receivables 0 0 0 0 5 0 (1) (1) (1)Movement in payables 0 0 0 0 (1) (1) 1 1 1Movements in provisions 0 0 0 0 0 0 0 0 0Finance expenses 0 0 0 0 0 0 0 0 0Finance income 0 0 0 0 0 0 0 0 0Tax paid 0 0 0 0 0 0 0 0 0CF from operations 0 67 0 0 62 56 54 49 48Proceeds from sale of investment property 0 0 0 0 0 0 0 0 0Proceeds from sale of discontinued operations 0 0 0 0 0 0 0 0 0Acquisition of investment property 0 0 0 0 0 0 0 0 0Investment in investment property 0 0 0 0 0 0 0 0 0Investment in other investments of a non current nature 0 0 0 0 0 0 0 0 0Investment in investment property under development 0 0 0 0 0 (150) (110) (110) (40)Investment in property, plant and equipment 0 0 0 0 0 0 0 0 0Investment in subsidiaries and associates 0 0 0 0 0 0 0 0 0Dividends received 0 0 0 0 0 0 0 0 0CF from Investments 0 (77) 0 0 0 (150) (110) (110) (40)Proceeds from loans and borrowings 0 0 0 0 2 54 251 47 (3)Repayments of loans and borrowings 0 0 0 0 0 0 0 0 0Dividends paid 0 0 0 0 0 0 (202) 0 0Issue of shares 0 0 0 0 0 0 0 0 0CF from financing 0 0 0 0 2 54 50 47 (3)Net cash flow 0 (10) 0 0 64 (40) (6) (14) 6Opening cash balance 0 11 0 0 27 90 50 44 30Closing cash balance 0 1 0 0 90 50 44 30 36Note: Corio does not disclose detailed quarterly cash flow statement figures, hence the missing figures in the historical period.Source: Company data, ING estimatesFig 29 Quarterly per share data (€m)4Q08 1Q09 2Q09 3Q09 4Q09F 1Q10F 2Q10F 3Q10F 4Q10FNumber of shares EOP (m) 66.3 66.3 66.3 76.4 76.4 76.4 76.4 76.4 76.4Average weighted no of shares (m) 66.3 66.3 69.2 76.4 76.4 76.4 76.4 76.4 76.4Direct result per share-group share (€) 0.73 0.79 0.71 0.79 0.73 0.71 0.69 0.67 0.67Indirect result per share-group share (€) (4.83) (2.16) (2.23) (0.21) (0.14) (0.11) (0.11) 0.21 0.21Net result per share-group share (€) (4.10) (1.38) (1.51) 0.58 0.59 0.60 0.58 0.88 0.88Shareholders equity reported (group share) 52.2 50.2 0.0 44.2 44.8 45.4 43.3 44.2 45.1Deferred tax 4.1 4.0 0.0 3.0 3.0 5.0 5.0 5.0 4.9Change loans to market value 2.2 2.7 0.0 0.4 0.4 0.4 0.4 0.4 0.4Deferred tax (nominal) (0.5) (0.5) 0.0 (0.4) (0.4) (0.4) (0.4) (0.4) (0.4)EPRA NNNAV 57.9 56.5 0.0 47.2 47.8 50.4 48.3 49.2 50.0Dividend per share (€) 0 0 2.64 0 0 0 2.64 0 0Source: Company data, ING estimates133
<strong>Benelux</strong> <strong>Real</strong> <strong>Estate</strong> February 2010Fig 30 Multi development completions in the NetherlandsProject name City Country GLA offices GLA shopping GLA other No of houses CompletionBeverwaard Rotterdam Netherlands 5,500 1/1/84Zevenkamp Rotterdam Netherlands 9,000 111 1/2/93Bloeijendaal Utrecht Netherlands 10,000 1/2/93Lambertushof Hengelo Netherlands 1,100 1/2/93Osdorpplein Amsterdam Netherlands 4,000 56 1/3/93Paradijs Hoofddorp Netherlands 5,000 56 1/1/94Kopspijker Spijkenisse Netherlands 5,300 80 1/2/94Jacobsweerd Utrecht Netherlands 16,000 1/2/94Johan de Witt Den Haag Netherlands 14,000 1/2/94Multi Veste Gouda Netherlands 5,500 1/1/95Toshiba Gouda Netherlands 4,800 1/2/95Circus Almere Netherlands 6,700 1/2/95NDU Oosterflank Rotterdam Netherlands 18,500 1/7/96Middenhoven Amstelveen Netherlands 3,300 1/7/96Vitel Gouda Netherlands 5,100 1/7/96Achterveld IJsselstein Netherlands 2,000 39 1/9/96KPMG Den Haag Netherlands 15,000 8,000 1/9/96DDD Rotterdam Netherlands 12,500 7,100 1/9/96de Breul oudbouw Zeist Netherlands 2,200 1/9/96Westerhage Breda Netherlands 3,450 1/10/96T+T Rijnsweerd Utrecht Netherlands 10,000 5,900 1/10/96Zwarts Utrecht Netherlands 6,400 3,900 1/8/97Piazza Gouda Netherlands 5,300 3,500 1/9/97de Coener Amsterdam Netherlands 6,500 2,500 1/9/97Westblaak Rotterdam Netherlands 8,400 2,900 1/10/97de Ster Rotterdam Netherlands 12,500 6,100 1/10/97Plaza Rotterdam Netherlands 26,000 3,400 11,700 102 1/3/98Terminal Den Haag Netherlands 18,500 5,900 1/9/98Haagse Arc Den Haag Netherlands 22,500 9,000 1/9/98Rokkeveen I Zoetermeer Netherlands 3,900 76 1/9/99Tandem Hoofddorp Netherlands 10,000 3,600 1/10/99Compaq Gouda Netherlands 4,300 1,800 1/10/99Dam Utrecht Netherlands 7,700 1,000 1/11/99Bonnema Utrecht Netherlands 4,700 1/2/00Goverwelle Gouda Netherlands 6,200 84 1/3/00Rokkeveen II Zoetermeer Netherlands 4,000 77 1/3/00Almericain Almere Netherlands 3,130 12 1/4/00de Breul nieuwbouw Zeist Netherlands 12,000 8,000 1/6/00AH Hoofdkantoor Zaandam Netherlands 40,000 10,800 1/7/00Pal. v Justitie Den Haag Netherlands 22,000 1,230 1/10/00WC de Vlinder Emmen Netherlands 10,500 10 1/3/01Beursplein Rotterdam Netherlands 30,000 7,000 104 1/3/01Roodbeen Rijnsweerd Utrecht Netherlands 7,600 1/8/01Stadshart/Liesveld Vlaardingen Netherlands 11,900 24 1/8/01Utrechtsebaan Den Haag Netherlands 18,300 6,800 1/9/01Arthur Andersen Amstelveen Netherlands 7,400 1,900 1/10/01V&D Beursplein Rotterdam Netherlands 30,000 1/10/01Bruggebouw A Den Haag Netherlands 7,100 1/12/01Adelheidstraat Den Haag Netherlands 37 1/6/02Kalvertoren Amsterdam Netherlands 750 13,000 3,300 26 1/7/02Douanekantoor Rotterdam Netherlands 5,100 1/9/02Stationsplein Den Bosch Netherlands 5,700 1,600 2,000 16 1/9/02Loeffplein Den Bosch Netherlands 13,500 6,500 40 1/9/02Iglo / Ola Den Bosch Netherlands 5,700 1,200 1/1/03In de Boogaard Rijswijk Netherlands 700 3,500 7,000 36 1/4/03NIKE Hoofdkantoor Hilversum Netherlands 36,000 8,800 1/4/03Bruggebouw B Den Haag Netherlands 11,700 2,900 1/4/03Arthur Andersen Amstelveen Netherlands 6,500 1/5/03Stadshart St. Jorisplein Amersfoort Netherlands 15,500 9,000 70 1/9/03Blaak Rotterdam Netherlands 22,000 1/1/04Maanplein Den Haag Netherlands 95,000 34,000 1/2/04134
_<strong>Benelux</strong> <strong>Real</strong> <strong>Estate</strong> February 2010Fig 30 Multi development completions in the Netherlands (cont’d)Project name City Country GLA offices GLA shopping GLA other No of houses CompletionLampenier Den Bosch Netherlands 1,500 18 1/3/04Origin Groningen Netherlands 5,000 1/4/04SVB/EDS Utrecht Netherlands 21,000 2,300 1/6/04Origin Rijswijk Netherlands 11,500 2,400 1/7/04Statenplein Dordrecht Netherlands 10,000 29 1/9/04AXA Utrecht Netherlands 32,000 3,400 1/9/04Schaerweijderbossen Zeist Netherlands 59 1/10/04Kolfstraatblok Dordrecht Netherlands 3,400 8 1/3/05Van Heekplein Enschede Netherlands 10,350 10,300 31 1/7/05A10 Bridgebuilding North Amsterdam Netherlands 8,500 600 2,200 1/8/05Papendorp Origin Utrecht Netherlands 41,300 15,000 1/9/05Cap Gemini Utrecht Netherlands 50,000 31,800 1/9/05IBM Amsterdam Netherlands 34,000 6,000 1/10/05Trade Parc Westland Naaldwijk Netherlands 5,900 1/11/05HP Papendorp Utrecht Netherlands 38,700 21,100 1/4/06Gulden Winckelplantsoen Amsterdam Netherlands 11,800 12,000 1/4/06A10 overbouwing Zuid Amsterdam Netherlands 11,500 2,700 1/5/06Inter Access Hilversum Netherlands 11,200 2,500 1/6/06Boompjes Kantoortoren Rotterdam Netherlands 16,300 1/6/06Boompjes Parkeergarage Rotterdam Netherlands 1/8/06Ren. E&Y M. Meesweg Rotterdam Netherlands 8,500 25/9/06Spuimarkt Den Haag Netherlands 2,000 79 1/10/06Musiskwartier Arnhem Netherlands 21,700 75 1/10/06Hoochwoert Woerden Netherlands 8,201 86 1/11/06Entre Deux Maastricht Netherlands 11,800 19 1/11/06Brouwershof Offices Amersfoort Netherlands 14,250 1/11/06Entreegebouw A Arena Hilversum Netherlands 7,300 182 1/12/06Computer Associates Utrecht Netherlands 3,250 1/2/07KPN Papendorp Utrecht Netherlands 14,500 1/2/07De Leesten Zutphen Netherlands 3,100 58 1/3/07Spuimarkt Levi Lasse, C&A Den Haag Netherlands 21,400 1/5/07Veranda 16/17 Rotterdam Netherlands 5,000 1/9/07Centrumplan Hardenberg Hardenberg Netherlands 9,000 113 1/9/07Amstelwijck Looije Dordrecht Netherlands 3,000 1/9/07BDU gebouw Barneveld Netherlands 1,000 1/9/07Brouwershof Hotel Amersfoort Netherlands 6,100 1/10/07Cegelec Dordrecht Netherlands 3,800 1/10/07Veranda 14/15 Rotterdam Netherlands 4,000 1/10/07Amstelwijck Delta Dordrecht Netherlands 4,200 1/11/07Source: ING Research, Multi development135
<strong>Benelux</strong> <strong>Real</strong> <strong>Estate</strong> February 2010Fig 31 Multi development completions outside of the NetherlandsProject name City Country GLA offices GLA shopping GLA other No of houses CompletionVictoria Square Belfast United Kingdom 54,000 10,000 106 Feb-84Forum Bornova Izmir Turkey 58,600 3,200 Jan-85Forum Mersin Mersin Turkey 68,000 3,300 Feb-85Forum Camlik Denizli Turkey 27,500 4,500 Jan-86Forum Trabzon Trabzon Turkey 46,000 3,000 Feb-86Forum Ankara Ankara Turkey 48,000 31,000 Jan-87Forum Aydin Aydin Turkey 24,000 5,100 Jan-88Expo Sevilla Sevilla Spain Pavillion Feb-88Forum Leon Leon Spain 37,000 34,000 Mar-88Forum Girones Gerona Spain 39,900 47,800 Jan-89Espacio Torrelodones Madrid Spain 32,000 2,000 Feb-89Espacio Mediterraneo Cartagena Spain 29,500 8,500 Mar-89Espacio Buenavista Oviedo Spain 36,000 3,000 Apr-89Miraflores 1 / Arquiparque Lissabon Portugal 5,342 2,903 May-89Miraflores 3 / Arquiparque Lissabon Portugal 7,585 4,450 Jan-90Miraflores 8 / Arquiparque Lissabon Portugal 5,342 2,877 Feb-90Miraflores 2 / Arquiparque Lissabon Portugal 3,528 250 2,300 Mar-90Miraflores 4 / Arquiparque Lissabon Portugal 7,325 3,291 Apr-90Miraflores 9 / Arquiparque Lissabon Portugal 5,268 536 3,323 May-90Forum Aveiro Aveiro Portugal 700 18,220 30,000 56 Jan-91Miraflores 5 / Arquiparque Lissabon Portugal 11,800 3,300 Feb-91Chiado Lissabon Portugal 2,000 12,000 4,000 Mar-91Forum Algarve Faro Portugal 33,000 6,600 Apr-91Almada Lissabon Portugal 78,800 127,000 May-91Coimbra Retail Park Coimbra Portugal 25,000 Jan-92Forum Montijo Montijo Portugal 58,000 105,000 Feb-92Forum Madeira Madeira Portugal 19,700 23,000 Feb-92Forum Viseu Viseu Portugal 20,000 Mar-92Forum Coimbra Coimbra Portugal 900 30,000 5,000 Apr-92Forum Castelo Branco Castelo Branco Portugal 10,000 3,400 May-92Media Markt Gaia Portugal 6,000 Jun-92Forum Barreiro Barreiro Portugal 16,000 1,300 Jul-92Arquiparque II- building A Lisbon Portugal 4,800 350 Jan-93Forum Koszalin Koszalin Poland 49,000 5,000 Feb-93I Petali Di Reggio Reggio Emilia Italy 3,000 14,300 12,000 Mar-08Retail Parc Mestre Mestre Italy 9,500 800 Mar-08Kennedypark Dusseldorf Germany 14,100 5,900 Mar-08Clemens Galerien Solingen Germany 7,500 15,800 19,000 Apr-08Neutor Bocholt Germany 6,000 8,700 1,300 Apr-08Volme Galerie am Rathaus Hagen Germany 15,000 30,000 16,000 May-08Kamp Promenade Osnabruck Germany 2,300 13,400 5,000 Jun-08Schlossel Galerie Pforzheim Germany 2,400 17,500 Jun-08Liliencarre Wiesbaden Germany 3,500 23,600 3,279 Sep-08Forum Duisburg Duisburg Germany 800 56,000 1,700 Sep-08Les Quatre Chemins Vichy France 14,000 13,500 42 Sep-08La Vache Noire Arcueil France 35,900 4,000 Oct-08Plzn Phase II Plzen Czech Republic 8,000 Oct-08Olympia Plzen Czech Rep 32,400 Nov-08Olympia Olomouc Czech Rep 30,000 Nov-08Chodov Prague Czech Rep 52,800 Dec-08Parking Martinus Genk Belgium 5,900 Dec-08Abdijstraat Antwerp Belgium 13,100 8,500 Dec-08Multifunctioneel Centrum Oostende Belgium 16,500 Jan-09Stadsfeestzaal Antwerp Belgium 19,000 23 Sep-09Source: ING Research, Multi development136
_<strong>Benelux</strong> <strong>Real</strong> <strong>Estate</strong> February 2010NetherlandsEurocommercialPropertiesCiao bello! The dividend machineArjan KnibbeAmsterdam (31) 20 563 8780arjan.knibbe@ing.comJean-Yves DevlooAmsterdam (31) 20 563 8745jean-yves.devloo@ing.comInitiating coverageBuy<strong>Real</strong> <strong>Estate</strong>5 February 2010€28.8Target price€31.8ReutersECP seems to be sailing through the crisis: no need to repairits balance sheet, vacancies are
_<strong>Benelux</strong> <strong>Real</strong> <strong>Estate</strong> February 2010Investment caseEurocommercial is a retail property company with a strong focus on mediumsizedand large shopping centres in France, Italy and Sweden. The assetselection process of Eurocommercial has often struck us as slightly moredetailed and refined than that of its peers, perhaps because of its long traditionof excellent disclosure. Eurocommercial has no greenfield developments andfocuses on extensions. The portfolio has tripled in ten years throughacquisitions, extensions and valuation results to its current value of €2.3bn.Focus has been sharpened from a 74% retail weighting to 100% in 2009.HighlightsAt Eurocommercial, investors can still see the rent yield and valuation result per asset.We would appreciate a return to this disclosure at all property companies. Suchopenness, and the quality of the assets (that can be checked), is rewarded byinvestors by a premium for the shares.Apparent obsessionwith occupancy costratesOne of the recurrent themes of management is its apparent obsession with occupancycost ratios. These low percentages are often brought forward when new marketsincluding the UK are discussed. Wereldhave, which has recently chosen to go to UKretail from a virtual zero weighting in the past, may want to double-check those ratiosat the UK retail assets it is eyeing.Fig 1 Occupancy cost ratios and reversionary potential (%)Occupancy cost ratiosReversionary potentialFrance 7.6 8Italy 8.2 5Sweden 7.6 1Total 7.9Source: Company dataIf ECP included hypermarkets, occupancy costs would fall to 7.2%. The occupancycost ratios in Figure 1 are not comparable with the 11.3% that was reported by Unibail-Rodamco at its 1H results. The ECP number excludes hypermarkets, whereas Unibail-Rodamco includes hypermarkets and supermarkets, which have a lower occupancycost ratio than the boutiques in the Eurocommercial results. Unibail has also includedcinemas, fitness centres, supermarkets and department stores, but it excludes banks,pharmacies, travel agencies and tobacco stores. Eurocommercial has also excludedthese tenants.Ten DPS rises in a rowEurocommercial has raised its dividend per share for ten years in a row, and EPS hasgrown from €1.31 to 1.82 in the past ten years. These are impressive numbers, in ouropinion. We think that even when there is a temporary dip in recurring EPS in thecurrent book year, Eurocommercial will maintain its dividend per share.We believe that the secret behind this lies in the combination of sound and stablefinancial management, and a thorough asset selection and extension process. Thismanagement team has done an excellent job. Quarterly cash flow statements arenormal procedure.138
<strong>Benelux</strong> <strong>Real</strong> <strong>Estate</strong> February 2010SWOTFig 2SWOT analysisStrengthsExcellent record of EPS and DPS growthExtensive record in France and ItalyMost experienced real estate CFO in sectorExcellent disclosure on property levelCommunicative managementOpportunitiesEnter new marketsWeaknessesManagement almost ignores SRI reportingManagement teams in London and Amsterdam operating in France,Italy and Sweden. Potentially cost-inefficientThreats/RisksSwedish assets pose currency riskPossibly too small to exploit all economies of scaleSource: ING_RisksProperty companies arelow-risk, on averageBecause of the contractual nature of a large part of the recurring cash flows, propertycompanies are usually considered to have less risk than most other equity sectors.The risk of property companies has a close relationship to the amount of developmentexposure, the geographical and sector breakdown, corporate governance andalignment of interest between management and shareholders.DevelopmentEurocommercial specialises in creating extensions to existing centres. This results in alower level of risk than plain greenfield development. In general, the Eurocommercialpipeline has been well managed and has never disappointed, as far as we canremember.Lack of retail supply constraintsPlanning is relaxed inItaly and SwedenIn Eurocommercial’s core countries, planning is relaxed (Sweden), is somewhatrelaxed (Italy) or has recently become more relaxed (France). In the medium term, thismay lead to an oversupply of retail space, which in turn may lead to lower marketrents. We do not believe that this will be an obstacle in the near future, but it may hurtECP more than its peers with a heavy Dutch, German or UK retail weighting, whereplanning is on average stricter.SuccessionLonger Lewis staywould be good newsBut the matter shouldbe addressed to preventinternal or externalsurprisesCEO Jeremy Lewis is 64 years of age. At the AGM, he announced his desire tocontinue for quite a while, without quantifying if he was meant months or years.Management also said it has some ideas about succession, but that it is too early fordetails.We believe it would be good news if the CEO stayed on longer. At the same time, webelieve that there should be some clarity here as surprises are rarely good for shareprice performance. In addition, there is a risk that this management team, which ishighly regarded, would be disbanded if the succession is not resolved in a way thatsatisfies all team members. We believe this matter will be managed prudently, but itdoes bear a risk.139
_<strong>Benelux</strong> <strong>Real</strong> <strong>Estate</strong> February 2010Catalysts• Further acquisitions• Swedish krona movements• Eurocommercial has a 30 June book year. 1H results are due on 5 Feb• News about succession schedule or planningOutlookNo eyes on “fringes ofAsia”At the AGM, management was cautiously optimistic. Much will depend on the increasein inflation and bond yield movements. ECP believes that unemployment is a keydriver of shopping centre turnover. The rents are sustainable, given the low occupancycost ratios. Management plans not to go to the “fringes of Asia”. It has also repeatedthat southern Italy is a no-go area for ECP. Bear in mind that Corio owns a very largeshopping centre in Marcianise, near Naples. Sweden has priority with extensions, andacquisitions must be earnings-enhancing.ConsensusFig 3 Consensus recurring EPS estimates (€)2008/09 2009/10F 2010/11F 2011/10FConsensus 1.82 1.81 1.97 1.97ING 1.82 1.76 1.90 2.07Difference from consensus 0.00 (0.05) (0.07) 0.10Difference (%) 0.0 -2.7 -3.6 4.9Source: ReutersWe are 5% and 7% below consensus in 2009/10 and 2010/11, but we have a 5% EPSestimate above the 2011/12 consensus.Our estimates and assumptionsWe have not adjusted for currency changes. The Swedish €40m, 8% yield on costVaxjo retail development, due for completion in May 2011 and 80% pre-let, is takeninto account. The recent French and Italian acquisitions have started to contribute toJanuary 2010. We are running a LFL rental growth rate of c.4% for most years except2010F, when we expect indexation in France and Sweden will be weak.140
__<strong>Benelux</strong> <strong>Real</strong> <strong>Estate</strong> February 2010Company profileInvestment portfolioFig 4 Portfolio breakdown by country including Dec 2009 acquisitions30 June 2009 Acquisitions Total (%)France 780 59 839 38Italy 882 40 922 41Sweden 471 471 21Total 2,133 99 2,232 100Source: Company data, ING estimatesFigure 4 gives the breakdown of the portfolio as of 30 June and includes the December2009 acquisitions.Fig 5 Portfolio breakdown by type of retail Fig 6 Portfolio breakdown by countryCity centregalleries &shops21%Retail parks4%Sweden21%France38%Suburbancentres75%Italy41%Source: Company data, ING estimatesSource: Company data, ING estimates_Type of retailEurocommercial has most of its portfolio in suburban centres. After the inclusion of therecent acquisition, this exposure amounts to 76%. Given this breakdown and the factthat prime high street retail on average shows fewer vacancies than suburban centres,the 1% vacancy rate is all the more remarkable, and shows the very strong assetselection skills of this management team. One could also argue that it does not pushthe tenants hard enough, but the fact that ECP has not made a single rent reduction inthe past year proves that this is untrue.Fig 7 Portfolio breakdown by type of retail, incl. recent acquisitions(%) Value (€m) Acquisitions Value (€m) (%)Suburban centres 75 1,599.75 99 1,698.75 76City centre galleries & shops 21 447.93 447.93 20Retail parks 4 85.32 85.32 4Total 2,133 2,232Source: Company data, ING estimatesRecent acquisitions were done at yields of 6.5% in Moisselles, 15km north of St Denis,Paris, and 6.4% in Modena, Italy. Figure 6 illustrates the yield used for ECP’s leadingcentres, which range between 5.3% and 5.9%. ECP’s largest assets are CentroCarosello, just outside Milan, with a value of €265m, and Passage du Havre, in centralParis, valued at €243m.141
_<strong>Benelux</strong> <strong>Real</strong> <strong>Estate</strong> February 2010Fig 8Eurocommercial’s top ten assetsName City Value(€m)Valuation result(%)Net yield incl. purch. cost(%)Passage du Havre Paris 243 -11.9 5.3Passy Plaza Paris 117 -7.7 5.6Les Atlantes Tours Tours 111 -8.6 5.5Il Castello Ferrara 101 7.4 5.8I Gigli Firenze 225 -10.5 5.7Carosello Carugate, MI 265 10.1 5.3Burlov Center Malmo 105 -6.5 5.6Curno Bergamo 97 -5.5 5.4421 Goteborg 70 -9.5 5.7Ingelsta Shopping Center Norrkoping 83 21.2 5.9Total top ten 1,418Source: Company data_Breakdown by tenantFigure 9 shows the top ten tenants. We believe this is a solid list of tenants, who areunlikely to go bust.Fig 9 Top-ten tenants and turnover by country and sectorTenant % of rent Sales turnover 30 June 2008-30 June 2009 (%)Carrefour 4.2 Overall -1.1ICA Sverige 4.2 France -2.6H&M 4.1 Italy -0.8Groupe Casino 3.6 Sweden 0.1Mediamarkt 3.3 Fashion -0.8Fnac 3.2 Gifts and jewellery 3.9Coin Spa 2.0 Health and beauty 2.1Inditex 1.7 Home goods -2.0Vis Pathé 1.7 Restaurants 1.1Co-op Sverige AB 1.6 Electricals -6.9Hyper/supermarkets 1.1Source: Company data_Like-for-like rental growthEurocommercial posted LFL rental growth of 4.5% in the 12 months preceding30 September 2009. This compares with 4.5% for Unibail Retail, 1.8% for the retailportfolio of Corio and c.0.6% for VastNed Retail.Fig 10 Like-for-like rental growth (%)Like-for-like12m precedingEurocommercial 4.50 30-Sep-09Eurocommercial France 4.10 30-Sep-09Eurocommercial Italy 5.00 30-Sep-09Eurocommercial Sweden 4.20 30-Sep-09Corio Retail 1.80 30-Sep-09VastNed Retail 0.60 30-Sep-09Unibail Retail 4.50 30-Jun-09Unibail Retail France 5.80 30-Jun-09Unibail Retail Nordic 1.90 30-Jun-09Source: Company data, ING estimatesWe believe that LFL rental growth is still not the mathematical formula it should be. Inparticular, a company can take centres in and out of the sample, in order to obtain abetter growth figure.142
<strong>Benelux</strong> <strong>Real</strong> <strong>Estate</strong> February 2010Corporate governanceShares have beenconverted intocertificates, removingpower fromshareholdersEurocommercial shares convert into certificates authorised by the StichtingAdministratiekantoor regulatory body, and these trade at one certificate to 10 shares.As a result, it would be difficult but not impossible to engineer a takeover of thecompany. We have not noticed any trading discount so far, probably because investorsare fairly happy with the performance of the management team. When shareholders donot take up their voting rights, in effect they are transferred automatically tomanagement. As a result, the power of a small minority remains limited. TheTabaksblatt Commission of Dutch corporate governance supports this structure.We do not advocate a monopoly of shareholders on corporate governance.Nevertheless, in principle we oppose the certification of shares and we would demanda discount for it, because it transfers power from shareholders to management and notto other stakeholders.Priority sharesIn addition to the certification, Eurocommercial has priority shares outstanding, whichis not in line with Dutch best practice corporate governance.ManagementChief executive, Jeremy Lewis• By profession a chartered surveyor, Mr Lewis was a founding director of thecompany in 1991. He has more than 30 years’ international experience runningquoted property investment vehicles.Finance director. Evert Jan van Garderen• Evert Jan van Garderen, a Dutch national and graduate of Erasmus UniversityRotterdam, joined the company in 1994. He is a qualified lawyer and charteredaccountant.Director, Peter Mills• Peter Mills joined Eurocommercial in 1993 and is the director responsible for thecompany's investments in the Netherlands and Sweden. Before joiningEurocommercial, he worked for major international property consultants coveringthe UK and European investment markets. Mr Mills is a chartered surveyor, havingread land economy at Cambridge University.Director, Tom Newton• Having acquired experience in the property markets of the UK, Australia andFrance, Tom Newton joined Eurocommercial in 1992. Since then he has beeninvolved in the acquisition programme in France and Italy, and is now responsiblefor the French portfolio. Tom Newton has a degree in modern languages fromDurham University, and is a chartered surveyor.Director, Tim Santini• Tim Santini joined Eurocommercial in 1994 and is the director responsible for theItalian activities of the company. Before joining Eurocommercial, he was with theretail team of a major international property consultant in London, working onprojects in the UK and continental Europe. Mr Santini speaks French and Italian,and is a chartered surveyor.143
__<strong>Benelux</strong> <strong>Real</strong> <strong>Estate</strong> February 2010FinancialsFig 11 Profit and loss accounts (€m)Yr to June 2008/09 2009/10F 2010/11F 2011/12F 2012/13F 2013/14F 2014/15FRental income 134.2 140.0 153.8 163.1 171.8 181.1 190.9Service charges income 21.1 22.9 24.3 25.8 27.0 28.3 29.7Service charges expenses (24.2) (26.1) (27.7) (29.4) (30.8) (32.3) (33.8)Property expenses (16.7) (17.0) (19.1) (20.2) (21.4) (22.6) (23.8)Net property income 114.4 119.8 131.3 139.2 146.6 154.6 163.0Disposal of investment properties (0.3) 0.0 0.0 0.0 0.0 0.0 0.0Investment revaluation (208.1) 4.5 92.2 120.3 126.4 106.1 54.9Interest income 0.4 (0.1) (0.3) (0.3) (0.2) (0.1) 0.0Interest expenses (44.7) (43.5) (45.5) (45.9) (46.0) (46.1) (46.1)Interest capitalised 3.4 1.3 1.8 1.8 1.8 1.8 1.8Total interest (40.8) (42.3) (44.0) (44.4) (44.4) (44.4) (44.3)Fair value movement derivatives (86.7) (8.8) 0.0 0.0 0.0 0.0 0.0Net financing cost (127.5) (51.1) (44.0) (44.4) (44.4) (44.4) (44.3)Company expenses (8.5) (9.5) (10.8) (11.4) (12.0) (12.7) (13.4)Investment expenses (1.3) (1.7) (2.3) (2.4) (2.6) (2.7) (2.9)Result before taxation (231.2) 62.0 166.4 201.2 214.1 200.9 157.4Corporate income tax 0.0 0.0 0.0 0.0 0.0 0.0 0.0Deferred tax 50.5 (1.7) (18.4) (24.1) (25.3) (21.2) (11.0)Result after taxation (180.7) 60.3 148.0 177.1 188.8 179.7 146.4Total direct result 65.1 68.0 76.6 83.3 90.2 97.5 105.3Total indirect result (245.8) (7.7) 71.4 93.8 98.6 82.1 41.1Recurring cash flow 60.4 64.9 72.5 79.1 85.9 93.0 100.6Recurring net profit 63.8 66.3 74.3 80.9 87.6 94.8 102.4Source: ING estimatesFig 12 Per share data (€)Yr to June 2008/09 2009/10F 2010/11F 2011/12F 2012/13F 2013/14F 2014/15FNo. of depositary receipts representing shares after 35,840,442 40,303,499 40,303,499 40,303,499 40,303,499 40,303,499 40,303,499deduction of depositary receipts brought backAverage number of depositary receipts 35,797,301 38,629,853 40,303,499 40,303,499 40,303,499 40,303,499 40,303,499Direct result per depositary receipt 1.82 1.76 1.90 2.07 2.24 2.42 2.61Indirect result per depositary receipt (6.87) (0.20) 1.77 2.33 2.45 2.04 1.02Total result per depositary receipt (5.05) 1.56 3.67 4.40 4.68 4.46 3.63IFRS NAV per depositary receipt 28.82 28.29 30.25 32.75 35.36 37.58 38.80Adjusted NAV per depositary receipt 33.05 32.33 34.76 37.85 41.09 43.84 45.32Dividend (€) 1.78 1.78 1.90 2.07 2.24 2.42 2.61Source: ING estimates144
_<strong>Benelux</strong> <strong>Real</strong> <strong>Estate</strong> February 2010Fig 13 Balance sheet (€m)As at 30 June 2008/09 2009/10F 2010/11F 2011/12F 2012/13F 2013/14F 2014/15FProperty investments 2,125.1 2,277.1 2,380.7 2,501.0 2,627.5 2,733.5 2,788.5Property investments under development 11.7 12.0 12.0 12.0 12.0 12.0 12.0Tangible fixed assets 1.6 1.5 1.5 1.5 1.5 1.5 1.5Receivables 1.4 1.3 1.3 1.3 1.3 1.3 1.3Derivative financial instruments 1.0 0.2 0.2 0.2 0.2 0.2 0.2Total fixed assets 2,140.8 2,292.0 2,395.6 2,516.0 2,642.4 2,748.5 2,803.4Property held for sale 0.0 0.0 0.0 0.0 0.0 0.0 0.0Receivables 23.4 1.7 1.8 1.9 2.0 2.1 2.2Cash and deposits 7.8 37.2 68.6 80.4 92.8 105.8 119.7Total current assets 31.2 38.8 70.4 82.3 94.8 107.9 121.9Total assets 2,172.0 2,330.8 2,466.0 2,598.3 2,737.2 2,856.4 2,925.3Corporate tax payable 0.0 0.0 0.0 0.0 0.0 0.0 0.0Creditors 63.7 69.8 75.4 79.4 83.7 88.2 93.0Borrowings 55.8 54.8 67.5 71.1 74.9 78.9 83.2Total current liabilities 119.6 124.6 142.8 150.5 158.6 167.2 176.3Creditors 10.0 9.8 9.8 9.8 9.8 9.8 9.8Borrowings 857.3 892.8 912.0 912.0 912.0 912.0 912.0Derivative financial instruments 60.6 68.3 68.3 68.3 68.3 68.3 68.3Deferred tax liabilities 90.9 94.9 113.4 137.4 162.7 183.9 194.9Provision for pensions 0.4 0.4 0.4 0.4 0.4 0.4 0.4Total fixed liabilities 1,019.4 1,066.3 1,103.9 1,128.0 1,153.3 1,174.5 1,185.5Total liabilities 1,139.0 1,190.9 1,246.7 1,278.5 1,311.9 1,341.6 1,361.7Issued share capital 179.9 0.0 0.0 0.0 0.0 0.0 0.0Share premium reserve 324.8 0.0 0.0 0.0 0.0 0.0 0.0Other reserves 709.1 0.0 0.0 0.0 0.0 0.0 0.0Undistributed income (180.7) 0.0 0.0 0.0 0.0 0.0 0.0Equity 1,033.1 1,140.0 1,219.2 1,319.8 1,425.3 1,514.7 1,563.6Total equity and liabilities 2,172.0 2,330.8 2,466.0 2,598.3 2,737.2 2,856.4 2,925.3IFRS net equity per balance sheet 1,033.1 1,140.0 1,219.2 1,319.8 1,425.3 1,514.7 1,563.6Deferred tax liabilities 90.9 94.9 113.4 137.4 162.7 183.9 194.9Derivative financial instruments 60.6 68.2 68.2 68.2 68.2 68.2 68.2Adjusted net equity 1,184.6 1,303.1 1,400.8 1,525.4 1,656.2 1,766.9 1,826.7Source: ING estimates145
_<strong>Benelux</strong> <strong>Real</strong> <strong>Estate</strong> February 2010Fig 14 Cash flow statement (€m)Yr to June 2008/09 2009/10F 2010/11F 2011/12F 2012/13F 2013/14F 2014/15FTotal investment result (180.7) 60.3 148.0 177.1 188.8 179.7 146.4Adjustments 0.0 0.0 0.0 0.0 0.0 0.0 0.0Change in receivables 11.5 21.2 (0.1) (0.1) (0.1) (0.1) (0.1)Increase in creditors 19.8 15.2 5.6 4.0 4.3 4.5 4.8Movement stock options 1.0 0.2 0.0 0.0 0.0 0.0 0.0Investment revaluation 209.8 (6.2) (92.2) (120.3) (126.4) (106.1) (54.9)Property sale result 0.3 0.0 0.0 0.0 0.0 0.0 0.0Derivative financial instruments 86.7 8.8 0.0 0.0 0.0 0.0 0.0Deferred tax (50.5) 1.7 18.4 24.1 25.3 21.2 11.0Other movements (net interest) 0.1 32.0 44.0 44.4 44.4 44.4 44.3Capital gains tax (8.1) 0.0 0.0 0.0 0.0 0.0 0.0Derivative financial instruments 0.0 (0.7) 0.0 0.0 0.0 0.0 0.0Interest paid (39.8) (41.6) (43.7) (44.1) (44.2) (44.3) (44.3)Interest received 0.4 (0.1) (0.3) (0.3) (0.2) (0.1) 0.0CFO 50.4 90.9 79.8 84.8 91.8 99.2 107.1Property acquisitions (15.0) (99.1) 0.0 0.0 0.0 0.0 0.0Capital expenditure (87.2) (20.3) (11.4) 0.0 0.0 0.0 0.0Property sale 134.2 0.0 0.0 0.0 0.0 0.0 0.0Additions to tangible fixed assets (0.8) (0.1) 0.0 0.0 0.0 0.0 0.0CFI 31.3 (119.5) (11.4) 0.0 0.0 0.0 0.0Proceeds issued shares 0.0 98.8 0.0 0.0 0.0 0.0 0.0Borrowings added 203.1 72.1 31.8 3.6 3.8 4.0 4.3Repayment of borrowings (230.4) (49.3) 0.0 0.0 0.0 0.0 0.0Dividends paid (59.0) (63.7) (68.8) (76.6) (83.3) (90.2) (97.5)Stock options exercised 0.5 0.0 0.0 0.0 0.0 0.0 0.0Depositary receipts brought back 0.0 0.0 0.0 0.0 0.0 0.0 0.0Increase in non-current creditors (0.7) (0.3) 0.0 0.0 0.0 0.0 0.0CFF (86.5) 57.6 (36.9) (72.9) (79.5) (86.2) (93.2)Net cash flow (4.8) 29.0 31.4 11.9 12.3 13.1 13.8Currency differences on cash and deposits (1.2) 0.4 0.0 0.0 0.0 0.0 0.0Decrease in cash and deposits (6.0) 29.4 31.4 11.9 12.3 13.1 13.8Cash and deposits at beginning of year 13.8 7.8 37.2 68.6 80.4 92.8 105.8Cash and deposits at end of year 7.8 37.2 68.6 80.4 92.8 105.8 119.7Source: ING estimates146
__<strong>Benelux</strong> <strong>Real</strong> <strong>Estate</strong> February 2010Fig 15 Quarterly profit and loss account (€m)Yr to June 2008/09 1Q09/10 2Q09/10F 1H09/10F 3Q09/10F 9M09/10F 4Q09/10F 2009/10FRental income 134.2 33.3 33.8 67.1 36.2 103.3 36.7 140.0Service charges income 21.1 6.3 5.3 11.6 5.6 17.3 5.7 22.9Service charges expenses (24.2) (7.1) (6.1) (13.2) (6.4) (19.6) (6.5) (26.1)Property expenses (16.7) (3.8) (4.2) (8.0) (4.5) (12.5) (4.5) (17.0)Net property income 114.4 28.7 28.9 57.6 30.9 88.5 31.4 119.8Disposal of investment properties (0.3) 0.0 0.0 0.0 0.0 0.0 0.0 0.0Investment revaluation (208.1) (1.7) (38.3) (40.0) 0.0 (40.0) 44.5 4.5Interest income 0.4 0.0 0.0 0.0 (0.1) (0.1) 0.0 (0.1)Interest expenses (44.7) (10.3) (10.8) (21.1) (11.1) (32.4) (11.1) (43.5)Interest capitalised 3.4 0.0 0.4 0.4 0.4 0.9 0.4 1.3Total interest (40.8) (10.3) (10.4) (20.7) (10.8) (31.6) (10.7) (42.3)Fair value movement derivatives (86.7) (8.8) 0.0 (8.8) 0.0 (8.8) 0.0 (8.8)Net financing cost (127.5) (19.1) (10.4) (29.5) (10.8) (40.4) (10.7) (51.1)Company expenses (8.5) (2.0) (2.4) (4.4) (2.5) (6.9) (2.6) (9.5)Investment expenses (1.3) (0.1) (0.5) (0.6) (0.5) (1.2) (0.6) (1.7)Result before taxation (231.2) 5.7 (22.6) (16.9) 17.0 0.0 62.0 62.0Corporate income tax 0.0 0.0 0.0 0.0 0.0 0.0 0.0 0.0Deferred tax 50.5 (0.5) 7.7 7.2 0.0 7.2 (8.9) (1.7)Result after taxation (180.7) 5.2 (15.0) (9.7) 17.0 7.2 53.1 60.3Total direct result 65.1 16.4 16.1 32.5 17.6 49.9 18.1 68.0Total indirect result (245.8) (11.1) (31.1) (42.2) (0.5) (42.7) 35.0 (7.7)Recurring cash flow 60.4 16.2 15.2 31.4 16.6 47.8 17.1 64.9Recurring net profit 63.8 16.2 15.6 31.9 17.0 48.7 17.6 66.3Source: Company data, ING estimatesFig 16 Quarterly per share data (€)Yr to June 2008/09 1Q09/10 2Q09/10F 1H09/10F 3Q09/10F 9M09/10F 4Q09/10F 2009/10FNo of depositary receipts representing shares after 35,840,442 35,840,442 40,303,499 40,303,499 40,303,499 40,303,499 40,303,499 40,303,499deduction of depositary receipts brought backAverage number of depositary receipts 35,797,301 35,840,442 38,071,971 36,956,206 40,303,499 38,071,971 40,303,499 38,629,853Direct result per depositary receipt 1.82 0.46 0.42 0.88 0.44 1.31 0.45 1.76Indirect result per depositary receipt (6.87) (0.31) (0.82) (1.14) (0.01) (1.12) 0.87 (0.20)Total result per depositary receipt (5.05) 0.15 (0.39) (0.26) 0.42 0.19 1.32 1.56IFRS NAV per depositary receipt 28.82 29.29 26.55 26.55 26.97 26.97 28.29 28.29Adjusted NAV per depositary receipt 33.05 33.81 30.37 30.37 30.80 30.79 32.34 32.33Dividend 1.78 0 0 0 0 0 0 1.78Source: Company data, ING estimates147
_<strong>Benelux</strong> <strong>Real</strong> <strong>Estate</strong> February 2010Fig 17 Quarterly balance sheet (€m)2008/09 1Q09/10 2Q09/10F 1H09/10F 3Q09/10F 9M09/10F 4Q09/10F 2009/10FProperty investments 2,125.1 2,154.6 2,221.2 2,221.2 2,226.9 2,226.9 2,277.1 2,277.1Property investments under development 11.7 12.0 12.0 12.0 12.0 12.0 12.0 12.0Tangible fixed assets 1.6 1.5 1.5 1.5 1.5 1.5 1.5 1.5Receivables 1.4 1.3 1.3 1.3 1.3 1.3 1.3 1.3Derivative financial instruments 1.0 0.2 0.2 0.2 0.2 0.2 0.2 0.2Total fixed assets 2,140.8 2,169.5 2,236.1 2,236.1 2,241.8 2,241.8 2,292.0 2,292.0Property held for sale 0.0 0.0 0.0 0.0 0.0 0.0 0.0 0.0Receivables 23.4 25.9 1.5 1.5 1.5 1.5 1.6 1.6Cash and deposits 7.8 12.6 8.5 8.5 19.2 19.2 30.2 30.3Total current assets 31.2 38.5 10.0 10.0 20.7 20.7 31.8 31.8Total assets 2,172.0 2,208.0 2,246.1 2,246.1 2,262.5 2,262.6 2,323.8 2,323.8Corporate tax payable 0.0 0.0 0.0 0.0 0.0 0.0 0.0 0.0Creditors 63.7 68.3 64.0 64.0 64.7 64.7 65.4 65.4Borrowings 55.8 54.8 54.8 54.8 54.8 54.8 54.8 54.8Total current liabilities 119.6 123.1 118.9 118.9 119.6 119.6 120.3 120.3Creditors 10.0 9.8 9.8 9.8 9.8 9.8 9.8 9.8Borrowings 857.3 862.8 892.8 892.8 892.8 892.8 892.8 892.8Derivative financial instruments 60.6 68.3 68.3 68.3 68.3 68.3 68.3 68.3Deferred tax liabilities 90.9 93.7 93.7 93.7 93.7 93.7 93.7 93.7Provision for pensions 0.4 0.4 0.4 0.4 0.4 0.4 0.4 0.4Total fixed liabilities 1,019.4 1,035.0 1,065.0 1,065.0 1,065.0 1,065.0 1,065.0 1,065.0Total liabilities 1,139.0 1,158.2 1,183.9 1,183.9 1,184.6 1,184.6 1,185.3 1,185.3Equity 1,033.1 1,049.9 1,063.4 1,063.4 1,079.1 1,079.2 1,139.7 1,139.7Total equity and liabilities 2,172.0 2,208.0 2,247.3 2,247.3 2,263.7 2,263.8 2,325.0 2,325.0IFRS net equity per balance sheet 1,033.1 1,049.9 1,063.4 1,063.4 1,079.1 1,079.2 1,139.7 1,139.7Deferred tax liabilities 90.9 93.7 93.7 93.7 93.7 93.7 93.7 93.7Derivative financial instruments 60.6 68.2 68.2 68.2 68.2 68.2 68.2 68.2Adjusted net equity 1,184.6 1,211.7 1,225.3 1,225.3 1,241.0 1,241.0 1,301.6 1,301.6Source: ING estimates148
_<strong>Benelux</strong> <strong>Real</strong> <strong>Estate</strong> February 2010Fig 18 Quarterly cash flow statement (€m)Yr to June 2008/09 1Q09/10 2Q09/10F 1H09/10F 3Q09/10F 9M09/10F 4Q09/10F 2009/10FTotal investment result (180.7) 5.2 (15.0) (9.7) 17.0 7.2 53.1 60.3Adjustments 0.0 0.0 0.0 0.0 0.0 0.0 0.0 0.0Change in receivables 11.5 (3.0) 24.4 21.4 (0.1) 21.3 0.0 21.2Increase in creditors 19.8 13.7 (4.0) 9.7 4.5 14.2 1.0 15.2Movement stock options 1.0 0.2 0.0 0.2 0.0 0.2 0.0 0.2Investment revaluation 209.8 0.0 38.3 38.3 0.0 38.3 (44.5) (6.2)Property sale result 0.3 0.0 0.0 0.0 0.0 0.0 0.0 0.0Derivative financial instruments 86.7 8.8 0.0 8.8 0.0 8.8 0.0 8.8Deferred tax (50.5) 0.5 (7.7) (7.2) 0.0 (7.2) 8.9 1.7Other movements (net interest) 0.1 0.2 10.4 10.6 10.8 21.4 10.7 32.0Capital gains tax (8.1) 0.0 0.0 0.0 0.0 0.0 0.0 0.0Derivative financial instruments 0.0 (0.7) 0.0 (0.7) 0.0 (0.7) 0.0 (0.7)Interest paid (39.8) (9.8) (10.3) (20.2) (10.7) (30.9) (10.7) (41.6)Interest received 0.4 0.0 0.0 0.0 (0.1) (0.1) 0.0 (0.1)CFO 50.4 15.1 36.0 51.1 21.4 72.4 18.5 90.9Property acquisitions (15.0) 0.0 (99.1) (99.1) 0.0 (99.1) 0.0 (99.1)Capital expenditure (87.2) (3.2) (5.7) (8.9) (5.7) (14.6) (5.7) (20.3)Property sale 134.2 0.0 0.0 0.0 0.0 0.0 0.0 0.0Additions to tangible fixed assets (0.8) (0.1) 0.0 (0.1) 0.0 (0.1) 0.0 (0.1)CFI 31.3 (3.2) (104.8) (108.0) (5.7) (113.8) (5.7) (119.5)Proceeds issued shares 0.0 0.0 98.8 98.8 0.0 98.8 0.0 98.8Borrowings added 203.1 42.1 30.0 72.1 0.0 72.1 0.0 72.1Repayment of borrowings (230.4) (49.3) 0.0 (49.3) 0.0 (49.3) 0.0 (49.3)Dividends paid (59.0) 0.0 (63.7) (63.7) 0.0 (63.7) 0.0 (63.7)Stock options exercised 0.5 0.0 0.0 0.0 0.0 0.0 0.0 0.0Depositary receipts brought back 0.0 0.0 0.0 0.0 0.0 0.0 0.0 0.0Increase in non-current creditors (0.7) (0.3) 0.0 (0.3) 0.0 (0.3) 0.0 (0.3)CFF (86.5) (7.5) 65.1 57.6 0.0 57.6 0.0 57.6Net cash flow (4.8) 4.3 (3.7) 0.6 15.7 16.2 12.8 29.0Currency differences on cash and deposits (1.2) 0.4 0.0 0.4 0.0 0.4 0.0 0.4Decrease in cash and deposits (6.0) 4.7 (3.7) 1.0 15.7 16.5 12.8 29.4Cash and deposits at beginning of year 13.8 7.8 12.6 7.8 8.8 7.8 24.5 7.8Cash and deposits at end of year 7.8 12.6 8.8 8.8 24.5 24.4 37.3 37.2Source: ING estimates149
<strong>Benelux</strong> <strong>Real</strong> <strong>Estate</strong> February 2010This page is left blank intentionally150
_<strong>Benelux</strong> <strong>Real</strong> <strong>Estate</strong> February 2010BelgiumHome InvestBelgiumBrussels residential playJean-Yves DevlooAmsterdam (31) 20 563 8745jean-yves.devloo@ing.comArjan KnibbeAmsterdam (31) 20 563 8780arjan.knibbe@ing.comInitiating coverageSell<strong>Real</strong> estate5 February 2010€54.2Target price (12 month)€48.0ReutersHIB focuses on the Brussels residential market. With a 9%average total return over ten years, it outperforms ourBelgian universe, except WDP. We believe lot-for-lotdisposals offer attractive returns. We initiate with a SELLand €48 TP based on a 5% discount to 2010F IFRS NAV.We believe that Home Invest Belgium should try to grow in order to get oninvestors’ radar screens and reel in the economies of scale that are possiblewith a larger portfolio. We would also like to see HIB publish its results inEnglish.Key ratios and forecasts2008 2009F 2010F 2011F 2012FEPS adj (€) 2.33 2.06 2.11 2.16 2.20PER (x) 23.3 26.4 25.7 25.1 24.6Net yield (%) 5.9 6.0 6.2 6.3 6.5IFRS NAV (€) 52.7 51.4 50.5 50.3 50.0EPRA NNNAV (€) N/A N/A N/A N/A N/AP/IFRS NAV (€) 1.0 1.1 1.1 1.1 1.1DPS (€) 2.36 2.43 2.48 2.53 2.58Dividend yield (%) 4.4 4.5 4.6 4.7 4.8CFPS (€) 2.37 2.06 2.11 2.16 2.20LTV (%) 28.9 29.7 30.4 30.8 31.2Source: Company data, ING estimates12-month forecast returns (%)Share price -11.4Dividend 4.612m f'cst total return -6.8Key ratios (%)2008 2009FRental growth 14.7 1.0Operating margin 65.7 65.7Occupancy rate 96.0 96.0Share dataNo of shares (€m) 2.8Daily turnover (shares, 3M) 800Free float (%) 62.4Enterprise value (€m) 215.4Market cap (€m) 154.9Share price performance6555453525151/08 7/08 1/09 7/09 1/10PriceBEL 20 (rebased)Source: ING151
<strong>Benelux</strong> <strong>Real</strong> <strong>Estate</strong> February 2010Investment caseHome Invest Belgium is a property investor in Brussels, specialising in furnishedand unfurnished rental apartments. The company owns a €210m portfolio, 70%of which are apartments; 76% of the portfolio is located in Brussels. Theportfolio is relatively new, with 66% less then 10 years old. The company’slargest single property asset is the 8,152m 2 Lambermont building inSchaerbeek, northern Brussels, worth c.9% of the portfolio.HighlightsOvervaluedGood network, wellchosen sub-marketsDividend yield low andlease lengths shortSRI potentialWe believe that HIB is overvalued: the current price does not reflect the low liquidity ofthe shares and this company is probably operating significantly below its most efficientscale.We have no reason to believe management is not doing a good job. We believe it isresponsive and straightforward, and well connected to the right networks of residentialdevelopers, investors and tenants. We believe HIB’s focus on the middle segmentmakes sense, as re-letting is a core activity in this market.Our price target of €48 is based on a 5% discount to 2010F IFRS NAV of €50.50. Thedividend yield of 4.4% is lower than that of its office peers, Cofinimmo and Befimmo,which also offer a relatively secure income as leases have significantly longerdurations.We believe that at its inception, HIB would fit an SRI profile well, but with the companyat its current size it probably makes little sense to spend time on this issue.152
<strong>Benelux</strong> <strong>Real</strong> <strong>Estate</strong> February 2010Fig 1 SWOT analysisStrengthsUpper midmarket segment focus limits exposure to troubled tenants.In 2008, total rent defaults were 1.2% of total rents receivedLot-for-lot sales have become possible over the last couple of yearsStrong track record: an annual average IRR of 13% since creation(1999) has been realised (assuming reinvestment of dividends)Large and diversified tenant base: most important tenant accountedfor a mere 2.7% of FY08 rentsFully internalised asset management and portfolio managementEconomic crisis has hurt the residential buyers’ market, driving morepeople to rent housesRecently started developing for own account (apartment site in SintGillis)Simple contract structure, resulting in absence of significantincentivesOpportunitiesVery low debt ratio enables large capacity for leveraged acquisitionswhen opportunities arise.Asset management for third partiesBecause of the crisis, fewer people are willing to step into theresidential transactional market and are placing their focus on theletting market.Public private partnership that foresees in social housing, a marketthat is c.50% undersupplied in BrusselsAdd more developmentsWeaknessesPortfolio is too small in relation to management expenses, resultingin a low operating marginLow stock liquidity and limited free floatCorporate reports not in EnglishLimited EPRA reporting complianceThreats/RisksWeak outlook for the furnished apartments segment (substantialdecrease in number of expats) likely to hurt the occupancy rate ofthis part of the portfolio (11%)Source: ING_RisksProperty companies arelow-risk, on averageBecause of the contractual nature of a large part of the recurring cash flows, propertycompanies are usually considered to have less risk than most other equity sectors.The risk to property companies bears a strong relation to the amount of developmentexposure, the geographical and sectoral breakdown, corporate governance andalignment of interest between management and shareholders.Tenant riskHIB’s largest tenant pays only 2.7% of total rental income. This risk seems limited, inour view.Catalysts• Acquisitions, paid in shares or cash• Letting market developments• Year-end results on 6 March 2010• Delivery of the Brussels developments• Merger of takeover transactions153
_<strong>Benelux</strong> <strong>Real</strong> <strong>Estate</strong> February 2010Company profileBelgium’s focusedapartment REITHome Invest Belgium (HIB) was created and quoted by ING and Fortis in 1999, with amission to create an upper midmarket residential real estate portfolio, located primarilyin the Brussels region (mainly in the centre and east). In mid-2009, HIB had a portfolioworth €210m, totalling 918 individual units, with an area of c.105,000m² let to almost1,000 tenants. HIB carries the status of “residential Sicafi” (a requirement of having>60% of assets invested in residential real estate), resulting in a dividend withholdingtax exemption at the shareholder level, which is meant to be compensation for theresidential registration tax that is payable by the owner instead of the tenant.Fig 2 Geographical spread of assets (%) Fig 3 Typological spread of assets (%)Flandersregion9%Brusselsregion74%Walloonregion17%Furnishedappartments11%Retail assets14%HousesOffices 7% Senior homes2%7%Unfurnishedappartments59%Source: Company dataSource: Company dataHIB’s investment strategy is multi-faceted:• Investment in residential assets resulting in an immediate yield accretion or futurefair value gain potential, among others by lot for lot disposals• Assets with a minimum size of €3m for buildings and €5m for portfolios• Liquidate individual apartment units in order to facilitate future lot-for-lot disposals• Preferably located in the Brussels region, Antwerp, Ghent, Leuven and Namur. Aminimum number of inhabitants of 50,000 is required.Increased focus onarbitrationSince 2006, HIB has searched for arbitration possibilities that consist of the disposal ofsmaller buildings, ground lots destined for construction of upmarket assets andbuildings that can be sold at a large fair value gain. In terms of acquisitions, HIB says itwill invest only in assets with a maximum age of 10 years, unless the assets inquestion have recently been renovated. At end-2008, almost 67% of total buildingswere less than 10 years old. This strategy has been chosen in order to optimise futuregains from active lot-for-lot disposals. In the long term, these lot-for-lot sales aretargeted at an average of c.5% of the total portfolio per year.154
__<strong>Benelux</strong> <strong>Real</strong> <strong>Estate</strong> February 2010Fig 4 Spread according to age of buildings> 20 years5%11-20 years28%< 5 years37%6-10 years30%Source: Company dataLot-for-lot sales in orderto compensate for lowyield or to become morefocused…Lot-for-lot sales have been done for assets that are either no longer strategic or haveyields that are too low and have the potential to generate a large fair value gain onsale.Fig 5 Transactions during 1H09 (€000)Sales pricenet of transactioncostsAcquisitionvalue plusinvestmentsNet realisedcapital gainsNet realised capitalgain as % of initialacquisition valueLatestfair valueNet realised capitalgain as % of latestfair valueRomanza Residence 521.1 291.5 229.5 78.8 406.0 28.4Nieuport 385 166.8 166.8 130.8 167.1 130.4Source: Company data…while on track tobecome a specialist inunfurnished apartmentsTypical Belgian leasecontract applies,absence of incentivesFurnished apartmentsmay be disposed ofInternal managementstructure results inefficiencesHIB’s aim is to become a specialist investor in residential unfurnished apartments andhouses in the mid market and upper midmarket segment, in areas that are consideredas top location, or which may very well become top location in future. The other assettypes that belong to HIB’s portfolio should not be considered as strategic growth areas.Standard lease contracts are on a nine-year basis, keeping in mind that an individualresidential tenant can cancel a lease at three months’ notice. If cancellation occurswithin three years of renewal of the contract, an indemnity has to be paid. Leasecancellations totalled c.0.4% and 0.6% of total rents in 2007 and 2008 respectively.Furnished apartments are not core to the strategy: HIB has only one building of fullyfurnished and serviced apartments, namely the Résidences du Quartier Européen,situated in central Brussels and consisting of 50 lots (average size 86m²). Totaloccupancy rate has decreased to 75% at present. Aedifica’s furnished apartmentoccupancy stands at c.86% (INGF).HIB is fully internally managed, which is reflected in lower management costscompared with the portfolio and gross rents. Efficiencies in terms of property costsseem to be less clear.155
<strong>Benelux</strong> <strong>Real</strong> <strong>Estate</strong> February 2010Low operating marginsare caused partly bysmaller assetsFigure 6 illustrates that the smaller assets are more management-intensive than thelarger assets. As a consequence, an increased focus on lot-for-lot sales of thesesmaller assets may result in improved efficiency and better operating margins.Fig 6 Operating charges versus gross rents (%)%40353025201510502007 2008 2007 2008 2007 2008 2007 2008total portfolio small buildings buildings < €2,5m Buildings > €2,5mOperating charges/gross rents (LH)Source: Company data_Corporate governanceManagementCEO Xavier Mertens• 54 years old• CEO since 2002• Previous experience at Fortis AG real estate asset management and at AnhypBank (manager, lending department)• Former Brussels lawyer• Masters degrees in law, business analysis and executive education in managementCFO Jean-Luc Colson• 35 years old• CFO since 2004• Previous experience at ING <strong>Real</strong> <strong>Estate</strong> (Belgium), financial management and atAXA (real estate asset management)• Degree in accounting156
_<strong>Benelux</strong> <strong>Real</strong> <strong>Estate</strong> February 2010ShareholdersFig 7 Shareholder structureVOP Group22%Free Float55%Axa Belgium15%ARCO Group4%AssuranceFédérales4%Source: BloombergVOP Group has been a shareholder since the contribution in kind related to theLambermont building (2008). Axa, Assurances Fédérales and Arco Group are alsolong-term shareholders. The free float is 55%.157
__<strong>Benelux</strong> <strong>Real</strong> <strong>Estate</strong> February 2010FinancialsFig 8 Profit and loss account (€m)2008 2009F 2010F 2011F 2012F 2013F 2014FGross rents 11.9 12.0 12.2 12.5 12.8 13.1 13.4Rental expenses (0.2) (0.2) (0.2) (0.2) (0.2) (0.2) (0.2)Net rents 11.7 11.8 12.0 12.3 12.6 12.9 13.2Recuperation of costs (0.7) (0.7) (0.7) (0.7) (0.7) (0.7) (0.8)Property result 11.0 11.1 11.3 11.6 11.9 12.2 12.5Total property costs (2.8) (2.8) (2.8) (2.9) (2.9) (3.0) (3.1)Operational result 8.3 8.4 8.5 8.7 8.9 9.1 9.4General costs (0.5) (0.5) (0.5) (0.5) (0.5) (0.5) (0.5)Operational result before portfolio result 7.8 7.9 8.0 8.2 8.4 8.6 8.8FV on investment properties (1.3) (2.8) (1.5) 0.1 0.2 0.4 0.4Operational result after portfolio result 7.3 5.1 6.6 8.3 8.7 9.0 9.2Financial revenues 0.5 0.5 0.5 0.5 0.5 0.4 0.4Interest expenses (2.5) (2.6) (2.6) (2.7) (2.7) (2.8) (2.8)Net interest (1.9) (2.1) (2.1) (2.2) (2.2) (2.3) (2.4)Other financial expenses (0.1) 0.0 0.0 0.0 0.0 0.0 0.0Total financial result (2.0) (2.1) (2.1) (2.2) (2.2) (2.3) (2.4)Result before taxes 5.3 2.9 4.4 6.1 6.4 6.7 6.8Corporate tax 0.0 0.0 0.0 0.0 0.0 0.0 0.0Exit tax 0.0 0.0 0.0 0.0 0.0 0.0 0.0Net result 5.3 2.9 4.4 6.1 6.4 6.7 6.8Source: Company data, ING estimatesFig 9 Per share data (€)2008 2009F 2010F 2011F 2012F 2013F 2014FAvg. no. of shares with full entitlement (m) 2,475,725 2,790,465 2,790,465 2,790,465 2,790,465 2,790,465 2,790,465Net result per share 2.13003 1.045872 1.580321 2.192052 2.290238 2.384668 2.422997Net recurring result per share 2.327739 2.055973 2.108044 2.157634 2.203507 2.245518 2.283569Result on the portfolio per share (0.197709) (1.010101) (0.527724) 0.034418 0.086732 0.13915 0.139428Proposed dividend 2.36 2.43 2.4786 2.528172 2.578735 2.63031 2.682916IFRS NAVPS 52.7 51.4 50.5 50.3 50.0 49.8 49.6Recurring CFPS 2.37 2.06 2.11 2.16 2.20 2.25 2.28Recurring EPS 2.37 2.06 2.11 2.16 2.20 2.25 2.28Source: Company data, ING estimates158
_<strong>Benelux</strong> <strong>Real</strong> <strong>Estate</strong> February 2010Fig 10 Balance sheet (€m)2008 2009F 2010F 2011F 2012F 2013F 2014FIntangible fixed assets 0.0 0.0 0.0 0.0 0.0 0.0 0.0Investment properties 198.1 195.3 193.8 193.9 194.1 194.5 194.9Developments 9.6 9.6 9.6 9.6 9.6 9.6 9.6Other fixed assets 0.1 0.1 0.1 0.1 0.1 0.1 0.1Financial fixed assets 0.1 0.1 0.1 0.1 0.1 0.1 0.1Financial lease receivables 1.5 1.5 1.5 1.5 1.5 1.5 1.5Total fixed assets 209.3 206.5 205.0 205.1 205.4 205.8 206.1Assets held for sale 0.6 0.7 0.7 0.7 0.7 0.7 0.7Financial lease receivables 0.1 0.1 0.1 0.1 0.1 0.1 0.1Trade receivables 0.8 0.8 0.8 0.8 0.8 0.9 0.9Tax receivables and other current assets 2.0 2.0 2.1 2.1 2.2 2.2 2.3Cash and equivalent 1.5 3.1 2.2 3.3 2.4 3.5 2.5Deferred charges and accrued income 0.1 0.1 0.1 0.1 0.1 0.1 0.1Total current assets 5.1 6.8 5.9 7.1 6.3 7.5 6.6Total assets 214.4 213.3 211.0 212.2 211.7 213.2 212.7Total equity 147.1 143.4 141.1 140.3 139.6 139.0 138.5Long-term financial debt 61.5 64.0 64.0 66.0 66.0 68.0 68.0Other long-term debt 2.1 2.1 2.1 2.1 2.1 2.1 2.1Total long-term debt 63.7 66.1 66.1 68.1 68.1 70.1 70.1Short-term financial debt 0.5 0.5 0.5 0.5 0.5 0.5 0.5Trade debt and other debt 1.6 1.7 1.7 1.8 1.8 1.8 1.9Other short-term obligations 1.3 1.3 1.3 1.4 1.4 1.4 1.5Accrued charges and deferred income 0.2 0.2 0.2 0.3 0.3 0.3 0.3Total short-term debt 3.7 3.7 3.8 3.9 4.0 4.1 4.2Total liabilities 67.3 69.8 69.9 72.0 72.1 74.2 74.3Total equity and liabilities 214.4 213.3 211.0 212.2 211.7 213.2 212.7Source: Company data, ING estimates159
_<strong>Benelux</strong> <strong>Real</strong> <strong>Estate</strong> February 2010Fig 11 Cash flow statements (€m)2008 2009F 2010F 2011F 2012F 2013F 2014FOperational result after portfolio result 7.3 5.1 6.6 8.3 8.7 9.0 9.2Interest received 0.5 0.5 0.5 0.5 0.5 0.4 0.4Interest paid (2.5) (2.6) (2.6) (2.7) (2.7) (2.8) (2.8)Taxes 0.0 0.0 0.0 0.0 0.0 0.0 0.0Non-cash adjustments 0.0 0.0 0.0 0.0 0.0 0.0 0.0Depreciations and write-downs on fixed assets 0.0 0.0 0.0 0.0 0.0 0.0 0.0FV change in investment properties 1.3 2.8 1.5 (0.1) (0.2) (0.4) (0.4)Gain on sales on fixed assets 0.0 0.0 0.0 0.0 0.0 0.0 0.0Gain on sales on investment properties (0.8) 0.0 0.0 0.0 0.0 0.0 0.0Total non-cash adjustments 0.5 2.8 1.5 (0.1) (0.2) (0.4) (0.4)Working capital changes 0.0 0.0 0.0 0.0 0.0 0.0 0.0Asset items 0.7 (0.1) (0.1) (0.1) (0.1) (0.1) (0.1)Liability items 0.3 0.0 0.1 0.1 0.1 0.1 0.1Total 1.0 0.0 0.0 0.0 0.0 0.0 0.0CF from operations 6.8 5.7 5.9 6.0 6.2 6.3 6.4Cash to investments (0.2) 0.0 0.0 0.0 0.0 0.0 0.0Cash to acquisitions 0.0 0.0 0.0 0.0 0.0 0.0 0.0Cash from sales 2.1 0.0 0.0 0.0 0.0 0.0 0.0Project developments (6.4) 0.0 0.0 0.0 0.0 0.0 0.0Other fixed assets 0.0 0.0 0.0 0.0 0.0 0.0 0.0Long-term financial assets 0.0 0.0 0.0 0.0 0.0 0.0 0.0Acquisition of subsidiaries (5.0) 0.0 0.0 0.0 0.0 0.0 0.0CF from investing (9.6) 0.0 0.0 0.0 0.0 0.0 0.0Change in financial debt 8.8 2.5 0.0 2.0 0.0 2.0 0.0Change in capital (0.1) 0.0 0.0 0.0 0.0 0.0 0.0Dividend previous year (5.0) (6.6) (6.8) (6.9) (7.1) (7.2) (7.3)Change in FV of financial assets and liabilities 0.0 0.0 0.0 0.0 0.0 0.0 0.0CF from financing 3.8 (4.1) (6.8) (4.9) (7.1) (5.2) (7.3)Net cash movement 0.9 1.6 (0.9) 1.1 (0.9) 1.1 (1.0)Cash BOP 0.6 1.5 3.1 2.2 3.3 2.4 3.5Cash EOP 1.5 3.1 2.2 3.3 2.4 3.5 2.5Source: Company data, ING estimates160
__<strong>Benelux</strong> <strong>Real</strong> <strong>Estate</strong> February 2010BelgiumLeasinvest <strong>Real</strong><strong>Estate</strong>Diversifying into LuxembourgJean-Yves DevlooAmsterdam (31) 20 563 8745jean-yves.devloo@ing.comArjan KnibbeAmsterdam (31) 20 563 8780arjan.knibbe@ing.comInitiating coverageHold<strong>Real</strong> <strong>Estate</strong>5 February 2010€62.3Target price (12 month)€60.0ReutersLNRE.BRLRE is Belgium’s diversified offices, retail and logisticscompany that has recently shown strong stability. We seelittle upside potential given its already high occupancy rate,over-rented portfolio and rising cost of financing. HOLD.LRE is looking to underweight its offices portfolio and increase its weight inretail, achieving a balanced portfolio between Belgium and Luxembourg. Theincreased development exposure has added stability to the portfolio, but wesee a low likelihood of LRE catching near-term positive rent reversion.Sensitivity of our 2010F EPS to vacancy rate and total LFLVacancy rate (%)2.5 3.5 4.5 5.5 6.5 7.5 8.5 9.5-3 5.41 5.30 5.20 5.09 4.99 4.88 4.78 4.67-2 5.51 5.40 5.30 5.19 5.09 4.98 4.88 4.77LFL (%) -1 5.61 5.51 5.40 5.30 5.19 5.09 4.98 4.881 5.71 5.61 5.50 5.40 5.29 5.19 5.08 4.982 5.82 5.71 5.61 5.50 5.40 5.29 5.19 5.083 5.92 5.81 5.71 5.60 5.50 5.39 5.29 5.184 6.02 5.91 5.81 5.70 5.60 5.49 5.39 5.285 6.12 6.02 5.91 5.81 5.70 5.60 5.49 5.39Source: ING estimatesKey ratios and forecasts2008 (18m) 2009F 2010F 2011F 2012FEPS adj (€) 6.6 5.0 5.4 5.5 5.6PER (x) 14.1 12.4 11.6 11.4 11.1Net yield (%) 7.1 7.5 7.9 8.0 8.1IFRS NAV per share (€) 65.9 63.7 63.2 65.3 67.7EPRA NNNAV per share (€) N/A N/A N/A N/A N/AP/IFRS NAV (%) 0.94 0.98 0.98 0.95 0.92DPS (€) 3.9 4.0 4.1 4.2 4.3Dividend yield (%) 6.2 6.4 6.6 6.8 6.9LTV (%) 46.9 49.6 48.8 47.2 45.412-month forecast returns (%)Share price -4.6Dividend 6.612m f'cst total return 2.0Key ratios (%)2008 2009FRental growth 11.0 4.3Operating margin 80.1 79.5Occupancy rate 97.2 96.5Share dataNo of shares (m) 4.1Daily turnover (shares, 3M) 1,600Free float (%) 34Enterprise value (€m) 499.2Market cap (€m) 252.5Share price performance90807060504030201/08 7/08 1/09 7/09 1/10Source: INGPriceBEL 20 (rebased)Source: Company data, ING estimates161
<strong>Benelux</strong> <strong>Real</strong> <strong>Estate</strong> February 2010Investment caseLeasinvest <strong>Real</strong> <strong>Estate</strong> is looking to divest its Belgian offices portfolio (valued atc.€160m), which we rate as secondary, and it wants to invest the proceeds inretail assets spread over Belgium and Luxembourg, becoming a balancedparticipant between Belgium and Luxembourg. LRE has walked a successfulpath during the crisis by: (1) making opportunistic acquisitions; and(2) (re)developing assets supporting portfolio resilience and optimal occupancyrates. LRE is looking for acquisition opportunities that allow it to become morediversified in offices and retail in Belgium and Luxembourg. It is consideringselling its Belgian secondary offices portfolio and investing the proceeds in retailassets. Looking at an already high occupancy rate and a slightly over-rentedportfolio, we believe it is unlikely LRE will reap any fruits from its cyclicalexposure.SWOTFig 1 SWOT analysisStrengths(Re)developments have brought c.€30m of realised and unrealisedcapital gains over the last two years, supporting occupancy andportfolio valuation. Developments are capped at 10% of the portfolio.Exposure to the troubled financial sector in Luxembourg remainslimited thanks to a favourable diversification into retail and logisticsOpportunitiesDisposal of secondary Belgian offices portfolio and acquire a largeretail portfolio with the proceeds.Acquisition of assets in Luxembourg with considerable(re)development potential.WeaknessesShort debt duration will force refinancing at higher margins.Externally managed.Limited free float at 34%.Complex corporate governance structure (CV instead of NV).Large influence of Ackermans & van Haaren on management.Quality of financial reporting, not in accordance with EPRA bestpractices recommendations.Threats/risksFurther deterioration of the real estate market will primarily affectthe secondary Belgian offices portfolio, lowering the probability of anear-term sale.Source: ING_RisksBecause of the contractual nature of a large part of the recurring cash flows, propertycompanies are usually considered to have less risk than most other equity sectors.The risk of property companies bears a strong relation to the amount of developmentexposure, geographical and sector breakdown, corporate governance and alignment ofinterest between management and shareholders.Principally an investorWe believe that LRE is a low-risk property company. It is principally an investor, whichis the least risky activity of the four core real estate company activities: investment,development, trading and asset management. LRE’s secondary offices and industrialportfolio add some risk that is to be compensated by the diversification intoLuxembourg and into retail assets.162
<strong>Benelux</strong> <strong>Real</strong> <strong>Estate</strong> February 2010Tenant riskLRE’s largest tenants are Wolters Kluwer (logistics, 6.6% of rental value) and L’Oreal(offices, 5.8%), two tenants that carry low risk, in our view.Accounting for leasesThere are accounting initiatives that may lead to the obligation of tenants to accountlong leases as a liability in their balance sheets. This may put pressure in future on theaverage lease lengths of real estate companies and LRE.No currency risksAll rents and expenses are done in euros, so there are no currency risks.CatalystsWe see the following catalysts:• Disposal of the secondary Belgian offices portfolio at a good price• Refinancing at an acceptable margin• Internalisation of management• Large (re)development project• FY09 results on 19 February 2010OutlookIn the 1H09 results press release, LRE stated that it expects a higher net recurringresult for FY09 compared with FY08. No numerical guidance has been given. Weexpect a full year per share recurring net result of €5.12, influenced positively by theacquisition of the Metro retail assets at end-2008.ValuationWe value LRE on a 5% discount to its 2010F IFRS NAV, generating a target price of€60.0. Dividend yield 6.6% looks sustainable and is based on a low, sub-80% payoutrate. Note that the 80% dividend legal distribution requirement is only related to theBelgian portfolio and not to the proceeds from the Luxembourg portfolio.Our estimates and assumptions1) VacanciesFig 2 Our vacancy assumptions (%)2009F 2010F 2011F 2012FOffices 4.5 6.0 5.0 4.5Logistics and semi-industrial 2.0 3.0 2.5 2.0Retail 1.0 2.0 1.0 1.0Total 3.5 4.7 3.9 3.4Source: ING estimates2) Like-for-like rental growth: includes CPI indexation, incentives and renegotiations163
__<strong>Benelux</strong> <strong>Real</strong> <strong>Estate</strong> February 2010Fig 3 Our total LFL assumptions (%)2009F 2010F 2011F 2012FOffices -1.5 -1.0 -0.5 0.0Logistics and semi-industrial -0.8 0.0 1.5 2.0Retail -1.5 1.5 2.0 2.0Total -1.3 -0.5 0.3 0.8Source: ING estimates3) Portfolio valuationFig 4 Our portfolio valuation assumptions (%)2009F 2010F 2011F 2012FBelgium -3.0 -2.0 0.0 0.0Luxembourg -2.0 -1.0 0.5 0.5Total -2.6 -1.6 0.2 0.2Source: ING estimates164
__<strong>Benelux</strong> <strong>Real</strong> <strong>Estate</strong> February 2010Company profileStarted with Brixtonoffices in 1999Leasinvest <strong>Real</strong> <strong>Estate</strong> (LRE) was listed on the Euronext Brussels stock exchange in1999. LRE originally was an investor in office buildings, notably by the incorporation ofthe Brixton portfolio in 1999.Fig 5 Portfolio per type of assets (end-2008) Fig 6 Portfolio per region and type (end-2008)Retail16%RetailBelgium4%RetailLuxembourg12%OfficesBrussels27%LogisticsLuxembourg4%Logistics21%Offices63%LogisticsBelgium17%OfficesAntwerp0.5%OfficesMechelen5%Offices Gent8%OfficesLuxembourg23%Source: Company dataSource: Company dataExternally managedLRE is externally managed by LRE Management, a 100% subsidiary of the Belgiumbased industrial holding, Ackermans van Haaren (AvH), which played an important rolein the foundation of LRE, and retains a 30% stake. Four of the 11 directors representAvH. LRE has 17 employees. As statutory manager, LRE receives an annualmanagement fee of c.41.5bp of the total portfolio value.Fig 7 Organisation structure and major shareholdersAckermans & van Haaren AXA Belgium AG Insurance Publiek30.01% 28.99% 7.36% 33.23%0.40%Leasin vest <strong>Real</strong> <strong>Estate</strong>(4.012.832)0.01%100% 100% 99%Leasinvest Immo Lux Leasinvest Immo Lux Conseil Leasinvest Services NVSource: Company dataDiversified into retail andLuxembourg in 2006……profiting fromdistressed salesLRE made its first expansion into the Grand Duchy of Luxembourg in 2006, byacquiring the
__<strong>Benelux</strong> <strong>Real</strong> <strong>Estate</strong> February 2010a relatively high occupancy rate of c.96.5%, LRE has showed solid performancerecently.Stepping away fromoffices to retail in orderto become a diversifiedparticipant…LRE recently decided to decrease its weight in offices to the advantage of retail assets,more specifically, retail parks (LRE has retail warehouses in Luxembourg andZaventem and the Brussels decentralised area), among others in order to lower overallcapex requirements. LRE wants to manage its €200m portfolio of Belgian officesdynamically (of which €130m are in the Brussels decentralised area and periphery)and, if possible, it will divest a substantial part of the offices in future.Fig 8 Portfolio overview (Brussels)Source: Company data…creating additionalvalue with c.5-10%developmentsLRE’s business model has been resilient during the crisis thanks to the realisation ofc.€40m in gains at four different development projects in Belgium and Luxembourg(average yield on cost 12-13%).Fig 9 Recent (re)developmentsNameCost/investment(€m)Gain(%)Gain(€m)DateYield on cost(%)DescriptionCFM site 6.6 (extensioninvestment)14.4 (unrealised) 1H08 12-13 Luxembourg office and warehouse extensionfor tenant, still in portfolioBian 11.8 15.2 (realised) 1H09 12-13 Extension and redevelopment of an office inLuxembourg, sold to the Luxembourg PostMontimmo 12.8 >2.0, unrealised (INGestimate, to be2H09 6.5 Redevelopment of an office in Luxembourg,fully leased since December 2009confirmed)Source: Company data, ING estimatesSmall peer groupLRE’s main peers were Cofinimmo and Befimmo. Since the recent diversification intoretail assets, a comparison with both Intervest offices and Intervest Retail (the twoBelgian REIT subsidiaries of Dutch funds VastNed Offices and VastNed Retail) makes166
__<strong>Benelux</strong> <strong>Real</strong> <strong>Estate</strong> February 2010more sense. The growing focus on retail parks also makes a comparison with BelgianREIT Retail <strong>Estate</strong>s (Not Rated) more useful.Fig 10 LRE offices versus Cofinimmo and BefimmoLRE Cofinimmo BefimmoDiversified company (offices and retail)Diversified company (offices, pubs andnursing homes)Pure-play offices90% corporate tenants 10% public tenants c.35% public tenants c.64% public tenantsOffices are in secondary locationsDiversified over Brussels and Luxembourg(the latter being less subject to anoverheated supply); Brussels is not astrategic area for growthSource: Company dataOffices are mostly on primary locations(taken together with an overweight position inthe Brussels decentralised area)Offices are primarily focused in Brussels(also a small part in Antwerp)Offices are almost all in prime locationsOffices are primarily in Brussels, theFedimmo portfolio also involves someoffices in regional cities (all government let)Fig 11 Top-ten assets according to FY07/08 estimated rental value (€m)Name Type Floor area(000m²)% of portfoliosurfaceERV(€m)% of portfolioERVOccupancy rate(%)Axxes BP Office Gent 23.7 6.9 3.6 9.0 92Riverside BP Office Brussels 21.6 6.3 2.9 7.4 80Strassen Retail Luxembourg 22.7 6.6 2.3 5.8 100Lenniksebaan Office Brussels 15.1 4.4 2.3 5.7 100WKB Office Mechelen 14.2 4.1 2.1 5.3 100Avenue Louise 250 Office Brussels 9.9 2.9 1.9 4.7 99Rue Montoyer 63 Office Brussels 6.7 2.0 1.8 4.4 100Prins Boudewijnlaan 7 Logistics Belgium 27.6 8.0 1.6 4.1 100EBBC Offices Luxembourg 4.5 1.3 1.6 3.9 96Brixton BP Logistics Belgium 21.7 6.3 1.5 3.7 95Subtotal 167.8 48.6 21.5 53.9Total portfolio 345.3 39.9 97.3Source: Company dataFig 12 Yield and duration as of end-2008 Fig 13 Lease duration overview as of end-20089876543210Offices LRE Logistics LRE Retail LRE Total LREYield (%)Remaining duration (years)10090807060504030201000-3 years 3-6 years 6-9 years
_<strong>Benelux</strong> <strong>Real</strong> <strong>Estate</strong> February 2010Corporate governanceManagementCEO, Jean Louis Appelmans• 56 years old• CEO of LRE since 1989• Independent director at Retail <strong>Estate</strong>s (Belgian pure play retail REIT, Not Rated)• Previously corporate banker at Crédit Lyonnais Belgium and Chase ManhattanBankCOO, Michel Van Geyte• 43 years old• COO since 2004• Previously managing partner at Knight FrankCorporate secretary, group counsel and compliance officer, Micheline Paredis• 42 years old• Employed by LRE since 2000• Previous experience as a candidate notaryCFO, Sophie Wuyts• 35 years old• CFO since 2007• Previously controller at Ackermans & van HaarenShareholdersFig 14 ShareholdersFree float34%Ackermans & VanHaaren30%AG Insurance7%Axa29%Source: BloombergAckermans & van Haaren (AvH) has been a shareholder since inception. Both Axa andAvH are long-term shareholders. Free float 34%.AvH has appointed four directors to the board, while Axa has appointed three. Four ofthe 11 directors are independent.LRE has only done business with the construction subsidiary of AvH twice: theconstruction of an archive leased to public sector in Bruges (€18m) and theconstruction of another building in Antwerp.168
_<strong>Benelux</strong> <strong>Real</strong> <strong>Estate</strong> February 2010FinancialsFig 15 Profit and loss (€m)2008 (18m) 2009F 2010F 2011F 2012F 2013F 2014FNet rents 48.9 41.9 43.8 44.3 44.9 45.3 45.6Property result before property expenses 49.2 41.9 43.8 44.3 44.9 45.3 45.6Total property expenses (7.5) (6.3) (6.6) (6.6) (6.7) (6.8) (6.8)Operational property result after property expenses 41.8 35.6 37.2 37.6 38.1 38.5 38.8General costs (2.8) (2.3) (2.4) (2.4) (2.5) (2.5) (2.5)Operational result before portfolio result 39.2 33.3 34.8 35.2 35.7 36.0 36.3Result on sale of properties 3.6 0.0 0.0 0.0 0.0 0.0 0.0FV variation on investment properties 13.4 (14.0) (8.8) 1.2 1.2 1.2 1.2Operational result after portfolio result 56.2 19.4 26.0 36.4 36.9 37.2 37.5Financial gains 4.9 0.1 0.2 0.2 0.3 0.4 0.6Interest expenses (16.3) (12.0) (11.9) (12.0) (12.1) (12.1) (12.2)Interest capitalised 0.0 0.0 0.0 0.0 0.0 0.0 0.0Net interest costs (11.4) (11.9) (11.8) (11.8) (11.7) (11.7) (11.6)Other financials expenses (4.9) 0.0 0.0 0.0 0.0 0.0 0.0Net financial result (16.3) (11.9) (11.8) (11.8) (11.7) (11.7) (11.6)Result before taxes 39.9 7.5 14.2 24.6 25.1 25.5 25.9Corporation tax (0.3) (0.6) (0.7) (0.7) (0.7) (0.7) (0.7)Exit tax 0.0 0.0 0.0 0.0 0.0 0.0 0.0Net result 39.6 6.9 13.6 24.0 24.5 24.8 25.2Net result attributed to minority interest 1.2 0.2 0.5 0.8 0.9 0.9 0.9Direct part 1.0 0.7 0.8 0.8 0.8 0.8 0.8Indirect part 0.3 (0.5) (0.3) 0.0 0.0 0.0 0.0Net result attributed to group shareholders 38.3 6.7 13.1 23.1 23.6 24.0 24.3Source: Company data, ING estimates169
_<strong>Benelux</strong> <strong>Real</strong> <strong>Estate</strong> February 2010Fig 16 Balance sheet (€m)2008 (18m) 2009F 2010F 2011F 2012F 2013F 2014FIntangible assets 0.0 0.0 0.0 0.0 0.0 0.0 0.0Investment properties 534.0 560.1 551.3 552.5 553.7 554.9 556.1Developments 29.2 29.2 29.2 29.2 29.2 29.2 29.2Other fixed assets 0.0 0.0 0.0 0.0 0.0 0.0 0.0Financial fixed assets 1.0 1.0 1.0 1.0 1.0 1.0 1.0Total fixed assets 564.2 590.3 581.5 582.7 583.9 585.1 586.3Assets held for sale 0.0 0.0 0.0 0.0 0.0 0.0 0.0Financial current assets 2.9 3.8 3.9 4.0 4.0 4.1 4.1Trade receivables 4.8 6.3 6.6 6.6 6.7 6.8 6.8Tax receivables and other 1.7 2.1 2.2 2.2 2.2 2.3 2.3Cash and equivalent 2.6 (4.4) 9.5 19.6 31.1 42.8 55.7Accruals 0.8 1.0 1.1 1.1 1.1 1.1 1.1Total current assets 12.7 8.8 23.3 33.6 45.2 57.1 70.0Total assets 576.9 599.0 604.8 616.2 629.1 642.2 656.4Total group equity 264.4 255.6 253.6 262.2 271.9 282.5 294.3Minorities 0.0 0.2 0.7 1.5 2.4 3.3 4.2Total equity 264.4 255.9 254.4 263.7 274.3 285.8 298.5Provisions 1.1 1.1 1.1 1.1 1.1 1.1 1.1Long-term financial debt 172.5 172.5 172.5 172.5 172.5 172.5 172.5Other long-term financial debt 2.7 2.7 2.7 2.7 2.7 2.7 2.7Other long-term debts 0.4 0.4 0.4 0.4 0.4 0.4 0.4Total long-term liabilities 176.7 176.7 176.7 176.7 176.7 176.7 176.7Provisions 0.0 0.0 0.0 0.0 0.0 0.0 0.0Current financial debts 92.0 113.2 118.1 119.6 121.2 122.2 123.2Trade debts and other current debts 11.1 14.7 15.3 15.5 15.7 15.8 16.0Other current liabilities 24.3 29.4 30.6 31.0 31.4 31.7 32.0Accruals 8.3 9.2 9.6 9.7 9.9 10.0 10.0Total current liabilities 135.8 166.5 173.7 175.8 178.2 179.7 181.2Total liabilities 312.5 343.2 350.4 352.5 354.9 356.4 357.9Total equity and liabilities 576.9 599.0 604.8 616.2 629.1 642.2 656.4Source: Company data, ING estimates170
__<strong>Benelux</strong> <strong>Real</strong> <strong>Estate</strong> February 2010Fig 17 Cash flow statement (€m)2008 (18m) 2009F 2010F 2011F 2012F 2013F 2014FNet result 39.6 6.9 13.6 24.0 24.5 24.8 25.2Non-cash adjustments 0.0 0.0 0.0 0.0 0.0 0.0 0.0Depreciations and amortizations 0.1 0.0 0.0 0.0 0.0 0.0 0.0FV on investment properties (13.4) 14.0 8.8 (1.2) (1.2) (1.2) (1.2)Provisions (0.6) 0.0 0.0 0.0 0.0 0.0 0.0Gratuities spreading (0.6) 0.0 0.0 0.0 0.0 0.0 0.0FV on financial derivatives 4.4 0.0 0.0 0.0 0.0 0.0 0.0Other non-recurring transactions (0.3) 0.0 1.0 2.0 3.0 4.0 5.0Gain on sale of fixed assets (3.6) 0.0 0.0 0.0 0.0 0.0 0.0Working capital items 0.0 0.0 0.0 0.0 0.0 0.0 0.0Asset itemsFinancial current assets 6.3 (0.9) (0.2) 0.0 (0.1) 0.0 0.0Trade debtors (0.7) (1.5) (0.3) (0.1) (0.1) (0.1) (0.1)Tax debtors and other current assets (1.2) (0.4) (0.1) 0.0 0.0 0.0 0.0Accruals 0.5 (0.3) 0.0 0.0 0.0 0.0 0.0Liability itemsTrade debts and other current liabilities (0.2) 3.5 0.6 0.2 0.2 0.1 0.1Other current liabilities 22.0 5.1 1.3 0.4 0.4 0.3 0.3Accruals 0.1 0.9 0.4 0.1 0.1 0.1 0.1CF from operations 52.4 27.2 25.1 25.3 26.8 28.0 29.4Investment properties (51.9) (40.0) 0.0 0.0 0.0 0.0 0.0Project developments (18.1) 0.0 0.0 0.0 0.0 0.0 0.0Intangible fixed assets and other fixed assets 0.0 0.0 0.0 0.0 0.0 0.0 0.0Financial fixed assets (35.3) 0.0 0.0 0.0 0.0 0.0 0.0Assets held for sale 13.1 0.0 0.0 0.0 0.0 0.0 0.0Consolidation of new participations 0.1 0.0 0.0 0.0 0.0 0.0 0.0CF from Investing (92.2) (40.0) 0.0 0.0 0.0 0.0 0.0Change in financial debt 72.8 21.2 4.9 1.4 1.6 1.0 1.0Change in other financial debts 0.0 0.0 0.0 0.0 0.0 0.0 0.0Change in other liabilities 0.0 0.0 0.0 0.0 0.0 0.0 0.0Change in capital and premium accounts 0.0 0.0 0.0 0.0 0.0 0.0 0.0Change in own shares (1.0) 0.0 0.0 0.0 0.0 0.0 0.0Last year dividend (15.5) (15.4) (16.1) (16.6) (16.9) (17.3) (17.5)Current year interim dividend (15.4) 0.0 0.0 0.0 0.0 0.0 0.0Increase (+) decrease (-) of fair value of fin derivatives 0.0 0.0 0.0 0.0 0.0 0.0 0.0Mutation expenses increase (+) or decrease (-) 0.0 0.0 0.0 0.0 0.0 0.0 0.0CF from financing 40.9 5.7 (11.2) (15.2) (15.3) (16.3) (16.5)Net CF 1.1 (7.0) 13.9 10.1 11.5 11.7 12.9Cash BOP 1.5 2.6 (4.4) 9.5 19.6 31.1 42.8Cash EOP 2.6 (4.4) 9.5 19.6 31.1 42.8 55.7Source: Company data, ING estimatesFig 18 Per share data (€)2008 (18m) 2009F 2010F 2011F 2012F 2013F 2014FShares 4,012,832 4,012,832 4,012,832 4,012,832 4,012,832 4,012,832 4,012,832Net result per share 9.55 1.66 3.26 5.77 5.88 5.97 6.06Recurring result per share 6.62 5.01 5.38 5.48 5.59 5.68 5.77Indirect result per share 2.93 (3.36) (2.11) 0.29 0.29 0.29 0.29Dividend per share 3.85 4.010886 4.139126 4.217301 4.307491 4.372318 4.442832IFRS NAVPS 65.9 63.7 63.2 65.3 67.7 70.4 73.3Source: Company data, ING estimates171
<strong>Benelux</strong> <strong>Real</strong> <strong>Estate</strong> February 2010This page is left blank intentionally172
__<strong>Benelux</strong> <strong>Real</strong> <strong>Estate</strong> February 2010NetherlandsNieuwe SteenInvestments (NSI)Ambitious turnaroundJean-Yves DevlooAmsterdam (31) 20 563 8745jean-yves.devloo@ing.comArjan KnibbeAmsterdam (31) 20 563 8780arjan.knibbe@ing.comInitiating coverageHold<strong>Real</strong> <strong>Estate</strong>5 February 2010€14.1Target price (12 month)€13.1ReutersNSTEc.ASNSI is restructuring its portfolio by disposing of smallerassets before more aggressive growth is added. Focusedprimarily on secondary retail and offices, we do not thinkNSI will outperform in 2010 from these levels. HOLD.NSI is looking for sizeable acquisition opportunities, primarily in France, andpotentially needs additional equity to grow. The new CEO wants to achieve aturnaround by adding development and creating a balanced portfolio over theNetherlands, Switzerland and France.Sensitivity of our 2010F EPS to vacancy rate and total LFL (€)Vacancy rate (%)5.0 7.0 9.0 10.0 11.0 12.0 13.0 14.0-2 1.44 1.38 1.32 1.29 1.27 1.24 1.21 1.18-1 1.46 1.41 1.35 1.32 1.29 1.26 1.24 1.210 1.48 1.42 1.36 1.33 1.31 1.28 1.25 1.22LFL (%) 1 1.50 1.45 1.39 1.36 1.33 1.30 1.27 1.252 1.53 1.47 1.42 1.39 1.36 1.33 1.30 1.273 1.56 1.50 1.44 1.41 1.38 1.36 1.33 1.304 1.58 1.52 1.47 1.44 1.41 1.38 1.35 1.325 1.61 1.55 1.49 1.47 1.44 1.41 1.38 1.35Source: ING estimatesKey ratios and forecasts2008 2009 2010F 2011F 2012FEPS adj (€) 1.40 1.36 1.36 1.37 1.44PER (x) 10.1 10.3 10.4 10.3 9.8Net yield (%) 6.3 6.9 7.2 7.2 7.2EPRA NNNAV (€) N/A N/A N/A N/A N/AIFRS NAV per share (€) 16.3 14.1 13.7 13.9 14.9P/IFRS NAV (%) 0.87 1.00 1.02 1.01 0.94DPS (€) 1.40 1.34 1.36 1.37 1.44Dividend yield (%) 9.9 9.5 9.6 9.7 10.2CFPS (€) 1.36 1.32 1.31 1.33 1.39LTV (%) 58.3 57.1 57.9 57.6 56.012-month forecast returns (%)Share price -9.0Dividend 9.612m f'cst total return 0.6Key ratios (%)2008 2009FRental growth 13.5 1.4Operating margin 82.3 82.3Occupancy rate 92.6 91.5Share datano of shares (€m) 39.4Daily turnover (shares, 3M) 67,000Free float (%) 66Enterprise value (€m) 1,324.1Market cap (€m) 564.8Share price performance22201816141210861/08 7/08 1/09 7/09 1/10Source: INGPriceAMX (rebased)Source: Company data, ING estimates173
<strong>Benelux</strong> <strong>Real</strong> <strong>Estate</strong> February 2010Investment caseNieuwe Steen Investment has completely restructured its board. A formerWereldhave board member, Johan Buijs, started as CEO in 2008, and in 2009 anew CFO, Daniel van Dongen, joined the management. NSI wants to achieve aturnaround by: (1) spicing up its operational gearing by adding moredevelopment; (2) disposing of smaller, management-intensive assets; (3) fullyinternalising property management; (4) doubling the size of the portfolio byc.2012, spread evenly over quality secondary retail and office assets.HighlightsTurnaround financingand timing will be keyGrocery anchored smalland medium-sized retailand edge-of-CBD multitenantofficesBeefing up developmentat a 10% yield on costDividend cut ahead, butyield 9% post-cutTiming and financing of the above turnaround will drive the share price on NSI over thenext few years. The growth is potentially to be financed by an equity issue to enablerapid entry into France. We believe the restructuring of the portfolio, by further disposalof smaller assets, should have a higher priority than the acquisition of a Frenchportfolio or Swiss growth. However, we understand that the markets will not remainattractive to enter for years, and if financing is available 2010 could turn out to be agood entry point for France.The focus on daily shopping in the retail portfolio should support earnings, however thesecondary offices portfolio will probably suffer from increasing vacancies and willrequire significant incentives, adding cyclicality to the business model. We like the ideaof refocusing the office portfolio towards the edges of the central business districts oflarger towns in the west of the Netherlands. We find that the theoretical net yield of7.6%, with a 9% vacancy rewards risks appropriately.The development pipeline will be expanded and management has a refreshing costawareness that has resulted in a small pipeline at a yield of cost of 10%. In addition,management has identified a further €75m of extensions. A lot of the above newelements seem to be priced in and the risks of execution of the international expansionseem underestimated, in our view.We estimate a cut in DPS from €1.36 to €1.25 in 2010. After this cut, the dividend yieldof above 9% seems sustainable, unless vacancy rates rise steeply. We show thesensitivities of recurring EPS to vacancy rates on the cover of this company report. A2% increase from 9% to 11% vacancy would knock €0.05 off our 2010F EPS of €1.36.We initiate on Nieuwe Steen Investments with a HOLD.As a part of its restructuring strategy, NSI is likely to move its head office from Hoorn toAmsterdam.174
<strong>Benelux</strong> <strong>Real</strong> <strong>Estate</strong> February 2010SWOTFig 1 SWOT analysisStrengthsWeaknessesNo real estate transactions with Habas ensures adherence tocorporate governance principlesConsiderable free float of c.66%Down to earth management with strong technical know-howStrong commitment of investors during the mid-2009 ABB of 90% fixed rate structureManagement remuneration seems linked to external growthLow level of implementation of the EPRA best practicesOpportunitiesHabas network has proven useful during the entry in the Swissmarket; this could be repeated in the futurePotential for a partnership in the French market in the medium tolonger termOffice vacancy 13.1%Threats/RisksHigh leverageObligation to buy assets from shareholder HabasTax may be imposed on buildings that are not energy-efficientSource: ING_RisksBecause of the contractual nature of a large part of the recurring cash flows, propertycompanies are usually considered to have less risk than most other equity sectors.The risk of property companies bears a strong relation with the amount of developmentexposure, the geographical and sector breakdown, corporate governance andalignment of interest between management and shareholders.Principally an investorWe believe that NSI carries moderate risk, because it is principally an investor, whichis the least risky activity of the four core real estate company activities: investment,development, trading and asset management. NSI’s target is to spread its portfolioevenly into upper secondary range offices and retail assets (45% retail and 50%offices at present). We believe the retail assets will offer more resilience (focus onevery day shopping), which is to be offset by the office’s performance, which is willprobably suffer from a rising vacancy rate and high incentives.Tenant riskAn aggregate c.15% of the rent payroll is derived from regional government orgovernment institutions, which in our view carries little risk. The rest of the rents is wellspread over various industrial and business support players, not exceeding 3% perindividual tenant. The top 10 tenants constitute >30% of total payroll.Accounting for leasesThere are accounting initiatives that may lead to the obligation of tenants to accountlong leases as a liability in their balance sheets. In future, this may put pressure on theaverage lease lengths of real estate companies and NSI.175
<strong>Benelux</strong> <strong>Real</strong> <strong>Estate</strong> February 2010International expansionInternational expansionbears riskWe believe that the international growth of NS bears some risk, as traditionally the NSIorganisation has been very domestically focused. Although new management addedan international perspective, it takes time for this perspective to be understood andsupported in a company.CatalystsIn our view, the major catalysts involve:• Successful deleveraging at low cost• Limit vacancy increase, especially in the offices portfolio, where we expectvacancies to top 14% in mid-2010, compared with 5% for the retail portfolio)• Successful disposal of the smaller assets (>€5m) portfolio• Attraction of a partner to enter the French market• Adding developments with attractive yield on cost• 1Q results are due on 29 April• The potential improvement of the valuation methodology moving more in line withEPRA recommendations (25% externally each quarter, 100% internally everyquarter)OutlookWe would prioritiserestructuring overgrowth……redevelopmentsshould improve LFL andvacancy levels……and a continued focuson disposal of smallerassetsIn the longer run, NSI said it wants to grow further in Switzerland and enter the Frenchmarket. Given the uncertain situation on the French market, and the low likelihood ofan establishment of an immediate French real estate partnership, we do not expectany major French transactions to occur before 2H10 or even 2011.Instead, we favour a fully professional and internalised Swiss portfolio, along with aredevelopment of the existing portfolio (in order to increase like-for-like and todecrease incentives on lease renewals), subject to the favourable attraction of newfinancing.We also expect the sale of the smaller assets (
__<strong>Benelux</strong> <strong>Real</strong> <strong>Estate</strong> February 2010Consensus overviewFig 2 Consensus EPS overview (€)2008 2009 2010F 2011FConsensus 1.4 1.36 1.30 1.32ING 1.40 1.36 1.36 1.37Difference 0.00 0.00 0.06 0.05Difference (%) 0.0 0.0 4.3 3.9Source: Reuters, ING estimates_Our estimates and assumptions1) Vacancies: we assume vacancies peak in mid-2010, with the office portfoliounderperforming the retail portfolio on the back of higher cyclical exposure.Fig 3 Our vacancy assumptions (%)2010F 2011F 2012FOffices 12.0 9.0 7.0Retail 3.8 3.0 3.0Other 8.5 6.3 6.0Total 8.6 6.5 5.4Source: ING estimates_2) Total LFL rental growth: includes incentives and renegotiations. While NSI is tryingto replace incentives by capital expenditure and small consulting favours, we donot expect this to prevent more incentives, especially for the offices portfolio.Fig 4 Total LFL assumptions (%)2010F 2011F 2012FOffices 0.4 2.0 2.0Retail -0.6 2.0 2.0Other 0.5 1.8 1.8Total 1.4 2.0 2.0Source: ING estimates3) Portfolio valuation: we expect value adjustments for the portfolio to flatten out, butassume 0.9% further downward adjustments into 2010. We believe our 2011 and2012 zero estimates for portfolio value increases are conservative.Fig 5 Our portfolio valuation assumptions (%)2010F 2011F 2012FOffices -1.4 -0.5 3.0Retail -0.5 2.0 3.0Other 0.0 0.0 2.5Total -0.9 0.6 3.0Source: ING estimates177
_<strong>Benelux</strong> <strong>Real</strong> <strong>Estate</strong> February 2010Company profileFrom a mid-sized,internally managedDutch investmentfund……to an international,professional participantin offices and retail‘ three countries, twosectors, one goal :dividend ‘Nieuwe Steen Investments (NSI) was founded in 1993 by Jo Roelof Zeeman and wasfloated on the Amsterdam exchange in 1998. NSI has been an investor in retail, officesand industrial from its inception.In 2007, a decision was made further to focus, internationalise, ‘professionalise’ andincrease the portfolio. This has resulted in the hire of a new CEO, Mr Buijs, the exit ofthe Zeeman family and the entry of the Israeli quoted residential developer, Habas(which has bought 22% of the shares). The focus now lies on the gradual disposal ofsmaller, management intensive assets (
__<strong>Benelux</strong> <strong>Real</strong> <strong>Estate</strong> February 2010Geographical focusdetermined by political,legal and tax similaritiesto the NetherlandsIn 2008, NSI abandoned its interest in Austria (too small and too isolated) andGermany (unfavourable tax reforms), and said it was only interested in Switzerland,France and the Netherlands.Fig 8Current portfolio composition (€1.3bn end-September 2009)Switzerland8%Fig 9 Target portfolio composition (2010F,c.€2.5bn)France26%Switzerland14%Netherlands60%Source: Company dataNetherlands92%Source: ING estimatesNSI’s main presence in Switzerland is in Zug and Thalwil (offices, c.€50m end-2008),and Fribourg (retail, c.€51m end-2008). The remaining industrial and residential assetsmake up part of the disposal programme. The Swiss growth is focused on retail, with amaximum asset size of €50m, which means asset sizes of 8,000-20,000m 2 .Management has stated that it could decide to hold the Swiss portfolio in a fund whichit could invite others to enter, in order to have critical mass without the capitalrequirement. The company has even said that the duration of such a fund would befive years.TenantsFig 10 Top office tenants according to FY08 rent revenuesName Sector FY08 rent revenues(€m)% of total FY08 offices rentsRijksgebouwendienst Public 4.5 7.5Gemeente Rotterdam Public 2.9 4.7Stichting de Thuiszorg Icare Public 2.0 3.3Getronics Pink Roccade Nederland B.V. ICT 1.8 2.9Imtech Industry/trade 1.7 2.9Ziggo Industry/trade 1.7 2.8Gemeente Heerlen Public 1.5 2.4Ernst & Young Accountants Business support 1.2 1.9Stichting ROC Amsterdam Business support 1.0 1.7Friesland Coberco Dairy Foods B.V. Industry/trade 0.8 1.4Total 19.1 31.5Source: Company dataNSI stated that with the home furnishing tenants, who feel the crisis severely,management is discussing the incorporation of turnover rents. This is very unusual inthe Netherlands.179
_<strong>Benelux</strong> <strong>Real</strong> <strong>Estate</strong> February 2010Fig 11 Top retail tenants according to FY08 rent revenuesNameFY08 rent revenues(€m)% of total FY08 retail rentsAhold 3.0 8.8Laurus 1.4 4.1Plus 1.2 3.6Lidl 1.2 3.4Kruidvat, Trekpleister 0.9 2.6Blokker 0.8 2.3Maxeda 0.7 2.2Impact Retail 0.6 1.9Aldi 0.6 1.8C&A 0.6 1.7Total 11.0 32.4Source: Company data180
_<strong>Benelux</strong> <strong>Real</strong> <strong>Estate</strong> February 2010Corporate governanceManagementCEO Johan Buijs (1965)• Johan Buijs was formerly a member of the board of Wereldhave NV. Before hejoined Wereldhave in 2000, he held a number of positions at various technicalconsultants.CFO Daniel van Dongen (1971)• Daniel van Dongen was formerly a group controller at Wereldhave NV. He is achartered controller and has international experience.Growth for growth’ssake is a potentialmisalignmentWe believe that some of the elements of the remuneration of Mr Buijs are focused toomuch on acquisition targets. The sizes of the Swiss and French portfolios have acombined 40% weighting in the long-term variable remuneration of the CEO. Toomuch pressure on acquisition targets can lead to a misalignment of interest withshareholders who are likely to be more interested in returns than the size of thebalance sheet. We also believe that Mr Buijs and the new strategy will appeal toinvestors. This may well be one of the reasons why the shares are trading at or aboveNAV.ShareholdersEarly in 2007, the Israel-based quoted real estate developer, Habas Investments,acquired a near 22% stake in NSI. It is not NSI’s intention to engage in any operationaltransactions with this investor. Another 12.5% is in the hands of the Moeijes family, anhistorical shareholder from West Friesland. The remaining 66% of the shares are freefloat.Fig 12 Shareholder structureHabas21%Free float66%Moeijes family13%Source: Bloomberg181
__<strong>Benelux</strong> <strong>Real</strong> <strong>Estate</strong> February 2010FinancialsFig 13 Balance sheet (€m)2008 2009 2010F 2011F 2012F 2013F 2014F<strong>Real</strong> estate investments 1,411.5 1,303.2 1,291.2 1,299.5 1,338.8 1,392.9 1,449.4Intangible fixed assets 8.2 8.3 8.3 8.3 8.3 8.3 8.3Tangible fixed assets 4.1 3.9 3.9 3.9 3.9 3.9 3.9Financial derivatives 0.0 0.0 0.0 0.0 0.0 0.0 0.0Pre-payments and accrued inc. in relation to rent incentives 1.8 2.4 2.4 2.4 2.4 2.4 2.4Total fixed assets 1,425.7 1,317.9 1,305.8 1,314.1 1,353.4 1,407.5 1,464.1Debtors and receivables incl. derivs 3.6 2.4 3.9 4.0 4.1 4.2 4.4Cash 0.0 0.0 50.7 49.5 53.2 51.7 50.3Total current assets 3.6 2.4 54.6 53.5 57.3 56.0 54.7Total assets 1,429.3 1,320.3 1,360.4 1,367.6 1,410.7 1,463.5 1,518.8Total shareholders’ equity 582.2 554.8 541.0 548.3 586.4 639.1 694.4Mortgage loans 747.2 661.1 715.0 715.0 720.0 720.0 720.0Financial derivatives 16.3 28.1 28.1 28.1 28.1 28.1 28.1Deferred tax liabilities 0.3 0.5 0.5 0.5 0.5 0.5 0.5Total long-term liabilities 763.8 689.6 743.6 743.6 748.6 748.6 748.6Redemption requirement long-term debt 0.1 30.0 30.0 30.0 30.0 30.0 30.0Debts to credit institutions incl. derivs 59.5 25.1 25.1 25.1 25.1 25.1 25.1Other accounts payables and accruals and deferred income 23.7 20.8 20.8 20.8 20.8 20.8 20.8Total current liabilities 83.3 75.8 75.8 75.8 75.8 75.8 75.8Total liabilities 847.1 765.5 819.4 819.4 824.4 824.4 824.4Total shareholders’ equity and liabilities 1,429.3 1,320.3 1,360.4 1,367.6 1,410.7 1,463.5 1,518.8Source: Company data, ING estimatesFig 14 Profit and loss (€m)2008 2009 2010F 2011F 2012F 2013F 2014FGross rents 101.7 103.8 104.9 105.7 108.9 111.7 115.0Operating costs (13.4) (14.2) (12.1) (12.2) (12.5) (12.8) (13.2)Net rents 88.3 89.6 92.8 93.5 96.4 98.8 101.7Total revaluation of investments (42.7) (52.3) (12.1) 8.3 39.3 54.1 56.6Total net income from investments 45.3 37.4 80.8 101.9 135.7 153.0 158.3Interest cost (34.9) (34.7) (35.1) (35.1) (35.1) (35.1) (35.1)Interest income 0.1 0.2 0.1 0.1 0.0 0.0 0.0Total interest (34.8) (34.5) (35.0) (35.0) (35.1) (35.1) (35.1)Net financing expenses (61.7) (46.9) (35.0) (35.0) (35.1) (35.1) (35.1)General expenses (4.6) (4.7) (5.8) (5.8) (6.0) (6.1) (6.3)Direct share (exploitation and portfolio mgt) (3.3) (3.3) (4.3) (4.4) (4.5) (4.6) (4.7)Indirect share (centralised asset mgt) (1.2) (1.4) (1.4) (1.5) (1.5) (1.5) (1.6)Result before tax (20.9) (14.2) 40.0 61.0 94.6 111.7 116.9Corporate income tax (0.4) (0.3) (0.5) (0.5) (0.5) (0.6) (0.6)Direct share (payable current fiscal year) (0.1) (0.2) (0.2) (0.2) (0.2) (0.2) (0.2)Indirect share (tax effect of subs falling under other tax regimes) (0.3) (0.2) (0.4) (0.4) (0.4) (0.4) (0.4)Result after tax (21.3) (14.4) 39.5 60.5 94.1 111.2 116.3Total direct result 50.0 51.6 53.3 54.0 56.7 59.0 61.7Total indirect result (71.4) (66.2) (13.9) 6.5 37.4 52.2 54.6Source: Company data, ING estimates182
__<strong>Benelux</strong> <strong>Real</strong> <strong>Estate</strong> February 2010Fig 15 Cash flow statement (€m)2008 2009 2010F 2011F 2012F 2013F 2014FTotal investment result (21.3) (14.6) 39.5 60.5 94.1 111.2 116.3Adjustments for 0.0 0.0 0.0 0.0 0.0 0.0 0.0Revaluation of investments 42.7 52.3 12.1 (8.3) (39.3) (54.1) (56.6)<strong>Real</strong>ised result on sales of investments 0.2 (0.1) 0.0 0.0 0.0 0.0 0.0Net financing expenses 61.7 46.9 0.0 0.0 0.0 0.0 0.0Movements in debtors and other payables 3.0 1.2 (1.4) (0.1) (0.1) (0.1) (0.1)Movements in account payables 2.0 (2.9) 0.0 0.0 0.0 0.0 0.0Interest paid (35.0) 0.0 0.0 0.0 0.0 0.0 0.0CF from operations 53.6 84.0 50.1 52.0 54.7 56.9 59.6CF from investments (237.6) 54.7 0.0 0.0 0.0 0.0 0.0Dividend paid (49.7) (51.4) (53.3) (53.3) (56.0) (58.4) (61.0)Share issue 0.0 38.5 0.0 0.0 0.0 0.0 0.0Drawdown on loans 225.7 30.0 53.9 0.0 5.0 0.0 0.0Redemption of loans (14.9) (121.0) 0.0 0.0 0.0 0.0 0.0CF from financing 161.1 (103.9) 0.6 (53.3) (51.0) (58.4) (61.0)Net cash flow (22.9) 34.8 50.7 (1.2) 3.7 (1.5) (1.4)Exchange rate differences 1.5 0.2 0.0 0.0 0.0 0.0 0.0Cash and accounts payable to banks EOP (59.5) (24.5) 50.7 49.5 53.2 51.7 50.3Source: Company data, ING estimatesFig 16 Per share data (€)2008 2009 2010F 2011F 2012F 2013F 2014FYear-end number of shares (basic) 35,774,117 39,351,527 39,351,527 39,351,527 39,351,527 39,351,527 39,351,527Direct result per share 1.40 1.36 1.36 1.37 1.44 1.50 1.57Indirect result per share (2.00) (1.75) (0.35) 0.17 0.95 1.33 1.39Total investment result (0.60) (0.39) 1.00 1.54 2.39 2.82 2.95Dividend per share attributed (€) 1.40 1.34 1.36 1.37 1.44 1.50 1.57IFRS NAV per share 16.3 14.1 13.7 13.9 14.9 16.2 17.6Recurring CFPS 1.36 1.32 1.31 1.33 1.39 1.45 1.52Recurring EPS 1.36 1.32 1.31 1.33 1.39 1.45 1.52Source: Company data, ING estimates183
___<strong>Benelux</strong> <strong>Real</strong> <strong>Estate</strong> February 2010Fig 17 Quarterly profit and loss (€m)1Q09 2Q09 3Q09 4Q09 1Q10F 2Q10F 3Q10F 4Q10FGross rents 26.1 26.3 25.6 25.7 28.1 25.5 25.6 25.7Operating charges (4.0) (3.4) (2.9) (3.9) (3.2) (2.9) (2.9) (3.0)Net rents 22.1 22.9 22.7 21.8 24.8 22.6 22.6 22.8Total net income from investments (7.2) 18.1 17.9 8.5 20.1 18.5 20.7 21.5Interest cost (8.9) (8.8) (8.5) (8.6) (8.8) (8.8) (8.8) (8.8)Interest income 0.0 0.1 (0.1) 0.2 0.0 0.0 0.0 0.0Total interest (8.8) (8.7) (8.6) (8.4) (8.7) (8.7) (8.8) (8.8)Revaluation of financial derivatives (11.1) 3.1 (3.9) (0.4) 0.0 0.0 0.0 0.0Exchange rate differences (0.1) 0.0 0.2 (0.3) 0.0 0.0 0.0 0.0Net financing expenses (20.0) (5.6) (12.3) (9.0) (8.7) (8.7) (8.8) (8.8)General expenses (1.0) (1.5) (1.1) (1.0) (1.5) (1.4) (1.4) (1.4)Direct share (exploitation and portfolio mgt) (0.8) (1.2) (0.7) (0.6) (1.2) (1.1) (1.1) (1.1)Indirect share (centralised asset mgt) (0.3) (0.4) (0.4) (0.4) (0.4) (0.4) (0.4) (0.4)Result before tax (28.3) 11.0 4.4 (1.4) 9.8 8.4 10.5 11.3Corporate income tax (0.3) (0.1) (0.2) 0.3 (0.1) (0.1) (0.1) (0.1)Direct share (payable current fiscal year) (0.1) 0.0 (0.2) 0.0 0.0 0.0 0.0 0.0Indirect share (tax effect of subsids falling under other tax regimes) (0.2) (0.1) (0.5) 0.3 (0.1) (0.1) (0.1) (0.1)Result after tax (28.5) 11.0 4.2 (1.1) 9.7 8.3 10.4 11.2Total direct result 12.4 13.1 13.2 12.8 14.9 12.8 12.8 12.9Total indirect result (41.0) (2.0) (9.5) (14.0) (5.2) (4.5) (2.4) (1.7)Source: Company data, ING estimatesFig 18 Quarterly cash flow statement (€m)1Q09 2Q09 3Q09 4Q09 1Q10F 2Q10F 3Q10F 4Q10FTotal investment result (28.5) 10.9 4.1 (1.1) 9.7 8.3 10.4 11.2Adjustments for 0.0 0.0 0.0 0.0 0.0 0.0 0.0 0.0Revaluation of investments 29.5 4.8 4.7 13.3 4.7 4.1 2.0 1.3<strong>Real</strong>ised result on sales of investments (0.2) (0.1) 0.2 0.0 0.0 0.0 0.0 0.0Net financing expenses 20.0 5.6 12.4 9.0 0.0 0.0 0.0 0.0Deferred tax liabilities 0.2 0.1 0.2 (0.3) 0.0 0.0 0.0 0.0Movements in debtors and other payables (7.8) 7.4 (3.1) 4.6 (1.8) 0.4 0.0 0.0Movements in account payables 15.8 (15.4) (1.5) 35.0 0.0 0.0 0.0 0.0Interest paid (8.8) (8.7) (8.5) 0.0 0.0 0.0 0.0 0.0CF from operations 20.2 4.6 8.4 60.5 12.6 12.7 12.3 12.4Purchases of real estate and investments in existing properties (0.2) (0.4) (8.2) 0.0 0.0 0.0 0.0 0.0Sales of real estate investments 24.9 7.7 16.9 0.0 0.0 0.0 0.0 0.0Mmts in pre-payments and accrued income relating to rent incentives (0.3) (0.2) 0.0 0.0 0.0 0.0 0.0 0.0Movements in tangible fixed assets 0.1 0.0 (0.2) (0.1) 0.0 0.0 0.0 0.0CF from Investments 24.5 7.1 8.5 (0.1) 0.0 0.0 0.0 0.0Dividend paid (12.5) (12.5) (13.0) (13.2) 0.0 (27.7) (12.8) (12.8)Share issue 0.0 38.5 0.0 0.0 0.0 0.0 0.0 0.0Drawdown on loans 30.0 0.0 0.0 (52.3) 0.0 53.9 0.0 0.0Redemption of loans (10.3) (34.5) (17.4) 0.0 0.0 0.0 0.0 0.0CF from financing 7.2 (8.6) (30.4) (65.5) 0.0 26.2 (12.8) (12.8)Net cash flow 51.9 3.1 (13.5) (5.1) 12.6 38.9 (0.4) (0.3)Exchange rate differences 0.1 (0.1) 0.1 0.0 0.0 0.0 0.0 0.0Cash and accounts payable EOP (7.5) (56.4) (13.4) (5.1) 12.6 51.5 51.1 50.7Source: Company data, ING estimatesFig 19 Quarterly per share data (€)1Q09 2Q09 3Q09 4Q09 1Q10F 2Q10F 3Q10F 4Q10FYear-end number of shares (basic) 35,774,117 39,351,527 39,351,527 39,351,527 39,351,527 39,351,527 39,351,527 39,351,527Direct result per share 0.35 0.35 0.34 0.33 0.38 0.32 0.32 0.33Indirect result per share (1.15) (0.05) (0.24) (0.36) (0.13) (0.11) (0.06) (0.04)Total investment result (0.80) 0.30 0.10 (0.03) 0.25 0.21 0.26 0.28Dividend per share attributed (€) 0.35 0.35 0.34 0.33 0.38 0.32 0.32 0.33IFRS NAV per share 15.1 14.7 14.5 14.1 14.3 13.9 13.8 13.7Recurring CFPS 0.33 0.34 0.32 0.33 0.37 0.31 0.31 0.32Recurring EPS 0.33 0.34 0.32 0.33 0.37 0.31 0.31 0.32Source: Company data, ING estimates184
__<strong>Benelux</strong> <strong>Real</strong> <strong>Estate</strong> February 2010NetherlandsVastNed O&ICheap cycle playJean-Yves DevlooAmsterdam (31) 20 563 8745jean-yves.devloo@ing.comArjan KnibbeAmsterdam (31) 20 563 8780arjan.knibbe@ing.comInitiating coverageBuy<strong>Real</strong> <strong>Estate</strong>5 February 2010€12.8Target price (12 month)€15.4ReutersVWNN.ASValued at a 30% discount to 2010F EPRA NNNAV, which isbased on a 6.3% net property yield, VNOI is oversold, inour opinion. VNOI now has clear upside in fillingvacancies. BUY.As debt maturities recover, we believe VNOI is becoming an attractivetakeover candidate. The current 12% vacancy rate offers unrivalled earningspotential. We have been very conservative in assuming a further deteriorationin vacancy rate to 16%.Sensitivity of our 2010F EPS to vacancy rate and total like-for-likeVacancy rate (%)11.5 13.5 15.5 17.5 19.5 21.5 23.5 25.5-10 1.44 1.35 1.27 1.18 1.09 1.01 0.92 0.83-8 1.52 1.43 1.34 1.26 1.17 1.08 1.00 0.91-6 1.59 1.51 1.42 1.33 1.25 1.16 1.07 0.99LFL (%) -4 1.67 1.58 1.50 1.41 1.32 1.24 1.15 1.06-2 1.75 1.66 1.57 1.49 1.40 1.31 1.23 1.140 1.82 1.74 1.65 1.56 1.48 1.39 1.30 1.212 1.90 1.81 1.73 1.64 1.55 1.47 1.38 1.294 1.98 1.89 1.80 1.72 1.63 1.54 1.45 1.37Source: ING estimatesKey ratios and forecasts2008 2009F 2010F 2011F 2012FEPS adj (€) 1.59 1.62 1.38 1.38 1.62PER (x) 8.1 7.9 9.3 9.3 7.9Net yield (%) 6.6 6.7 6.2 6.2 6.8IFRS NAV per share (€) 23.2 18.2 17.1 17.4 17.8EPRA NNNAV per share (€) 23.2 19.0 18.0 18.3 18.8P/EPRA NNNAV (%) 0.55 0.67 0.71 0.70 0.68DPS (€) 1.59 1.62 1.38 1.38 1.62Dividend yield (%) 12.4 12.6 10.8 10.8 12.7CFPS (€) 2.84 3.09 1.38 1.38 1.62LTV (%) 50.3 54.2 55.5 54.4 52.912-month forecast returns (%)Share price 20.3Dividend 12.012m f'cst total return 32.3Key ratios (%)2008 2009FRental growth 4.1 -5.5Operating margin 86.8 85.5Occupancy rate 90.7 84.5Share dataNo. of shares (m) 18.8Daily turnover (shares) 58,000Free float (%) 100Enterprise value (€m) 947.6Market cap (€m) 240.3Share price performance25201510501/08 7/08 1/09 7/09 1/10Source: INGPriceAMX (rebased)Source: Company data, ING estimates185
_<strong>Benelux</strong> <strong>Real</strong> <strong>Estate</strong> February 2010Investment caseBUY on weaknessWe have been conservative in terms of occupancy, like-for-like rental growthand incentives, reflecting the weak outlook for secondary office markets andseveral buildings vacant due to renovations. We believe the market is toopessimistic and does not fully take into account the stabilisation we anticipate in2010. BUY.Focus goes from yielddecompression tooccupancyimprovementWe expect EPRANNNAV to bottom out atc.€18 in 2010F……while recurring EPSwill rebound oninvestments in qualitymaterialisingVNOI to outperformCofinimmo andBefimmo, depending onthe speed of recoveryWe believe the main driver for VNOI is the way in which it can increase the occupancyrate of its 6.5% over-rented portfolio. We have shifted our focus from yielddecompression to improvement of the occupancy rate, at decent rental levels. Webelieve VNOI will have to offer additional lease incentives and bear additionalrenovation costs in order to support its occupancy rates.Direct investment result should suffer from increased operating expenses anddecreasing like-for-like rates. We expect stabilisation past mid-2010, when capex andoperational expenses spent should start to materialise in an increased occupancy rateand a competitive portfolio. NAV growth should remain benign during forthcomingquarters, on the back of slowly stabilising yield decompression and decreasingearnings. We see 2010F EPRA NNNAV bottoming out at €18.0 per share (€23.2 inFY08).We expect quarterly EPS to bottom out in 3Q10 at €0.33 per share on the back ofimproved occupancy, stabilising incentives and improving like-for-like rental growth.We expect VNOI to outperform its larger peers Cofinimmo (HOLD, target price €99.3)and Befimmo (HOLD, target price €57.8), if there is a very strong economic recovery.VNOI has many vacancies to fill, certainly compared with Cofinimmo and Befimmo,which have vacancy rates of 3% and 4% (both excluding renovations) respectively.Nieuwe Steen Investments office vacancy rate stands at c.12%.SWOTFig 1 SWOT analysisStrengthsDecentralised management structures in the different countries ofpresence ensures local awareness (eg, Intervest O&I in Belgium)VastNed Group management results in economies of scale on costand managerial knowledgeConsistency and completeness of financial reportingSeasoned managementImplemented the EPRA recommendationsSmall/flexibleOpportunitiesFilling voids at acceptable pricesAcquiring distressed assetsWeaknessesA secondary portfolio underperforms in a crisisIncome tax liability is due in GermanyCyclical nature of the offices and semi-industrial market6.5% over-rented portfolio is likely to pressure rentsThreats/risksSecondary offices will underperform in 2010?Increased vacanciesSource: ING186
<strong>Benelux</strong> <strong>Real</strong> <strong>Estate</strong> February 2010RisksProperty companies arelow-risk, on averageBecause of the contractual nature of a large part of the recurring cash flows, propertycompanies are usually considered to be less of a risk than most other equity sectors.The risks of property companies bear a strong relation to the amount of developmentexposure, geographical and sector breakdown, corporate governance and thealignment of interests between management and shareholders.Principally an investor, but in relatively cyclical secondary propertyassetsPrincipal activity isinvesting, limiteddevelopment exposureIn our view, VNOI carries low risk because its main activity is investing in property, andhas limited developments. This limited development exposure must be compensatedby VNOI’s exposure to offices in secondary locations, which we rate as more cyclicalcompared with retail. We believe this sector will underperform in 2010, but not as muchas is priced in now.Tenant risk is not limitedConsiderableconcentration oftenants at c.25% of totaltheoretical rent payrollVNOI’s top three tenants in terms of FY08 total rental revenues are PWC (10.4%,business services, Belgian portfolio), Tibotec (7.5%, pharmaceutical, Belgian portfolio)and Deloitte (7.2%, business services, Belgian portfolio). While to date we have notrecorded any sizeable rent payment delays or pressure, we believe this exposure tothe same tenants remains considerable.Mid-2009, Tibotec, part of Johnson&Johnson, reported relocating its activities fromMechelen to the mother company Janssen Pharmaceutica in Beerse (both in Belgium).This has involved moving 450 employees and will affect VNOI in a decrease in itsoccupancy rate. The total rent roll of Tibotec is €3.2m, of which 50% will leave in2H10, 20% in 2H13 and 30% in 2H14.Vacancy riskVNOI has to improve itsoccupation, but at whatcost?At end-September 2009, VNOI had a rent weighted vacancy of c.12%, which weassume to increase to 16% in mid-2010, after which we expect VNOI should be able toincrease its occupancy to normal levels. We have factored in significant rent incentiveswhich will certainly pressure 2010F EPS (see Outlook section), which we believemakes us conservative. A more drastic evolution in rent incentives is not excluded.Accounting for leasesPotential pressure onlease lengthThere are accounting initiatives that may lead to an obligation for tenants to accountlong leases as a liability in their balance sheets. In future, this may put pressure on theaverage lease lengths of real estate companies and VNOI.No currency risksVNOI receives all its rents and makes all its costs in euros, which implies there is nocurrency risk.CatalystsMonitor vacancy, LFLand lease incentivescloselyTaking into account a potential underperformance of secondary offices in 2010, webelieve we have been conservative in terms of like-for-like rental growth, vacancy andlease incentives. An outperformance of any of these metrics would clearly benefit theshare price. More specific factors involve:• Letting the ‘Red Elephant’ (largest asset in the Dutch portfolio) at acceptable rentallevels.187
<strong>Benelux</strong> <strong>Real</strong> <strong>Estate</strong> February 2010• We do not expect any major acquisitions or disposals in the near future.OutlookDividend expectationsbetween €1.55 and €1.60are conservativeAfter posting its 3Q09 results, VNOI increased its dividend per share outlook from€1.55 to a value of between €1.55 and €1.60 per share. We expect VNOI to be able tomeet the €1.60 threshold (we expect €1.62), but it should dip to €1.38 during 2010F,based on our assumptions below (see Estimates and assumptions section). VNOIaims fully to distribute its direct investment result.ValuationWe value VNOI on a 10% discount to 2010F EPRA NNNAV. The 2010F dividend yieldstands at +10%, and is not necessarily sustainable, in our view.ConsensusThe market clearly expects falling earnings for VNOI, driven by increased vacancy andincentives. Applying stringently conservative vacancy, like-for-like and portfoliovaluation assumptions (see Figure 3), we are still well ahead of consensus.Fig 2 EPS consensus estimates (€)2008 2009F 2010F 2011FConsensus 1.59 1.57 1.30 1.25ING 1.59 1.62 1.38 1.38Difference 0.00 0.05 0.08 0.13Difference (%) 0 3 6 10Source: Reuters, ING estimates_Our estimates and assumptionsConservativeassumptions forvacancies, LFL andvaluation result• Vacancies should increase from the current 12% level to 16% in mid-2010, afterwhich we expect it to improve again well below 10% through 2012F. The sharpestincrease in vacancy is expected in the Netherlands (vacancies touching 25% inmid-2010F).Fig 3 Our vacancy assumptions (%)2009F 2010F 2011F 2012FNetherlands 17.6 23.3 19.3 10.0Belgium 8.9 9.8 9.5 5.0Germany 11.6 14.8 11.8 6.0Total 15.5 15.2 13.2 6.9Source: ING estimates_• Like-for-like rental growth should be negative during 2009F, mainly owing to thecombination of low indexation and high lease incentives. This trend is expected tocontinue in 2010F, especially in the Netherlands, and should return to normal levelsthereafter.188
_<strong>Benelux</strong> <strong>Real</strong> <strong>Estate</strong> February 2010Fig 4 Our total LFL rental growth assumptions (%)2009F 2010F 2011F 2012FNetherlands -29.3 -14.0 -3.5 3.5Belgium -19.5 -4.0 1.5 4.0Germany -9.0 -3.5 1.8 3.5Total -17.0 -7.6 -0.3 3.8Note that these assumptions comprise indexation and incentives but no vacancy movements.The 2009F indexation only refers to the annualised value for the final quarter.Source: ING estimates_• Portfolio valuations should fall further, given the large exposure to secondaryoffices, which we consider as more cyclical and likely to take further hits into 2010.Fig 5 Our portfolio valuation assumptions (%)2009F 2010F 2011F 2012FNetherlands -10.3 -3.9 0.0 0.0Belgium -6.6 -3.9 0.0 0.0Germany -11.8 -1.5 -1.5 -1.5Total -8.7 -3.7 -0.2 -0.2Source: Company data, ING estimates189
_<strong>Benelux</strong> <strong>Real</strong> <strong>Estate</strong> February 2010Company profilePrimarily offices REIT inthe Netherlands,Belgium and GermanyVastNed O&I (VNOI) was founded in 1984 as VWN (Vaste Waarden Nederland) andqualifies as a closed end property investment fund with variable capital. It has beenquoted on the Euronext Amsterdam stock exchange since 1989. Its mission is to invest80-100% in offices and 20-0% in semi-industrial real estate assets spread across theNetherlands (42%), Belgium (47%) and Germany (10%). The Dutch and Belgianportfolios qualify as FBI (Fiscale Belegingsinstelling) and Bevak(Beleggingsvennootschap met vast kapitaal), which are the respective national REITlikeimplementations, resulting in zero corporate income tax liability. The Belgianportfolio is held through a 55% stake in Intervest Offices/Industrial, quoted on EuronextBrussels. Income from the German portfolio is fully subject to corporate income tax.See Figure 8 for a full overview of the organisational structure.Fig 6 Portfolio overview, end-September 2009 Fig 7 Portfolio overview, end-2008Germany10%Semiindustrial19%Belgium48%NL42%Offices81%Source: Company dataSource: Company dataPart of the VastNedGroup, internalmanagementVNOI is part of the VastNed Group and is the sister company of VastNed Retail (VNR).Both companies are managed internally by their own country management teams (theBelgian subsidiaries Intervest O/I and Intervest Retail are managed by the samecountry management and are majority owned by VastNed O/I and VastNed Retail),which are in turn supervised by their respective mother company, located inRotterdam. VNR and VNOI own 66.7% and 33.3% respectively of the shares ofVastNed Management, and the group’s management costs are spread proportionally.There is no profit being allocated to VastNed Management. We are positive on the costefficiencies (some millions of euros) and knowledge efficiencies that are realised onthe back of this shared management structure. There are 108 employees in theVastNed group who are on the payroll of VastNed Management and the relatedmanagement companies (see Figure 8).190
_<strong>Benelux</strong> <strong>Real</strong> <strong>Estate</strong> February 2010Fig 8 Organisational structure of VastNed GroupVastNed RetailVastNed Offices/IndustrialIntervest Retail(Antwerp, Belgium)VastNed RetailNetherlands(Rotterdam)77%100%66.7% 33.3% 55%VastNed Management(Rotterdam, NDL)100%IntervestOffices/Industrial(Antwerp, Belgium)VastNed OfficesNetherlands(Rotterdam)VastNed Istanbul100%100%VastNed Deutschland(Frankfurt)VastNed ManagementEspańa(Madrid)100%VastNed ManagementFrance(Paris)100%Note 1: Intervest Retail and Intervest O/I are Belgian majority-owned subsidiaries of VNR and VNOI respectively. They enjoy the Belgian REIT benefits (Bevak)and are quoted on Euronext Brussels. Apart from the VastNed participation, their shares are free float.Note 2: Intervest Retail and Intervest O/I have the same country management board (CEO and CFO), headed by Jean-Paul Sols.Note 3: The management of the Portuguese retail portfolio is located in Madrid.Source: INGFocus on (re)letting byimproving quality of theportfolio. Low likelihoodof major acquisitionsSound financingstructure; considerableLTV at 54%Disposals of smaller and secondary assets combined with investments in prime assetshave been key in VNOI’s strategy in the last few years. In 2007, VNOI acquired thesingle-tenant “Red Elephant” building in The Hague, the largest building in the Dutchportfolio (7% and 5% of Dutch portfolio appraisal value and rents end-2008respectively). Mid-2009, the tenant of the “Red Elephant” left after lease expiration,leading to a 400bp drop in the occupancy rate of the Dutch portfolio to almost 20%.When the first problems in the financial sector became clear at end-2007, VNOI’sstrategy shifted to (re)letting and improving the overall quality and marketability of theportfolio among others by investing in the sustainability of the portfolio. Consistent withthis strategy, the “Red Elephant” building has been subject to a considerablerenovation. We believe there is a low likelihood of considerable acquisitions in thefuture.The start of the problems in the financial sector, the yield decompression anddecreasing rents have led to an early and comprehensive refinancing and covenantrevision during 4Q08 of the loan portfolio relating to the Dutch and German portfolio,totalling c.€370m. The current financial debt totals c.€590m, of which 69% is floating.Average interest rate 9M09 was 3.8%, and should increase on the larger marginsrelated to recent refinancing. Unused facilities are estimated at c.€30m. Loan to value(LTV) is considerable at 54%.191
__<strong>Benelux</strong> <strong>Real</strong> <strong>Estate</strong> February 2010Fig 9 Financial debt overview, end-Sept 2009 Fig 10 Financial debt overview, end-Sept 2009Floating31%Short term9%Fixed69%Source: Company data, ING estimatesSource: Company data, ING estimatesLong term91%_PortfolioOver-rented portfolioand lease expiries forceVNOI to focus onoccupancy rates atdecent conditionsIn Figure 11, some major metrics are presented per geographical segment. With NVOIbeing over-rented and confronted with considerable lease expiries (18% INGF) during2010, we believe the company is likely to pay a price in the form of capex, leaseincentives and temporary increase operational expenses in order to increase its rentallevel.Fig 11 Key portfolio indicatorsNetherlands Belgium GermanyTotalportfolioOver/under-rented, end-2008 (%) -2.2 -11.4 -3.0 -6.5Occupancy, September 2009 (%) 80 90 84 88Avg. lease duration to first break, end-2008 (yrs) 3.4 3.7 3.7 3.6No. of properties, end-2008 103 61 5 169Average gross rent/property (€m) 0.4 0.7 1.3 0.5Number of tenants, end-2008 299 209 38 546Average gross rent/tenant (€m) 0.13 0.21 0.17 0.16Net theoretical yield, 2008 7.7 8.6 6.3 7.8Lease incentives (% of FY08 theoretical gross rent) 19 15 13 17Estimated lease expiries FY10 (% of gross rents) 15 20 8 18Source: Company data, ING estimatesFig 12 Average rent (€/m²/year) during FY08250200€/m²/year150100500OfficesSemiIndustrialTotal Offices SemiIndustrialTotalOfficesThe Netherlands Belgium GermanySuper cities Large cities Medium sized cities Small citiesNote: Super cities >500,000 inhabitants; large cities 150,000 to 500,000 inhabitants; medium cities 50,000-150,000inhabitants and small cities
__<strong>Benelux</strong> <strong>Real</strong> <strong>Estate</strong> February 2010Primary exposure tosmall and medium-sizedcitiesVNOI’s portfolio is allocated primarily to small and medium-sized cities (500,000 inhabitants respectively). This is incontrast with Cofinimmo and Befimmo, which are present primarily in Brussels(Cofinimmo also has nursing homes and pubs, which are spread throughout Belgiumand France, and Belgium and the Netherlands).Fig 13 Regional spread (% of FY08 appraisal value)Medium sizedcities32%Small cities33%Large cities16%Super cities19%Source: Company dataFigures 14-16 illustrate the largest assets in the Dutch and the Belgian portfolio.Fig 14 Top ten assets according to appraisal value in the Netherlands, end-2008NameCityFY08appraisalvalue (€m)% of Dutchportfolioend-2008FY08 grosstheoreticalrent (€m)% of DutchportfolioOccupancyend-2008No. oftenants‘Red Elephant’, Zuid Hollandlaan* The Hague 30 7 2.1 5 100 1Schendelstraat Utrecht 25 5 1.8 5 100 6Stramanweg Amsterdam 20 4 1.9 5 77 28Jardinstraat Amsterdam 14 3 1.1 3 100 1van der Mandelelaan Rotterdam 13 3 1.4 4 28 1Europalaan s'Hertogenbosch 11 2 1.2 3 86 4Europaweg Zoetermeer 11 2 1 3 100 1Cessnalaan Schiphol 9 2 0.7 2 100 1Fokkerweg Amsterdam 9 2 0.8 2 90 14Weg der Verenigde Naties Utrecht 8 2 0.6 2 100 2Total 150.6 33 12.6 32 59Note: the ‘Red Elephant’ building in the Hague has been fully vacant since mid July 2009. It is undergoing considerable renovation and at the time of writing wehave not had any news on reletting.Source: Company data‘Red Elephant’ in TheHague is still vacantMid-2009, the departure of the tenant of the ‘Red Elephant’ building in The Haguecontributed to a drop in occupancy rate of the Dutch portfolio of c.4% to
__<strong>Benelux</strong> <strong>Real</strong> <strong>Estate</strong> February 2010Fig 15 Top ten assets in Belgium according to appraisal value, end-2008NameCityFY08 % of Belgianappraisal portfolio endvalue(€m) 2008FY08 grosstheoreticalrent (€m)% of BelgianportfolioOccupancyend-2008No. oftenantsSchaliënhoevedreef Mechelen 89 17 8.5 19 93 52Woluwedal Woluwe 66 13 5.1 12 92 1de Wittelaan Mechelen 48 9 5.3 12 92 44Blarenberglaan Mechelen 26 5 2.4 5 100 1Veurtstraat Puurs 25 5 2.1 5 100 1Atealaan Herentals 24 5 1.5 3 100 9Berkenlaan Diegem 18 4 1.5 3 100 1Berkenlaan Diegem 18 3 1.4 3 100 1Brusselstraat Antwerp 16 3 1.6 4 87 7Boomsesteenseweg Wilrijk 15 3 1.4 3 100 1Total 344.5 67 30.8 70 118Note: Woluwe and Diegem are located in the Brussels peripherySource: Company dataBelgium: IntervestOffices IndustrialGermany: building uppresenceVastNed Belgium’s portfolio is taken up by Intervest Offices/Industrial, in which VNOIhas a 55% stake. The offices are located on mainly secondary locations on theAntwerp/Brussels axis, while the logistics assets are located close to national andinternational motorways. Leases are primarily concluded on a 3/6/9-year basis, while5/7/9 is becoming more common. The average lease duration stands at 3.7 years,which is substantially below Cofinimmo and Befimmo (9 yearsrespectively). The Belgian portfolio does not have a large proportion of rents receivedfrom public tenants, which reduces the quality of rental income compared withCofinimmo or Befimmo. The Belgian office market is characterised by substantialoversupply due to a large speculative pipeline, primarily in the Brussels CBD.The German portfolio only comprises five office properties, situated in very liquid officemarkets. VNOI is present in Düsseldorf and Frankfurt, and plans to limit its exposure tothe top five cities by population in Germany (Berlin, Düsseldorf, Frankfurt, Hamburgand Munich).Fig 16 Top 10 tenants in the Netherlands, Belgium and Germany, according to FY08 theoreticalrents (€m)NameNetherlands Belgium GermanyTheoreticalrental incFY08 (€m)% of totalportfoliorental incNameTheoreticalrental incFY08 (€m)% of totalportfoliorental incNameTheoretical % of totalrental inc portfolioFY08 (€m) rental incDe Brauw Blackstone2.5 2.5 PricewaterhouseCoopers 10.6 10.4 Victoria Versicherung 2.1 2.0WestbroekRijksgebouwendienst 1.9 1.9 Tibotec 7.5 7.4 A.T. Kearney 1.2 1.2Prorail 1.6 1.5 Deloitte/GSI 7.2 7.1 A.C. Nielsen 1.2 1.1Rexel 1.4 1.3 EDS 5.2 5.1 Invensys 0.5 0.5Gemeente Amsterdam 1.3 1.2 Fiege Kalf 4.6 4.5 Moneymaxx 0.3 0.3RDW 1.1 1.1 Brico 3.5 3.4 Royal Bank of Scotland 0.2 0.2Imtech 0.9 0.9 Borealis 2.5 2.5 Gruner+Jahr 0.2 0.2ROC 0.9 0.9 PGZ Retail Concept 2.4 2.4 Claus Koch Identity 0.1 0.1Shell 0.8 0.8 JVC 2.3 2.3 C.I.G. Caravaning 0.1 0.1Interxion 0.8 0.8 European Commission 2.2 2.2 TK Maxx 0.1 0.1Total 13.2 12.9 Total 48.2 47.3 6.0 5.9Source: Company data194
<strong>Benelux</strong> <strong>Real</strong> <strong>Estate</strong> February 2010Corporate governanceTop managementCEO Reinier van Gerrevink, statutory director• CEO of VastNed Group since 2002• Previously several management functions at ABN AMRO, Rodamco and Robeco• Degree in Dutch law from the University of UtrechtCFO Tom de Witte• CFO of VastNed Group since 2003• Previously an accountant at Deloitte• Degrees in business economics, Dutch law and accounting, Erasmus University ofRotterdamVastNed Group issearching for a new CIOCOO: replaced by top managementHans Pars, former CIO of VNR and VNOI, decided to leave the company mid-2009 inorder to accept a new challenge as the CEO of Wereldhave NV. His function is sharedtemporarily between the other members of top management.General counsel and director, investor relations, Arnaud du Pont• General counsel and director of investor relations since 2000• Previously tax adviser with BDO and PricewaterhouseCoopers• Degree in tax law, Erasmus University RotterdamDirector, Wim Fieggen• Director, strategy and planning since 2003• Previously with Robeco, Rodamco, Roproperty and Altera• Degree in economics, Erasmus University RotterdamShareholder structureFigure 17 presents the main shareholders with more than 5% of the shares of VNOI.There is no shareholding agreement between any of these shareholders. As a result,the shares are 100% free float.195
_<strong>Benelux</strong> <strong>Real</strong> <strong>Estate</strong> February 2010Fig 17 Major holders as of 20 January 2010Cohen & Steers10%Nomura AssetManagement8%Fortis Investments6%Sumitomo MitsuiAM5%Other66%CommonwealthBank of Australia5%Source: Bloomberg196
__<strong>Benelux</strong> <strong>Real</strong> <strong>Estate</strong> February 2010FinancialsFig 18 Balance sheet (€m)2007 2008 2009F 2010F 2011F 2012F 2013F 2014FTotal investment properties 1,189.9 1,167.0 1,067.3 1,028.0 1,026.3 1,024.7 1,023.2 1,021.6Total fixed assets 1,198.8 1,168.1 1,068.9 1,029.5 1,027.8 1,026.2 1,024.7 1,023.1Total current assets 18.3 21.0 22.8 26.6 42.9 62.7 81.2 100.8Total assets 1,217.2 1,189.1 1,091.6 1,056.1 1,070.8 1,089.0 1,105.9 1,123.9Equity VNOI shareholders 509.4 434.1 342.8 320.4 326.2 334.9 343.2 352.1Equity minority interests 142.6 134.3 117.4 109.8 114.1 119.8 125.6 131.8Total equity 652.1 568.4 460.2 430.2 440.2 454.7 468.7 483.8Deferred tax liabilities 0.9 0.5 (0.3) (1.1) (1.2) (1.2) (1.2) (1.2)Long-term interest-bearing loans 409.4 310.4 538.0 538.0 538.0 538.0 538.0 538.0Financial derivatives 0.0 9.7 21.0 21.0 21.0 21.0 21.0 21.0Guarantee deposits 1.3 1.2 1.3 1.3 1.3 1.3 1.3 1.3Total long-term liabilities 411.7 321.8 559.9 559.1 559.1 559.1 559.0 559.0Payables to banks 104.5 260.5 25.1 23.5 25.1 26.4 27.4 28.5Redemption long-term liabilities 15.3 18.4 24.2 22.6 24.1 25.4 26.4 27.4Income tax 4.3 1.5 1.0 0.9 1.0 1.0 1.1 1.1Other liabilities and accruals 29.4 18.6 21.3 19.9 21.2 22.4 23.2 24.1Total short-term liabilities 153.4 298.9 71.6 66.8 71.4 75.2 78.1 81.1Total equity and liabilities 1,217.2 1,189.1 1,091.6 1,056.1 1,070.8 1,089.0 1,105.9 1,123.9Source: Company data, ING estimatesFig 19 Profit and loss (€m)2007 2008 2009F 2010F 2011F 2012F 2013F 2014FGross rents 85.4 89.0 84.0 73.6 73.0 80.2 83.3 86.5Operating expenses (9.3) (10.3) (10.6) (9.6) (9.5) (10.4) (10.8) (11.2)Net rents 74.6 77.2 71.9 64.0 63.5 69.8 72.4 75.2Total value movement investment properties 15.2 (55.4) (99.4) (39.4) (1.6) (1.6) (1.6) (1.5)Net result on disposals of investment properties (4.5) 0.5 (0.2) 0.0 0.0 0.0 0.0 0.0Net income from investment properties 85.3 22.3 (27.8) 24.6 61.9 68.2 70.9 73.7Total interest (21.4) (25.8) (22.2) (21.6) (21.3) (20.5) (19.8) (19.0)Value movements in fin derivatives 0.0 0.0 (0.3) 0.0 0.0 0.0 0.0 0.0Net financing expenses (21.4) (25.8) (22.4) (21.6) (21.3) (20.5) (19.8) (19.0)General expenses (5.4) (6.0) (5.5) (5.1) (5.1) (5.6) (5.8) (6.1)Total expenses (26.8) (31.8) (27.9) (26.8) (26.4) (26.1) (25.6) (25.1)Investment result before tax 58.5 (9.5) (55.7) (2.2) 35.5 42.0 45.3 48.6Income tax payable 0.0 0.0 0.0 (0.1) (0.1) (0.2) (0.2) (0.2)Movement in deferred tax assets and liabilities 0.0 0.4 1.1 0.8 0.0 0.0 0.0 0.0Investment result after taxes 58.5 (9.0) (54.6) (1.5) 35.4 41.9 45.1 48.5Investment result attributable to minority interests (17.9) (6.8) 2.9 (0.5) 10.6 12.6 13.5 14.5Total investment result attributable to VNOI SH 40.7 (15.8) (51.7) (2.0) 46.0 54.5 58.7 63.0Total direct result 47.9 45.4 44.2 37.1 37.0 43.5 46.7 50.0Attributable to minority interests (12.9) (12.9) (13.8) 11.1 11.1 13.0 14.0 15.0Attributable to VNOI SH 35.0 32.5 30.3 26.0 25.9 30.4 32.7 35.0Total indirect result 10.6 (54.5) (98.8) (38.6) (1.6) (1.6) (1.5) (1.5)Attributable to minority interests (5.0) 6.1 16.7 (11.6) (0.5) (0.5) (0.5) (0.5)Attributable to VNOI SH 5.6 (48.3) (82.1) (27.0) (1.1) (1.1) (1.1) (1.1)Source: Company data, ING estimates197
__<strong>Benelux</strong> <strong>Real</strong> <strong>Estate</strong> February 2010Fig 20 Cash flow statement (€m)2007 2008 2009F 2010F 2011F 2012F 2013F 2014FTotal investment result 58.5 (9.0) (54.6) (1.5) 35.4 41.9 45.1 48.5Value movements investment properties (15.2) 55.4 99.4 39.4 1.6 1.6 1.6 1.5Movement current assets (6.1) (2.2) (1.6) 0.9 (0.9) (0.8) (0.6) (0.6)Movement short-term liabilities 1.7 (2.6) (5.1) (4.7) 4.6 3.8 2.9 3.0Movement provisions 0.0 0.0 0.0 0.0 0.0 0.0 0.0 0.0CF from operations 43.3 39.8 39.5 34.1 40.7 46.5 49.0 52.4Acquisitions and investments (201.1) (73.7) (5.8) 0.0 0.0 0.0 0.0 0.0Disposals 151.2 29.0 11.9 0.0 0.0 0.0 0.0 0.0Acquisitions and disposals of shares in subsidiaries (20.1) 0.0 0.0 0.0 0.0 0.0 0.0 0.0CF from property (70.1) (44.7) 6.1 0.0 0.0 0.0 0.0 0.0Movement tangible fixed assets 0.1 0.1 0.0 0.0 0.0 0.0 0.0 0.0CF from investments (70.1) (44.6) 6.1 0.0 0.0 0.0 0.0 0.0Share issues 49.5 0.0 0.0 0.0 0.0 0.0 0.0 0.0Share buyback 0.0 (10.0) 0.0 0.0 0.0 0.0 0.0 0.0Dividend paid-group share (34.4) (34.4) (40.6) (21.4) (19.0) (20.6) (23.3) (25.0)Dividend paid to minority interests (13.1) (12.2) 0.0 (7.1) (6.3) (6.9) (7.8) (8.3)Interest-bearing loans drawn down 149.0 75.4 41.9 0.0 0.0 0.0 0.0 0.0Interest-bearing loans redeemed (121.7) (15.5) (40.3) (0.8) 0.0 0.0 0.0 0.0CF from finance 29.2 3.3 (39.0) (29.3) (25.3) (27.5) (31.1) (33.4)Net movement in cash and equivalents 2.4 (1.5) 6.6 4.8 15.4 19.1 17.9 19.0Opening cash balance 0.9 3.4 1.9 8.5 13.3 28.6 47.7 65.6Closing cash balance 3.4 1.9 8.5 13.3 28.6 47.7 65.6 84.6Source: Company data, ING estimatesFig 21 Per share data (€)2007 2008 2009F 2010F 2011F 2012F 2013F 2014FYE no. of shares (fully diluted, m) 20,697,319 18,735,153 18,782,879 18,782,879 18,782,879 18,782,879 18,782,879 18,782,879Direct result per share 1.7 1.6 1.6 1.4 1.4 1.6 1.7 1.9Indirect result per share 0.3 (2.4) (4.4) (1.4) (0.1) (0.1) (0.1) (0.1)Total investment result per share 2.0 (0.8) (2.8) (0.1) 1.3 1.6 1.7 1.8Declared dividend per share 1.7 1.6 1.6 1.4 1.4 1.6 1.7 1.9Interim dividend 0.0 0.0 0.0 0.0 0.0 0.0 0.0 0.0IFRS NAV per share 24.6 23.2 18.2 17.1 17.4 17.8 18.3 18.7Diluted EPRA NAV per share 24.3 23.6 19.3 18.1 18.4 18.9 19.3 19.8Diluted EPRA NNNAV per share 24.6 23.2 19.0 18.0 18.3 18.8 19.2 19.7Source: Company data, ING estimatesFully distribute directresult, with an interimdividendThe dividend is paid in the form of an interim dividend set at 60% of the directinvestment result of the first six months of the year (fully paid in cash), payable in thethird quarter of each year, and a final dividend equal to the remaining undistributeddirect result at the end of the year, payable in the second quarter of the following year.As a consequence, both VNOI and VNR are aiming to distribute fully the directinvestment result per share. At the discretion of shareholders, a small portion of thefinal dividend payment could be paid in shares, charged to the premium share reserve.198
__<strong>Benelux</strong> <strong>Real</strong> <strong>Estate</strong> February 2010Fig 22 Quarterly profit and loss (€m)4Q08 1Q09 2Q09 3Q09 4Q09F 1Q10F 2Q10F 3Q10F 4Q10FGross rents 22.4 22.1 21.7 20.9 19.3 19.0 18.5 18.0 18.1Operating expenses (2.9) (2.8) (2.8) (2.5) (2.5) (2.5) (2.4) (2.3) (2.3)Net rents 18.9 18.9 18.4 17.7 16.8 16.5 16.1 15.7 15.7Total value movement investment properties (47.2) (40.4) (21.7) (14.3) (22.9) (15.5) (10.0) (9.3) (4.6)Net result on disposals of investment properties (0.1) 0.1 (0.2) (0.1) 0.0 0.0 0.0 0.0 0.0Net income from investment properties (28.4) (21.4) (3.5) 3.3 (6.1) 1.1 6.1 6.3 11.1Total interest (6.6) (5.7) (5.0) (6.2) (5.3) (5.3) (5.3) (5.5) (5.4)Value movements in fin derivatives 0.0 0.0 0.0 (0.3) 0.0 0.0 0.0 0.0 0.0Exchange rate differences 0.0 0.0 0.0 0.0 0.0 0.0 0.0 0.0 0.0Net financing expenses (6.6) (5.7) (5.0) (6.4) (5.3) (5.3) (5.3) (5.5) (5.4)General expenses (1.6) (1.4) (1.5) (1.3) (1.4) (1.3) (1.3) (1.3) (1.3)Total expenses (8.2) (7.0) (6.5) (7.8) (6.6) (6.7) (6.6) (6.8) (6.7)Investment result before tax (36.6) (28.5) (10.0) (4.5) (12.8) (5.6) (0.5) (0.4) 4.4Income tax payable 0.2 0.0 0.1 0.0 0.0 0.0 0.0 0.0 0.0Movement in deferred tax assets and liabilities 0.4 0.3 0.1 0.2 0.5 0.3 0.2 0.2 0.1Investment result after taxes (36.1) (28.2) (9.9) (4.2) (12.3) (5.3) (0.4) (0.3) 4.4Investment result attributable to minority interests 2.6 2.9 (1.8) 0.0 1.8 (1.6) (0.1) (0.1) 1.3Total investment result attributable to VNOI SH (33.4) (25.3) (11.7) (4.3) (10.5) (6.9) (0.5) (0.4) 5.8Total direct result 10.8 11.8 12.0 10.2 10.1 9.9 9.4 8.9 9.0Attributable to minority interests (3.3) (3.5) (3.5) (3.4) (3.4) 3.0 2.8 2.7 2.7Attributable to VNOI SH 7.5 8.3 8.5 6.8 6.8 6.9 6.6 6.2 6.3Total indirect result (46.9) (40.0) (21.9) (14.5) (22.5) (15.2) (9.8) (9.1) (4.5)Attributable to minority interests 6.0 6.4 1.7 3.4 5.2 (4.5) (2.9) (2.7) (1.4)Attributable to VNOI SH (40.9) (33.6) (20.1) (11.1) (17.3) (10.6) (6.8) (6.4) (3.2)Source: Company data, ING estimatesFig 23 Quarterly cash flow statement (€m)4Q08 1Q09 2Q09 3Q09 4Q09F 1Q10F 2Q10F 3Q10F 4Q10FTotal investment result (36.1) (28.2) (9.9) (4.2) (12.3) (5.3) (0.4) (0.3) 4.4Value movements investment properties 47.2 40.4 21.7 14.3 22.9 15.5 10.0 9.3 4.6Net result on disposals investment properties 0.1 (0.1) 0.2 0.1 0.0 0.0 0.0 0.0 0.0Movement current assets (2.4) (2.4) 0.0 (0.2) 0.9 0.2 0.4 0.3 0.0Movement short-term liabilities (4.4) 3.9 (2.5) (0.6) (5.8) (1.2) (2.1) (1.6) 0.2CF from operations 5.1 13.9 8.7 11.3 5.7 9.2 8.0 7.7 9.2Acquisitions and investments (3.5) (3.2) (1.0) (1.6) 0.0 0.0 0.0 0.0 0.0Disposals 0.8 5.1 3.4 3.3 0.0 0.0 0.0 0.0 0.0CF from property (2.6) 1.9 2.4 1.7 0.0 0.0 0.0 0.0 0.0Movement tangible fixed assets 0.1 0.0 0.0 0.0 0.0 0.0 0.0 0.0 0.0CF from Investments (2.6) 1.8 2.5 1.8 0.0 0.0 0.0 0.0 0.0Share issues 0.0 0.0 0.0 0.0 0.0 0.0 0.0 0.0 0.0Share buyback (10.0) 0.0 0.0 0.0 0.0 0.0 0.0 0.0 0.0Dividend paid-group share 9.6 0.0 (20.0) (20.6) 0.0 0.0 (15.3) (6.1) 0.0Dividend paid to minority interests (12.2) 0.0 (7.2) 7.2 0.0 0.0 (5.1) (2.0) 0.0Interest-bearing loans drawn down 8.8 38.7 (17.3) 20.5 0.0 0.0 0.0 0.0 0.0Interest-bearing loans redeemed (3.9) (53.6) 38.7 (24.8) (0.5) (0.3) (0.2) (0.2) (0.1)CF from finance (7.7) (14.9) (5.8) (17.8) (0.5) (0.3) (20.6) (8.3) (0.1)Net movement in cash and equivalents (5.3) 0.8 5.3 (4.7) 5.3 8.9 (12.6) (0.5) 9.1Opening cash balance 7.1 1.9 2.7 8.0 3.2 8.5 17.3 4.7 4.2Closing cash balance 1.9 2.7 8.0 3.2 8.5 17.3 4.7 4.2 13.3Source: Company data, ING estimates199
_<strong>Benelux</strong> <strong>Real</strong> <strong>Estate</strong> February 2010Fig 24 Quarterly per share data (€)4Q08 1Q09 2Q09 3Q09 4Q09F 1Q10F 2Q10F 3Q10F 4Q10FYE no. of shares (fully diluted, m) 18,735,153 18,735,053 18,782,879 18,782,879 18,782,879 18,782,879 18,782,879 18,782,879 18,782,879Direct result per share 0.40 0.44 0.45 0.36 0.36 0.37 0.35 0.33 0.33Indirect result per share (2.18) (1.79) (1.07) (0.59) (0.92) (0.56) (0.36) (0.34) (0.17)Total investment result per share (1.78) (1.35) (0.62) (0.23) (0.56) (0.20) (0.01) (0.01) 0.17Declared dividend per share 0.00 0.00 0.00 0.00 0.00 0.00 0.00 0.00 0.00Interim dividend 0.00 0.00 0.00 0.53 0.00 0.00 0.00 0.43 0.00IFRS NAV per share 23.17 21.41 19.74 18.81 18.25 18.05 17.22 16.89 17.06Diluted EPRA NAV per share 23.63 22.28 20.54 19.80 19.26 19.08 18.26 17.94 18.11Diluted EPRA NNNAV per share 23.17 21.84 20.10 19.39 18.91 18.80 18.00 17.71 17.92Recurring CFPS 0.76 0.82 0.83 0.73 0.72 0.37 0.35 0.33 0.33Source: Company data, ING estimates200
__<strong>Benelux</strong> <strong>Real</strong> <strong>Estate</strong> February 2010NetherlandsVastNed RetailPan-euro high street property fundJean-Yves DevlooAmsterdam (31) 20 563 8745jean-yves.devloo@ing.comArjan KnibbeAmsterdam (31) 20 563 8780arjan.knibbe@ing.comInitiating coverageBuy<strong>Real</strong> <strong>Estate</strong>5 February 2010€46.6Target price (12 month)€50.7ReutersVASN.ASVNR has performed strongly since its March 2009 lows.Trading at an attractive 0.9x 2010F IFRS NAV, we believeVNR still has upside. VNR will profit from favourable rentreversion and quality acquisitions. We initiate with Buy.We are conservative on occupancy levels and total like for like, assumingvacancy levels reach 5% by mid 2010 and additional incentives. We expectsecondary retail to continue to underperform prime retail. VNR has c.45% ofits portfolio in high street retail and is currently cheap, in our view.Sensitivity of our 2010F EPS to vacancy and total like-for-like (€)Vacancy rate (%)2.5 3.5 4.5 5.5 6.5 7.5 8.5 9.5-2 3.79 3.72 3.66 3.59 3.53 3.46 3.39 3.33-1 3.85 3.79 3.72 3.66 3.59 3.52 3.46 3.390 3.89 3.82 3.75 3.69 3.62 3.56 3.49 3.42LFL (%) 1 3.95 3.88 3.82 3.75 3.69 3.62 3.55 3.492 4.01 3.95 3.88 3.81 3.75 3.68 3.62 3.553 4.08 4.01 3.94 3.88 3.81 3.75 3.68 3.614 4.14 4.07 4.01 3.94 3.88 3.81 3.74 3.685 4.20 4.14 4.07 4.00 3.94 3.87 3.81 3.74Source: ING estimatesKey ratios and forecasts2008 2009F 2010F 2011F 2012FEPS adj (€) 3.71 4.05 3.77 3.85 3.93PER (x) 12.6 11.5 12.4 12.1 11.9Net yield (%) 5.8 6.2 6.1 6.1 6.2IFRS NAV per share (€) 60.8 51.6 50.7 51.4 52.2EPRA NAV per share (€) 64.3 54.9 54.0 54.7 55.5P/IFRS NAV (%) 0.77 0.90 0.92 0.91 0.89DPS (€) 3.85 4.05 3.77 3.85 3.93Dividend yield (%) 8.3 8.7 8.1 8.3 8.4CFPS (€) 4.23 4.78 3.77 3.85 3.93LTV (%) 42.1 41.3 41.7 41.2 40.612-month forecast returns (%)Share price 8.7Dividend 8.112m f'cst total return 16.8Key ratios2008 2009FTurnover growth (%) 9.5 -0.9EBITDA margin (%) 88.5 88.5Operating margin (%) 97.8 96.1Share dataNo. of shares (m) 18.3Daily turnover (shares) 58,000Free float (%) 100Enterprise value (€m) 851.25Market cap (€m) 1,746.34Share price performance807060504030201/08 7/08 1/09 7/09 1/10Source: INGPriceAMX (rebased)Source: Company data, ING estimates201
<strong>Benelux</strong> <strong>Real</strong> <strong>Estate</strong> February 2010Investment caseVastNed Retail is an investor in retail property with a €1.9bn portfolio in fivecountries. The company specialises in high street retail and smaller shoppingcentres. Recently, VNR has invested c.€24m in Turkish high street retail and€20m in a shopping centre in Lelystad, the Netherlands. VNR raised €76mduring the September 2009 accelerated equity issue. Together with unuseddebt facilities, VNR now has c.€200m of immediate firepower which we expectto be used in opportunistic acquisitions, primarily in high street retail. VNR’sportfolio was c.6% over-rented at the start of 2009. VNR is well placed toprevent a large increase in vacancy rate thanks to the reversionary potentialand increased managerial focus resulting from the gradual disposal of smaller,management-intensive assets. We believe VNR is cheap at c.9x 2010F IFRSNAV. We closely monitor the acquisition and disposal programme. Spotvacancy rate at 30 September 2009 was 96.9% (NL: 98.0%).SWOTFig 1 SWOT analysisStrengthsDetailed and complete financial reportingc.€200m of firepowerDisposal of smaller assets improved VNR’s risk profile6.1% under-rented portfolio end-2008 allows for near-term upward leasepotentialShared management structure with VastNed Offices Industrial results incost efficiencies and knowledge sharingDiversification towards TurkeyOpportunitiesAcquisitions, many opportunistic possibilities in SpainIncrease rents by catching reversionary potentialAdd developments to catch more cyclical exposure in an upturnWeaknessesLeases in Spain are not protected against deflationSmall assets are still management intensiveThreats/RisksDutch government plans to limit Sunday trading in theNetherlands could impose a serious risk on footfallPolitical risk in TurkeyCurrency risks in TurkeySource: ING_RisksBecause of the contractual nature of a large part of the recurring cash flows, propertycompanies are usually considered to have less risk than most other equity sectors.The risks of property companies have a strong correlation to the amount ofdevelopment exposure, the geographical and sector breakdown, corporate governanceand the alignment of interests between management and shareholders.Principally an investorSecondary retail is moreresilient compared tooffices and industrialIn our view, VNR carries low risk as its main activity is investing in property, and it hasa limited development pipeline which we estimate at c.€45m. VNR has exposure tomainly secondary retail. We expect retail to outperform offices and logistics, butsecondary retail to underperform prime retail throughout 2010.202
<strong>Benelux</strong> <strong>Real</strong> <strong>Estate</strong> February 2010Tenant risk is not limitedH&M and Inditex do notrepresent major risk, inour viewVNR’s top two tenants were H&M and Inditex, taking c.4% and 2% of FY08 total rentroll,respectively. We find the business models of both retailers fairly comparable andexpect them to hold up well in the current economic circumstances.Vacancy riskUnder-rented portfolioshould support goodoccupancy levelsAt end-September 2009, VNR had a vacancy rate of c.3%, which we assume willincrease only slightly taking into account additional incentives on new leases andrenewals, which are primarily expected in Spain. The portfolio, which is currently c.6%under-rented, has benefited from higher rental levels on new lettings and renewals(especially in Belgium), a trend which we expect to continue into 2010.Accounting for leasesPotential pressure onlease lengthAccounting initiatives may oblige tenants to account for long leases as a liability in theirbalance sheets. In future, this may put pressure on the average lease lengths of realestate companies and VNR.No currency risksVNR receives nearly all its rents and incurs all its costs in euro. VNR tries to realiseTurkish rents mostly in euro, but this remains a small risk.CatalystsMajor catalysts for VNR include:1) Accretive acquisitions at fire sale prices (taking into account the current firepowerof c.€200m)2) Lease renewals and new lettings at significantly higher rental levels (e.g. asobserved in Belgium during 9M09), catching the reversionary potential3) Increase of pre-let developments at attractive yield on cost levels4) A further deterioration of retail vacancy rates in the Netherlands5) FY09 results on 5 March 2010.OutlookWe expect VNR to beatthe €4.00 direct resultper share forecastVNR confirmed its FY09 direct result EPS outlook of €4.00 in its 9M09 resultscommunication. We expect a slightly higher full year result at €4.05, this being slightlypositively influenced by the €20m Lelystad shopping centre acquisition of lateDecember 2009. As VNR intends to fully distribute its direct result, dividend per shareis expected to be €4.05. We do not expect this dividend to be sustainable into 2010 aswe forecast a 7% decrease in EPS on the back of conservative vacancy and like-forlikeassumptions.ValuationWe value VNR in line with its 2010F IFRS NAV, reaching a price target of €50.7.Dividend yield is solid at 8.1%, among the highest in the sector, although we do notexpect this will be sustainable into 2010.203
___<strong>Benelux</strong> <strong>Real</strong> <strong>Estate</strong> February 2010ConsensusFig 2 Consensus estimates (€)2008 2009F 2010F 2011FConsensus 3.71 3.95 3.75 3.71ING 3.71 4.05 3.77 3.85Difference 0.00 0.10 0.02 0.14Difference (%) 0 2.5 0.6 3.7Source: Reuters, ING estimatesWe expect VNR to slightly outperform its 2009F EPS guidance, as opposed toconsensus estimates.Our estimates and assumptions1) Development pipeline: we have not factored any future developments into ourforecasts.2) Vacancies: we expect total vacancies to edge up to 5% by mid-2010, andgradually fall thereafter.Fig 3 Vacancy assumptions overview (%)2009F 2010F 2011F 2012FNetherlands 2.5 2.8 2.0 2.0Spain 4.0 4.4 4.0 4.0France 1.0 1.6 1.5 1.5Belgium 1.0 1.6 1.5 1.5Turkey 32.6 12.5 10.0 10.0Portugal 1.0 1.8 1.0 1.0Total 3.9 4.3 3.4 3.4Source: ING estimates3) Like-for-like rental growth: note that this figure includes indexation, but alsoincentives and rent renegotiations. We believe we are conservative taking intoaccount the under-rented portfolio, which is demonstrated by recent re-lettings atsignificantly higher rental levels (e.g. in Belgium).Fig 4 Total like-for-like rental growth assumptions (%)2009F 2010F 2011F 2012FNetherlands -1.5 1.3 1.5 2.5Spain -2.0 0.5 0.9 1.9France -2.5 0.2 1.0 2.0Belgium -2.5 0.2 1.0 2.0Turkey 0.0 7.0 7.0 7.0Portugal -7.0 -2.0 -2.0 -2.0Total -2.5 0.5 0.7 1.6Source: ING estimates4) Portfolio valuations: we believe the portfolio will have been hit hardest duringFY09, and some minor adjustments will probably follow in Spain, where theunderlying fundamentals are weakest.204
_<strong>Benelux</strong> <strong>Real</strong> <strong>Estate</strong> February 2010Fig 5 Portfolio valuation estimates (%)2009F 2010F 2011F 2012FNetherlands -3.1 -1.0 0.0 0.0Spain -17.9 -4.4 0.0 0.0France -6.2 0.0 0.0 0.0Belgium -0.2 0.0 2.0 2.0Turkey 1.9 0.0 2.0 2.0Portugal -6.8 0.0 0.0 0.0Total -7.5 -1.4 0.4 0.4Source: ING estimates205
_<strong>Benelux</strong> <strong>Real</strong> <strong>Estate</strong> February 2010Company profileMid-sized retail investorin developed Europeand TurkeyVastNed Retail (VNR) was founded in 1986 and invests in three types of retail assets:high street retail shops (€907m), shopping centres (€826m) and retail warehouses(€262m). Assets are located in its four home markets (the Netherlands, France, Spainand Belgium) and recently less than €50 million emerging market exposure was builtup in Turkey, where VNR decided to (temporarily) limit its exposure to 10% of the totalportfolio (current exposure is limited at c.1%). There is also a limited presence inPortugal (€13m, fully let), but there is no intention to grow further in this country. VNRwas floated on the NYSE Euronext Amsterdam and Paris exchanges in 1987 and2004, respectively. The portfolio value totalled €1.9bn at end-3Q09. The Dutch andBelgian portfolio qualify as a FBI (“Fiscale Belegingsinstelling”) and a Bevak(“Beleggingsvennootschap met vast kapitaal”), which are the respective national REITlikeimplementations, resulting in zero corporate income tax liability. The Belgianportfolio is held through a 71% stake in Intervest Retail, quoted on Euronext Brussels.See Figure 8 for a full overview of the organisational structure.Fig 6 Geographic overview end-September 2009 Fig 7 Overview by type of asset end-2008France22%Belgium16%Turkey1%Spain23%Portugal1%Netherlands37%Retailwarehouses13%Shoppingcentres41%Other1%High streetshops45%Source: Company dataSource: Company dataPart of the VastNedGroup, internalmanagementVNR is part of the VastNed Group and is the sister company of VastNedOffices/Industrial (VNOI). Both companies are internally managed by their own countrymanagement teams. The Belgium-listed subsidiaries, Intervest O/I and Intervest Retail,are managed by the same country management and are majority owned by VastNedO/I and VastNed Retail. The local teams are supervised by their respective mothercompany, located in Rotterdam, the Netherlands. VNR and VNOI respectively own66.7% and 33.3% of the shares of VastNed Management, and the group managementcosts are spread proportionally. There is no profit being allocated to VastNedManagement. We are positive on the cost efficiencies (some millions of Euros) andknowledge efficiencies that are realised on the back of this shared managementstructure. There are 108 employees in the VastNed group, which are on the payroll ofVastNed Management and related companies (see organisation chart).206
_<strong>Benelux</strong> <strong>Real</strong> <strong>Estate</strong> February 2010Fig 8 Organisational structure of VastNed Group(Paris)VastNed RetailsVastNed Offices/Industrial71%55%Intervest Retails(Antwerp, Belgium)VastNed RetailsNetherlands(Rotterdam)100%100%66.7% 33.3%VastNed Management(Rotterdam, NDL)100%100%VastNed OfficesNetherlands(Rotterdam)IntervestOffices/Industrial(Antwerp, Belgium)VastNed Istanbul100%VastNed ManagementEspaña(Madrid)VastNed Deutschland(Franfurt)VastNed ManagementFrance(Paris)Note 1: Intervest Retail and Intervest O/I are Belgian majority owned subsidiaries of VNR and VNOI, respectively. They enjoy the Belgian REIT benefits(Bevak) and are quoted on Euronext Brussels. Apart from the VastNed participation, their shares are free float.Note 2: Intervest Retail and Intervest O/I have the same country management board, headed by Jean-Paul SolsNote 3: the management of the Portuguese retail portfolio is located in MadridSource: INGFailed takeover in2007-08Streamlining theportfolio for growthIn November 2007, VNR received an indicative public takeover bid from IEF Capital, aventure between Dutch investment companies Inflation Index Fund and BouwfondsAsset Management and a leading investor in Dutch real estate and inflation-linkedproducts. IEF Capital made an indicative offer of €70 per VNR share in November2007 (a premium of c.8% to the average share price prior to the bid). VNR initiallyrejected the primary offer, and a second exclusive round of negotiations during 1H08was cancelled by IEF Capital because of the negative market outlook, particularly inSpain. In the course of this take-over process, VNR tried to increase its value througha break-up sale to a number of parties, but quickly abandoned this attempt due toworsened market conditions. In mid-2008, VNR reiterated its strategy of being a midsizedEuropean retail investor.PortfolioAt end-2008, 75% of VNR’s portfolio consisted of assets >€2.5m. During FY08,
_<strong>Benelux</strong> <strong>Real</strong> <strong>Estate</strong> February 2010Fig 9 Current portfolio allocation (€1.9bn, Sept 09) Fig 10 Target portfolio allocation (€4bn)Retailwarehouses13%Other1%Retailwarehouses20%High streetshops45%High streetshops45%Shoppingcentres41%Source: Company dataShoppingcentres35%Source: Company dataFig 11 Key portfolio indicators (FY08)Netherlands Spain France Belgium Turkey Portugal TotalNumber of tenants 827 490 255 246 18 13 1849Theoretical annual rents 51 34.5 25.8 20.6 1.2 1.1 134.2Market rent 52.8 35.6 30.2 21.4 1.7 1.1 142.8(Over)/under rented (%) 3.5 3.1 14.5 3.8 30.8 (0.4) 6.1Average occupancy (%) 98.4 96.6 98.4 92.2 85.5 100 97.9Spot occupancy (%) 98.3 95.6 98.3 99.7 94.4 100 97.8Rent incentives (%) 0.3 0.8 1.3 1.6 0.0 0.8Number of properties 347 15 127 97 3 9 598Average size per property (€m) 2.2 32 3.2 3 6.7 1.5 3.3Gross yield (%) 6.8 7.2 6.6 7 5.9 8.2 6.9Net yield (%) 6 6.8 6.4 6.5 5.3 7.8 6.3Sector spread (%)Shopping centres 34 81 37 6 51 42Retail warehouses 3 13 6 49 13High street shops 62 6 55 45 49 100 44Other 1 0 2 0 1Regional spread (%)Super cities 10 60 35 11 100 42 29Large cities 21 39 18 29 32 26Medium-sized cities 31 0 21 15 7 18Small cities 38 1 26 45 19 27Industry spread (%)Non-food 48 51 65 59 54 54Food and personal care 28 21 6 14 20 19Home and garden 13 6 4 18 10Other 11 22 25 9 26 100 17Average occupancy at YE (%)Shopping centres 99.5 94.6 95.5 100 89.1 96.3Retail warehouses 100 100 100 99.6 99.8High street shops 97.8 100 99.7 99.8 100 100 98.7Other 68.2 100 0Source: Company data208
__<strong>Benelux</strong> <strong>Real</strong> <strong>Estate</strong> February 2010Fig 12 Regional spread Fig 13 Average rent (€/m²/year) during FY08800Small cities27%Medium sizedcities18%Large cities26%Super cities29%7006005004003002001000NetherlandsSpainFranceBelgiumTurkeyPortugalTotalShopping centres Retail warehouses High street shops otherNote: Super cities >500,000 inhabitants; large cities 150,000 to 500,000inhabitants; medium cities 50,000-150,000 inhabitants and small cities6% end-September 2009 and net yield at 7.7%, the priority is on(re)letting in order to minimise a further deterioration of rental inflows.The quality of Intervest Retail, the Belgian REIT-like subsidiary of VNR, was confirmedwith new lettings substantially above the previous rental levels. Generating net yieldsof 6.4% at end-September 2009 and under-rented by 3.8% at 31 December 2008, wesee more rental upside in this part of the portfolio.209
___<strong>Benelux</strong> <strong>Real</strong> <strong>Estate</strong> February 2010Netherlands: focus on(re)letting andextensionsAlso the Dutch portfolio adds to the stability of the overall portfolio. Primary focus is onthe (re)letting and addition of a number of extensions, such as the Het Rond shoppingcentre and the Roermond retail park.Fig 15 Rental level overview per country (€m)Gross theoretical rentFY08Market rentFY08Over/under-rented(%)Netherlands 51.0 52.8 3.5Spain 34.5 35.6 3.1France 25.8 30.2 14.5Belgium 20.6 21.4 3.8Turkey 1.2 1.7 30.8Portugal 1.1 1.1 -0.4Total 134.2 142.8 6.1Source: Company dataMixed result in Turkey,further expansion is puton holdThe Turkish portfolio shows a mixed result. Added as a fifth core market some yearsago, exposure has been limited to 10% of the total portfolio value. High street shopsare delivering net yields of 8.5%, and some recently-acquired shops are still in theprocess of being leased and are expected to yield 7.3% net.Fig 16 Top 10 assets as of end-2008NameLocationGrosstheoreticalrents% of totaltheoreticalrentsAppraisalvalue% of totalappraisalvalueoccupancyrateNumber oftenants(€m) (€m) (%)Centro Commercial "Sur" Madrid, Spain 5.8 4.3 82.3 4.2 97.4 73Centre Commercial "Val Thoiry" Thoiry, France 5.2 3.9 85.3 4.3 100.0 62Centro Commercial "La Rosaleda" Malaga, Spain 5.0 3.7 71.3 3.6 97.7 58Centro Commercial "Las Rosas" Madrid, Spain 4.5 3.4 66.5 3.4 99.5 104City Centre Lille, France 4.6 3.4 65.1 3.3 100.0 52City Centre Paris, France 4.3 3.2 76.9 3.9 99.2 14Centro Commercial "Getafe III" Madrid, Spain 3.9 2.9 46.3 2.4 98.6 49Schaarbroekerweg 14-58 Roermond, Netherlands 3.8 2.8 55.5 2.8 100.0 18Centro Commercial "Montigala" Badalona, Spain 3.7 2.8 53.4 2.7 100.0 54Parque Vistahermosa Alicante, Spain 3.6 2.7 45.1 2.3 100.0 6Subtotal 44.4 33.1 647.7 32.9 490Source: Company dataFig 17 Top 10 tenants as of end-2008 (€m)Name Theoretical rental income (€m) % of FY08 theoretical rentsH&M 5.6 4.2Inditex 3.3 2.5Auchan 2.6 1.9A.S. Watson 1.6 1.2Ahold 1.6 1.2Macintosh 1.4 1.0Blokker 1.4 1.0Eroski 1.4 1.0Armand Thierry 1.3 1.0Maxeda 1.2 0.9Total 21.4 15.9Source: Company data210
_<strong>Benelux</strong> <strong>Real</strong> <strong>Estate</strong> February 2010Corporate governanceTop managementCEO Reinier van Gerrevink, statutory director• CEO of VastNed Group since 2002• Previously several management functions at ABN AMRO, Rodamco and Robeco• Degree in Dutch law from the University of UtrechtCFO Tom de Witte, statutory director• CFO of VastNed Group since 2003• Previously an accountant at Deloitte• Degrees in business economics, Dutch law and accounting, Erasmus University ofRotterdamVastNed Group iscurrently in search of anew CIOCOO: replaced by top managementHans Pars, former CIO of VNR and VNOI, decided to leave the company mid-2009 inorder to accept a new challenge as the CEO of Wereldhave NV. His function istemporarily shared between the other members of the management board.General counsel and director investor relations Arnaud du Pont• General counsel and director investor relations since 2000• Previously tax adviser with BDO and Pricewaterhouse Coopers• Degree in tax law, Erasmus University RotterdamWim Fieggen, director• Director strategy and planning since 2003• Previously with Robeco, Rodamco, Roproperty and Altera• Degree in economics, Erasmus University Rotterdam100% free floatShareholder structureThe chart below illustrates the main shareholders holding more than 5% of the sharesof VNR. There is no shareholding agreement between these shareholders. As a result,the shares are 100% free float.Fig 18 Shareholder structure end-January 2009 (%)ING Clarion8%CommonwealthBank of Australia6%Fortis Investments8%ABP5%Other73%Source: Bloomberg211
__<strong>Benelux</strong> <strong>Real</strong> <strong>Estate</strong> February 2010FinancialsFig 19 Balance sheet (€m)2008 2009F 2010F 2011F 2012F 2013F 2014FTotal investment properties 2,014.8 1,879.0 1,853.6 1,860.2 1,867.0 1,873.9 1,881.0Total fixed assets 2,017.1 1,881.3 1,855.8 1,862.5 1,869.3 1,876.2 1,883.2Total current assets 26.5 18.5 21.3 30.0 40.2 51.9 64.1Total assets 2,043.6 1,899.8 1,877.2 1,892.5 1,909.4 1,928.1 1,947.3Equity VNR shareholders 998.2 943.4 925.2 939.0 953.2 968.1 983.5Equity minority interests 96.2 95.8 94.1 93.4 92.7 92.1 91.4Total equity 1,094.4 1,039.2 1,019.3 1,032.4 1,045.9 1,060.1 1,074.8Deferred tax liabilities 40.5 24.4 21.9 22.6 23.2 23.9 24.6Total long-term liabilities 690.5 684.3 681.8 682.4 683.1 683.8 684.5Payables to banks 183.4 96.8 96.6 97.5 99.0 101.1 103.2Redemption long-term liabilities 36.3 41.6 41.5 41.9 42.6 43.5 44.4Income tax 4.3 3.4 3.4 3.4 3.5 3.6 3.6Other debts, accruals and deferred income 34.6 34.5 34.5 34.8 35.3 36.1 36.8Total short-term liabilities 258.6 176.3 176.1 177.6 180.4 184.2 188.0Total equity and liabilities 2,043.6 1,899.8 1,877.2 1,892.5 1,909.4 1,928.1 1,947.3Source: Company data, ING estimatesFig 20 Profit and loss (€m)2008 2009F 2010F 2011F 2012F 2013F 2014FGross rents 132.0 131.0 128.2 129.7 131.3 133.8 136.6Total operating expenses (15.2) (15.1) (15.4) (15.6) (15.8) (16.1) (16.4)Net rents 116.9 115.9 112.8 114.1 115.6 117.8 120.2Total value movement investment properties (122.6) (140.7) (25.5) 6.6 6.8 6.9 7.1Net result on disposals of investment properties 0.9 2.3 0.0 0.0 0.0 0.0 0.0Net income from investment properties (4.8) (22.5) 87.3 120.8 122.4 124.7 127.3Total interest (38.8) (32.1) (29.3) (29.0) (28.7) (28.3) (27.9)Value movements in fin derivatives (0.5) (0.9) 0.0 0.0 0.0 0.0 0.0Exchange rate differences 0.0 0.0 0.0 0.0 0.0 0.0 0.0Net financing expenses (39.3) (32.9) (29.3) (29.0) (28.7) (28.3) (27.9)General expenses (10.2) (7.2) (7.0) (7.1) (7.2) (7.4) (7.5)Total expenses (49.5) (40.2) (36.3) (36.1) (35.9) (35.7) (35.4)Investment result before tax (54.4) (62.7) 51.0 84.6 86.5 89.0 91.8Current income tax expense (1.7) (1.5) (1.6) (1.6) (1.6) (1.6) (1.7)Movement in deferred tax assets and liabilities 12.3 14.0 2.5 (0.7) (0.7) (0.7) (0.7)Investment result after taxes (43.8) (50.3) 52.0 82.4 84.2 86.7 89.5Investment result attributable to minority interests (7.2) (5.1) 5.5 6.2 6.4 6.6 6.8Direct part (5.2) (6.2) 6.0 6.1 6.2 6.4 6.6Indirect part (2.1) 1.1 (0.5) 0.1 0.1 0.1 0.1Total investment result attributable to VNR SH (51.1) (55.4) 57.5 88.6 90.5 93.2 96.2Total direct result 66.0 75.1 74.9 76.4 78.1 80.5 83.1Attributable to minority interests (5.2) (6.2) 6.0 6.1 6.2 6.4 6.6Attributable to VNR SH 60.9 68.9 68.9 70.3 71.8 74.0 76.5Total indirect result (109.9) (125.3) (22.9) 6.0 6.1 6.2 6.4Attributable to minority interests (2.1) 1.1 (0.5) 0.1 0.1 0.1 0.1Attributable to VNR SH (111.9) (124.2) (22.5) 5.9 6.0 6.1 6.2Source: Company data, ING estimates212
__<strong>Benelux</strong> <strong>Real</strong> <strong>Estate</strong> February 2010Fig 21 Cash flow statement (€m)2008 2009F 2010F 2011F 2012F 2013F 2014FTotal Investment result (43.8) (50.2) 52.0 82.4 84.2 86.7 89.5Adjustments for 0.0 0.0 0.0 0.0 0.0 0.0 0.0Value movements investment properties 122.6 140.7 25.5 (6.6) (6.8) (6.9) (7.1)Movement current assets 2.3 2.2 0.0 (0.1) (0.2) (0.3) (0.3)Movement short-term liabilities (3.0) (0.4) (0.3) 1.6 2.8 3.7 3.8CF from Operations 61.4 79.0 77.2 77.1 80.0 83.2 85.9Acquisitions and investments (107.4) (45.4) 0.0 0.0 0.0 0.0 0.0Disposals 63.4 46.1 0.0 0.0 0.0 0.0 0.0Capital contributions to subsidiaries 14.6 0.0 0.0 0.0 0.0 0.0 0.0Cash flow from property (29.4) 0.6 0.0 0.0 0.0 0.0 0.0CF from Investments (29.1) 0.7 0.0 0.0 0.0 0.0 0.0Share issue 0.0 74.4 0.0 0.0 0.0 0.0 0.0Share buyback 0.0 0.0 0.0 0.0 0.0 0.0 0.0Dividend paid (60.3) (63.5) (71.8) (69.3) (70.7) (72.4) (74.7)CF from Finance (42.9) (79.0) (74.3) (68.6) (70.0) (71.8) (74.0)Net movement in cash and equivalents (10.7) 0.7 2.8 8.5 10.0 11.4 11.9Opening cash balance 13.7 3.1 3.8 6.6 15.1 25.1 36.5Closing cash balance 3.1 3.8 6.6 15.1 25.1 36.5 48.4Source: Company data, ING estimatesFig 22 Per share data (€)2008 2009F 2010F 2011F 2012F 2013F 2014FYear end number of shares (basic) 16,417,526 16,604,740 18,265,213 18,265,213 18,265,213 18,265,213 18,265,213Year end number of shares (fully diluted) 16,417,526 18,265,213 18,265,213 18,265,213 18,265,213 18,265,213 18,265,213Direct result per share (adjusted for cost of offering of shares) 3.71 4.05 3.77 3.85 3.93 4.05 4.19Indirect result per share (6.83) (7.30) (1.23) 0.32 0.33 0.33 0.34Total investment result per share (3.11) (3.25) 2.54 4.17 4.26 4.39 4.53Declared dividend per share in cash (interim + final) 3.85 4.05 3.77 3.85 3.93 4.05 4.19IFRS NAV per share 60.8 51.6 50.7 51.4 52.2 53.0 53.8Diluted EPRA NAV per share 64.3 54.9 54.0 54.7 55.5 56.3 57.1Diluted EPRA NNNAV per share 61.9 53.6 52.7 54.7 55.4 56.2 57.0Recurring CFPS 4.23 4.78 3.77 3.85 3.93 4.05 4.19Source: Company data, ING estimatesFully distribute directresult, with an interimdividendThe dividend is paid in the form of an interim dividend set at 60% of the directinvestment result of the first six months of the years (fully paid in cash), payable in thethird quarter of each year, and a final dividend equal to the remaining undistributeddirect result at the end of the year, payable in the second quarter of the following year.As a consequence, both VNOI and VNR aim to fully distribute the direct investmentresult per share. At the discretion of the shareholders, a small portion of the finaldividend payment could be paid in shares, charged to the premium share reserve.213
__<strong>Benelux</strong> <strong>Real</strong> <strong>Estate</strong> February 2010Fig 23 Quarterly profit and loss (€m)4Q08 1Q09 2Q09 3Q09 4Q09F 1Q10F 2Q10F 3Q10F 4Q10FGross rents 33.5 33.1 33.0 32.6 32.3 32.1 31.9 32.0 32.2Total operating expenses 0.0 (3.7) (3.8) (3.8) (3.9) (3.8) (3.8) (3.8) (3.9)Net rents 29.8 29.4 29.2 28.8 28.4 28.2 28.0 28.2 28.4Total value movement investment properties (91.1) (59.8) (54.4) (14.1) (12.4) (11.8) (7.6) (4.0) (2.0)Net result on disposals of investment properties (0.2) 0.1 2.2 0.0 0.0 0.0 0.0 0.0 0.0Net income from investment properties (61.5) (30.3) (22.9) 14.7 16.0 16.4 20.4 24.2 26.4Total interest (10.0) (8.9) (7.9) (7.9) (7.4) (7.2) (7.3) (7.4) (7.3)Value movements in fin derivatives (0.5) (0.2) (0.1) (0.5) 0.0 0.0 0.0 0.0 0.0Exchange rate differences 0.0 0.0 0.0 0.0 0.0 0.0 0.0 0.0 0.0Net financing expenses (10.5) (9.1) (8.0) (8.4) (7.4) (7.2) (7.3) (7.4) (7.3)General expenses (2.0) (1.9) (1.7) (1.8) (1.8) (1.8) (1.8) (1.8) (1.8)Total expenses (12.4) (11.1) (9.7) (10.2) (9.2) (9.0) (9.0) (9.2) (9.1)Investment result before tax (73.9) (41.4) (32.6) 4.5 6.9 7.4 11.4 14.9 17.3Current income tax expense (0.2) (0.3) (0.4) (0.4) (0.4) (0.4) (0.4) (0.4) (0.4)Movement in deferred tax assets and liabilities 5.0 4.5 6.7 1.5 1.2 1.2 0.8 0.4 0.2Investment result after taxes (69.1) (37.1) (26.4) 5.6 7.7 8.2 11.8 15.0 17.1Investment result attributable to minority interests 2.2 (1.6) (0.1) (1.7) (1.7) 1.3 1.4 1.4 1.5Direct part (1.5) (1.6) (1.6) (1.5) (1.5) 1.5 1.5 1.5 1.5Indirect part 3.7 (0.1) 1.5 (0.2) (0.2) (0.2) (0.1) (0.1) 0.0Total investment result attributable to VNR SH (66.9) (38.7) (26.5) 3.8 6.0 9.5 13.1 16.4 18.5Total direct result 17.6 18.3 19.1 18.8 18.9 18.9 18.6 18.6 18.8Attributable to minority interests (1.5) (1.6) (1.6) (1.5) (1.5) 1.5 1.5 1.5 1.5Attributable to VNR SH 16.1 16.8 17.5 17.2 17.3 17.4 17.1 17.1 17.3Total indirect result (86.8) (55.4) (45.5) (13.2) (11.2) (10.7) (6.9) (3.6) (1.8)Attributable to minority interests 3.7 (0.1) 1.5 (0.2) (0.2) (0.2) (0.1) (0.1) 0.0Attributable to VNR SH (83.0) (55.5) (44.0) (13.4) (11.3) (10.5) (6.7) (3.5) (1.8)Source: Company data, ING estimatesFig 24 Quarterly cash flow statement (€m)4Q08 1Q09 2Q09 3Q09 4Q09F 1Q10F 2Q10F 3Q10F 4Q10FTotal Investment result (69.1) (37.1) (26.4) 5.6 7.7 8.2 11.8 15.0 17.1Adjustments for 0.0 0.0 0.0 0.0 0.0 0.0 0.0 0.0 0.0Value movements investment properties 91.1 59.8 54.4 14.1 12.4 11.8 7.6 4.0 2.0Net result on disposals investment properties 0.2 (0.1) (2.2) 0.0 0.0 0.0 0.0 0.0 0.0Movement current assets 0.6 0.1 2.6 (0.6) 0.2 0.1 0.1 (0.1) (0.1)Movement short-term liabilities 5.1 0.2 0.0 1.4 (1.9) (1.2) (1.2) 0.8 1.2Movement provisions (0.6) (0.6) 0.2 0.2 0.0 0.0 0.0 0.0 0.0CF from Operations 26.9 20.0 23.1 17.7 18.3 19.0 18.3 19.7 20.2Acquisitions and investments (37.8) (7.7) (11.6) (6.0) (20.0) 0.0 0.0 0.0 0.0Disposals 34.0 6.6 37.1 2.5 0.0 0.0 0.0 0.0 0.0Capital contributions to subsidiaries 14.6 0.0 0.0 0.0 0.0 0.0 0.0 0.0 0.0Cash flow from property 10.8 (1.2) 25.4 (3.6) (20.0) 0.0 0.0 0.0 0.0Movement tangible fixed assets 0.1 0.1 (0.1) 0.0 0.0 0.0 0.0 0.0 0.0CF from Investments 10.9 (1.1) 25.4 (3.6) (20.0) 0.0 0.0 0.0 0.0Share issue 0.0 0.0 0.0 74.4 0.0 0.0 0.0 0.0 0.0Share buyback 0.0 0.0 0.0 0.0 0.0 0.0 0.0 0.0 0.0Dividend paid 3.8 0.0 (37.8) (25.6) 0.0 0.0 (51.1) (20.7) 0.0Interest bearing loans redeemed (14.4) (42.6) (12.1) (74.5) (1.2) (1.2) (0.8) (0.4) (0.2)CF from Finance (36.6) (17.5) (46.8) (13.4) (1.2) (1.2) (51.9) (21.1) (0.2)Net movement in cash and equivalents 1.1 1.3 1.6 0.7 (2.9) 17.8 (33.5) (1.4) 20.0Opening cash balance 1.9 3.1 4.4 6.0 6.7 3.8 21.6 (12.0) (13.4)Closing cash balance 3.1 4.4 6.0 6.7 3.8 21.6 (12.0) (13.4) 6.6Source: Company data, ING estimates214
_<strong>Benelux</strong> <strong>Real</strong> <strong>Estate</strong> February 2010Fig 25 Quarterly per share data (€)4Q08 1Q09 2Q09 3Q09 4Q09F 1Q10F 2Q10F 3Q10F 4Q10FYear end number of shares (basic) 16,417,526 16,417,526 16,604,740 16,604,740 16,604,740 18,265,213 18,265,213 18,265,213 18,265,213Year end number of shares (fully diluted) 16,417,526 16,417,526 16,417,526 16,417,526 18,265,213 18,265,213 18,265,213 18,265,213 18,265,213Direct result per share 0.98 1.02 1.06 1.04 1.04 0.95 0.94 0.94 0.95Indirect result per share (5.06) (3.38) (2.67) (0.81) (0.68) (0.57) (0.37) (0.19) (0.10)Total investment result per share (4.08) (2.36) (1.61) 0.23 0.36 0.38 0.57 0.74 0.85Final dividend declared 0.00 0.00 0.00 0.00 0.00 0.00 2.80 0.00 0.00Interim dividend 0.00 0.00 0.00 1.25 0.00 0.00 0.00 1.13 0.00IFRS NAV per share 0.0 57.6 53.9 57.1 51.6 52.0 50.1 49.8 50.7diluted EPRA NAV per share 0.0 62.2 58.7 62.3 54.9 55.3 53.4 53.2 54.0diluted EPRA NNNAV per share 0.0 59.0 55.7 59.0 53.6 54.0 52.1 51.9 52.7Recurring CFPS 0.00 1.21 1.26 1.22 1.23 0.95 0.94 0.94 0.95Source: Company data, ING estimates215
<strong>Benelux</strong> <strong>Real</strong> <strong>Estate</strong> February 2010This page is left blank intentionally216
__<strong>Benelux</strong> <strong>Real</strong> <strong>Estate</strong> February 2010BelgiumWDPGeared to seize opportunities?Jean-Yves DevlooAmsterdam (31) 20 563 8745jean-yves.devloo@ing.comArjan KnibbeAmsterdam (31) 20 563 8780arjan.knibbe@ing.comPreviously: BuyHold<strong>Real</strong> <strong>Estate</strong>5 February 2010€32.6Target price (12 month):€28.2ReutersWDPP.BRCurrently valued at 1.2x 2010F IFRS NAV, we believe WDPis overbought. The dividend yield is still the highest in thesector at 9%. We downgrade to HOLD from Buy on theback of the meagre near-term development potential.WDP’s balance sheet benefited from the recent rights issue and the sale andlease back transactions with DHL. EPS stability will be determined by theextent to which the remaining part of the speculative pipeline will be let andthe lease expiries will be renegotiated.Sensitivity of our 2010F EPS to vacancy rate and total like-for-likeVacancy rate (%)4 5 6 7 8 9 10 110 2.83 2.78 2.74 2.69 2.64 2.60 2.55 2.501 2.87 2.83 2.78 2.73 2.69 2.64 2.59 2.55LFL (%) 2 2.92 2.87 2.82 2.78 2.73 2.68 2.64 2.593 2.96 2.91 2.87 2.82 2.77 2.73 2.68 2.634 3.00 2.96 2.91 2.86 2.82 2.77 2.72 2.685 3.05 3.00 2.96 2.91 2.86 2.82 2.77 2.726 3.09 3.05 3.00 2.95 2.91 2.86 2.81 2.777 3.14 3.09 3.04 3.00 2.95 2.90 2.86 2.81Source: ING estimatesKey ratios and forecasts2008 2009F 2010F 2011F 2012FEPS adj (€) 3.64 2.94 2.81 2.93 3.05PER (x) 9.0 11.1 11.6 11.1 10.7Net yield (%) 7.0 6.9 7.5 7.7 7.9IFRS NAV per share (€) 30.4 27.5 26.9 26.8 26.7EPRA NNNAV per share (€) N/A N/A N/A N/A N/AP/IFRS NAV (%) 1.07 1.19 1.21 1.22 1.22DPS (€) 2.94 2.94 3.03 3.12 3.21Dividend yield (%) 9.0 9.0 9.3 9.6 9.8CFPS (€) 3.27 2.94 2.81 2.93 3.05LTV (%) 67.0 61.5 62.2 62.3 62.412-month forecast returns (%)Share price -13.4Dividend 9.312m f'cst total return -4.1Key ratios (%)2008 2009FRental growth 21.6 17.9Operating margin 90.2 97.8Occupancy rate 99 94Share dataNo. of shares (m) 12.5Daily turnover (shares) 13,000Free float (%) 68.6Enterprise value (€m) 873.2Market cap (€m) 408.9Share price performance50454035302520151/08 7/08 1/09 7/09 1/10Source: INGPriceBEL 20 (rebased)Source: Company data, ING estimates217
<strong>Benelux</strong> <strong>Real</strong> <strong>Estate</strong> February 2010Investment caseWDP specialises in investing and developing logistics property across Europe. Itowns an €804m portfolio, 70% of the rental value of which is in Belgium. At 30September, management had already extended 72% of the leases that expire in2010. Nevertheless, we feel WDP has become markedly expensive and do notsee major upside in the coming months. WDP has executed a €74m rights issueand additional sale and lease back transactions in 2009. The confirmeddividend of €2.50 net per share is attractive as it results in a yield of 9%.Speculative developments have been halted, which limits the potential for neartermdevelopment gains.We are confident WDP is going to be able to maintain the occupancy rate atcurrent levels (if it was not able to lease current lease expiries and if recentlydelivered developed projects were not leased, vacancy would increase from thecurrent level of 6% to 10%), thanks to its competitive price/quality and excellentreputation. We are positive on the development reputation WDP hasestablished, together with the strategic land reserve built up in Romania, but donot see major opportunities occurring in the near future. HOLD.SWOTFig 1 SWOT analysisStrengthsThanks to its in-house development, WDP retains a development margin ofc.10-15%. Consequently, it can afford the best price quality and the lowestcost of ownership compared to its peers.Assets are of strategic importance to its tenants (eg, Belgian, <strong>Benelux</strong> or evenEuropean distribution centres).Long-term duration of rental contracts (seven years).Low rental reversion limits the risk of rents falling intensively in a downmarket.Tenants have little exposure to the "risky" economic environment.Strong commitment to pay out high and rising dividend each year.Inflationary protected investment.Virtually no corporate taxation thanks to SICAFI status.OpportunitiesAcquisitions in foreign markets at fire sale prices.Large strategic land reserve secures future potential.WeaknessesSignificant lease expiries (c.12% during 2009 and 4% in2010F) have not all been replaced by new lets.The final part of the speculative developments mayfurther hurt the occupancy rate.Still a high leverage.Economic crisis probably will not allow any near term preletdevelopments.Quality of financial reporting (no quarterly cash flowstatements and low level of compliance with EPRA bestpractice recommendations).Legal form is a CV in stead of an NV (limited liability),resulting in the fact that shareholders may have lesspower compared to an NV.ThreatsEnough funding available to fund opportunities in themarket?Large fair value adjustments may hurt the leverage ratio.Source: INGRisksBecause of the contractual nature of a large part of the recurring cash flows, propertycompanies are usually considered to have less risk than most other equity sectors.The risk of property companies bears a strong correlation to the amount of218
<strong>Benelux</strong> <strong>Real</strong> <strong>Estate</strong> February 2010development exposure, the geographical and sector breakdown, corporate governanceand alignment of interest between management and shareholders.Investor, but also a developerSpeculativedevelopments havehaltedWe believe that WDP is a medium-risk property company. It is principally an investor,which is the least risky activity of the four core real estate company activities:investment, development, trading and asset management. WDP has focused primarilyon logistics property on important transport axes and intersections in the Netherlands,Belgium and France, and also has a 50% stake in a €50m land bank in Romania (butnot yet any real estate assets). It develops on average 50,000-100,000m² of logisticssurface per year, but since early 2009 has temporarily halted any further speculativedevelopments.Tenant riskLargest tenant Univegpays 14% of rent-rollThe largest tenant is the Univeg Group, representing c.14% of the rent payroll. Thisexposure is quite high, but is offset because (1) this part of rental income is derivedfrom six different buildings spread over two different countries and three differentactivities; (2) the low economic risk of Univeg’s activities (distribution of fruit,vegetables and flowers and pre-prepared salads, etc); and (3) c.90% of Univeg’s rentalcontracts have a fixed duration of c.20 years.Accounting for leasesPotential pressure onlease lengthThere are accounting initiatives that may lead to tenants being required to account forlong leases as a liability on their balance sheets. This may in future put pressure onthe average lease lengths of real estate companies and WDP.No currency risksNearly all rents and expenses are made in Euros. A minor proportion of the rents isderived from the Czech Republic (property value of c.€27m), but the exchange risk isnegligible.CatalystsWe see the following catalysts:• Negotiation of remaining upcoming lease expiries• Leasing up the final phases of the speculative development pipeline• Pre-lettings of developments either in Western Europe or in Romania• Full year results on 17 February.OutlookWe forecast full year 2009F EPS of €2.94 per share, in line with the dividend of €2.94,which is composed of a dividend of €1.47 paid out to all existing shares prior to therights issue and another €1.47 paid out to all shares after the rights issue. Thedividend outlook was confirmed during the 3Q09 results communication.ValuationWe value WDP on a 5% premium to its 2010F IFRS NAV of €26.9. We note that a10% premium may be justified in normal times given the lucrative development trackrecord, however in the upcoming 12 months development gains will be low as WDPhas temporarily paused any further speculative developments. Another reason for the219
____<strong>Benelux</strong> <strong>Real</strong> <strong>Estate</strong> February 2010relatively high premium in current circumstances is the effect of derivatives valueadjustments on equity, which is high compared to peers, and more than proportionallylowers IFRS per share (c.10%, in our view). EPRA NNNAV makes an adjustment forthese flaws; however, WDP has not decided to implement significant EPRA BestPractices up to now. We would strongly appreciate greater adherence to the EPRABPR and more complete financial reporting (quarterly cash flow statement).ConsensusFig 2 Consensus EPS overview (€)2009F 2010F 2011FConsensus 2.97 2.94 3.18ING 2.94 2.81 2.94Difference (0.03) (0.13) (0.24)Difference (%) -0.9 -4.4 -7.4Source: Reuters, ING estimatesOur EPS forecasts are modestly below consensus forecasts. This may be explained bya number of lease incentives that are in our model and a vacancy rate in line withcurrent levels.Our estimates and assumptions1. Vacancies: we expect vacancies to edge up slightly above 6% into 2010 on theback of lease expiries and speculative developments. We assume vacancies willnormalise to 5% after a number of incentives should have materialised.Fig 3 Vacancy assumptions (%)Vacancy rate 2009F 2010F 2011F 2012FWestern Europe 5.9 6.5 5.5 5.0Czech republic 0.0 0.0 0.0 0.0Romania N/A N/A N/A N/ATotal 5.8 6.4 5.4 4.9Source: ING estimates2. Like-for-like rental growth: note that these estimates also take into accountincentives, but not vacancy rates. We relied on ING macro economic estimates forthe CPI forecasts and also took a number of incentives into account.Fig 4 Total like-for-like rental growth assumptions (%)Like-for-like rental growth 2009F 2010F 2011F 2012FWestern Europe -0.5 1.7 2.0 2.5Czech republic 0.0 1.5 2.0 2.0Romania N/A N/A N/A N/ATotal -0.5 1.7 2.0 2.5Source: ING estimates3. Portfolio valuation: we assume portfolio adjustments fade out into 2010.Fig 5 Portfolio valuation forecasts (%)2009F 2010F 2011F 2012FWestern Europe -3.3 -0.3 0.0 0.0CEE -18.2 -8.3 -0.5 0.0Total -5.4 -0.8 0.0 0.0Source: ING estimates220
<strong>Benelux</strong> <strong>Real</strong> <strong>Estate</strong> February 2010Company profileLargest semi-industrialreal estate fund inBelgium<strong>Real</strong> estate developing,investing and sale andlease backsIn terms of real estate assets, WDP is the third-largest Sicafi in Belgium, with assets ofc.€804m at the end of 3Q09. It is the market leader in semi-industrial and logistics realestate in Belgium. It has been using the Sicafi status since 1999, and hence hasappeared in the Euronext Bel Mid index since 1999. It also acquired SIIC status inFrance, which enables it to enjoy comparable tax benefits by investing in French realestate compared with Belgian real estate. WDP is located in Wolvertem, on theoutskirts of Brussels.WDP’s core strategy is to offer flexibility to its clients by creating added value in threeways:• <strong>Real</strong> estate development. Retaining a strategic reserve of land of c.€50m near themost important transport axes and intersections in the Netherlands, Belgium,France, and recently also Romania, WDP is ready to develop logistics andwarehouse assets when opportunities arise. In this way, WDP develops an averagelogistics surface of 50,000-100,000m² per year. Having nearly completed the lastparts of its speculative pipeline, WDP has stated it will not engage in any furtherspeculative developments until market circumstances improve.• Sale and leaseback operations of logistics centres of industrial companies lookingto focus on their core activities. A good example is the sale and leaseback of threeof DHL’s Belgian distribution centres during 1Q09 for an investment value of€29.7m and an initial yield of 8.7%.• <strong>Real</strong> estate investment. This represents the traditional purchase of real estateassets and renovations, depending on clients’ needs, or making additionalinvestments in existing buildings that have already been leased.Pan-European strategyIn 2007, WDP decided to grow its portfolio by also acquiring land assets in Romania,near access routes to Bucharest. This marked the start of a pan-European strategy ofinvesting in semi-industrial and logistics real estate.Portfolio profile€50m strategic landreserveWDP owns a €804m portfolio, of which c.€102m is in developments, and €50m in land.Some 30% of the rental income of the portfolio is generated outside Belgium. Weestimate WDP owns nearly 100 sites in its portfolio, spread over five countries:Belgium, France, the Netherlands, Romania and the Czech Republic. The total surfacearea of land at the sites of the portfolio is
_<strong>Benelux</strong> <strong>Real</strong> <strong>Estate</strong> February 2010Fig 6 Rentable surface by categoryCommercialpremises2%Offices1%Other2% Officesadjoiningwarehouses8%Fig 7 Rental value per countryCzechRepublic5% France10%TheNetherlands15%Belgium70%Warehouses87%Source: Company dataSource: Company dataBalance betweenmature and growthmarketsThe portfolio is well balanced between the mature Western European market andgrowth markets in Eastern Europe. In the Netherlands, Belgium and France, WDP triesto be present at each important intersection on the Rotterdam-Antwerp-Brussels-Lilleaxis, locations characterised by strong demand for logistics solutions. The Nord-Pasde-Calaisregion (Lille) in northern France in particular is recognised as a key locationfor transport towards affluent consumer regions such as Paris, London, Flanders andthe Ruhr area. It is seen as a leading and stable logistics centre for the next 15 yearsby industry experts such as the Vlaams Instituut voor Logistiek and Cushman &Wakefield.Fig 8 Fair value overview at end-1Q09Netherlands• Value: €127m• Gross yield: 8.06%•180.000m²Belgium• Value: €529m• Gross yield: 7.74%• 887.000m²Czech Republic• Value: €27m• Gross yield: 8.79%• 39.000m²Romania• Value: €25m•Gross yield: N/A•929.000m²• (landbank)France• Value: €73m• Gross yield: 8.56%•118.000m²Source: June 2009 rights issue roadshow presentationStrategic potential inRomania…About half of the €40m strategic land bank owned by WDP is situated in Romania. Thisrepresents c0.9m m 2 . Even though no real estate has been bought or developed in thisarea, WDP believes this land portfolio remains of strategic importance given itslocation at the eastern border of the European Union. We found that WDP hasobtained the most important certifications that allow it to begin development in this222
<strong>Benelux</strong> <strong>Real</strong> <strong>Estate</strong> February 2010area, as soon as demand improves. However, no specific projects are known up to thispoint.…partially thanks to alocal joint ventureStatus quo in CzechRepublicIn Romania, WDP operates through a 50/50 joint venture, which is responsible forattracting more suitable sites for future development, and finding quality tenants. Thejoint venture ends once the buildings become marketable. At this stage, WDP pays outthe share of fair value of the projects to its partner and assumes full responsibility forthe projects.The total rental value of the properties (100% let) in the Czech Republic representsc.5% of the aggregate portfolio rental value. We believe WDP will maintain the statusquo in this country, given the 100% let assets and the recent removal of its local Czechmanagement team.Recently, CEE investments of property companies have been hammered for their highrisk. Now, however, we believe that CEE investments offer the medium-termopportunities for above-average growth that some of the other Belgian companies lack.Fig 9 Overview of ten most important assets according to rental valueCity Country Rental value(€m)Share of portfoliorental value(%)Built surface(th m²)2008occupancy rate(%)TenantRidderkerk Netherlands 2.6 5.5 34 100 UnivegKontich* Belgium 2.3 4.9 58 100 Philips LightingMladá Boleslav Czech Republic 1.7 3.6 30 100 Siemens, DHLBoom* Belgium 1.7 3.5 37 100 BelgacomMachelen Belgium 1.5 3.2 16 100 InbevLeuven Belgium 1.4 3.0 15 100 Tech DataAsse* Belgium 1.3 2.8 27 94 De PostVeghel Netherlands 1.3 2.7 78 100 Kühne & NagelNivelles Belgium 1.2 2.6 27 100 RenaultSt-Katelijne-Waver* Belgium 1.2 2.6 23 100 UnivegTotal 47.2 34.4 344* Equipped with solar panelsSource: Company data_Corporate governanceManagementWDP has built up an in-house team of some 20 employees who take care of in-houseasset, property and development management. Befimmo has 31 people andCofinimmo has 108 people on the payroll. WDP also has local representatives inFrance, the Czech Republic and Romania.CEO Tony De Pauw• CEO of WDP since 1999.• Represents the founding family shareholders, who retain a stable 31.4% stake inWDP. He is the son of the founder, Jos De Pauw.CFO Joost Uwents• CFO of WDP since 1999.• Is a commercial engineer and holds an MBA.223
_<strong>Benelux</strong> <strong>Real</strong> <strong>Estate</strong> February 2010Free float of 68.6%Shareholders and stock liquidityWDP obtained SICAFI status in 1999, and has a history that goes back to the 1970s.The De Pauw family has a 31.4% stake in the company and acts as the referenceshareholder. The family kept its interest at the same level during the capital-raisingrelated to the acquisition of the DHL distribution centres during 1Q09 and during theJune 2009 rights issue.Fig 10 Shareholder structureDe Pauw family31%Free float69%Source: Bloomberg224
_<strong>Benelux</strong> <strong>Real</strong> <strong>Estate</strong> February 2010FinancialsFig 11 Balance sheet (€m)2008 2009F 2010F 2011F 2012F 2013F 2014FIntangible assets 0.2 0.2 0.2 0.2 0.2 0.2 0.2Investment properties 664.6 793.5 787.3 787.1 787.1 787.1 787.1Development projects 77.6 0.0 0.0 0.0 0.0 0.0 0.0Other tangible assets (own use) 32.4 48.8 48.8 48.8 48.8 48.8 48.8Financial fixed assets 10.6 11.8 11.8 11.8 11.8 11.8 11.8Financial lease receivables 0.3 0.2 0.2 0.2 0.2 0.2 0.2Trade receivables 0.3 0.2 0.2 0.2 0.2 0.2 0.2Deferred tax assets 0.8 0.8 0.8 0.8 0.8 0.8 0.8Total fixed assts 786.6 855.4 849.3 849.0 849.0 849.0 849.0Investment property held for sale 4.6 16.1 16.4 16.8 17.2 17.5 17.9Financial lease receivables 0.1 0.1 0.1 0.1 0.1 0.1 0.1Trade debtors 4.3 14.6 14.9 15.3 15.6 16.0 16.3Trade benefits and other current assets 2.6 3.7 3.7 3.8 3.9 4.0 4.1Cash and cash equivalents 1.3 18.0 18.2 20.3 21.9 23.8 25.8Accruals and deferred income 3.2 4.1 4.2 4.3 4.4 4.5 4.6Total current assets 16.1 56.6 57.4 60.6 63.1 65.8 68.7Total assets 802.7 912.1 906.6 909.6 912.1 914.9 917.8Total equity 261.3 344.9 337.1 335.7 334.9 334.1 333.4Provisions 1.3 1.2 1.2 1.2 1.2 1.2 1.2Long term financial debt 297.3 375.2 375.2 375.2 375.2 375.2 375.2Hedging instruments 21.2 28.8 28.8 28.8 28.8 28.8 28.8Deferred tax liabilities 9.0 9.7 9.7 9.7 9.7 9.7 9.7Total LT liabilities 328.9 414.9 414.9 414.9 414.9 414.9 414.9Short term financial debt 180.3 102.5 104.1 107.0 109.3 111.7 114.1Trade payables and other current debts 15.2 24.9 25.3 26.0 26.6 27.1 27.7Other ST commitments 13.8 10.3 10.4 10.7 10.9 11.2 11.4Accruals and deferred income 3.2 14.6 14.9 15.3 15.6 16.0 16.3Total ST liabilities 212.5 152.3 154.6 159.0 162.4 165.9 169.5Total equity and liabilities 802.7 912.1 906.6 909.6 912.1 914.9 917.8Source: Company data, ING estimates_Fig 12 Profit and loss (€m)2008 2009F 2010F 2011F 2012F 2013F 2014FGross rents 46.8 55.2 59.0 60.6 62.1 63.5 64.8Rental charges (0.2) (0.6) (0.2) (0.2) (0.2) (0.2) (0.2)Net rents 46.6 54.6 58.8 60.4 61.9 63.3 64.6Other rental charges 0.2 4.1 3.1 3.2 3.3 3.3 3.4Property result 46.9 58.7 61.9 63.6 65.2 66.6 68.0Property charges (1.2) (1.5) (1.5) (1.6) (1.6) (1.7) (1.7)Property operating result 45.7 57.2 60.4 62.0 63.6 64.9 66.3General expenses (3.5) (3.2) (3.4) (3.5) (3.6) (3.7) (3.7)Operating result before result on portfolio 42.2 54.0 57.0 58.5 60.0 61.3 62.6Result on disposals 0.1 0.0 0.0 0.0 0.0 0.0 0.0FV variation of investment property (17.9) (36.1) (6.2) (0.2) 0.0 0.0 0.0Total operating result 24.4 17.8 50.8 58.3 60.0 61.3 62.6Financial income 7.6 0.0 0.5 0.5 0.5 0.5 0.5Interest charges (19.7) 0.0 (21.6) (21.6) (21.6) (21.6) (21.6)Total interest (10.6) (18.6) (21.1) (21.1) (21.1) (21.1) (21.1)Revaluation on financial instruments (31.4) (12.0) 0.0 0.0 0.0 0.0 0.0Net financing expenses (41.9) (30.6) (21.1) (21.1) (21.1) (21.1) (21.1)Result before tax (17.5) (12.8) 29.7 37.2 38.9 40.2 41.5Corporate tax expense (0.4) 1.6 (0.6) (0.6) (0.7) (0.7) (0.7)Deferred tax movements 2.2 1.8 0.0 0.0 0.0 0.0 0.0Net result (15.8) (9.4) 29.1 36.6 38.2 39.5 40.8Source: Company data, ING estimates225
__<strong>Benelux</strong> <strong>Real</strong> <strong>Estate</strong> February 2010Fig 13 Cash flow statement (€m)2008 2009F 2010F 2011F 2012F 2013F 2014FProfit for the year (15.8) (9.4) 29.1 36.6 38.2 39.5 40.8Total P/L from company activities (1.5) (9.4) 29.1 36.6 38.2 39.5 40.8Writedowns 0.2 0.0 0.0 0.0 0.0 0.0 0.0Change in provisions (0.2) 0.0 0.0 0.0 0.0 0.0 0.0FV variations in property 17.9 36.1 6.2 0.2 0.0 0.0 0.0Change in deferred taxes (1.7) 0.7 0.0 0.0 0.0 0.0 0.0FV on derivatives 29.6 12.0 0.0 0.0 0.0 0.0 0.0Increase in sales (0.1) 0.0 0.0 0.0 0.0 0.0 0.0Total adjustment for non-monetary items 45.7 48.7 6.2 0.2 0.0 0.0 0.0Change in working capital assets 9.6 (23.8) (0.6) (1.1) (0.9) (0.9) (0.9)Change in working capital liabilities 4.5 17.6 0.8 1.4 1.1 1.1 1.2Other (0.7) 0.0 0.0 0.0 0.0 0.0 0.0Total operating capital movements 13.3 (6.2) 0.2 0.3 0.3 0.3 0.3Interest received 2.2 0.0 0.0 0.0 0.0 0.0 0.0Income tax paid/received (0.4) 0.0 0.0 0.0 0.0 0.0 0.0CF from other operating activities 1.8 0.0 0.0 0.0 0.0 0.0 0.0Total cash from operations 59.5 33.1 35.4 37.1 38.5 39.8 41.1Total cash from financing 104.1 (76.5) (35.3) (35.0) (36.8) (37.9) (39.1)Acquisition payments for property investments (NET) (109.4) 0.0 0.0 0.0 0.0 0.0 0.0Payments in connection with project developments (37.8) 0.0 0.0 0.0 0.0 0.0 0.0Acquisition of other tangible and intangible fixed assets (26.0) 60.2 0.0 0.0 0.0 0.0 0.0Business combinations 0.0 0.0 0.0 0.0 0.0 0.0 0.0Total cash from purchases (173.1) 60.2 0.0 0.0 0.0 0.0 0.0Total cash from disposals 1.8 0.0 0.0 0.0 0.0 0.0 0.0Total cash from investing (171.3) 60.2 0.0 0.0 0.0 0.0 0.0Net cash movement (7.7) 16.8 0.1 2.1 1.7 1.8 2.0Cash balance BOP 9.0 1.3 18.0 18.2 20.3 21.9 23.8Cash balance EOP 1.3 18.0 18.2 20.3 21.9 23.8 25.8Source: Company data, ING estimatesFig 14 Per share data (€)2008 2009F 2010F 2011F 2012F 2013F 2014FNo. of shares 8,592,721 12,533,938 12,533,938 12,533,938 12,533,938 12,533,938 12,533,938Direct result per share 3.64 2.94 2.81 2.93 3.05 3.15 3.26Indirect result per share (5.48) (3.69) (0.49) (0.02) 0.00 0.00 0.00Total result per share (1.84) (0.75) 2.32 2.92 3.05 3.15 3.26IFRS NAV per share 30.4 27.5 26.9 26.8 26.7 26.7 26.6Recurring CFPS 3.27 2.94 2.81 2.93 3.05 3.15 3.26Recurring EPS 3.64 2.94 2.81 2.93 3.05 3.15 3.26DPS 2.94 2.94 3.03 3.12 3.21 3.31 3.41Source: Company data, ING estimates226
__<strong>Benelux</strong> <strong>Real</strong> <strong>Estate</strong> February 2010Fig 15 Quarterly profit and loss (€m)2Q09 3Q09 4Q09F 1Q10F 2Q10F 3Q10F 4Q10FGross rents 0.0 13.9 14.7 14.7 14.6 14.8 14.9Net rents 13.1 13.9 14.6 14.6 14.6 14.7 14.9Other rental charges 1.5 1.5 0.8 0.8 0.8 0.8 0.8Property result 14.6 15.5 15.4 15.4 15.4 15.5 15.7Property charges (technical, commercial, mgnt) (0.5) (0.3) (0.4) (0.4) (0.4) (0.4) (0.4)Property operating result 14.1 15.2 15.0 15.0 15.0 15.1 15.3General expenses (0.9) (0.8) (0.8) (0.8) (0.8) (0.9) (0.9)Other results 0.0 0.0 0.0 0.0 0.0 0.0 0.0Operating result before result on portfolio 13.2 14.4 14.2 14.2 14.1 14.3 14.4FV variation of investment property (7.5) (5.5) (10.0) (3.4) (2.1) (0.4) (0.2)Total operating result 5.7 8.9 4.1 10.8 12.0 13.8 14.2Financial income 0.0 0.0 0.2 0.2 0.1 0.0 0.1Interest charges 0.0 0.0 (5.4) (5.4) (5.4) (5.4) (5.4)Total interest (4.6) (4.5) (5.2) (5.2) (5.3) (5.4) (5.3)Revaluation on financial instruments 6.4 (4.8) 0.0 0.0 0.0 0.0 0.0Net financing expenses 1.8 (9.3) (5.2) (5.2) (5.3) (5.4) (5.3)Result before tax 7.5 (0.4) (1.0) 5.6 6.7 8.5 8.9Corporate tax expense 2.4 (0.4) (0.2) (0.2) (0.2) (0.2) (0.2)Deferred tax movements 0.0 1.8 0.0 0.0 0.0 0.0 0.0Net result 9.9 1.0 (1.2) 5.4 6.6 8.3 8.7Source: Company data, ING estimatesFig 16 Quarterly cash flow statement (€m)2Q09 3Q09 4Q09F 1Q10F 2Q10F 3Q10F 4Q10FProfit for the year 9.9 0.0 (1.2) 5.4 6.6 8.3 8.7Total P/L from company activities 9.9 0.0 (1.2) 5.4 6.6 8.3 8.7FV variations in property 0.0 0.0 10.0 3.4 2.1 0.4 0.2Total adjustment for non-monetary items 0.0 0.0 10.0 3.4 2.1 0.4 0.2Change in working capital assets 0.0 0.0 (1.7) 0.0 0.1 (0.4) (0.4)Change in working capital liabilities 0.0 0.0 (5.0) (0.1) (0.1) 0.5 0.5Total operating capital movements 0.0 0.0 (6.7) 0.0 0.0 0.1 0.1CF from other operating activities 0.0 0.0 0.0 0.0 0.0 0.0 0.0Total cash from operations 9.9 0.0 2.1 8.8 8.7 8.9 9.1Loan acquisition 0.0 0.0 2.1 (0.1) (0.3) 1.0 1.0Loan repayment 0.0 0.0 0.0 0.0 0.0 0.0 0.0Financing granted to WDP development RO joint venture 0.0 0.0 0.0 0.0 0.0 0.0 0.0Dividends paid 0.0 0.0 0.0 0.0 (36.8) 0.0 0.0Total cash from financing 93.0 0.0 2.1 (0.1) (37.1) 1.0 1.0Total cash from investing* 0.0 0.0 0.0 0.0 0.0 0.0 0.0Net cash movement 9.9 0.0 4.3 8.7 (28.5) 9.8 10.1Cash balance BOP 0.0 0.0 21.6 18.0 26.8 (1.7) 8.1Cash balance EOP 9.9 0.0 25.9 26.8 (1.7) 8.1 18.2*Unavailable on a quarterly basisSource: Company data, ING estimates227
_<strong>Benelux</strong> <strong>Real</strong> <strong>Estate</strong> February 2010Fig 17 Quarterly per share data (€)2Q09 3Q09 4Q09F 1Q10F 2Q10F 3Q10F 4Q10FNo. of shares 9,400,454 12,533,938 12,533,938 12,533,938 12,533,938 12,533,938 12,533,938Direct result per share 1.16 0.76 0.71 0.70 0.69 0.70 0.71Indirect result per share (0.11) (0.68) (0.80) (0.27) (0.17) (0.04) (0.02)Total result per share 1.05 0.08 (0.10) 0.43 0.52 0.66 0.70IFRS NAV per share 37.6 28.2 28.1 28.0 25.5 26.2 26.9Recurring CFPS 1.16 0.76 0.71 0.70 0.69 0.70 0.71Recurring EPS 1.16 0.76 0.71 0.70 0.69 0.70 0.71DPS 2.94 0 0 0 2.94 0 0Source: Company data, ING estimates228
_<strong>Benelux</strong> <strong>Real</strong> <strong>Estate</strong> February 2010NetherlandsWereldhaveA €2.5bn ‘global player’Arjan KnibbeAmsterdam (31) 20 563 8780arjan.knibbe@ing.comJean-Yves DevlooAmsterdam (31) 20 563 8745jean-yves.devloo@ing.comInitiating coverageBuy<strong>Real</strong> estate5 February 2010€65.0Target price€72.7ReutersWEHA.ASWe initiate with a BUY and a €72.7 TP, based on a targetpremium of 0% to 2010F IFRS NAV of €72.7. It reflects theuncommitted development pipeline, strong balance sheet,execution risk of the strategy change and currency risks.Wereldhave has set itself a very ambitious programme to restructure itsportfolio. This process will take years and is likely to be the key driver ofearnings growth.In the current phase, Wereldhave is well positioned to outperform in eitherU-, V- or W-shaped recoveries as it can accelerate or slow down its verysubstantial acquisition and disposal programme that lies ahead.We appreciate the fact that Wereldhave responded to the crisis very early,some say too early, and did not have to raise equity. The new managementearns respect for its clearer strategy, which is ambitious but lacks geographicfocus.Key ratios and forecasts2008 2009F 2010F 2011F 2012FEPS adj (€) 4.92 4.91 4.83 4.97 5.32PER (x) 13.3 13.4 13.6 13.2 12.3EPRA NNNAV per share (€)* N/A N/A N/A N/A N/AIFRS NAV per share (€)** 83.74 73.28 72.72 78.25 82.00P/IFRS NAV (%) 78 0 0 0 0DPS (€) 4.66 4.59 4.72 5.05 5.17Dividend yield (%) 7.1 7.0 7.2 7.7 7.9CFPS (€) 4.71 5.84 4.44 3.75 4.34LTV (%) 26 28 31 31 3012-month forecast returns (%)Share price 10.8Dividend 7.212m f'cst total return 18.0Key ratios (%)2009 2010FRental growth -2.1 5.4Operating margin 66.8 66.5Occupancy rate 94.6 93.4Share dataNo. of shares (m) 21.28Daily turnover (€m) 8.1Free float (%) 100Enterprise value (€m) 2,198Market cap (€m) 1,382Share price performance7060504030201/08 7/08 1/09 7/09 1/10Source: INGPriceAEX All Share (rebased)* Wereldhave only reports an EPRA NAV, and this is on an annual basis. EPRA NAV end-2008 was€86.31 (fully diluted)** IFRS NAV per share before distribution of the dividendSource: Company data, ING estimates229
_<strong>Benelux</strong> <strong>Real</strong> <strong>Estate</strong> February 2010Investment caseWereldhave is the oldest quoted property company in the <strong>Benelux</strong>, having beenestablished in 1930. The company has a €2.4bn investment portfolio and adevelopment pipeline of c.€465m, of which €72m is spent. The pipeline isuncommitted. With the arrival of the new CEO, Hans Pars, in 2009, thecompany’s strategy has been adjusted. Wereldhave has stated that it willconcentrate on nine regions, in each of which it aims to have an office, retail orresidential portfolio of c.€400m. Belgium will remain the only multi-sectorcountry. Management aims to increase the retail weighting from 45% to 50-60%and dispose of its industrial portfolio and smaller assets with a value below€20m.ValuationWe value Wereldhave at premium of 0% to 2010F IFRS NAV, which leads to our targetprice of €72.7. The 0% premium reflects the uncommitted development pipeline, strongbalance sheet, execution risk of the strategy change and currency risks.HighlightsSeven meagre yearscould be overExecution moreimportant than marketsfor WereldhaveOver the past seven years Wereldhave has slightly neglected EPS, in our view, as itfell from €5.90 to €4.90 in the period 2002-08, which was a very strong period in directproperty markets. On the other hand, we must compliment Wereldhave for having notneeded to raise equity in the past crisis, because of its strong balance sheet.Wereldhave did issue a five year €230m 4.375% convertible bond (exercise price of€72.184) in August.Timing of the execution of the new strategic plan will be the key determinant of EPSgrowth, not the real estate markets. In Figure 1 we illustrate the acquisition anddisposal work that lies ahead of Wereldhave as it executes its adjusted strategic plan.As a rule, we do not pencil in planned acquisitions or disposals in our estimates.Fig 1 Portfolio restructuring by country and sectorUSA-283260212UK-11-126341Finland-113-90Spain-33-37316France-37-41318Belgium-167181Nethlnds-153-17195-300 -200 -100 0 100 200 300 400 500 600Offices Retail Industrial ResidentialSource: ING estimates230
<strong>Benelux</strong> <strong>Real</strong> <strong>Estate</strong> February 2010We comment extensively on the various elements of the company’s plan later in thisnote. In addition to these transactions, we feel that the internal organisation will needto be adjusted to become more retail-focused.SWOTFig 2 SWOT analysisStrengthsStrong balance sheet with 30% LTV at 30 Sept 2009Long track record in a large number of marketsStrong local management teamsClear strategyAverage asset size increasingDevelopment and entrepreneurial track recordNo growth for growth’s sakeTradition of internal managementOpportunitiesEnter new marketsExport European or US best practice between continentsNew management could make Wereldhave a more outward lookingorganisationWeaknessesBi-continental model lacks focusSmall country portfolios; c.€400mLate with retail overweightEPS track recordPipeline disclosure unstructuredThreats/RisksSelf-imposed turmoil in portfolio may cause bumpy rideUS dollar and UK Sterling (hedged 64% and 65%, respectively)Internal organisation is not (yet) the retail management and officetiming “machine” it should beSource: ING_RisksProperty companies arelow risk, on averageBecause of the contractual nature of a large part of the recurring cash flows, propertycompanies are usually considered to have less risk than most other equity sectors.The risks for property companies bear a strong relation to the amount of developmentexposure, the geographical and sectoral breakdown, corporate governance andalignment of interests between management and shareholders.DevelopmentWereldhave is not afraid to take on greenfield developments, such as the one in SanAntonio, Texas. As a result, we believe the potential development exposure could bearmore risk than that of its Dutch peers. We have included a sensitivity table of NAV tothe development pipeline later in the note (see Figure 15).Retail switchWereldhave has announced it wants to make retail its core sector as it is possible toadd value in that sector. We believe that the retail markets have become veryprofessional and complex and that Wereldhave needs to beef up its retail expertisefurther. There is a risk that retail will not outperform offices to the same extent as in thepast decade, because there was a structural catch-up yield shift that put retail yields inline with prime office yields.New managementWereldhave installed a completely new management board in 2009. Notwithstandingthe relevant experience of Hans Pars, we believe this does bear a risk. In particular,because a change of strategic direction has been taken.231
<strong>Benelux</strong> <strong>Real</strong> <strong>Estate</strong> February 2010Execution of planExecution of the strategic plan, which we find attractive on a number of points, couldbe challenging. If management is unable to keep to promises on timing, its reputationwill be dented before it has really begun.CurrenciesWereldhave operates in the United Kingdom and in the United States. This bringssubstantial currency risks. Wereldhave aims to hedge between 30% and 70% of itsnon-euro exposure. In November 2009 Wereldhave reported that a 10% change incurrencies led to a €1.57 (or 2%) change in NAV per share. Cash flows are not hedgedand a 10% change in average currency rates would have led to a €0.17 (or 3.5%)change in recurring EPS.Fig 3 Current portfolio (30 Sept 2009) Fig 4 Target portfolio8006004002001200100080060040020000Nethlnds Belgium France Spain Finland UK USANethlndsBelgiumFranceSpainFinlandUKUSAOffices Retail Industrial ResidentialOffices Retail Industrial ResidentialSource: Company dataNote: Belgium is a mixed portfolioSource: Company data, ING estimates_Catalysts• Execution of the new strategy will cause very significant deal flow• A pick up of US or European property markets• Currency swings• Results are due out on 3 March• Newsflow about the financing of the growth from c.€2.5bn to €3.6-3.8bn• A potential second step in the strategyThe new strategic planFairly brave but stillpulling punchesOur view on thestrategy is mixedThe new strategic plan has a number of elements that we will discuss. We believe theplan is well thought through and leaves ample flexibility for later adjustments. In Figure5 we comment on the main points. This is a fairly brave strategy, as it aims to changethe company. On the other hand, we believe that new management is pulling itspunches somewhat, maybe to make sure the organisation is not shaken too much.The presented plan may well be the first of a number of steps to create an ultra flexible(sectoral and geographical) property company. Some would say it lacks focus, ourviews are below.232
<strong>Benelux</strong> <strong>Real</strong> <strong>Estate</strong> February 2010Fig 5 Our verdict on the main points of Wereldhaves’ new strategyVerdictCommentIncrease retail to 50-60% +/- Too late and potentially too littleNine submarkets +/- Conveniently close to heritageTwo continents - - Lacks credible pan-US scaleMinimum presence of €400m - Seems low, especially for retailOne sector per submarket +/- Inflexible but good focusDisposal of sub-€20m assets and industrial property ++ Cost and management time efficientRetail focus on value-add through management + Is there another way? New for WereldhaveOffice and apartment value add by timing ++ Timing is more than half the returnDevelopments adds 5-10% (€180-360m) per annum ++ Cost conscious, new and SRI- and timing-gripSource: ING_Increase retail to 50-60%Retail was the flavour ofthe previous decadePrime retail may seesignificantly morechange in consumerhabits than prime officespace will see fromoffice workersRetail was the flavour of the previous decade and many property companies in andoutside the <strong>Benelux</strong> increased their retail weighting. Retail has made a structuralrelative (to office space) yield shift that will not be repeated. This structural yield shiftexplains part of the outperformance in the past. There is little doubt that retailoutperforms in difficult markets. Lastly, the supply constraints are much stronger forretail than for office or apartment space.We agree with Wereldhave and many others that good management can add muchmore value to retail than to office space. Nevertheless, we believe that Wereldhavecould be beefing up its retail exposure near its relative peak. We are not sure retail willoutperform office space over the next three years. Prime retail may see significantlymore changes in consumer habits – greater use of the internet, less use of retailing asa leisure activity etc – than prime office space will see from office workers.One of the elements of a retail property strategy is that the investor has a certain cloutbecause the retailer has several outlets with the investor. With a €2bn retail portfolioscattered across Europe, (the US portfolios will have office and residential) that is not acredible case.Nine submarketsA friendly startThe choice of nine submarkets seems to be the easiest way, as no one gets hurt.Wereldhave does not exit any of its markets, which in itself a good thing as it iscurrently not a sellers market, but we would expect the company to differentiate morebetween its current markets in the future.Two continentsThe US portfolio shouldbe liquidatedWereldhave should notadjust its strategy toserve a shrinking groupof small investorsWe do not believe there is a strong rational argument for Wereldhave to operate in theUS. It has no superior asset or market picking skills that we are aware of (and weasked), its track record is not such that it warrants a presence, and the presence bearscurrency risk. We have not seen any best US practice being imported (certainly not inoffices), or the other way around. Management believes it has good region-pickingskills.The US is a legacy portfolio and should be liquidated when the markets are ripe for it.The diversification effect only makes sense for small investors that are unaware of, orhave no access to, US REITs, and that do not want to or cannot buy a US REITumbrella fund. These investors are dying out and we believe Wereldhave should notweaken its strategy to service them.233
<strong>Benelux</strong> <strong>Real</strong> <strong>Estate</strong> February 2010Minimum presence of €400mWe are unconvincedthat ‘one size fits all’ isthe right choiceWe believe that €400m is sensible number for an office portfolio in smaller markets,but too small for a retail portfolio. As market dominance is more beneficial in retail thanin office space we are unconvinced that ‘one size fits all’ is the right choice here. Itsbeauty is its simplicity. The €400m is a minimum number. Wereldhave could decide toput more capital into a market so it is not limiting itself to assets below €400m. A largeLa Défense tower or a UK shopping centre are still possible, but would be stretchingthe balance.One sector per submarketFocus and disciplineare goodWe believe that focus and discipline are good things. With this restriction Wereldhaverepairs part of the damage of the US distractions. The resulting lower flexibility is anacceptable price to pay.Disposal of sub-€20m assets and industrial propertyGood idea. This should have been done before, unless there is a marriage value.Retail focus on value add through managementThis is an open door but a useful one. For Wereldhave, the new plan requires the onboarding of a large number of people with retail skills. Managing Director and memberof the Board Dirk Anbeek brings 13 years of Ahold experience. In addition, Wereldhaverecently hired a senior retail expert from WPM, a specialised retail propertymanagement company that managed Corio’s Hoog Catharijne shopping centre amongothers. The company also hired a senior retail specialist from Delancey to lead the UKretail drive.No deep-rooted retailculture, yetWereldhave does not have the same deep retail culture as some of its peers, and it willtake years to create it. We were slightly surprised to hear about Wereldhave’s UKfocus on retail. We think that UK retail is extremely competitive and Wereldhave lacksexperience and size. UK shopping centres often have high occupancy cost ratios,putting a question mark on the longer term sustainability of some of the rental levels.Office and apartment value add by timingWe have not often seen such a stress on the importance of timing in the office andresidential markets. We also like the inclusion of development in the timing picture. Welook forward to more guidance about this timing process. We believe that Wereldhavemay be better positioned to read the gap between building cost and investment valuethan many others.Developments should add 5-10% (€130-260m) per annum to the portfolioWhy 5-10%?This is a good idea, but why so restrictive and why not set a wider range of 0-20%?Clearly, if timing is a core competence development, completions should become zeroat some stage in the cycle.234
___<strong>Benelux</strong> <strong>Real</strong> <strong>Estate</strong> February 2010OutlookManagement stated in November 2009 that it expects a direct investment result (DIR)per share of between €4.85 and €4.90, if currencies are stable. Our estimate stands at€4.89 per share. In 2008 Wereldhave reported €4.92. Management does not expect astrong recovery in office markets.ConsensusWe are 6% below 2010EPS consensusFig 6 Consensus EPS versus ING estimates (€)2008 2009F 2010F 2011FConsensus 4.92 4.95 4.87 4.76ING 4.92 4.89 4.52 4.65Difference 0.00 (0.06) (0.35) (0.11)Difference (%) 0.0 -1.1 -7.2 -2.3Source: ING estimatesWe are 1% or €0.06 below consensus for 2009F EPS. For 2010 we are much morenegative as the gap to consensus widens to €0.35, or 7%.Our estimates and assumptionsWe have not adjusted for currency changes. Figures 7 and 8 highlight our forecasts forvacancy rates and valuation results.Fig 7 Forecast valuation results per country (%)2008 2009F 2010F 2011F 2012F 2013F 2014FNetherlands -0.5 -7.1 -0.4 5.0 2.0 2.0 2.0Belgium 1.2 -2.4 -0.4 6.0 2.0 2.0 2.0France -11.1 -14.6 -3.0 4.0 2.0 4.0 2.0Spain -4.3 -12.5 -4.0 2.0 0.0 3.0 2.0Finland 0.9 -13.3 -3.0 -1.0 1.5 2.0 2.0UK -20.7 -15.2 4.0 6.0 4.0 4.0 4.0US -2.4 -7.8 -1.0 8.0 4.0 4.0 4.0Total -4.2 -8.8 -1.2 4.7 2.6 3.0 2.8Source: ING estimatesWe believe that 2010 will continue to show negative valuations as Spain, Finland andalso France will show negative valuation results. Vacancies are expected to peak in2010 and then gradually level off to 4%. We expect the UK and the US to recover morequickly than other markets.Fig 8 Forecast vacancies per country (%)Vacancies 2009F 2010F 2011F 2012F 2013F 2014FNetherlands 2 4 4 3 3 3Belgium 8 9 7 6 5 4France 4 4 3 2 2 2Spain 5 8 7 5 4 3Finland 1 2 3 3 3 3UK 8 7 6 4 3 3US 9 9 7 5 5 5Total 5 6 5 4 4 4Source: ING estimates235
_<strong>Benelux</strong> <strong>Real</strong> <strong>Estate</strong> February 2010Company profileInvestment portfolioBuilding cheaper thanbuying, UK seems outof placeThe investment portfolio of Wereldhave is special because a large part has beendeveloped by the company. Previous management had a strategy that building wascheaper than buying. This has also resulted in a fairly high number of non-primeoffices.A large part of the UK portfolio dates back to the Peachy takeover in 1988. Capitalrecycling has not been on the agenda in the UK. The individual office assets in Londonare below 4,000m², which we think is small, and we are unaware of a UK retail trackrecord that justifies the new focus on this sector in the UK. In our view, in the UK inparticular it may be a good strategy to build rather than to buy.The Belgian portfolio seems attractive to us, with good recent progress on retaildevelopments. Offices should not be too hard to dispose of. The Finnish economy is ina deeper recession than much of the rest of Europe, and Wereldhave’s Itakeskuscentre – which forms c.90% of the €522m (21%) Finnish presence – is likely to besuffering.Fig 9 Wereldhave portfolio as at 30 September 2009 (€m)Netherlands Belgium France Spain Finland UK US TotalOffices 17 167 82 84 9 126 574 1061Retail 205 219 41 37 513 59 28 1101Industrial 153 0 37 33 0 11 0 235Residential 0 0 0 0 0 0 88 88Total 375.0 386.0 160.0 155.0 522.0 196.3 690.0 2,484Source: Company dataWe believe Wereldhaveshould exit the USThe US portfolio is divided into three regions: Texas, San Diego and Washington.Wereldhave has a local presence in these markets. It remains unclear to us whetherthe company aims to outperform the local markets or believes these markets willoutperform the US as a whole, or both. Because it lacks size, scale or othercompetitive advantages such as superior national market intelligence, we believeWereldhave should exit the US and focus on the task ahead in Europe.Wereldhave’s Dutch portfolio has a striking near-absence of office space (5% of Dutchportfolio) and a 40% distribution space weighting. The shopping centres in Arnhem,Leiderdorp and Etten Leur bring in half of the total Dutch rents, but are still fairly smallcentres.236
__<strong>Benelux</strong> <strong>Real</strong> <strong>Estate</strong> February 2010Fig 10 Portfolio breakdown by region as at 30September 2009Fig 11 Portfolio breakdown by sector as at 30September 2009USA28%Netherlands15%ResidentialIndustrial 4%9%Belgium16%Offices43%UK8%Finland21%Spain6%France6%Retail44%Source: Company dataSource: Company dataFigure 12 gives a picture of the recent valuation changes as a result of yield increases.Finland was hit particularly hard in 2009, with a 60bp yield increase in only ninemonths. Belgium was remarkably strong, in line with other Belgian operators. Thebiggest yield increase in the period from 2007 to 3Q09 took place in the UK, whereyields rose from 6.6% to 8.5%.Fig 12 Net property yields Wereldhave 2007-3Q09 (%)3Q09 change (ppt) 2008 change (ppt) 2007Belgium 6.2 0.1 6.1 0.3 5.8Finland 5.9 0.6 5.3 0.2 5.1France 6.5 0.5 6.0 0.4 5.6Netherlands 6.5 0.5 6.0 0.1 5.9Spain 7.1 0.5 6.6 0.5 6.1UK 8.5 0.6 7.9 1.3 6.6US 6.8 0.5 6.3 0.1 6.2Total 6.6 0.4 6.2 0.3 5.9Source: Company data_VacanciesFigure 13 illustrates the vacancy rates at Wereldhave over the years. The occupancylevel has dropped substantially in many markets, notably Finland, Paris and the US. At99%, the Spanish occupancy rate is not yet impacted by the crisis.Fig 13 Occupancy (%)2005 2006 2007 2008 30-Jun-09Netherlands 83 84 87 92 93Belgium 99 99 99 99 99Paris 97 98 96 96 37Spain 89 94 97 98 99Finland 93 99 99 99 99UK 97 98 92 91 91US 90 89 92 93 90Total 92 94 94 95 90Note: Average over the past periodSource: Company data237
_<strong>Benelux</strong> <strong>Real</strong> <strong>Estate</strong> February 2010DevelopmentsWereldhave has a €476m uncommitted development pipeline. We have modelledPhase 1 of San Antonio and Nivelles in our estimates.Fig 14 Wereldhave’s uncommitted development pipelineDevelopments Capex (€m) Phase 1 Phase 2San Antonio (mixed) 262 €131m delivery 2010 and 2011 €131m, delivery undecidedNivelles (retail) 145 2011: €62m 2011-15: €83 mTournai Retail) 34 2011-12: €20m 2011-12: €14mLeiderdorp (Retail) 35 2012-14: €35mTotal 476Source: Company dataWereldhave’s largest development is San Antonio, where it will complete two officetowers at the end of 1Q10 as the start of a large mixed development. Management haspostponed the next completions until 2011. In Belgium, Wereldhave is working on twoextensions of shopping centres: Nivelles, where construction will start shortly, andTournai, where management expects to be able to apply for a building permit soon,now that the urban zoning plan has been approved.Sensitivity analysis of our target pricePipeline could add €5-7to NAV per shareFigure 15 illustrates what the developments could add to NAV per share, and henceour target price. On the horizontal axis we have the yield on cost and on the verticalaxis is the yield on completion. Management has stated that the yields on cost of SanAntonio and Nivelles are c.7.5%, with the cost of construction falling. We believe thispipeline could add c.€5-7 per share over the next few years. As stated above, this notfully incorporated in our estimates.Fig 15 Sensitivity of NAV per share to the €476m pipeline (€)Yield on cost (%)7.0 7.5 8.0 8.5 9.0 9.5 10.05.5 6.09 8.13 10.16 12.19 14.22 16.25 18.286.0 3.72 5.59 7.45 9.31 11.17 13.04 14.90Yield on 6.5 1.72 3.44 5.16 6.88 8.60 10.31 12.03Completion (%) 7.0 0.00 1.60 3.19 4.79 6.38 7.98 9.587.5 (1.49) 0.00 1.49 2.98 4.47 5.96 7.458.0 (2.79) (1.40) 0.00 1.40 2.79 4.19 5.59Source: ING estimates_Corporate governanceManagement boardJ. Pars (male, aged 47)• Zadelvast Beheer, Commercial Manager 1987-89• Stichting Pensioenfonds Hoogovens, Portfolio Manager 1989-93• Rodamco Europe, several management positions 1993-2003• VastNed Groep, Director and CIO 2003-08• Wereldhave, appointed to Director from 1 January 2009• Managing Director as of 2 April 2009, CEO as of 1 July 2009238
<strong>Benelux</strong> <strong>Real</strong> <strong>Estate</strong> February 2010D.J. Anbeek (male, aged 46)• DSM, several financial positions 1988-94• Pricewaterhouse, Senior Consultant 1994-95• Ahold, several international management positions 1996-2005• Albert Heijn, Director Franchise & <strong>Real</strong> <strong>Estate</strong> 2006-09• Wereldhave, Managing Director as of 1 June 2009Hans Pars looks after Belgium, the US and the UK. Dirk Anbeek looks after theNetherlands, France, Finland and Spain.239
__<strong>Benelux</strong> <strong>Real</strong> <strong>Estate</strong> February 2010FinancialsFig 16 Balance sheet (€m)2008 2009F 2010F 2011F 2012F 2013F 2014FInvestment properties 2,646.0 2,386.2 2,477.0 2,670.4 2,739.4 2,821.2 2,900.8Total fixed assets 2,781.7 2,520.4 2,611.2 2,804.6 2,873.6 2,955.4 3,035.0Trade and other receivables 12.4 16.1 17.7 19.1 19.6 20.0 20.3Tax receivables 4.4 1.4 1.5 1.7 1.7 1.7 1.8Cash and cash equivalents 24.7 12.8 28.4 30.3 48.5 28.6 79.0Total current assets 41.5 30.3 47.7 51.1 69.8 50.3 101.1Total assets 2,823.2 2,550.7 2,658.9 2,855.7 2,943.3 3,005.7 3,136.1Equity - group share 1,740.3 1,559.2 1,547.2 1,664.9 1,744.7 1,831.8 2,018.4Minority interest 119.9 115.8 114.7 115.7 116.5 117.0 117.5Total equity 1,860.2 1,674.9 1,661.8 1,780.6 1,861.1 1,948.8 2,135.8Interest bearing liabilities 715.6 518.2 618.2 678.2 678.2 648.2 688.2Deferred tax liabilities 151.8 124.7 124.7 124.7 124.7 124.7 124.7Other long term liabilities 21.3 21.4 21.4 21.4 21.4 21.4 21.4Long term liabilities 888.7 664.2 764.2 824.2 824.2 794.2 834.2Trade payables 3.5 3.6 4.0 4.3 4.4 4.5 4.6Taxes 3.3 4.9 5.4 5.8 6.0 6.1 6.2Interest bearing liabilities 24.0 170.8 188.1 202.6 208.4 212.2 215.9Other short term liabilities 43.5 32.1 35.4 38.1 39.2 39.9 40.6Short term liabilities 74.3 211.5 232.8 250.8 258.0 262.7 267.2Total equity and liabilities 2,823.2 2,550.7 2,658.9 2,855.7 2,943.3 3,005.7 3,237.3Source: Company data, ING estimatesFig 17 Profit and loss (€m)2008 2009F 2010F 2011F 2012F 2013F 2014FGross rents 168.3 164.8 173.6 182.3 195.0 198.6 202.0Service costs charged 42.6 44.2 47.0 50.0 53.9 54.8 55.7Total revenues 210.9 209.0 220.6 232.4 248.8 253.4 257.7Service costs paid (48.2) (51.8) (55.9) (59.5) (64.0) (65.1) (66.2)Property expenses (14.1) (14.4) (17.3) (18.4) (20.0) (20.4) (20.7)Net rental income 148.6 142.8 147.4 154.4 164.8 167.9 170.8Valuation results (108.0) (249.0) (27.5) 118.7 69.0 81.8 79.6Results on disposals 4.3 0.8 0.0 0.0 0.0 0.0 0.0General costs (14.5) (15.1) (15.9) (16.8) (18.3) (18.6) (19.0)Other income and expenses 4.0 3.6 4.0 4.2 4.5 4.6 4.6Operational result 34.4 (116.9) 107.9 260.5 220.0 235.7 236.1Interest charges (31.7) (20.0) (27.0) (30.2) (32.0) (32.1) (32.2)Interest income 8.5 1.7 0.7 0.6 1.1 1.3 1.4Interest capitalised (2.1) 0.7 2.9 2.9 2.9 2.9 2.9Net interest (25.2) (17.5) (23.4) (26.7) (28.0) (27.9) (27.9)Other financial income and expenses (7.6) 0.4 0.0 0.0 0.0 0.0 0.0Total finance expenses (32.9) (17.1) (23.4) (26.7) (28.0) (27.9) (27.9)Result before tax 1.5 (134.0) 84.5 233.9 192.0 207.7 208.2Taxes on result 7.3 30.1 1.6 (17.4) (10.9) (12.6) (12.3)Direct 0.0 (2.2) (2.0) (2.0) (2.0) (2.0) (2.0)Indirect 0.0 32.3 3.6 (15.4) (8.9) (10.6) (10.3)Profit 8.8 (103.9) 86.0 216.5 181.0 195.1 195.9Shareholders share 0.5 (107.9) 79.3 207.6 172.3 186.0 186.6Minority interest share 8.3 4.0 6.8 8.9 8.8 9.1 9.3Direct result 109.4 111.6 110.0 113.2 121.0 123.9 126.6Wereldhave SH share 102.3 104.4 102.8 105.8 113.1 115.8 118.4Minority interest share 7.1 7.3 7.1 7.4 7.9 8.1 8.2Indirect result (111.3) (215.5) (23.9) 103.3 60.0 71.2 69.3Wereldhave SH share (101.8) (212.3) (23.6) 101.8 59.1 70.2 68.3Minority interest share (9.5) (3.2) (0.4) 1.5 0.9 1.1 1.0Source: Company data, ING estimates240
__<strong>Benelux</strong> <strong>Real</strong> <strong>Estate</strong> February 2010Fig 18 Cash flow statement (€m)2008 2009F 2010F 2011F 2012F 2013F 2014FProfit 8.8 (103.9) 86.0 216.5 181.0 195.1 195.9Exchange rate differences 0.2 (0.5) 0.0 0.0 0.0 0.0 0.0Non cash financial income and expense 7.3 (0.1) 0.0 0.0 0.0 0.0 0.0Valuation results 108.0 249.0 27.5 (118.7) (69.0) (81.8) (79.6)Results on disposals (3.0) (0.8) 0.0 0.0 0.0 0.0 0.0Deferred taxes (10.3) (28.3) 0.0 0.0 0.0 0.0 0.0Other movement in reserves 0.6 0.6 0.0 0.0 0.0 0.0 0.0Movements in working capital 6.3 (4.7) 2.3 2.0 0.8 0.5 0.5CFO 117.8 111.3 115.9 99.8 112.8 113.8 116.8Proceeds from disposals 2.7 2.8 0.0 0.0 0.0 0.0 0.0Investments in investment property, equipment and projects (146.3) (34.7) (118.3) (74.7) 0.0 0.0 0.0Investments in minority interests 0.0 (2.2) 0.0 0.0 0.0 0.0 0.0Investments in financial assets (2.9) 0.5 0.0 0.0 0.0 0.0 0.0Investments in other long term assets (0.8) (3.9) 0.0 0.0 0.0 0.0 0.0CFI (147.4) (37.4) (118.3) (74.7) 0.0 0.0 0.0New loans interest bearing debts 346.6 271.5 117.3 74.5 5.8 (26.2) 43.7Repayment interest bearing debts (192.9) (303.1) 0.0 0.0 0.0 0.0 0.0Change other long term liabilities (3.4) (0.5) 0.0 0.0 0.0 0.0 0.0Cancellation of preference shares 0.0 (3.4) 0.0 0.0 0.0 0.0 0.0Dividend paid-group share (96.6) (73.8) (91.2) (89.9) (92.5) (98.9) (101.2)Dividend paid to minority interest (6.5) (6.3) (7.9) (7.8) (8.0) (8.6) (8.8)Cash part forward transactions (9.6) 29.8 0.0 0.0 0.0 0.0 0.0CFF 37.5 (85.8) 18.1 (23.2) (94.7) (133.6) (66.4)Increase/decrease in cash 7.9 (12.0) 15.7 1.9 18.1 (19.9) 50.4Cash balance BOP 16.8 24.7 12.8 28.4 30.3 48.5 28.6Cash and bank balances EOP 24.7 12.8 28.4 30.3 48.5 28.6 79.0Source: Company data, ING estimatesFig 19 Per share data (€)2008 2009F 2010F 2011F 2012F 2013F 2014FNo. of ordinary shares EOP 20,781,735 21,276,988 21,276,988 21,276,988 21,276,988 21,276,988 21,276,988Maximum convertible shares 2,061,856 2,061,856 2,061,856 2,061,856 2,061,856 2,061,856 2,061,856Fully diluted number of shares 22,843,591 23,338,844 23,338,844 23,338,844 23,338,844 23,338,844 23,338,844Average no. of shares outstanding 20,781,735 21,276,988 21,276,988 21,276,988 21,276,988 21,276,988 21,276,988Result per share – group share – diluted 0.02 (5.07) 3.73 9.76 8.10 8.74 8.77Direct result per share – group share 4.92 4.91 4.83 4.97 5.32 5.44 5.56Indirect result per share – group share (4.90) (9.98) (1.11) 4.78 2.78 3.30 3.21Dividend previous year 4.66 4.59 4.72 5.05 5.17 5.29IFRS NAV per share 83.74 73.28 72.72 78.25 82.00 86.09 94.86EPRA NNNAV per share N/A N/A N/A N/A N/A N/A N/ARecurring CFPS 4.71 5.84 4.44 3.75 4.34 4.38 4.51Recurring EPS 4.92 4.91 4.83 4.97 5.32 5.44 5.56Source: Company data, ING estimates241
__<strong>Benelux</strong> <strong>Real</strong> <strong>Estate</strong> February 2010Fig 20 Quarterly balance sheet (€m)1Q09 2Q09 3Q09 4Q09F 1Q10F 2Q10F 3Q10F 4Q10FInvestment properties 2,657.6 2,586.8 2,412.8 2,386.2 2,400.7 2,416.6 2,443.5 2,477.0Total fixed assets 2,786.0 2,708.2 2,547.0 2,520.4 2,534.9 2,550.8 2,577.6 2,611.2Trade and other receivables 13.2 15.4 16.4 16.1 17.1 17.1 17.6 17.7Tax receivables 5.6 5.6 1.5 1.4 1.5 1.5 1.5 1.5Cash and cash equivalents 26.4 29.5 41.4 12.8 24.3 24.9 29.5 28.4Total current assets 45.1 50.5 59.3 30.3 42.9 43.4 48.7 47.7Total assets 2,831.1 2,758.7 2,606.3 2,550.7 2,577.8 2,594.3 2,626.3 2,658.9Equity - group share 1,752.0 1,654.7 1,557.5 1,559.2 1,571.8 1,494.2 1,517.7 1,547.2Minority interest 121.9 115.9 114.8 115.8 117.4 111.0 112.8 114.7Total equity 1,873.9 1,770.6 1,672.3 1,674.9 1,689.1 1,605.2 1,630.5 1,661.8Interest bearing liabilities 721.2 587.2 568.2 518.2 518.2 618.2 618.2 618.2Deferred tax liabilities 149.7 143.7 124.7 124.7 124.7 124.7 124.7 124.7Other long term liabilities 21.9 21.5 21.4 21.4 21.4 21.4 21.4 21.4Long-term liabilities 892.8 752.4 714.2 664.2 664.2 764.2 764.2 764.2Trade payables 3.1 3.5 3.9 3.6 3.8 3.8 4.0 4.0Taxes 2.9 3.2 5.0 4.9 5.2 5.2 5.4 5.4Interest bearing liabilities 15.0 188.1 174.2 170.8 181.2 181.6 187.1 188.1Other short term liabilities 43.4 41.0 36.7 32.1 34.1 34.2 35.2 35.4Short-term liabilities 64.4 235.7 219.7 211.5 224.4 224.8 231.6 232.8Total equity and liabilities 2,831.1 2,758.7 2,606.3 2,550.7 2,577.8 2,594.3 2,626.3 2,658.9Source: Company data, ING estimatesFig 21 Quarterly profit and loss account (€m)1Q09 2Q09 3Q09 4Q09F 1Q10F 2Q10F 3Q10F 4Q10FGross rents 41.7 41.9 41.0 40.2 42.6 42.7 44.0 44.2Service costs charged 11.6 11.5 10.8 10.4 11.4 11.4 12.0 12.1Total revenues 53.3 53.4 51.7 50.6 54.1 54.2 56.1 56.4Service costs paid (13.8) (13.3) (12.6) (12.1) (13.6) (13.6) (14.3) (14.4)Property expenses (3.5) (3.2) (3.9) (3.8) (4.2) (4.2) (4.4) (4.4)Net rental income 36.0 36.8 35.3 34.7 36.2 36.3 37.3 37.5Valuation results (31.8) (50.8) (139.8) (26.6) (15.1) (13.7) (2.7) 4.0Results on disposals 0.0 0.0 0.8 0.0 0.0 0.0 0.0 0.0General costs (3.9) (3.6) (3.8) (3.8) (4.0) (3.9) (4.0) (4.0)Other income and expenses 1.0 0.8 0.9 0.9 1.0 1.0 1.0 1.0Operational result 1.3 (16.9) (106.6) 5.3 18.2 19.7 31.6 38.5Interest charges (6.2) (4.2) (3.1) (6.5) (6.5) (6.7) (6.9) (7.0)Interest income 1.6 0.4 (0.6) 0.3 0.3 0.2 0.1 0.1Interest capitalised 0.0 0.0 0.0 0.7 0.7 0.7 0.7 0.7Net interest (4.7) (3.7) (3.6) (5.5) (5.4) (5.8) (6.1) (6.1)Other financial income and expenses (1.1) 1.8 (0.2) 0.0 0.0 0.0 0.0 0.0Total finance expenses (5.8) (2.0) (3.8) (5.5) (5.4) (5.8) (6.1) (6.1)Result before tax (4.4) (18.8) (110.4) (0.2) 12.7 13.9 25.5 32.4Taxes on result 3.0 6.4 17.8 2.9 1.5 1.3 (0.1) (1.0)Direct 0.0 0.0 0.0 (0.5) (0.5) (0.5) (0.5) (0.5)Indirect 0.0 0.0 0.0 3.4 2.0 1.8 0.4 (0.5)Profit (1.5) (12.5) (92.6) 2.7 14.2 15.2 25.3 31.3Shareholders share (3.3) (12.9) (93.3) 1.7 12.6 13.6 23.6 29.5Minority interest share 1.9 0.4 0.7 1.0 1.6 1.6 1.8 1.9Direct result 28.1 30.4 27.3 25.8 27.3 27.1 27.7 27.9Wereldhave SH share 26.2 28.7 25.6 23.9 25.6 25.3 25.9 26.0Minority interest share 1.9 1.7 1.7 1.9 1.8 1.8 1.8 1.8Indirect result (32.9) (49.1) (139.2) (23.2) (13.2) (11.9) (2.4) 3.5Wereldhave SH share (29.5) (41.6) (118.9) (22.2) (13.0) (11.7) (2.3) 3.4Minority interest share (3.4) 2.0 (1.0) (0.9) (0.2) (0.2) 0.0 0.1Source: ING estimates242
_<strong>Benelux</strong> <strong>Real</strong> <strong>Estate</strong> February 2010Fig 22 Quarterly cash flow statements (€m)1Q09 2Q09 3Q09 4Q09F 1Q10F 2Q10F 3Q10F 4Q10FProfit (1.5) (12.5) (92.6) 2.7 14.2 15.2 25.3 31.3Exchange rate differences (0.1) 0.0 (0.1) 0.0 0.0 0.0 0.0 0.0Adjustments: 0.0 0.0 0.0 0.0 0.0 0.0 0.0 0.0Non cash financial income and expense 1.5 0.0 0.2 0.0 0.0 0.0 0.0 0.0Valuation results 31.8 0.0 139.8 26.6 15.1 13.7 2.7 (4.0)Results on disposals 0.0 0.0 (0.8) 0.0 0.0 0.0 0.0 0.0Deferred taxes (3.6) 0.0 (19.8) 0.0 0.0 0.0 0.0 0.0Other movement in reserves 0.2 0.0 0.3 0.0 0.0 0.0 0.0 0.0Movements in working capital (3.3) 0.0 7.0 (4.5) 1.4 0.0 0.7 0.1CFO 24.9 (12.5) 33.8 24.8 30.7 28.9 28.8 27.5Proceeds from disposals 0.3 0.0 2.8 0.0 0.0 0.0 0.0 0.0Investments in investment property, equipment and projects (12.8) 0.0 (11.5) 0.0 (29.6) (29.6) (29.6) (29.6)Investments in minority interests 0.0 0.0 (2.2) 0.0 0.0 0.0 0.0 0.0Investments in financial assets 0.6 0.0 0.0 0.0 0.0 0.0 0.0 0.0Investments in other long term assets (0.2) 0.0 (3.5) 0.0 0.0 0.0 0.0 0.0CFI (12.1) 0.0 (14.3) 0.0 (29.6) (29.6) (29.6) (29.6)New loans interest bearing debts 34.4 0.0 228.7 (53.3) 10.4 100.4 5.5 1.0Repayment interest bearing debts (53.4) 0.0 (240.5) 0.0 0.0 0.0 0.0 0.0Change other long term liabilities 0.1 0.0 (0.2) 0.0 0.0 0.0 0.0 0.0Cancellation of preference shares 0.0 0.0 (3.4) 0.0 0.0 0.0 0.0 0.0Dividend paid-group share 0.0 0.0 (0.1) 0.0 0.0 (91.2) 0.0 0.0Dividend paid to minority interest 0.0 0.0 0.0 0.0 0.0 (7.9) 0.0 0.0Cash part forward transactions 7.8 0.0 7.8 0.0 0.0 0.0 0.0 0.0CFF (11.2) 0.0 (7.6) (53.3) 10.4 1.2 5.5 1.0Increase/decrease in cash 1.6 (12.5) 12.4 (28.6) 11.6 0.5 4.7 (1.1)Cash balance BOP 24.7 26.4 29.5 41.4 12.8 24.3 24.9 29.5Cash and bank balances EOP 26.4 13.9 41.8 12.8 24.3 24.9 29.5 28.4Source: Company data, ING estimates243
<strong>Benelux</strong> <strong>Real</strong> <strong>Estate</strong> February 2010This page is left blank intentionally244
<strong>Benelux</strong> <strong>Real</strong> <strong>Estate</strong> February 2010Appendices245
<strong>Benelux</strong> <strong>Real</strong> <strong>Estate</strong> February 2010This page is left blank intentionally246
_Appendix 1Fig 1 Buildings occupied by the Commission in Brussels247Source: ec.europa.eu<strong>Benelux</strong> <strong>Real</strong> <strong>Estate</strong> February 2010
_<strong>Benelux</strong> <strong>Real</strong> <strong>Estate</strong> February 2010Fig 2 Overview of the Cofinimmo portfolio in Belgium and the NetherlandsSource: Cofinimmo 2008 annual report248
_<strong>Benelux</strong> <strong>Real</strong> <strong>Estate</strong> February 2010Fig 3 Befimmo portfolio in BrusselsSource: Befimmo FY08/09 annual report249
_<strong>Benelux</strong> <strong>Real</strong> <strong>Estate</strong> February 2010Fig 4 Leasinvest <strong>Real</strong> <strong>Estate</strong> portfolio (Brussels part)Source: Company data250
_<strong>Benelux</strong> <strong>Real</strong> <strong>Estate</strong> February 2010Appendix 2Fig 5 GDP Forecasts (%YoY)4Q09 1Q10 2Q10 3Q10 2009F 2010F 2011FWorld (US$) -0.2 2.2 3.0 3.1 -2.5 3.3 3.4US -0.6 1.9 3.0 3.5 -2.6 3.0 2.8Japan -2.0 1.7 1.4 1.8 -5.4 1.8 2.1Germany -1.4 2.5 2.5 2.2 -4.7 2.2 1.9France -0.3 1.4 1.4 1.5 -2.2 1.5 2.0UK -2.8 0.4 1.5 1.9 -4.8 1.4 1.9Italy -2.4 0.5 1.2 1.0 -4.8 1.0 1.1Canada -1.5 1.1 3.0 4.3 -2.6 3.3 3.0Eurozone -3.0 -1.4 0.0 0.3 -3.9 1.7 2.0Spain -3.0 -1.4 0.0 0.3 -3.6 -0.1 1.4Netherlands -2.2 0.7 2.5 1.8 -3.9 1.6 2.0Belgium -0.9 1.3 1.9 1.7 -3.1 1.6 1.8Greece -1.5 -1.3 -1.1 -0.2 -1.2 -0.5 0.8Switzerland -0.7 0.5 1.1 1.2 -1.5 1.0 1.9Sweden 0.4 2.0 2.4 2.8 -4.3 2.5 2.9Norway 0.3 2.0 3.8 3.8 3.4 3.2 2.7Iceland -7.1 -2.0 -1.2 5.3 -5.6 0.8 2.5Bulgaria -5.7 -2.6 -1.1 1.3 -5.0 0.2 2.8Croatia -3.9 0.2 2.6 3.1 -5.6 2.3 2.9Czech Republic -2.8 2.6 2.4 1.8 -4.0 2.6 3.3Hungary -3.8 -0.5 -1.1 1.0 -6.4 0.5 3.1Kazakhstan * 2.2 3.5 3.8 - -0.4 2.6 4.7Poland 3.0 3.2 2.7 2.1 1.7 2.6 3.4Romania -4.4 -0.5 1.3 2.2 -6.5 1.6 0.9Russia * -1.1 4.1 4.7 - -8.4 3.3 4.5Slovakia -3.2 2.8 2.2 1.0 -4.8 1.8 3.5Turkey 1.7 6.8 3.7 2.9 -6.0 4.0 3.9Ukraine -4.4 4.4 2.9 1.6 -14.6 2.5 4.6Brazil 5.8 7.6 6.9 5.9 0.2 6.0 4.3Mexico -4.4 1.1 3.8 2.6 -7.2 2.8 3.1China 11.0 11.5 12.0 10.8 8.6 11.0 10.0Hong Kong 6.0 7.5 6.5 5.5 -2.0 6.2 5.8India 5.9 7.0 7.6 7.7 6.5 7.8 8.5Indonesia 5.8 5.8 6.2 6.0 4.7 6.1 6.3Korea 6.2 7.0 6.0 5.0 0.1 5.3 5.1Malaysia 3.2 6.0 4.5 3.5 -2.0 4.4 5.3Philippines 1.2 2.7 3.2 3.6 0.9 3.4 4.0Singapore 3.5 7.0 6.0 5.0 -1.9 5.8 6.5Taiwan 6.1 6.0 5.0 4.0 -3.5 4.8 5.5Thailand 2.2 5.0 4.5 4.0 -3.0 4.0 4.5* Russia & Kasakstan updated as of 11 December 2009Updated 08 January 2010Source: ING251
_<strong>Benelux</strong> <strong>Real</strong> <strong>Estate</strong> February 2010Fig 6 CPI Forecasts, pa (%YoY)4Q09 1Q10 2Q10 3Q10 2009F 2010F 2011FWorld 1.4 2.0 2.1 1.9 1.0 2.0 1.9US 1.5 2.8 3.0 2.6 -0.3 2.7 2.0Japan -2.0 -1.6 -1.3 -0.8 -1.3 -1.0 0.2Germany 0.4 1.1 1.3 1.5 0.3 1.4 1.7France 0.2 1.0 1.3 1.6 0.1 1.5 1.9UK 2.0 2.9 2.4 2.0 2.2 2.3 2.2Italy 0.7 1.5 1.4 1.7 0.8 1.6 1.7Canada 0.6 0.6 0.5 0.6 0.5 1.9 2.2Eurozone 0.5 1.2 1.4 1.4 0.3 1.4 1.8Spain 0.4 1.0 1.3 1.6 -0.3 1.4 1.6Netherlands 0.9 1.1 0.9 1.6 1.2 1.2 1.1Belgium -0.3 1.1 1.8 1.5 -0.1 1.5 2.0Greece 1.9 2.5 2.5 2.3 1.3 2.4 2.0Switzerland -0.2 0.7 1.7 1.0 -0.5 1.0 1.3Sweden -0.4 1.1 1.3 1.4 -0.3 1.4 1.8Norway 1.3 1.6 1.5 1.9 2.2 1.8 2.0Iceland 8.6 7.3 6.2 3.7 12.2 4.7 1.6Bulgaria 0.0 0.4 0.0 1.2 2.8 1.1 3.0Croatia 1.8 1.6 1.2 1.9 2.4 1.9 2.8Czech Republic 1.0 1.3 1.5 2.0 2.4 1.6 2.5Hungary 5.6 4.8 3.9 3.2 4.2 3.8 3.0Kazakhstan* 6.0 7.5 7.1 - 7.4 7.2 8.0Poland 3.4 2.9 1.8 1.6 3.5 2.1 2.1Romania 4.7 3.9 4.4 5.3 5.6 4.7 4.5Russia* 9.3 7.1 5.9 - 11.8 6.1 8.2Slovakia 0.3 0.0 0.3 0.6 1.0 0.2 2.1Turkey 6.5 7.7 8.6 8.8 6.3 7.9 6.2Ukraine¹ 12.3 11.8 12.9 12.7 16.0 12.6 11.7Brazil 4.3 4.5 4.3 4.5 4.3 4.5 4.5Mexico 4.0 4.5 4.4 4.6 5.3 4.7 4.6China 0.4 1.5 2.8 3.0 -0.8 2.5 2.5Hong Kong 1.8 1.7 2.3 2.8 0.6 2.0 2.3India 11.0 11.0 8.5 8.0 10.5 8.0 6.0Indonesia 2.6 5.2 6.1 6.7 4.8 5.9 5.9Korea 2.4 2.8 2.7 2.7 2.7 2.8 2.5Malaysia -0.1 1.6 2.2 2.3 0.6 2.0 2.3Philippines 3.0 4.6 5.1 5.6 3.3 4.8 4.2Singapore 0.0 1.0 2.3 2.1 0.3 1.8 2.0Taiwan -1.2 1.0 1.5 2.0 -0.9 1.5 1.8Thailand 1.3 2.4 3.0 2.5 -1.0 2.5 2.7¹ Quarterly forecasts are eop; yearly forecasts are average over the yearUpdated 8 January 2010Source: ING252
_<strong>Benelux</strong> <strong>Real</strong> <strong>Estate</strong> February 2010Fig 7 Policy Rate Forecasts (end period, %)1Q10F 2Q10F 3Q10F 4Q10F 2011F 2012FUS 0.00 0.00 0.75 1.75 3.25 4.50Euro rate 1.00 1.00 1.00 1.50 2.75 3.50Japan 0.10 0.10 0.10 0.10 0.50 0.50UK 0.50 0.50 1.00 1.50 3.00 3.75Switzerland 0.25 0.25 0.50 0.75 2.00 2.50Sweden 0.25 0.25 0.50 1.00 3.00 4.00Norway 2.00 2.50 3.00 3.25 4.00 4.50Iceland 9.00 8.00 6.50 6.00 5.50 5.00Canada 0.25 0.50 1.00 1.50 3.75 4.50Australia 4.00 4.50 5.00 5.50 6.00 6.00New Zealand 2.50 2.75 3.25 3.75 5.50 6.25Czech Republic 1.00 1.00 1.25 1.75 2.50 2.75Hungary 5.75 5.75 5.50 5.75 6.00 5.50Kazakhstan* 7.00 6.50 6.50 6.50 7.00 -Poland 3.50 3.50 3.50 3.50 4.50 5.00Romania 7.00 6.25 6.25 6.25 8.00 7.50Russia* 7.50 7.50 7.50 8.00 8.00 -Turkey 6.50 6.50 6.50 8.00 9.50 9.50Ukraine 10.25 9.75 9.50 9.50 7.00 6.50Brazil 8.75 8.75 9.25 10.25 10.25 9.50Mexico 4.50 4.50 6.00 6.50 7.75 8.50China 2.52 2.79 3.06 3.33 3.33 3.33India 5.00 5.50 6.00 6.50 7.50 8.00Indonesia 6.75 7.25 7.50 7.75 8.00 8.00Korea 2.50 3.25 3.75 4.00 4.50 4.50Malaysia 2.00 2.00 2.00 2.50 3.00 3.00Philippines 4.00 4.00 4.50 5.00 6.25 6.25Taiwan 1.25 1.25 1.50 1.75 2.25 2.50Thailand 1.25 1.25 1.50 1.75 2.50 2.50* Russia & Kasakstan updated as of 11 December 2009Source: ING253
_<strong>Benelux</strong> <strong>Real</strong> <strong>Estate</strong> February 2010Fig 8 3-month Interest Rate Forecasts (end period, %)1Q10F 2Q10F 3Q10F 4Q10F 2011F 2012FUS 0.40 0.55 1.05 2.05 3.40 4.70Euro rate 0.85 1.15 1.25 1.75 2.85 3.60Japan 0.30 0.30 0.30 0.30 0.70 0.75UK 0.70 0.80 1.30 1.80 3.30 4.00Switzerland 0.25 0.30 0.55 0.70 2.10 2.70Sweden 0.60 0.70 1.00 1.40 3.30 4.20Norway 2.50 2.90 3.40 3.50 4.30 4.80Canada 0.60 0.95 1.50 1.95 4.15 4.65Bulgaria 4.35 4.15 4.25 4.35 4.35 5.10Croatia 3.85 3.95 4.05 4.25 4.65 5.10Czech Republic 1.50 1.50 1.75 2.00 3.00 3.50Hungary 5.80 5.80 5.70 5.80 6.10 5.60Poland 4.08 4.13 4.08 4.10 4.82 5.15Romania 8.10 7.50 7.00 7.25 8.75 7.75Russia* 6.50 6.00 6.20 6.50 6.50 -Turkey 7.06 7.26 7.26 9.04 10.05 9.95Ukraine 22.00 19.00 17.00 17.00 15.00 12.50Brazil 9.24 9.74 10.24 10.25 10.25 9.50Mexico 4.53 4.53 6.05 6.55 7.83 8.59China* 1.40 1.60 1.80 2.00 2.80 2.80Hong Kong 0.25 0.40 0.70 1.10 2.30 2.30India 3.90 4.10 4.25 4.40 5.50 6.50Indonesia 7.25 7.50 7.75 8.00 8.50 8.50Korea* 2.90 3.50 3.90 4.25 4.50 4.50Malaysia 2.30 2.40 2.60 2.90 3.30 3.30Philippines* 4.40 4.40 4.60 4.80 5.00 5.00Singapore 0.65 0.80 1.00 1.50 2.00 2.00Taiwan* 0.50 0.60 1.00 1.25 2.00 2.20Thailand 1.40 1.60 1.80 2.00 2.30 2.50* Russia updated as of 11 December 2009* 3 month PBOC bill rate for China; CD rate for Korea, T-bill rate for the Philippines and CP rate for Taiwan; Interbankrates for the othersSource: ING254
_<strong>Benelux</strong> <strong>Real</strong> <strong>Estate</strong> February 2010Fig 9 10Y Bond Yield Forecasts (end period 10Y unless stated, %)1Q10F 2Q10F 3Q10F 4Q10F 2011F 2012FUS: Fed funds 0.00 0.00 0.75 1.75 3.25 4.503M 0.40 0.55 1.05 2.05 3.40 4.502Y 1.80 2.20 2.60 3.00 3.90 4.505Y 3.10 3.30 3.50 3.60 4.40 4.5010Y 4.20 4.50 4.70 4.50 4.50 4.5030Y 4.80 4.90 5.10 5.00 5.00 4.75EU12: ECB refi 1.00 1.00 1.00 1.50 3.25 3.503M 0.85 1.15 1.25 1.75 2.85 3.602Y 1.80 2.00 2.30 2.60 3.40 3.705Y 2.80 2.90 3.00 3.00 3.90 4.0010Y 3.60 3.70 3.80 3.90 4.10 4.3030Y 4.20 4.30 4.30 4.40 4.50 4.50Japan 1.40 1.40 1.40 1.70 2.00 2.00UK 4.40 4.70 4.60 4.60 5.00 5.00Canada 4.00 4.30 4.50 4.30 4.30 4.40Switzerland 2.10 2.20 2.30 2.50 3.20 3.70Sweden 3.70 4.00 4.40 4.60 4.90 4.90Norway 4.40 4.50 4.60 4.80 5.20 5.30Bulgaria 6.80 6.70 6.30 5.90 5.40 5.60Croatia 6.10 6.20 5.80 5.60 5.40 5.60Czech Republic 4.40 4.50 4.80 4.90 5.60 5.50Hungary 8.00 8.20 7.70 7.30 6.50 6.20Poland 5.88 5.71 5.96 5.88 6.05 5.72Romania (5Y) 8.75 8.00 7.80 8.00 8.50 7.00Russia * 8.00 7.50 7.80 8.00 8.00 -Slovakia 4.60 4.70 4.75 4.80 4.90 4.90Ukraine (5Y) 10.80 10.50 10.10 9.80 9.70 9.70Brazil 13.00 13.00 12.50 11.75 10.75 8.75Mexico 8.20 8.50 8.70 8.50 8.50 8.50China (5Y) 3.20 3.40 3.60 3.80 4.30 4.30Hong Kong 2.60 2.70 2.80 2.90 3.50 3.50India 8.20 8.40 8.50 8.60 9.00 8.5Indonesia (10Y) 10.25 10.50 10.50 10.25 10.00 10.00Korea (3Y) 4.80 5.00 5.25 5.50 5.50 5.50Malaysia (5Y) 3.80 3.90 4.00 4.20 4.50 4.50Philippines (5Y) 6.40 6.50 6.60 6.75 7.00 7.00Singapore 2.70 2.80 2.90 3.00 3.30 3.30Taiwan 1.55 1.70 1.80 2.00 2.30 2.50Thailand 4.50 4.60 4.70 4.80 4.80 5.00* Russia updated as of 11 December 2009Updated 8 January 2010Source: ING255
_<strong>Benelux</strong> <strong>Real</strong> <strong>Estate</strong> February 2010Fig 10 Foreign Exchange Forecasts (end period)1Q10F 2Q10F 3Q10F 4Q10F 2011F 2012FEuro EUR/USD 1.44 1.42 1.40 1.35 1.25 1.30Japan USD/JPY 95.0 100.0 105.0 110.0 120.0 115.0UK GBP/USD 1.57 1.58 1.61 1.59 1.56 1.63Japan EUR/JPY 136.8 142.0 147.0 148.5 150.0 149.5UK EUR/GBP 0.92 0.90 0.87 0.85 0.80 0.80Canada USD/CAD 1.00 1.02 1.04 1.05 1.10 1.15Australia AUD/USD 0.95 0.98 0.99 1.00 0.95 0.95New Zealand NZD/USD 0.76 0.77 0.76 0.75 0.70 0.72Switzerland EUR/CHF 1.46 1.45 1.45 1.45 1.50 1.55Sweden EUR/SEK 9.90 9.70 9.60 9.50 9.40 9.30Norway EUR/NOK 8.00 7.80 7.70 7.60 7.40 7.30Iceland EUR/ISK 220 200 180 160 150 140Bulgaria EUR/BGN 1.96 1.96 1.96 1.96 1.96 1.96Croatia EUR/HRK 7.27 7.15 7.10 7.20 7.15 7.15Czech Rep EUR/CZK 25.60 25.40 24.80 24.60 23.40 23.00Hungary EUR/HUF 280.0 285.0 275.0 268.0 260.0 260.00Poland EUR/PLN 3.85 4.00 4.20 3.90 3.60 3.60Romania EUR/RON 4.15 4.25 4.20 4.10 3.80 3.60Brazil USD/BRL 1.77 1.83 1.86 1.90 1.95 1.98Mexico USD/MXN 12.81 12.83 12.92 12.80 13.08 13.36Kazakhstan* USD/KZT 145 140 138 138 134 -Russia* USD/RUB 28.7 29.1 30.1 31.5 34.60 -Turkey USD/TRY 1.48 1.44 1.50 1.55 1.55 1.55Ukraine USD/UAH 8.50 8.90 8.85 8.84 8.66 8.57China USD/CNY 6.820 6.810 6.716 6.622 6.490 6.490Hong Kong USD/HKD 7.751 7.751 7.751 7.751 7.751 7.751India USD/INR 45.00 44.00 43.50 43.00 41.00 40.00Indonesia USD/IDR 9300 9300 9300 9300 9200 9000Korea USD/KRW 1150 1150 1125 1100 1050 1000Malaysia USD/MYR 3.417 3.442 3.435 3.427 3.397 3.397Philippines USD/PHP 48.00 46.70 48.00 45.50 45.00 43.50Singapore USD/SGD 1.400 1.411 1.408 1.405 1.392 1.392Taiwan USD/TWD 32.40 32.50 32.60 32.70 32.70 32.70Thailand USD/THB 33.10 33.00 32.75 32.50 32.50 32.50* Russia & Kasakstan updated as of 11 December 2009Updated 8 January 2010Source: ING256
_.<strong>Benelux</strong> <strong>Real</strong> <strong>Estate</strong> February 2010Disclosures AppendixANALYST CERTIFICATIONThe analyst(s) who prepared this report hereby certifies that the views expressed in this report accurately reflecthis/her personal views about the subject securities or issuers and no part of his/her compensation was, is, or will bedirectly or indirectly related to the inclusion of specific recommendations or views in this report.IMPORTANT DISCLOSURESCompany disclosures and ratings charts are available from the disclosures page on our website athttp://research.ing.com or write to The Compliance Department, ING Financial Markets LLC, 1325 Avenue ofthe Americas, New York, USA, 10019.Valuation and risks: For details of the valuation methodologies used to determine our price targets and risks relatedto the achievement of these targets refer to the main body of this report and/or the most recent company reportavailable at http://research.ing.com.The remuneration of research analysts is not tied to specific investment banking transactions performed by INGGroup although it is based in part on overall revenues, to which investment banking contribute.Securities prices: Prices are taken as of the previous day’s close on the home market unless otherwise stated.Job titles. The functional job title of the person/s responsible for the recommendations contained in this report isequity research analyst unless otherwise stated. Corporate titles may differ from functional job titles.Conflicts of interest policy. ING manages conflicts of interest arising as a result of the preparation and publication ofresearch through its use of internal databases, notifications by the relevant employees and Chinese walls asmonitored by ING Compliance. For further details see our research policies page at http://research.ing.com.FOREIGN AFFILIATES DISCLOSURESEach ING legal entity which produces research is a subsidiary, branch or affiliate of ING Bank N.V. See back pagefor the addresses and primary securities regulator for each of these entities.RATING DISTRIBUTION (as of end 4Q09)Equity coverageInvestment Banking clients*Buy 45% 53%Hold 42% 41%Sell 13% 40%100%* Percentage of companies in each rating category that are Investment Bankingclients of ING Financial Markets LLC or an affiliate.RATING DEFINITIONSBuy: Forecast 12-mth absolute total return greater than +15%Hold: Forecast 12-mth absolute total return of +15% to -5%Sell: Forecast 12-mth absolute total return less than -5%Total return: forecast share price appreciation to target price plus forecast annualdividend. Price volatility and our preference for not changing recommendations toofrequently means forecast returns may fall outside of the above ranges at times.257
AMStERDAM BRuSSELS LONDON NEW yORK SiNGAPORETel: 31 20 563 8417 Tel: 32 2 547 7534 Tel: 44 20 7767 1000 Tel: 1 646 424 6000 Tel: 65 6535 3688BratislavaTel: 421 2 5934 6111BucharestTel: 40 21 222 1600BudapestTel: 36 1 235 8800Buenos AiresTel: 54 11 4310 4700DublinTel: 353 1 638 4000GenevaTel: 41 22 593 8050Hong KongTel: 852 2848 8488IstanbulTel: 90 212 367 7011KievTel: 380 44 230 3030MadridTel: 34 91 789 8880ManilaTel: 63 2 479 8888Mexico CityTel: 52 55 5258 2199MilanTel: 39 02 89629 3610MoscowTel: 7 495 755 5400ParisTel: 33 1 56 39 32 84PragueTel: 420 257 473 111SantiagoTel: 56 2 659 2700Sao PauloTel: 55 11 4504 6000SeoulTel: 82 2 317 1800ShanghaiTel: 86 21 6841 3355SofiaTel: 359 2 917 6400TaipeiTel: 886 2 2734 7600TokyoTel: 81 3 5210 0100WarsawTel: 48 22 820 5018Research offices: legal entity/address/primary securities regulatorAmsterdamBratislavaBrusselsBucharestBudapestHong KongIstanbulKievLondonManilaMexico CityMilanMoscowMumbaiNew YorkPragueSao PauloSingaporeSofiaWarsawING Bank N.V., Foppingadreef 7, Amsterdam, Netherlands, 1102BD. Netherlands Authority for the Financial MarketsING Bank N.V., pobocka zahranicnej banky, Jesenskeho 4/C, 811 02 Bratislava, Slovak Republic. National Bank of SlovakiaING Belgium S.A./N.V., Avenue Marnix 24, Brussels, Belgium, B-1000. Banking Finance and Insurance CommissionING Bank N.V. Bucharest Branch, 11-13 Kiseleff Avenue, PO Box 2-208, 011342, Bucharest 1, RomaniaRomanian National Securities and Exchange CommissionING Bank N.V. Hungary Branch, Dozsa Gyorgy ut 84\B, H - 1068 Budapest, Hungary. Hungarian Financial Supervisory AuthorityING Bank N.V. Hong Kong Branch, 39/F, One International Finance Centre, Central Hong Kong. Hong Kong Monetary AuthorityING Bank N.V. Istanbul Representative Office, Eski Buyukdere Caddesi Guney Plaza No: 17 / A Kat: 3 Maslak, Istanbul, Turkey,34398. Capital Markets BoardING Bank Ukraine JSC, 30-a, Spaska Street, Kiev, Ukraine, 04070 Ukrainian Securities and Stock CommissionING Bank N.V. London Branch, 60 London Wall, London EC2M 5TQ, United Kingdom. Authorised by the Dutch Central BankING Bank N.V. Manila Branch, 21/F Tower I, Ayala Avenue, 1226 Makati City, Philippines. Philippine Securities and Exchange CommissionING Bank (Mexico) SA, Bosques de Alisos 45-B, Piso 4, Bosques de Las Lomas, 05120, Mexico City, Mexico. Comisión NacionalBancaria y de ValoresING Bank N.V. Milano, Via Paleocapa, 5, Milano, Italy, 20121. Commissione Nazionale per le Società e la BorsaING Bank (Eurasia) ZAO, 36, Krasnoproletarskaya ulitsa, 127473 Moscow, Russia. Federal Financial Markets ServiceING Vysya Bank Limited, A Wing, Shivsagar <strong>Estate</strong>, 2nd Floor, South Wing, Dr. Annie Besant Road, Worli, Mumbai, 400 018. IndiaSecurities and Exchange Board of IndiaING Financial Markets LLC, 1325 Avenue of the Americas, New York, United States, 10019. Securities and Exchange CommissionING Bank N.V. Prague Branch, Nadrazni 25, 150 00 Prague 5, Czech Republic. Czech National BankING Bank N.V. Sao Paulo, Ave. Presidente Juscelino Kubistchek, 2nd floor, Sao Paulo, Brazil 04543-000. Securities and ExchangeCommission of BrazilING Bank N.V. Singapore Branch, 19/F Republic Plaza, 9 Raffles Place, #19-02, Singapore, 048619. Monetary Authority of SingaporeING Bank N.V. Sofia Branch, 49B Bulgaria Blvd, Sofia 1404 Bulgaria. Financial Supervision CommissionING Securities S.A., Plac Trzech Krzyzy, 10/14, Warsaw, Poland, 00-499. Polish Financial Supervision AuthorityDisclaimerThis report has been prepared on behalf of ING (being for this purpose the wholesale and investment banking business of ING Bank NV and certain of itssubsidiary companies) solely for the information of its clients. ING forms part of ING Group (being for this purpose ING Groep NV and its subsidiary andaffiliated companies). It is not investment advice or an offer or solicitation for the purchase or sale of any financial instrument. While reasonable care has beentaken to ensure that the information contained herein is not untrue or misleading at the time of publication, ING makes no representation that it is accurate orcomplete. The information contained herein is subject to change without notice. ING Group and any of its officers, employees, related and discretionaryaccounts may, to the extent not disclosed above and to the extent permitted by law, have long or short positions or may otherwise be interested in anytransactions or investments (including derivatives) referred to in this report. In addition, ING Group may provide banking, insurance or asset managementservices for, or solicit such business from, any company referred to in this report. Neither ING Group nor any of its officers or employees accepts any liability forany direct or consequential loss arising from any use of this report or its contents. Copyright and database rights protection exists in this report and it may notbe reproduced, distributed or published by any person for any purpose without the prior express consent of ING. All rights are reserved. Any investmentsreferred to herein may involve significant risk, are not necessarily available in all jurisdictions, may be illiquid and may not be suitable for all investors. The valueof, or income from, any investments referred to herein may fluctuate and/or be affected by changes in exchange rates. Past performance is not indicative offuture results. Investors should make their own investigations and investment decisions without relying on this report. Only investors with sufficient knowledgeand experience in financial matters to evaluate the merits and risks should consider an investment in any issuer or market discussed herein and other personsshould not take any action on the basis of this report. This report is issued: 1) in the United Kingdom only to persons described in Articles 19, 47 and 49 of theFinancial Services and Markets Act 2000 (Financial Promotion) Order 2005 and is not intended to be distributed, directly or indirectly, to any other class ofpersons (including private investors); 2) in Italy only to persons described in Article No. 31 of Consob Regulation No. 11522/98. Clients should contact analystsat, and execute transactions through, an ING entity in their home jurisdiction unless governing law permits otherwise. ING Bank N.V. London Branch isauthorised by the Dutch Central Bank. It is incorporated in the Netherlands and its London Branch is registered in the UK (number BR000341) at 60 LondonWall, London EC2M 5TQ. ING Financial Markets LLC, which is a member of the NYSE, FINRA and SIPC and part of ING, has accepted responsibility for thedistribution of this report in the United States under applicable requirements. ING Vysya Bank Ltd is responsible for the distribution of this report in India.EQAdditional information is available on request