Timing of clade divergence and discordant estimates of genetic and ...
Timing of clade divergence and discordant estimates of genetic and ...
Timing of clade divergence and discordant estimates of genetic and ...

You also want an ePaper? Increase the reach of your titles
YUMPU automatically turns print PDFs into web optimized ePapers that Google loves.
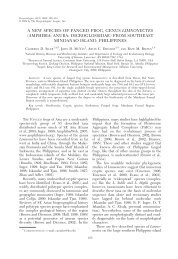
R.E. Blanton et al. / Molecular Phylo<strong>genetic</strong>s <strong>and</strong> Evolution xxx (2012) xxx–xxx 3Fig. 1. Localities examined for all gene-based analyses <strong>of</strong> Noturus exilis. Localities examined for the morphological data comparisons are provided in Section 5.2.2.1. Genetic variationPairwise sequence <strong>divergence</strong>s <strong>and</strong> average pairwise <strong>divergence</strong>swithin <strong>and</strong> between recovered <strong>clade</strong>s were generated usingMega v. 4 (Tamura et al., 2007) for both markers to examine patterns<strong>of</strong> sequence variation. Base compositional analysis was conductedto determine the average frequency <strong>of</strong> bases in both datasets using PAUP 4.0b10 (Sw<strong>of</strong>ford, 2003).2.2.2. Gene tree reconstructionIndependent phylo<strong>genetic</strong> hypotheses were generated for eachdataset using the maximum parsimony criterion implemented inPAUP 4.0b10 (Sw<strong>of</strong>ford, 2003). The most parsimonious trees werefound using the heuristic search option <strong>and</strong> 100 r<strong>and</strong>om additionsequence replicates with the tree-bisection-reconnection option<strong>of</strong> branch-swapping <strong>and</strong> save multiple trees, branches <strong>of</strong> lengthzero collapsed, <strong>and</strong> retention <strong>of</strong> minimal length trees options. Nodesupport was assessed using non-parametric bootstrap re-samplingprocedure with 1000 pseudoreplicates.Bayesian maximum likelihood analyses (BML) were used togenerate phylo<strong>genetic</strong> hypotheses for each dataset independently<strong>and</strong> for a concatenated data set that included both the Cyt b <strong>and</strong>RAG2 genes. In all BML analyses, each gene was partitioned bycodon position. The optimal model <strong>of</strong> sequence evolution foreach data partition was determined from 56 progressivelycomplex models tested in Modeltest v.3.7 (Posada <strong>and</strong> Cr<strong>and</strong>all,1998). The selected model under the Akaike InformationCriterion (AIC) <strong>and</strong> its parameters were implemented in therespective BML analyses in Mr. Bayes 3.1.1 (Ronquist <strong>and</strong> Huelsenbeck,2003) using the LSET <strong>and</strong> APPLYTO comm<strong>and</strong>s. Modelparameter values were estimated for each partition independentlyusing the ULINK comm<strong>and</strong>. Four Markov chains with defaultpriors were used in all analyses <strong>and</strong> r<strong>and</strong>om trees wereused to start each chain. Runs consisted <strong>of</strong> 5 million generations<strong>of</strong> Markov Chain Monte Carlo (MCMC) simulations. Four replicateruns were conducted to ensure the MCMC went through asufficient number <strong>of</strong> iterations to allow convergence in the estimations<strong>of</strong> tree topology with the best maximum likelihood posteriorprobability. The burn-in <strong>of</strong> the MCMC analysis wasdetermined by graphically examining the ML scores at each <strong>of</strong>the sampled generations to find where values converged. Alltrees recorded prior to the burn-in were discarded. The posteriorprobability or frequency at which a <strong>clade</strong> occurred in theremaining trees was used as an indication <strong>of</strong> node support. Inall analyses, N. gyrinus (Cyt b GenBank No.: AY327295; RAG2GenBank No.: AY327090), N. flavus (Cyt b: AY327287; RAG2:AY327086), <strong>and</strong> N. insignis (Cyt b: AY327301; RAG2:AYDQ492400) were used as outgroups. In the Cyt b dataset, N.albater (AY327268), N. baileyi (AY327273), N. eleutherus(AY327278), N. hildebr<strong>and</strong>i (AY327298), N. miurus (AY327307),<strong>and</strong> N. stigmosus (AY327319) also were used as outgroups; <strong>and</strong>N. lachneri (AY327090) <strong>and</strong> N. leptocanthus (AY327094) also wereused as outgroups in the RAG2 analysis.Please cite this article in press as: Blanton, R.E., et al. <strong>Timing</strong> <strong>of</strong> <strong>clade</strong> <strong>divergence</strong> <strong>and</strong> <strong>discordant</strong> <strong>estimates</strong> <strong>of</strong> <strong>genetic</strong> <strong>and</strong> morphological diversity in theSlender Madtom, Noturus exilis (Ictaluridae). Mol. Phylogenet. Evol. (2012), http://dx.doi.org/10.1016/j.ympev.2012.10.022
R.E. Blanton et al. / Molecular Phylo<strong>genetic</strong>s <strong>and</strong> Evolution xxx (2012) xxx–xxx 5<strong>and</strong> Rambaut 2007). Three fossil-determined minimum bound lognormalage <strong>estimates</strong> that represented prior distributions, <strong>and</strong> thebest-fit models <strong>of</strong> sequence evolution for the two-gene data setwere used to estimate the posterior probability density <strong>of</strong> <strong>divergence</strong>times.A separate alignment <strong>of</strong> the Cyt b + RAG2 sequences that includedthe same N. exilis, N. gyrinus, N. flavus, <strong>and</strong> N. insignis sequencesas in the combined phylo<strong>genetic</strong> analysis describedpreviously, plus two species <strong>of</strong> Ameiurus (A. brunniens; A. catus),two species <strong>of</strong> Ictalurus (I. furcatus; I. punctatus), <strong>and</strong> Cranoglanisbouderius (Cyt b: AF16879; RAG2: DQ492401), was generated. Cranoglanisis member <strong>of</strong> the family Cranoglanididae, which is sister tocatfishes <strong>of</strong> the family Ictaluridae (Sullivan et al., 2006; Lundberget al., 2007), to which Noturus, Ameiurus, <strong>and</strong> Ictalurus belong. Thisalignment was subjected to an independent BML analysis using thesame parameters as described previously for the two-gene analysis<strong>of</strong> the more limited data set to estimate a tree that included taxaencompassing selected fossils for estimating <strong>divergence</strong> times <strong>of</strong>Noturus exilis <strong>clade</strong>s <strong>and</strong> to serve as a target tree in the BEAST v.1.6.1 analyses.Node age constraints were set using lognormal priors with minimumage bounds determined from a subset <strong>of</strong> dated catfish fossilspreviously used by Lundberg (2007) to estimate lacantuniid catfish<strong>divergence</strong> <strong>and</strong> by Hardman <strong>and</strong> Hardman (2008) to estimateAmeiurus (Bullhead Catfish) diversification rates, <strong>and</strong> two Noturusfossils (Lundberg, 1975) not used in previous studies. The minimumage (Ma) <strong>estimates</strong> for fossils used as calibration points were:(1) Astephus sp., 65 mya (lognormal prior mean <strong>and</strong> st<strong>and</strong>ard deviation<strong>of</strong> 1.1 <strong>and</strong> root prior <strong>of</strong>fset <strong>of</strong> 65); (2) Ictalurus, 19 mya (lognormalprior mean <strong>and</strong> st<strong>and</strong>ard deviation <strong>of</strong> 1.0 <strong>and</strong> <strong>of</strong>fset value<strong>of</strong> 19) <strong>and</strong> (3) Noturus sp./N. furiosus, 2.6 mya (lognormal priormean <strong>and</strong> st<strong>and</strong>ard deviation <strong>of</strong> 1.0 <strong>and</strong> <strong>of</strong>fset 2.6). Astephus sp. isthe oldest known ictalurid fossil (63–65 Ma; Lundberg, 1975) <strong>and</strong>was applied to the node representing the <strong>divergence</strong> <strong>of</strong> Ictaluridaefollowing Hardman <strong>and</strong> Hardman (2008; Fig. 5, node 1). The Ictalurusfossil date (19 Ma; Lundberg 1975, 1992) was applied to thenode representing the Ictalurus <strong>clade</strong>, also following Hardman<strong>and</strong> Hardman (2008; Fig. 5 node 2). The application <strong>of</strong> these fossils<strong>and</strong> their corresponding dates as minimum age <strong>estimates</strong> for thedescribed nodes have been shown to be good predictors <strong>of</strong> catfish<strong>divergence</strong> times (Lundberg et al., 2007; Hardman <strong>and</strong> Hardman,2008). The third calibration point is based on two fossils <strong>of</strong> Noturusdescribed from the Pliocene (Fig. 5, node 3; Lundberg et al., 2007).The use <strong>of</strong> 2.6 my as a minimum age estimate for the genus Noturuswas supported by <strong>estimates</strong> <strong>of</strong> Pliocene <strong>divergence</strong> times for otherspecies <strong>of</strong> Noturus (Egge <strong>and</strong> Simons, 2006). Other fossils wereavailable, but could not be placed phylo<strong>genetic</strong>ally given the estimatedphylogeny.The birth–death process speciation prior was used to estimatebranching rates <strong>and</strong> a total <strong>of</strong> four independent runs <strong>of</strong> 60 milliongenerations each were conducted in BEAST v. 1.6.1. Resulting logfiles were viewed in Tracer v. 1.4 (Drummond <strong>and</strong> Rambaut,2007) to examine marginal probabilities <strong>of</strong> each run to ensureconvergence <strong>of</strong> parameter values <strong>and</strong> estimated node ages <strong>and</strong>to ensure effective sample sizes (>1000). Samples recorded priorto stationarity were discarded as burn-in. LogCombiner v. 1.4.6was used to combine the resulting tree <strong>and</strong> log files <strong>of</strong> each run.TreeAnnotater v. 1.4.6 (Drummond <strong>and</strong> Rambaut, 2007) was usedto summarize the posterior probability density <strong>of</strong> the combinedtree <strong>and</strong> log files. FigTree v. 1.1 (Drummond <strong>and</strong> Rambaut,2007) was used to visualize the mean <strong>and</strong> 95% highest posteriorprobability density <strong>estimates</strong> <strong>of</strong> <strong>divergence</strong> times for Noturus exilis<strong>clade</strong>s. A separate BEAST analysis was conducted without alignmentdata, using the same parameters as previously described,to determine the effect <strong>of</strong> the calibration priors on <strong>divergence</strong>time <strong>estimates</strong>.2.4. Morphological variationExamination <strong>of</strong> morphological variation focused on the samegeographic regions <strong>and</strong> river systems as that examined for <strong>genetic</strong>variation; however, several populations for which tissues for <strong>genetic</strong>data were unavailable were included in the morphologicalcomparisons. These included extirpated populations from theGreen River (Ohio River) system <strong>and</strong> Kentucky River system (OhioRiver) <strong>and</strong> a possibly extirpated population from the Licking River(Ohio R.) <strong>of</strong> Kentucky. A list <strong>of</strong> the populations examined for morphologyis provided in Section 5.2.4.1. MorphometricsMeasurements were taken on 281 specimens from 58 localitiesdistributed across the range <strong>of</strong> the species. Variation in body shapewas assessed using a truss network (Bookstein et al. 1985) <strong>of</strong>16interl<strong>and</strong>mark distances <strong>and</strong> an additional 16 st<strong>and</strong>ard measurementsincluding: (1) dorsal-fin base length, (2) dorsal-fin insertionto adipose-fin insertion, (3) adipose-fin insertion to anal-fin insertion,(4) anal-fin base length, (5) anal-fin origin to pelvic-fin origin,(6) pelvic-fin origin to pectoral-fin origin, (7) dorsal-fin insertion topectoral-fin origin, (8) dorsal-fin insertion to pelvic-fin origin, (9)dorsal-fin insertion to anal-fin origin, (10) body depth at the posterioreye margin, (11) body width at the posterior eye margin(12)body depth at dorsal-fin origin, (13) body width at dorsal-fin origin,(14) body width at pectoral-fin origin, (15) body width atanal-fin insertion, (16) snout to posterior eye margin, (17) snoutto dorsal-fin insertion, (18) snout to adipose-fin insertion, (19)snout to anal-fin origin, (20) snout to pelvic-fin origin, (21) snoutto pectoral-fin origin, (22) inter-orbital distance, (23) head length,(24) dorsal-fin spine length, (25) pectoral-fin spine length, (26)predorsal length, (27) adipose-fin base length, (28) dorsal-finheight, measured from dorsal-fin origin to end <strong>of</strong> longest ray,(29) anal-fin height, measured from anal-fin origin to end <strong>of</strong> longestray (30) pectoral-fin height, measured from pectoral-fin originto end <strong>of</strong> longest ray (31) caudal-fin height, measured along medialray, <strong>and</strong> (32) st<strong>and</strong>ard length (SL). Measurements were made onthe left side <strong>of</strong> the body on specimens >35 mm SL. Unless notedotherwise, methods followed those described by Hubbs <strong>and</strong> Lagler(1958) or Taylor (1969).Measurements were analyzed using a multivariate PrincipalComponents Analysis (SYSTAT v.8.0) <strong>of</strong> log-transformed data. Thefirst principal component recovered was considered to be a sizecomponent <strong>and</strong> was not used in population comparisons. Variableswith high component loadings were considered potentially informativetaxonomically <strong>and</strong> to have contributed most to any separationamong taxa or populations in the PCA scatterplots.To further identify potentially diagnostic characters, ranges <strong>of</strong>measurements st<strong>and</strong>ardized by st<strong>and</strong>ard length were alsocompared to identify populations with non-overlapping or marginally-overlappingranges. Measurements are presented as thous<strong>and</strong>ths<strong>of</strong> SL.2.4.2. PigmentationCharacteristics were described from 164 specimens <strong>and</strong> 34localities from across the range <strong>of</strong> the species. The width or depth<strong>of</strong> the distal black b<strong>and</strong> was measured for caudal, anal <strong>and</strong> dorsalfins; measurements were made at the middle <strong>of</strong> the fin, <strong>and</strong> valueswere st<strong>and</strong>ardized for comparison by dividing the width or depth<strong>of</strong> the b<strong>and</strong> by the respective fin height or length. Notes were madeon the distribution <strong>of</strong> black coloration in the fin (e.g., covering allrays, all rays except two, etc.). In the caudal fins <strong>of</strong> some individuals,the fin was black or dusky throughout <strong>and</strong> the exact width <strong>of</strong>the distal black b<strong>and</strong> could not be determined. In such cases, finswere noted as ‘overall dusky’.Please cite this article in press as: Blanton, R.E., et al. <strong>Timing</strong> <strong>of</strong> <strong>clade</strong> <strong>divergence</strong> <strong>and</strong> <strong>discordant</strong> <strong>estimates</strong> <strong>of</strong> <strong>genetic</strong> <strong>and</strong> morphological diversity in theSlender Madtom, Noturus exilis (Ictaluridae). Mol. Phylogenet. Evol. (2012), http://dx.doi.org/10.1016/j.ympev.2012.10.022
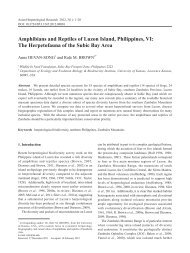
R.E. Blanton et al. / Molecular Phylo<strong>genetic</strong>s <strong>and</strong> Evolution xxx (2012) xxx–xxx 9Fig. 4. An 85% majority rule consensus phylogram <strong>of</strong> the post burn-in trees resulting from the Bayesian analysis <strong>of</strong> the Cytochrome b <strong>and</strong> RAG2 genes. Numbers on branchesreflect posterior probabilities. Site numbers used in Fig. 1 <strong>and</strong> Table 1 identify members <strong>of</strong> each <strong>clade</strong>, followed by the number <strong>of</strong> sequences from each site recovered withinthat <strong>clade</strong> (if more than one).Cytochrome b. With this notable exception, the general observation<strong>of</strong> conserved morphology among closely related species <strong>of</strong>madtom catfishes <strong>and</strong> the low levels observed among <strong>genetic</strong>allydivergent <strong>clade</strong>s <strong>of</strong> N. exilis (Taylor, 1969; Egge <strong>and</strong> Simons,2006, 2009) indicate that morphology alone may commonly under-estimatediversity for this group <strong>of</strong> fishes.Given the estimated early Miocene to late Oligocene age <strong>of</strong> thegenus, the low-levels <strong>of</strong> morphological <strong>divergence</strong> in madtom catfishesis interesting considering the degree <strong>of</strong> morphological variationobserved for other similarly-aged groups <strong>of</strong> small-bodied,benthic, Central Highl<strong>and</strong>s stream fishes such as darters (Percidae).The relatively low levels <strong>of</strong> morphological <strong>divergence</strong> observed inmadtom catfishes may be due, at least in part, to reduced levels<strong>of</strong> selection acting on morphological features. For example, dartersrely on external morphological features such as color <strong>and</strong> fin shapefor mate identification, selection, <strong>and</strong> antagonistic displays for nestsites. Thus, considerable variation in external morphology,particularly in color <strong>and</strong> pigmentation pattern, is observed amongclosely related species as a result <strong>of</strong> sexual selection (Page, 1983).Catfishes, however, rely less on visual cues, using other senses suchas smell <strong>and</strong> taste to interact with the biotic <strong>and</strong> abiotic environment<strong>and</strong> are primarily nocturnal (Lundberg, 1970).4.2. <strong>Timing</strong> <strong>of</strong> <strong>clade</strong> diversificationThe Central Highl<strong>and</strong>s Vicariance Hypothesis (Mayden, 1988)predicts a widespread diverse pre-Pleistocene fish fauna <strong>and</strong>numerous studies have observed patterns <strong>of</strong> diversity <strong>and</strong> <strong>clade</strong>age <strong>estimates</strong> that are consistent with this hypothesis (e.g., Berendzenet al., 2008; Hollingsworth <strong>and</strong> Near, 2009; Keck <strong>and</strong> Near,2010). Based on fossil evidence the genus Noturus arose prior to thePleistocene (Lundberg, 1975), a result also supported herein by thelate Oligocene age estimate for the MRCA <strong>of</strong> the genus. Noturus exiliswas estimated to have originated in the Miocene, indicating thatPlease cite this article in press as: Blanton, R.E., et al. <strong>Timing</strong> <strong>of</strong> <strong>clade</strong> <strong>divergence</strong> <strong>and</strong> <strong>discordant</strong> <strong>estimates</strong> <strong>of</strong> <strong>genetic</strong> <strong>and</strong> morphological diversity in theSlender Madtom, Noturus exilis (Ictaluridae). Mol. Phylogenet. Evol. (2012), http://dx.doi.org/10.1016/j.ympev.2012.10.022
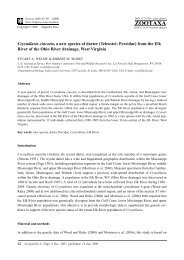
10 R.E. Blanton et al. / Molecular Phylo<strong>genetic</strong>s <strong>and</strong> Evolution xxx (2012) xxx–xxxFig. 5. Maxiumum credibility chronogram for catfish species estimated from the combined independent BEAST analyses using the mitochondrial cytochrome b <strong>and</strong> nuclearRAG2 genes. Bars show uncertainty in the estimated <strong>divergence</strong> with the length representing the 95% highest posterior density (HDP) <strong>of</strong> node ages. Numbers on nodeshighlight the phylo<strong>genetic</strong> placement <strong>of</strong> fossil calibrations described in the methods: (1) Astephus, 65 Ma; (2) Ictalurus, 19 Ma; <strong>and</strong> (3) Noturus, 2.6 Ma. Italicized numbers atnodes are mean node age <strong>estimates</strong>. Posterior probability <strong>and</strong> bootstrap support values for nodes are given in Figs. 2–4.Please cite this article in press as: Blanton, R.E., et al. <strong>Timing</strong> <strong>of</strong> <strong>clade</strong> <strong>divergence</strong> <strong>and</strong> <strong>discordant</strong> <strong>estimates</strong> <strong>of</strong> <strong>genetic</strong> <strong>and</strong> morphological diversity in theSlender Madtom, Noturus exilis (Ictaluridae). Mol. Phylogenet. Evol. (2012), http://dx.doi.org/10.1016/j.ympev.2012.10.022
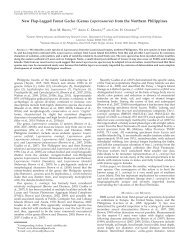
R.E. Blanton et al. / Molecular Phylo<strong>genetic</strong>s <strong>and</strong> Evolution xxx (2012) xxx–xxx 11Table 3Average between <strong>clade</strong> <strong>and</strong> within <strong>clade</strong> RAG2 sequence <strong>divergence</strong>s. Cladescorrespond to those recovered in Figs. 2 <strong>and</strong> 4.Average between <strong>clade</strong> <strong>divergence</strong>sClade A (%) Clade B (%) Clade CClade A 0.00Clade B 0.17 0.09Clade C 0.23 0.16 0.16Average within <strong>clade</strong><strong>divergence</strong> (%)Table 4Divergence times <strong>of</strong> Noturus exilis reported as posterior mean ages in millions <strong>of</strong> years(mya). Ages estimated using the uncorrelated lognormal relaxed clock method.Credibility intervals for age <strong>estimates</strong> are given as 95% highest posterior density(HPD). Nodes (A–D) correspond to those in Fig. 6.Node Posterior mean age (mya) 95% HPDA 0.36 0.05, 1.00B 3.68 1.78, 6.13C 5.47 3.16, 8.73D 9.67 5.32, 14.93Fig. 6. Maxiumum credibility chronogram for Noturus exilis estimated from thecombined independent BEAST analyses using the mitochondrial cytochrome b <strong>and</strong>nuclear RAG2 genes. Italicized numbers at nodes are mean node ages. Bars showuncertainty in the estimated <strong>divergence</strong> with the length representing the 95%highest posterior density (HDP) <strong>of</strong> node ages. Age <strong>estimates</strong> <strong>and</strong> the 95% HPD forfocal nodes (A–D) are provided in Table 4. In the Neogene geologic time scale shown’Ps’ = Pleistocene, ’Pl’ = Pliocene, <strong>and</strong> ’Mi’ = Miocene (in part). Posterior probability<strong>and</strong> bootstrap support values for nodes are given in Figs. 2–4.both the genus <strong>and</strong> species lineages were part <strong>of</strong> the diverse pre-Pleistocene fish fauna, lending further support to Mayden’s(1988) Central Highl<strong>and</strong>s Vicariance Hypothesis.Diversification within Noturus exilis occurred more recently,spanning the pre-Pleistocene–Pleistocene boundary. Hardy et al.(2002) argued the degree <strong>of</strong> <strong>genetic</strong> structure <strong>and</strong> <strong>divergence</strong> withinNoturus exilis arose before or very early in the Pleistocene. Usingthe poikilotherm mt DNA clock they estimated that N. exilis <strong>clade</strong>sdiverged 0.77–7.6 mya. Using multiple catfish fossils to calibraterates <strong>of</strong> molecular <strong>divergence</strong>, we find on average younger age <strong>estimates</strong>for <strong>clade</strong>s <strong>of</strong> N. exilis, which had mean ages <strong>of</strong> 0.36–5.47. Theestimated age <strong>of</strong> Clade A, from the mid-Pleistocene is consistentwith recent diversification within the Central Highl<strong>and</strong>s associatedwith events <strong>of</strong> the Pleistocene glacial cycles (Hocutt et al., 1986).Contradictory to predictions <strong>of</strong> the CHVH, Hocutt et al. (1986)hypothesized that the Pleistocene glacial cycles were the primarygenerator <strong>of</strong> the diversity <strong>and</strong> distribution <strong>of</strong> fishes in the CentralHighl<strong>and</strong>s region <strong>and</strong> that this diversity was relatively young.Diversification <strong>of</strong> the two other <strong>clade</strong>s (B <strong>and</strong> C) <strong>of</strong> N. exilis, however,occurred prior to the Pleistocene (Pliocene <strong>and</strong> Miocene),demonstrating that both ancient <strong>and</strong> recent events have playedprominent roles in the evolutionary history <strong>of</strong> the species.Divergence <strong>of</strong> the <strong>clade</strong>-rich <strong>and</strong> widespread Clade C (5.47 mya,95% HPD: 3.16, 8.73; Fig. 6) corresponds to a drastic drop in sea-leveloccurring at the Miocene–Pliocene boundary. Near et al. (2003)found a period <strong>of</strong> rapid diversification in Micropterus <strong>and</strong> Nagle <strong>and</strong>Simons (2012) observed <strong>divergence</strong> among the eastern <strong>and</strong> western<strong>clade</strong>s <strong>of</strong> Nocomis (Cyprinidae) associated with this drop insea-level. The congruent timing <strong>of</strong> diversification among these distantlyrelated groups <strong>of</strong> fishes indicates that common geologicalevents or climate shifts likely influenced their diversification.Although, the estimated diversification time <strong>of</strong> genus Noturus(Miocene to late Oligocene) is younger than the estimate recoveredby Hardman <strong>and</strong> Hardman (2008; late Eocene–early Oligocene), itsupports their speculation <strong>of</strong> climate change <strong>of</strong> the Oligocene <strong>and</strong>Miocene potentially playing a more prominent role in North Americanfish species diversification than the Eocene–Oligocene climate-shift.Near et al. (2005) emphasized the impact <strong>of</strong> thedramatic cooling event <strong>of</strong> the latter on North American freshwaterfishes in general, <strong>and</strong> particularly for the Centrarchidae (basses <strong>and</strong>sunfishes) for which the age <strong>of</strong> the root node was estimated at theEocene–Oligocene boundary. However, Hardman <strong>and</strong> Hardman(2008) noted that most <strong>of</strong> the extant genera <strong>of</strong> Centrarchidae <strong>and</strong>much <strong>of</strong> the diversification within Ictaluridae was Oligocene to Pliocenein age. The latter was also observed based on the <strong>clade</strong> agesestimated herein for diversification within each <strong>of</strong> the catfish genera(Ictalurus, Ameiurus, <strong>and</strong> Noturus) examined. DiversificationPlease cite this article in press as: Blanton, R.E., et al. <strong>Timing</strong> <strong>of</strong> <strong>clade</strong> <strong>divergence</strong> <strong>and</strong> <strong>discordant</strong> <strong>estimates</strong> <strong>of</strong> <strong>genetic</strong> <strong>and</strong> morphological diversity in theSlender Madtom, Noturus exilis (Ictaluridae). Mol. Phylogenet. Evol. (2012), http://dx.doi.org/10.1016/j.ympev.2012.10.022
12 R.E. Blanton et al. / Molecular Phylo<strong>genetic</strong>s <strong>and</strong> Evolution xxx (2012) xxx–xxxTable 5Frequency distribution <strong>of</strong> preopercular m<strong>and</strong>ibular pores (POM) for Noturus exilisfrom <strong>clade</strong>s A–C <strong>of</strong> Figs. 2 <strong>and</strong> 4. Numbers in bold highlight modal POM counts foreach <strong>clade</strong>.Species/<strong>clade</strong> POM pores # Ind. Mean9 10 11Noturus exilis (Clade A) 7 50 57 10.9Noturus exilis (Clades B + C) 1 101 2 104 10.0Fig. 7. Scatterplot <strong>of</strong> factor scores generated from the Principle ComponentsAnalysis <strong>of</strong> all morphometric characters <strong>and</strong> individuals <strong>of</strong> Noturus exilis examined.Individuals/populations are grouped by <strong>clade</strong>s as recovered in Figs. 2 <strong>and</strong> 4.Component loadings for variables measured are provided in the text.among genera <strong>and</strong> for the family predated the Eocene–Oligocenecooling event, indicating that, as suggested by Hardman <strong>and</strong> Hardman(2008), this event had minimal impact on North Americancatfish <strong>divergence</strong> <strong>and</strong> that climate shifts or geological events, suchas the warming event <strong>of</strong> the Oligocene or sea level fluctuations <strong>of</strong>the Miocene–Pliocene, likely played a more influential role in theirdiversification.4.3. Phylogeographic relationshipsGeographic variation in N. exilis displays a number <strong>of</strong> interestingbiogeographic features. Data from both Cyt b <strong>and</strong> RAG2 indicatethat populations in the Illinois <strong>and</strong> Skunk river systems in the glaciatedregions <strong>of</strong> Illinois <strong>and</strong> Iowa are more closely related to thosein the Ozarks, particularly the Missouri River <strong>and</strong> its tributaries <strong>and</strong>the St. Francis River, than they are to populations in the EasternHighl<strong>and</strong>s. This suggests that northern populations are the result<strong>of</strong> dispersal from populations in the Ozarks up the Mississippi Riverfollowing retreat <strong>of</strong> the Pleistocene glaciers, which is furthersupported by the estimated mid-Pleistocene (mean nodeage = 0.57, 95% HDP: 0.24–1.05) diversification for this <strong>clade</strong> <strong>of</strong> N.exilis (Fig. 6). This finding is consistent with the Leading Edge Model<strong>of</strong> population expansion (Hewitt, 1996), which states that aquatictaxa in northern glaciated portions <strong>of</strong> North America arecomprised <strong>of</strong> lineages persisting <strong>and</strong>/or differentiating in southernrefugia during the Pleistocene. These lineages then exp<strong>and</strong>ednorthward into newly available habitats as glaciers receded. Similarresults have been found for other taxa in the upper MississippiRiver system, including Etheostoma caeruleum, Percina evides, <strong>and</strong>Noturus flavus (Near et al., 2001; Ray et al., 2006; Faber et al.,2009). Bay Creek, a tributary <strong>of</strong> the Ohio River in southern Illinois,also seems to have been populated by Ozarkian fishes, rather thanby invasions from closer tributaries <strong>of</strong> the Ohio River, viz., the lowerTennessee <strong>and</strong> Cumberl<strong>and</strong> rivers.The phylogeographic position <strong>of</strong> Clear Creek, a small direct tributary<strong>of</strong> the Mississippi River in southern Illinois <strong>and</strong> adjacent toBay Creek, was <strong>of</strong> particular interest. Hardy et al. (2002) foundshared haplotypes between the Clear Creek system <strong>and</strong> the LittleRed River (White River) <strong>of</strong> Arkansas. Although our sample sizeswere smaller, we found no shared haplotypes between these regions<strong>and</strong> both the Cyt b <strong>and</strong> RAG2 data indicate that the LittleRed River population is <strong>genetic</strong>ally distinct <strong>and</strong> divergent fromall others examined. As with Bay Creek, Clear Creek is allied withOzarkian fishes, but those from the Missouri <strong>and</strong> St. Francis rivers<strong>and</strong> not the White River system as previously proposed.The Cyt b data suggest that populations <strong>of</strong> Noturus exilis in theBlack River system (Current, Black, <strong>and</strong> Strawberry rivers) <strong>of</strong> thelower White River drainage are more closely related to populationsin the Eastern Highl<strong>and</strong>s, Missouri River drainage, <strong>and</strong> previouslyglaciated regions than they are to those in the upper White riversystem. The RAG2 data did not resolve these relationships, <strong>and</strong>we know <strong>of</strong> no other fish that shows this exact pattern. However,distributions <strong>of</strong> other upl<strong>and</strong> Ozarkian fishes do support a phylogeographicbreak between the upper White River <strong>and</strong> the Black River(lower White River). For example, populations <strong>of</strong> the RainbowDarter, Etheostoma caeruleum, from the Black River system aremore closely related to those from the middle <strong>and</strong> lower Mississippiriver systems (e.g., Meramac <strong>and</strong> St. Francis) than to theupper White River system (Ray et al., 2006). The relationship <strong>of</strong>the Black River <strong>clade</strong> to the <strong>clade</strong>s containing Eastern Highl<strong>and</strong>s<strong>and</strong> Missouri River populations was unresolved. Hellbenders, Cryptobranchusalleganiensis, from the upper White River system aremore closely related to those from the Tennessee River <strong>of</strong> the EasternHighl<strong>and</strong>s <strong>and</strong> Meramac <strong>and</strong> Missouri Rivers than to populationsfrom the Black River (e.g., Current <strong>and</strong> Eleven Point rivers;Routman et al., 1994). In Noturus exilis, the Black River system is alliedwith those from the Eastern Highl<strong>and</strong>s <strong>and</strong> Missouri River systems.Other madtom catfishes (N. albater <strong>and</strong> N. maydeni; Egge <strong>and</strong>Simons, 2006), minnows (Cyprinidae: Luxilus; Mayden, 1988) <strong>and</strong>basses (Centrarchidae: Amploblites; Cashner <strong>and</strong> Suttkus, 1977)also support a Black-White River vicariance.The phylogeographic break observed in many taxa between theupper <strong>and</strong> lower White River system is <strong>of</strong>ten attributed to Mayden’s(1988) pre-Pleistocene drainage hypothesis that states thatthe Mississippi River flowed through the area that is now the BlackRiver. Under this historical drainage pattern scenario, populations<strong>of</strong> fishes in each <strong>of</strong> the Black River system tributaries would havebeen isolated from each other <strong>and</strong> from the upper White River system<strong>and</strong> the other major lower White River tributary, the Little RedRiver system. Hardy et al. (2002) suggested that the observed phylo<strong>genetic</strong><strong>divergence</strong> between the Black River <strong>and</strong> upper WhiteRiver was likely due to pre-Pleistocene separation <strong>of</strong> these drainages,as noted by Mayden (1988). The pattern <strong>and</strong> timing <strong>of</strong> <strong>clade</strong><strong>divergence</strong> observed herein for the <strong>clade</strong>s <strong>of</strong> N. exilis from theWhite River system also are congruent with this aspect <strong>of</strong> Mayden’s(1988) pre-Pleistocene drainage hypothesis. Noturus exilisfrom the upper <strong>and</strong> lower White River (excluding the Little RedRiver <strong>of</strong> Clade A) were recovered as divergent sub-<strong>clade</strong>s withinthe larger Clade C, which had a diversification age estimate <strong>of</strong>5.47 mya (95% HPD 3.16, 8.73). This result supports the hypothesis<strong>of</strong> vicariance associated with pre-Pliestocene drainage patternshifts leading to the observed <strong>genetic</strong> <strong>divergence</strong> among the upper<strong>and</strong> lower White River system populations <strong>of</strong> N. exilis.Although, the same general phylogeographic break in the WhiteRiver system is observed across multiple taxa, the timing <strong>of</strong> thebreak has only been estimated for the sister species Noturus albaterfrom the upper White River <strong>and</strong> Little Red River system, <strong>and</strong> N.Please cite this article in press as: Blanton, R.E., et al. <strong>Timing</strong> <strong>of</strong> <strong>clade</strong> <strong>divergence</strong> <strong>and</strong> <strong>discordant</strong> <strong>estimates</strong> <strong>of</strong> <strong>genetic</strong> <strong>and</strong> morphological diversity in theSlender Madtom, Noturus exilis (Ictaluridae). Mol. Phylogenet. Evol. (2012), http://dx.doi.org/10.1016/j.ympev.2012.10.022
R.E. Blanton et al. / Molecular Phylo<strong>genetic</strong>s <strong>and</strong> Evolution xxx (2012) xxx–xxx 13maydeni from the Black River system (lower White River). The estimated<strong>divergence</strong> time for these species is 2.7–3.4 mya (Egge <strong>and</strong>Simons, 2006). Although calculated under different methods (usingthe cyprinid molecular clock <strong>of</strong> Dowling et al. (2002)) this impliesisolation leading to <strong>divergence</strong> <strong>of</strong> these species was younger thanthat inferred for Noturus exilis. Estimates for the timing <strong>of</strong> diversificationfor other species that show this geographic break have notbeen generated. Thus, it is unclear if other species are consistentwith the timing <strong>of</strong> <strong>divergence</strong> estimated for the Slender Madtom.Given the two different <strong>estimates</strong> for catfish <strong>divergence</strong>, it is likelythat the commonly observed pattern <strong>of</strong> <strong>divergence</strong> among populationsfrom the upper White River <strong>and</strong> those from the Black Riversystem, shared by many taxa, is not associated with a single vicariantevent, but may be better explained by vicariance associatedwith multiple <strong>of</strong> persistent events through time. This finding supportsprevious studies that caution against reliance <strong>of</strong> shared patterns<strong>of</strong> <strong>clade</strong> <strong>divergence</strong> among taxa, in the absence <strong>of</strong> temporaldata, to infer historical processes responsible for contemporarypatterns <strong>of</strong> species or <strong>clade</strong> diversity (Donoghue <strong>and</strong> Moore,2003; Keck <strong>and</strong> Near 2005).At a larger, more general scale, disparity is seen in <strong>clade</strong> agesestimated for Noturus exilis <strong>and</strong> those estimated for other small upl<strong>and</strong>,benthic fishes with similar geographic patterns <strong>of</strong> diversity inthe Central Highl<strong>and</strong>s. For example, populations <strong>of</strong> the CorrugatedDarter, E. basilare, which is restricted to a small portion <strong>of</strong> the Cumberl<strong>and</strong>River drainage in the Eastern Highl<strong>and</strong>s, diverged between2–8 mya (Hollingsworth <strong>and</strong> Near, 2009). Although the estimated<strong>divergence</strong> time for all Eastern Highl<strong>and</strong> populations (all withinClade C) <strong>of</strong> N. exilis (at 5.47 mya), is comparable to that estimatedfor E. basilare, <strong>divergence</strong> among Cumberl<strong>and</strong> River populations(middle versus lower Cumberl<strong>and</strong> River) <strong>of</strong> N. exilis, which are geographicallymore widespread than populations <strong>of</strong> the CorrugatedDarter, was estimated at only 2.5 mya. Such disparity in <strong>clade</strong> agesfor fishes with similar habitat preferences <strong>and</strong> geographic rangesprovides further support that multiple events or persistent historicalprocesses, rather than a single shared vicariant event, may <strong>of</strong>tenbest explain shared biogeographic patterns (Donoghue <strong>and</strong>Moore, 2003).5. Materials examined5.1. MorphologyNumbers in parentheses are numbers examined for measurements,meristics, <strong>and</strong> pigmentation, respectively.5.1.1. Mississippi River basin: Arkansas river drainageAR: Pope Co.: McCoy Creek TU 182899 (10); Van Buren Co.:Cadron Creek TU 188831 (5, 5, 5); Washington Co.: Illinois RiverUAIC 12550.09 (5, 5, 5); Yell Co.: Fourche LaFave River TU 98015(6). KS: Cherokee Co.: Spring River-Neosho River UAIC 10460.09(14), USNM 172051 (1). OK: Adair Co.: Tyner Creek UAIC2758.01 (5); Adair-Sequohay Co. Line: Little Lee Creek TU 2254(4); Delaware Co.: Flint Creek TU188767 (10). Illinois RiverDrainage: IL: Bureau Co.: East Bureau Creek INHS 55800 (1, 1,1); McClean Co.: Buck Creek-Mackinaw River INHS 85850 (4);LaSalle Co.: Buck Creek-Fox River INHS 88189 (3). Missouri RiverDrainage: KS: Wabaunsee Co.: Kansas River UAIC 7999.10 (4, 4,4). MO: Dallas Co.: Greasy Creek-Osage River UAIC 10104.09(4); Texas Co.: Piney River-Gasconade River TU 57612 (2), UF172043 (2), USNM 201394 (1, 1, 1); Warren Co.: Massie CreekUAIC 7995.05 (3); Webster Co.: Niangua River USNM 244959 (2,2, 2). Ohio River Drainage: Cumberl<strong>and</strong> River: KY: Trigg Co.: DonaldsonCreek UF 167337 (5, 5, 5); TN: Montgomery Co.: PineyFork-Red River UF 167327 (5, 5, 5); Williamson Co.: MayesCreek-Harpeth River UAIC 13633.02 (3, 3, 3). Green River: KY:Adair Co.: Green River SIUC 61238 (5, 5, 5); Grayson Co.: NolinRiver SIUC (uncataloged SIUC lot, collected 7 July 1959, 4, 4, 4).Kentucky River: KY: Grant Co.: Eagle Creek SIUC 66647 (5, 5, 5).Licking River: KY: Pendleton Co.: South Fork Licking River SIUC19120 (2, 2, 2). Tennessee River: AL: Limestone Co.: Piney CreekUAIC 13287.03 (5, 5, 5); Swan Creek UAIC 13289.03 (5, 5, 5);TN: C<strong>of</strong>fee Co.: Duck River TU 30304 (4, 4, 4); Lewis Co.: GrindersCreek-Buffalo River UF 172084 (5, 0, 5); Wayne Co.: StokesBranch-Duck River UF 172062 (5, 0, 5); Wayne Co.: Hog CreekUF 172003 (3, 0, 3). Direct Ohio River Tributaries: IL: Pope Co.:Bay Creek UF 167309 (5, 5, 5). Red River Drainage: AR: PolkCo.: Two Mile Creek TU 48515 (8). White River Drainage: BlackRiver: AR: Fulton Co.: South Fork Spring River TU 188810 (8);MO: Shannon Co.: Jacks Fork Current River UAIC 1077.05 (1);Texas Co.: South Prong Current River UF 172072 (7, 0, 5). BuffaloRiver: AR: Baxter Co.: Buffalo River TU 49703 (1). James River:MO: Christian Co.: Finley Creek USNM 263606 (2). Little Red River:AR: Stone Co.: Middle Fork Little Red River UAIC 11370.08 (2, 2,2); Van Buren Co.: Archey Fork UAIC 11368.06 (2, 2,), TU187869 (5, 31, 5); Hartsugg Creek TU 182855 (22, 22). North ForkWhite River: MO: Douglas Co.: Indian Creek UF 171996 (1, 0, 1);Ozark Co.: North Fork White River UAIC 118680.1 (3, 3, 3). UpperWhite River: AR: Benton Co.: War Eagle Creek UAIC 12596.12 (2,2, 2); White River TU 50018 (5). West Fork White River: AR: WashingtonCo.: Hutchins Creek USNM 201395 (6). Other MississippiRiver Systems or Tributaries: Clear Creek: IL:Union Co.: ClearCreek UF 167389 (5, 5, 5); Hutchins Creek UF 172053 (8). MeramecRiver: MO: Franklin Co.: Bourbeuse River UAIC 10321.11 (4,4, 4); Washington Co.: Big River SIUC 25996 (5, 5, 5). Rock River:IL: Ogle Co.: Leaf River INHS 54181 (9). Pecatonica River: IL:Winnebago Co.: Grove Creek Braasch & Smith 1962 (uncataloged,5). Skunk River: IA: Story Co.: Bear Creek UF 170791 (3, 3, 3),170792 (5, 5, 5); Long Dick Creek UF 170793 (3, 3, 3). South HendersonCreek: IL: Henderson Co.: South Henderson Creek INHS90619 (2, 2, 2). St. Francis River: MO: Madison Co.: St. Francis RiverSIUC 28424 (1, 1, 1); Rock Creek SIUC 34926 (5, 5, 5), UF172035 (4).5.2. MolecularMaterials examined arranged by gene <strong>and</strong> locality number usedin Table 1 <strong>and</strong> Fig. 1. Following locality numbers are tissue vouchernumber, followed by specimen voucher number in parentheses (ifavailable). Non-institutional abbreviations used are as follows:AMS are collections by A.M. Simons <strong>and</strong> JJDE are collections byJ.J.D. Egge, loaned through the Bell Museum (University <strong>of</strong> Minnesota);<strong>and</strong> NJL are collections by N.J. Lang loaned through the University<strong>of</strong> St. Louis.5.2.1. Cytochrome bSite 1: AMS02-01-2, AMS 02-01-3; Site 2: KU 630, 631 (KU23543); Site 3: KU 7892, 7907 (KU 38695); Site 4: FLMNH 2008-0238, 2008-0239 (UF 172043); Site 5: FLMNH 2008-0228, 2008-0229, 2008-0230, 2008-0231, 2008-0232 (UF 172072); Site 6:NAFF 1241 (STL 834.01); Site 7: AMS 02-17-3, 02-17-4, 02-16-1,02-16-2; Site 8: AMS02-04-1, 02-04-2; Site 9: FLMNH 2008-0234, 2008-0235, 2008-0236 (UF 171996); Site: 10: AMS 02-05-1, 02-05-2; Site 11: JJDE 03-13-3, 03-13-4; Site 12: FLMNH 2008-0223, 2008-0224, 2008-0225, 2008-0226 (UF 172035); Site 13:AMS 99-34-1; Site 14: NAFF 1234 (STL 272.04); Site 15: KU8104, 8105 (KU 38748); Site 16: STL 271.02; Site 17: NAFF 1242,1243, 1244 (STL 271.02); Site 18: NAFF 1249 (STL 400.2); Site19: NAFF 1235 (STL 268.01); Site 20: AMS 01-06-1, 01-06-2,JJDE03-11-1, 03-11-2; Site 21: JJDE 03-10-1, 03-10-2; Site 22:NAFF 1240 (STL 458.01); Site 23: FLMNH 2007-0445, 2007-0448,Please cite this article in press as: Blanton, R.E., et al. <strong>Timing</strong> <strong>of</strong> <strong>clade</strong> <strong>divergence</strong> <strong>and</strong> <strong>discordant</strong> <strong>estimates</strong> <strong>of</strong> <strong>genetic</strong> <strong>and</strong> morphological diversity in theSlender Madtom, Noturus exilis (Ictaluridae). Mol. Phylogenet. Evol. (2012), http://dx.doi.org/10.1016/j.ympev.2012.10.022
14 R.E. Blanton et al. / Molecular Phylo<strong>genetic</strong>s <strong>and</strong> Evolution xxx (2012) xxx–xxx2007-0450 (UF 167327); Site 24: FLMNH 2007-0329, 2007-0331,2007-0339 (UF 167337); Site 26: YFTC 7168; Site 27: AMS 02-32-1, 02-32-3; Site 28: NJL07-24; Site 29: FLMNH 2008-0172,2008-0173, 2008-0174 (UF 172062); Site 30: FLMNH 2008-0212,2008-0218, 2008-0221, 2008-0222 (UF 172084); Site 31: FLMNH2008-0186, 2008-0187 (UF 172003); Site 32: FLMNH 2007-0420,2007-0421 (UF 167309); Site 33: FLMNH 2008-0240, 0242, 0242,0243, 0244 (UF 172053); Site 34: FLMNH 2007-0481, 2007-0482(UF 167389); Site 35 INHS 101227-1, 101227-2 (INHS 101227);Site 36: FLMNH 2007-0513, 2007-0514 (UF 17091); Site 37:FLMNH 2007-0515, 2007-0516, 2007-0517 (UF 170792); Site 38:FLMNH 2007-0520, 2007-0521, 2007-0522 (UF 170793); Site 39:AMS 02-22-1, 02-22-2; Site: 40: AMS 02-23-4.5.2.2. RAG2Site 1: AMS02-01-1; Site 2: KU 631 (KU 23543); Site 3: KU 7892,7907 (KU 38695); Site 4: FLMNH 2008-0238, 0239 (UF 172043);Site 5: FLMNH 2008-0228, 0229 (UF 172072); Site 6: NAFF 1241(STL 834.01); Site 7: AMS 02-17-3, 02-17-3-4, 02-16-1, 02-16-2;Site 8: AMS02-04-1, 02-04-2; Site 9: FLMNH 2008-0234, 0235(UF 171996); Site 10: AMS 02-05-1, 02-05-2; Site 11: JJDE 03-13-3; Site 12: FLMNH 2008-0223, 2008-0224 (UF 172035); Site 13:AMS 99-34-1; Site 14: NAFF 1234 (STL 272.04); Site 15: KU8104, 8105 (KU 38748); Site 16: STL 271.02; Site 17: NAFF 1243(STL 271.02); Site 18: NAFF 1249 (STL 400.2); Site 19: NAFF 1235(STL 268.01); Site 20: AMS 01-06-1, JJDE03-11-1; Site 21: JJDE03-10-1; Site 22: NAFF 1240 (STL 458.01); Site 23: FLMNH 2007-0445 (UF 167327); Site 24: FLMNH 2007-0339 (UF 167337); Site25: YFTC 5512; Site 26: YFTC 7168; Site 27: AMS 02-32-1, 02-32-3; Site 28: NJL07-24; Site 29: FLMNH 2008-0172, 2008-0173 (UF172062); Site 30: FLMNH 2008-0212, 2008-0218 (UF 172084); Site31: FLMNH 2008-0186, 2008-0187 (UF172003); Site 32: FLMNH2007-0420, 2007-0421, 2007-0422 (UF 167309); Site 33: FLMNH2008-0240, 0242 (UF 172053); Site 34: FLMNH 2007-0481 (UF167389); Site 35: INHS 101227-1 (INHS 101227); Site 37: FLMNH2007-0515 (UF 170792); Site 39: AMS 02-22-1, 02-22-2; Site 40:AMS 02-23-4; Site 41: YFTC 2923.AcknowledgmentsWe thank B.M. Burr, M. Compton, J. Johansen, N. Lang, M. Thomas,<strong>and</strong> A. Thomson for assistance collecting specimens, M. Thomasfor photographs <strong>of</strong> N. exilis, G. Paulay for lab space <strong>and</strong>equipment, J. Grosso <strong>and</strong> G. Sheehy for distribution maps, <strong>and</strong>the numerous institutions <strong>and</strong> individuals noted in the MaterialsExamined that provided tissues <strong>and</strong> specimens. This study wassupported by the All Catfish Species Inventory funded by the NationalScience Foundation (DEB 0315963). Collection <strong>of</strong> specimensoccurred under state permits to LMP including: Arkansas Permit123020081, Kentucky Permit SC0911011, Missouri Permit 14002,<strong>and</strong> Tennessee Permit 809.Appendix A. Supplementary materialSupplementary data associated with this article can be found, inthe online version, at http://dx.doi.org/10.1016/j.ympev.2012.10.022.ReferencesAvise, J.C., 2000. Phylogeography: The History <strong>and</strong> Formation <strong>of</strong> Species. HarvardUniversity Press, Cambridge, MA.Baric, S., Sturmbauer, C., 1999. Ecological parallelism <strong>and</strong> cryptic species in thegenus Ophiothrix derived from mitochondrial DNA sequences. Mol. Phylogenet.Evol. 11, 157–162.Berendzen, P.B., Simons, A.M., Wood, R.M., Dowling, T.E., Secor, C.L., 2008.Recovering cryptic diversity <strong>and</strong> ancient drainage patterns in eastern NorthAmerica: historical biogeography <strong>of</strong> the Notropis rubellus species group(Teleostei: Cypriniformes). Mol. Phylogenet. Evol. 46, 721–737.Bookstein, F.L., Chern<strong>of</strong>f, B., Elder, R.L., Humphries Jr., J.M., Smith, G.R., Strauss, R.E.,1985. Morphometrics in evolutionary biology. Acad. Nat. Sci., PhiladelphiaSpecial Pub. 15, 1–277.Burr, B.M., Eisenhour, D.J., Grady, J.M., 2005. Two new species <strong>of</strong> Noturus(Siluriformes: Ictaluridae) from the Tennessee River drainage: description,distribution, <strong>and</strong> conservation status. Copeia 2005, 783–802.Cashner, R.C., Suttkus, R.D., 1977. Ambloplites constellatus, a new species <strong>of</strong> rock bassfrom the Ozark upl<strong>and</strong> <strong>of</strong> Arkansas <strong>and</strong> Missouri with a review <strong>of</strong> western rockbass populations. Am. Mid. Nat. 98, 147–161.Donoghue, M.J., Moore, B.R., 2003. Toward <strong>and</strong> integrative historical biogeography.Integr. Comp. Biol. 43, 261–270.Dowling, T.E., Tibbets, C.A., Minckley, W.L., Smith, G.R., 2002. Evolutionaryrelationships <strong>of</strong> the plagopterins (Teleostei: Cyprinidae) from cytochrome bsequences. Copeia, 665–678.Drummond, A.J., Rambaut, A., 2007. BEAST: Bayesian evolutionary analysis bysampling trees. BMC Evol. Biol. 7, 214.Drummond, A.J., Ho, S.Y.W., Phillips, M.J., Rambaut, A., 2006. Relaxed phylo<strong>genetic</strong>s<strong>and</strong> dating with confidence. PLOS Biol. 4, 699–710.Egge, J.J.D., Simons, A.M., 2006. The challenge <strong>of</strong> truly cryptic diversity: diagnosis<strong>and</strong> description <strong>of</strong> a new madtom catfish (Ictaluridae: Noturus). Zool. Scr. 35,581–591.Egge, J.J.D., Simons, A.M., 2009. Molecules, morphology, missing data <strong>and</strong> thephylo<strong>genetic</strong> position <strong>of</strong> a recently extinct madtom catfish (Actinopterygii:Ictaluridae). Zool. J. Linn. Soc. 155, 60–75.Faber, J.E., Rybka, J., White, M.M., 2009. Intraspecific phylogeography <strong>of</strong> theStonecat Madtom, Noturus flavus. Copeia 3, 563–571.Hardman, M., Hardman, L.M., 2008. The relative importance <strong>of</strong> body size <strong>and</strong>Paleoclimatic change as explanatory variables influencing lineagediversification rate: an evolutionary analysis <strong>of</strong> Bullhead Catfishes(Siluriformes: Ictaluridae). Syst. Biol. 57, 116–130.Hardman, M., Page, L.M., 2003. Phylo<strong>genetic</strong> relationships among bullhead catfishes<strong>of</strong> the genus Ameiurus (Siluriformes: Ictalurdiae). Copeia 1, 20–33.Hardman, M., 2004. The phylo<strong>genetic</strong> relationships among Noturus catfishes(Siluriformes: Ictaluridae) as inferred from mitochondrial gene cytochrome b<strong>and</strong> nuclear recombination activating gene 2. Mol. Phylogenet. Evol. 30, 395–408.Hardy, M.E., Grady, J.M., Routman, E.J., 2002. Intraspecific phylogeography <strong>of</strong> theSlender Madtom: the complex evolutionary history <strong>of</strong> the Central Highl<strong>and</strong>s <strong>of</strong>the United States. Mol. Ecol. 11, 2393–2403.Hewitt, G.M., 1996. Some <strong>genetic</strong> consequences <strong>of</strong> ice ages, <strong>and</strong> their role in<strong>divergence</strong> speciation. Biol. J. Linn. Soc. 58, 247–276.Hocutt, C.H., Jenkins, R.E., Stauffer Jr., J.R., 1986. Zoogeography <strong>of</strong> the fishes <strong>of</strong> thecentral Appalachians <strong>and</strong> central Atlantic coast plain. In: Hocutt, C.H., Wiley,E.O. (Eds.), The Zoogeography <strong>of</strong> North American Freshwater Fishes. WileyInterscience, New York.Hollingsworth, P.R., Near, T.J., 2009. Temporal patterns <strong>of</strong> diversification <strong>and</strong>microendemism in Eastern Highl<strong>and</strong> endemic Barcheek Darters (Pericdae:Etheostomatinae). Evolution 63, 228–243.Hubbs, C.L., Lagler, K.F., 1958. Fishes <strong>of</strong> the Great Lakes Region. Cranbrook Institute<strong>of</strong> Science, Bloomfield Hills, MI.Hubbs, C.L., Raney, E.C., 1944. Systematic notes on North American Siluroid fishes <strong>of</strong>the genus Schilbeodes. Occas. Pap. Mus. Zool., Univ. Mich. 487, 1–36.Keck, B.P., Near, T.J., 2005. Dispersal, vicariance, <strong>and</strong> timing <strong>of</strong> diversification inNothonotus darters. Mol. Ecol. 14, 3485–3496.Keck, B.P., Near, T.J., 2010. A young <strong>clade</strong> repeating an old pattern: Diversity inNothonotus Darters (Teleostei: Percidae) endemic to the Cumberl<strong>and</strong> River. Mol.Ecol. 19, 5030–5042.Kinzinger, A.P., Wood, R.M., Welsh, S.A., 2001. Systematics <strong>of</strong> Etheostomatippecanoe <strong>and</strong> Etheostoma denoncourti (Perciformes: Percidae). Copeia, 235–239.Leviton, A.E., Gibbs, R.H., Jr., Heal, E., Dawson, C.E., 1985. St<strong>and</strong>ards in herpetology<strong>and</strong> ichthyology: Part 1. St<strong>and</strong>ard symbolic codes for institution resourcecollections in herpetology <strong>and</strong> ichthyology. Copeia, 802–832.Lundberg, J.G., Sullivan, J.P., Rodiles-HernûCPíndez, R., Hendrickson, D.A., 2007.Discovery <strong>of</strong> African roots for the Mesoamerican Chiapas catfish, Lacantuniaenigmatica, requires an ancient intercontinental passage. Proc. Acad. Nat. Sci.Phil. 156, 39–53.Lundberg, J.G., 1970. The Evolutionary History <strong>of</strong> North American Catfishes,Family Ictaluridae. Unpubl. Ph.D. Dissertation. University <strong>of</strong> Michigan, AnnArbor.Lundberg, J.G., 1975. The Fossil Catfishes <strong>of</strong> North America. Cluade W. HibbardMemorial, vol. II. Museum <strong>of</strong> Paleontology, The University <strong>of</strong> Michigan, Paperson Paleontology 11, pp. 1–51.Lundberg, J.G. 1992. The phylogeny <strong>of</strong> ictalurid catfishes: a synthesis <strong>of</strong> recent work.In: Mayden, R. (Ed.), Systematics, Historical Ecology <strong>and</strong> North AmericanFreshwater Fishes. Stanford University Press, pp. 392–420.Mayden, R.L., 1988. Vicariance biogeography, parsimony, <strong>and</strong> evolution <strong>of</strong> NorthAmerican freshwater fishes. Syst. Zool. 37, 329–355.Mayden, R.L., 2002. On biological species, species concepts <strong>and</strong> individuation in thenatural world. Fish Fish. 3, 171–196.Nagle, B.C., Simons, A.M., 2012. Rapid diversification in the North American minnowgenus Nocomis. Molec. Phylog. Evol. 63, 639–649.Near, T.J., Bernard, M.F., 2004. Rapid allopatric speciation in logperch darters(Percidae: Percina). Evolution 58, 2798–2808.Please cite this article in press as: Blanton, R.E., et al. <strong>Timing</strong> <strong>of</strong> <strong>clade</strong> <strong>divergence</strong> <strong>and</strong> <strong>discordant</strong> <strong>estimates</strong> <strong>of</strong> <strong>genetic</strong> <strong>and</strong> morphological diversity in theSlender Madtom, Noturus exilis (Ictaluridae). Mol. Phylogenet. Evol. (2012), http://dx.doi.org/10.1016/j.ympev.2012.10.022