Hydro and Pedo-chemistry of Mardan district, N.W.F.P., Pakistan ...
Hydro and Pedo-chemistry of Mardan district, N.W.F.P., Pakistan ...
Hydro and Pedo-chemistry of Mardan district, N.W.F.P., Pakistan ...

Create successful ePaper yourself
Turn your PDF publications into a flip-book with our unique Google optimized e-Paper software.
CHAPTER 1INTRODUCTIONThe earth is a small living unit <strong>of</strong> the whole universe, but it is so complicated thatits own dimension cannot be clearly defined. The earth’s living unit, biosphere also calledecosphere is consisting <strong>of</strong> the lithosphere; lower part <strong>of</strong> the atmosphere <strong>and</strong> hydrosphere.These three spheres influence the biosphere by their chemical <strong>and</strong> physical interactions(Kabata-Pendias <strong>and</strong> Pendias, 1992).Generally the biosphere comprised <strong>of</strong> the three main ecosystems; l<strong>and</strong>environment, fresh water <strong>and</strong> marine ecosystem, while environment is the sum <strong>of</strong> the allthe features <strong>and</strong> conditions surrounding an organism that may influence it. The physicalenvironment encompasses rocks, soils, air <strong>and</strong> water (Montgomery, 2008). Beside naturalenvironment, humans inhabit the built environment so, the technological, cultural <strong>and</strong>social world are also the components <strong>of</strong> the environment (Cunningham et al., 2007).Environment could be either a resource or a hazard. As a resource it provideswater, soil, industrial raw <strong>and</strong> building material, energy, minerals <strong>and</strong> disposable sitesfor wastes but on the other h<strong>and</strong> environment constraint our development <strong>and</strong>infrastructure. Environment also generates some potent hazards in the form <strong>of</strong> theearthquake, volcanoes <strong>and</strong> floods (Bennett et al., 1997).1
Environmental geology is one <strong>of</strong> important aspect <strong>of</strong> the Environmental EarthSciences, which deals with the study <strong>of</strong> the human interaction with geologicalenvironment. The geological environment not only means the physical constituents <strong>of</strong> theearth, but also the earth surface, its l<strong>and</strong>forms <strong>and</strong> all the process those could bringchanges in these l<strong>and</strong>forms through time (Bennett et al., 1997).Water <strong>and</strong> soil are the two important components <strong>of</strong> the nature in terms <strong>of</strong> bothhazard <strong>and</strong> resource. Water is the most abundantly available substance in the nature,forming about 75 % <strong>of</strong> the matter <strong>of</strong> the Earth’s crust <strong>and</strong> is essential ingredient <strong>of</strong> allliving biota <strong>of</strong> the earth, (Srivastava, 2002). Chemically water is found in all three states<strong>of</strong> the matter (solid, liquid <strong>and</strong> vapor), all <strong>of</strong> equal importance (Trividi <strong>and</strong> Raj, 1992).Soil is a storage place for the solar energy. Solar energy reaching the soil isincorporated in the biomass <strong>of</strong> plants <strong>and</strong> is ultimately transferred to the other livingbeings <strong>and</strong> humans. The soil provides time <strong>and</strong> space to the dead organics <strong>and</strong>microorganisms to oxidise <strong>and</strong> release nutrients trapped in the organic matter (Davis <strong>and</strong>Masten, 2003).In return <strong>of</strong> getting hundreds <strong>of</strong> benefits the water is the mostly suffered mediafrom all the natural <strong>and</strong> anthropogenic activities (mining, agrichemicals, industries,domestic sewage etc), releasing heavy, trace <strong>and</strong> toxic metals, pesticides, sediments <strong>and</strong>organic compounds to the surface water had badly effected the quality <strong>and</strong> quantity <strong>of</strong> the2
fresh water as well as associated soil <strong>and</strong> atmospheric system (Montgomery, 2006). Alltheir components are altered in their quality by various kinds <strong>of</strong> pollutions.Environmental contamination by trace <strong>and</strong> toxic heavy metals is receiving greatattention worldwide, as serious issues regarding health <strong>and</strong> environment are arising dueto these metals. The presence <strong>of</strong> heavy metals in aquatic environment is <strong>of</strong> much concerndue to their influence on plants, animals <strong>and</strong> human’s lives. Elevated levels <strong>of</strong> heavy <strong>and</strong>trace metals may be mainly <strong>of</strong> anthropogenic influence rather than geogenic (Karenn <strong>and</strong>Baired. 2001). Heavy metals in soils are greatly associated with biological <strong>and</strong>geochemical processes. Although, heavy metals in soils are <strong>of</strong> geogenic origin, buthumans activities such as agriculture, transport, industrial activities <strong>and</strong> waste disposalhave resulted in manifold increase (Lund, 1990). Heavy metals in soils pose threatsthrough their mobility by transport to water <strong>and</strong> bioavailability to plants (Adriano, 2002).Although, heavy metals are present in the Earth’s crust, but they tend to accumulate inagriculture soils because <strong>of</strong> application <strong>of</strong> commercial fertilizers, insecticides <strong>and</strong> sewagesludge containing heavy metals (Peris et al., 2007; Wong et al., 2002). For exampleapplication <strong>of</strong> phosphate fertilizers has resulted in the accumulation <strong>of</strong> cadmium, a nonessential element to plants along other heavy metals (Mordvet <strong>and</strong> Osborn, 1982). Heavymetals are important in toxicological studies. It has been reported that cadmium posescarcinogenic, embryotoxic, teratogenic <strong>and</strong> mutagenic properties (S<strong>and</strong>ers, 1986).Similarly, having a known record in toxicological history, mercury has no significantbiological role, its compounds like mercuric chloride <strong>and</strong> organomercurial are highlytoxic (Gutkentcht, 1981).3
Besides the impacts <strong>of</strong> other heavy, trace <strong>and</strong> toxic metals, arsenic contaminationhas become a challenge for scientists worldwide. Presence <strong>of</strong> arsenic has long beendetermined in tube wells <strong>and</strong> drinking water supplies in south east Asia, India,Bangladesh <strong>and</strong> <strong>Pakistan</strong> (Smedley <strong>and</strong> Kinniburgh, 2002; Bhattacharya et al., 2003) <strong>and</strong>it is estimated that about 100 million peoples are at risk due to consumption <strong>of</strong>contaminated water in these countries (Nordstrom, 2002; Sun et al., 2004). Its chroniceffects in human beings commonly include skin diseases (e.g., pigmentation, dermalhyperkeratosis, skin cancer), <strong>and</strong> many cardiovascular, neurological, hematological, renal<strong>and</strong> respiratory disorders which may effect lungs, bladder, liver, <strong>and</strong> kidney (Morton <strong>and</strong>Dunette, 1994; Smith et al., 1999).Sources <strong>of</strong> drinking water in <strong>Pakistan</strong> include rivers, ground water, lakes <strong>and</strong>reservoirs. In present days disposal <strong>of</strong> agriculture, industrial <strong>and</strong> domestic effluents intonatural bodies has greatly deteriorated water sources. One <strong>of</strong> such example is MancharLake which is a source <strong>of</strong> drinking water <strong>and</strong> food for the local inhabitants has beenanthropologically contaminated with arsenic by main Nara Valley Drain (Arian et al.,2008). Due to reporting <strong>of</strong> arsenic problems in neighboring countries, Government <strong>of</strong><strong>Pakistan</strong> has been taken initiatives regarding this problem since 1999 with assistance <strong>of</strong>UNICEF. In first step preliminary investigations were made from November 1999 toJanuary 2001 by PCSIR <strong>and</strong> PCRWR with technical <strong>and</strong> financial support from UNICEF.In this study water samples from six Districts <strong>of</strong> Punjab province were collectd: resultshowed 14% <strong>of</strong> samples having arsenic above 10µg/l. Further similar studies were alsoconducted on water <strong>of</strong> 34 Districts in all four provinces <strong>of</strong> <strong>Pakistan</strong> (Ahmad et al., 2004).4
Similarly arsenic contamination has been reported in drinking water <strong>of</strong> three Districts(i.e., <strong>Mardan</strong>, D.I Khan <strong>and</strong> Chitral) <strong>of</strong> Khyber Pakhtun Khwa by PCRWR duringNational Water Quality Monitoring Programme (PCRWR Report, 2006)Study Area Pr<strong>of</strong>ileGeneral information regarding <strong>Mardan</strong> District has been taken from DistrictCensus Report (DCR) <strong>of</strong> <strong>Mardan</strong> (1998). General information about study area is;Location, boundary <strong>and</strong> area<strong>Mardan</strong> District is the part <strong>of</strong> Peshawar valley. Until 1937 <strong>Mardan</strong> District was apart <strong>of</strong> Peshawar District but it was set up as independent District in 1937. <strong>Mardan</strong>District lies between latitude 34° 05′ to 34° 32′ North <strong>and</strong> longitude 71° 48′ to 72° 25′East. It is bounded on the north-east by Buner District, on the north <strong>and</strong> north-west byMalak<strong>and</strong> protected area, on the south-east by Swabi District, on the south by NowsheraDistrict <strong>and</strong> on the west by Charsadda District. Total area <strong>of</strong> the District is 1632 squarekilometers (DCR, 1998).Physical features/ Topography<strong>Mardan</strong> District can be divided into two parts, northern hilly area <strong>and</strong> southwestern plain area. The northern side is completely bounded by the hills. The two highesthills are Pajja or Sacra, 2056 meters high <strong>and</strong> Garo or Pato, 1816 meters high. Thesouthern part is comprised <strong>of</strong> fertile plain which is accepted to be once the bed <strong>of</strong> the lakewhich was gradually filled up by the load <strong>of</strong> river (DCR, 1998).5
DrainageMost <strong>of</strong> the streams drain into the Kabul River. Kalpani is an important riverwhich originates from the Baizai, flowing southwards <strong>and</strong> joins Kabul River atNowshehra District. The other important streams which join Kalpani are BaghiariKhawar <strong>and</strong> Muqam Khawar, coming from Sudham valley <strong>and</strong> Naranji Khawar from theNaranji hills (DCR, 1998).ClimateSummer season is hot <strong>and</strong> high temperature has been observed from May to July.The temperature reaches to its maximum (i.e., 40-48°C) in the month <strong>of</strong> June. Thecoldest months are December <strong>and</strong> January in which the temperature falls to the average2.09 °C. Most <strong>of</strong> the rainfall occurs in the month <strong>of</strong> July, August, December <strong>and</strong> January.The maximum rainfall recorded for the month <strong>of</strong> August is 125.85 mm. The relativehumidity is quiet high throughout the year with maximum (i.e., 73.33 %) humidityrecorded in December.Flora <strong>and</strong> FaunaThe flora in the irrigated areas is exotic. The common trees are mesquite, ber,species <strong>of</strong> acecia <strong>and</strong> jund. The most common shrubs are Tarmariax, Articulate, Sp<strong>and</strong>sa.Akk, small red poppy, Spera, Pueghambrigual, Drab grass, Eamelthorl <strong>and</strong> Pohli chaulaietc. Variety <strong>of</strong> fauna is found in the District <strong>Mardan</strong>. The common animals are leopard,leopard cat, black Bear, brown Monkey, Jackal, wild Goat <strong>and</strong> Pheasant etc. (DCR,1998).6
Agriculture<strong>Mardan</strong> District is best known for its agriculture. It’s l<strong>and</strong> is well suited for thetobacco <strong>and</strong> sugar cane cultivation. The major crops grown in the District are wheat,sugar cane, tobacco, maize, rice, rape seed <strong>and</strong> mustered etc. (DCR, 1998).IrrigationThe main source <strong>of</strong> irrigational water is the canals. The upper Swat canal irrigatesmost part <strong>of</strong> the District <strong>and</strong> lower Swat canal irrigates south-western part <strong>of</strong> the District.The other sources are tube wells <strong>and</strong> lift irrigation (DCR, 1998).Horticulture <strong>and</strong> ForestryThe area is famous for orchards. The important fruit grown in the District areorange, plum, peach, apricot, pear, lechi, rare mango <strong>and</strong> apple. In <strong>Mardan</strong> Districtforestry is based on the canal <strong>and</strong> road sides <strong>and</strong> private l<strong>and</strong> plantation (DCR, 1998).Industry <strong>and</strong> TradeIn <strong>Mardan</strong> District, a small industrial state with 66 factories was established. Inwhich only 33 factories are now operating. <strong>Mardan</strong> is rich in the production <strong>of</strong> thetobacco <strong>and</strong> sugarcane. In 1997-98, <strong>Mardan</strong> District had 77 working industrial unitsincluding tobacco, match, furniture, marble, flour mills, steel industries, aluminum goods<strong>and</strong> h<strong>and</strong>y crafts (DCR, 1998).7
MiningIn <strong>Mardan</strong> District commercial deposits <strong>of</strong> marble, limestone, dolomite <strong>and</strong>granite are present. Veins <strong>of</strong> good quality pink topaz have also been found in the hillocks<strong>of</strong> Shaheed Ghundai <strong>and</strong> Shamozai Katlang, <strong>Mardan</strong>. Deposits <strong>of</strong> the non sticky clayhave also been prospected near the Indus river bank <strong>of</strong> Jehangira Swabi road. The miningactivities <strong>of</strong> minor minerals (ordinary s<strong>and</strong>, bajri <strong>and</strong> gravel) are dealt with according tothe N.W.F.P mining Concession Rules, 1971 (DCR, 1998).Geology <strong>of</strong> the Study Area<strong>Mardan</strong> District consists mainly <strong>of</strong> a north-eastern hilly part <strong>and</strong> south-westernplain area. The plain area <strong>of</strong> <strong>Mardan</strong> is comprised <strong>of</strong> alluvial cover <strong>of</strong> hundreds <strong>of</strong> metersthickness while the mountainous area consists <strong>of</strong> the rocks <strong>of</strong> Shewa Shahbazgarhi.According to Ahmad (1986) Shahbazgarhi complex can be divided in to Acidic <strong>and</strong> basicrocks. Acidic rocks are microporphyry, porphyritic granite, aegirine riececkite porphyry,riececkite gneiss. The acidic rocks are intruded by basic rocks such as metagabbro,metadolorite <strong>and</strong> local quartz monozonite. Minerals in the basic rocks include hastingsite,clinopyroxene, orthopyroxene, biotite <strong>and</strong> epidote while the acidic rocks have orthoclase,plagioclase <strong>and</strong> ferromagnesian minerals. Along with acidic <strong>and</strong> basic rocks, the threetypes <strong>of</strong> microstructure observed in the area are i) deformation structure ii) recoverystructure <strong>and</strong> iii) recrystallization structure. It can be estimated from the structure <strong>and</strong>texture that the rocks had undergone intense cataclization/<strong>and</strong> or mylonization in the past.8
Jehan (1985) concluded that the origin <strong>of</strong> Shewa Shehbazgarhi is <strong>of</strong> igneousnature. It was suggested that catacalsite <strong>and</strong> metagabbro can be dated to Precambrian times<strong>and</strong> subduction phenomena. However, the origination <strong>of</strong> gneisses microgranite could berelated with intrusion <strong>of</strong> basic magma, or either to tectonic activity. She has classified therocks <strong>of</strong> small outcrop south <strong>of</strong> Shahbazgarhi into acidic dykes, gneissose microgranite,metagabbro, lamprophyric dykes <strong>and</strong> cataclastic types. In the east <strong>of</strong> <strong>Mardan</strong>, SalkalaFormation, Tanowal Formation <strong>and</strong> Ambela Granitic Complex are present towards SwabiDistrict. Salkala Formation has sulfide mineral seems while Ambela Granite Complex is abatholithic mass comprising <strong>of</strong> granites, alkali granite, quartz syenites <strong>and</strong> basic dykes(Rafiq <strong>and</strong> Jan, 1989).AIMS AND OBJECTIVESFollowing are the aims <strong>and</strong> objectives <strong>of</strong> the present study:• Identification <strong>and</strong> chemical characterization <strong>of</strong> the waters <strong>and</strong> soils <strong>of</strong> the <strong>Mardan</strong>District.• Determination <strong>of</strong> Physico-chemical parameters <strong>and</strong> their environmental impactson the inhabitants <strong>of</strong> the area.• Investigation <strong>and</strong> verification <strong>of</strong> the already reported enhanced values <strong>of</strong> arsenic<strong>and</strong> if the arsenic enhancement is noticed then to identify possible ways <strong>and</strong>means for reducing the level <strong>of</strong> contamination.• Preparation <strong>of</strong> geochemical zonation maps <strong>of</strong> the District to delineate areas <strong>of</strong>environmental concern using GIS.9
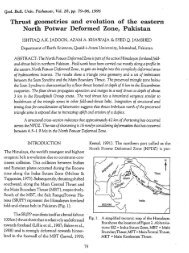
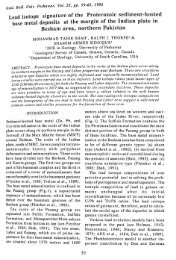
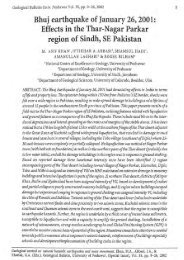
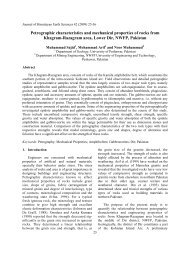
Fig. 1.1 Location Map <strong>of</strong> <strong>Mardan</strong> District10
CHAPTER 2LITERATURE REVIEWLiterature review on water <strong>and</strong> sediments contaminationArienzo et al. (2009) carried out an extensive review on Potassium (K) fromwastewater <strong>and</strong> its impacts on the soil, irrigated with such water. The main sources <strong>of</strong> Kare effluent discharge from cheese <strong>and</strong> dairy processing; winery, oil mills <strong>and</strong> potatoesprocessing at several hundred to several thous<strong>and</strong> mg/l, besides effluents, solid wastedumping from such sources also elevate the K level. Potassium from these sources ismore exchangeable than that <strong>of</strong> fertilizers. The irrigation with effluent increases soilorganic, soil respiration, enzymatic activities <strong>and</strong> mineral content. Addition <strong>of</strong> K to soilwith sufficient clay may hold K while with less clay soil K may leach to ground water.Despite <strong>of</strong> some positive effects, K in alkaline effluent may elevate K level <strong>and</strong> hindersthe hydraulic conductivity <strong>of</strong> soil. Therefor the study suggested that some legume plants<strong>and</strong> grasses can be used to remove excess K from soil.Emmaneul et al. (2009) conducted physiochemical-biological study regardingHealth Risk Assessment (HRA) <strong>of</strong> wastewater from hospital in Haiti. Water samplesfrom the septic tanks were compared with ground water. The ground water had showedhigh concentration <strong>of</strong> Cd, Pb, Cr <strong>and</strong> Ni due to leaching <strong>of</strong> effluent.Kazi et al. (2009) have studied the level <strong>of</strong> arsenic contamination in MancharLake, Sindh, <strong>Pakistan</strong>. They studied the impacts <strong>of</strong> contamination by analyzing scalphairs <strong>and</strong> blood <strong>of</strong> the residents. The range <strong>of</strong> arsenic concentrations in lake surface water11
was 35.2–158 µg/l, which are 3–15 folds higher than WHO limits. On the other h<strong>and</strong>good correlation was found between As in surface water <strong>and</strong> skin diseases in the area.Latif et al. (2009) analyzed level <strong>of</strong> arsenic, chromium <strong>and</strong> iron in the water,foodstuff <strong>and</strong> sediments from different areas <strong>of</strong> Bangladesh. They found that arsenic <strong>of</strong>geogenic nature is positively correlated with iron in many samples; also chromium wasfound in excessive amount in the sediments from the tannery area <strong>of</strong> Bangladesh.Bibi et al. (2008) conducted geochemical study on Meghna river delta. Watersamples from different tube wells were collected. High As <strong>and</strong> Fe were recorded in thewater samples from shallow tube wells. It was concluded from the leaching test that Asrelease was significant under both acidic <strong>and</strong> alkaline conditions. However, Fe releasewas maximum under acidic conditions. It was concluded that the As release might begoverned either by the dissolution <strong>of</strong> iron hydroxide fraction or organic matter in thesediments.Giang Luu et al. (2008) conducted research on trace elements contamination inthe ground water <strong>of</strong> K<strong>and</strong>al province <strong>of</strong> Cambodia. For this purpose 15 water sampleswere collected from three villages <strong>and</strong> were analyzed for heavy metals contamination.About 86% <strong>of</strong> the samples were notified with high As concentration with average value<strong>of</strong> 552 µg/l; with dominant form <strong>of</strong> hazardous AsIII. Among other trace elements Ba, Mn<strong>and</strong> Pb were also in high concentrations.12
Sthiannopkao et al. (2008) studied As <strong>and</strong> Mn contamination in the tube wellswater <strong>of</strong> Prey Veng <strong>and</strong> K<strong>and</strong>al provinces <strong>of</strong> Cambodia. Water samples were collected atdifferent depths from tube wells. Arsenic was found in high concentration in about 54%samples. The remaining 46% tube wells water showed upto 400µg/l <strong>of</strong> Mn with low As.Arsenic concentration in the water <strong>of</strong> tube wells could be related to reducing conditions.Farooqi et al. (2007) worked on arsenic, fluoride <strong>and</strong> sulfate concentration in theground waters <strong>of</strong> Lahore <strong>and</strong> Kasure Districts. During their study 5 samples <strong>of</strong> rain water<strong>and</strong> 24 samples <strong>of</strong> ground water (shallow <strong>and</strong> deep ground) samples were collected <strong>and</strong>analyzed to measure health impacts on the residents. High fluoride <strong>and</strong> arsenic contantswere observed in the shallow ground water samples. Samples from the local rain watercontained all the three (F - , As <strong>and</strong> SO -2 4 ), which could be due to the brick factories inpremises <strong>of</strong> Lahore <strong>and</strong> Kasure Districts.Rapant <strong>and</strong> Krcmova (2007) investigated different metals in ground water.Through conducting screening Health Risk Assessment they found that 11 % <strong>of</strong> theSlovakia territory has about 1 % Arsenic chronic risk level.Begum (2007) conducted physico-chemical analysis <strong>of</strong> different parameters inwater, soil <strong>and</strong> plants samples collected from Kabal-Mingora area. Among light <strong>and</strong>heavy elements Mg, Cr <strong>and</strong> Ni were high in water samples near mélange zone. In the soilsamples all the light element oxides <strong>and</strong> Cu, Pb, Zn, Ni, Cr, Co <strong>and</strong> Cd were in highcontents. Similarly some plant samples also had elevated levels <strong>of</strong> these elements. The13
concentration <strong>of</strong> these elements was also correlated with the mafic <strong>and</strong> ultramafic rockswithin mélange zone <strong>of</strong> swat.Nasreen (2006) conducted study on the waters <strong>and</strong> soils <strong>of</strong> Peshawar basin. It wasconcluded that the waters from the shallow ground water sources were having highcontents <strong>of</strong> cations, anions <strong>and</strong> trace <strong>and</strong> heavy metals as compared to deep groundwaters. Similarly soils <strong>of</strong> Peshawar basin were also enriched in these elements. Thisenrichment <strong>of</strong> different elements with the passage <strong>of</strong> time could be attributed t<strong>of</strong>luctuation <strong>of</strong> water table, changes in sediments lithology <strong>and</strong> anthropogenicinterferences.Nickson et al. (2005) analyzed the ground water samples <strong>of</strong> Muzaffargarh District<strong>of</strong> south western Punjab. The samples were analyzed for various elements with moreemphasize on As. The results showed that 58 % <strong>of</strong> the samples were recorded with highAs content. It was further concluded that the samples collected from the rural areas hadlow As as compared to urban areas. This high As in the urban waters could be due to thereduction <strong>of</strong> Ferric hydroxide <strong>and</strong> release <strong>of</strong> Arsenic through anthropogenic activities.Tamasi <strong>and</strong> Cini (2004) worked on water quality regarding heavy metals. Watersamples from springs <strong>and</strong> public aqueducts in Mount Amiata region, Italy. This regionhas been active regarding volcanic activities. In samples many heavy metals were foundat maximum allowable concentrations, except As which was found higher than maximumlimit.14
Rahman <strong>and</strong> Miah (2002) conducted a case study in rural areas <strong>of</strong> Ch<strong>and</strong>purDistrict, Bangladesh. They found that 98.5 % <strong>of</strong> tube wells in the area were affected byarsenic contamination. The inhabitants severely affected by various As borne diseasesdue to consumption <strong>of</strong> As contaminated water.M<strong>and</strong>al <strong>and</strong> Suzuki (2002) have extensively reviewed different studies about thesources, fate, distribution <strong>and</strong> impacts <strong>of</strong> As throughout the world. They categorized thedistribution <strong>of</strong> As into different rock types <strong>and</strong> sediments. They point out the groundwater contamination with As is a major threat to human health. Fruit, fish <strong>and</strong> vegetablescontain mainly organic As while, milk, dairy products, beef <strong>and</strong> cereals poses inorganicform. Major human diseases associated with As contamination are dermal problems,respiratory, pulmonary, cardiovascular, gastrointestinal, hematological, hepatic, renal,neurological, developmental, reproductive, immunologic, genotoxic, mutagenetic, <strong>and</strong>carcinogenic effects.Berg et al. (2001) studied arsenic in drinking water <strong>and</strong> sediments <strong>of</strong> red riverarea, Hanoi at different seasonal interval. In the 68 water samples, 78 % were havingArsenic above Vietnam’s st<strong>and</strong>ards <strong>of</strong> 50µg/l. Holding capacity <strong>of</strong> arsenic in sedimentswas in order brown black clay > gray clay > brown gray s<strong>and</strong>.Cooper <strong>and</strong> Gillespie (2001) carried out research on As, Hg in water <strong>and</strong>sediments in relation with these metals accumulation in fish tissues. Their study area wasa 10.1 km 2 oxbow lake <strong>of</strong> Mississippi River called Moon Lake. With passage <strong>of</strong> time15
most <strong>of</strong> the surrounding areas are brought under cultivation <strong>and</strong> wetl<strong>and</strong>s are drained.resulting in lake contamination <strong>and</strong> degradation. For analysis samples <strong>of</strong> water,sediments, fishes <strong>and</strong> surrounding soil were taken. Mercury in water was detected by coldvapor atomic absorption spectrometry with a detection limit <strong>of</strong> 0.2 mg/l while Asconcentrations in sediments <strong>and</strong> water were determined by stabilized temperaturegraphite furnace AA spectrometry. In the results <strong>of</strong> water samples both As <strong>and</strong> Hg werewithin permissible limits, average concentration <strong>of</strong> 5.12 mg/l <strong>and</strong> 2.16 mg/l respectively.Arsenic in soil, lake sediments, wetl<strong>and</strong> sediments <strong>and</strong> fishes were in averageconcentration <strong>of</strong> 5727.88, 5614.41 mg/kg, <strong>and</strong> 6746.47 mg/kg, <strong>and</strong> 36.99 mg/kgrespectively. Average Hg concentrations in soils, lake sediments, <strong>and</strong> fishes were, 55.1mg/kg, 14.5 mg/kg <strong>and</strong> 125 mg/kg respectively. It was clear from results that the mainsource <strong>of</strong> contamination is run <strong>of</strong>f from surrounding soils, as they have more metals thanother mediums.Khan et al. (2000) have done work on the quality <strong>of</strong> potable water <strong>of</strong> <strong>Mardan</strong> city<strong>and</strong> surrounding areas. In 31 water samples most showed high BOD <strong>and</strong> COD wheresome deep well water showed higher concentration <strong>of</strong> nitrates <strong>and</strong> magnesium values.Literature review on soilJavied et al. (2009) studied <strong>and</strong> compared the values <strong>of</strong> phosphate rocks collectedfrom different localities <strong>of</strong> Abbotabad with national <strong>and</strong> international values, in order toassess environmental impact <strong>of</strong> phosphate fertilizers. Different light (K, Mg, Mn <strong>and</strong> Na)<strong>and</strong> heavy (Cd, Cu, Cr, Ni, Pb <strong>and</strong> Zn) elements were analyzed in the phosphate rocks to16
measure their threats to soil, water <strong>and</strong> air. On comparison with samples frominternational values, the average concentrations <strong>of</strong> elements were relatively lower thanthose in foreign samples. However, the uncontrolled use <strong>of</strong> fertilizer in agricultural soilsmay results in soil, water <strong>and</strong> air pollution.Kanai et al. (2009) have identified impact <strong>of</strong> Fe deficiency on Zn uptake,accumulation <strong>and</strong> plant growth in Zea mays. In their study seedlings were treated withfour different nutrient solutions separately in such combination: a complete nutrientsolution (+Fe+Zn), a nutrient solution without EDA-Fe (−Fe+Zn), a nutrient solutionwithout ZnSO 4 (+Fe−Zn), <strong>and</strong> a solution without either EDA-Fe or ZnSO 4 (−Fe−Zn).The amount <strong>of</strong> taken <strong>and</strong> accumulated nutrients was determined from dried maize shootsdigested with HNO 3 : HClO 4 (4:1) at 100–180 °C for 4 hours. Results showed that in Fedeficientconditions, the uptake <strong>of</strong> Zn was 15-fold higher <strong>and</strong> Zn accumulation was 16-fold higher than that under normal nutrient conditions. Plant growth under conditions <strong>of</strong>both Fe <strong>and</strong> Zn deficiency was significantly higher than that under only Fe-deficientcondition, because during Fe deficiency high uptake <strong>of</strong> Zn hinders plant growth.Yang et al. (2009) studied the accumulation <strong>of</strong> cadmium in plants, grown oncontaminated soil. They grew six different plants in the pot treated with cadmium <strong>and</strong> asa result linear relationship was found between level <strong>of</strong> contamination <strong>and</strong> accumulation.However level <strong>of</strong> accumulation differed in different plants.17
Dinakar et al. (2008) did research on the Cd phytotoxicity on Arachis hypogaeaL. They studied the impacts <strong>of</strong> Cd on chlorophyll, protein, proline, nitrate <strong>and</strong> nitritereductase, antioxidant enzyme activity in leaves <strong>and</strong> roots. The seedlings were grown inthe pots <strong>and</strong> provided with CdCl 2 in 25, 50, <strong>and</strong> 100 μmol/l concentrations for 10, 15, 20<strong>and</strong> 25 days. Different extracts were made from leaves <strong>and</strong> roots according to enzymetype to be studied. The results showed direct relationship between the damage, toconcentration <strong>and</strong> exposure time. The higher concentration <strong>of</strong> cadmium (100 μmol/l)resulted (leaves <strong>and</strong> roots) total chlorophyll 91.01%, protein 79.51%, 83.61%, nitratereductase 79.39%, 80.72% <strong>and</strong> nitrite reductase 77.07%, 75.88% activity decreased withincrease in cadmium concentrations <strong>and</strong> exposure periods.Nwajei et al. (2007) worked on contaminated soil. In their study, they collectedsamples from the waste disposal sites in Onitsha metropolis, Nigeria. These samples wereanalyzed for seven (As, Ba, Cd, Cr, Mn, Pb <strong>and</strong> Li) metals <strong>and</strong> these elements werefound in elevated concentration as compared to normal soils <strong>of</strong> the area.Ganne et al. (2006) studied soils <strong>of</strong> Angleur, Belgium which is an industrial <strong>and</strong>zinc metallurgical waste dumping site. Four elements (As, Cu, Pb <strong>and</strong> Zn) were found athigh concentration, however, leaching behavior <strong>of</strong> these metals was very low in relationwith pH <strong>of</strong> that soil, posing low risk.Sarkar et al. (2005) studied the speciation <strong>and</strong> bioavailability <strong>of</strong> As in twodifferent soils: acidic s<strong>and</strong>y soil with low As retention <strong>and</strong> s<strong>and</strong>y loam with high18
concentration <strong>of</strong> amorphous Fe/Al-oxides. Both soils were spiked with dimethylarsenicacid (DMA), a low toxic herbicide at three rates: 45, 225, <strong>and</strong> 450 mg/kg. Arsenicspeciation <strong>and</strong> bioavailability tests were done at the beginning <strong>and</strong> after four months <strong>of</strong>incubation. They concluded that soil with amorphous Fe/Al-oxides retain more As henceposes low bioavailability. Although As from such soil was less bioavailable but underacidic conditions <strong>of</strong> human gastrointestinal system As may become available.Smeets et al. (2005) studied the Cd phytotoxicity <strong>and</strong> antioxidative reaction inbean (Phaseolus vulgaris L.). The seedlings were exposed to minimum Cd level. Majorbiochemical <strong>and</strong> physiological changes were observed within 24 hours. Some importantenzymes were reduce in functioning, similarly ascorbate peroxidase <strong>and</strong> glutathionereductase increased to cope the oxidative stress generated in leaves. After 72 hours <strong>of</strong>exposure visual effect like chlorosis was visible, showing high oxidative stress due to Cd.Tamura et al. (2005) worked on Phyto accumulation <strong>of</strong> Pb, on buckwheat. Soilwas sieved upto 2mm size, CEC <strong>and</strong> pH were also determined. One soil type was kept ascontrol while the 2 nd type was made contaminated through Pb pellets. The soils were thanprovided with urea, calcium superphosphate, potassium chloride <strong>and</strong> magnesium lime.Three seedlings were grown in each pot provided with 60% humidity <strong>and</strong> light for 12hours <strong>of</strong> day for 8 weeks. Before one week <strong>of</strong> harvesting Pb contaminated wheat weretreated with chelators, citrate (trisodium citrate), ethylenediaminetetraacetic aciddisodium salt (EDTA) or methylglycinediacetic acid trisodium salt (MGDA) atconcentration <strong>of</strong> 0, 1, 5, 10, <strong>and</strong> 20 mmol/kg. Results showed that more Pb was19
accumulated in plants grown on Pb contaminated soil than those <strong>of</strong> control soil. Amongplant tissues leaves ((8,000 mg/kg DW), had higher accumulation than shoot (2,000mg/kg DW), <strong>and</strong> roots (3,300 mg/kg DW). Also among chelators, MGDA which isbiodegradable enhanced the uptake <strong>of</strong> Pb from the soil. From this experiment the authorconcluded that Pb at level <strong>of</strong> 1000mg/kg DW can be accumulated in shoots <strong>of</strong> buckwheatwithout significant effects.Ali et al. (2004) worked on the phytotoxicity <strong>of</strong> Cd <strong>and</strong> Cr in control <strong>and</strong> forestsoils by using barley (Hordeum vulgare L.). Soils were spiked with K 2 Cr 2 O 7 <strong>and</strong> CuSO 4on dry (DW) weight bases. Soil concentrations ranged from 0.30 to 305mg Cu/g <strong>and</strong>from 0.3 to 101mg Cr/g DW in silica; <strong>and</strong> from 17.2 to 322mg Cu/g <strong>and</strong> from 12.4 to318mg Cr/g DW. Plants were taken after 14 days <strong>of</strong> exposure. Results were studied fromvarious aspects like effect <strong>of</strong> concentration; subtract type <strong>and</strong> exposure, to plantemergence, growth <strong>and</strong> tissue accumulation. In all forms plants in forest soil were lessaffected than those in artificial soil due to low bioavailability.Kosobrukhov et al. (2003) worked on Pb phytotoxicity in Plantago major plantswhich are generally grown on Pb contaminated soils. Phytotoxicity was checked throughparameters <strong>of</strong> plant growth, photosynthesis, <strong>and</strong> chlorophyll content <strong>and</strong> leaf anatomy.Analysis was carried out in two parts: on plants grown in laboratory having no Pb <strong>and</strong> 2 ndon plants collected from their habitats with Pb content in soil determined in 0.1 N HClsoil extract was 486 ± 20mg. On each category <strong>of</strong> plants separate experiments were madefor comparison. Various parameters like photosynthetic photon flux density (PPFD), CO 220
gas Exchange, stomata per unit Leaf area in adaxial <strong>and</strong> abaxial epidermis etc. The resultsshowed decreased in plant growth <strong>and</strong> photosynthesis due to reduction in leaf area,decrease in chlorophyll content <strong>and</strong> change in the leaf structure with increase <strong>of</strong> Pb from500 <strong>and</strong> 2000 mg/ kg.Jonesa et al. (2000) worked on the roadside Hg deposition <strong>and</strong> its consequenceson plants. Methylcyclopentadienyl manganese tricarbonyl (MMT: C 9 H 7 MnO 3 ), that isused as anti knocking agent; its combustion releases oxides <strong>of</strong> manganese which aredeposited along roadside. To measure their effects on plants they selected Radish(Raphanus sativus) for experiment. Seedlings <strong>of</strong> Radish were sprouted in manganouschloride (0, 0.25, 0.5, 1.0, 5.0, 10.0, 50.0, 100.0, 500.0, 750.0, <strong>and</strong> 1000.0 mg/l Mn).After five days the optimum temperature for Mn effectiveness was determined at 5°Cintervals from 5°C-45°C, with the help <strong>of</strong> Calorimeter. Respiratory rate was determinedby heat produced from the reaction between CO 2 from tissues <strong>and</strong> NaOH. Concentration<strong>of</strong> Mn in seedling <strong>and</strong> tissues were also determined. Mn in solution <strong>and</strong> in 5 daysseedlings were in good linear relation. Similarly the plant metabolism got increased withtemperature but beyond 100mg/l, oxidative stress due to Mn was observed. Growth ratewas good at higher temperature <strong>and</strong> low Mn, while at higher amount growth decreased.Carbonellu et al. (1998) studied the phytotoxic effects <strong>of</strong> different As compoundson marsh grass called Spartina alterniflor. Soil was treated with four chemical forms <strong>of</strong>As, AsO 2 , AsO 3, Monomethylacetamide (MMAA) <strong>and</strong> Dimethylacetamide (DMAA) <strong>and</strong>four As concentrations 0, 0.2, 0.8 <strong>and</strong> 2.0. The entire chemicals were in the forms sodiumsalts. Uniform seedlings were grown in the controlled environment <strong>and</strong> were harvested21
after 30 days. Plants treated with organic forms (MMAA <strong>and</strong> DMAA) showed significantgrowth reduction while those with As (V) had highest matter production due to moreuptake <strong>of</strong> P by plants. Increased concentration <strong>of</strong> Na in roots <strong>and</strong> Ca in leaf was observedin plants treated with organic form.Das et al. (1997) reviewed many studies on the phytotoxic impacts <strong>of</strong> Cd.Cadmium being a non essential element gets concentrated in the soil through variousanthropogenic activities like automobiles exhaust, mining <strong>and</strong> industrial sources. Thecommon symptoms <strong>of</strong> Cd phytotoxicity are chlorosis <strong>and</strong> stunning. Chlorosis is due todeficiency <strong>of</strong> iron <strong>and</strong> other essential nutrients. High Cd content lowers the P <strong>and</strong> Mnuptake. It also destroys enzymes, mitochondria <strong>and</strong> reduces concentration <strong>of</strong>Adinotriphosphate (ATP) <strong>and</strong> chlorophyll.22
CHAPTER 3METHODOLOGYResearch methodology <strong>of</strong> present study is divided into two folds: Field <strong>and</strong>Laboratory work.Field WorkWater SamplingTo conduct hydro-geochemical study <strong>of</strong> <strong>Mardan</strong> District, representative watersamples from all the fresh water resources including dug wells <strong>and</strong> h<strong>and</strong> pumps (30m deep), seasonal streams, springs <strong>and</strong> irrigationalcanals were collected. The samples locations were taken by the GPS. Before collectingthe water samples the polyethylene bottles were washed with double deionized water.From the field each representative sample was stored in two bottles one un-acidified forthe identification <strong>of</strong> physical parameters while, another was acidified with 5% HNO 3 forelemental analysis . Temperature, electric conductivity <strong>and</strong> pH were recorded on the spotin the field. Color, depth <strong>and</strong> flow <strong>of</strong> water were also observed in the field. Watersamples were further taken for analysis in the Geo<strong>chemistry</strong> Laboratory <strong>of</strong> NationalCentre <strong>of</strong> Excellence, University <strong>of</strong> Peshawar.Soil SamplingIn order to determine the <strong>Pedo</strong>-<strong>chemistry</strong> <strong>of</strong> <strong>Mardan</strong> District, the soil sampleswere collected from different agricultural fields <strong>of</strong> the area. Each samples <strong>of</strong> about 1kg23
was taken upto a depth <strong>of</strong> 30 cm by an uger <strong>and</strong> stored in the polyethylene bags. Thesesoil samples were labeled in the field; GPS position for each sample was recorded. Thesamples were taken further for analysis to Geo<strong>chemistry</strong> laboratory.Determination <strong>of</strong> Physical Parameters <strong>of</strong> WaterThe physical properties temperature (T), pH <strong>and</strong> electric conductivity (EC), weremeasured in the field with the help <strong>of</strong> portable instruments.Determination <strong>of</strong> TemperatureTemperature <strong>of</strong> water is greatly dependant upon the source, depth <strong>and</strong> season,chemical <strong>and</strong> biological activities. Ground water is less affected by surface temperature<strong>and</strong> processes while, temperature <strong>and</strong> other phenomena <strong>of</strong> surface water vary withatmospheric temperature. The living biota <strong>of</strong> water ecosystems is adapted to a narrowrange <strong>of</strong> temperature. In the field the temperature <strong>of</strong> water sample was determined withsimple thermometer.Determination <strong>of</strong> pH<strong>Hydro</strong>gen ion concentration is an important parameter regarding the quality <strong>of</strong>any substance. Chemically pure water dissociates in to 10 -14 g molecules per liter <strong>of</strong> waterinto H + <strong>and</strong> OH – in equal proportion at 25ºC. pH <strong>of</strong> drinking water below seven indicatesacidic while above seven for alkaline, it may be little alkaline due to presence <strong>of</strong>carbonates. pH may be measured either by colorimetric method or by electric method.pH <strong>of</strong> the samples was again determined in the laboratory with Consort Electrochemical24
Analyzer. The pH meter was calibrated with buffer solutions <strong>of</strong> 4 <strong>and</strong> 7 pH. pH meterwas immersed in samples <strong>and</strong> pH was noted. For accurate results pH meter wascalibrated with buffer solutions after few samples.Determination <strong>of</strong> Electric Conductivity (EC) <strong>and</strong> Total Dissolved Solids (TDS)Electric conductivity is the ability <strong>of</strong> solution to pass the amount <strong>of</strong> electriccurrent. It is directly related to the amount <strong>of</strong> dissolved substances. Pure water issupposed to have low electric conductivity. Electric conductivity <strong>and</strong> TDS in the watersamples were determined with the help <strong>of</strong> Consort Electrochemical Analyzer C931.Conductivity meter was first calibrated with 0.01M KCl solution <strong>and</strong> results recorded inµS/cm. To get accurate results after few samples again meter was calibrated with KClsolution.Determination <strong>of</strong> TurbidityTurbidity is the optical property <strong>of</strong> water in which scattering <strong>of</strong> light occurs due tosuspended particles. In water turbidity arises from silt, clay particles, mineral dissociation<strong>and</strong> organic particles. In the laboratory turbidity was measured by using JENWAY 6035Turbidity meter. Before analyizing the water samples instrument was first calibrated withblank, 2 <strong>and</strong> 5NTU st<strong>and</strong>ards.25
Determination <strong>of</strong> Anions in water samplessamples:The following anions (SO 4-2, NO 3-, Cl - , CO 3 -2 <strong>and</strong> HCO 3 - ) were determined in theDetermination <strong>of</strong> Sulfate (SO -2 4 )Sulfate concentrations in the water samples were determined by HACH DR 2800photometer. From the stored programs method 680 was selected for measuring sulfate inrange <strong>of</strong> 2-70g. One square cell was filled with 10 ml <strong>of</strong> sample <strong>and</strong> to it powder content<strong>of</strong> SulfaVer 4 reagent was added. Content <strong>of</strong> the cell was thoroughly mixed by swirling<strong>and</strong> left for 5 minutes. In second cell same sample was taken as blank sample. After fiveminutes the blank containing cell was inserted <strong>and</strong> pressed zero. Similarly the cell havingsample with reagent was inserted <strong>and</strong> reading for sulfate was recorded in mg/l.Determination <strong>of</strong> Nitrates (NO - 3 )Nitrate concentrations in the water samples were determined by HACH DR 2800photometer. Method for nitrate was selected. Two cells were filled with 10 ml <strong>of</strong> samesample. In one cell reagent was added from powder pillow. A time <strong>of</strong> one minute was setduring which cell’s contents were shaked vigorously. Reaction cell was left for 5minutes. Blank was wiped, inserted in the cell holder <strong>and</strong> reading was set to zero mg/l.Then sample’s cell was inserted into the cell holder <strong>and</strong> concentration <strong>of</strong> nitrate wasrecorded in mg/l.26
Determination <strong>of</strong> Chlorides (Cl - )Chloride in water was also determined by HACH DR2800 photometer. Fromstored program 70 chloride was selected. One square sample cell was filled with 10 ml <strong>of</strong>deionized water <strong>and</strong> reserved as blank. In second cell 10 ml <strong>of</strong> sample was taken; in bothcells 0.8ml <strong>of</strong> Mercuric Thiocyanate solution was added. After mixing well, 0.4 ml <strong>of</strong>ferric ion solution was added in each cell, on mixing an orange color developed in cells.Both cells were kept for two minutes for reaction, after reaction time first blank thansample’s cell was inserted into cell holder <strong>and</strong> the results were noted in mg/l.Determination <strong>of</strong> Carbonates (CO 3 -2 ) <strong>and</strong> Bicarbonates (HCO 3 - )Carbonates <strong>and</strong> bicarbonates were measured by titration method using 0.1Nhydrochloric acid. Phenolphtalene <strong>and</strong> methyl orange were used as indicators. The 25 ml<strong>of</strong> water sample was taken in flask <strong>and</strong> few drops <strong>of</strong> Phenolphtalene were added but nocolor developed as all samples were having pH below 8.3. In the same volume 2-3 drops<strong>of</strong> methyl orange were added. Light orange color developed in samples which weretitrated with 0.1N HCl until color disappeared. The volume <strong>of</strong> acid used was noted <strong>and</strong>results were recorded in mg/l in terms <strong>of</strong> CaCO 3 using following formula (Srivastava,2004);mg/l <strong>of</strong> CaCO 3 = (Volume × N <strong>of</strong> acid used) ×50,000Volume <strong>of</strong> sample27
Determination <strong>of</strong> Light, Trace <strong>and</strong> Heavy Elements by Atomic AbsorptionTechniqueMajor portion <strong>of</strong> the analysis was done with the help <strong>of</strong> atomic absorption usingflame, electrothermal (graphite furnace) <strong>and</strong> Mercury Hydride System (MHS). Flametechnique was used for the analysis <strong>of</strong> Calcium (Ca), Magnesium (Mg), Sodium (Na),Potassium (K), Iron (Fe) <strong>and</strong> Manganese (Mn) for both soil <strong>and</strong> water samples. Theremaining elements such as Copper (Cu), Lead (Pb), Zinc (Zn), Nickel (Ni), Chromium(Cr) <strong>and</strong> Cadmium (Cd) were also determined by flame technique in the soils <strong>and</strong>concentrations were recorded in mg/kg. While these elements were determined bygraphite furnace <strong>and</strong> the results were noted in μg/l. Mercury Hydride System was usedfor measuring Arsenic in both soil <strong>and</strong> water samples in μg/l.Water AnalysisDetermination <strong>of</strong> Major Elements in water with Flame TechniqueDetermination <strong>of</strong> Calcium <strong>and</strong> Magnesium (Ca + Mg)Instrumental conditions:Element Ca MgMode Absorption AbsorptionWavelength 422nm 285.2nmEnergy 57 58Current 10 1.6Slit width 0.7nm 0.4nm28
Air flow 17 L/m 17L/minFuel flow 2L/min 2L/minSt<strong>and</strong>ard stock solutions <strong>of</strong> 1000 mg/l <strong>of</strong> Ca <strong>and</strong> Mg were prepared by dissolving2.479g <strong>of</strong> CaCO 3 <strong>and</strong> 4.952g <strong>of</strong> MgCO 3 in 50ml <strong>of</strong> double deionized water <strong>and</strong> addingdrop wise 10ml <strong>of</strong> HCl, <strong>and</strong> then diluted to one liter with double deionized water forcalcium <strong>and</strong> magnesium respectively. From these stock solutions working st<strong>and</strong>ards <strong>of</strong>2.5, 5 <strong>and</strong> 10 mg/l were prepared. Before running samples, 3ml <strong>of</strong> lanthanum oxide wasadded to the working st<strong>and</strong>ards <strong>and</strong> samples. Instrument was calibrated according toabove mentioned conditions <strong>and</strong> st<strong>and</strong>ardization was done by the working st<strong>and</strong>ardssolutions.Determination <strong>of</strong> Sodium <strong>and</strong> Potassium (Na + K)Instrumental conditions:Element Na KMode Absorption AbsorptionWavelength 589nm 766.5nmEnergy 57 89Current 8 12Slit width 0.2nm 0.4nmAir flow 17 L/mi 17L/minFuel flow 2L/min 2L/min29
St<strong>and</strong>ard stock solutions <strong>of</strong> 1000mg/l <strong>of</strong> Na <strong>and</strong> K were prepared by dissolving2.542g <strong>of</strong> NaCl <strong>and</strong> 1.907g <strong>of</strong> KCl in deionized water <strong>and</strong> diluted to one liter with doubledeionized water in a volumetric flask. St<strong>and</strong>ard working solutions <strong>of</strong> differentconcentration i.e., 2.5, 5 <strong>and</strong> 10mg/l were prepared from 1000mg/l stock solutions. Thesamples were diluted with double deionized water where required. The instrument wascalibrated with the above mentioned conditions <strong>and</strong> st<strong>and</strong>ardized with working st<strong>and</strong>ardssolutions.Determination <strong>of</strong> Manganese (Mn)Instrumental conditions:ModeWavelengthAbsorption279.5nmEnergy 38Current 20Slit widthAir flowFuel flow0.2nm17L/min2L/min1000mg/l st<strong>and</strong>ard was prepared by dissolving 4.418g <strong>of</strong> MnSO 4 .4H 2 O in doubledeionized water in 1000ml volumetric flask <strong>and</strong> made to the mark. This stock solutionwas used for preparation <strong>of</strong> working st<strong>and</strong>ards <strong>of</strong> 2.5, 5, 10 mg/l. When proper conditionswere attained; instrument was calibrated with working st<strong>and</strong>ards. Samples were run onatomic absorption <strong>and</strong> concentration was noted in mg/l.30
Determination <strong>of</strong> trace <strong>and</strong> heavy elements in Water Samples on GraphiteFurnaceDetermination <strong>of</strong> iron (Fe)Instrumental conditions:ModeWavelengthPretreatment tempAtomization tempAbsorption248.3nm1400˚C2400˚CEnergy 40CurrentTube/siteSlit width30mApyro/platform0.2nmStock solution <strong>of</strong> 1000mg/l was prepared by dissolving 3.115g Mohr salt [Fe(NH 4 ) 2 . (SO 4 ) 2 H 2 O] in double deionized water <strong>and</strong> further diluted in volumetric flask toone liter. Working st<strong>and</strong>ards <strong>of</strong> different concentrations i.e., 50, 100 <strong>and</strong> 200µg/l wereprepared from the stock solution. Atomic absorption was calibrated with workingst<strong>and</strong>ards <strong>and</strong> concentration <strong>of</strong> iron was measured in µg/l.Determination <strong>of</strong> Copper (Cu)Instrumental conditions:ModeWavelengthAbsorption324.8nm31
Pretreatment tempAtomization temp1200˚C2300˚CEnergy 23CurrentTube/siteSlit width15mApyro/platform0.7nm1000mg/l stock solution was prepared by dissolving 1g copper metal in (1:1) HNO 3<strong>and</strong> further diluted to one liter with deionized water in a volumetric flask. From the stocksolution, working st<strong>and</strong>ards <strong>of</strong> 2.5, 5 <strong>and</strong> 10mg/l were prepared. Instrument was setaccording to the above mentioned conditions; calibrated with working st<strong>and</strong>ards <strong>and</strong>concentration in samples was noted in µg/l.Determination <strong>of</strong> Lead (Pb)Instrumental conditions:ModeWavelengthPretreatment tempAtomization tempAbsorption283.3nm850˚C1800˚CEnergy 35CurrentTube/siteSlit width10mApyro/platform0.7nm32
1000mg/l stock solution was prepared by dissolving 1.598g <strong>of</strong> Pb (NO 3 ) 2 in 1%<strong>of</strong> HNO 3 <strong>and</strong> diluted to one liter with double deionized water. Working st<strong>and</strong>ardsolutions <strong>of</strong> 50, 100 <strong>and</strong> 200µg/l were prepared from this 1000mg/l stock solution.Instrument was calibrated according to above mentioned conditions.Determination <strong>of</strong> Zinc (Zn)Instrumental conditions:ModeWavelengthPretreatment tempAtomization tempAbsorption213.9nm700˚C1800˚CEnergy 22CurrentTube/siteSlit width15mApyro/platform0.7nm1000mg/l stock solution was prepared by 1g zinc metal in minimum volume <strong>of</strong>HCl <strong>and</strong> diluted upto one liter with double deionized water in a volumetric flask. Furtherworking st<strong>and</strong>ards <strong>of</strong> 50, 100 <strong>and</strong> 200µg/l were prepared from the same stock solution.After attaining proper conditions <strong>and</strong> calibration samples were run on instrument throughautosampler.33
Determination <strong>of</strong> Nickel (Ni)Instrumental conditions:ModeWavelengthPretreatment tempAtomization tempAbsorption232nm1400˚C2500˚CEnergy 30CurrentTube/siteSlit width25mApyro/platform0.2nmStock solution <strong>of</strong> 1000mg/l was prepared by dissolving 1.273g <strong>of</strong> Nickel oxide inminimum volume <strong>of</strong> 10% (v/v) HCl <strong>and</strong> diluted to one liter with double deionized waterin a volumetric flask. Working st<strong>and</strong>ard solutions <strong>of</strong> 50, 100 <strong>and</strong> 200µg/l were preparedfrom stock solution. Instrument was calibrated according to the above mentionedconditions. Results were recorded in µg/l.Determination <strong>of</strong> Chromium (Cr)Instrumental conditions:ModeWavelengthPretreatment tempAtomization tempAbsorption357.9nm1650˚C2500˚C34
Energy 67CurrentTube/siteSlit width25mApyro/platform0.7nmStock solution <strong>of</strong> 1000mg/l was prepared by dissolving 3.735g <strong>of</strong> potassiumchromate (K 2 CrO 4 ) in double deionized water <strong>and</strong> diluted to one liter with doubledeionized water in one liter volumetric flask. From this solution, working st<strong>and</strong>ards <strong>of</strong> 50,100 <strong>and</strong> 200µg/l were prepared. After proper calibration, samples were run throughautosampler <strong>and</strong> concentration was noted in µg/l.Determination <strong>of</strong> Cadmium (Cd)Instrumental conditions:ModeWavelengthPretreatment tempAtomization tempAbsorption228.8nm700˚C1608˚CEnergy 26CurrentTube/siteSlit width4mApyro/platform0.7nm35
For making 1000mg/l stock solution 1g <strong>of</strong> cadmium metal was dissolved inminimum volume <strong>of</strong> HCl <strong>and</strong> diluted with 1 % HCl upto one liter. From this, stockworking st<strong>and</strong>ards <strong>of</strong> 50, 100 <strong>and</strong> 200µg/l were prepared. Instrument was calibrated withworking st<strong>and</strong>ards, <strong>and</strong> then st<strong>and</strong>ards <strong>of</strong> known concentrations were run in the machine(graphite furnace) to check the accuracy <strong>of</strong> instrument. All the samples <strong>and</strong> st<strong>and</strong>ardsafter proper calibration were run through autosampler <strong>and</strong> concentrations were recordedin µg/l.Soil AnalysisPreparation <strong>of</strong> soil solutionsBefore the preparation <strong>of</strong> the solution, the soil samples were air dried. thanpulverized to 200 meshes. The mortar was washed <strong>and</strong> dried after each run. The powderwas thoroughly mixed through quartering <strong>and</strong> coning. Powdered samples were kept inglass bottles for drying in oven at 110 ºC overnight. Solutions were prepared from theseoven dried samples.Solution preparation for Physico-chemical parameters in soilFor measuring physical parameters <strong>of</strong> soil, 10g <strong>of</strong> each oven dried sample <strong>of</strong> soilwas taken. To each sample 40ml <strong>of</strong> deionized water was added <strong>and</strong> shaken for 10 minuteson electric shaker. Mixture was left overnight <strong>and</strong> again mixed thoroughly for 10minutes. After leaving for next 24 hours; again mixture was shaken <strong>and</strong> finally filtered.Filtrate was used for the determination <strong>of</strong> physico-chemical parameters.36
Stock solution preparation for major elementsFrom oven dried soil samples, 0.5g <strong>of</strong> each soil sample was taken in Teflonbeakers <strong>and</strong>10ml <strong>of</strong> <strong>Hydro</strong>fluoric acid (HF) <strong>and</strong> 4ml <strong>of</strong> Perchloric acid (HClO 4 ) wereadded. After one hour heating on hot plate, 2ml <strong>of</strong> Perchloric acid was added <strong>and</strong> heatedcontinuously until paste was formed. Than again about 10ml <strong>of</strong> deionized water <strong>and</strong> 4ml<strong>of</strong> Perchloric acid were added <strong>and</strong> heated for 10 minutes. Finally, content <strong>of</strong> each beakerwas diluted to 250 ml with double deionized water. This method was adopted afterJeffery <strong>and</strong> Hutcheson (1986). This solution was run on the atomic absorption fordetermination <strong>of</strong> major elements.Stock solution preparation for the trace elementsOne gram <strong>of</strong> each dried soil sample was taken in Typhlon beaker <strong>and</strong> 5ml <strong>of</strong> HFwas added. Teflon beakers were heated for one hour on hot plate, after heating 10ml <strong>of</strong>aqua regia was added. Beakers were heated to completely dry the sample. On drying20ml <strong>of</strong> 2N HCl was added in the dried samples, heated <strong>and</strong> diluted with 30ml <strong>of</strong>deionized water (Jeffery <strong>and</strong> Hutscher, 1986). Solution was run on Atomic Absorption(AA) for determination <strong>of</strong> Cu, Pb, Zn, Ni, Cr, <strong>and</strong> Cd.Solution preparation for Arsenic in soil5g <strong>of</strong> air dried soil sample was digested in an acid mixture prepared from 20mlHNO 3, 10ml HCl <strong>and</strong> 2ml HF. Digests were heated at 130˚C on hot plat for 2 hours. Afterkeeping overnight in fuming hood, the contents were filtered. The filtrates were further37
diluted to 100ml with double deionized water. This solution was run on Mercury HydrideGeneration System for Arsenic determination (Abollino et al., 2002).Determination <strong>of</strong> Physical Parameters <strong>of</strong> SoilSoil colorSoil color was determined in both dry <strong>and</strong> moist state by comparing it withMunsell soils color Chart.Soil TextureSoil texture was determined with hydrometer method. 50g <strong>of</strong> oven dried soil wastaken <strong>and</strong> 10ml <strong>of</strong> 1N Sodium Carbonate was added along with deionized water. Themixture was stirred thoroughly in dispersion machine for five minutes. After this, themixing suspension was transferred to one liter graduated cylinder. <strong>Hydro</strong>meter was thendipped in suspension <strong>and</strong> after 40 seconds, the temperature <strong>and</strong> reading on <strong>Hydro</strong>meterwere noted. The temperature <strong>and</strong> height were recoded after 2 hours (Ryan, et al., 2001).pH, Conductivity, Total Dissolved Solids (TDS) in soilPysico-chemical parameters such as; pH, conductivity <strong>and</strong> total dissolve solids(TDS) were determined through the same procedure as was used for water samples fromthe soil solution prepared for physico-chemical parameters.38
Determination <strong>of</strong> Elements in Soil SamplesDetermination <strong>of</strong> Calcium <strong>and</strong> Magnesium (Ca + Mg)Instrumental conditions:Element Ca MgMode Absorption AbsorptionWavelength 422nm 285.2nmEnergy 57 58Current 10 1.6Slit width 0.7nm 0.4nmAir flow 17 L/m 17L/minFuel flow 2L/min 2L/minSt<strong>and</strong>ard stock solutions <strong>of</strong> 1000mg/l were prepared by dissolving 2.479g <strong>of</strong>CaCO 3 <strong>and</strong> 4.952g <strong>of</strong> MgCO 3 in 50ml <strong>of</strong> deionized water <strong>and</strong> adding drop wise 10ml <strong>of</strong>HCl, <strong>and</strong> then diluted to one liter with deionized water for calcium <strong>and</strong> magnesiumrespectively. From these stock solutions, working st<strong>and</strong>ards <strong>of</strong> 2.5, 5 <strong>and</strong> 10mg/l wereprepared. Before running, samples 3ml <strong>of</strong> lanthanum oxide was added to each sample.Instrument was calibrated according to above conditions <strong>and</strong> the st<strong>and</strong>ardization wasdone by working st<strong>and</strong>ards. The samples were than run as unknown on the instruments<strong>and</strong> result was noted in mg/l.39
Determination <strong>of</strong> Sodium <strong>and</strong> Potassium (Na + K)Instrumental conditions:Element Na KMode Absorption AbsorptionWavelength 589nm 766.5nmEnergy 57 89Current 8 12Slit width 0.2nm 0.4nmAir flow 17 L/mi 17L/minFuel flow 2L/min 2L/minSt<strong>and</strong>ard stock solutions <strong>of</strong> 1000mg/l were prepared by dissolving 2.542g <strong>of</strong> NaCl<strong>and</strong> 1.910g KCl in deionized water <strong>and</strong> diluting upto one liter with deionized water in avolumetric flask. Working solutions <strong>of</strong> different concentration i.e., 2.5, 5 <strong>and</strong> 10mg/lwere prepared from 1000mg/l stock solutions. The samples were diluted with doubledeionized water where it was required. The instrument was calibrated <strong>and</strong> st<strong>and</strong>ardizedbefore aspirating the samples through the machine. Concentrations were noted in mg/l.Determination <strong>of</strong> Iron (Fe)Instrumental conditions:ModeWavelengthAbsorption248.3nmEnergy 4040
Current 30Slit width 0.2HAir flowFuel flow17L/min2.3L/minStock solution <strong>of</strong> 1000mg/l was prepared by dissolving Mohr salt [Fe (NH 4 ) 2 .(SO 4 ) 2 H 2 O] in deionized water <strong>and</strong> further diluted to one liter with deionized water.Working st<strong>and</strong>ards <strong>of</strong> different concentrations i.e. 2.5, 5 <strong>and</strong> 10mg/l were prepared fromthe stock solution. Atomic absorption was calibrated with prepared working st<strong>and</strong>ards<strong>and</strong> concentration <strong>of</strong> iron was measured in mg/l.Determination <strong>of</strong> Manganese (Mn)Instrumental conditions:ModeWavelengthAbsorption279.5nmEnergy 38Current 20Slit width 0.2HAir flowFuel flow17L/min2L/min1000mg/l st<strong>and</strong>ard was prepared by dissolving 4.054g <strong>of</strong> MnSO 4 .4H 2 O indeionized water in volumetric flask <strong>and</strong> diluted to one liter. This stock solution was used41
for preparation <strong>of</strong> working solutions <strong>of</strong> 2.5, 5, 10mg/l. When proper conditions wereattained; instrument was calibrated with working st<strong>and</strong>ards. Samples were run <strong>and</strong>concentration was noted in mg/l.Determination <strong>of</strong> Copper (Cu)Instrumental conditions:ModeWavelengthAbsorption324.8nmEnergy 68Current 15Slit width 0.7HAir flowFuel flow17L/min2L/min1000mg/l stock solution was prepared by dissolving 1g copper metal in (1:1) HNO 3<strong>and</strong> further diluted to one liter with deionized water in a volumetric flask. From the stock,working st<strong>and</strong>ards <strong>of</strong> 2.5, 5 <strong>and</strong> 10mg/l were prepared. Instrumented was set according toabove st<strong>and</strong>ardization <strong>and</strong> calibrated with working st<strong>and</strong>ard solutions. Concentrationswere noted in mg/l.Determination <strong>of</strong> Lead (Pb)Instrumental conditions:ModeAbsorption42
Wavelength283.3nmEnergy 41Current 10Slit width 0.7HAir flowFuel flow17L/min2L/min1000mg/l stock solution was prepared by dissolving 1.598g <strong>of</strong> Pb (NO 3 ) 2 in 1%<strong>of</strong> HNO 3 <strong>and</strong> diluted to one liter with deionized water. Working st<strong>and</strong>ards <strong>of</strong> 2.5, 5 <strong>and</strong>10 mg/l were prepared from this 1000mg/l stock solution. Instrument was calibrated <strong>and</strong>st<strong>and</strong>ardized according to above conditions <strong>and</strong> concentration <strong>of</strong> Pb was determined inmg/l.Determination <strong>of</strong> Zinc (Zn)Instrumental conditions:ModeWavelengthAbsorption213.9nmEnergy 35Current 15Slit width 0.7HAir flowFuel flow17L/min2L/min43
1000mg/l stock solution was prepared by 1g <strong>of</strong> zinc metal in minimum volume <strong>of</strong>HCl <strong>and</strong> diluted upto one liter with deionized water in a volumetric flask. Furtherworking st<strong>and</strong>ards <strong>of</strong> 2.5, 5 <strong>and</strong> 10mg/l were prepared from the same stock solution.After attaining proper conditions <strong>and</strong> calibration, samples were run on instrument <strong>and</strong> theconcentrations were noted in mg/l.Determination <strong>of</strong> Nickel (Ni)Instrumental conditions:ModeWavelengthAbsorption232nmEnergy 30Current 25Slit width 0.2HAir flowFuel flow17L/min2L/minStock solution <strong>of</strong> 1000mg/l was prepared by dissolving 1.273g <strong>of</strong> Nickel oxide inminimum volume <strong>of</strong> 10% (v/v) HCl <strong>and</strong> diluted to one liter with deionized water in avolumetric flask. Working solution <strong>of</strong> 2.5, 5 <strong>and</strong> 10mg/l were prepared from stocksolution. Instrument was calibrated <strong>and</strong> st<strong>and</strong>ardized according the above mentionedconditions. Results were recorded in mg/l.44
Determination <strong>of</strong> Chromium (Cr)Instrumental conditions:ModeWavelengthAbsorption357.9nmEnergy 30Current 25Slit width 0.7HAir flowFuel flow17L/min2.5L/minStock solution <strong>of</strong> 1000mg/l was prepared by dissolving 3.735g <strong>of</strong> potassiumchromate (K 2 CrO 4 ) in deionized water <strong>and</strong> diluted to one liter with same water involumetric flask. From this solution working st<strong>and</strong>ards <strong>of</strong> 2.5, 5 <strong>and</strong> 10mg/l wereprepared. After proper calibration <strong>and</strong> st<strong>and</strong>ardization, samples were run <strong>and</strong>concentration was noted in mg/l.Determination <strong>of</strong> Cadmium (Cd)Instrumental conditions:ModeWavelengthAbsorption279.5nmEnergy 39Current 4Slit width 0.2H45
Air flowFuel flow17L/min2L/minFor making 1000mg/l stock solution, 1g <strong>of</strong> cadmium metal was dissolved inminimum volume <strong>of</strong> HCl <strong>and</strong> diluted with 1 % HCl upto one liter. From this stockworking st<strong>and</strong>ards <strong>of</strong> 2.5, 5 <strong>and</strong> 10mg/l were prepared. All the required conditions wereset on machine. Instrument was calibrated with working st<strong>and</strong>ards, <strong>and</strong> then st<strong>and</strong>ards <strong>of</strong>known concentrations were run to check the accuracy <strong>of</strong> instrument. After propercalibration samples were run <strong>and</strong> concentration was recorded in mg/l.Determination <strong>of</strong> Arsenic (As) in Water <strong>and</strong> Soil on Mercury Hydride SystemInstrumental conditionsWavelength193.7nmSlit wide 0.7HRadiation sourcePre reaction purge timeReaction timePost reaction purge timeElectrodeless discharge lamp for As50 sec25 sec40 sec46
Arsenic was determined on Mercury Hydride Generation system (MHS). Thefollowing solutions were prepared;1. 0.25mol/L (1% w/v) NaOH was prepared by dissolving 10g NaOH in doubledeionized water <strong>and</strong> diluted to one liter. 0.15M (1.5% v/v) HCl2. 5mol/L HCl was prepared by taking 206ml concentrated HCl <strong>and</strong> diluting upto oneliter with double deionized water. 0.8mol/L NaBH 4 solution was prepared by taking 3gSodium borohydride <strong>and</strong> dissolving it in 100ml <strong>of</strong> 10% NaOH. Pottasium iodied (KI) wasprepared by 3g KI <strong>and</strong> 5g Ascorbic acid in 100ml <strong>of</strong> deionized water.As determination with Pottasium iodied (KI) for pre reduction <strong>of</strong> As (IV) to As (III)In order to reduce interference, As (IV) was reduced to As (III) with KI solution.10ml <strong>of</strong> 5mol/L HCl <strong>and</strong> 1ml KI were added to 10ml <strong>of</strong> each sample. These sampleswere left for 30min in bottles to reduce As (IV) to As (III). Same procedure was followedfor the blank <strong>and</strong> st<strong>and</strong>ards. After 30 minutes, samples were run on MHS. Total inorganicarsenic was determined in µg/l.47
CHAPTER 4WATER CHEMISTRYWater is a very complicated <strong>and</strong> important medium upon which, all the livingmolecules depend <strong>and</strong> without it no life exists. These unique properties <strong>of</strong> the water aredue to hydrogen bonding, making it best solvent. Due to high dissolution power, itprovides basic medium for the transport <strong>of</strong> nutrients <strong>and</strong> other hazardous substances(Trivedi <strong>and</strong> Raj, 1992).Throughout history water has greatly influenced the well being <strong>of</strong> humans bothqualitatively <strong>and</strong> quantitatively. Great civilizations were habituated along the waterresources <strong>and</strong> were disappeared due to water shortage. Water has also added destructionto the humans through floods <strong>and</strong> water born diseases which are able to kill million <strong>of</strong>people. In nature the water is circulated through <strong>Hydro</strong>logical cycle. (Trivedi <strong>and</strong> Raj,1992).Although major part <strong>of</strong> the water on the earth is confined in the oceans <strong>and</strong> icecaps, the two principle sources <strong>of</strong> water are surface water <strong>and</strong> ground water, used by thehabitants.Surface WaterSurface water includes all the sources <strong>of</strong> water (rivers, lakes, streams, canals <strong>and</strong>springs etc) on the earth except <strong>of</strong> oceans <strong>and</strong> seas. Sunlight can penetrate the surfacewater <strong>and</strong> is well aerated. Due to availability <strong>of</strong> oxygen <strong>and</strong> sunlight, photosynthesis48
plays important role in alteration <strong>of</strong> surface water <strong>chemistry</strong>. The bottom boundary <strong>of</strong>surface water is called bed sediments (Perk, 2006).Surface Water PollutionSurface waters are in contact with humans, animals <strong>and</strong> soil microbes, because <strong>of</strong>this, it is more likely to contain harmful chemicals <strong>and</strong> microbes than ground water(Srivastava, 2004). Water from domestic run <strong>of</strong>f contains variety <strong>of</strong> contaminants likenitrogen, phosphorus, heavy metals <strong>and</strong> organic compounds. Direct point sources <strong>of</strong>surface water pollution are mine drainage, effluents from industrial <strong>and</strong> municipalsewage. Pollutants in the surface water partially get accumulated in the bed sedimentswhich can be again released to water (Perks, 2006).Ground waterGround water is almost found everywhere but the question is its accessibility. Itmay be so close to surface or hundreds <strong>of</strong> feet deep (Srivastava, 2004). Ground water isrecharged either through infiltration <strong>of</strong> surface water or percolation <strong>of</strong> water fromunsaturated zone. This replenishment <strong>of</strong> the ground water is called recharge. The porousstructure <strong>of</strong> soil sediments conduct the water.The only <strong>and</strong> most differing parameter inthe ground waters is temperature (Perks, 2006; Srivastava, 2004).Ground water pollutionGenerally sources <strong>of</strong> the ground water pollution are same as for soil <strong>and</strong> surfacewater, because the dissolved pollutants in soil <strong>and</strong> surface water infiltrate or percolate to49
ground water (Perk, 2006). Direct input <strong>of</strong> contaminated water through deep wellinjection also contributes to deep water contamination (Perks, 2006). Most <strong>of</strong> thechemical substances are removed during percolation <strong>of</strong> the water through the soilhorizons. Ground water mostly contains no microbes, but usually some bacteria, due t<strong>of</strong>iltering nature <strong>of</strong> the soil (Srivastava, 2004).Classification <strong>of</strong> Water PollutantsIn spite <strong>of</strong> such great significance, water is the most suffered medium <strong>of</strong> themodern ages by pollution <strong>and</strong> contamination. Quality <strong>of</strong> surface water is dependant onboth natural <strong>and</strong> anthropogenic sources. The anthropogenic sources constitute as constantpolluting source (Singh et al., 2004) <strong>and</strong> deteriorating water quality both in surface <strong>and</strong>ground water sources through atmospheric pollution, effluent discharge, use <strong>of</strong>agriculture, chemical eroded soil <strong>and</strong> l<strong>and</strong> use (Niemi, 1990). Water pollution can bedefined any physical or chemical change in water that an adversely affect organisms. Anysubstance that disallows the normal use <strong>of</strong> water is regarded as pollutant. The excess <strong>of</strong>naturally occurring substances is also considered as pollution. Water pollution is a broadphenomenon, as it varies with the use; nature <strong>and</strong> quantity <strong>of</strong> water, e.g., nitrogen in theirrigated water will not be so hazardous than in drinking water (Trivedi <strong>and</strong> Raj, 1992).Nature <strong>and</strong> complexity <strong>of</strong> water pollutants varies with sources generating thesepollutants. Trivedi <strong>and</strong> Raj (1992) have classified water pollutants into followingcategories:50
a) Oxygen dem<strong>and</strong>ing wasteOxygen dem<strong>and</strong>ing wastes are primarily organic materials that are oxidized bybacteria. Their oxidation leads to the depletion <strong>of</strong> oxygen in aquatic system. Thisdepletion affects the fish <strong>and</strong> other aquatic life, besides these wastes imparts annoyingodor, color <strong>and</strong> scum to aquatic life.b) Disease causing agentsThe main sources <strong>of</strong> such agents are, municipal <strong>and</strong> sanitary wastes, slaughteringplants <strong>and</strong> waste dumping. Disease causing agents are mostly bacteria <strong>and</strong>microorganisms; however, water may also be a breeding place for terrestrial diseasecausing species e.g., mosquitoes.c) Plant nutrientsAlthough nutrients are essential for all living things, but their excess in anyenvironment results in many problems. Excessive nutrient levels accelerate the plants <strong>and</strong>algal growth resulting in Eutriphication. The organic matter on decay increases theoxygen dem<strong>and</strong> <strong>of</strong> the system besides other problems.d) Organic compoundsSources <strong>of</strong> organic chemicals are diverse, including detergents, pesticides,industrial products <strong>and</strong> the decomposition products <strong>of</strong> the other organic matters. Some <strong>of</strong>the organics <strong>and</strong> their biproducts are more dangerous, e.g., phenol has been found toxic t<strong>of</strong>ishes at level less than 1mg/l.51
e) OilWater is mostly affected by oil during its production, distribution <strong>and</strong> use in thedomestic works. Incidental leakage from ships <strong>and</strong> oil plants has badly influenced waterresources.f) Inorganic chemicals <strong>and</strong> mineral substancesThis category <strong>of</strong> pollutants includes inorganic salts, mineral acids <strong>and</strong> metals.Presence <strong>of</strong> these elements disrupts the aquatic ecology greatly. The major associatedproblems are change in the pH, increasing corrosivety, disturbing osmotic balance <strong>of</strong> saltsin the aquatic flora <strong>and</strong> fauna, persistent heavy metals accumulation <strong>and</strong> rendering waterunsafe for irrigation purposes.g) SedimentsSediments are naturally added to water by erosional processes from varioussources. These sediments fill the stream channels; power plants <strong>and</strong> machines are eroded;increase turbidity; reduce light penetration <strong>and</strong> disrupt habitats <strong>of</strong> aquatic lives.h) Radioactive materialsDifferent types <strong>of</strong> radioactive waste are released from nuclear plants; industries,mining <strong>and</strong> refining, medical <strong>and</strong> scientific research utilizations. Hazardous elementsleached from the tailings <strong>and</strong> reach soil <strong>and</strong> water. Many <strong>of</strong> the radioactive elementsshow similar behavior to other plants nutrients <strong>and</strong> get absorbed: finally reaching tohigher food levels.52
i) HeatNormal water has an average (15-22˚C) temperature. Rise in water temperature ismainly due to thermal waste water used for cooling purposes in plants. High temperaturealters the physical, chemical <strong>and</strong> biological characteristics <strong>of</strong> the water system, reducingor eliminating life forms. It may also accelerates spawning activity <strong>and</strong> as a consequencestarvation <strong>of</strong> new spawning. In heated water the dissolved oxygen is lowered: rate <strong>of</strong>chemical reactions are increased <strong>and</strong> no hatchings from the eggs <strong>of</strong> various animals.Physico- Chemical Properties <strong>of</strong> WaterThe geochemical data <strong>of</strong> the waters <strong>of</strong> <strong>Mardan</strong> District have been given in table4.1 to 4.4 <strong>and</strong> are graphically presented in Figures 4.1 to 4.13. Various concentrations<strong>and</strong> the related variation <strong>of</strong> physical parameters, anions, cations <strong>and</strong> the heavy <strong>and</strong> traceelements in the present studied water samples have been described below:Water classificationPiper diagram was used to classify the waters <strong>of</strong> <strong>Mardan</strong> District. Classificationwas made on the bases <strong>of</strong> pH, TDS, Na + , Ca + , Mg +2 , K + , SO -2 4 , Cl - -<strong>and</strong> HCO 3concentration. In case <strong>of</strong> surface water dominant cations were Na + <strong>and</strong> K + while inanions, HCO - 3 was dominant. Surface water lies in the field <strong>of</strong> NaHCO 3 (Fig. 4.14a).Similarly shallow <strong>and</strong> deep ground water falls in the fields <strong>of</strong> NaHCO 3 <strong>and</strong> NaCaHCO 3category (Fig. 4.14b <strong>and</strong> c respectively). Water from the study area is alkaline type withprevailing (<strong>Hydro</strong>gen) Carbonatic nature.53
Temperature (T)Temperature is the most important parameter for the aquatic environment,because it controls all the physical, chemical <strong>and</strong> biological properties. Density, viscosity,surface tension, vapor pressure all are temperature dependent. Saturation values <strong>of</strong>substances <strong>and</strong> gases, biological oxygen dem<strong>and</strong>s, photosynthesis, microbial activities,all are temperature dependent (Trivedi <strong>and</strong> Raj, 1992).Temperature <strong>of</strong> surface water varied from 18 to 30 ◦ C with average value <strong>of</strong> 25 ◦ C(Table 4.1a). Values <strong>of</strong> temperature in shallow ground water sources (Table 4.1b) variedfrom 20 to 27 ◦ C with average value <strong>of</strong> 23 ◦ C. Similarly deep ground water sources variedfrom15 to 26 ◦ C with an average value <strong>of</strong> 23 ◦ C (Table 4.1c). Majority <strong>of</strong> the surfacewaters showed values about 20C˚, however, high values were found in stream water fromShahbaz Garhi (30 ◦ C), Saidabad (30 ◦ C), Bakhshali (30 ◦ C) <strong>and</strong> Malakabad (30 ◦ C) (Table4.1a).pHIt is the –log <strong>of</strong> hydrogen ion concentration or is the intensity factor <strong>of</strong> acidity. pHvalues can also be defined as the exponent to the base 10 <strong>of</strong> hydrogen ion concentration.For natural water these values range from 4-9, however, higher values representbicarbonate <strong>and</strong> carbonates <strong>of</strong> alkali <strong>and</strong> alkaline earth elements (Nollet, 2000).The average pH value in surface water <strong>of</strong> District <strong>Mardan</strong> was 7.3. Shallow <strong>and</strong>deep ground water showed the average pH values <strong>of</strong> 7.0 <strong>and</strong> 7.3 respectively (Table 4.1a54
<strong>and</strong> 4.1b respectively). All the water samples were within permissible limit <strong>of</strong> 6.5 to 8.5suggested by WHO (2004) <strong>and</strong> USEPA (2009). Water samples collected from differentsources showed less variation although, general trend <strong>of</strong> alkaline nature was observedamong samples. Highest value <strong>of</strong> pH (8.4) was observed in water from h<strong>and</strong> pump atTakker village (Table 4.1b).Electric Conductivity (EC)Electrical conductivity is the reciprocal <strong>of</strong> electric resistance, <strong>and</strong> is directlyproportional to the ionic species. In order to measure the amount <strong>of</strong> TDS in water electricconductance is used as basic factor. Higher EC indicates high concentration <strong>of</strong> dissolvedsolids. Results <strong>of</strong> EC are expressed in millisiemens/meter (Peavy et al., 1985).Electric conductivity in surface water ranged from 132 to 1876µS/cm with anaverage value <strong>of</strong> 522µS/cm (4.1a). Permissible limit <strong>of</strong> EC by WHO (1996) is
samples with high EC value were from Par Hoti (1496µS/cm), Jalala (1148 µS/cm) <strong>and</strong>Chankari stop (913µS/cm) (Table 4.1c).Total Dissolved Solids (TDS)Dissolved solids in water can be <strong>of</strong> both inorganic <strong>and</strong> organic nature. Metals <strong>and</strong>minerals in nature are dissolved due to solvent nature <strong>of</strong> water. These dissolvedsubstances may impart undesirable taste, color <strong>and</strong> odor to water. Some <strong>of</strong> the metals <strong>and</strong>dissolved substances posses health problems e.g., dissolved organics may be carcinogenic(Peavy et al., 1985).Water samples from surface water sources showed an average value <strong>of</strong> 242mg/l,with minimum value <strong>of</strong> 70mg/l <strong>and</strong> maximum <strong>of</strong> 430mg/l (Table 4.1a). Permissible limitfor TDS is 1000mg/l <strong>and</strong> 500mg/l by WHO (2004) <strong>and</strong> USEPA (2009) respectively.Average TDS value in samples from shallow ground water source was 430mg/l, <strong>and</strong>ranged from 82 to 1220mg/l. One water sample, sample No. W-30 from the h<strong>and</strong> pump<strong>of</strong> Jalala was having 1220mg/l TDS concentration which exceeded the permissible limit(Table 4.1b). Water samples from deep ground sources observed average value <strong>of</strong>367mg/l. TDS values were in range <strong>of</strong> 142 to 805mg/l, <strong>and</strong> were therefore, found withinthe permissible limit <strong>of</strong> WHO, however, it exceeded the USEPA permissible limit (Table4.1c).56
TurbidityTurbidity refers to the expression <strong>of</strong> optical property (Tyndall effect) in which thescattering <strong>of</strong> light occurs due to suspended particles present in the water. Turbidityreduces the light penetration, hence affecting the biological <strong>and</strong> chemical activities. Themagnitude <strong>of</strong> the light scattering depends upon the size, shape <strong>and</strong> refractive index <strong>of</strong>particles. Turbidity is caused by clay, silt, organic matter, phytoplankton <strong>and</strong>microorganisms. (Trivedi <strong>and</strong> Raj, 1992).Surface water samples <strong>of</strong> the study area were having turbidity in range from 0.10to 25.00NTU with average value <strong>of</strong> 7.85NTU. High value (25.00NTU) was found insample from Bakhshali (Table 4.1a). In shallow ground water samples turbidity rangedfrom 0.10 to 23.00NTU with average value <strong>of</strong> 4.26NTU (Table 4.1b). Highest valueswere found in the water <strong>of</strong> h<strong>and</strong> pumps <strong>of</strong> Jh<strong>and</strong>ai (23.00NTU), Chil (14.80NTU) <strong>and</strong>Garhi Kapora (15.00NTU). However, the values <strong>of</strong> turbidity in deep water samplesranged from 0 to 27.70NTU with average turbidity <strong>of</strong> 2.60NTU (Table 4.1c).Sulfates (SO -2 4 )Sulfur plays important role in the biosphere. The major ions in which sulfur isfound are sulfates, sulfite <strong>and</strong> sulfide. Among all these, sulfates have received greatattention because <strong>of</strong> its mobility, availability to the plants <strong>and</strong> microorganisms. Sulfatesare also significant in precipitation reaction <strong>and</strong> its reactivity with positive chargedsurfaces in the soil (Nolett, 2000).57
Sulfate concentration in the surface water varied from 1 to 30mg/l with averagecontent <strong>of</strong> 15mg/l (Table 4.2a), from 3 to 206mg/l in shallow ground water with averagecontent <strong>of</strong> 42.88mg/l (Table 4.2b) <strong>and</strong> from 2 to 250mg/l in deep ground water sampleswith average value <strong>of</strong> 52mg/l (Table 4.2c). Permissible limit for SO -2 4 by WHO b (1996)is 500mg/l <strong>and</strong> USEPA (2009) is 250mg/l in drinking water. Sulfate concentrations in allwater samples from the study area were within permissible limits.Nitrates (NO - 3 )Nitrates are stable compounds in the nitrogen cycle. Nitrates are highly solublespecie in the water but weekly retained in the soil, as a result, it gets percolated to theground water. The presence <strong>of</strong> the nitrate in the water system indicates contamination,microbial activities <strong>and</strong> pesticides residue (Nolett, 2000). Although nitrates are found inthe natural water however, its level has been elevated by anthropogenic sources likenitrogenous fertilizer, wastewater discharge, sewage disposal, l<strong>and</strong>fills <strong>and</strong> atmosphericpollutants (Lck, 1996). Elevated level <strong>of</strong> nitrate poses serious threat to environment in theform <strong>of</strong> eutriphication (Allaby, 1989). The serious human health problems arise whennitrates are reduced to nitrite, which further oxidize iron <strong>of</strong> hemoglobin <strong>and</strong> formsmethamoglobin causing “Blue baby” syndrome (Burden, 1961).Concentration <strong>of</strong> NO - 3 in surface water samples ranging from
<strong>of</strong> less than 50mg/l while that <strong>of</strong> USEPA (2009) is 10mg/l; therefore all the samples werehaving NO 3 - within permissible limits.Chloride (Cl - )In nature Chlorides are found as salts <strong>of</strong> sodium (NaCl), potassium (KCl) <strong>and</strong>Calcium (CaCl 2 ). They form ionic components <strong>of</strong> water. Their concentration isunaffected by biological <strong>and</strong> chemical processes <strong>of</strong> water. In ground <strong>and</strong> surface waterchlorides are added through run <strong>of</strong>f containing inorganic fertilizers, road salts, septictanks effluents, industrial discharges <strong>and</strong> sea water intrusions in coastal areas (WHO a ,1996). The amount <strong>of</strong> chloride in fresh water is usually less than 10mg (Nollet, 2000).Health impacts due to chlorides is mainly associated with the type <strong>of</strong> cation, however, ahealthy individual can tolerate large intake. The two important impacts on humans arecongestive heart failure due to impaired metabolism <strong>of</strong> NaCl <strong>and</strong> hypertension using dueto NaCl at level above 2.5mg/l (WHO a , 1996).Chloride contents in the surface water varied from 1 to 18mg/l (Table 4.2a), withaverage value <strong>of</strong> 6mg/l, from 3 to195mg/l in shallow ground water with average value <strong>of</strong>37mg/l (Table 4.2b) <strong>and</strong> from 2 to 96mg/l in deep ground water samples with averagecontent <strong>of</strong> 30mg/l (Table 4.2c). Maximum acceptable limit <strong>of</strong> Cl in drinking water byWHO (2004) <strong>and</strong> USEPA (2009) is 250mg/l, therefore all the samples were found withinpermissible limit.59
Carbonates (CO -2 3 ) <strong>and</strong> Bicarbonates (HCO - 3 )Carbonates <strong>and</strong> bicarbonates impart alkalinity to the water, which is the ability <strong>of</strong>water to neutralize acid. Alkalinity is a function <strong>of</strong> carbonate, bicarbonates <strong>and</strong> hydroxylion. Measures <strong>of</strong> these parameters are important in the interpretation <strong>and</strong> control <strong>of</strong> thewater <strong>and</strong> wastewater treatment process. Generally s<strong>of</strong>t waters are prone to acidshowever, the presence <strong>of</strong> the carbonates <strong>and</strong> bicarbonates ions help in buffering thesystem (Nolett, 2000).Samples from the surface sources were having HCO - 3 in a range <strong>of</strong> 130 to460mg/l with average content <strong>of</strong> 294mg/l (Table 4.2a), from 100 to 1000mg/l in shallowground water with average content <strong>of</strong> 450mg/l (Table 4.2b) <strong>and</strong> from 200 to 800mg/l indeep ground water with average value <strong>of</strong> 448mg/l (Table 4.3c). WHO (1996) has setpermissible limit <strong>of</strong> 250mg/l for HCO - 3 , therefore, majority <strong>of</strong> the samples containedelevated concentrations <strong>of</strong> HCO 3-.Light ElementsCalcium (Ca)Calcium is the most common alkaline earth metal, found in + 2 oxidation state.Calcium is important constituent <strong>of</strong> igneous rocks minerals e.g., plagioclase, pyroxene<strong>and</strong> amphibole. As large numbers <strong>of</strong> minerals contain Ca therefore, this element isplentiful in soil <strong>and</strong> water. Besides natural sources fertilizers also contribute to Ca in soil<strong>and</strong> water (Perk, 2006).60
Impacts on humansHuman body stores its 99 % <strong>of</strong> Ca in bones <strong>and</strong> teeth; remaining 1 % regulatesimportant physiological functions like vascular <strong>and</strong> muscular contraction, nervetransmission <strong>and</strong> blood clotting. Inadequate Ca intake may results in nephrolithiasis(kidney stone), colorectal cancer, osteoporosis, hypertension <strong>and</strong> obesity (WHO, 2005).High intake calcium is suggested to reduce the chances <strong>of</strong> Ca resorption <strong>and</strong> bone loss(Gulliement et al, 2000), however, some studies conclude that elevated Ca reduce theabsorption <strong>of</strong> other essential elements (WHO a , 2009).Surface water <strong>of</strong> the study area contained 39mg/l <strong>of</strong> average Ca content with arange <strong>of</strong> 6 to 85mg/l (Table 4.3a). Sample from the stream at Jamal Garhi (85mg/l)showed Ca above WHO (2004) permissible limit <strong>of</strong> 75mg/l (Fig.4.1a). Majority <strong>of</strong>shallow ground water samples were found with elevated level <strong>of</strong> Ca, with a range <strong>of</strong> 3to137mg/l <strong>and</strong> average content <strong>of</strong> 63mg/l (Table 4.3b, Fig.4.1b). Calcium content in thedeep ground water varied from 2 to 111mg/l with average value <strong>of</strong> 41mg/l (Table 4.3c).Samples from Mian Kali (111mg/l) <strong>and</strong> Jalalabad (76mg/l) were having high Ca content(Fig.4.1c).Magnesium (Mg)Magnesium forms about 2.5% <strong>of</strong> the earth’s crust. Two common sources <strong>of</strong> Mgare dolomite <strong>and</strong> magnesite minerals. Due to high reactivity, Mg readily combines withother elements therefore, not occurs in free state (Uttley, 2000). Magnesium is also61
important component <strong>of</strong> nuts, beans, green leaf vegetables <strong>and</strong> sea foods (Pressman <strong>and</strong>Buff, 2000).Impacts on humansMagnesium is the most abundant cation in human body. Magnesium formsc<strong>of</strong>actor <strong>of</strong> 350 enzymes <strong>and</strong> involved in protein synthesis <strong>and</strong> nucleic acid synthesis.Severe Mg deficiency leads to Hypomagnesaemia <strong>and</strong> reduce insulin sensitivity resultingin mellitus diabetes (WHO a , 2009). High concentration <strong>of</strong> Mg helps against hypertension<strong>and</strong> cardiovascular diseases (Simons-Morton et al., 1997).Average concentration <strong>of</strong> Mg in surface water was 9mg/l with a range <strong>of</strong> 0 to39mg/l (Table 4.3a). WHO (2004) suggested limit for Mg in drinking water is 50mg/l <strong>and</strong>all the samples from surface water were within permissible limit (Fig. 4.2a). Shallowground water samples were having Mg in range <strong>of</strong> 0 to 35mg/l with average content <strong>of</strong>13mg/l (Table 4.3b). All <strong>of</strong> the shallow water samples were having Mg withinpermissible limit (Fig.4.2b). Deep ground water samples had Mg in range <strong>of</strong> 2 to 56mg/lwith an average value <strong>of</strong> 17mg/l (Table 4.3c). Deep water samples also contained Mgbelow permissible limit except samples from Jalala (55mg/l) <strong>and</strong> Sowkai (56mg/l)(Fig.4.2c).Sodium (Na)Sodium is the sixth abundant element on Earth’s crust (2.83%). Salts <strong>of</strong> Na arereadily soluble in water <strong>and</strong> are, therefore, found in both surface <strong>and</strong> ground water.Sodium forms essential component <strong>of</strong> all most every food product in the form <strong>of</strong> sodium62
chloride. Its shortages may lead to dehydration, convulsion, muscle paralysis, decreasedgrowth <strong>and</strong> general numbness. Salts <strong>of</strong> Na are used in water treatment processes, in roadde icing, paper <strong>and</strong> soap industry: glass, pharmaceuticals, chemicals <strong>and</strong> food processing(NAS, 1980).Impacts on humansIn human body the sodium balance is controlled through complex system byNervous <strong>and</strong> Hormonal system (DNHW, 1992). High intake <strong>of</strong> table salt results in highblood pressure, arteriosclerosis, oedema (fluid accumulation in body) <strong>and</strong> hypetension.Other associated problems with high intake <strong>of</strong> Na include acute stress <strong>and</strong> body pain. Inacute stress condition Aldosterone is released which cause body inflammation <strong>and</strong> Naaccumulation in kidney tissues (Wilson, 1992).Sodium concentration in surface water <strong>of</strong> the study area ranged from 50 to 565mg/l with an average content <strong>of</strong> 271mg/l (Table 4.3a). Majority <strong>of</strong> the samples werehaving Na above the WHO (2004) limit <strong>of</strong> 200mg/l. High concentrations <strong>of</strong> Na werefound in surface water from Par Hoti (278mg/l), Sangi Murmur (247mg/l), SangiMurmur(565mg/l), Shahbaz Garhi (280mg/l), M<strong>and</strong>ut (344mg/l), Saidabad (560mg/l) ,Saidabad (311mg/l), Parkho (282mg/l), Lund Khawr (262mg/l), Toru (315mg/l) <strong>and</strong> nearRisalpur (328mg/l), (Fig.4.3a). Shallow ground water sources had average Naconcentration <strong>of</strong> 318mg/l with minimum concentration <strong>of</strong> 91mg/l <strong>and</strong> maximum <strong>of</strong>616mg/l (Table 4.3b). Samples with relatively elevated concentration were from Garakol(321mg/l), Jh<strong>and</strong>ai (489mg/l), Pump Korona (368mg/l), Takkar(355mg/l), Jalala(459mg/l), Shergarh (437mg/l), Lund Khwar (414mg/l), Chin B<strong>and</strong>a (550mg/l), Pirabad63
near Jamal Garhi (367mg/l), Ghundo (616mg/l), Khairabad (372mg/l) <strong>and</strong> Kundurvillage (526mg/l) (Fig.4.3b). Sodium concentration in samples from deep ground watersources ranged from 131 to 586mg/l with an average value <strong>of</strong> 331mg/l (Table 4.3c).Samples with elevated concentrations <strong>of</strong> Na were found in Hoti Kali (324mg/l), Chankaristop (529mg/l), Gujar Garhi(422mg/l), Takht Bhai (373mg/l), Jalala (586mg/l), JamalGarhi (562mg/l), Sheikh Maltoon Town (357mg/l), Torru (292mg/l), Sowkai (472mg/l),(Fig.4.3c).Potassium (K)Potassium is essential element <strong>and</strong> present in all animals <strong>and</strong> plants tissues.Wastewater from different industries has potassium at several hundred to severalthous<strong>and</strong> mg/l. Groundwater normally contains low K concentration, but in s<strong>and</strong>y soilleaching <strong>of</strong> wastewater results in higher values (Kumar <strong>and</strong> Kookna, 2006).Impacts on humansPotassium play important role in the regulation <strong>of</strong> various important bodyfunctions e.g., normal functioning <strong>of</strong> nerve cells, heart beat, kidney functions, musclescontraction <strong>and</strong> secretion <strong>of</strong> juice in stomach (Akhter et al., 2003). Adverse healthimpacts from high potassium intake in water include chest tightness, nausea, vomiting,diarrhea, hyperkalamia, shortening <strong>of</strong> breath <strong>and</strong> heart failure (WHO a , 2009).The concentration <strong>of</strong> K ranged from 1 to 3mg/l in surface water with averagevalue <strong>of</strong> 2mg/l (Table 4.3a), from 0 to 10mg/l in shallow ground water with averagevalue <strong>of</strong> 3mg/l (Table 4.3b) <strong>and</strong> from 1 to10mg/l with average value <strong>of</strong> 5mg/l in deep64
ground water samples respectively (Table 4.3c). WHO (2004) suggested a permissiblelimit <strong>of</strong> 10 to15 mg/l for K in drinking water. All the samples <strong>of</strong> surface, shallow <strong>and</strong>deep water were found within permissible limit.Heavy <strong>and</strong> Trace ElementsIron (Fe)Iron is the fourth most abundant element on earth’s crust <strong>and</strong> is involved invarious important environmental processes. Two dominants form <strong>of</strong> iron are, Ferrous ion(Fe +2 ) less water soluble than Ferric ion (Fe +3 ). Under some geological conditions like inmafic, ultramafic rocks <strong>and</strong> meteorites, elemental Fe may be found. Due to its electrondonor capacity Fe occurs in many compounds (Read, 1970).Impacts on humansFe is the main component <strong>of</strong> haemoglobin <strong>and</strong> myglobin, its deficiency results inanemia. Iron has significant role in glucose metabolism <strong>and</strong> transportation <strong>of</strong> oxygen <strong>and</strong>electrons (Peter, 2000). Folic acid is supposed to reduce the risk <strong>of</strong> colon <strong>and</strong> rectumcancer (Willett, et al,. 1990). Excessive intake <strong>of</strong> Fe can cause small intestine infection(Bhattacharjee, 2001) <strong>and</strong> secondary hemochromtosis in which iron gets accumulated inliver <strong>and</strong> heart, even death in young children (Bothwell et al,.1979).Average concentration <strong>of</strong> Fe in surface water was 98.57µg/l with a range <strong>of</strong>
having 497.50µg/l <strong>of</strong> Fe from Sirai (W-35) <strong>and</strong> 356.00µg/l from Bakhshali (W-14),(Fig.4.5a). Shallow ground water contained Fe in range <strong>of</strong>
vision <strong>and</strong> Mn pneumonia <strong>and</strong> direct ingestion results in gastrointestinal irritation (Cover,1997).Surface water <strong>of</strong> study area had Mn in the range <strong>of</strong> 2 to 71µg/l with an averageconcentration <strong>of</strong> Mn is 23µg/l (Table 4.4a). Samples from M<strong>and</strong>at (W-8), Bakhshali (W-14), <strong>and</strong> Malakabad (W-15) were having 62µg/l, 60µg/l <strong>and</strong> 71µg/l Mn respectivelyabove the USEPA (2009) <strong>and</strong> WHO (2004) permissible limits <strong>of</strong> 50µg/l for drinkingwater (Fig.4.6a). Shallow ground water showed Mn in a range <strong>of</strong> 2 to 78µg/l withaverage content <strong>of</strong> 19µg/l (Table 4.4b). All the water samples from shallow groundsources contained Mn within the permissible limit except one sample No.W-6 fromZ<strong>and</strong>o Kali (78 µg/l), (Fig.4.6b). Similarly Mn in deep ground water <strong>of</strong> the study areavaried from 2 to 132µg/l with average value <strong>of</strong> 30µg/l (Table 4.4c). One sample (W-3)had 132µg/l <strong>of</strong> Mn above permissible limit (Fig.4.6c). Figure 4.15b showed thedistribution pattern <strong>of</strong> Mn concentration in the water <strong>of</strong> <strong>Mardan</strong> District. It was clearedfrom the map that major part <strong>of</strong> the District had uniform distribution <strong>of</strong> Mn except acluster <strong>of</strong> relatively high concentration was found in the southern part (Fig.4.15b)Copper (Cu)Copper is present on the earth in iron sulfide <strong>and</strong> copper sulfides ores in lowconcentration, through metallurgical process Cu is extracted (Sievers <strong>and</strong> Meyer, 2003).Its major uses include electrical equipments, coins, utensils, building materials,fungicides, algaecides <strong>and</strong> fertilizers etc. Aquatic environment contains Cu in Cu + statesin the form <strong>of</strong> complexes or particulates (ATSDR, 2002).67
Impacts on humansCu is an essential element for many physiological processes but elevatedconcentrations may pose threats to biological communities. In humans low dose results insimple food poisoning, however, large amount causes heptocellular toxicity,methaemoglobinemia, intravascular haemolysis, kidney failure <strong>and</strong> gastrointestinalbleeding (Agarwal et al., 1993). In another genetic disorder “Wilson disease” body failsto absorb Cu which ultimately gets accumulation in different body tissues <strong>of</strong> liver, eyes<strong>and</strong> brain, damaging these organs (NDDIC, 2009).Copper was found in surface water within the range <strong>of</strong> 5 to 4838µg/l <strong>and</strong> averagevalue <strong>of</strong> 400µg/l (Table 4.4a). According to WHO (2004) <strong>and</strong> USEPA (2009),permissible limit for Cu is 2000µg/l <strong>and</strong> 1000µg/l respectively. Only one sample (W-35)from Upper Swat Canal branch near Sirai showed high value <strong>of</strong> 4838µg/l (Fig.4.7a).Shallow ground water had an average Cu concentration in a range <strong>of</strong> 1 to 2496µg/l withaverage value <strong>of</strong> 282µg/l (Table 4.4b). Samples from Chin B<strong>and</strong>a (W-36) <strong>and</strong> ChingaiBaba (W-51) had Cu above permissible limit with concentration <strong>of</strong> 2496µg/l <strong>and</strong> 2236µg/respectively (Fig.4.7b). Copper concentration in the deep water ranged from 18 to846µg/l with average value <strong>of</strong> 113µg/l (Table 4.4c). Cu concentration in all deep watersamples was found within permissible limit <strong>of</strong> WHO (Fig.4.7c). Distribution <strong>of</strong> Cu in thewater samples <strong>of</strong> <strong>Mardan</strong> District was showed in Figure 4.15c, based on GIS. Only asmall area in Sirai in the northern part <strong>of</strong> <strong>Mardan</strong> District showed relatively highconcentration <strong>of</strong> Cu (Fig.4.15c).68
Lead (Pb)In water Pb is found either in dissolved form or as a waterborne particle. Leadoccurs in + 1, + 2 oxidation states; its high persistence <strong>and</strong> stability make it more significantregarding health (Murugesan et al., 2006; Kobya et al., 2005). Generally all sources <strong>of</strong>water are free <strong>of</strong> Pb contamination, but corrosion <strong>of</strong> pipes makes water susceptible for Pbcontamination. Alkalinity, temperature, pH <strong>and</strong> DO are major controlling factors in Pbcorrosion (AWWA, 1996).Impacts on humansLead has both carcinogenic <strong>and</strong> teratogenic properties <strong>and</strong> adversely effectsyoung children through lowering their Neuropsychological <strong>and</strong> Neurobehavioraldevelopment (Needlemen <strong>and</strong> Bellinger, 1991). After entering human body 99% <strong>of</strong> Pbgets bound to red blood cells, remaining 1% with plasma. In adults its toxicity rangesfrom carcinogenesis to high blood pressure <strong>and</strong> also dental caries scores (Curzen <strong>and</strong>Bibby, 1970). Similarly Pb is capable <strong>of</strong> crossing placenta resulting in prematurity, intrausterine death <strong>and</strong> low weight birth (Papanikolaou et al., 2005).In surface water <strong>of</strong> study area, average concentration <strong>of</strong> Pb was found as9.424µg/l with a wide range <strong>of</strong>
3.660µg/l with minimum value <strong>of</strong>
(2009), permissible limit <strong>of</strong> Zn in drinking water is 3000 µg/L <strong>and</strong> 5000 µg/lrespectively. Only one sample (W-26) from Swat Canal in Takkar with a concentration <strong>of</strong>3058µg/l showed relatively high concentration (Fig.4.9a). Shallow ground showedaverage concentration <strong>of</strong> 744µg/l with a range from
the major cause <strong>of</strong> lung <strong>and</strong> nasal cancer, however, this problem is not reported in case <strong>of</strong>metallic Ni (Liesegang et al., 1993).Average Ni concentration in surface water samples was found as 6.66µg/l with arange from 1.40 to 22.39µg/l (Table 4.4a). WHO (2004) <strong>and</strong> USEPA (2009) has setpermissible limit for Ni as 20µg/l <strong>and</strong> 100µg/l respectively in drinking water, Only onesample (W-15) from Malkabad was having Ni concentration (22.39µg/l) above WHOpermissible limit (Fig. 4.10a). Shallow <strong>and</strong> deep ground water showed Ni concentrationin the range <strong>of</strong> 1.27 to 19.01µg/l <strong>and</strong> 0.81 to 20µg/l with average concentrations 4.87µg/l<strong>of</strong> 3.48µg/l respectively (Table 4.4b <strong>and</strong> c respectively). All most all samples fromshallow <strong>and</strong> deep ground water were having Ni concentration below WHO (2004)(Fig.4.10b <strong>and</strong> c respectively). GIS based distribution map <strong>of</strong> Ni for water <strong>of</strong> <strong>Mardan</strong>District was prepared as showed in Figure 4.15f. From this map, it is cleared that low Niconcentration was homogenously distributed. However, relatively high concentration wasfound along eastern, western, northern <strong>and</strong> southern boundaries (Fig.4.15f).Chromium (Cr)Chromium does not occur free in nature <strong>and</strong> its most common form is chromate.Natural water contains chromium in two oxidation states Cr +3 <strong>and</strong> Cr +6 , however, Cr +6 isfound at higher concentration as its salts are more soluble than those <strong>of</strong> Cr +3 . In surfacewaters the average concentration <strong>of</strong> Cr range from 0.5-2µg/l <strong>and</strong> ground water havingconcentration less than 1µg/l (USEPA, 1987).72
Impacts on humansNaturally soil <strong>and</strong> water has little amount <strong>of</strong> Cr but elevation in concentration canbe result <strong>of</strong> anthropogenic sources. Chromium is used in the manufacturing <strong>of</strong> chromecolors, cements, fungicides, wood preservatives, electroplating <strong>and</strong> tannery industries(Kotas <strong>and</strong> Stasicka, 2000). Both forms <strong>of</strong> Cr differ in their geochemical <strong>and</strong> toxicologyproperties, as Cr +3 are essential to mammals for lipid <strong>and</strong> protein metabolism. On otherh<strong>and</strong> salts <strong>of</strong> Cr +6 are toxic (Kornhauser et al., 2002). It has been reported that chromateat level <strong>of</strong> 1-5gm can cause sever health problems like gastrointestinal problems,haemorrhagic diathesis <strong>and</strong> even death due to cardiovascular disorders. Genotoxic effects(chromosomal aberrations) <strong>and</strong> lung cancer is observed in the workers due to theirexposure to Cr +6 (Janus <strong>and</strong> Krajnc, 1990).Chromium concentration in the surface water ranged from
Cadmium (Cd)Cadmium is metal with + 2 oxidation state. It is found in sulfide ores along zinc<strong>and</strong> lead due to its similar behavior like zinc. Cadmium has no significant nutritionalvalue but is important in many industrial applications such as fertilizers production,electrodes, batteries, pigments in plastics <strong>and</strong> PVC products etc. (Toppi <strong>and</strong> Gabbrielli,1999).Impacts on humansHuman kidney is the most sensitive organ to Cd toxicity. Chronic oral exposureresults in itai-itai disease <strong>and</strong> Tubular Proteinaria in which the resorption capacity <strong>of</strong>tubules is reduced resulting excretion <strong>of</strong> low weight protein, glucose, enzymes <strong>and</strong>Amino acids. Sometimes lose <strong>of</strong> essential constituents results in many physiologicalchanges like bone disease called Osteoporosis (Krajnc et al., 1987).Average concentration <strong>of</strong> Cd in surface water was as found 0.764µg/l with arange <strong>of</strong>
Arsenic (As)Arsenic a ubiquitous element, forming 20 th most abundant element <strong>of</strong> earth. It ispart <strong>of</strong> about 200 different minerals, 60% <strong>of</strong> those are in the form <strong>of</strong> arsenates (Onisha,1969). Inorganic arsenic is found in As (III) which is most toxic <strong>and</strong> mobile form than As(IV): Organic As is mainly found in Methylated form (Bowell, 1994).Impacts on humansChronic arsenicosis is the most prevalent problem especially in south Asiancountries. Its chronic effects in human beings commonly include skin diseases (e.g.,pigmentation, dermal hyperkeratosis, skin cancer), <strong>and</strong> many cardiovascular,neurological, hematological, renal <strong>and</strong> respiratory disorders which may effect lungs,bladder, liver, <strong>and</strong> kidney (Morton <strong>and</strong> Dunette, 1994; Smith et al., 1999), as arsenic isaccumulated in hair, nails, skin <strong>and</strong> bones (Karagas et al., 2000).Surface water sources from the study area showed As concentrations in the range<strong>of</strong> 0.284 to 1.579µg/l with average concentration <strong>of</strong> 0.751µg/l (Table 4.4a; Fig.4.13a).Concentration <strong>of</strong> As in shallow ground water sample varied from 0.000 to 7.780µg/l withaverage value <strong>of</strong> 0.893µg/l (Table 4.4b) <strong>and</strong> from 0.0459 to 2.896µg/l with an averagecontent <strong>of</strong> 0.864µg/l in deep ground water respectively (Table 4.4c). WHO (2004) has seta permissible limit <strong>of</strong> 10µg/l <strong>and</strong> 5µg/l by USEPA (2009). Only one sample from Dugwell <strong>of</strong> Garhi Kapora (7.780µg/l) had high value <strong>of</strong> As. The distribution map <strong>of</strong> As in the<strong>Mardan</strong> District was showed as GIS based contour diagram (Fig.4.15i). It was clearlyindicated that the area in premises <strong>of</strong> Ghari Kapora in the southern part <strong>of</strong> District washaving relatively high concentration <strong>of</strong> Arsenic (4.15i).75
Table 4.1a. Physical parameters <strong>of</strong> Surface water <strong>of</strong> <strong>Mardan</strong> DistrictSample Source LocationTemp˚C pHConductivityµS/cmTDSmg/lTurbidityNTUW-1 Kalpani Nalla Par hoti bridge 28 6.9 542 288 3.60W-4 Seasonal stream Sangi Murmur 29 7.1 583 307 8.00W-5 Seasonal stream Sangi Murmur 26 7.0 809 430 0.10W-7 Seasonal stream Shahbaz Garhi 30 6.8 489 261 8.60W-8 Irrigational M<strong>and</strong>at 30 7.0 501 269 11.50W-11 Stream Saidabad307.2 678 365 2.20W-13 Seasonal stream Bakhshali 28 7.1 460 246 5.30W-14 Irrigational Bakhshali 29 6.8 132 70 25.00W-15 Irrigational Malakabad 30 7.2 203 110 24.00W-18 Kalpani Nalla Kul 21 7.7 506 262 14.00W-21 Seasonal streamSaidabad(Takht bhai)208.0 1876 282 3.40W-22 Seasonal stream Saidabad 22 7.3 455 240 4.70W-26 Swat canal Takkar 20 7.3 243 122 7.50W-28 Jalala stream Parkho 23 7.8 503 265 8.90W-32 Seasonal stream Lund Khwar 24 7.3 436 246 7.90W-35 Swat canal Sirai187.5 176 100 0.60W-44 Seasonal stream Jamal Garhi217.3 473 250 7.40W-47 Kalpani Nalla Rustam 27 7.7 387 206 0.70W-54 Kalpani Nalla Toru 21 7.4 500 263 3.50W-59 Kalpani Nalla Near Risalpur 23 7.5 500 270 10.00Minimum 18 6.8 132 70 0.10Maximum 30 8.0 1876 430 25.00Average257.3 522 242 7.85WHO 6.5-8.5
Table 4.1b. Physical parameters <strong>of</strong> Shallow ground water <strong>of</strong> <strong>Mardan</strong> DistrictSample Source LocationTemp˚C pHConductivityµS/cmTDSmg/lTurbidityNTUW-6 Dug well Z<strong>and</strong>o kali 27 6.9 850 451 13.40W-12 Dug well Garakol 26 7.2 1442 767 0.20W-16 H<strong>and</strong> pump Gujar Garhi 23 7.0 647 344 8.60W-19 H<strong>and</strong> pump Jh<strong>and</strong>ai 22 7.5 210 270 23.00W-20 Dug well Jh<strong>and</strong>ai 22 7.0 1373 736 1.20W-23 H<strong>and</strong> pump Pump Korona 25 6.7 740 400 0.40W-24 H<strong>and</strong> pump Takht Bhai 24 6.8 1123 605 0.10W-27 H<strong>and</strong> pump Takkar 23 8.4 209 112 0.20W-30 H<strong>and</strong> pump Jalala 25 7.0 2200 1220 1.70W-31 H<strong>and</strong> pump Sergarh 24 7.1 639 343 0.30W-33 H<strong>and</strong> pump Lund Khawr 23 6.8 660 352 0.90W-34 H<strong>and</strong> pump Chil 24 6.8 420 225 14.80W-36 Dug well Chin B<strong>and</strong>a 22 7.0 912 482 3.30W-37 H<strong>and</strong> pumpPir Abad(Jamal garhi) 25 6.8 695 370 13.80W-38 Dug well Jamal Garhi 23 6.7 746 396 0.60W-39 H<strong>and</strong> pump Katlang 22 6.8 608 327 0.40W-41 H<strong>and</strong> pump Ghundo 23 6.7 630 333 1.60W-46 H<strong>and</strong> pump Spainkai 22 6.8 429 233 1.40W-48 H<strong>and</strong> pump Rustam 20 6.9 241 206 0.70W-49Artesianwell Rustam 25 7.6 317 125 0.40W-51 Spring Chingai Baba 24 6.3 154 82 0.10W-52 H<strong>and</strong> pump Khairabad 20 7.0 578 305 0.10W-56 H<strong>and</strong> pump Kundr 25 7.4 1451 755 1.50W-57 Dug well Garhi Kapora 24 7.7 1879 1000 15.00W-58 H<strong>and</strong> pump Ch<strong>and</strong>ur 24 7.3 625 332 2.70Minimum 20 6.3 154 82 0.10Maximum 27 8.4 2200 1220 23.00Average 23 7.0 791 430 4.26WHO 6.5-8.5
Table 4.1c. Physical parameters <strong>of</strong> Deep ground water <strong>of</strong> <strong>Mardan</strong> DistrictSample Source LocationTemp˚CpHConductivityµS/cmTDSmg/lTurbidityNTUW-2 Bore water Hoti kali 26 7.2 542 288 4.80W-3 Bore water Hoti kali 25 7.2 1496 805 27.70W-9 Tube well Chankari stop 15 7.3 913 495 0.20W-10 Tube well Chankari stop 25 7.5 904 496 1.30W-17 Tape water Gujar Garhi 20 7.6 567 310 0.30W-25 Tape water Takht Bhai 23 7.6 590 340 0.20W-29 Bore water Jalala 25 7.2 1148 612 0.90W-40 Bore water Katlung 25 7.0 535 281 0.70W-42 Tape water Mian Kali 21 7.2 488 258 0.10W-43 Tape water Babuzai 22 7.2 430 230 0.20W-45 Tape water Jamal Garhi 20 7.3 808 430 0.30W-50 Tube well Jalal ababd 23 6.7 492 261 0.60SheikhW-53 Bore water Multon 22 8.0 738 395 1.20W-55 Bore water Toru 24 7.5 260 142 0.00W-60 Tape water Sowkai 26 7.9 325 168 0.50Minimum 15 6.7 260 142 0.00Maximum 26 8.0 1496 805 27.70Average 23 7.3 656 367 2.60WHO 6.5-8.5
Table 4.2a. Anions concentration in Surface water <strong>of</strong> <strong>Mardan</strong> DistrictSample Source LocationSulfatemg/lNitratemg/lChloridemg/lBicarbonatemg/lW-1 Kalpani Nalla Par hoti bridge 25 2.30 1 200W-4 Seasonal stream Sangi Murmur 16
Table 4.2b. Anions concentration in Shallow ground water <strong>of</strong> <strong>Mardan</strong> DistrictSample Source LocationSulfatemg/lNitratemg/lChloridemg/lBicarbonatemg/lW-6 Dug well Z<strong>and</strong>o kali 42 2.50 16 440W-12 Dug well Garakol 52
Table 4.2c. Anions concentration in Deep ground water <strong>of</strong> <strong>Mardan</strong> DistrictSample Source LoactionSulfatemg/lNitratemg/lChloridemg/lBicarbonatesmg/lW-2 Bore water Hoti kali250 5.80 96 460W-3 Bore water Hoti kaliW-9 Tube well Chankari stopW-10 Tube well Chankari stopW-17 Tape water Gujar Garhi135 7.80 73 50070 4.00 50 44069
Table 4.3a. Light elements concentration in Surface water <strong>of</strong> <strong>Mardan</strong> DistrictSample Source LocationCamg/lMgmg/lNaMg/lW-1 Kalpani Nalla Par hoti bridge 46 38 278 3W-4 Seasonal stream Sangi Murmur 50 10 247 3W-5 Seasonal stream Sangi Murmur 24 6 565 1W-7 Seasonal stream Shahbaz Garhi 28 7 280 3W-8 Seasonal stream M<strong>and</strong>at 10 7 344 3W-11 Seasonal stream Saidabad 15 8 560 2W-13 Seasonal stream Bakhshali 33 6 215 3W-14 Irrigational Bakhshali 46 5 145 1W-15 Irrigational Malakabad 19 1 157 3W-18 Kalpani Nalla Kul 49 18 324 2SaidabadW-21 Seasonal stream (Takht bahi) 43 39 50 2W-22 Seasonal stream Saidabad 74 10 311 2W-26 Swat canal Takkar 51 2 184 2W-28 Jalala stream Parkho 22 0 282 2W-32 Seasonal stream Lund Khwar 57 9 262 2W-35 Swat canal Sirai 6 0 146 1W-44 Seasonal stream Jamal Garhi 85 6 228 2W-47 Kalpani Nalla Rustam 44 0 197 3W-54 Kalpani Nalla Toru 34 2 315 2W-59 Kalpani Nalla near Risalpur 43 6 328 3Minimum 6 0 50 1Maximum 85 39 565 3Average 39 9 271 2WHO 75 50 200 15Kmg/l82
Table 4.3b. Light elements concentration in Shallow ground water <strong>of</strong> <strong>Mardan</strong>DistrictSample Source LocationCamg/lMgmg/lNamg/lKmg/lW-6 Dug well Z<strong>and</strong>o kali 44 7 427 10W-12 Dug well Garakol 20 19 321 4W-16 H<strong>and</strong> pump Gujar Garhi 85 17 269 3W-19 H<strong>and</strong> pump Jh<strong>and</strong>ai 27 19 489 5W-20 Dug well Jh<strong>and</strong>ai 82 11 219 6W-23 H<strong>and</strong> pump Pump Korona 129 4 368 4W-24 H<strong>and</strong> pump Takht Bhai 118 25 193 2W-27 H<strong>and</strong> pump Takkar 28 3 355 3W-30 H<strong>and</strong> pump Jalala 51 35 459 7W-31 H<strong>and</strong> pump Shergarh 39 13 437 2W-33 H<strong>and</strong> pump Lund Khawr 55 15 414 2W-34 H<strong>and</strong> pump Chil 75 6 158 1W-36 Dug well Chin B<strong>and</strong>a 59 31 550 3W-37 H<strong>and</strong> pumpPir Abad(Jamal garhi) 84 19 367 1W-38 Dug well Jamal Garhi 137 20 181 2W-39 H<strong>and</strong> pump Katlang 82 16 227 2W-41 H<strong>and</strong> pump Ghundo 109 4 616 1W-46 H<strong>and</strong> pump Spainkai 85 2 147 0W-48 H<strong>and</strong> pump Rustam 80 3 186 4W-49 Artesian well Rustam 37 10 190 2W-51 Spring Chingai Baba 8 0 210 1W-52 H<strong>and</strong> pump Khairabad 47 3 372 2W-56 H<strong>and</strong> pump Kundr 38 16 526 3W-57 Dug well Garhi Kapora 3 10 120 1W-58 H<strong>and</strong> pump Ch<strong>and</strong>ur 50 7 91 3Minimum 3 0 91 0Maximum 137 35 616 10Average 63 13 318 3WHO 75 50 200 1583
Table 4.3c. Light elements concentration in Deep ground water <strong>of</strong> <strong>Mardan</strong> DistrictSample SourceW-2 Bore waterW-3 Bore waterW-9 Tube wellW-10 Tube wellLocationCamg/lMgmg/lNamg/lKmg/lHoti kali 40 25 324 10Hoti kali 25 21 210 10Chankari stop 46 8 131 6Chankari stop 59 9 529 6W-17 Tape water Gujar Garhi 13 7 422 5W-25 Tape water Takht Bhai 17 23 373 5W-29 Bore water Jalala 46 55 586 5W-40 Bore water Katlung 71 12 200 1W-42 Tape water Mian Kali 111 2 158 1W-43 Tape water Babuzai 72 10 164 1W-45 Tape water Jamal Garhi 36 24 562 6W-50 Tube well Jalal ababd 76 3 188 3W-53 Bore water Sheikh Multon 2 9 357 3W-55 Bore water Toru 4 2 292 5W-60 Tape water Sowkai 5 56 472 3Minimum 2 2 131 1Maximum 111 56 586 10Average 41 18 331 5WHO 75 50 200 1584
Table 4.4a. Trace <strong>and</strong> heavy elements concentration in Surface water <strong>of</strong> <strong>Mardan</strong>DistrictSample Source LocationFeµg/lMnµg/lCuµg/lPbµg/lZnµg/lNiµg/lCrµg/lCdµg/lAsµg/lW-1KalpaniNalla Par hoti 8.47 2 23
Table 4.4b. Trace <strong>and</strong> heavy elements concentration in Shallow ground water <strong>of</strong><strong>Mardan</strong> DistrictSample Source LocationFeµg/lMnµg/lCuµg/lPbµg/lZnµg/lNiµg/lCrµg/lCdµg/lAsµg/lW-6 Dug well Z<strong>and</strong>o kali 48.05 78 37 0.344 1013 3.07
Table 4.4c. Trace <strong>and</strong> heavy elements concentration in Deep ground water <strong>of</strong><strong>Mardan</strong> DistrictSample Source LocationFeµg/lMnµg/lCuµg/lPbµg/lZnµg/lNiµg/lCrµg/lCdµg/lAsµg/lW-2 Bore water Hoti kali 13.38 19 23
Ca (mg/l)9080706050403020100W-1W-4W-5W-7W-8W-11W-13W-14W-15W-18W-21W-22W-26W-28W-32W-35W-44W-47W-54W-59WHOSamplesFig. 4.1a. Calcium (Ca) concentration (mg/l) in Surface water <strong>of</strong> <strong>Mardan</strong> DistrictCa (mg/l)140120100806040200W-6W-12W-16W-19W-20W-23W-24W-27W-30W-31W-33W-34W-36W-37W-38W-39W-41W-46W-48W-49W-51W-52W-56W-57W-58WHOSamplesFig. 4.1b. Calcium (Ca) concentration (mg/l) in Shallow ground water <strong>of</strong> <strong>Mardan</strong>District120100Ca (mg/l)806040200W-2W-3W-9W-10W-17W-25W-29W-40W-42W-43W-45W-50W-53W-55W-60WHOSamplesFig. 4.1c. Calcium (Ca) concentration (mg/l) in Deep ground water <strong>of</strong> <strong>Mardan</strong>District88
5040Mg (mg/l)3020100W-1W-4W-5W-7W-8W-11W-13W-14W-15W-18W-21W-22W-26W-28W-32W-35W-44W-47W-54W-59WHOSamplesFig. 4.2a. Magnesium (Mg) concentration (mg/l) in Surface water <strong>of</strong> <strong>Mardan</strong>District5040Mg (mg/l)3020100W-6W-12W-16W-19W-20W-23W-24W-27W-30W-31W-33W-34W-36W-37W-38W-39W-41W-46W-48W-49W-51W-52W-56W-57W-58WHOSamplesFig. 4.2b. Magnesium (Mg) concentration (mg/l) in Shallow ground water <strong>of</strong><strong>Mardan</strong> District6050Mg (mg/l)403020100W-2W-3W-9W-10W-17W-25W-29W-40W-42W-43W-45W-50W-53W-55W-60WHOSamplesFig. 4.2c. Magnesium (Mg) concentration (mg/l) in Deep ground water <strong>of</strong> <strong>Mardan</strong>District89
600500Na (mg/l)4003002001000W-1W-4W-5W-7W-8W-11W-13W-14W-15W-18W-21W-22W-26W-28W-32W-35W-44W-47W-54W-59WHOSamplesFig. 4.3a. Sodium concentration (mg/l) in Surface water <strong>of</strong> <strong>Mardan</strong> DistrictNa (mg/l)7006005004003002001000W-6W-12W-16W-19W-20W-23W-24W-27W-30W-31W-33W-34W-36W-37W-38W-39W-41W-46W-48W-49W-51W-52W-56W-57W-58WHOSamplesFig. 4.3b. Sodium (Na) concentration (mg/l) in Shallow ground water <strong>of</strong> <strong>Mardan</strong>District600500Na (mg/l)4003002001000W-2W-3W-9W-10W-17W-25W-29W-40W-42W-43W-45W-50W-53W-55W-60WHOSamplesFig. 4.3c. Sodium (Na) concentration (mg/l) in Deep ground water <strong>of</strong> <strong>Mardan</strong>District90
1512K (mg/l)9630W-1W-4W-5W-7W-8W-11W-13W-14W-15W-18W-21W-22W-26W-28W-32W-35W-44W-47W-54W-59WHOSamplesFig. 4.4a. Potassium (K) concentration (mg/l) in Surface water <strong>of</strong> <strong>Mardan</strong> District1512K (mg/l)9630W-6W-12W-16W-19W-20W-23W-24W-27W-30W-31W-33W-34W-36W-37W-38W-39W-41W-46W-48W-49W-51W-52W-56W-57W-58WHOSamplesFig. 4.4b. Potassium (K) concentration (mg/l) in Shallow ground water <strong>of</strong> <strong>Mardan</strong>District1512K (mg/l)9630W-2W-3W-9W-10W-17W-25W-29W-40W-42W-43W-45W-50W-53W-55W-60WHOSamplesFig. 4.4c. Potassium (K) concentration (mg/l) in Deep ground water <strong>of</strong> <strong>Mardan</strong>District91
Fe (ug/l)500450400350300250200150100500W-1W-4W-5W-7W-8W-11W-13W-14W-15W-18W-21W-22W-26W-28W-32W-35W-44W-47W-54W-59WHOUSEPASamplesFig. 4.5a. Iron (Fe) concentration (µg/l) in Surface water <strong>of</strong> <strong>Mardan</strong> DistrictFe (ug/l)180016001400120010008006004002000W-6W-12W-16W-19W-20W-23W-24W-27W-30W-31W-33W-34W-36W-37W-38W-39W-41W-46W-48W-49W-51W-52W-56W-57W-58WHOUSEPASamplesFig. 4.5b. Iron (Fe) concentration (µg/l) in Shallow ground water <strong>of</strong> <strong>Mardan</strong> District300250Fe (ug/l)200150100500W-2W-3W-9W-10W-17W-25W-29W-40W-42W-43W-45W-50W-53W-55W-60WHOUSEPASamplesFig. 4.5c. Iron (Fe) concentration (µg/l) in Deep ground water <strong>of</strong> <strong>Mardan</strong> District92
Mn (ug/l)80706050403020100W-1W-4W-5W-7W-8W-11W-13W-14W-15W-18W-21W-22W-26W-28W-32W-35W-44W-47W-54W-59WHOUSEPASamplesFig. 4.6a. Manganese (Mn) concentration (µg/l) in Surface water <strong>of</strong> <strong>Mardan</strong> DistrictMn (ug/l)80706050403020100W-6W-12W-16W-19W-20W-23W-24W-27W-30W-31W-33W-34W-36W-37W-38W-39W-41W-46W-48W-49W-51W-52W-56W-57W-58WHOUSEPASamplesFig. 4.6b. Manganese (Mn) concentration (µg/l) in Shallow ground water <strong>of</strong> <strong>Mardan</strong>District140120Mn (ug/l)100806040200W-2W-3W-9W-10W-17W-25W-29W-40W-42W-43W-45W-50W-53W-55W-60WHOUSEPASamplesFig. 4.6c. Manganese (Mn) concentration (µg/l) in Deep ground water <strong>of</strong> <strong>Mardan</strong>District93
50004000Cu (ug/l)3000200010000W-1W-4W-5W-7W-8W-11W-13W-14W-15W-18W-21W-22W-26W-28W-32W-35W-44W-47W-54W-59WHOUSEPSamplesFig. 4.7a. Copper (Cu) concentration (µg/l) in Surface water <strong>of</strong> <strong>Mardan</strong> District25002000Cu (ug/l)150010005000W-6W-12W-16W-19W-20W-23W-24W-27W-30W-31W-33W-34W-36W-37W-38W-39W-41W-46W-48W-49W-51W-52W-56W-57W-58WHOUSEPASamplesFig. 4.7b. Copper (Cu) concentration (µg/l) in Shallow ground water <strong>of</strong> <strong>Mardan</strong>District200017501500Cu (ug/l)125010007505002500W-2W-3W-9W-10W-17W-25W-29W-40W-42W-43W-45W-50W-53W-55W-60WHOUSEPASamplesFig. 4.7c. Copper (Cu) concentration (µg/l) in Deep ground water <strong>of</strong> <strong>Mardan</strong>District94
Pb (ug/l)35302520151050W-1W-4W-5W-7W-8W-11W-13W-14W-15W-18W-21W-22W-26W-28W-32W-35W-44W-47W-54W-59WHOUSEPASamplesFig. 4.8a. Lead (Pb) concentration (µg/l) in Surface water <strong>of</strong> <strong>Mardan</strong> DistrictPb(ug/l)35302520151050W-6W-12W-16W-19W-20W-23W-24W-27W-30W-31W-33W-34W-36W-37W-38W-39W-41W-46W-48W-49W-51W-52W-56W-57W-58WHOUSEPASamplesFig. 4.8b. Lead (Pb) concentration (µg/l) in Shallow ground water <strong>of</strong> <strong>Mardan</strong>District353025Pb (ug/l)20151050W-2W-3W-9W-10W-17W-25W-29W-40W-42W-43W-45W-50W-53W-55W-60WHOUSEPASamplesFig. 4.8c. Lead (Pb) concentration (µg/l) in Deep ground water <strong>of</strong> <strong>Mardan</strong> District95
50004000Zn (ug/l)3000200010000W-1W-4W-5W-7W-8W-11W-13W-14W-15W-18W-21W-22W-26W-28W-32W-35W-44W-47W-54W-59WHOUSEPSamplesFig. 4.9a. Zinc (Zn) concentration (µg/l) in Surface water <strong>of</strong> <strong>Mardan</strong> District50004000Zn (ug/l)3000200010000W-6W-12W-16W-19W-20W-23W-24W-27W-30W-31W-33W-34W-36W-37W-38W-39W-41W-46W-48W-49W-51W-52W-56W-57W-58WHOUSEPASamplesFig. 4.9b. Zinc (Zn) concentration (µg/l) in Shallow ground water <strong>of</strong> <strong>Mardan</strong>District50004000Zn (ug/l)3000200010000W-2W-3W-9W-10W-17W-25W-29W-40W-42W-43W-45W-50W-53W-55W-60WHOUSEPASamplesFig. 4.9c. Zinc (Zn) concentration (µg/l) in Deep ground water <strong>of</strong> <strong>Mardan</strong> District96
1009080706050403020100W-1W-4W-5W-7W-8W-11W-13W-14W-15W-18W-21W-22W-26W-28W-32W-35W-44W-47W-54W-59WHOUSEPANi (ug/l)SamplesFig. 4.10a. Nickel (Ni) concentration (µg/l) in Surface water <strong>of</strong> <strong>Mardan</strong> DistrictNi (ug/l)1009080706050403020100W-6W-12W-16W-19W-20W-23W-24W-27W-30W-31W-33W-34W-36W-37W-38W-39W-41W-46W-48W-49W-51W-52W-56W-57W-58WHOUSEPASamplesFig. 4.10b. Nickel (Ni) concentration (µg/l) in Shallow ground water <strong>of</strong> <strong>Mardan</strong>DistrictNi (ug/l)1009080706050403020100W-2W-3W-9W-10W-17W-25W-29W-40W-42W-43W-45W-50W-53W-55W-60WHOUSEPASamplesFig. 4.10c. Nickel (Ni) concentration (µg/l) in Deep ground water <strong>of</strong> <strong>Mardan</strong> District97
1009080706050403020100W-1W-4W-5W-7W-8W-11W-13W-14W-15W-18W-21W-22W-26W-28W-32W-35W-44W-47W-54W-59WHOUSEPACr (ug/l)SamplesFig. 4.11a. Chromium (Cr) concentration (µg/l) in Surface water <strong>of</strong> <strong>Mardan</strong> DistrictCr (ug/l)1009080706050403020100W-6W-12W-16W-19W-20W-23W-24W-27W-30W-31W-33W-34W-36W-37W-38W-39W-41W-46W-48W-49W-51W-52W-56W-57W-58WHOUSEPASamplesFig. 4.11b. Chromium (Cr) concentration (µg/l) in Shallow ground water <strong>of</strong> <strong>Mardan</strong>DistrictCr (ug/l)1009080706050403020100W-2W-3W-9W-10W-17W-25W-29W-40W-42W-43W-45W-50W-53W-55W-60WHOUSEPASamplesFig. 4.11c. Chromium (Cr) concentration (µg/l) in Deep ground water <strong>of</strong> <strong>Mardan</strong>District98
54Cd (ug/l)3210W-1W-4W-5W-7W-8W-11W-13W-14W-15W-18W-21W-22W-26W-28W-32W-35W-44W-47W-54W-59WHOUSEPASamplesFig. 4.12a. Cadmium (Cd) concentration (µg/l) in Surface water <strong>of</strong> <strong>Mardan</strong> District65Cd (ug/l)43210W-6W-12W-16W-19W-20W-23W-24W-27W-30W-31W-33W-34W-36W-37W-38W-39W-41W-46W-48W-49W-51W-52W-56W-57W-58WHOUSEPASamplesFig. 4.12b. Cadmium (Cd) concentration (µg/l) in Shallow ground water <strong>of</strong> <strong>Mardan</strong>District54Cd (ug/l)3210W-2W-3W-9W-10W-17W-25W-29W-40W-42W-43W-45W-50W-53W-55W-60WHOUSEPASamplesFig. 4.12c. Cadmium (Cd) concentration (µg/l) in Deep ground water <strong>of</strong> <strong>Mardan</strong>District99
As (ug/l)109876543210W-1W-4W-5W-7W-8W-11W-13W-14W-15W-18W-21W-22W-26W-28W-32W-35W-44W-47W-54W-59WHOUSEPASamplesFig. 4.13a. Arsenic (As) concentration (µg/l) in Surface water <strong>of</strong> <strong>Mardan</strong> DistrictAs(ug/l)109876543210W-6W-12W-16W-19W-20W-23W-24W-27W-30W-31W-33W-34W-36W-37W-38W-39W-41W-46W-48W-49W-51W-52W-56W-57W-58WHOUSEPASamplesFig. 4.13b. Arsenic (As) concentration (µg/l) in Shallow ground water <strong>of</strong> <strong>Mardan</strong>DistrictAs (ug/l)109876543210W-2W-3W-9W-10W-17W-25W-29W-40W-42W-43W-45W-50W-53W-55W-60WHOUSEPASamplesFig. 4.13c. Arsenic (As) concentration (µg/l) in Deep ground water <strong>of</strong> <strong>Mardan</strong>District100
Fig.4.14a. Piper diagram showing Surface water classification <strong>of</strong> <strong>Mardan</strong> District101
Fig.4.14b. Piper diagram showing Shallow ground water classification <strong>of</strong> <strong>Mardan</strong>District102
Fig.4.14c. Piper diagram showing Deep ground water classification <strong>of</strong> <strong>Mardan</strong>District103
Fig.4.15a. Map showing the Iron (Fe) concentration (µg/l) in water <strong>of</strong><strong>Mardan</strong> District104
Fig.4.15b. Map showing the Manganese (Mn) concentration (µg/l) in water <strong>of</strong><strong>Mardan</strong> District105
Fig.4.15c. Map showing the Copper (Cu) concentration (µg/l) in water <strong>of</strong><strong>Mardan</strong> District106
Fig.4.15d. Map showing the Lead (Pb) concentration (µg/l) in water <strong>of</strong><strong>Mardan</strong> District107
Fig.4.15e. Map showing the Zinc (Zn) concentration (µg/l) in water <strong>of</strong><strong>Mardan</strong> District108
Fig.4.15f. Map showing the Nickel (Ni) concentration (µg/l) in water <strong>of</strong><strong>Mardan</strong> District109
Fig.4.15g. Map showing the Chromium (Cr) concentration (µg/l) in water <strong>of</strong><strong>Mardan</strong> District110
Fig.4.15h. Map showing the Cadmium (Cd) concentration (µg/l) in water <strong>of</strong><strong>Mardan</strong> District111
Fig.4.15i. Map showing the Arsenic (As) concentration (µg/l) in water <strong>of</strong><strong>Mardan</strong> District112
CHAPTER 5SOIL CHEMISTRYSoil is a mixture <strong>of</strong> weathered rocks minerals; <strong>and</strong>, small living organismsincluding plants, animals <strong>and</strong> bacteria. Soil also contains water <strong>and</strong> air. The generalproportion is <strong>of</strong> 95 % inorganic <strong>and</strong> 5% organic constituents. Soil provides media to trapsolar energy in the form <strong>of</strong> plant biomass <strong>and</strong> then transfer it to higher level organismslater on. All the biogeochemical cycles are operated on the soil, recycling essentialelements in the environment. Soil differs from the regolith (rock fragments). In terms itsupports <strong>and</strong> bears living flora <strong>and</strong> fauna (Mckenzie <strong>and</strong> Susan, 2004). Verticaldistribution <strong>of</strong> matter in the soil is called horizons while the vertical arrangement <strong>of</strong>horizons form soil pr<strong>of</strong>iles (Wild, 1996).Soil FormationThe complex phenomena <strong>of</strong> soil formation can be simplified in two steps:weathering <strong>and</strong> addition <strong>of</strong> organics (Wild, 1996). Weathering is a biochemical processby which the parent rock is broken down into fragments by the action <strong>of</strong> water, gases <strong>and</strong>living mater (Mckenzie <strong>and</strong> Susan, 2004). After exposure <strong>of</strong> surface through variouschemical interactions e.g., hydrolysis <strong>of</strong> orthoclase, oxidation <strong>of</strong> ferrous iron, hydration<strong>and</strong> carbonation minerals are released (Wild, 1996). During all the mentioned processparent minerals are destructed <strong>and</strong> the elements pass from into suspension <strong>and</strong> solutions.Besides chemical dissolution, living organisms contributes to the weathering by the113
elease <strong>of</strong> two compounds: carbonic acid <strong>and</strong> organic chelates <strong>and</strong> their decompositionadd organics (Kabat-Pendias <strong>and</strong> Pendias, 1992).Major Constituents <strong>of</strong> the SoilSoil WaterAmount <strong>of</strong> water in the form <strong>of</strong> soil moist is estimated to range from 0.001 to0.0005% <strong>of</strong> the total water content <strong>of</strong> the earth (Bohn et al., 2001). Greater part <strong>of</strong> soilwater is run<strong>of</strong>f or percolating water, so this liquid part is not pure as it contains varioussolutes <strong>and</strong> dissolved gases. The concentration <strong>of</strong> these solutes <strong>and</strong> gases differsaccording to their solubility, conditions <strong>of</strong> formation <strong>of</strong> soil, water content, organics <strong>and</strong>gases etc (Wild, 1996).Soil AirAir in the soil is not <strong>of</strong> uniform nature but a mixture <strong>of</strong> nitrogen, oxygen <strong>and</strong>carbon dioxide. Concentration <strong>of</strong> nitrogen remains constant (79%) while oxygen <strong>and</strong>nitrogen dioxide fluctuates (Hausenbuiller, 1972). In soil rich with flora <strong>and</strong> fauna,carbon dioxide is much higher than oxygen due to respiration <strong>of</strong> plants <strong>and</strong> soilorganisms <strong>and</strong> the reduce diffusion <strong>of</strong> gases. Due to limited oxygen supply respiration<strong>and</strong> organic decay is affected <strong>and</strong> availability <strong>of</strong> released nutrients is lowered down.Movement <strong>of</strong> air constituents in soil takes place through diffusion <strong>and</strong> mass flow(Hausenbuiller, 1972).114
Soil OrganicsPlants, bacteria, fungi <strong>and</strong> other living organisms forms the organic <strong>and</strong> livingpart <strong>of</strong> the soil. Solar energy trapped in the biomass is converted to organics ondecomposition (Mckenzie <strong>and</strong> Susan, 2004). Addition <strong>of</strong> sewage sludge <strong>and</strong> organicmanure are also source <strong>of</strong> soil organics. The upper 10cm soil layer usually contains 1-3 %carbon in the form <strong>of</strong> organics. Soil organics can be divided in 1) light fraction (lightcolor, visible, low density) <strong>and</strong> 2) Humus (dark color, high density), (Hausenbuiller,1972).Soil InorganicsNature <strong>of</strong> the mineral in the soil depends on the parent rock, degree <strong>of</strong>weathering <strong>and</strong> physical nature <strong>of</strong> the soil (Wild, 1996). In nature only 8 minerals formsthe major portion <strong>of</strong> earth crust, major portion <strong>of</strong> which are silicate minerals(Hausenbuiller, 1972). On the basis <strong>of</strong> formation, minerals are <strong>of</strong> two types: Primaryminerals are derived from rocks without any transformation while the secondary mineralsare altered by air, water <strong>and</strong> other chemical reactions (Mckenzie <strong>and</strong> Susan, 2004).Physico- Chemical Properties <strong>of</strong> the Soils <strong>of</strong> study areaSoil pHSoil pH is <strong>of</strong> primary importance as all the chemical <strong>and</strong> biological activities arehighly dependant on pH. Lowering <strong>of</strong> pH, enhances the metals solubility <strong>and</strong> hence theirextraction from soil (Castilha <strong>and</strong> Chardan, 1995). Decrease in pH poses negative115
impacts on soil microbial activities. On one side concentration <strong>of</strong> metals get increasedupto dangerous limit in plants, while on other the availability <strong>of</strong> essential nutrients arehindered (Wang et al., 2006).Average soil pH <strong>of</strong> the samples was 7.6 with a range <strong>of</strong> 5.9 to 8.1. Highest valuewas observed in soils <strong>of</strong> the Chin B<strong>and</strong>a <strong>and</strong> lowest in the soil from Farum Korona.However, generally the pH <strong>of</strong> soils <strong>of</strong> <strong>Mardan</strong> District was normal (Table 5.1).Electric Conductivity (EC) <strong>and</strong> Total Dissolved Solids (TDS)Total dissolved solids <strong>and</strong> EC both are significant from agricultural point <strong>of</strong> view.High electric conductivity <strong>of</strong> the soil indicates more dissolve substances. For exampleincrease in soil salinity speed up soil erosion <strong>and</strong> retard the plant growth (Szaboles,1989). Sources <strong>of</strong> soluble salts in the soil include weathering <strong>of</strong> primary minerals <strong>and</strong>native rocks, atmospheric deposition, saline irrigational water, addition <strong>of</strong> inorganic <strong>and</strong>organic fertilizers (Sparks, 2003).Electric conductivity in studied soils varied from 209 to 510μS/cm with anaverage conductivity <strong>of</strong> 287μS/cm. Soil samples from Farum Korona (445μS/cm) <strong>and</strong>Shahabaz Garhi (510μS/cm) were having relatively higher values (Table 5.1). Totaldissolved solids in the soil samples varied from 110 to 265mg/kg with an average <strong>of</strong>152mg/Kg. The values <strong>of</strong> TDS in soil samples were found normal (Table 5.1).116
Soil TextureTexture is the relative proportion <strong>of</strong> clay, silt <strong>and</strong> s<strong>and</strong> in the soil. On the bases <strong>of</strong>texture, soil is called as clay, silty clay, s<strong>and</strong>y clay etc. Texture gives clue about soilcapacity to hold water <strong>and</strong> minerals. Soil texture is relatively a permanent property untilsome outside phenomena e.g., erosion, deposition <strong>and</strong> flood etc. changes it(Hausenbuiller, 1972).Average percentage <strong>of</strong> three components, s<strong>and</strong>, clay <strong>and</strong> silt were found as28.24%, 10.24% <strong>and</strong> 61.55% respectively. On the basis <strong>of</strong> dominant silt component, thesoils <strong>of</strong> the study area were mainly “Silty Loam”. One sample from Rustam was falling inthe category <strong>of</strong> “S<strong>and</strong>y Loam” having 63.5 % <strong>of</strong> s<strong>and</strong> (Table 5.2).Soil ColorColor is an important property to the pedogenic environment <strong>and</strong> history <strong>of</strong> soilformation (Murry <strong>and</strong> Tedrow, 1992). Soil color provides clue for the extent <strong>of</strong>weathering, amount <strong>of</strong> organics <strong>and</strong> state <strong>of</strong> aeration. Change in color <strong>of</strong> soil indicates theformation <strong>of</strong> secondary minerals. Similarly red, yellow <strong>and</strong> brown colors are due to Fecompounds or highly weathered minerals in the soil. Color imparted due to organicsdepends upon quantity, nature <strong>and</strong> grain size <strong>of</strong> organic material (Hausenbuiller, 1972).Color <strong>of</strong> the studied soils showed little variations. Dominant colors were paleyellow, olive brown, light brown <strong>and</strong> brownish gray in dry condition. In the moist formdark brown <strong>and</strong> dark grayish colors were dominant in most <strong>of</strong> the samples (Table 5.2).117
Major Element OxidesCalcium (CaO)Calcium is a most important soil nutrient. Amount <strong>of</strong> Ca present in soil variesgreatly from 0.05 to 25% <strong>of</strong> the whole soil weight. Feldspar minerals are the primarysource <strong>of</strong> Ca in soil, while the Ca from the lime <strong>and</strong> gypsum is termed secondary(Hausenbuiller, 1972). Limestone derived soils are not very productive because <strong>of</strong>excessive leaching <strong>of</strong> Ca (Bohn et al., 2001)Significance to plantsCrops grow rapidly when Ca is adequate in the soil. Calcium maintains the soilpH neutral for plants <strong>and</strong> microorganisms survival (Bohn et al., 2001). Ca deficiencyresults in chlorosis, root damage <strong>and</strong> malformation <strong>of</strong> younger leaves (Jain, 2006).Excess in soil calcium may alter the pH <strong>and</strong> ultimately accumulation <strong>of</strong> elements inplants is disturbed (Hausenbuiller, 1972). Sometimes excess <strong>of</strong> Ca results in theformation <strong>of</strong> different compounds with other elements e.g., with chlorides which disturbsthe Osmotic pressure in plant roots (Hausenbuiller, 1972).Calcium oxides concentration in the soils <strong>of</strong> studied area ranged from1.26 to19.56 % with an average content <strong>of</strong> 8.66%. According to Bohn et al. (2001) the safe limitfor CaO in normal agricultural soils is 2.5 %. Soil sample (S-5) with normal CaO (1.26)content was found in Gujrat, while the rest <strong>of</strong> samples were having higher concentrations(Table 5.3). Soil samples with higher CaO were from Farum Korona (9.14%), ShahbazGarhi (8.84%), Yaqubabad (10.35%), Gujar Garhi (7.65%), Pump Korona (11.12%),118
Takht Bhai (16.19%), Takkar (11.61%), Lund Khwur (11.9%), Chil (12.57%), ChinB<strong>and</strong>a (7.90%), Jamal Garhi (9.96%), Katlung (7.21%), Ghundo (7.87%), MianKali(19.56%), Babuzai (13.10%), Spainkai (15.90%), Jalalabad (18.10%) <strong>and</strong> Toru(11.70%) (Table 5.3; Fig.5.1a).Magnesium (MgO)Magnesium is present in all soil types in sufficient amount except s<strong>and</strong>y soilswhich are Mg deficient. Soils derived from the serpentine (Mg silicate) rock have higherMg content. Many primary <strong>and</strong> secondary minerals <strong>of</strong> aluminum silicates also containMg as major component (Bohn et al., 2001).Significance to plantsMagnesium is an important plant nutrient <strong>and</strong> its deficiency affects plants growthbadly. Magnesium is a part <strong>of</strong> chlorophyll <strong>and</strong> helps in the translocation <strong>of</strong> starch withinplant tissues. It is also significant in the formation <strong>of</strong> plant oils <strong>and</strong> fats <strong>and</strong> for thegrowth <strong>of</strong> new cells (Bohn et al., 2001). Magnesium deficiency appears in the form <strong>of</strong>leaf chlorosis <strong>and</strong> necrotic patches on leaves (Jain, 2006). Soils with high Mg contentexperience some problems like high pH, soil crusting <strong>and</strong> lower hydraulic permeability.In the presence <strong>of</strong> elevated Mg, availability <strong>of</strong> Ca is also hindered (Bohn et al., 2001).The concentration <strong>of</strong> MgO in studied soils ranged from 0.13 to 2.40% with anaverage value <strong>of</strong> 1.59% (Table 5.3). The permissible limit for MgO in normal soils is1.5% (Bohn et al., 2001). Samples with higher concentration <strong>of</strong> MgO were from ShahbazGarhi (1.98%), Yaquabad (2.14%), Salim Khan Kali (2.37%), Gujar Garhi (2.03%),119
Pump Korona (2.00%), Shergarh (2.06%), Lund Khuwr (2.06%), Chil (2.15%), GarhiKapora (2.00%) <strong>and</strong> Ch<strong>and</strong>ar (2.28%) (Table 5.3; Fig.5.1b).Sodium (Na 2 O)Sodium along with K is found in the parent material <strong>of</strong> many minerals. Soilsderived from igneous rock have total 1 to 2% Na, while in sedimentary origin soil, itsvalue ranges from 0.02 to 0.1%. In light s<strong>and</strong>y soil Na is found below 0.02%. Soil withsodic nature generally has greater than 15% <strong>of</strong> Na exchange capacity (Draycott et al.,2003).Significance to plantsSodium is not required by plants <strong>and</strong> inhibits the absorption <strong>of</strong> K. It is estimatedthat 5-15 % <strong>of</strong> exchangeable Na has inhibitory effect on water movement (Bohn et al.,2001). Elevated concentrations <strong>of</strong> Na results in soil swell (Kabata-Pendias <strong>and</strong> Pendias,1992). In presence <strong>of</strong> high Na, plants exp<strong>and</strong> more energy on water take up due to higherosmotic pressure, leaving less potential for plant growth (Bohn et al., 2001). High Nareduces photosynthesis <strong>and</strong> disrupts the balance <strong>of</strong> Reactive oxygen species (ROS)(Marschner, 1995).Average concentration <strong>of</strong> Na 2 O in studied soil samples was 13.26% with a rangefrom 7.92-15.50%. The recommended value <strong>of</strong> Na 2 O for agricultural soil is 1.5% (Bohnet al., 2001). In this respect, all the samples <strong>of</strong> the study area were having elevated level<strong>of</strong> Na 2 O (Table 5.3; Fig.5.1c).120
Potassium (K 2 O)Potassium is the 3 rd most used element in fertilizers after nitrogen <strong>and</strong> phosphorus(Bohn et al., 2001). In soil the minerals having K in abundance are mica, feldspar <strong>and</strong>illite (Hausenbuiller, 1972). A soil solution mainly has low available K because it isstrongly retained by the clay minerals in soil, to overcome its deficiency fertilizer areadded to the soil (Bohn et al., 2001).Significance to plantsInspite <strong>of</strong> K abundance in soil, very small amount is available (10%) <strong>of</strong> the wholeK to plants. On the basis <strong>of</strong> mineral structure, K is categorized in exchangeable <strong>and</strong> nonexchangeableforms. In plants K remains in ionic form having different functions e.g.,synthesis <strong>of</strong> protein, chlorophyll <strong>and</strong> carbohydrate, transformation <strong>of</strong> nitrogen fromnitrates, helps in the root absorption, translocation <strong>and</strong> storage <strong>of</strong> carbohydrates(Hausenbuiller, 1972). Symptoms <strong>of</strong> K deficiency are chlorosis <strong>and</strong> necrosis <strong>of</strong> leaves<strong>and</strong> stunted plant growth (Jain, 2006).The content <strong>of</strong> K 2 O in the studied soil samples varied from 1.18 to 4.13% withaverage value <strong>of</strong> 3.14%. The safe limit K 2 O content in normal agricultural soils is as1.5% (Bohn et al., 2001). It was notified that the majority <strong>of</strong> samples were having K 2 Oabove permissible limits; however the concentration <strong>of</strong> K 2 O was found lower than Na 2 Ocontent (Table 5.3; Fig.5.1d).121
Iron (Fe 2 O 3 )Through out the world estimated concentration <strong>of</strong> the Fe is about 45%; mainsources being mafic rocks. Iron content provides base in the classification <strong>of</strong> soil types.Although Fe forms many different compounds in soil, however, the available content isvery small. Normal soils are supposed to contain 0.5-5% Fe (Kabata-Pendias <strong>and</strong>Pendias, 1992).Significance to plantsIron is a plant micronutrients <strong>and</strong> its deficiency leads to severe impacts on growth<strong>and</strong> yield (Marschner, 1995). Iron has important part in Nitrate <strong>and</strong> Sulphate reduction,chlorophyll formation, metabolism <strong>and</strong> catalytic functions (Kabata-Pendias <strong>and</strong> Pendias,1992). During Fe deficiency, the uptake <strong>of</strong> Mn <strong>and</strong> Zn is accelerated (Alam et al., 2001).Average concentration <strong>of</strong> Fe 2 O 3 in the agricultural fields <strong>of</strong> study area was 3.57%with a range <strong>of</strong> 1.66 to 4.97%. Permissible limit <strong>of</strong> Fe 2 O 3 for normal agricultural soils byBohn et al. (2001) is 5.77%. Most <strong>of</strong> the studied soil samples were having Fe 2 O 3concentration within normal range (Table 5.3; Fig.5.1e).Manganese (MnO)Mn is a common most trace element on earth, usually association with maficrocks. In minerals, Mn is present in various ionic forms but Mn +2 is common in silicatesminerals. Its hydroxides <strong>and</strong> oxides are capable <strong>of</strong> making association with heavy metals(Kabata-Pendias <strong>and</strong> Pendias, 1992).122
Significance to plantsManganese is essential for plants especially for electron transport inphotosynthesis (Bartlett, 1986) <strong>and</strong> as a c<strong>of</strong>actor <strong>of</strong> various enzymes (Marschner, 1995).Mn also helps plants in the assimilation <strong>of</strong> nitrogen. Chloroplast shows sensitivitytowards Mn deficiency, growth <strong>and</strong> osmotic pressure are also affected (Kabat-Pendias<strong>and</strong> Pendias, 1992). On other h<strong>and</strong> excess Mn is toxic <strong>and</strong> its symptoms are brownpatches on leaves <strong>and</strong> uneven chlorophyll distribution in leaves. During Mn stress freeradicals oxidize membrane lipids causing cells death (Tanaka, 1994). High Mn level alsoimpairs enzymes <strong>and</strong> growth hormones (Foy, 1983).Manganese Oxide concentration in studied soils ranged from 0.07 to 1.38 % withan average concentration <strong>of</strong> 0.21%. The safe limit for MnO in agricultural soils is
in all soil solutions in both free <strong>and</strong> ionic state (Kabata-Pendias <strong>and</strong> Pendias, 2001). Cuconcentration in the soils varies from 2-50mg/kg (Alloway, 1995).Significance to plantsCu forms integral part <strong>of</strong> several plant enzymes <strong>and</strong> its average concentration inplants tissue range from 1-5mg/kg (Alloway, 1995). Major biochemical functions inwhich Cu is involved are photosynthesis, respiration, nitrogen reduction <strong>and</strong> fixation,protein metabolism, immune against diseases <strong>and</strong> fertility (Kabata-Pendias <strong>and</strong> Pendias,1992). Ionic forms <strong>of</strong> Cu are more toxic than organic complexes (Florence, et al,. 1984).Some toxic effects <strong>of</strong> high Cu content to plants are, to change the permeability <strong>of</strong> cellmembrane, peroxidies the lipid content <strong>of</strong> chloroplasts, damage DNA <strong>and</strong> reducephotosynthesis (Woolhouse <strong>and</strong> Walker, 1981; S<strong>and</strong>mann <strong>and</strong> Boger, 1980). Irondeficiency <strong>and</strong> root elongation are also reported in wheat in presence <strong>of</strong> excess Cu(Michaud et al., 2008).Copper concentration in studied soils ranged from 12 to 45mg/kg with averageconcentration <strong>of</strong> 28mg/kg. Safe limit <strong>of</strong> Cu content in normal agricultural soil is 20mg/kg(Bohn et al., 2001). Soil samples with higher concentration <strong>of</strong> Cu were from FarumKorona (31mg/kg <strong>and</strong> 36mg/kg), Yaqubabad (39mg/kg), Ibrahim Khan Kali (38mg/kg),Pump Korona (35mg/kg), Takht Bhai (35mg/kg), Takkar (27mg/kg), Jalala (38mg/kg),Shergarh(40mg/kg), Chill (27mg/kg), Chin B<strong>and</strong>a (28mg/kg), Ch<strong>and</strong>ar (35mg/kg),Katlung (35mg/kg) <strong>and</strong> Sowkai (45mg/kg) (Table 5.4; Fig.5.2a). Distribution map forthe Cu concentration in the soils <strong>of</strong> <strong>Mardan</strong> District was prepared by GIS as showed inFigure 5.3a. Uneven distribution <strong>of</strong> Cu was notified from the figure with low Cu content124
at the eastern boundary. However rest <strong>of</strong> the <strong>Mardan</strong> District was having high Cu contentwith clusters found at the western boundary near Shergarh <strong>and</strong> Jalala; at the southernboundary near Salim Khan kalli <strong>and</strong> Rushaki <strong>and</strong> at the central part near Katlang(Fig.5.3a)Lead (Pb)On earth Pb occurs in two forms, primary <strong>and</strong> secondary: primary is <strong>of</strong> geogenicorigin while secondary Pb comes from radioactive decay <strong>of</strong> U <strong>and</strong> Th. The commonnatural state <strong>of</strong> Pb is galena. Pb gets accumulated on the surface soil due to its lowsolubility <strong>and</strong> high adsorption to minerals or by forming organic complexes (Adriano,1986). The estimated half life <strong>of</strong> Pb in soil is about 740-5,900 years (Alloway <strong>and</strong> Ayres,1997).Significance to plantsAll most all plants have Pb but many studies suggest its no significant biologicalrole. Major phytotoxic impacts on plants are reduction in enzymatic, photosynthesisactivities <strong>and</strong> plant growth (Stiborova et al., 1987). Pb contamination also affects thegrowth <strong>and</strong> population <strong>of</strong> Arbuscular Mycorrhizal Fungi (AMF), a symbiotic soil fungus(Khan et al., 2000).The average concentration <strong>of</strong> Pb in studied soils was 27mg/kg with a range <strong>of</strong> 4 to56 mg/kg. According to Bohn et al. (2001), safe limit <strong>of</strong> Pb for normal agricultural soilsis 10mg/kg. All most all the soil samples were having Pb content above permissible limitexcept one sample (W-21) from Jamal Garhi (Fig.5.2b). Lead distribution map was125
prepared by GIS <strong>and</strong> showed in Figure 5.3b. It is showed that high Pb content washomogenously distributed through the whole study area; however, cluster with relativelyelevated Pb content was showed near Shahbaz Garhi at the southern part <strong>of</strong> <strong>Mardan</strong>District (Fig.5.3b)Zinc (Zn)Zn is found in all magmatic rocks uniformly, with slight increase in mafic rocks.Common form is zinc sulfide. During weathering Zn is released as Zn +2 that are readilyadsorbed by soil minerals <strong>and</strong> organic component. Anthropogenic sources <strong>of</strong> Zn aremetal industry <strong>and</strong> agricultural practices (Kabata-Pendias <strong>and</strong> Pendias, 1992). AverageZn content in the soil is 50mg/kg (MortvEd. 2000).Significance to plantsPlants take Zn in the forms <strong>of</strong> complex ions, hydrated ions <strong>and</strong> Zn-organicchelates (Grahm et al,. 1987). Zinc is considered important in protein <strong>and</strong> carbohydratemetabolism, <strong>and</strong> also involved in the synthesis <strong>of</strong> growth hormone Auxin (Jain, 2006).Zinc also develops resistance in plants against extreme conditions, <strong>and</strong> bacterial <strong>and</strong>fungal attacks. Zn is not considered as highly phytotoxic, however; new leaves chlorosis<strong>and</strong> retarded growth are consequences <strong>of</strong> Zn phytotoxicity (Kiekens, 1990; Fontes <strong>and</strong>Cox, 1998). It also hindered the uptake <strong>of</strong> Fe <strong>and</strong> redish color appears due to deficiency(Lee et al., 1996).Zinc concentration in the studied soil samples varied from 4 to 275mg/kg with anaverage value <strong>of</strong> 96mg/kg. According to Bohn et al. (2001), safe limit for Zn in normal126
soils is 50mg/kg. Samples with high Zn value were found in Farum Korona (70mg/kg<strong>and</strong> 80mg/kg respectively), Shahbaz Garhi (127mg/kg), Chankari Stop (107), IbrahimKhan Kali (101mg/kg), Gujar Garhi (120mg/kg), Gujar Garhi (110mg/kg), Jalala(208mg/kg), Shergarh (120mg/kg), Chin B<strong>and</strong>a (275mg/kg), Jamal Garhi (141mg/kg),Katlung (122mg/kg), Ghundo (76mg/kg), Mian Kali (81mg/kg), Babuzai (74mg/kg),(99mg/kg) Spainkai, Toru (105mg/kg), Garhi Kapora (100mg/kg) , Ch<strong>and</strong>ar (91mg/kg)<strong>and</strong> Sowkai (133mg/kg) (Table 5.4; Fig.5.2c). Distribution <strong>of</strong> Zn in the studied soils wasdemonstrated in Figure 5.3c. High Zn content with homogenous distribution was notifiedfrom the map with a cluster <strong>of</strong> relatively elevated Zn towards northern part (Fig.5.3c)Nickel (Ni)In nature mafic rocks are the main source <strong>of</strong> Ni having its proportion from 1400-2000mg/kg. Primary minerals <strong>of</strong> terrestrial rocks having Ni are sulfides, arsenites,antimonides <strong>and</strong> ferromagnesian minerals; Ni also occurs in carbonate, silicates <strong>and</strong>phosphates. After weathering, Ni becomes mobilized but its ions are stable in soil. Due tostrong affinity <strong>of</strong> organics to absorb Ni, it is also found in coal <strong>and</strong> oil (Kabat-Pendias<strong>and</strong> Pendias, 1992).Significance to plantsAlthough many studies show that Ni is not essential to plants but supposed to be apart <strong>of</strong> enzymes in higher plants. Symptoms <strong>of</strong> toxicity on plants include necrosis,chlorosis, wilting <strong>and</strong> restarted growth (Madhava Rao <strong>and</strong> Sresty 2000; P<strong>and</strong>ey <strong>and</strong>Sharma, 2002). Under high Ni stress ROS (reactive oxygen species) in plants are127
disturbed (Gratao et al., 2005) which cause injuries to macromolecules (lipids, proteins<strong>and</strong> nucleic acids), (Kekrer, 2000).Soils from the study area contained Ni in the range <strong>of</strong> 20 to 81mg/kg with averagevalue <strong>of</strong> 49mg/kg. Safe limit for Ni content in normal agricultural soils by Bohn et al.(2001) is 40mg/kg. Samples having high Ni concentration were from Farum Korona(65mg/kg <strong>and</strong> 68mg/kg), Gulshanabad (53mg/Kg), Yaquabad (81mg/Kg), Ibrahim KhanKali (62mg/kg), Gujar Garhi (62mg/kg <strong>and</strong> 60mg/kg), Jh<strong>and</strong>ai (60mg/kg), Pump Korona(64mg/kg), Takht Bhai (58mg/kg), Jalala (69mg/kg), Shergarh (66mg/kg), Katlung(58mg/kg), Ch<strong>and</strong>ar (51mg/kg) <strong>and</strong> Sokai (54mg/kg), (Table 5.4; Fig.5.2d). GIS basedNi distribution map was prepared in Figure 5.3d. It was noticed in the map that theeastern boundary contained Ni within safe limit. However, high content was found in thecentral part with clusters <strong>of</strong> elevated levels along western <strong>and</strong> southern boundaries(Fig.5.3d).Chromium (Cr)Soils derived from mafic <strong>and</strong> ultramafic rocks have Cr from 0.2 to 0.4 %, whilehigher concentration is found in argillaceous sediments. Chromium has variable range <strong>of</strong>oxidation states, forming complexes through its anions <strong>and</strong> cations. The two commonstates <strong>of</strong> Cr are Cr +3 <strong>and</strong> Cr +6 in soil (Kabata-Pendias <strong>and</strong> Pendias, 1992). Normal range<strong>of</strong> Cr in soil is 9.9-121mg/kg (Archer <strong>and</strong> Hodgson, 1987).128
Significance to plantsCr has no nutritional value to plants <strong>and</strong> its elevated level hinders plant growth<strong>and</strong> cause leaf chlorosis (Sharma et al., 1995). Plants grown on Cr spiked soils also showgreater metal accumulation (Ali et al., 2004).Chromium content in the studied soils varied from 25 to 84mg/kg with an averageconcentration <strong>of</strong> 60mg/kg (Table 5.4). According to Bohn et al. (2001), the Crconcentration in the normal agricultural soils is generally 20mg/kg. Majority <strong>of</strong> the soilsamples were having high Cr contents as compared to normal agricultural soil (Fig.5.2e).The distribution map <strong>of</strong> Cr in the soils was prepared with the help <strong>of</strong> GIS. It was notedthat the whole District was having high Cr values. However, cluster with relatively highervalues were recorded in the western, southern <strong>and</strong> central parts (Fig.5.3e) <strong>of</strong> <strong>Mardan</strong>District.Cadmium (Cd)Cadmium is considered important because <strong>of</strong> its ecotoxicity to environment.Magmatic rocks have very low Cd while it is concentrated in argillaceous <strong>and</strong> shaledeposits (0.3ppm). Average content <strong>of</strong> Cd in soil is 0.06-1.1mg/kg. Cd is readily soluble<strong>and</strong> shows strong affinity towards sulfur, therefore, is adsorbed by sulfide in the soil.Anthropogenic sources <strong>of</strong> Cd in soil are phosphorus fertilizers, sewage sludge <strong>and</strong> aerialdeposition (Kabata-Pendias <strong>and</strong> Pendias, 1992).129
Significance to plantsIn plants Cd is easily translocated from root tissues to above ground parts. Cd hasability to affect physiological activities <strong>and</strong> productivity (Florijin <strong>and</strong> Van Beusichem,1993). Reduction in photosynthesis, plant growth, chlorophyll content <strong>and</strong> oxidativestress development are the major phytotoxic effects <strong>of</strong> Cd (Zhou <strong>and</strong> Huang, 2001; Yi<strong>and</strong> Ching, 2003; Zhou et al., 2003).Agricultural soil <strong>of</strong> the study area showed average Cd concentration <strong>of</strong> 2.33mg/kg<strong>of</strong> Cd with a range <strong>of</strong> 0.15 to 3.06mg/kg. All the soil samples from the study area werehaving concentration above the normal Cd value <strong>of</strong> 0.06mg/kg <strong>of</strong> Bohn et al. (2001)(Table 5.4; Fig.5.2f). The GIS based distribution map <strong>of</strong> Cd in the soils <strong>of</strong> <strong>Mardan</strong>District was prepared (Fig.5.3f). The distribution pattern <strong>of</strong> Cd indicated that the whole<strong>Mardan</strong> District was having high Cd concentration, with clusters <strong>of</strong> elevatedconcentration in the northern, western <strong>and</strong> central parts (Fig.5.3f).Arsenic (As)All types <strong>of</strong> rocks constitutes As but relatively concentrated in argillaceoussediments. About 200 minerals contains As, majority <strong>of</strong> which are Arsenates. It formscompounds with Fe, Pb <strong>and</strong> Cu e.g., Arsenopyrite (FeAsS). Although elemental As is lessmobile due to its strong association with clay <strong>and</strong> organics, but its ions have moremobility (Kabata-Pendias <strong>and</strong> Pendias, 1992). Complexation reaction on mineral oxides(Inskeep et al., 2002) <strong>and</strong> small textural fraction <strong>of</strong> soil control As activity (Lombi et al.,2000).130
Significance to plantsArsenic has no important biological role hence, is considered non essentialelements to plants (Marin et al., 1993). Contaminated soils around the world haveaverage As concentration <strong>of</strong> 26.5mg/kg (Hingston et al, 2001).Two As compounds,sodium arsenate <strong>and</strong> arsenic trioxide (used in herbicides) cause metabolic inhibition(Kabata-Pendias <strong>and</strong> Pendias, 1992). Root elongation is markedly reduced in Ascontaminated soils (Cao et al, 2007).Arsenic was present in the soil samples <strong>of</strong> the study area in the range <strong>of</strong> 1.55 to26.13mg/kg with an average amount <strong>of</strong> 5.14mg/kg. All the samples contained As withinpermissible limit <strong>of</strong> 8.4-9mg/kg for silty <strong>and</strong> loam soils (Kabata-Pendias <strong>and</strong> Pendias,2001), except one sample (S-11) collected from Gujar Garhi (Table 5.4; Fig.5.2g).Arsenic distribution map <strong>of</strong> the studied soil was prepared by GIS as showed in the Figure5.3g. The As distribution was generally homogenous in the soils throughout the District.However, small cluster <strong>of</strong> relatively high concentration was found in the south-westernpart (Fig.5.3g)131
Table 5.1. Physical parameters <strong>of</strong> Soils <strong>of</strong> <strong>Mardan</strong> DistrictSample Locations pHConductivityµS/cmTDSmg/lS-1 Farum Korona 5.9 445 231S-2 Farum Korona 7.3 305 158S-3 Shahbaz Garhi 7.4 510 265S-4 Chankari Dheri 6.2 266 138S-5 Gujrat 7.2 277 146S-6 Gulshanabad 7.7 345 178S-7 Malakabad 7.8 279 154S-8 Yaqubabad 8.0 371 196S-9 Salim Khan kalli 7.6 360 190S-10 Gujar Garhi 7.5 276 146S-11 Gujar Garhi 7.7 246 132S-12 Jh<strong>and</strong>ai 8.0 300 160S-13 Pumo Korona 7.8 277 148S-14 Takht Bhai 7.8 255 137S-15 Takkar 7.7 256 136S-16 Jalala 8.0 249 132S-17 Shergarh 7.9 266 141S-18 Lund Khwur 7.7 259 140S-19 Chil 7.9 237 125S-20 Chin B<strong>and</strong>a 8.1 295 157S-21 Jamal Garhi 7.4 246 135S-22 Katlung 7.5 240 126S-23 Ghundo 7.6 225 119S-24 Mian Kali 7.5 247 131S-25 Babuzai 7.5 271 143S-26 Sphinkai 7.6 235 127S-27 Rustum 7.7 257 135S-28 Jalalabad 7.6 242 129S-29 Chigai Baba 7.7 209 110S-30 Toru 8.0 247 134S-31 Garhi Kapora 7.7 287 152S-32 Ch<strong>and</strong>ar 7.4 327 176S-33 Sowkai 7.5 358 184Minimum 5.9 209 110Maximum 8.1 510 265Average 7.6 287 152132
Table 5.2. Texture <strong>and</strong> Color <strong>of</strong> Soils <strong>of</strong> <strong>Mardan</strong> DistrictSample LocationsS<strong>and</strong>%Clay%Silt% Texture Color in Dry Color in moistS-1 Farum Korona 21.50 21.70 56.70 Silty Loam L.brownish gray D.grayish brownS-2 Farum Korona 30.30 5.00 64.60 Silty Loam L.yellow brown Grayish brownS-3 Shahbaz Garhi 27.50 5.70 66.80 Silty Loam L.brownish gray D.grayish brownS-4 Chankari Dheri 30.60 5.00 64.30 Silty Loam Brown Dark brownS-5 Gujrat 29.50 17.76 53.00 Silty Loam Brown V.gray dark brownS-6 Gulshanabad 33.50 15.70 50.70 Silty Loam Brown V.gray dark brownS-7 Malakabad 29.50 5.70 64.70 Silty Loam L.brownish gray D.grayish brownS-8 Yaqubabad 21.52 17.70 60.70 Silty Loam L.brownish gray D.grayish brownS-9 Charsadda road 18.24 5.00 76.80 Silty Loam L.yellow brown dark brownS-10 Gujar Garhi 21.50 17.76 60.70 Silty Loam L.yellow brown V.dark brownS-11 Gujar Garhi 30.24 5.00 64.70 Silty Loam L.olive brown Dark brownS-12 Jh<strong>and</strong>ai 13.50 5.70 81.00 Silt L.yellow brown L.olive brownS-13 Pumo Korona 22.20 23.00 54.70 Silty Loam L.yellow brown D.grayish brownS-14 Takht Bhai 33.50 5.70 60.70 Silty Loam L.yellow brown D.grayish brownS-15 Takkar 17.50 5.70 76.70 Silty Loam Pale yellow L.olive brownS-16 Jalala 17.50 15.70 66.70 Silty Loam L.olive brown Olive brownS-17 Shergarh 34.24 9.00 56.70 Silty Loam L.olive brown D.grayish brownS-18 Lund Khwur 31.50 5.70 62.70 Silty Loam Pale yellow Olive brownS-19 Chil 30.20 15.00 54.70 Silty Loam L.yellow brown D.grayish brownS-20 Chin B<strong>and</strong>a 41.50 5.70 52.80 Silty Loam L.yellow brown Olive brownS-21 Jamal Garhi 30.00 13.00 57.00 Silty Loam L.yellow brown D.grayish brownS-22 Katlung 19.50 9.80 71.00 Silty Loam L.yellow brown D.grayish brownS-23 Ghundo 17.50 15.80 66.70 Silty Loam light gray Olive brownS-24 Mian Kali 14.24 9.00 76.70 Silty Loam Pale yellow L.olive brownS-25 Babuzai 17.50 15.70 66.70 Silty Loam L.yellow brown D.yellow brownS-26 Sphinkai 16.20 11.00 72.70 Silty Loam L.yellow brown Olive brownS-27 Rustum 63.50 5.70 31.00 S<strong>and</strong>y Loam L.olive brown Olive brownS-28 Jalalabad 44.00 5.00 50.70 Silty Loam L.yellow brown Olive brownS-29 Chigai Baba 54.00 9.00 37.00 Silty Loam L.yellow brown Olive brownS-30 Toru 50.30 5.00 47.00 Silty Loam L.yellow brown D.grayish brownS-31 Garhi Kapora 17.50 5.70 76.70 Silty Loam L.yellow brown D.grayish brownS-32 Ch<strong>and</strong>ar 20.00 15.00 65.00 Silty Loam L.brownish gray Dark grayS-33 Sowkai 32.24 5.00 62.70 Silty Loam L.yellow brown Olive brownMinimum 13.50 5.00 31.00Maximum 63.50 23.00 81.00Average 28.24 10.24 61.55Sample Locations CaO% MgO% Na 2 O% K 2 O% Fe 2 O 3 % MnO%133
S-1 Farum Korona 9.14 0.13 13.06 3.88 4.11 0.10S-2 Farum Korona 6.99 2.40 12.80 3.53 3.95 0.12S-3 Shahbaz Garhi 8.84 1.98 13.38 3.91 3.50 0.10S-4 Chankari Dheri 5.60 1.52 13.95 2.90 4.80 0.25S-5 Gujrat 1.26 1.14 15.50 4.13 3.12 0.09S-6 Gulshanabad 3.60 1.51 13.20 3.90 3.19 0.09S-7 Malakabad 4.38 1.33 13.54 3.88 2.79 0.08S-8 Yaqubabad 10.35 2.14 12.87 4.08 3.76 0.12S-9 Salim Khan kalli 3.83 2.37 15.24 4.07 3.84 0.12S-10 Gujar Garhi 7.65 2.03 15.20 3.42 4.00 0.13S-11 Gujar Garhi 9.50 1.66 13.04 2.66 3.34 0.11S-12 Jh<strong>and</strong>ai 5.90 1.87 12.81 2.60 3.55 0.11S-13 Pumo Korona 11.12 2.00 7.92 2.67 3.86 0.10S-14 Takht Bhai 16.19 1.17 12.13 2.10 3.09 0.07S-15 Takkar 11.61 1.87 14.14 3.40 4.80 0.12S-16 Jalala 3.00 1.72 12.28 2.60 2.47 0.11S-17 Shergarh 4.23 2.06 13.00 3.47 4.20 0.12S-18 Lund Khwur 11.90 2.06 13.40 3.62 4.97 0.10S-19 Chil 12.57 2.15 12.80 2.40 2.94 0.11S-20 Chin B<strong>and</strong>a 7.92 1.51 13.00 2.57 3.01 0.11S-21 Jamal Garhi 9.96 1.57 13.05 3.32 3.50 0.08S-22 Katlung 7.21 1.40 12.76 3.34 4.42 0.11S-23 Ghundo 7.87 1.65 12.87 3.13 3.58 0.10S-24 Mian Kali 19.56 1.55 12.60 3.35 3.60 0.08S-25 Babuzai 13.10 1.64 13.12 3.60 3.89 0.10S-26 Sphinkai 15.90 1.69 12.96 2.50 4.08 0.11S-27 Rustum 5.06 0.28 14.22 1.86 1.66 0.57S-28 Jalalabad 18.10 0.72 14.76 2.96 2.63 0.65S-29 Chigai Baba 2.73 0.67 13.99 3.55 2.05 0.09S-30 Toru 11.70 1.76 14.02 2.87 3.40 0.08S-31 Garhi Kapora 6.65 2.00 13.04 3.66 3.60 0.11S-32 Ch<strong>and</strong>ar 3.37 2.28 13.01 3.37 4.06 0.12S-33 Sowkai 5.49 1.35 14.02 1.18 4.60 1.38Minimum 1.26 0.13 7.92 1.18 1.66 0.07Maximium 19.56 2.40 15.50 4.13 4.97 1.38Average 8.66 1.59 13.26 3.14 3.57 0.21Bohn’s Stnd 2.5 1.5 1.5 1.5 5.77
Sample LocationsCumg/kgPbmg/kgZnmg/kgNimg/kgCrmg/kgCdmg/kgAsmg/kgS-1 Farum Korona 31 25 70 65 64 0.15 4.63S-2 Farum Korona 36 35 80 68 70 2.43 5.48S-3 Shahbaz Garhi 28 56 127 42 52 2.19 3.02S-4 Chankari Dheri 17 34 107 28 25 2.52 4.25S-5 Gujrat 18 36 52 41 48 2.43 5.46S-6 Gulshanabad 23 30 69 53 58 3.06 3.31S-7 Malakabad 24 29 70 45 56 2.55 3.48S-8 Yaqubabad 39 38 79 81 80 2.73 5.97S-9 Salim Khan kalli 38 17 101 62 69 2.28 4.28S-10 Gujar Garhi 32 27 120 62 70 2.49 4.42S-11 Gujar Garhi 32 28 110 60 60 2.73 26.13S-12 Jh<strong>and</strong>ai 25 28 9 60 65 2.79 5.25S-13 Pumo Korona 35 30 8 64 65 2.40 3.46S-14 Takht Bhai 35 33 36 58 84 3.06 5.46S-15 Takkar 27 30 4 46 58 2.25 3.66S-16 Jalala 38 27 208 69 74 2.73 5.06S-17 Shergarh 40 31 120 66 77 2.91 5.64S-18 Lund Khwur 25 19 70 36 47 2.10 6.01S-19 Chil 27 20 75 42 58 2.67 5.44S-20 Chin B<strong>and</strong>a 28 32 275 38 58 2.82 4.03S-21 Jamal Garhi 24 4 141 38 55 1.77 5.30S-22 Katlung 35 27 122 58 75 2.55 4.00S-23 Ghundo 24 22 76 43 54 2.07 5.71S-24 Mian Kali 25 27 81 40 57 2.79 1.55S-25 Babuzai 24 26 74 40 55 2.07 4.03S-26 Sphinkai 23 20 99 42 58 2.16 5.79S-27 Rustum 12 16 65 20 28 1.89 3.08S-28 Jalalabad 17 17 103 23 44 1.71 5.60S-29 Chigai Baba 21 27 181 23 30 2.07 2.82S-30 Toru 28 22 105 62 61 2.16 5.45S-31 Garhi Kapora 24 25 100 41 64 1.95 4.09S-32 Ch<strong>and</strong>ar 35 29 91 51 70 2.25 5.09S-33 Sowkai 45 21 133 54 77 2.04 2.51Minimum 12 4 4 20 25 0.15 1.55Maximium 45 56 275 81 84 3.06 26.13Average 28 27 96 49 60 2.33 5.14Bohn’s Stnd 20 10 50 40 20 0.06 4-9135
2016CaO%12840S-1S-2S-3S-4S-5S-6S-7S-8S-9S-10S-11S-12S-13S-14S-15S-16S-17S-18S-19S-20S-21S-22S-23S-24S-25S-26S-27S-28S-29S-30S-31S-32S-33BohSampleFig. 5.1a. CaO concentration (%) in Soils <strong>of</strong> <strong>Mardan</strong> District3210S-1S-2S-3S-4S-5S-6S-7S-8S-9S-10S-11S-12S-13S-14S-15S-16S-17S-18S-19S-20S-21S-22S-23S-24S-25S-26S-27S-28S-29S-30S-31S-32S-33BohMgO%SampleFig. 5.1b. MgO concentration (%) in Soils <strong>of</strong> <strong>Mardan</strong> District1612Na2O%840S-1S-2S-3S-4S-5S-6S-7S-8S-9S-10S-11S-12S-13S-14S-15S-16S-17S-18S-19S-20S-21S-22S-23S-24S-25S-26S-27S-28S-29S-30S-31S-32S-33BohSampleFig. 5.1c. Na 2 O concentration (%) in Soils <strong>of</strong> <strong>Mardan</strong> District136
54K2O%3210S-1S-2S-3S-4S-5S-6S-7S-8S-9S-10S-11S-12S-13S-14S-15S-16S-17S-18S-19S-20S-21S-22S-23S-24S-25S-26S-27S-28S-29S-30S-31S-32S-33BohSampleFig. 5.1d. K 2 O concentration (%) in Soils <strong>of</strong> <strong>Mardan</strong> District654Fe2O3%3210S-1S-2S-3S-4S-5S-6S-7S-8S-9S-10S-11S-12S-13S-14S-15S-16S-17S-18S-19S-20S-21S-22S-23S-24S-25S-26S-27S-28S-29S-30S-31S-32S-33BohSampleFig. 5.1e. Fe 2 O 3 concentration (%) in Soils <strong>of</strong> <strong>Mardan</strong> District1.501.251.00MnO%0.750.500.250.00S-1S-2S-3S-4S-5S-6S-7S-8S-9S-10S-11S-12S-13S-14S-15S-16S-17S-18S-19S-20S-21S-22S-23S-24S-25S-26S-27S-28S-29S-30S-31S-32S-33BohSampleFig. 5.1f. MnO concentration (%) in Soils <strong>of</strong> <strong>Mardan</strong> District137
4536Cu (mg/kg)271890S-1S-2S-3S-4S-5S-6S-7S-8S-9S-10S-11S-12S-13S-14S-15S-16S-17S-18S-19S-20S-21S-22S-23S-24S-25S-26S-27S-28S-29S-30S-31S-32S-33BohSampleFig. 5.2a. Copper (Cu) concentration (mg/kg) in Soils <strong>of</strong> <strong>Mardan</strong> District6050Pb (mg/kg)403020100S-1S-2S-3S-4S-5S-6S-7S-8S-9S-10S-11S-12S-13S-14S-15S-16S-17S-18S-19S-20S-21S-22S-23S-24S-25S-26S-27S-28S-29S-30S-31S-32S-33BohSampleFig. 5.2b. Lead (Pb) concentration (mg/kg) in Soils <strong>of</strong> <strong>Mardan</strong> District138
300250Zn (mg/kg)200150100500S-1S-2S-3S-4S-5S-6S-7S-8S-9S-10S-11S-12S-13S-14S-15S-16S-17S-18S-19S-20S-21S-22S-23S-24S-25S-26S-27S-28S-29S-30S-31S-32S-33BohSampleFig. 5.2c. Zinc (Zn) concentration (mg/kg) in Soils <strong>of</strong> <strong>Mardan</strong> District10080Ni (mg/kg)6040200S-1S-2S-3S-4S-5S-6S-7S-8S-9S-10S-11S-12S-13S-14S-15S-16S-17S-18S-19S-20S-21S-22S-23S-24S-25S-26S-27S-28S-29S-30S-31S-32S-33BohSampleFig. 5.2d. Nickel (Ni) concentration (mg/kg) in Soils <strong>of</strong> <strong>Mardan</strong> District139
9075Cr (mg/kg)604530150S-1S-2S-3S-4S-5S-6S-7S-8S-9S-10S-11S-12S-13S-14S-15S-16S-17S-18S-19S-20S-21S-22S-23S-24S-25S-26S-27S-28S-29S-30S-31S-32S-33BohSampleFig. 5.2e. Chromium (Cr) concentration (mg/kg) in Soils <strong>of</strong> <strong>Mardan</strong> District3.503.002.50Cd (mg/kg)2.001.501.000.500.00S-1S-2S-3S-4S-5S-6S-7S-8S-9S-10S-11S-12S-13S-14S-15S-16S-17S-18S-19S-20S-21S-22S-23S-24S-25S-26S-27S-28S-29S-30S-31S-32S-33BohSampleFig. 5.2f. Cadmium (Cd) concentration (mg/kg) in Soils <strong>of</strong> <strong>Mardan</strong> District140
As (mg/kg)2724211815129630S-1S-2S-3S-4S-5S-6S-7S-8S-9S-10S-11S-12S-13S-14S-15S-16S-17S-18S-19S-20S-21S-22S-23S-24S-25S-26S-27S-28S-29S-30S-31S-32S-33BohSampleFig. 5.2g. Arsenic (As) concentration (mg/kg) in Soils <strong>of</strong> <strong>Mardan</strong> District141
Fig.5.3a. Map showing Copper (Cu) concentration (mg/kg) in Soils <strong>of</strong> <strong>Mardan</strong>District142
Fig.5.3b. Map showing Lead (Pb) concentration (mg/kg) in Soils <strong>of</strong> <strong>Mardan</strong>District143
Fig.5.3c. Map showing Zinc (Zn) concentration (mg/kg) in Soils <strong>of</strong> <strong>Mardan</strong>District144
Fig.5.3d. Map showing Nickel (Ni) concentration (mg/kg) in Soils <strong>of</strong> <strong>Mardan</strong>District145
Fig.5.3e. Map showing Chromium (Cr) concentration (mg/kg) in Soils <strong>of</strong><strong>Mardan</strong> District146
Fig.5.3f. Map showing Cadmium (Cd) concentration (mg/kg) in Soils <strong>of</strong><strong>Mardan</strong> District147
Fig.5.3g. Map showing Arsenic (As) concentration (mg/kg) in Soils <strong>of</strong> <strong>Mardan</strong>District148
CHAPTER 6DISCUSSIONDistrict <strong>Mardan</strong> is a part <strong>of</strong> Peshawar valley which lies between latitude 34° 05′to 34° 32′ North <strong>and</strong> longitude 71° 48′ to 72° 25′ East. It is bounded on the north-east byBuner District, on the north <strong>and</strong> north-west by Malak<strong>and</strong> protected area, on the south-eastby Swabi, on the south by Nowshera District <strong>and</strong> on the west by Charsadda. Totalpopulation <strong>of</strong> the District is about 1.6 million having1632 square km 2 area (SDNP, 2003).Geologically <strong>Mardan</strong> can be differentiated into hilly area <strong>and</strong> south western plain area(DCR, 1998). In eastern part <strong>of</strong> the District Salkala Formation, Tanowal Formation <strong>and</strong>Ambela Granitic complex while in south, outcrops <strong>of</strong> Shahbaz Garhi are observed.Source <strong>of</strong> irrigational water in the District mainly comes from the upper <strong>and</strong> lower SwatCanal <strong>and</strong> their tributaries. Beside Swat Canals other sources include seasonal streams(Khwars), perennials streams, artesisn wells, tube wells <strong>and</strong> dug wells. Majority <strong>of</strong> thesurface water is drained to Kabul River (DCR, 1998). Water <strong>and</strong> soil data from thedifferent localities were studied <strong>and</strong> anaylised <strong>and</strong> on the basis <strong>of</strong> their Physico-chemicalanalysis following discussion is made:WaterAmong the various physical parameters, temperature <strong>and</strong> pH <strong>of</strong> the watersamples were within permissible limits suggested by WHO (2004) <strong>and</strong> USEPA (2009).Turbidity was found relatively high (>5 NTU) in some samples. Turbidity in surfacewater ranged from 0.01 to 25.00 with average value <strong>of</strong> 7.85NTU (Table 4.1a). Samples149
from Bakhshali (25.00NTU) <strong>and</strong> Malkabad (24.00NTU) showed higher level <strong>of</strong> turbidity.Samples from shallow ground water showed turbidity in a range <strong>of</strong> 0.01 to 23.00NTUwith an average value <strong>of</strong> 4.26NTU (Table 4.1b), high turbidity was recorded from Z<strong>and</strong>oKali (13.40NTU), Chil (14.80NTU) <strong>and</strong> Pirabad (13.80NTU). Turbidity in deep groundwater ranged from 0 to 27.70NTU, highest value was notified in Bore water from HotiKali (27.70NTU), (Table 4.1c). Total dissolved solids in the water were withinpermissible limit (1000mg/l) <strong>of</strong> WHO (2004) except one sample from a H<strong>and</strong> Pump inJalala (1220mg/l) (Table 4.1b). Water samples from all the three sources showed elevatedvalues <strong>of</strong> EC (Table 4.1a, b, c, respectively). Surface water had EC in range <strong>of</strong> 132to1876µS/cm, elevated values had been recorded in the stream water <strong>of</strong> Sangi Murmur(809µS/cm) <strong>and</strong> in village Saidabad (1876µS/cm) near Takht Bhai (Table 4.1a).Relatively high levels <strong>of</strong> EC were found in Shallow ground water in the range <strong>of</strong> 154-2200µS/cm with average EC <strong>of</strong> 791µS/cm. Samples with relatively high EC values werefrom Garakol, Jh<strong>and</strong>ai, Garhi Kapora <strong>and</strong> Takht Bhai, Jalala, Chin B<strong>and</strong>a, <strong>and</strong> Kundur(Table 4.1b). Deep ground samples from Boring at Par Hoti, Jalala <strong>and</strong> tube wells <strong>of</strong>Chankari stop showed high EC level (Table 4.1c). Such results show that water <strong>of</strong> thestudy area has a great potential to dissolve salts <strong>and</strong> minerals.-2Among various Anions (SO 4 , NO - 3 , Cl - <strong>and</strong> HCO - 3 ), all were found within-the permissible limits <strong>of</strong> WHO <strong>and</strong> USEPA except HCO 3 , which was notified with highlevels in majority <strong>of</strong> water samples from all sources (Table 4.2a, b <strong>and</strong> c, respectively).Such elevated HCO - 3 content may be due to the dissolution <strong>of</strong> carbonates minerals.150
Similarly light elements cations (Ca, Mg, Na <strong>and</strong> K) were also comparedwith WHO <strong>and</strong> USEPA st<strong>and</strong>ards. Surface water <strong>of</strong> the study area had 39mg/l average Ca(Table 4.3a). The shallow water (Dug wells <strong>and</strong> H<strong>and</strong> pumps) <strong>of</strong> the <strong>Mardan</strong> Districtcontained relatively high Ca with average value <strong>of</strong> 63mg/l higher than average <strong>of</strong> 41mg/lin deep ground water (Table 4.b, c, respectively). Calcium content can be attributed to thepercolation <strong>of</strong> water through limestone <strong>and</strong> dolomite. High Ca (>75mg/l) content wasobserved in the water from the H<strong>and</strong> pumps <strong>and</strong> Dug wells <strong>of</strong> Jamal Garhi, Jahndai,Pump Korona, Takht Bhai, Jalala, Lund Khawr, Chil, Chin B<strong>and</strong>a, Katlung, Ghundo,Spainkai <strong>and</strong> Rustum. Sodium in all sort <strong>of</strong> water was present in level above WHO(2004) limit <strong>of</strong> 200 mg/l. Sodium content varied from 50 to 565 mg/l in surface water, 91to 616 mg/l in shallow ground water <strong>and</strong> 131 to 586mg/l in deep ground water (Table4.3a, b <strong>and</strong> c, respectively). In water <strong>of</strong> the study area high content <strong>of</strong> Na can be the result<strong>of</strong> dissolved minerals from the local NaCl <strong>and</strong> Na 2 CO 3 seems. Sedimentary evaporates<strong>and</strong> high saline conditions in the past can also be responsible for high Na concentration inwater. Both Mg <strong>and</strong> K were observed within permissible limits <strong>of</strong> WHO (2004), exceptone sample from Sowkai (56mg/l) with Mg above 50mg/l (Table 4.3c).On the basis <strong>of</strong> Cations, Anions <strong>and</strong> TDS water <strong>of</strong> the <strong>Mardan</strong> District has beenclassified as NaHCO 3 type through Piper classification scheme.In order to assess the health risk associated with heavy <strong>and</strong> trace elements(Mn, Fe, Cu, Pb, Zn, Ni, Cr, Cd <strong>and</strong> As) their concentration in water were compared withWHO <strong>and</strong> USEPA permissible limits.151
Average content <strong>of</strong> Fe in surface water was 98.57µg/l (Table 4.4a). Watersamples from Swat Canal at Sirai (497.75µg/l) <strong>and</strong> in irrigational channel at Bakhshali(356.00µg/l) were having Fe above USEPA (2009) permissible limit <strong>of</strong> 300µg/l(Fig.4.15a). In shallow ground water average Fe was notified as 160.85µg/l, samples withhigh concentration were from Takkar village (956.25µg/l) <strong>and</strong> Chingai Baba(1627.00µg/l), (Table 4.4b; Fig.4.15a). However, deep ground water had low averagecontent with a value <strong>of</strong> 40.88µg/l (Table 4.4c; Fig.4.15a). High content <strong>of</strong> Fe in surface<strong>and</strong> shallow ground water can be attributed to the oxidation <strong>of</strong> magnetite, hematite <strong>and</strong>other iron sulfide minerals.Mn concentration in majority <strong>of</strong> samples from all types <strong>of</strong> water was foundwithin permissible limit (50µg/l) <strong>of</strong> USEPA <strong>and</strong> WHO (Table 4.4a, b <strong>and</strong> c,respectively). Samples with relatively higher concentration were from M<strong>and</strong>at, Z<strong>and</strong>okali, Ch<strong>and</strong>ar <strong>and</strong> Hoti kali (Fig.4.15b).Copper concentration in surface water samples varied from 5 to 4838µg/l, <strong>and</strong>1 to 2496µg/l in shallow ground water (Table 4.4b; Fig.4.15c). All the samples from thedeep ground water sources were within permissible limit (2000µg/l) <strong>of</strong> WHO (2004) <strong>and</strong>USEPA (2009). The raised value <strong>of</strong> Cu in the surface <strong>and</strong> shallow ground water could bethe leaching <strong>of</strong> Cu from sulfide seems present in the area.Like other parts <strong>of</strong> the Peshawar Basin, <strong>Mardan</strong> District also showed highconcentration <strong>of</strong> Pb in water above 10µg/l <strong>and</strong> 15µg/l by WHO (2004) <strong>and</strong> USEPA152
(2009) respectively. Pb in surface water ranged from
<strong>and</strong> dolomite presence in the soil. Similarly the average distribution <strong>of</strong> silt (61.55%), clay(10.24%) <strong>and</strong> s<strong>and</strong> (28.24%) indicated the texture was dominantly silty loam (Table 5.2).Various light element oxides, trace <strong>and</strong> heavy metals concentration was measured <strong>and</strong>compared with values <strong>of</strong> normal soil suggested by Bohn et al. (2001).Agricultural soils <strong>of</strong> the study area had CaO content in range <strong>of</strong> 1.26 to19.56 % with average content <strong>of</strong> 8.66% (Table 5.3; Fig.5.1a). Value <strong>of</strong> CaO for normalagricultural soil is 2.5 % (Bohn et al., 2001). All the soil samples from the study areawere having elevated level <strong>of</strong> Ca which may be due to the weathering <strong>of</strong> limestone <strong>and</strong>dolomite, <strong>and</strong> the addition <strong>of</strong> superphosphate fertilizers to the soil. Although Ca isessential plant nutrient but its abundance may disturb the water <strong>and</strong> salt balance in theplants. On other h<strong>and</strong> the average value (1.59%) <strong>of</strong> MgO in the study area was near to thenormal value <strong>of</strong> 1.5% (Bohn et al., 2001), (Table 5.3; Fig.5.1b).Soil samples <strong>of</strong> the study area were highly enriched with NaO, with averagecontent <strong>of</strong> 13.26% (Table 5.3; Fig.5.1c). Sodium concentration in the soil <strong>of</strong> study areawas far higher than normal value <strong>of</strong> 1.5% (Bohn et al., 2001). This elevated level <strong>of</strong> Naalters the soil structure (Kabata-Pendias <strong>and</strong> Pendias, 1992), as well as harmful for plantsas it disturbs the salt-water balance. Sodium content in the soil <strong>of</strong> <strong>Mardan</strong> may be due tohigh concentration <strong>of</strong> salt that is built up in the soils <strong>of</strong> <strong>Mardan</strong> District due to high rate<strong>of</strong> evaporation <strong>of</strong> water contributed by the Swat River through irrigational means. Thewater logging <strong>and</strong> salinity remained the problem for long time in the <strong>Mardan</strong> Districtwhich has greatly affected the agriculture <strong>of</strong> the area. This problem has been dealt with154
y pumping out the saline water by tube wells <strong>and</strong> SCARP program, but still the problemexists to certain extent.Average K 2 O value in the studied soils was 3.14%, higher than the Bohn et al.(2001) value (1.5%) for normal agricultural soils (Table 5.3; Fig.5.1d). Samples withhigher values were from Farum Korona, Shahbaz Garhi, Gujrat, Gulshanabad, Malkabad,Yaqubabad, Ibrahim Khan Kali, Gujar Garhi, Takkar, Shergarh, Lund Khwur, JamalGarhi <strong>and</strong> Katlung. The elevated content <strong>of</strong> K 2 O could be due to the decomposition <strong>of</strong>feldspar, contributed to the studied soils by the granite rocks <strong>of</strong> alkaline province exposedin the northern parts <strong>of</strong> <strong>Mardan</strong> DistrictAmong the heavy <strong>and</strong> trace elements in the soils <strong>of</strong> <strong>Mardan</strong> District, Fe <strong>and</strong> Mnwere found within the limit suggested by Bohn et al. (2001) for normal agricultural soils.The rest <strong>of</strong> the elements such as Cu, Pb, Zn, Ni, Cr <strong>and</strong> Cd were found above the limits <strong>of</strong>normal agricultural soils.The average concentrations <strong>of</strong> Cu, Pb, Zn <strong>and</strong> Cd in the studied soils were foundas 28mg/kg, 27mg/kg, 96mg/kg <strong>and</strong> 2.33mg/kg respectively, which are higher than thevalues suggested by Bohn et al. (2001) for normal agricultural soil. This enhancement <strong>of</strong>Cu, Pb <strong>and</strong> Zn can be attributed by sulfide seems in the soils <strong>of</strong> the area (Watling, 2006).The average amount <strong>of</strong> Ni (49mg/kg) <strong>and</strong> Cr (60mg/kg) in the studied soils werefound higher than that <strong>of</strong> normal agricultural soils (Bohn et al., 2001). This enrichment in155
the studied soils could be due to the weathered material contributed by the mafic <strong>and</strong>ultramafic rocks exposed in the north-western part <strong>of</strong> <strong>Mardan</strong> District.The average amount <strong>of</strong> As (5.14mg/kg) in the studied soils was found within therange <strong>of</strong> normal soils (Kabata-Pendias <strong>and</strong> Pendias, 2001). These low values indicated nosignificant environmental threats due to As presence in the soils.It has been notified during this study that the soils <strong>of</strong> <strong>Mardan</strong> District havegreater input from geogenic sources <strong>and</strong> no anthropogenic sources are involved in themetal enrichment in the soils. The elevated concentration <strong>of</strong> various elements in the soilsas compare to the normal agricultural soil suggests that there could be environmentalimpacts on the ecosystem <strong>of</strong> the area.Health risk assessmentIn the study area, the health risk assessment; Average daily dose (ADD), hazardquotient (HQ) <strong>and</strong> cancer risk (CR) were calculated for the consumption <strong>of</strong> drinking(shallow <strong>and</strong> deep ground water). Table 6.1a <strong>and</strong> 6.2b have summarized the calculatedADD, HQ <strong>and</strong> CR values for heavy <strong>and</strong> trace elements.Health risk assessment <strong>of</strong> shallow ground waterThe minimum, maximum <strong>and</strong> average ADD values for trace <strong>and</strong> heavy elementsin shallow ground water were as following; Fe from 0.00 to 4.39E-02mg/kg-day withaverage value <strong>of</strong> 3.00E-03mg/kg-day, Mn from 0.00 to 2.11E-03mg/kg-day with average156
value <strong>of</strong> 5.00E-04mg/kg-day, Cu from 6.7E-02 to 7.00E-03mg/kg-day with average value<strong>of</strong> 7.00E-03mg/kg-day, Pb from 0.00 to 8.00E-04mg/kg-day with average value <strong>of</strong> 7.00E-05mg/kg-day, Zn from 0.00 to 1.13E-01mg/kg-day with average value <strong>of</strong> 1.90E-02mg/kg-day, Ni from 0.00 to 5.00E-04mg/kg-day with average value <strong>of</strong> 1.00E-04mg/kg-day, Cr from 0.00 to 1.00E-03mg/kg-day with average value <strong>of</strong> 2.00E-05mg/kg-day, Cd from 0.00 to 1.00E-04mg/kg-day, with average value <strong>of</strong> 2.00E-05mg/kg-day <strong>and</strong> As from 0.00 to 2.00E-04mg/kg-day with average value <strong>of</strong> 2.30E-05mg/kg-day (Table 6.1a).The ADD values were used to calculate the HQ <strong>of</strong> trace <strong>and</strong> heavy elements inthe shallow ground water. The HQ values <strong>of</strong> these elements were found as; Fe from 0.00to 17.57 with average value <strong>of</strong> 1.20, Mn from 0.00 to 0.01 with average value <strong>of</strong> 0.00, Cufrom 0.00 to 1.82 with average value <strong>of</strong> 0.19, Pb from 0.00 to 0.22 with average value <strong>of</strong>0.02, Zn from 0.00 to 0.37 with average value <strong>of</strong> 0.06, Ni from 0.00 to 0.02 with averagevalue <strong>of</strong> 0.00, Cr from 0.00 to 0.00 with average value <strong>of</strong> 0.00, Cd from 0.00 to 0.23 withaverage value <strong>of</strong> 0.04, As from 0.00 to 0.70 with average value <strong>of</strong> 0.07 (Table 6.1a).Majority <strong>of</strong> trace <strong>and</strong> heavy elements were found with HQ values 10 for Fe. Similarly 7% sampleswere recorded with HQ value >1-
The cancer risk values were calculated only for Arsenic in shallow ground watersamples. It ranged from 0.00 to 1.10E-04 with average value <strong>of</strong> 3.47E-05. According toUSEPA approach 1999 these values indicate low cancer risk.Health risk assessment <strong>of</strong> deep ground waterValues <strong>of</strong> calculated ADD for different trace <strong>and</strong> heavy elements were asfollows; Fe from 0.00 to 3.20E-03mg/kg-day with average value <strong>of</strong> 7.00E-04mg/kg-day,Mn from 0.00 to 4.00E-03 mg/kg-day with average value <strong>of</strong> 8.00E-04mg/kg-day, Cufrom 5.00E-04 to 2.30E-02mg/kg-day with average value <strong>of</strong> 3.00E-03 mg/kg-day, Pbfrom 0.00 to 9.00E-04mg/kg-day with average value <strong>of</strong> 7.00E-05 mg/kg-day, Zn from1.00E-05 to 3.50E-02mg/kg-day with average value <strong>of</strong> 8.00E-03mg/kg-day, Cd from0.00 to 3.87E-05mg/kg-day with average value <strong>of</strong> 1.60E-05mg/kg-day <strong>and</strong> As from 0.00to 7.70E-05mg/kg-day with average value <strong>of</strong> 2.17E-05mg/kg-day. However, Ni showednegligible ADD values (6.1b).HQ values based on the ADD for trace <strong>and</strong> heavy elements in deep groundwater samples were as follows; Fe from 0.00 to 1.26 with average value <strong>of</strong> 0.26, Mn from0.00 to 0.25 with average value <strong>of</strong> 0.05, Cu from 0.01 to 0.61 with average value <strong>of</strong>0.082, Pb from 0.00 to 0.26 with average value <strong>of</strong> 0.02, Zn from 0.00 to 0.11 withaverage value <strong>of</strong> 0.25, Ni from 0.00 to 0.01 with average value <strong>of</strong> 0.00, Cd from 0.00 to0.07 with average value <strong>of</strong> 0.03 <strong>and</strong> As from 0.00 to 0.25 with average value <strong>of</strong> 0.07(6.1b). However, Ni <strong>and</strong> Cr showed negligible values <strong>of</strong> HQ (6.1b). It is clear from the158
HQ values that majority <strong>of</strong> sample were having no risk (HQ=
HCO 3 -Cu (r = -0.524), HCO 3 -Zn (r = -0.591), HCO 3 -Ni (r = -0.688), Ca-Cu (r = -0.444),Na-Ni (r = -0.516), K-Fe (r =-0.467 ), Mn-Cd (r = -0.453), (Table 6.2a).Shallow ground waterIn shallow ground water sources some <strong>of</strong> physio-chemical parameters pairsshowed positive correlation such as; pH-As (r = 0.582), EC-TDS (r = 0.991), EC-SO 4 (r =0.748), EC-NO 3 (r = 0.472), EC-Cl (r = 0.820), EC-HCO 3 (r = 0.865), EC-Mg (r = 0.562), EC-Cr (r = 0.478), EC-As (r = 0.426), TDS- SO 4 (r = 0.761), TDS- NO 3 (r = 0.487),TDS-Cl (r = 0.821), TDS-HCO 3 (r = 0.860), TDS-Mg (r = 0.589), TDS-As (r = 0.447),SO 4 -NO 3 (r = 0.527) , SO 4 -Cl (r = 0.778), SO 4 - HCO 3 (r = 0.547) , SO 4 -Mg (r = 0.449),NO 3 -Mg (r = 0.629) , NO 3 -Cr (r = 0.550), Cl HCO 3 (r = 0.665), ClAs (r = 0.400), HCO 3 -Mg (r = 0.575), HCO 3 -As (r = 0.453), K-Mn (r = 0.411), Fe-Cu (r = 0.657), Fe-Pb (r =0.931), Fe-Zn (r = 0.401), Fe-Ni (r = 0.859), Cu-Pb (r = 0.592), Cu-Ni (r = 0.489), Pb-Zn(r = 0.564), Pb-Ni (r = 0.852). While some pair also showed negative correlation such as;EC-Zn (r = -0.409), EC-Ni (r = -0.405), HCO 3 -Fe (r = -0.490), HCO 3 -Zn (r = -0.438),HCO 3 -Ni (r = -0.473), (Table 6.2b).Deep ground waterIn deep ground water some <strong>of</strong> the selected physio-chemical parameters showedstrong positive correlation such as; pH-As (r = 0.705), EC-TDS (r = 0.999), EC-NO 3 (r =0.768), pH-HCO 3 (r = 0.686) , pH-K (r = 0.564), pH-Mn (r = 0.637), TDS-NO 3 (r = 0.772),TDS-HCO 3 (r = 0.678), TDS-K (r = 0.572), TDS-Mn (r = 0.652), SO 4 -NO 3 (r = 0.807) ,SO 4 –Cl (r = 0.842), SO 4 -K (r = 0.805), NO 3 -Cl (r = 0.667), NO 3 -K (r = 0.884), NO 3 -Mn160
(r = 0.693), Cl-K (r = 0.636), Ca-As (r = 0.797), Mg-Na (r = 0.602), Mg-Cu (r = 0.536),K-Mn (r = 0.583), Fe-Cd (r = 0.686), Pb-Ni (r = 0.956), Pb-As (r = 0.816), Cr-As (r =0.550). While some <strong>of</strong> the pairs showed negative correlation like; pH-Ca (r = -0.725),NO 3 -Cr (r = -0.704), Ca-As (r = -0.797), (Table 6.2c).Pearson correlation <strong>of</strong> related physio-chemical parameters in soilsIn order to asses correlation among different physio-chemical parameters in soil,Pearson correlation method was applied. Table 6.3 summarized the correlation <strong>of</strong>selected physio-chemical parameters. The result showed that some <strong>of</strong> pairs had strongpositive correlation such as; pH-MgO (r = 0.369), Cond-TDS (r = 0.998), Cond-Pb (r =0.509), TDS-Pb (r = 0.500), MgO-Fe 2 O 3 (r = 0.460), MgO-Cu (r = 0.459), MgO-Ni (r =0.446), MgO-Cr (r = 0.447), MgO-Cd (r = 0.491), Fe 2 O 3 -Cu (r =0.381), Cu-Ni (r = 0.818,p =0.01),Cu-Cr (r = 0.870),Ni-Cr (r = 0.870). Pairs with negative correlation werefound as; pH-Cond (r = -0.345), pH-Cd (r = -0.602), K 2 O-MnO (r = -0.590), (Table 6.3).161
Table.6.1a. Health risk assessment (ADD, HQ <strong>and</strong> CR) <strong>of</strong> trace <strong>and</strong> heavy elements in Shallow ground water <strong>of</strong> <strong>Mardan</strong>District.ADD (mg/kg-day)RangeFe Mn Cu Pb Zn Ni Cr Cd As0.00-4.39E-020.00-2.11E-036.70E-02-7.00E-030.00-8.00E-04 0.00-1.13E-010.00-5.00E-040.00-1.00E-030.00-1.00E-040.00-2.00E-04Average 3.00E-03 5.00E-05 7.00E-03 7.00E-05 1.90E-02 1.00E-04 2.00E-04 2.00E-05 2.30E-05HQRange 0.00-17.57 0.00-0.01 0.00-1.82 0.00-0.22 0.00-0.37 0.00-0.02 0.00-0.00 0.00-0.23 0.00-0.07Average 1.20 0.003 0.19 0.02 0.06 0.00 0.00 0.04 0.07CRRange ND ND ND ND ND ND ND ND0.00-3.10E-04Average ND ND ND ND ND ND ND ND 3.47E-05*ADD (Average daily dose).*HQ (Hazard quotient).* CR (Cancer risk).* ND (Not determined)162
Table 6.1b. Health risk assessment (ADD, HQ <strong>and</strong> CR) <strong>of</strong> trace <strong>and</strong> heavy elements in Deep ground water <strong>of</strong> <strong>Mardan</strong> District.ADD (mg/kg-day)RangeFe Mn Cu Pb Zn Ni Cr Cd As0.00-3.20E-030.00-4.00E-035.00E-4-2.3E-020.00-9.00E-041.00E-05-3.50E-02 0.00-0.000.00-5.00E-040.00-3.87E-050.00-7.70E-05Average 7.00E-04 8.00E-04 3.00E-03 7.00E-05 8.00E-03 0.00 2.00E-04 1.60E-05 2.17E-05HQRange 0.00-1.26 0.00-0.25 0.01-0.61 0.00-0.26 0.00-0.11 0.00-0.01 0.00-0.00 0.00-0.07 0.00-0.25Average 0.26 0.05 0.08 0.02 0.00 0.00 0.00 0.03 0.07CR0.00-1.00E-Range ND ND ND ND ND ND ND ND04Average ND ND ND ND ND ND ND ND 4.00E-05*ADD (Average daily dose).*HQ (Hazard quotient).* CR (Cancer risk).* ND (Not determined)163
Table 6.2a. Correlation between different parameters in Surface water <strong>of</strong> <strong>Mardan</strong> DistrictpH EC TDS SO 4-2NO 3-Cl - -HC0 3 Ca Mg Na K Mn Fe Cu Zn Ni Cd Cr AspH 1 0.418 -0.012 0.123 -0.086 -0.187 0.114 0.077 0.110 -0.283 -0.105 -0.209 -0.065 0.106 0.114 -0.007 0.343 -0.006 -0.308EC 1 0.548 * 0.452 * -0.222 0.041 0.509 * 0.033 0.686 ** -0.011 -0.013 -0.141 -0.452 * -0.323 -0.326 -0.218 0.007 0.041 0.107TDS1 0.798 ** -0.181 0.283 0.895 ** -0.027 0.314 0.741 ** 0.121 -0.453 * -0.775 ** -0.544 * -0.541 * -0.720 ** -0.019 -0.087 -0.017-2SO 4-NO 31 -0.205 0.196 0.621 ** -0.020 0.441 0.635 ** 0.009 -0.444 * -0.514 * -0.370 -0.372 -0.561 * 0.122 -0.336 0.0681 -0.090 -0.165 -0.127 -0.176 -0.061 0.107 0.175 0.048 -0.171 0.058 0.022 -0.049 -0.028 0.182Cl - 1 0.385 -0.151 -0.126 0.287 0.305 0.225 -0.281 -0.234 -0.263 -0.504 * -0.191 -0.268 0.397-HC0 3 1 -0.093 0.099 0.689 ** 0.096 -0.284 -0.696 ** -0.524 * -0.591 ** -0.688 ** -0.123 0.091 -0.119Ca 1 0.228 -0.220 0.008 -0.326 -0.280 -0.444 * 0.097 -0.241 0.327 -0.184 -0.275Mg 1 -0.143 0.127 -0.150 -0.307 -0.270 -0.284 -0.027 -0.016 -0.063 0.347Na 1 -0.097 -0.251 -0.421 -0.322 -0.307 -0.516 * -0.132 0.053 -0.114K 1 0.107 -0.467 * -0.390 -0.143 -0.168 0.038 -0.196 0.615 **Mn 1 0.259 0.013 0.098 0.466 * -0.453 * 0.105 0.452 *Fe 1 0.837 ** 0.421 0.706 ** 0.004 0.271 -0.102Cu 1 0.312 0.559 * 0.055 0.266 -0.185Zn 1 0.502 * -0.022 0.063 -0.285Ni 1 -0.156 0.377 0.041Cd 1 -0.128 -0.047Cr 1 -0.290As 1*. Correlation is significant at the 0.05 level (2-tailed).**. Correlation is significant at the 0.01 level (2-tailed).164
Table 6.2b. Correlation between different parameters in Shallow ground water <strong>of</strong> <strong>Mardan</strong> DistricpH EC TDS SO 4-2NO 3-Cl - -HC0 3 Ca Mg Na K Mn Fe Cu Pb Zn Ni Cr Cd AspH 1 0.082 0.090 0.066 -0.205 0.213 0.066 -0.517 ** -0.009 0.031 0.104 0.002 0.023 -0.047 0.263 0.348 0.130 0.114 -0.157 0.582 **EC 1 0.991 ** 0.748 ** 0.472 * 0.820 ** 0.865 ** -0.098 0.562 ** 0.124 0.324 -0.074 -0.355 -0.199 -0.381 -0.392 -0.385 0.478 * -0.240 0.426 *TDS 1 0.761 ** 0.487 * 0.821 ** 0.860 ** -0.109 0.589 ** 0.148 0.369 -0.058 -0.365 -0.216 -0.391 -0.409 * -0.405 * 0.490 * -0.249 0.447 *-2SO 4-NO 31 0.527 ** 0.778 ** 0.547 ** 0.037 0.449 * -0.062 0.344 0.029 -0.176 -0.206 -0.206 -0.304 -0.266 0.328 -0.059 0.2451 0.319 0.314 0.021 0.629 ** 0.134 0.272 -0.076 -0.056 0.055 -0.119 -0.082 -0.086 0.550 ** -0.065 -0.068Cl - 1 0.665 ** -0.155 0.354 0.034 0.237 0.049 -0.182 -0.184 -0.203 -0.344 -0.271 0.497 * -0.204 0.408 *-HC0 3 1 0.033 0.575 ** 0.090 0.151 0-.109 -0.490 * -0.184 -0.506 ** -0.438 * -0.473 * 0.314 -0.220 0.493 *Ca 1 0.085 -0.074 -0.117 -0.089 -0.387 -0.311 -0.338 -0.154 -0.356 -0.230 0.279 -0.496 *Mg 1 0.307 0.231 -0.171 -0.372 0.052 -0.373 -0.378 -0.367 0.231 -0.085 -0.039Na 1 0.288 -0.128 -0.115 0.150 -0.068 0.066 0.091 0.093 -0.058 -.225K 1 0.411 * -0.141 -0.125 -0.123 0.005 -0.241 0.181 -0.337 0.016Mn 1 -0.060 -0.176 -0.134 -0.190 -0.217 -0.195 -0.133 0.096Fe 1 0.657 ** 0.931 ** 0.401 * 0.859 ** 0.165 -0.174 0.006Cu 1 0.592 ** 0.124 0.489 * 0.067 -0.228 -0.052Pb 1 0.564 ** 0.852 ** 0.161 -0.155 0.069Zn 1 0.553 ** -0.039 -0.218 -0.015Ni 1 0.122 -0.175 -0.023Cr 1 -0.183 0.202Cd 1 -0.273As 1*. Correlation is significant at the 0.05 level (2-tailed).**. Correlation is significant at the 0.01 level (2-tailed).165
Table.6.2c. Correlation between different parameters in Deep ground water <strong>of</strong> <strong>Mardan</strong> DistrictpH EC TDS SO 4-2NO 3-Cl - -HC0 3 Ca Mg Na K Mn Fe Cu Pb Zn Ni Cr Cd AspH 1 -0.123 -0.110 -0.078 -0.188 0.159 -0.293 -0.725 ** 0.229 0.441 0.008 0.078 -0.117 0.466 0.197 0.060 0.169 0.053 0.320 0.705 **EC 1 0.999 ** 0.421 0.768 ** 0.507 0.686 ** -0.046 0.221 0.173 0.564 * 0.637 * -0.333 -0.368 -0.549 -0.306 -0.408 0.061 -0.176 -0.162TDS 1 0.417 0.772 ** 0.501 0.678 ** -0.058 0.210 0.175 0.572 * 0.652 ** -0.329 -0.378 -0.534 -0.289 -0.411 0.043 -0.185 -0.166-2SO 4-NO 31 0.807 ** 0.842 ** 0.286 -0.115 0.165 0.045 0.805 ** 0.327 -0.440 -0.253 -0.375 -0.327 -0.027 -0.189 -0.202 0.0761 0.667 * 0.468 -0.086 0.151 -0.155 0.884 ** 0.693 * -0.556 -0.310 -0.465 -0.117 -0.132 -0.764 ** -0.439 -0.220Cl - 1 0.206 -0.242 0.025 -0.008 0.636 * 0.270 -0.353 -0.295 -0.352 -0.378 -0.078 -0.194 0.000 0.345-HC0 3 1 0.224 0.443 0.484 0.292 0.131 -0.211 -0.405 -0.595 -0.284 -0.464 0.421 -0.095 -0.365Ca 1 -0.315 -0.429 -0.405 -0.195 -0.046 -0.424 -0.496 0.277 -0.375 -0.162 -0.499 -0.797 **Mg 1 0.602 * 0.188 0.065 -0.531 0.536 * -0.277 -0.196 -0.175 0.571 * 0.210 0.093Na 1 0.232 0.069 -0.092 0.242 -0.101 -0.333 -0.080 0.503 0.315 0.183K 1 0.583 * -0.189 -0.139 0.262 -0.349 0.127 -0.173 -0.039 0.059Mn 1 -0.224 0.001 0.048 0.021 -0.008 -0.285 -0.111 0.008Fe 1 -0.088 0.621 0.366 0.596 -0.130 0.686 * 0.182Cu 1 0.292 -0.022 0.342 0.272 0.382 0.406Pb 1 -0.033 0.956 ** 0.667 0.476 0.816 *Zn 1 0.156 -0.289 -0.185 0.017Ni 1 0.048 0.452 0.520Cr 1 0.218 0.259Cd 1 0.550 *As 1*. Correlation is significant at the 0.05 level (2-tailed)**. Correlation is significant at the 0.01 level (2-tailed).166
Table 6.3. Correlation between different parameters in Soils <strong>of</strong> <strong>Mardan</strong> DistrictpH EC TDS CaO MgO Na 2 O K 2 O Fe 2 O 3 MnO Cu Pb Zn Ni Cr Cd AspH 1 -0.345 * -0.324 0.068 0.369 * -0.184 -0.220 -0.344 -0.063 0.172 -0.072 0.099 0.129 0.283 0.602 ** 0.072Cond 1 0.998 ** -0.200 0.065 0.046 0.313 0.204 0.106 0.316 0.509 ** -0.024 0.323 0.235 -0.284 -0.163TDS 1 -0.189 0.081 0.038 0.326 0.201 0.081 0.319 0.500 ** -0.030 0.330 0.247 -0.282 -0.153CaO 1 -0.021 -0.238 -0.196 0.127 -0.035 -0.101 -0.166 -0.231 -0.122 0.044 -0.075 0.061MgO 1 -0.200 0.199 0.460 ** -0.304 0.459 ** 0.205 -0.066 0.446 ** 0.447 ** 0.491 ** 0.092Na 2 O 1 0.214 -0.069 0.236 -0.310 -0.120 0.178 -0.310 -0.299 -0.162 -0.019K 2 O 1 0.154 -0.590 ** -0.080 0.311 -0.105 0.128 -0.039 -0.123 -0.102Fe 2 O 3 1 0.028 0.381 * 0.097 -0.246 0.309 0.307 -0.085 -0.018MnO 1 0.108 -0.244 0.095 -0.187 -0.032 -0.204 -0.125Cu 1 0.188 0.136 0.818 ** 0.870 ** 0.193 0.095Pb 1 -0.032 0.257 0.135 0.342 -0.028Zn 1 -0.131 -0.046 0.050 0.017Ni 1 0.847 ** 0.207 0.205Cr 1 0.255 0.069Cd 1 0.127As 1*. Correlation is significant at the 0.05 level (2-tailed).**. Correlation is significant at the 0.01 level (2-tailed).167
CHAPTER 7CONCLUSION• The physical parameters (T, pH, TDS, EC <strong>and</strong> turbidity) were found within thepermissible limits. However, few water samples showed relatively highconcentrations <strong>of</strong> EC <strong>and</strong> turbidity.• Different anions such as NO 3 - , Cl - <strong>and</strong> SO 4 - were found within permissible limits.However, HCO 3 - was found higher than the permissible limits.• Among the light elements Ca <strong>and</strong> Na were present above the permissible limits.While K, Mg, <strong>and</strong> Mn were found within permissible limits <strong>of</strong> WHO <strong>and</strong> USEPA,except one water sample collected from Malkabad showed high Mnconcentration.• The Fe concentration in water samples was within permissible limits except twosurface water samples collected from Sirai <strong>and</strong> Bakhshali villages; <strong>and</strong> twoshallow ground water samples collected from Takkar <strong>and</strong> Chingai Baba villages.• Some water samples from the study area contained Pb above permissible limitslike samples from Bakhshali, Saidabad near Takht Bhai, Sirai, Takkar, ChingaiBaba <strong>and</strong> Torru.168
• The trace <strong>and</strong> heavy elements such as Cu, Zn, Ni, Cr, Cd <strong>and</strong> As in water sampleswere found within permissible limits <strong>of</strong> WHO <strong>and</strong> USEPA. However, Ni showedrelatively high concentration in one sample collected from Malkabad.• No significant health risk was observed on the basis <strong>of</strong> HQ <strong>and</strong> CR. However,elevated concentration <strong>of</strong> certain elements in water samples may cause healthproblems.• Stronger positive <strong>and</strong> negative correlation was observed among pairs <strong>of</strong> variousphysio-chemical parameters in water.• The dominant texture <strong>of</strong> the soils <strong>of</strong> the study area was “Silty Loam” with colorindicating highly weathered mineral configuration.• All the physical parameters i.e., pH, EC <strong>and</strong> TDS <strong>of</strong> the soils were found withinnormal range.• The major elements oxides such as CaO, MgO, Na 2 O <strong>and</strong> K 2 O in the soil sampleswere found multi folds higher than those <strong>of</strong> the normal agricultural soils, whilethe Fe 2 O 3 <strong>and</strong> MnO were found within permissible limits.169
• All the trace <strong>and</strong> heavy elements (Cu, Pb, Zn, Ni, Cr <strong>and</strong> Cd) in the soil sampleswere found in higher concentrations than those <strong>of</strong> normal agricultural soils.• Soil samples showed stronger positive <strong>and</strong> negative correlation among pairs <strong>of</strong>physio-chemical parameters.• The geogenic sources are responsible for that increasing amount <strong>of</strong> various light,heavy <strong>and</strong> trace elements in both water <strong>and</strong> soil samples <strong>of</strong> the <strong>Mardan</strong> District.170
RECOMMENDATIONS• As shallow ground water sources have been reported with relatively high values<strong>of</strong> different parameters so, it is suggested that the old dug wells <strong>and</strong> h<strong>and</strong> pumpsshould be renewed or replaced with deep ground water wells.• The old pipes supplying drinking water from tube wells should be replaced withthe new ones.• Proper salinity control programmes should be adopted throughout the wholeDistrict to reduce salts content in soils <strong>and</strong> their seepage to ground water sources.• Fertilizers <strong>and</strong> other agro chemicals should be used properly in agricultural fieldsso that accumulation <strong>of</strong> various hazardous elements can be avoided.• Monitoring <strong>of</strong> both water <strong>and</strong> soils <strong>of</strong> the District <strong>Mardan</strong> in regard toenvironmental health risk assessment should be performed regularly in future.171
REFERENCESAbollino, O., Mal<strong>and</strong>rino, M., Mentasi, E., Sarzanini, C. & Petrella, F., 2002. Heavy metals insoils from piedmont Italy: Distribution, specification <strong>and</strong> chemometric data treatment.Chemosphere, 49, 545-557.Adriano, D.C., 1986. Lead. In: Trace Elements in the Terrestrial Environment, Springer, NewYork, 219–256.Adriano, D.C., Bolan, N.S., Bonjun, K., Naidu, R., Lelie, D., Vangronsveld, J. & Wenzel, W.W.,2002. Natural remediation processes: Bioavailability interactions in contaminated soils,symposium No.42, 17 th WCSS, Thail<strong>and</strong>, 501.Agarwal, K., Sharma, A. & Talukder, G., 1990. Clastogenic effects <strong>of</strong> copper sulphate on thebone marrow chromosomes <strong>of</strong> mice in vivo. Mutat. Res., 243, 1–6.Agency for Toxic Substances <strong>and</strong> Disease Registry (ATSDR),1999.Toxicology pr<strong>of</strong>ile formercury. Department <strong>of</strong> Health <strong>and</strong> Human Services, Washington DC.Agency for Toxic Substances <strong>and</strong> Disease Registry (ATSDR), 2000. Toxicological pr<strong>of</strong>ile formanganese. Atlanta, GA, US Department <strong>of</strong> Health <strong>and</strong> Human Services, Public HealthService, Agency for Toxic Substances <strong>and</strong> Disease Registry.Ahmad, A., Kahlown, M.A., Tahir, A. & Rashid, H., 2004. Arsenic an emerging Issue:Experiences from <strong>Pakistan</strong>. 30th WEDC International Conference, Vientiane.Ahmad, I., 1986. Petro<strong>chemistry</strong> <strong>of</strong> Shewa Shahbaz Garhi complex, <strong>Mardan</strong>. UnpublishedM.Phil thesis, University <strong>of</strong> Peshawar.Akhter, P., Ashraf, N., Mohammad, D., Orfi, S.D. & Ahmad, N., 2003. Nutritional <strong>and</strong>radiological impact <strong>of</strong> dietary potassium on the <strong>Pakistan</strong>i population. Food <strong>and</strong> Chem.Toxicol., 41, 531-34.Alam, S., Kamei, S. & Kawai, S., 2001. Effect <strong>of</strong> iron deficiency on the chemical composition <strong>of</strong>the xylem sap <strong>of</strong> barley. Soil Sci <strong>and</strong> Plant Nutrit., 47, 643–649.Ali, A.A., Ater, A., Sunahara, G.I. & Robidouxa, P.Y., 2004. Phytotoxicity <strong>and</strong> bioaccumulation<strong>of</strong> copper <strong>and</strong> chromium using barley (Hordeum vulgare L.) in spiked artificial <strong>and</strong>natural forest soils. Ecotox. Environ. Safety., 57, 363–374.Allaby, M., 1989. In dictionary <strong>of</strong> environment. 3 rd Ed. N.Y University press, New York, 423.Alloway, B.J., 1995. Heavy Metals in Soils, 2nd Ed. Blackie, London, 25-48.172
Alloway, B.J. & Ayres, D.C., 1997. Chemical principles <strong>of</strong> environmental pollution. BlackieAcademic <strong>and</strong> Pr<strong>of</strong>essional, London, 205.Arain, M.B., Kazi, T.G., Jamali, M.K., Afridi, H.I., Jalbani, N. & Shah, A., 2008. Total dissolved<strong>and</strong> bioavailable elements in water <strong>and</strong> sediment samples <strong>and</strong> their accumulation inOreochromis mossambicus <strong>of</strong> polluted Manchar Lake. Chemosphere, 70, 1845–1856.Archer, F.C. & Hodgson, I.H., 1987. Total <strong>and</strong> extractable trace element contents <strong>of</strong> soils inEngl<strong>and</strong> <strong>and</strong> Wales. J. Soil Sci., 38, 421–432.Arienzo, M., Christen, E.W., Quayle, W. & Kumar, A., 2009. A review <strong>of</strong> the fate <strong>of</strong> potassiumin the soil–plant system after l<strong>and</strong> application <strong>of</strong> wastewaters. J. Hazd. Mater., 164, 415–422.Aschner, M., Viterella, D., Allen, J.W., Conklin, D.R. & Cowan, K.S., 1998. Methylmercuryinducedastrocytic swelling is associated with activation <strong>of</strong> the Na+/H+ antiporter, <strong>and</strong> isfully reversed byamiloride. Brain Res., 799, 207–14.America Water Works Association (AWWA), 1996. Internal Corrosion <strong>of</strong> Water DistributionSystems, 2 nd Ed. American Water Works Association, Denver, Colorado.Bansal, R.L. & Nayyar, V.K., 1999. Evaluation <strong>of</strong> soil extractants for Mn availability <strong>and</strong>response <strong>of</strong> wheat to applied Mn in soils <strong>of</strong> semi-arid zone <strong>of</strong> Punjab, India. Nutrit. Cylc.Agroecos., 53, 139–146.Begum, S., 2007. Environmental studies <strong>of</strong> soils, water <strong>and</strong> plants associated with the mafic <strong>and</strong>ultramafic rocks in Kabal-Mingora, area Swat, Northern <strong>Pakistan</strong>. Unpublished M.Philthesis, University <strong>of</strong> Peshawar.Bennett, M.R., Bennett, S. & Doyte, P., 1997. Environmental Geology: Geology And TheHuman Environment. John Willy <strong>and</strong> Sons, New York, 10-40.Berg, M., Tran, H.C., Nguyen, T.C., Pham, H. V., Schertenleib, R. & Giger, W., 2001. ArsenicContamination <strong>of</strong> Groundwater <strong>and</strong> Drinking Water in Vietnam: A Human Health Threat.Environ. Sci. Technol., 35, 2621-2626.Bhattacharjee, Y., 2001. Excess iron intake increases risk <strong>of</strong> intestinal infections. 614, 292-8456;retrieved from http://www.scienceblog.com/community.Bhattacharyya, R., Jana, J., Nath, B., Sahu, S.J., Chatterjee, D. & Jacks, G., 2003. GroundwaterAs mobilization in Bengal delta plain, the use <strong>of</strong> ferralite as a possible remedial measure:a case study. Appl. Geochem., 18, 1435–1451.Bibi, M.H., Ahmad, F. & Ishiga, H., 2008. Geochemical study <strong>of</strong> arsenic concentrations ingroundwater <strong>of</strong> the Meghna River Delta, Bangladesh. J. Geochem. Explor., 97, 43-58.173
Bohn, H.L., McNeal, B. L. & O’Connor, G.A., 2001. Soil <strong>chemistry</strong>, 3 rd Ed. John Wiley <strong>and</strong>Sons, Inc. New York, 30-286.Bothwell, T.H., Charlton, R.W., Cook, J.D. & Finch, C.A., 1979. Iron Metabolism in Man.Blackwell Scientific, Oxford, U.K.Bowell, R.J., 1994. Sorption <strong>of</strong> arsenic by iron oxides <strong>and</strong> oxyhydroxides in soils. Appl.Geochem., 9, 279–86.Burden, E., 1961. The toxicology <strong>of</strong> nitrates <strong>and</strong> nitrites with particular reference to thepotability <strong>of</strong> water supplies. Analyst, 86(1024), 429–33.Cao, Q., Hu, Q., Khan, S., Wang, Z., Lin, A., Du, X. & Zhu, Y., 2007. Wheat phytotoxicity fromarsenic <strong>and</strong> cadmium separately <strong>and</strong> together in solution culture <strong>and</strong> in a calcareous soil.J. Hazd. Mater., 148, 377–382.Carbonellu, A.A., Aarabi, M.M., DeLaune, R.D., Gambrell, R.P. & Patrick, W.H., 1998. Arsenicin wetl<strong>and</strong> vegetation: Availability, phytotoxicity, uptake <strong>and</strong> effects on plant growth <strong>and</strong>nutrition. Sci.Total Environ., 217, 189-199.Castilho, P.D. & Chardon, W.J., 1995. Uptake <strong>of</strong> soil cadmium by three field crops <strong>and</strong> itsprediction by a pH-dependent Freundlich sorption model. Plant <strong>and</strong> Soil, 171, 263–666.Cooper, C.M. & Gillespie, W.B., 2001. Arsenic <strong>and</strong> mercury concentrations in major l<strong>and</strong>scapecomponents <strong>of</strong> an intensively cultivated watershed. Environ. Poll., 111, 67-74.Cover, L., 1997. Risk management <strong>and</strong> hazardous chemicals. CRC, Publications, New York,USA.Cunningham, W.P., Cunningham, M.A. & Saigo, B.W., 2007. Environmental sciences, 9 th Ed.Mcgraw Hill Company, New York.Curzon, M.E.J. & Bibby, B.G., 1970. Effect <strong>of</strong> heavy metals on dental caries <strong>and</strong> tooth eruption.J. Dent. Child., 37, 463–465.Das, P., Samantaray, S. & Rout, G. R., 1997. Studies on cadmium toxicity in plants: A Review.Environ. Poll., 98, 29-36.Davis, M. & Masten, S., 2003. Principles <strong>of</strong> environmental engineering <strong>and</strong> science, 3 rd Ed.Mcgraw Hill Company, New York.Department <strong>of</strong> National Health <strong>and</strong> Welfare (DNHW), 1992. Guidelines for Canadian drinkingwater quality: Supporting documentation, Ottawa.Dinakar, N., 2008. Phytotoxicity <strong>of</strong> cadmium on protein, proline <strong>and</strong> antioxidant enzymeactivities in growing Arachis hypogaea seedlings. J. Environ. Sci., 20, 199–206.174
District Census Report <strong>of</strong> <strong>Mardan</strong> District (DCR),1998.Draycott, A.P. & Christenson, D.R., 2003. Nutrients for sugar beet production: Soil-plantrelationship. CABI Publication, Wallingford, U.K, 60-62.Dudka, S. & Miller, W. P., 1998. Permissible concentration <strong>of</strong> arsenic <strong>and</strong> lead in soil based onrisk assessment. Water, Air, Soil, Poll., 113, 127–132.Elinder, C.G., 1986. Zinc. In: Friberg, L., Nordberg, G.F. & Vouk, V.B. (Eds). H<strong>and</strong>book on thetoxicology <strong>of</strong> metals, 2nd Ed. Elsevier Science Publishers, Amsterdam, 664-679.Emmanuel, E., Pierre, M.G. & Perrodin, Y., 2009. Groundwater contamination bymicrobiological <strong>and</strong> chemical substances released from hospital wastewater: Health riskassessment for drinking water consumers. Environ. Inter., 35, 718–726.Farooqi, A., Masuda, H. & Firdous, N., 2007. Toxic fluoride <strong>and</strong> arsenic contaminatedgroundwater in the Lahore <strong>and</strong> Kasur Districts, Punjab, <strong>Pakistan</strong> <strong>and</strong> possiblecontaminant sources. Environ. Poll., 145, 839-849.Florence, T.M., Lumsden, B.G. & Fardy, J.J., 1984. Algae as indicators <strong>of</strong> copper speciation. In:Kramer, C.J.M., Duinker, J.C. (Eds). Complexation <strong>of</strong> trace metals in natural waters.Maritimus Publishers, Hague, 411–424.Florijn, P.J. & Van Beusichem, M.L., 1993. Uptake <strong>and</strong> distribution <strong>of</strong> cadmium in maize inbredlines. Plant Soil, 150, 25–32.Fontes, R.L.S. & Cox, F.R., 1998. Zinc toxicity in soybean grown at high iron concentration innutrient solution. J. Plant Nutrit., 21, 1723–1730.Foy, C.D., 1983. Plant adaptation to mineral stress problem in soil. Iowa states J. Res., 57, 339.Gannea, P., Cappuynsa, V., Vervoortb, V., Buve, L. & Swennen, R., 2006. Leachability <strong>of</strong> heavymetals <strong>and</strong> arsenic from slags <strong>of</strong> metal extraction industry at Angleur (eastern Belgium.Sci.Total Environ., 356, 69– 85.Giang Luu, T.T., Sthiannopkao, S. & Kim, K.W., 2008. Arsenic <strong>and</strong> other trace elementscontamination in groundwater <strong>and</strong> a risk assessment study for the residents in the K<strong>and</strong>alProvince <strong>of</strong> Cambodia. Environ. Inter., 35, 455-460.Goyer, R.A. & Clarkson, T.W., 2001. Toxic Effects <strong>of</strong> Metals. In: Klaussen, C.D., (Ed). Casarett<strong>and</strong> Dull's toxicology: the basic science <strong>of</strong> poisons. New York: McGraw-Hill, 811–867.Graham, R.D., Welch, R.M., Grunes, D.L., Cary, E.E. & Norvell, W.A., 1987. Effect <strong>of</strong> ZincDeficiency on the Accumulation <strong>of</strong> Boron <strong>and</strong> Other Mineral Nutrients in Barley. SoilSci. Soc. Ame. J., 51, 652.175
Gratao, P.L., Polle, A., Lea, P.J. & Azevedo, A., 2005. Making the life <strong>of</strong> heavy metal-stressedplants a little easier. Funct. Plant Biol., 32, 481–494.Guillemant, J., Le, H.T., Accarie, C., du Moncel, S.T., Delabroise, A.M., Arnaud, M.J. &Guillemant, S. 2000. Mineral water as a source <strong>of</strong> dietary calcium: acute effects onparathyroid function <strong>and</strong> bone resorption in young men. Ame. J. Clin. Nutrit., 71, 999–1002.Gutknecht, J., 1981. Inorganic mercury (Hg 2+ ) transport through lipid bilayer membranes. J.Membr. Biol., 61, 61–66.Hausenbuiller, R.L., 1972. Soil science: Principles <strong>and</strong> Practices, Wm. C Brown CompanyPublishers, USA, 9-69.Hingston, J. A., Collins, C. D., Murphy, R. J. & Lester, J. N., 2001. Leaching <strong>of</strong> chromatedcopper arsenate wood preservatives: A review. Environ. Poll., 111, 53–66.Inskeep, W.P., McDermott, T.R. & Fendorf, S., 2002. Arsenic (V) <strong>and</strong> (III) cycling in soil <strong>and</strong>natural waters: chemical <strong>and</strong> microbiological processes. In: Frankenberger, W.T., Jr (Ed).Environmental Chemistry <strong>of</strong> Arsenic. Marcel Dekker, New York, 183-215.Jain, V.K., 2006. Fundamentals <strong>of</strong> plant physiology. S.Ch<strong>and</strong> <strong>and</strong> company Ltd, Ram Nagar,New Delhi, India, 23-30.Janus, J.A. & Krajnc, E.I., 1990. Integrated criteria document chromium: Effects. Appendix.Bilthoven, Netherl<strong>and</strong>s, National Institute <strong>of</strong> Public Health <strong>and</strong> EnvironmentalProtection.Javied. S., Mehmood, T., Chaudhary, M.M., Tufail, M. & Irfan, N., 2009. Heavy metal pollutionfrom phosphate rock used for the production <strong>of</strong> fertilizer in <strong>Pakistan</strong>. Microchem. J., 91,94-99.Jehan, N., (1985)., Geology <strong>of</strong> a part <strong>of</strong> Shewa Shehbaz garhi complex, District <strong>Mardan</strong>,<strong>Pakistan</strong>. Unpublished M.Sc thesis, University <strong>of</strong> Peshawar.Jonesa, A.R., Lytlea, C.M., Stonea, R.L., Hansenb, L.D. & Smitha, B.N., 2000.Methylcyclopentadienyl manganese tricarbonyl (MMT), plant uptake <strong>and</strong> effects onmetabolism. Thermochimica Acta, 349, 141-146.Kanai, M., Hirai, M., Yoshiba, M., Tadano, T. & Higuchi, K., 2009. Iron deficiency causes zincexcess in Zea may. Soil Sci. Plant Nutrit., 55, 271–276Karagas, M.R., Tosteson, T.D., Blum, J., Klaue, B., Weiss, J.E., Stannard, V., Spate, V. &Morris, J.S., 2000. Measurement <strong>of</strong> low levels <strong>of</strong> arsenic exposure: a comparison <strong>of</strong> water<strong>and</strong> toenail concentrations. Ame. J. Epidemiol., 152, 84–90.176
Karenn, B. & Baired. D., 2001. Survey <strong>of</strong> heavy metals in sediments <strong>of</strong> Swartkops River estuary,Port Elizabeth, South Africa. Water SA., 27 (4), 461-466.Kazi, T.G., Arain, M.B., Baig, J.A., Jamali, M.K., Afridi, H.I., Jalbanib, N., Sarfraz, R.A., Shah,A.Q. & Niaz, A., 2009.The correlation <strong>of</strong> arsenic levels in drinking water with theBiological samples <strong>of</strong> skin disorders. Sci. Total Environ., 407, 1019–1026.Kehrer, J.P., 2000. The Haber–Weiss reaction <strong>and</strong> mechanisms <strong>of</strong> toxicity. Toxicology, 149, 43–50.Khan, A.G., Kuek, C., Chaudhry, T.M., Khoo, C.S. & Hayes, W.J., 2000. Role <strong>of</strong> plants,mycorrhizae <strong>and</strong> phytochelators in heavy metal contaminated l<strong>and</strong> remediation.Chemosphere, 41, 197–207.Khan, A.R., Haq, I.U., Khan, W.A. & Khan, M., 2000. Quality characteristics <strong>of</strong> potable water <strong>of</strong><strong>Mardan</strong> city <strong>and</strong> surrounding areas. J.Chem. Soc. Pak., 22 (2), 87-93.Kiekens, L., 1990. Zinc: In Heavy Metals in Soils. Alloway, B.J. (Ed), Blackie Academic <strong>and</strong>Pr<strong>of</strong>essional, Glasgow, 284–305.Kobya, M., Demirbas, E., Senturk, E. & Ince, M., 2005. Adsorption <strong>of</strong> heavy metal ions fromaqueous solutions by activated carbon prepared from apricot stone. Bioresour. Technol.,96, 518–1521.Kornhauser, C., Wrobel, K., Wrobel, K., Malacara, J. M., Nava, L. E., Gomez, L. & Gonzalez,R., 2002. Possible adverse effect <strong>of</strong> chromium in occupational exposure <strong>of</strong> tanneryworkers. Industrial Health, 40(2), 207–213.Kosobrukhov, A., Knyazeva, I. & Mudrik, V., 2004. Plantago major plants responses to increasecontent <strong>of</strong> lead in soil: Growth <strong>and</strong> photosynthesis. Plant Growth Regul., 42, 145-151.Kotas, J. & Stasicka, Z., 2000. Chromium occurrence in the environment <strong>and</strong> methods <strong>of</strong> itsspeciation. Eniron. Poll., 107, 263-283.Krajnc, E. I., Van Gestel, C.A.M. & Mulder, H.C.M., 1987. Integrated criteria document.Cadmium-Effects. Appendix. National Institute <strong>of</strong> Public Health <strong>and</strong> EnvironmentalProtection, Bilthoven, Netherl<strong>and</strong>s, Report no. 758476004.Kumar, A. & Kookana, R.S., 2006. Impact <strong>of</strong> winery wastewater on ecosystem health. Finalreport to GWRDC, 139.Lam, J.C.W., Tanabe, S., Chan, S.K.F., Lam, M.H.W., Martin, M. & Lam, P.K.S., 2006. Levels<strong>of</strong> trace elements in green turtle eggs collected from Hong Kong: Evidence <strong>of</strong> risks due toselenium <strong>and</strong> nickel. Environ. Poll., 144, 790-801.177
Latif, S.A., Afroj, D., Hossain, S.M., Uddin, M.S., Islam, M.A., Begum, K., Oura, Y., Ebihara,M. & Katada, M., 2009. Determination <strong>of</strong> Toxic Trace Elements in Foodstuffs, Soils <strong>and</strong>Sediments <strong>of</strong> Bangladesh Using Instrumental Neutron Activation Analysis Technique.Environ. Contam. Toxicol., 82, 384-388.Lck, T.J., 1996. European Topic Centre on Inl<strong>and</strong> Water, Annual summary report, Doc numberp08/95-2, 22.Lee, C.W., Choi, J.M. & Pak, C.H., 1996. Micronutrient toxicity in seed geranium (Pelargonium× hortorum Baley). J. Ame. Soc. Hort. Sci., 121, 77–82.Liesegang, H., Lemake, K., Siddiqui, R.A. & Schlegel, H.G., 1993. Characterization <strong>of</strong> induciblenickel <strong>and</strong> cobalt resistance determinant from pMOL 28 <strong>of</strong> Alcaligenes eutrophes. J.Bacteriol., 175, 767–778.Lombi, E., Sletten, R.S. & Wenzel, W.W., 2000. Sequentially extracted arsenic from differentsize fractions <strong>of</strong> contaminated soil. Water, Air, Soil, Poll., 124, 319-332.Lund, W., 1990. Speciation analysis, why <strong>and</strong> how. Fresenius. J. Anal. Chem., 337, 557-641.Mackenzie L, D. & Susan J, M., 2004. Environmental engineering <strong>and</strong> science. Mcgraw HillCompany, New York, 1-242.Madhava Rao, K.V. & Sresty, T.V.S., 2000. Antioxidative parameters in the seedlings <strong>of</strong>pigeonpea (Cajanus cajan (L.) Millspaugh) in response to Zn <strong>and</strong> Ni stresses. Plant sci.,157, 113–128.M<strong>and</strong>al, B.K. & Suzuki, K.T., 2002. Arsenic round the world: a review. Talanta, 58, 201–235.Marin, A.R., Pezeshki, S.R., Masscheleyn, P.H. & Choi, H.S., 1993. Effect <strong>of</strong> dimethylarsenicacid (DMAA) on growth, tissue arsenic, <strong>and</strong> photosynthesis <strong>of</strong> rice plants. J. PlantNutrit., 16, 865–80.Marschner, H., 1995. Mineral Nutrition <strong>of</strong> Higher Plants, 2 nd Ed. Academic Press, London, 483-507.Martoanez, C.E. & Motto, H.L., 2000. Solubility <strong>of</strong> lead, zinc <strong>and</strong> copper added to mineral soils.Environ. Poll., 107, 153-158.Michaud, A.A., Chappellaz, C.C. & Hinsinger, P.P., 2008. Copper phytotoxicity affects rootelongation <strong>and</strong> iron nutrition in durum wheat (Triticum turgidum durum L). Plant Soil.,310, 1-2.Montgomery, C., 2006. Environmental Geology, 6 th Ed. Mc Graw Hill Company, New York.178
Mordvet, J.J. & Osborn, G., 1982. Studies on the chemical form <strong>of</strong> cadmium contaminants inphosphate fertilizers. Soil Sci., 134, 185–192.Moreno-Jimenez, E., Gamarra, R., Carpena-Ruiz, R.O., Millan, R., Penalosa, J.M. & Esteban, E.,2006. Mercury bioaccumulation <strong>and</strong> phytotoxicity in two wild plant species <strong>of</strong> Almadenarea. Chemosphere, 63, 1969–1973.Morgan, L.G. & Flint, G.N., 1989. Nickel alloys <strong>and</strong> coatings: release <strong>of</strong> nickel. In: NationalAcademy <strong>of</strong> Science. USA, 100, 11065–11069.Morton, W.E. & Dunette, D.A., 1994. Health effect <strong>of</strong> environmental arsenic. In: Arsenic in theenvironment, Part II: human <strong>and</strong> ecosystem effects, Wiley <strong>and</strong> Sons, New York, 17–34.MortvEd. J.J., 2000. Bioavailability <strong>of</strong> micronutrients: In H<strong>and</strong>book <strong>of</strong> Soil Science. Sumner,M.E. (Eds). CRC Press LLC, Boca Raton, Florida, D71–D86.Murray, R.C. & Tedrow, J.C.F., 1992. Forensic Geology, Prentice-Hall, New Jersey, 95-98.Murugesan, G.S., Sathishkumar, M. & Swaminathan, K. (Eds)., 2006. Arsenic removal fromgroundwater by pretreated waste tea fungal biomass. Bioresour. Technol., 97, 483-487.Nasreen, S., (2006). Monitoring <strong>of</strong> surface water, ground water, air <strong>and</strong> soil in Peshawar basinagainst time, the third dimension. Unpublished M.Phil thesis, University <strong>of</strong> Paehawar.National Academy <strong>of</strong> Sciences (NAS), 1980. Drinking water <strong>and</strong> health. National AcademyPress, Washington DC, 1980, 283-93.National Digestive Diseases Information Clearinghouse (NDDIC), 2009. Wilson Disease. NIHPublication No. 08–4684Needleman, H.L. & Bellinger, D., 1991. The health effects <strong>of</strong> low level exposure to lead. AnnualReview on Public Health, 12, 111–140.Neimi, G.J., Devore, P., Detenbeck, N., Taylor, D. & Lima, A., 1990. Overview <strong>of</strong> case studieson recovery <strong>of</strong> aquatic systems from disturbance. Environ. Mang., 14, 511-587.Nickson, R.T., McArthur, J.M., Shresitha, B., Myint-Kyaw, T.O. & Lowry, D., 2005. Arsenic<strong>and</strong> other drinking water quality issues, Muzaffargarh District, <strong>Pakistan</strong>. Appl.Geochem.,20, 55-68.Nolett, L.M.L., 2000. H<strong>and</strong> book <strong>of</strong> water analysis. Marcel Dakker Inc.Nordstrom, D.K., 2002. Worldwide occurrence <strong>of</strong> arsenic in groundwater. Science, 296, 2143–2144.179
Nwajei, G.E., Iwegbue, C.M.A. & Okafor, M.I., 2007. Heavy Metals in Surface Soils underWaste Dumps from Onitsha Nigeria. J. Biolog. Sci. Issue., 7, 405-408.O'Dell, B.L., 1984. History <strong>and</strong> status <strong>of</strong> zinc in nutrition. Federation proceedings, 43, 2821-2822.Onishi, H., 1969. Arsenic, in: Wedepohl, K.H., Ed. H<strong>and</strong>book <strong>of</strong> Geo<strong>chemistry</strong>. Springer-Verlag, New York, Vol. II-2, Chap 33.P<strong>and</strong>ey, N. & Sharma, C.P., 2002. Effect <strong>of</strong> heavy metals Co2+, Ni2+ <strong>and</strong> Cd2+ on growth <strong>and</strong>metabolism <strong>of</strong> cabbage. Plant Sci., 163, 2002, 753-758.Papanikolaou, N.C., Hatzidaki, E.G., Belivanis, S., Tzanakakis, G.N. & Tsatsakis., A.M., 2005.Lead toxicity update. A brief review. Med. Sci. Monit., 11, 329–36.PCRWR, National Water Quality Monitoring Programme Report 2006, Retrieved July 10, 2008,from http://www.pcrwr.gov.pk/arsenic_cp.Peavy, H.S. & Rowe, D.R., Tchobanoglous., 1985. Environmental engineering. McGraw-Hillbook Company, New York, 28.Pendias, K.A. & Pendias, H., 1992. Trace Elements in Soils <strong>and</strong> Plants, 2nd Ed. CRC Press, Inc.Boca Raton, Florida.Peris, M., Mico, C., Recatala, L., Sanchez, R. & Sanchez, J., 2007. Heavy metal contents inhorticultural crops <strong>of</strong> a representative area <strong>of</strong> the European Mediterranean region.Sci.Total Environ., 378, 42–48.Perk, M.V., 2006. Soil <strong>and</strong> water contamination: From molecule to catchment scale. Taylor <strong>and</strong>Francis Group Publication, London, UK, 85-96.Peter, A.M., 2000. Bioenergentics <strong>and</strong> the metabolism <strong>of</strong> carbohydrates <strong>and</strong> lipids. In: Robert,K.M., Daryl, K.G., Victor, W.R. (Eds). Harper’s bio<strong>chemistry</strong>, 25 th Ed. Sciencepublishing company, Beijing, China, 182–208.Pressman, A.H. & Buff, S., 2000. The complete idiot’s guide to vitamins <strong>and</strong> minerals, 2 nd Ed.Penguin Group Inc, USA, 189-197.Rafiq, M. & Jan, M.Q., 1989. Petrography <strong>of</strong> the Ambela granite complex, North West, <strong>Pakistan</strong>.Geol. Bull. Uni. Peshawar, 21, 27-48.Rahman, G. & Miah, M.A.M ., 2002. Arsenic Contamination in Drinking Water in KachuaUpazila <strong>of</strong> Ch<strong>and</strong>pur District: Problems <strong>and</strong> Programs for its Remedy.Rapant, S. & Krcmova, K., 2007. Health risk assessment maps for arsenic groundwater content:application <strong>of</strong> national geochemical databases. Environ. Geochem. Health., 29, 131–141.180
Read, H.H., 1970. Rutley's elements <strong>of</strong> mineralogy, 26th Ed. George Allen <strong>and</strong> Unwin, London,560.Ross, I.S., 1995. Reduced uptake <strong>of</strong> nickel by a nickel resistance strain <strong>of</strong> C<strong>and</strong>ida utilis.Microbios., 83, 261–70.Ryan, J., Estexen, G. & Rashid, A., 2001. Soil <strong>and</strong> plant analysis. Laboratory Mannual 2 nd Ed.ICARDA.S<strong>and</strong>ers, C.L., 1986. Toxicological aspect <strong>of</strong> energy production. MacMillan, New York, 158–162.S<strong>and</strong>mann, G. & Boger, O., 1980. Copper mediated lipid peroxidation process in photosynthesismembrane. Plant Physiol., 66, 797.Sarkar, D., Datta, R. & Sharma, S., 2005. Fate <strong>and</strong> bioavailability <strong>of</strong> arsenic in organo arsenicalpesticide-applied soils. Part-I: incubation study. Chemosphere, 60, 188–195.Sexton, K., Olden, K. & Johnson, B.L., 1993. Environmental justice: the central role <strong>of</strong> researchin establishing a credible scientific foundation for informed decision making. Toxicol.Indust. Health., 9, 685–727.Shah, A.Q., Kazi, T.G., Arain, M.B., Jamali, M.K., Afridi, H.I., Jalbani, N., Baig, J.A. &K<strong>and</strong>hro, G.A., 2009. Accumulation <strong>of</strong> arsenic in different fresh water fish species –potential contribution to high arsenic intakes. Food Chem., 112, 520–524.Sharma, D.C., Chatterjee, C. & Sharma, C.P., 1995. Chromium accumulation <strong>and</strong> its effects onwheat (Triticum aestivum L. c.v.Dh 2204) metabolism. Plant Sci., 111, 145–151.Sharma, D.C., Chatterjee, C. & Sharma, C.P., 1995. Chromium accumulation <strong>and</strong> its effects onwheat (Triticum aestivum L. c.v.Dh 2204) metabolism. Plant Sci., 111, 145–151.Sievers, H. & Meyer, F.M., 2003. Parameters influencing the efficiency <strong>of</strong> copper extraction.Erzmetall, 56, 420–25.Simons-Morton, D.G., Hunsberger, S.A., Van Horn, L., Barton, B.A., Robson, A.M. &McMahon, R.P., 1997. Nutrient intake <strong>and</strong> blood pressure in the Dietary InterventionStudy in children. Hypertension, 29, 930–36.Singh, K.P., Malik, A., Mohan, D. & Sinha, S., 2004. Multivariate statistical techniques forevaluation <strong>of</strong> Spatial <strong>and</strong> temporal variations in water quality <strong>of</strong> Gomti River (india): ACase study. Water Res., 38, 3980-3992.Smedley, P.L. & Kinniburgh, D.G., 2002. A review <strong>of</strong> the source, behaviour <strong>and</strong> distribution <strong>of</strong>arsenic in natural waters. Appl. Geochem., 17, 517–568.181
Smeets, K., Cuypers, A., Lambrechts, A., Semane, B., Hoet, P., Laere, A.V. & Vangronsveld, J.,2005. Induction <strong>of</strong> oxidative stress <strong>and</strong> antioxidative mechanisms in Phaseolus vulgarisafter Cd application. Plant Physio. Biochem., 43, 437–444.Smith, E., Naidu, R., Alston, A.M. E., 1999. Sorption <strong>of</strong> arsenate <strong>and</strong> arsenite by four Australiansoils. J. Environ. Quality., 28, 1719-1726.Sparks, D.L., 2003. Environmental soil <strong>chemistry</strong>, 2 nd Ed. Acedamic Press, California, USA,288-290.Srivastava, M.L., 2002. Physio, chemical <strong>and</strong> microbiological characteristic <strong>of</strong> water. Daya PubHouse, Delhi, India.Srivastava, M.l., 2004. Environmental <strong>chemistry</strong>. Shree publishers <strong>and</strong> distributors, 20 Ansariroad, Darya ganj, New Delhi-110002, 37-69.Sthiannopkao, S., Kim, K.W., Sotham, S. & Choup, S., 2008. Arsenic <strong>and</strong> manganese in tubewell waters <strong>of</strong> Prey Veng <strong>and</strong> K<strong>and</strong>al Provinces, Cambodia. Appl. Geochem., 23, 1086-1093.Stiborova, M., Ditrichova, M. & Brezinova, A., 1987. Effect <strong>of</strong> heavy metal ions on growth <strong>and</strong>biochemical characteristics <strong>of</strong> photosynthesis <strong>of</strong> barley <strong>and</strong> maize seedlings. Biol. Plant.,29, 453–467.Sun, G., Liu, J., Luong, T.V., Sun, D. & Wang, L., 2004. Endemic arsenicosis: a clinicaldiagnostic with photo illustrations. UNICEF East Asia <strong>and</strong> Pacific Regional Office,Bangkok, Thail<strong>and</strong>.Sustainable Development National Programme (SDNP), District Websites 2003. Retrieved onMay 27, 2008, from http://www.sdnpk.org/-1kSzabolcs, I., 1989. Salt affected soils. CRC Press Inc., Boca Raton, Floria, 274.Talajtan, 43, 113–132.Tamasi, G., Cini, R., 2004. Heavy metals in drinking waters from Mount Amiata (Tuscany,Italy). Possible risks from arsenic for public health in the Province <strong>of</strong> Siena. Sci. TotalEnviron., 327, 41–51Tamura, H., Honda, M., Sato, T. & Kamachi, H., 2005. Pb hyperaccumulation <strong>and</strong> tolerance incommon buckwheat. J.Plant Res., 118, 355–359.Tanaka, K., 1994. Causes <strong>of</strong> Photooxidative Stress <strong>and</strong> Amelioration <strong>of</strong> Defense Systems inPlants. Foyer, C.H., Mullineaux, P.M. (Eds.), CRC Press, Boca Raton, Florida, 365.182
Toppi L, S., Gabbrielli, R., 1999. Response to cadmium in higher plants. Environ. Exp. Bot., 40,105–30.Trivedi, P.R. & Raj, G., 1992. Water pollution. Akashdeep publishers, New Delhi, 1-162.US. Environmental Protection Agency (USEPA), 1987.Office <strong>of</strong> Drinking Water: Healthadvisory—Chromium. Washington, DC, US.US. Environmental Protection Agency (USEPA), 2009. Drinking water contaminents. USEPA,Washington, DC.Uttley, C., 2000. The elements: Magnesium. Marshall Cavendish Corporation, New York, USA.Wang, A.S., Angle, J.S., Chaney, R.L., Delorme, T.A. & McIntosh, M., 2006. Changes in soilbiological activities under reduced soil pH during Thlaspi caerulescens phytoextraction.Soil Biol. Biochem., 38, 1451–1461.Watling, H.R., 2006. The bioleaching <strong>of</strong> sulphide minerals with emphasis on copper sulphides: areview, <strong>Hydro</strong>metallurgy, 84, 81–108.World Health Organization (WHO), 1984. Guidelines for drinking water quality.Vol.1.2.Recommendation, WHO, Geneva, 130.World Health Organization (WHO), 2004. Guidelines for drinking water quality, 3 rd Ed. WorldHealth Organization, Geneva.World Health Organization (WHO), 2005. Nutrients in Drinking Water. World HealthOrganization, Geneva, 186.World Health Organization (WHO a ), 2009. Calcium <strong>and</strong> Magnesium in Drinking-water: Publichealth significance.World Health Organization (WHO a ), 1996. Chloride in drinking water: World HealthOrganization, Geneva.World Health Organization (WHO b ), 2009. Potassium background. Revised Document.World Health Organization (WHO b ), 1996. Guidelines for drinking water quality, 6 th Ed. WorldHealth Organization, Geneva.Wild, A., 1996. Soils <strong>and</strong> the environment, Cambridge University Press, New York, 4-53.Willett, W.C., Stampfer, M.J., Colditz, G.A., Rosner, B.A. & Speizer, F.E., 1990. Relation <strong>of</strong>meat, fat, <strong>and</strong> fiber intake to the risk <strong>of</strong> colon cancer in a prospective study amongwomen. New Engl. J. Med., 323, 1664–1672.183
Wilson, M.D.L., 1992. High Sodium/Potassium ratio. Originally the Eck Institute Bulletin.Wong, S.C., Li, X.D., Zhang, G., Qi, S.H. & Min, Y.S., 2002. Heavy metals in agricultural soils<strong>of</strong> the Pearl River Delta, south China. Environ. Poll., 119, 33–44.Woolhouse, H.W. & Walker, S., 1981. The physiological basis <strong>of</strong> copper toxicity <strong>and</strong> coppertolerance in higher plants. In: Loneragan, J.F., Robson, A.D., Grahm, R.D., (Eds). Copperin soil <strong>and</strong> plants. Academic Press, New York, 235.Yang, Y., Zhang, F.S., Li, H.F. & Jiang, R.F., 2009.Accumulation <strong>of</strong> cadmium in the edible parts<strong>of</strong> six vegetable species grown in Cd-contaminated soils. J. Environ. Manage., 90, 1117–1122.Yi, T.H., Ching, H.K., 2003. Changes in protein <strong>and</strong> amino acid contents in two cultivars <strong>of</strong> riceseedlings with different apparent tolerance to cadmium. Plant Growth Regul., 40, 147–155.Zalups, R.K. & Lash, L.H., 1996. Interactions between glutathione <strong>and</strong> mercury in the kidney,liver, <strong>and</strong> blood. In: Chang, L.W., (Ed). Toxicol metals. Boca Raton, Florida, CRC Press,145–163.Zhou, Q.X., Cheng, Y., Zhang, Q.R. & Liang, J.D., 2003. Quantitative analyses <strong>of</strong> relationshipsbetween ecotoxicological effects <strong>and</strong> combined pollution. Sci. China Ser., C33, 566–573.Zhou, Q.X. & Huang, G.H., 2001.Environmental Biogeo<strong>chemistry</strong> <strong>and</strong> Global EnvironmentalChanges. Beijing: Science Press.184