Access to HealthCare Swabi and Buner Districts - Médecins du Monde
Access to HealthCare Swabi and Buner Districts - Médecins du Monde
Access to HealthCare Swabi and Buner Districts - Médecins du Monde

You also want an ePaper? Increase the reach of your titles
YUMPU automatically turns print PDFs into web optimized ePapers that Google loves.
<strong>Access</strong> <strong>to</strong> <strong>HealthCare</strong><strong>Swabi</strong> <strong>and</strong> <strong>Buner</strong> <strong>Districts</strong>Khyber Pakhtunkhwa – PakistanOc<strong>to</strong>ber 2010Medecins <strong>du</strong> <strong>Monde</strong> - France
This report was written byAdeline LaulaniéSurvey AdvisorEmergency mission in PakistanMédecin <strong>du</strong> <strong>Monde</strong> FranceThe survey was con<strong>du</strong>cted byShamim Akhtar - Survey assistantMuhammad Ishaq - Survey assistantSadaf Sehar - Enumera<strong>to</strong>rSehrash Jabeen - Enumera<strong>to</strong>rJalal Tariq Khan - Enumera<strong>to</strong>rDanish Ahmad - Enumera<strong>to</strong>rFor further information, please contactGeneral Coordina<strong>to</strong>rEmergency mission in PakistanMédecin <strong>du</strong> <strong>Monde</strong>IslamabadPakistansurvey.kpk.mdmpakistan@gmail.comMédecins <strong>du</strong> <strong>Monde</strong> Page | 3
Page | 4Médecins <strong>du</strong> <strong>Monde</strong>
ACKNOWLEDGMENTSWe are grateful <strong>to</strong> the Ministry of Health <strong>and</strong> we especially acknowledge the Executive DistrictOfficers of Health (EDO Health), the District Coordination Officers (DCO), the AssistantCoordination Officers (ACO) <strong>and</strong> Head of the Social Welfare Department of <strong>Swabi</strong> <strong>and</strong> <strong>Buner</strong>districts who supported our actions in doing this survey.Special thanks are <strong>du</strong>e <strong>to</strong> the residents of all the villages we visited in <strong>Swabi</strong> <strong>and</strong> <strong>Buner</strong> fortheir time <strong>and</strong> the information they shared with us. Without their participation <strong>and</strong> support, thisproject would not have been possible.We also thank the MDM team based in <strong>Swabi</strong> for its help in the preparation <strong>and</strong> organizationof the survey.The assistance provided by the survey team members is highly appreciated.Médecins <strong>du</strong> <strong>Monde</strong> Page | 5
Page | 6Médecins <strong>du</strong> <strong>Monde</strong>
TABLE OF CONTENTSAcknowledgments ................................................................................................................................... 5Table of contents ..................................................................................................................................... 7Acronyms <strong>and</strong> Abbreviations .................................................................................................................. 9Executive summary ............................................................................................................................... 11I. Context ........................................................................................................................................... 161.1 Intro<strong>du</strong>ction............................................................................................................................ 161.2 Background ........................................................................................................................... 161.3. MDM in Pakistan ................................................................................................................... 171.4. Rationale ............................................................................................................................... 181.5. Health facilities in <strong>Swabi</strong> <strong>and</strong> <strong>Buner</strong> ...................................................................................... 191.6. Survey Objectives ................................................................................................................. 21II. Methodology ...................................................................................................................................... 222.1. Study area ............................................................................................................................. 222.2. Qualitative survey .................................................................................................................. 222.3. Quantitative survey ............................................................................................................... 242.4. Disclaimer.............................................................................................................................. 29III. Results of the survey........................................................................................................................ 303.1. Focus Group Discussions .......................................................................................................... 303.2. Quantitative survey ..................................................................................................................... 32Appendix 1: Questionnaire .................................................................................................................... 70Médecins <strong>du</strong> <strong>Monde</strong> Page | 7
Page | 8Médecins <strong>du</strong> <strong>Monde</strong>
ACRONYMS AND ABBREVIATIONSACOANCBHUDCODHQEDO HEPIFGDIDPKPKMdMNWFPLHVLHWMCHOPDPNCRHCTBATTUCWHOAssistant Coordination OfficerAntenatal CareBasic Health UnitDistrict Coordination OfficerDistrict Head QuarterExecutive District Officer of HealthExp<strong>and</strong>ed Programme of ImmunisationFocus Group DiscussionInternally Displaced PersonKhyber PakhtunkhwaMédecins <strong>du</strong> <strong>Monde</strong>North West Frontier ProvinceLady Health Visi<strong>to</strong>rLady Health WorkerMother <strong>and</strong> ChildOutpatient DepartmentPostnatal CareRural Health CentreTraditional Birth AttendantTetanus ToxoidUnion CouncilWorld Health OrganizationMédecins <strong>du</strong> <strong>Monde</strong> Page | 9
Page | 10Médecins <strong>du</strong> <strong>Monde</strong>
EXECUTIVE SUMMARYIn response <strong>to</strong> the military operations in Swat valley <strong>du</strong>ring the first half of 2009, Médecins <strong>du</strong><strong>Monde</strong> initiated a programme <strong>to</strong> support the displaced population from Swat Valley, Northern<strong>Buner</strong> <strong>and</strong> their host population in <strong>Swabi</strong> <strong>and</strong> <strong>Buner</strong> districts of Khyber Pakhtunkhwaprovince. The programme consisted of providing primary <strong>and</strong> maternal health care includingnutritional <strong>and</strong> immunization components. The programme has been able <strong>to</strong> reach over 77400 patients up until <strong>to</strong>day.As part of the Médecins <strong>du</strong> <strong>Monde</strong>’s operational <strong>and</strong> exit strategy, a survey on the access <strong>to</strong>health care has been con<strong>du</strong>cted throughout July <strong>and</strong> August 2010 in order <strong>to</strong> identify theaccess <strong>to</strong> health issues one year after the crisis. The objective of this analysis is <strong>to</strong> increaseinsight for all partners involved from local <strong>and</strong> provincial authorities <strong>to</strong> several humanitarianac<strong>to</strong>rs present in order <strong>to</strong> effectively address health access problematic of this specific region.The survey has been con<strong>du</strong>cted in two phases in which all types of access restrictions havebeen taken in<strong>to</strong> account. Physical <strong>and</strong> geographical accesses are linked <strong>to</strong> functional <strong>and</strong>quality questions, social cultural access <strong>and</strong> financial limitations. During the process we havegiven special attention <strong>to</strong> vulnerable groups such as children <strong>and</strong> pregnant women. The firstphase consisted of focus groups discussions (FGDs) with men <strong>and</strong> women separately in fourvillages. The general insight resulting from these discussions supported the questionnaire forthe cluster survey which has been con<strong>du</strong>cted in July <strong>and</strong> August 2010. The questionnaire hasbeen con<strong>du</strong>cted in 31 villages reaching a r<strong>and</strong>omly selected 617 head of household <strong>and</strong>mothers (50%/50%). Of the villages visited, 16 are located in <strong>Swabi</strong> (320 persons) <strong>and</strong> 15 in<strong>Buner</strong> (197 persons).In this summary we will give a broad outline of our main findings while the underlying detailscan be found in the rest of the report.General Healthcare <strong>Access</strong>Global access <strong>to</strong> healthcare in <strong>Swabi</strong> <strong>and</strong> <strong>Buner</strong> is in line with theprovincial averageEven though the access <strong>to</strong> health care in <strong>Swabi</strong> <strong>and</strong> <strong>Buner</strong> districts is comparable <strong>to</strong> thewhole of Khyber Pakhtunkhwa province, in absolute terms, the access <strong>to</strong> health care is prettylow.The access is unequal among the population. Households living in <strong>Swabi</strong>, e<strong>du</strong>cated, wealthier<strong>and</strong> living in an accessible village have a better access <strong>to</strong> healthcare.Médecins <strong>du</strong> <strong>Monde</strong> Page | 11
Financial issues form the main constraint for healthcare access in bothdistricts52% of the interviewees mentioned that their main constraint <strong>to</strong> access a health care facility isof financial nature.This financial issue is linked <strong>to</strong> the distance <strong>to</strong> the facility as the transportation cost constitutesa big part in the final cost. In <strong>Buner</strong> district where the villages are more remote than in <strong>Swabi</strong>,the average consultation cost including tests, medicines <strong>and</strong> transportation is approximately30% higher than in <strong>Swabi</strong>.Also, the financial issue has a bigger impact in <strong>Buner</strong> than in <strong>Swabi</strong>: A consultation <strong>to</strong> healthfacility represents 14% of the monthly income in <strong>Buner</strong>, where the households are usuallypoorer, <strong>and</strong> 9% in <strong>Swabi</strong>.Geographical constraints are more important in <strong>Buner</strong> than in <strong>Swabi</strong><strong>Buner</strong> is a more remote district than <strong>Swabi</strong>. Therefore the accessibility <strong>to</strong> health facilities ismore difficult than in <strong>Swabi</strong> which has an impact on the access <strong>to</strong> healthcare in many ways.• Transportation fees represent 10% of the final cost of consultation, especiallybecause there is no other option than taking a taxi, which is more expensive thanother forms of public transport.• In some villages, there is no car available <strong>du</strong>ring the day so the person sometimeshas <strong>to</strong> wait for a minimum of one day for a car <strong>to</strong> return which can lead <strong>to</strong> somecomplications meanwhile.• 31% of the children don’t get fully immunized because the facility is <strong>to</strong>o far.Limited awareness on preventive careAwareness seems <strong>to</strong> be a recurring problem for the preventive care such as antenatal care(ANC), postnatal care (PNC) <strong>and</strong> vaccination. Most of the time the people do not underst<strong>and</strong>the purpose <strong>and</strong> therefore do not realise the importance of preventive care consultations.Maternal HealthcareMotive for having antenatal check-ups depends on the household profileThe percentage of pregnant women getting an antenatal check-up is 60% which is in line withthe provincial average (54%).However, there is a strong relationship between the level of e<strong>du</strong>cation <strong>and</strong> income of thehousehold <strong>and</strong> the reason why the antenatal check-up is attended. The higher e<strong>du</strong>cated <strong>and</strong>richer the household, the more routinely antenatal visits take place. 70% of the pregnantwomen living in a household earning more than 10000 rupees is going for a routine check-up.Page | 12Médecins <strong>du</strong> <strong>Monde</strong>
On the other h<strong>and</strong>, 65% of the une<strong>du</strong>cated women going for an antenatal visit are going onlyin case of an assumed medical problem.The low percentage of routine check up among the une<strong>du</strong>cated people is <strong>du</strong>e <strong>to</strong> a lack ofawareness (43% of the answers), financial issue (34% of the answers).More than half of all antenatal care visits is taking place in private clinic<strong>du</strong>e <strong>to</strong> unavailability in the public system56% of all antenatal care visits is done in private clinics. Private clinics are mentioned <strong>to</strong> bepreferred for the following reasons:• The opening times of private clinics are more flexible, compared <strong>to</strong> the basic healthunits (BHUs) <strong>and</strong> rural health centres (RHCs) which are closing usually at 13:00.• People have the idea they will get better treatment in a private clinic than ingovernment health facility. Also, doc<strong>to</strong>rs are known <strong>to</strong> allocate more time <strong>to</strong> theirpatients in private clinic.• Lady doc<strong>to</strong>rs are more available in private clinics than in government health centres.Half of all pregnant women are not immunized against tetanus <strong>du</strong>e <strong>to</strong> alack of awareness27% of the households where the mother did not get the TT injections mention this is becausethey were not aware they should have it. 21% of the interviewees say it is <strong>to</strong>o far <strong>to</strong> get it <strong>and</strong>10% answered it is not cus<strong>to</strong>mary.Pregnant women living in more e<strong>du</strong>cated families usually get vaccinated as they know aboutit.Most of the time, TT vaccination is not part of the antenatal check-up when it is done in aprivate clinic. Either they do not have the tetanus <strong>to</strong>xoid available or charge for it. The womenthen have <strong>to</strong> specifically go <strong>to</strong> a government health centre <strong>to</strong> get the injection. There isapparently a lack of health e<strong>du</strong>cation as the pregnant women who go <strong>to</strong> a private clinic for anantenatal check-up not necessarily go <strong>to</strong> a government health centre <strong>to</strong> get immunized.One in two deliveries are not attended by a medically skilled personPeople living in remote places, mostly also the poorer households, don’t get the assistance ofa medically skilled person <strong>and</strong> usually deliver home.Financial issue remains the main reason why some women deliver without any skilled person.The average cost of a delivery in a facility is over 6000rs <strong>and</strong> cost of transportation <strong>to</strong> thefacility have <strong>to</strong> be added <strong>to</strong> it. Then, the cost of a home delivery with a skilled person isaround 1500rs which is still an considerable amount. Finally the average cost of the deliveryattended by friends or relatives is a lot cheaper as the people buy just some medicines if needbe <strong>and</strong> is less than 200rs.Médecins <strong>du</strong> <strong>Monde</strong> Page | 13
Tradition of staying home 40 days after delivery prevents mothers ofgoing for a postnatal check-up73% of women do not get any postnatal check-up as they don’t see the necessity of it <strong>and</strong>since the tradition that the mother should stay home <strong>du</strong>ring 40 days after delivery is wellrespected. 67% of the mothers in <strong>Swabi</strong> <strong>and</strong> <strong>Buner</strong> districts only leave the house for the firsttime after 40 days.Among the mothers who got the postnatal check-up, 30% of them got it at home which is agood way <strong>to</strong> combine both tradition <strong>and</strong> medical check-up.Curative HealthcareOne third of the households wait a minimum of 3 days before looking forprofessional medical careThe time <strong>to</strong> wait before looking for professional healthcare is strongly dependent on proximityof a health facility or professional. For the ones who wait the reasons vary as they think theproblem is not serious enough (31%), a large group needs <strong>to</strong> find the money needed first(25%) <strong>and</strong> others prefer <strong>to</strong> treat the patient first at home (17%).The waiting time varies between <strong>Swabi</strong> <strong>and</strong> <strong>Buner</strong>. 49% of the people in <strong>Swabi</strong> go straight <strong>to</strong>the doc<strong>to</strong>r whereas in <strong>Buner</strong>, up <strong>to</strong> 12% wait more than a week before going there.Choice of facility depends mainly on the availability <strong>and</strong> confidence inthe doc<strong>to</strong>rs58% of the people don’t go <strong>to</strong> the closest facility. The main reason given (55%) is that thefacility is closed most of time or they lack trust in the capacity of the closest facility orprofessional.The problem of availability of facility is more often mentioned in <strong>Buner</strong> (65%) whereas in<strong>Swabi</strong> the trust in the health professionals (34%) appears <strong>to</strong> be the main problem. Thissignificant difference shows that in <strong>Swabi</strong> the people have a choice in facilities <strong>and</strong>professionals. This therefore seems more of a choice than a primary constraint. In <strong>Buner</strong>, theavailability of a health facility itself remains the first concern.Page | 14Médecins <strong>du</strong> <strong>Monde</strong>
ImmunizationThree quarters of all children under 5 is up <strong>to</strong> date with theirvaccinations sche<strong>du</strong>leThere is a reasonable percentage (73%) of children vaccinated throughout the districts.Normally, if they get vaccination, they are up <strong>to</strong> date in their immunisation sche<strong>du</strong>le. Theparents in this case appear <strong>to</strong> underst<strong>and</strong> the full purpose <strong>and</strong> advantages of the vaccination,<strong>and</strong> therefore take the sche<strong>du</strong>le seriously.A smaller group within the population is reluctant <strong>to</strong> have injections or s<strong>to</strong>ps in the middle ofthe sche<strong>du</strong>le after presented side effects. The main reason for both reactions appears <strong>to</strong> be alack of awareness.DisclaimerReasonable measures have been taken <strong>to</strong> ensure the reliability <strong>and</strong> accuracy of theinformation included in this report. This report is intended <strong>to</strong> provide information as per 31 st ofAugust 2010. If details are necessary, please contact Médecins <strong>du</strong> <strong>Monde</strong> France.Médecins <strong>du</strong> <strong>Monde</strong> Page | 15
I. CONTEXT1.1 Intro<strong>du</strong>ction<strong>Buner</strong> <strong>and</strong> <strong>Swabi</strong> districts are both located in the Khyber Pakhtunkhwa (KPK) province, Northof Pakistan. Around 95% of the inhabitants of these 2 districts are Pash<strong>to</strong>.<strong>Buner</strong> consists of mountain valleys marked by small villages. Based on the 1998 PopulationCensus, the population was 506,048 indivi<strong>du</strong>als with a density of 271 people per squarekilometre. This district, divided in 27 union councils 1 (UCs), is a rural area <strong>and</strong> there is no bigurban centre. Most of the people are poor, une<strong>du</strong>cated, living in mud houses. Even thoughthe living conditions are improving as more <strong>and</strong> more families send people <strong>to</strong> work abroad,the incomes are low <strong>and</strong> the main source remains agriculture.<strong>Swabi</strong> district borders the south of <strong>Buner</strong>. As opposed <strong>to</strong> <strong>Buner</strong>, this district consists mainly ofbig plains. Based on 1998 Population Census, its population was 1 026 804 inhabitants with adensity of 665 people per square kilometre. The opening of the mo<strong>to</strong>rway two year agoimproved a lot the accessibility <strong>to</strong> the district with a possibility <strong>to</strong> reach Islamabad in less thantwo hours. However, the district main source of income remains agriculture, with a lot of<strong>to</strong>bacco plantations. As for <strong>Buner</strong>, more <strong>and</strong> more families send their members abroad <strong>to</strong> geta better income.1.2 BackgroundIn May 2009, the Government of Pakistanlaunched a military operation against Talibanforces in <strong>Buner</strong>, Low Dir, <strong>and</strong> Swat Valleydistricts, located in KPK province. Themajority of the local population startedmoving <strong>to</strong> Mardan <strong>and</strong> <strong>Swabi</strong> in order <strong>to</strong>avoid the conflict. By May 28, 2009, thenumber of IDPs had swelled <strong>to</strong> just over 3million creating further pressure on thegovernment, as well as the internationalcommunity, <strong>to</strong> respond <strong>to</strong> the needs of themigrating population who had left theirhomes without money or other support.In response <strong>to</strong> the evolving situation,Médecins <strong>du</strong> <strong>Monde</strong> (MDM) con<strong>du</strong>cted a1 A union council is the first level of government administration in Pakistan. Each union council includes 8-15 villages<strong>and</strong> an average population of about 15,000-25,000.Page | 16Médecins <strong>du</strong> <strong>Monde</strong>
apid assessment in mid May 2009 in order <strong>to</strong> underst<strong>and</strong> the needs of this latest group ofinternal displaced populations (IDPs). As IDP numbers increased, it was determined that themajority of IDPs were not in fact accommodated within IDP camps. Instead, IDPs preferred <strong>to</strong>stay with host families placing excessive strains on existing family support <strong>and</strong> copingmechanisms.MDM has decided then <strong>to</strong> set up some mobile clinics in <strong>Swabi</strong> <strong>and</strong> <strong>Buner</strong> districts <strong>to</strong> respond<strong>to</strong> the needs of IDPs out of the camps, of the host families <strong>and</strong> support some existing healthstructures. The length of this operation was planned for 6 months in order <strong>to</strong> accompany thereturnee’s process. The mission has then been extended <strong>to</strong> respond <strong>to</strong> the humanitarianneeds <strong>and</strong> the current situation.MDM-France is providing basic health services <strong>to</strong> the IDPs in their current living conditions<strong>and</strong> <strong>to</strong> the host families affected by the crisis in <strong>Swabi</strong> <strong>and</strong> <strong>Buner</strong> districts (KPK) throughmobile clinics <strong>and</strong> the support <strong>to</strong> health structures (drugs supplies) on sites.1.3. MDM in PakistanMdM has been working in Pakistan since 1996 under an agreement signed with theGovernment of Pakistan’s Economic Affairs Division (EAD) on the 3rd of August 1996. Inaccordance with its regional strategy, the primary aim of MdM in Pakistan is <strong>to</strong> focus on theaccess <strong>to</strong> health <strong>and</strong> status of women <strong>and</strong> children in the country.For 8 years, MdM con<strong>du</strong>cted the “Women’s Repro<strong>du</strong>ctive Health Care Programme” inKhanpur, in southern Punjab province in close collaboration with the Ministry of Health <strong>and</strong>the Ministry of Population Welfare. The aim was <strong>to</strong> improve maternal health awareness, <strong>to</strong>ensure quality <strong>and</strong> availability of obstetric services. A maternal health infrastructure wasestablished, based on strong links between government health facilities <strong>and</strong> trainedcommunity activists. This programme is now run by a Pakistani NGO.Since 2004, MdM is working in cooperation with the Ministry of Social Welfare of Punjab inthe “Dar-Ul-Aman”, social centres for women. The current programme is covering a <strong>to</strong>tal of 35Dar-Ul-Aman providing a legal, medical <strong>and</strong> psychosocial assistance <strong>and</strong> also managementsupport.In 2005 & 2006, MdM has intervened <strong>du</strong>ring 15 months <strong>to</strong> provide assistance <strong>to</strong> the victims ofthe earthquake which occurred in the Eastern North West Frontier Province (NWFP), nowknown as KPK.Since June 2009, an additional emergency programme was launched in <strong>Swabi</strong> <strong>and</strong> <strong>Buner</strong>districts, <strong>to</strong> contribute <strong>to</strong> re<strong>du</strong>ce the mortality <strong>and</strong> morbidity of the displaced population <strong>and</strong>the strained host population in KPK through the re-establishment of the access <strong>to</strong> primaryhealth care units (BHUs <strong>and</strong> RHCs).In February 2010, MDM responded the Orakzai crisis using the same mo<strong>du</strong>s oper<strong>and</strong>i than inthe Swat crisis <strong>to</strong> respond <strong>to</strong> the massive population displacement deploying medical team inKohat <strong>and</strong> Hangu districts.Médecins <strong>du</strong> <strong>Monde</strong> Page | 17
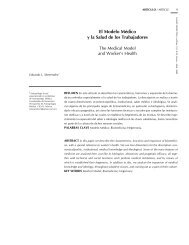
In August 2010, MDM responded <strong>to</strong> the flood crisis by providing in no time some mobileclinics in Charsada <strong>and</strong> Nowshera districts <strong>and</strong> two diarrhoea treatment centres in Kohat, atthe LMH <strong>and</strong> District Heal Quarter (DHQ) Hospital.MDM emergency program is currently working in 3 main locations, <strong>Swabi</strong> <strong>and</strong> <strong>Buner</strong> districts,Kohat <strong>and</strong> Hangu, <strong>and</strong> Charsada <strong>and</strong> Nowshera districts providing primary health carethrough mobile clinics. On average, MDM does 5000 consultations per month in the followingactivities: Curative consultations, repro<strong>du</strong>ctive health care <strong>and</strong> exp<strong>and</strong>ed programme ofimmunisation (EPI).Map 1: MDM in KPK1.4. RationaleAs MDM is looking at an exit strategy for <strong>Buner</strong> <strong>and</strong> <strong>Swabi</strong>, there is an increased need forassessing the health access situation 1 year after the peak of the crisis. The survey aims <strong>to</strong>create analysis, focusing on vulnerable groups <strong>to</strong> con<strong>du</strong>ct advocacy activities <strong>and</strong> <strong>to</strong> help theauthorities <strong>and</strong> the humanitarian community at underst<strong>and</strong>ing the health access problematicin these two districts.The health access constraints identification may look at the following fields:• Functional health access• Financial constraint for health accessPage | 18Médecins <strong>du</strong> <strong>Monde</strong>
• Geographical constraint for health access• Social-cultural constraint for health access• Physical constraint for health access• Security constraint for health accessIn May 2009 WHO con<strong>du</strong>cted a Rapid Health Assessment focusing on health availability in<strong>Swabi</strong> <strong>and</strong> did the same in February 2010 in <strong>Buner</strong>. Using this health availability baselineinformation, the survey may look at first on what is the link between the health availability <strong>and</strong>the health access.1.5. Health facilities in <strong>Swabi</strong> <strong>and</strong> <strong>Buner</strong>1. <strong>Swabi</strong> districtBased on the latest assessment made by WHO on the health facilities in <strong>Swabi</strong> in May 2009,there are 3 hospitals (two civil hospitals <strong>and</strong> one DHQ hospital), 4 rural health centres (RHCs)<strong>and</strong> 38 basic health units (BHUs).More than 90% of these facilities offer outpatient department (OPD), antenatal care (ANC),postnatal care (PNC), health e<strong>du</strong>cation, family planning <strong>and</strong> routine exp<strong>and</strong>ed programme onimmunization (EPI). More than 50% offer delivery services. Regarding MCH specifically thelevel of equipment for growth moni<strong>to</strong>ring is low (8%).Even though the health facilities in <strong>Swabi</strong> seem <strong>to</strong> be well equipped there is a regularshortage of medicines <strong>and</strong> also the lack of female medical staff makes the access <strong>to</strong> thefacilities difficult for the women. Therefore there is a still large number of deliveries at homenot attended by any skilled person. The long distance is also mentioned in the assessment asthe geographical access remains difficult for the remote villages.Médecins <strong>du</strong> <strong>Monde</strong> Page | 19
2. <strong>Buner</strong> districtIn <strong>Buner</strong>, the latest assessment has been made in February 2010 by WHO. 4 hospitals (threecivil hospitals <strong>and</strong> one DHQ hospital), 3 RHCs <strong>and</strong> 19 BHUs were listed for <strong>Buner</strong> district.More than 100% of these facilities offer outpatient department (OPD). More than 60%presents ANC, PNC, health e<strong>du</strong>cation, family planning, routine EPI <strong>and</strong> basic deliveryservices. However there is no specific MCH services in any of the facility in <strong>Buner</strong> <strong>and</strong> thegrowth moni<strong>to</strong>ring equipment is very seldom.The lack of services is mainly <strong>du</strong>e <strong>to</strong> the lack of adequate medicines <strong>and</strong> equipment. Also thelack of female medical staff is also one of the main issue. The lack of preventive care such asANC, PNC, growth moni<strong>to</strong>ring <strong>and</strong> health e<strong>du</strong>cation leads <strong>to</strong> an increased number ofmorbidity <strong>and</strong> mortality.Page | 20Médecins <strong>du</strong> <strong>Monde</strong>
1.6. Survey Objectives1. General objectiveMeasure <strong>and</strong> analyze the access <strong>to</strong> health services in <strong>Swabi</strong> <strong>and</strong> <strong>Buner</strong> districts (KPK)2. Specific ObjectiveProvide key analysis describing burdens for the most vulnerable groups <strong>to</strong> access healthservices following the 2009 IDPs influx in <strong>Swabi</strong> <strong>and</strong> <strong>Buner</strong> districts putting a specific focus onthe discrimination of structural <strong>and</strong> contextual problems.3. Main activities• Make a detailed statement of the health service offer constraints <strong>and</strong> challenges.• Collect available data concerning health access in KPK <strong>and</strong> potentially in <strong>Buner</strong> <strong>and</strong><strong>Swabi</strong> districts.• Describe the social <strong>and</strong> economic parameters of health access in the two districts (socioeconomicburden for vulnerable groups).• Analyze the physical health access <strong>to</strong> health facilities.• Identify the main constraints for vulnerable groups <strong>to</strong> access health services in <strong>Buner</strong> <strong>and</strong><strong>Swabi</strong>.• Propose recommendation for improving the health access of vulnerable groups in <strong>Swabi</strong><strong>and</strong> <strong>Buner</strong> districts.Médecins <strong>du</strong> <strong>Monde</strong> Page | 21
II. METHODOLOGYThe survey has been split in<strong>to</strong> two parts:• A qualitative survey, through focus group discussions (FGDs) <strong>and</strong> key informantinterviews, <strong>to</strong> initially underst<strong>and</strong> the main issues, their impact on people behaviouras well as re<strong>du</strong>cing assumptions, preconceptions or prejudices.• A quantitative survey, door <strong>to</strong> door, based on the results of the qualitative survey <strong>to</strong>validate or reject the results through measurable key indica<strong>to</strong>rs.2.1. Study areaAs part of MDM Emergency mission exitstrategy, the survey had <strong>to</strong> focus on the IDPsas well as the host communities in <strong>Swabi</strong> <strong>and</strong><strong>Buner</strong> districts <strong>du</strong>ring the crisis in May 2009.A map analysis has been made <strong>to</strong> identify theUCs the most affected by the crisis <strong>and</strong> wecame <strong>to</strong> the conclusion that the whole <strong>Swabi</strong><strong>and</strong> <strong>Buner</strong> should be targeted for the survey.The reason for this choice is the latest mapfound at UC level representing the IDPmovements <strong>and</strong> the hosting communities isdated from April 2010 (one year after thecrisis in this area). This map shows that<strong>Swabi</strong> <strong>and</strong> <strong>Buner</strong> are both still affectedglobally.The sample will consist of a r<strong>and</strong>om selectionof few villages in these 2 districts.2.2. Qualitative surveyIn order <strong>to</strong> best prepare the door <strong>to</strong> door survey, 8 FGDs have been con<strong>du</strong>cted <strong>to</strong> getinformation on the main constraints of access <strong>to</strong> health care for mother <strong>and</strong> child <strong>and</strong> theimpact on the behaviour of these populations.The FGDs have been made in separate groups with both, females <strong>and</strong> males <strong>and</strong> if possible,in the same villages. The idea is <strong>to</strong> get both point of view, <strong>and</strong> probably highlight themisconception of the access <strong>to</strong> health care for mother <strong>and</strong> child in one group or another.Page | 22Médecins <strong>du</strong> <strong>Monde</strong>
The findings have then been used <strong>to</strong> build a final questionnaire taking in<strong>to</strong> account thecus<strong>to</strong>ms <strong>and</strong> habits of the population in these districts <strong>and</strong> identify the main indica<strong>to</strong>rs wewant <strong>to</strong> include in the quantitative survey.Then two additional FGDs have been organised, one with MDM male medical team <strong>and</strong> onewith MDM female medical team working in <strong>Swabi</strong> <strong>and</strong> <strong>Buner</strong> districts, at the end of the door <strong>to</strong>door survey. The objectives of these focus groups were <strong>to</strong> get some explanation of someinteresting results <strong>and</strong> based on the results of the door <strong>to</strong> door survey, get some ideas <strong>and</strong>recommendations on what should be done <strong>to</strong> face the identified issues.1. ProcessThe process was as follow:• 8 FGDs (4 with females <strong>and</strong> 4 with males) have been performed.• 4 villages r<strong>and</strong>omly selected in <strong>Buner</strong> <strong>and</strong> <strong>Swabi</strong> (see the maps in the followingsection <strong>to</strong> locate the villages)• 6 <strong>to</strong> 10 people in each group.• All the discussions were recorded with the agreement of the community.2. LocationsTable 1: List of villages for the focus groupVillagesPopulationSizeArea Gender Group<strong>Swabi</strong>Sat Khetar 437 Remote Male Head of familiesSat Khetar 437 Remote Female Elders / Mother in LawAnbar 6095 Big village Male E<strong>du</strong>catedAnbar 6095 Big village Female E<strong>du</strong>cated<strong>Buner</strong>Girarai 3837 Remote Male InfluentGirarai 3837 Remote Female InfluentBanj Kara 868 Remote Male IlliterateGumbat* 4548 Remote Female Illiterate* This focus group is not in the same location as the one for male because we were not welcomed by the communityin Banj Kara <strong>to</strong> talk <strong>to</strong> the women.Médecins <strong>du</strong> <strong>Monde</strong> Page | 23
3. DiscussionsThe open questions asked <strong>du</strong>ring the FGDs where the same in all groups <strong>and</strong> were aroundspecific subjects.1. If you/your wife or one of your children in your family gets sick, what is the first thingyou do?2. Where would you go if you/your wife or one of your children in your family gets sick(diarrhoea, scabies, etc.)? If you/your wife or one of your children gets really sick(trauma) or have an accident?3. Who decides <strong>to</strong> take the person <strong>to</strong> the doc<strong>to</strong>r? Who takes her <strong>to</strong> the doc<strong>to</strong>r? Why?4. Do you/your wife <strong>and</strong> your children get immunization? Vaccination?5. During your last pregnancy, your delivery <strong>and</strong> after your delivery, did you see adoc<strong>to</strong>r?2.3. Quantitative survey1. Study populationThe survey includes both, mothers <strong>and</strong> men’s opinions. It is important <strong>to</strong> interview men, headof family or not, as they are the one making the decision of sending the mother <strong>and</strong> children<strong>to</strong> the health facility or not. Approximately the same number of men <strong>and</strong> women wereinterviewed with the restriction of not belonging <strong>to</strong> the same household.The selection of the households was as follow:Inclusion criteria• Household with at least one of these 2 criteriao A child under 5o A mother aged between 15 <strong>to</strong> 49• Mother should beo Married or ever marriedo Aged 15 <strong>to</strong> 49 OR with a child under 5o Who have been pregnant at least onceExclusion Criteria• People refuse• Communication problemPage | 24Médecins <strong>du</strong> <strong>Monde</strong>
2. Methodology of samplingA commonly used 2-stage sampling (also known as cluster sampling) scheme has been used.First, we r<strong>and</strong>omly selected the villages (cluster) in <strong>Swabi</strong> <strong>and</strong> <strong>Buner</strong> from the latestpopulation census data (1998) <strong>and</strong> then we interviewed a certain number of r<strong>and</strong>omhouseholds in these selected villages.Number of villages (cluster)WHO recommends the “30x7” (30 clusters x 7 interviews) strategy for rapid assessments (1month) such as cluster sample survey on health in developing countries or EPI coveragesurvey. So the minimum number of villages <strong>to</strong> select for this survey has been fixed <strong>to</strong> 30.Moreover, according <strong>to</strong> the budget allocated <strong>to</strong> the survey, we planned <strong>to</strong> visit 32 villages inboth <strong>Swabi</strong> <strong>and</strong> <strong>Buner</strong>.Table 2: List of selected villages for the door <strong>to</strong> door survey<strong>Swabi</strong><strong>Buner</strong>Village Union CouncilPopulationPopulationVillage Union Council(Census 1998)(Census 1998)AHAD KHAN Chack Nodeh 3781 AMBELA Kawga 4939ASOTA Asota 5407 BUDAL Batara 2502BATA KARA Bata Kara 5336 CHALANDRAI P<strong>and</strong>her 857BAZAAR Beka 2503 CHANAR Norezai 1965DEWAL Ganichitra 2822 DARGALAI Sarwai 2469GHULAMAN Parmola 3563 INZARMAIRA Sori Chagharzai 1899HARYAN Anbar 2181 KADAL/MENA Makhranai 1838JALBAI-MERA Jalbai 1515 KANDER/KATAI Gadaizi 1384JHANDA Jh<strong>and</strong>a 10185 KANGLAI Chinglai 2087KALU KHAN Kalu Khan 25108 KAT KALA Mali Khel 3097MAINI Maini 19556 KHADAR KHAN Amazai 1025NARANJI Naranji 8977 MUGHDARA Ghurghush<strong>to</strong> 1299SHANGRAI Gabasni 671 NAWAKILAY Krapa 2030SHEWA Shewa 18767 PANDHER P<strong>and</strong>her 1475URMAL DHERI Sudher 6247 TOPDARA Daggar 5047ZAIDA Zaida 4143 TOTALAI Totalai 12754This list represents the final selection as the villages with no accessibility, security problem<strong>and</strong> no support from the community have been excluded.Médecins <strong>du</strong> <strong>Monde</strong> Page | 25
Sample sizeThe most frequently used formula <strong>to</strong> calculate the sample size is the following one, as it doesnot depend on the size of the <strong>to</strong>tal population.N = D * Z 2 * (p) * (1 – p) / c 2Where:N= Sample sizeD = Design effectZ = The level of confidence desiredp = Prevalence of our main indica<strong>to</strong>rc = The st<strong>and</strong>ard errorFor a simple sampling, if we consider a prevalence of 50%, with a confidence level of 95%<strong>and</strong> a maximum error of 5.5%, the minimum sample size should be of 315 interviewedpersons. But in case of a 2-stage sampling, our methodology, there is a design effect of 2,which brings the minimum sample size at 630 interviewed persons. 10 people will be added <strong>to</strong>this <strong>to</strong>tal number in case of bad quality data, outliers, etc.For instance, with this definition, if our estimate is at 50%, we will be 95% sure that the realfigure will be within this range [44.5%; 55.5%].To sum up, we will visit 640 households in 32 villages which is 20 households per villages.These 2 maps show the union councils where the villages have been selected.Map 2: <strong>Swabi</strong> district with the selected UCs for the surveyNaranjiParmoliGanichitraShewaAsotaAdena Kalo KhanT/c Nawe Kali Sheikh JanaIsmailaTurl<strong>and</strong>i 2Chack NodehKab GhaniYar Hussain WestTurl<strong>and</strong>i 1Yar Hussain EastDagaiSaleem KhanPabeniBachaiJh<strong>and</strong>aManiri Bala<strong>Swabi</strong>DhobianSard CheenaYaqoobi SodherManiri PayanMainaiBam KhelPunj PirLahore Poree<strong>Swabi</strong> TehsilTopi WestJalsaiKundaShah MansoorLahor TehsilLahore RaporeeT/c ZaidaJalbaiAnmbarMankiKota Topi EastTh<strong>and</strong>a KawaiKala ButMarghuzBata KaraGar Munara ZarobiG<strong>and</strong>afGabasniTurdherMathani ChanganBekaJehangiraBlue: Door <strong>to</strong> door surveyPage | 26Médecins <strong>du</strong> <strong>Monde</strong>
Map 3: <strong>Buner</strong> district with the selected UCs for the surveyMalak PurNOGOPacha Killi/ BataiNOGOGok<strong>and</strong>NOGOGul B<strong>and</strong>aiSori ChagharzaiMali Khel Pir Baba/ Gadaizi TehsilGadaiziNOGOAbkhelTor WarsakDaggar TehsilKrapaEllaiNOGONorezaiDaggarRegaChagharzai TehsilBataraShal B<strong>and</strong>aiP<strong>and</strong>her x 2Gagra TehsilDewana BabaGagraMakhranaiKawgaChamla TehsilNawagaiAmazai x 2ChinglaiSarwai/ PanchtarTotalai TehsilGhurghush<strong>to</strong>TotalaiBlue: Door <strong>to</strong> door surveyRed: No go areaR<strong>and</strong>om selection of housesIn big villages, the selection of the houses was done according the “methodology of the bottle”which consist of throwing a bottle on the floor <strong>and</strong> see the direction it points <strong>to</strong>. So it gives thefirst direction <strong>to</strong> follow <strong>and</strong> then every five houses are visited. If the household does notcorrespond <strong>to</strong> our target population the next house is visited. Then when the end of the roadis reached, the street on the right was followed <strong>and</strong> the same technique was applied.In smaller villages where all the houses are scattered in the mountain, mainly in <strong>Buner</strong>, every3 houses were visited. The idea was <strong>to</strong> go from house <strong>to</strong> the closest one <strong>and</strong> leave each timetwo houses in between two visits.3. Data collectionThe interviewers were doing the interview as follow• Door <strong>to</strong> door• Indivi<strong>du</strong>al questionnaires were administrated. Interview of mothers were made withfemale interviewers <strong>and</strong> interview of the men were done by male surveyors.• The questionnaire was in English but the interview was made in Pash<strong>to</strong>, locallanguage in <strong>Swabi</strong> <strong>and</strong> <strong>Buner</strong> districts. The interview lasted between 30 <strong>to</strong> 40 minutesin order <strong>to</strong> let each enumera<strong>to</strong>r complete five interviews per day.Médecins <strong>du</strong> <strong>Monde</strong> Page | 27
4. Human resources involvedTwo assistants, one male <strong>and</strong> one female helped in the organization of the door <strong>to</strong> doorsurvey, talking <strong>to</strong> the communities prior <strong>to</strong> the effective survey. Then, four additionalenumera<strong>to</strong>rs joined <strong>to</strong> do the door <strong>to</strong> door survey. So in <strong>to</strong>tal, 6 enumera<strong>to</strong>rs did the survey.At first, one day training were given in order for them <strong>to</strong> get an intro<strong>du</strong>ction of the survey, <strong>to</strong>make sure they underst<strong>and</strong> the questions of the questionnaires, <strong>to</strong> agree on a translation inPash<strong>to</strong>.5. QuestionnaireThe questionnaire has been split in<strong>to</strong> 5 parts that all contain questions related <strong>to</strong> the mainissues on access <strong>to</strong> health identified <strong>du</strong>ring the focus groups <strong>and</strong> the indica<strong>to</strong>rs we want <strong>to</strong>measure, defined at the end of the focus groups.The questionnaire is divided as follow:• Family backgroundo Demographico E<strong>du</strong>cationo Family sizeo Income• Curative careo Homecareo Decision <strong>to</strong> go <strong>to</strong> the facilityo First visited facilityo Last visited facility• Maternal careo ANCo Deliveryo PNC• Immunizationo Children’s immunizationo Mother’s immunization• ConclusionTests of the questionnairePrior <strong>to</strong> the real survey, a test was made <strong>du</strong>ring one day with all the enumera<strong>to</strong>r in onevillage: Anbar.It allowed checking on the study population, the clarity of the questions, the ability of theinterviewers <strong>and</strong> the logistic part of the project. This part was essential as <strong>du</strong>ring the next 3days, part of the questionnaires was adjusted <strong>and</strong> also the study population was changed. Atthe beginning the objective was <strong>to</strong> compare the opinion differences of the mothers <strong>and</strong> theirrespective head of family. But we quickly noticed that it was difficult <strong>to</strong> find households whereboth, the head of family <strong>and</strong> the mother, were available at the same time, especially <strong>du</strong>ringdaytime… So, trying <strong>to</strong> gather the information from both would have biased a lot the outcomeof the survey because most of the time, the households were both were home <strong>du</strong>ring the dayPage | 28Médecins <strong>du</strong> <strong>Monde</strong>
at the same time was the poorest household… Otherwise, the heads of family or husb<strong>and</strong>sare usually working in the field…So we decided <strong>to</strong> change our study population <strong>to</strong> another one where we know the resultswould not be biased.6. Data processingThe data were processed with the data analysis <strong>and</strong> survey software, Sphinx version 5.2.4. DisclaimerIn <strong>to</strong>tal, 617 people were interviewed, 297 in <strong>Buner</strong> <strong>and</strong> 320 in <strong>Swabi</strong>. This difference resultsfrom the fact that one village in <strong>Buner</strong> could not be accessed anymore after the floods (July2010). In addition, 3 questionnaires were excluded from the survey as they contained invalidinformation for the analysis.The sampling of the survey has been made <strong>to</strong> respect the represent the whole population of<strong>Swabi</strong> <strong>and</strong> <strong>Buner</strong> districts. In addition, reasonable measures have been taken <strong>to</strong> ensure thereliability <strong>and</strong> accuracy of the information included in this report. This report is intended <strong>to</strong>provide information as per 31 st of August 2010.This survey presents some limitations as several external fac<strong>to</strong>rs interfered <strong>du</strong>ring the project.Some accessibility problems prevented us <strong>to</strong> go <strong>and</strong> visit certain villages, especially in <strong>Buner</strong>.In terms of accessibility, two rules were respected:1. The village should be accessible on a day trip from any of the MDM bases in <strong>Swabi</strong><strong>and</strong> <strong>Buner</strong>.2. The village should not be more than 30 minutes away from the road, one way.The door <strong>to</strong> door was <strong>du</strong>ring the rainy season <strong>and</strong> the flood disaster happened in the middleof the survey at the end of July in KPK, causing lots of l<strong>and</strong>slides in <strong>Buner</strong> <strong>and</strong> cutting theroad access <strong>to</strong> certain villages. In the end, only one village could not be visited, Kadal Mena,as the road was still not repaired before the end of the survey.Also, some areas in <strong>Buner</strong> have been excluded from the survey as they are not so stable asthey are known <strong>to</strong> have some militancy activities. It concerns 5 UCs were we could not go atall <strong>and</strong> one additional UC, Mali Khel, where we were requested <strong>to</strong> select only villagesaccessible from the road.Also, we had <strong>to</strong> get the approval from the community in order <strong>to</strong> do the door <strong>to</strong> door survey. Inone village in <strong>Swabi</strong>, Sat Khetar in Ganichitra UC, we were not welcome from the communityso we had <strong>to</strong> exclude this village from our selection. The reason why the people did not wantus <strong>to</strong> do the survey was because they had a disappointing previous experience with anotherorganization promising a lot of things <strong>and</strong> not coming back <strong>to</strong> them at all.Médecins <strong>du</strong> <strong>Monde</strong> Page | 29
III. RESULTS OF THE SURVEY3.1. Focus Group Discussions1. Main outcomesThe analysis of the FGDs gave the following outcomes that have been used <strong>to</strong> cus<strong>to</strong>mize thequestionnaire for the door <strong>to</strong> door survey. As expected from these discussions, some trendswere easily identified.General access <strong>to</strong> health careFinancial issue seems <strong>to</strong> be the main constraint for access <strong>to</strong> health for everyone, not onlymother <strong>and</strong> child. One sentence that was stated in all focus group discussions was: “If nomoney, we don’t go anywhere <strong>and</strong> the person dies on her bed”.In remote area, the transportation seems <strong>to</strong> be the second most important problem. In somevillages, there is no car <strong>du</strong>ring working hours. So in case of emergency, they have <strong>to</strong> wait fora car <strong>to</strong> come back before being able <strong>to</strong> do anything.The doc<strong>to</strong>r’s availability is also another issue as in most of the government facilities, thedoc<strong>to</strong>rs use <strong>to</strong> have their private clinic. After 1pm, the facility is then closed <strong>and</strong> the personsliving far away from the facility have no other choice than going <strong>to</strong> a private clinic.The lack of trust in the medical staff is one other fac<strong>to</strong>r. One good example is be that thedoc<strong>to</strong>rs take their time in the government facility <strong>to</strong> redirect the patients in the afternoon <strong>to</strong>their private clinic where they charge few hundred rupees. Another one is the healthprofessionals who charge for the medicines instead of giving them for free in the governmentfacility, or sometimes they keep them for the people they know.Maternal careAwareness is the main fac<strong>to</strong>r. It is often that the mother gets a check up only when she hascomplications <strong>du</strong>ring her pregnancy. The awareness is higher among e<strong>du</strong>cated people eventhough a large proportion of people seems not <strong>to</strong> know about the routine check up.From the discussion we learn that the social pressure plays an important role regarding ANC.Even if awareness is still the main fac<strong>to</strong>r, it appears from the FGDs that going <strong>to</strong> a check up isreally influence from the community. The community has also the same impact on the placeof delivery. In some villages, the community thinks it is better <strong>to</strong> deliver home <strong>and</strong> in someother, that it is said <strong>to</strong> be better <strong>to</strong> deliver in hospital, independently of e<strong>du</strong>cation or financiallevel. Apparently, if you don’t follow the “cus<strong>to</strong>ms” of the village, especially in small remotevillages, you will be judged badly from the other people of the village <strong>and</strong> you could lose yourhonour if something happens <strong>to</strong> the mother. Anytime someone was saying “It is a cus<strong>to</strong>m”,“everyone does it in the village”, “if you don’t do it, you will be judged”, we had <strong>to</strong> underst<strong>and</strong>they were talking about this social pressure presence in their village.Page | 30Médecins <strong>du</strong> <strong>Monde</strong>
The 40 days period after delivery, which says that the mother should stay home, seems <strong>to</strong>play a minor role in the postnatal check up. In any case, when the mother has a problem or issick after delivery the exception seems <strong>to</strong> be always made for her <strong>to</strong> go <strong>to</strong> the doc<strong>to</strong>r <strong>and</strong>also, if they are willing <strong>to</strong> make a routine check up, usually they seem <strong>to</strong> easily break the rule.ImmunizationOur findings are that local convictions are the main reasons why people don’t get vaccination.Polio seems <strong>to</strong> be more accepted as it is administrated in drops <strong>and</strong> not by injection. In allFGDs, everyone knows at least one family that does not get any injections because of belief,but it is never people directly related <strong>to</strong> the one speaking. This subject remains taboo...Vaccinations are most of the time assimilated <strong>to</strong> injections <strong>and</strong> some people believe thatinjections, coming from the western world, are a kind of complot <strong>to</strong> re<strong>du</strong>ce the Muslimpopulation <strong>and</strong> therefore, sterilise the people...Awareness is once again another issue. This issue is two folds: First the people are not reallyaware of the importance of vaccination <strong>and</strong> second, they think as it brings sickness, this is notgood <strong>and</strong> they should not do it any longer.2. Indica<strong>to</strong>rsBased on the results of the FGDs, a list of indica<strong>to</strong>rs was defined for the survey. For all theseindica<strong>to</strong>rs, a measurement will be made <strong>and</strong> also a explanation of the main reasons whythese indica<strong>to</strong>rs are so low or high.The indica<strong>to</strong>rs are around 5 axes.Curative care• Percentage of illness treated byo Modern medicineso Traditional medicineso Spiritual medicines• Percentage of illness treated by a MBBS doc<strong>to</strong>r• Average number of days before going <strong>to</strong> a facility• Average <strong>to</strong>tal cost for the treatment including transportation, consultation fees,medicines, etc.• Average distance <strong>to</strong> the facility.Maternal care• Percentage of ANCo When complicationo For routine check-up• Percentage of growth moni<strong>to</strong>ring <strong>du</strong>ring pregnancy?• Percentage of deliveryo in a facilityo at home?Médecins <strong>du</strong> <strong>Monde</strong> Page | 31
• Percentage of delivery attended by a skilled person• Average <strong>to</strong>tal cost for the delivery including transportation, consultation fees,medicines, medical tests.• Percentage of PNC?o For mothero For the babyImmunization• Percentage of children vaccinatedo Completelyo Not completelyo Not at all• Percentage of pregnant women vaccinated against TTo Completelyo Not completelyo Not at allDemographic indica<strong>to</strong>rsDemographic indica<strong>to</strong>rs are added <strong>to</strong> the questionnaire in order <strong>to</strong> get an idea on the situationin <strong>Buner</strong> <strong>and</strong> <strong>Swabi</strong> <strong>and</strong> <strong>to</strong> be able <strong>to</strong> cross this information with the other indica<strong>to</strong>rs.• Family size• E<strong>du</strong>cation level• Monthly income• Household effects <strong>and</strong> mean of transportation owned• Area• <strong>Access</strong>ibility3.2. Quantitative survey1. Sample descriptionDemographic characteristicsAs part of the survey pro<strong>to</strong>col, a choice was made <strong>to</strong> interview the 50% of mothers <strong>and</strong> 50%of men (head of family if possible). As a result, 308 mothers <strong>and</strong> 309 men were interviewed.Among the surveyed men, 223 (72%) are head of the family. They are the one responsible ofthe health of the family as well as the finance. Most of the time, they decide when <strong>to</strong> bring theperson <strong>to</strong> a health facility.Page | 32Médecins <strong>du</strong> <strong>Monde</strong>
Graph 1: Age pyramid> 60MenMother50-6040-5030-4020-30< 20-50% -30% -10% 10% 30% 50%Looking at the age pyramid for both sexes, a concentration of women between 20 <strong>to</strong> 40 yearsold confirms the study population definition (mother aged between 15 <strong>to</strong> 49 years old). As formen, more than 20% of them are more than 50 years old. This is explained by the fact thatthe head of families were interviewed in priority if they were available in the household, <strong>and</strong>most of the time the head of family is the father in law or the elder of the household.Literacy/E<strong>du</strong>cationGraph 2: A<strong>du</strong>lt Literacy rateTable 3: Level of e<strong>du</strong>cation80%70%60%50%40%30%20%10%0%Survey61%KPK50% 50%39%Caracteristics Une<strong>du</strong>cated Primary Secondary Higher Total NumberGenderMother 72% 16% 10% 1% 100% 308Men 48% 8% 28% 17% 100% 307District<strong>Swabi</strong> 53% 13% 25% 9% 100% 318<strong>Buner</strong> 68% 11% 13% 8% 100% 297Total60% 12% 19% 9% 100% 615IlliterateLiterateSource: Pakistan Social & Living St<strong>and</strong>ardMeasurement Survey 2008‐09The literacy rate of 39% in <strong>Swabi</strong> <strong>and</strong> <strong>Buner</strong> districts is lower than in the rest of KPK. InPakistan, the literacy rate has a strong relationship with the place of residence: In urbancentres, the literacy rate is higher than in rural places. As <strong>Swabi</strong> <strong>and</strong> <strong>Buner</strong> are considered asrural districts, this confirms this low figure. However, the level of e<strong>du</strong>cation is even lower in<strong>Buner</strong> (32% of e<strong>du</strong>cated persons) which is a more remote area as compare <strong>to</strong> <strong>Swabi</strong>.The gender also has an important influence on the literacy rate. 72% of the interviewedmothers are une<strong>du</strong>cated. This gender differential in e<strong>du</strong>cation could be attributed <strong>to</strong> culturalMédecins <strong>du</strong> <strong>Monde</strong> Page | 33
“norms” <strong>and</strong> the social constraints faced by women in Pakistan. During the survey, a largenumber of people mentioned that they were missing primary schools for girls in their area soonly boys could go <strong>to</strong> school.Location <strong>and</strong> accessibility81% of the households are living in villages considered as remote places as opposed <strong>to</strong> the19% of the households that are living in bigger villages that could be called urban centres.These urban villages are Kalu Khan, Maini, etc.In terms of accessibility, 25% of the villages are not accessible by road which means that weusually have <strong>to</strong> walk <strong>to</strong> reach these places. The other 75% of the villages are accessible bycar.Social situationGraph 3: House type50%45%40%35%30%25%20%15%10%5%0%<strong>Buner</strong>44%<strong>Swabi</strong>36%TOTAL28% 27% 26%24% 24%21% 21%19%16%14%Mud Mud&Bricks Bricks Blocks/CementThere is a significant difference between <strong>Swabi</strong> <strong>and</strong> <strong>Buner</strong> in terms of housing. Almost half ofthe surveyed household in <strong>Buner</strong> lives in mud houses whereas in <strong>Swabi</strong> the population livesmore in houses with bricks, blocks or cement.Page | 34Médecins <strong>du</strong> <strong>Monde</strong>
Table 4: Households’ effects <strong>and</strong> means of transportationCaracteristics <strong>Buner</strong> <strong>Swabi</strong> Total KPK NumberIn the houseElectricity 94% 98% 96% 93% 617Watch/Clock 84% 91% 88% 88% 617Radio 21% 25% 23% 43% 617Telephone 50% 63% 56% 41% 617Television 17% 37% 27% 39% 617Fridge 28% 51% 40% 31% 617TransportationBicycle 4% 24% 14% 25% 617Mo<strong>to</strong>rcycle 9% 21% 15% 6% 617Car/Truck/Trac<strong>to</strong>r 8% 10% 9% 5% 617Source: Demographic <strong>and</strong> Health Survey 2006-07 - National Institute of PopulationStudies Islamabad, Pakistan – June 2008In terms of housing, <strong>Swabi</strong> <strong>and</strong> <strong>Buner</strong> are significantly different. The population in <strong>Buner</strong>seems <strong>to</strong> be poorer than <strong>Swabi</strong>. 6% of the households live without electricity in <strong>Buner</strong>. Also, ifwe compare <strong>Buner</strong> KPK, we can see that for most of the goods <strong>and</strong> means of transportation,the proportion of households having all these goods is lower. On the other h<strong>and</strong>, theproportion of households having these effects is higher in <strong>Swabi</strong> than KPK <strong>and</strong> the differencecan be important for some of the effect. For example, half of the surveyed households in<strong>Swabi</strong> have a fridge whereas it is only one third in KPK <strong>and</strong> 28% in <strong>Buner</strong>.Also, 80% of the surveyed people own their house, 12% rent it <strong>and</strong> 8% live in places let forfree. These houses given for free are usually let by a relative or the community. Thehouseholds living there are the poorest <strong>and</strong> they have nothing, even no electricity.Family structureTable 5: Average household sizeFamily structureAverageNumber of babies, < 5 2.2Number of children, 5 - 14 2.6Number of women, 15 - 49 2.8Number of men, 15 - 49 2.7Number of elders, > 50 1.0Total family members 11.2The average family size in <strong>Swabi</strong> <strong>and</strong> <strong>Buner</strong> districts is around 11 persons, including around 2babies under 5 years old. In KPK in general, the size of the household is big as it includes theelders, the father <strong>and</strong> mother in law, then all the sons, their wives <strong>and</strong> children. They all live<strong>to</strong>gether in the same house. The structure is approximately the same in <strong>Swabi</strong> <strong>and</strong> <strong>Buner</strong>districts. Nuclear families are very rare <strong>and</strong> can be found in bigger villages like in Kalu Khan(census population 1998, 25000 inhabitants). The only reason why they left their communityis <strong>to</strong> find a job.Médecins <strong>du</strong> <strong>Monde</strong> Page | 35
IncomeDuring the survey, we noticed that this question on the income remains a delicate <strong>to</strong>pic... <strong>and</strong>the results might be biased. To make sure they are not, we crossed check the informationwith the households’ effect <strong>and</strong> means of transportation owned by the people <strong>and</strong> there is astrong relationship between the level of income (monthly income or money from outside).Therefore we can conclude the results are not biased.Nowadays, there are two main sources of income in <strong>Swabi</strong> <strong>and</strong> <strong>Buner</strong>. The monthly income isstill the most common source but the money received from someone working abroad orsomewhere else in Pakistan like in Karachi or Islamabad is also another main source ofincome.Graph 4: Income source40% <strong>Buner</strong>35%35%32%<strong>Swabi</strong>29%30% 28%TOTAL25%24%19%20%18% 18% 19%15%10%5%0%9%5%7%6%7%6%7%8%6% 6% 6%4%1% 1%1%The number of households getting some income from a daily work is significantly higher in<strong>Buner</strong> than in <strong>Swabi</strong> whereas <strong>Swabi</strong> has a significant higher number of vendors than <strong>Buner</strong>.7% of the households declare having no income at all. But 54% of them receive some moneyfrom abroad. So 3% of the households have no income at all.Page | 36Médecins <strong>du</strong> <strong>Monde</strong>
Graph 5: Monthly income earned in PakistanGraph 6: Average monthly income earnedin Pakistan35%30%25%20%15%10%33% 33%17%8% 8%9000TOTAL 807880007000600050008627Average8381rs5%0%< 5000rs 5000rs -10000rs10000rs -15000rs15000rs -20000rs> 20000rs40003000200010000<strong>Buner</strong><strong>Swabi</strong>Only 63% of the people answered. This is mainly <strong>du</strong>e <strong>to</strong> a lack of knowledge among thewomen. They often don’t have access <strong>to</strong> the money as the finances are managed by the headof family (usually a man). Consequently, 80% of the men answered the question <strong>and</strong> only43% of the women.The average monthly income for a household in both districts is pretty low, 8381rs. However,households living in <strong>Swabi</strong> appear <strong>to</strong> be wealthier than in <strong>Buner</strong> with an average income perhousehold of 8627rs in <strong>Swabi</strong> <strong>and</strong> 8078rs in <strong>Buner</strong>. In <strong>to</strong>tal, one third of the populationinterviewed live with less than 5000rs a month. The range is wide as it goes from 1000rs amonth <strong>to</strong> 50000rs a month in <strong>Buner</strong> <strong>and</strong> 80000rs a month in <strong>Swabi</strong>.80%70%60%50%40%30%20%10%0%Graph 7: Households receiving money67% 69% 68%<strong>Buner</strong><strong>Swabi</strong>TOTAL31%24%28%9%0%4%No Yes, abroad Yes, Gov./NGOsGraph 8: Average amount received fromabroad the past year25000020000015000010000080490206514Average156 930rs500000<strong>Buner</strong><strong>Swabi</strong>One third of the households got some money from abroad <strong>du</strong>ring the past year. This practiceis still very located <strong>and</strong> very specific <strong>to</strong> some villages. There are some villages with manyhousehold having someone abroad <strong>and</strong> some with none. Normally, people from the sameMédecins <strong>du</strong> <strong>Monde</strong> Page | 37
community send their relative <strong>to</strong> the same country. The four most common places are:Karachi, Saudi Arabia, Dubai <strong>and</strong> Malaysia.The average amount received differs a lot between <strong>Buner</strong> (80 490rs) <strong>and</strong> <strong>Swabi</strong> (206 514rs)<strong>and</strong> the maximum amount is at 360 000rs a year in <strong>Buner</strong> whereas it reaches 2 400 000rs ayear in <strong>Swabi</strong>. This trend is the same as per the monthly income where households from<strong>Swabi</strong> are wealthier than <strong>Buner</strong>. There is a strong correlation between the level of e<strong>du</strong>cation<strong>and</strong> the amount of money received from abroad <strong>and</strong> as households in <strong>Swabi</strong> are moree<strong>du</strong>cated than the one in <strong>Buner</strong>, the amount of money receives from abroad is higher in<strong>Swabi</strong> than <strong>Buner</strong>.In <strong>Buner</strong> only, 5 villages, Chal<strong>and</strong>rai, Kanglai, Khadar Khan, P<strong>and</strong>her, Totalai, got somemoney from the government or an NGOs for an amount of 15000rs approximately.CrisisIn <strong>Swabi</strong>, 10% of the surveyed households hosted relatives <strong>du</strong>ring the Swat crisis. More than80% of them <strong>to</strong>ok in the IDPs for less than three months. 55% of the time, they hosted morethan 10 persons at a time.In <strong>Buner</strong>, 41% of the surveyed households were displaced mainly <strong>to</strong> Mardan, <strong>Swabi</strong> <strong>and</strong><strong>Buner</strong> districts. They are all returned <strong>and</strong> 80% were displaced for less than 3 months.Two distinct profiles, <strong>Swabi</strong> versus <strong>Buner</strong>From this first description of the households, we can distinguish two groups:• People living in <strong>Buner</strong> are usually living in remote village, with less accessibility, nofacility nearby, illiterate <strong>and</strong> poor.• People living in <strong>Swabi</strong> are usually living in more accessible <strong>and</strong> bigger villages than in<strong>Swabi</strong>. They often have a health facility in the village <strong>and</strong> if not, the facility is nearby.They are more e<strong>du</strong>cated <strong>and</strong> richer than in <strong>Buner</strong>.2. Curative careThe objective of this part is <strong>to</strong> underst<strong>and</strong> the process of going <strong>to</strong> a health centre when a chil<strong>du</strong>nder 5 years old or a mother is sick in a household. What makes them go <strong>to</strong> a facility? Whatare their limitations? What do they do first at home? How long do they wait before going <strong>to</strong> afacility?Page | 38Médecins <strong>du</strong> <strong>Monde</strong>
Diseases descriptionsGraph 9: When the last illness happened35%33%30%25%20%20% 20%15%10%5%0%11%6%2%6%1%73% of the households have had a child under 5 years old or a mother ill recently, within thelast month. Among the sick people, 75% were children <strong>and</strong> 25% were mothers.Graph 10: List of illness35%30%31%25%23%20%15%13%15%10%5%5%4% 4%2% 1% 1% 1% 0% 0%0%The main reason why the people go <strong>to</strong> a facility is because of a fever with an unknown cause.Then, it is for gastro-intestinal pathology <strong>and</strong> respira<strong>to</strong>ry tract infections.Médecins <strong>du</strong> <strong>Monde</strong> Page | 39
Before going <strong>to</strong> a health professionalGraph 11: Type of homecare45%40%35%30%25%41%36%30%25%24% 24%29%22%<strong>Buner</strong><strong>Swabi</strong>TOTAL20%15%15%10%5%0%Did not waitModernmedicinesNothing7%6%7% 7% 6% 6%Give goodfoodTraditionalmedicines4%3%3%Homemademedicines1% 2% 2% 1% 0%Spiritualmedicines1%Don't knowTo the question “what do you do first when someone is ill before going <strong>to</strong> a healthprofessional?”, one third of the households don’t wait <strong>and</strong> go straight <strong>to</strong> see a someone, 24%give modern medicines that they have home <strong>and</strong> 18% uses more traditional approach bygiving homemade medicines, or good food, or spiritual medicines, etc. A large part also doesnot do anything while waiting (22%).We notice a significant difference between <strong>Swabi</strong> <strong>and</strong> <strong>Buner</strong> specifically regarding the waitingtime. A larger proportion of people go straight <strong>to</strong> the facility in <strong>Swabi</strong> <strong>and</strong> do not wait while in<strong>Buner</strong> one third of the people wait home but do not do anything specific in terms of care.Table 6: Type of homecareCaracteristicsDid notwaitModern medicinesNothingGive goodfoodTraditionalmedicinesHomemademedicinesSpiritualmedicines<strong>Access</strong>bilityNon accessible 24% 29% 28% 5% 9% 2% 4% 1% 100% 176<strong>Access</strong>ible 40% 23% 19% 7% 5% 4% 1% 1% 100% 516Facility in the villageNo 32% 28% 21% 6% 7% 3% 2% 1% 100% 286Yes 41% 19% 22% 8% 5% 4% 1% 0% 100% 400Don'tknowTotalNumberTotal36% 24% 22% 7% 6% 3% 2% 1% 100% 686These differences mentioned for <strong>Swabi</strong> <strong>and</strong> <strong>Buner</strong> could be explained by the fact that whenthe village is more accessible like in <strong>Swabi</strong>, the people go more easily <strong>to</strong> the facility <strong>and</strong> don’twait. In <strong>Buner</strong>, where we have more remote villages, the people wait for many reasonswithout doing anything at the same time. Also when the facility is in the village, 41% of thepeople go straight <strong>to</strong> the facility <strong>and</strong> don’t do any homecare.Page | 40Médecins <strong>du</strong> <strong>Monde</strong>
Graph 12: Waiting time60%50%40%30%20%10%35%49%42%29%21%25%15% 15%15%12%5% 5% 5% 4% 5% 5% 5%<strong>Buner</strong><strong>Swabi</strong>TOTAL8%0%Did not wait 1 - 2 days 3 - 4 days 5 - 6 days 7 - 8 days > 8 daysPeople living in <strong>Buner</strong> wait longer than people living in <strong>Swabi</strong>, more than 8 days for 12% ofthem.Table 7: Waiting timeCaracteristicsDid notwait1 - 2 days 3 - 4 days 5 - 6 days 7 - 8 days > 8 days Total Number<strong>Access</strong>bilityNon accessible 30% 28% 16% 7% 5% 14% 100% 134<strong>Access</strong>ible 46% 24% 15% 5% 5% 7% 100% 434This table confirms the graph just above as we can see that people living in non accessibleare more likely <strong>to</strong> wait before going <strong>to</strong> a facility. 14% of people living in not accessible villageswait more than one week.Graph 13: Reasons for waiting45%40%35%30%25%20%15%10%5%0%24%39%31%27%21%24%20%15%Not so serious Money <strong>to</strong> be find Treat himourselves17%17%13%8%Always wait8% 9%8%Husb<strong>and</strong> <strong>to</strong> comeback4% 5%3%4%1%Transport <strong>to</strong> befindOther<strong>Buner</strong><strong>Swabi</strong>TOTAL4%The main preoccupation for people living in <strong>Swabi</strong> is <strong>to</strong> know if the illness is serious or not. In<strong>Buner</strong> the main preoccupation is <strong>to</strong> find some money first. Transport also is a minor problembut still more important than in <strong>Swabi</strong>.Médecins <strong>du</strong> <strong>Monde</strong> Page | 41
Table 8: Reasons for waitingCaracteristicsNot soseriousMoney <strong>to</strong>be findHomecarefirstAlwayswaitHusb<strong>and</strong><strong>to</strong> comeTransport<strong>to</strong> be findOther Total Number<strong>Access</strong>bilityNon accessible 23% 26% 6% 17% 10% 9% 8% 100% 99<strong>Access</strong>ible 34% 23% 22% 11% 8% 0% 3% 100% 259Monthly income< 5000rs 21% 38% 10% 12% 8% 4% 8% 100% 775000rs - 10000rs 33% 18% 19% 13% 13% 3% 1% 100% 72> 10000rs 43% 15% 22% 11% 4% 3% 3% 100% 74Total31% 24% 17% 13% 8% 3% 4% 100% 358This table confirms the two main issues mentioned above which are financial <strong>and</strong> withtransportation. This means that the poorer households living in remote places are more likely<strong>to</strong> wait longer before going <strong>to</strong> a facility.Also there is a strong relationship between the number of days the people wait <strong>and</strong> the cost ofthe consultation, medicines <strong>and</strong> transportation. The longer people wait, the more expensivethe cost is.However, there is no correlation between the <strong>du</strong>ration of the waiting period <strong>and</strong> the reasonwhy people wait.Visit <strong>to</strong> a health professionalGraph 14: Type of health professional90%80%70%60%50%47%48%80%Doc<strong>to</strong>rDispenser/LHWTraditional/SpiritualNurse/LHV40%30%20%10%0%First visit15%4% 4%2% 1%Second visitRegarding the first visit, we can observe two trends. Some people go straight <strong>to</strong> the MBBSdoc<strong>to</strong>r <strong>and</strong> this is significantly linked <strong>to</strong> the importance of the illness. If the people think theperson might die, they go straight <strong>to</strong> the doc<strong>to</strong>r. Also if a doc<strong>to</strong>r is nearby they go there.Otherwise, people usually go first <strong>to</strong> the dispenser as this is often the closest facility <strong>and</strong> it isPage | 42Médecins <strong>du</strong> <strong>Monde</strong>
often in their village which mean that the women can easily go, alone with the children <strong>and</strong>with little money or they can pay later.22% of the people go for a second visit. In this case, people usually go <strong>to</strong> see a doc<strong>to</strong>r. Thismay be because of referral because the dispenser cannot do anything or because of a lack oftrust in the first doc<strong>to</strong>r <strong>and</strong> they are seeking for a second opinion.Table 9: Type of health professionalCaracteristicsDoc<strong>to</strong>rDispenser/LHWTraditional/SpiritualNurse/LHV Total NumberE<strong>du</strong>cationUne<strong>du</strong>cated 49% 45% 3% 3% 100% 400Primary 49% 45% 5% 0% 100% 79Secondary 54% 41% 5% 0% 100% 135Higher 62% 37% 2% 0% 100% 64The level of e<strong>du</strong>cation has an influence on the choice of the health professional. The moree<strong>du</strong>cated the family is, the more likely they will visit a MBBS doc<strong>to</strong>r. On the contrary,une<strong>du</strong>cated people would also go <strong>and</strong> see a dispenser which is normally based in the villageso easier <strong>to</strong> visit <strong>and</strong> for them this is a “doc<strong>to</strong>r”.Graph 15: Place of visit80%70%60%74%64%Private clinicHospitalGov.health center50%Other40%30%26%20%10%10%10%6% 7%4%0%First visitSecond visit22% of the people go <strong>to</strong> a second facility but in any case, the private clinic remains the mostcommon one. After a cross check, we conclude there is no pattern saying that when we go <strong>to</strong>a certain facility, then we go <strong>to</strong> this specific one after.Regarding the distance <strong>to</strong> the facility, 52% of the people go <strong>to</strong> the closest facility which meansthat 48% still do not go <strong>to</strong> the closest for the following reasons:Médecins <strong>du</strong> <strong>Monde</strong> Page | 43
Graph 16: Reasons why they don’t go <strong>to</strong> the closest facility70%65%<strong>Buner</strong>60%55%<strong>Swabi</strong>50%47%TOTAL40%34%30%25%20%10%14%17%12%14%7%4%6%0%Facility/ResourceavailabilityService not good/NotrustCost <strong>to</strong>o muchOtherThere is a significant difference between <strong>Swabi</strong> <strong>and</strong> <strong>Buner</strong> districts. <strong>Buner</strong> has an importantconstraint of facility <strong>and</strong> resource availability <strong>and</strong> <strong>Swabi</strong> has a problem of trust. This meansthat people living in <strong>Swabi</strong> are more choices than people living in <strong>Buner</strong> as they can goelsewhere if they don’t trust the health professionals while in <strong>Buner</strong> they have <strong>to</strong> go <strong>to</strong> afacility which is opened first.Transportation <strong>to</strong> the facilityGraph 17: Time <strong>to</strong> go <strong>to</strong> the facility (one way)80%70%60%50%59%71%66%<strong>Buner</strong><strong>Swabi</strong>TOTAL40%30%20%10%0%19% 20% 20%10% 11%6%8% 7%3%
Table 10: Time <strong>to</strong> go <strong>to</strong> the facilityCaracteristics
there is no car in the village <strong>du</strong>ring daytime <strong>and</strong> therefore they have <strong>to</strong> wait for the car <strong>to</strong>come back in the evening.CostGraph 19: Total cost1200100080090527160040010257438752000<strong>Buner</strong> <strong>Swabi</strong> TOTALConsultation + Test + MedicinesTransportationThe <strong>to</strong>tal cost, including consultation, medical tests, medicines <strong>and</strong> transportation costs, is30% higher in <strong>Buner</strong> than in <strong>Swabi</strong>. When there are less health professionals in a certainarea, the staff has a tendency <strong>to</strong> charge more that is why we can observe such a difference interms of price between <strong>Swabi</strong> <strong>and</strong> <strong>Buner</strong>. Also, transportation represents a larger part of thefinal cost in <strong>Buner</strong> than in <strong>Swabi</strong> as people in <strong>Buner</strong> have <strong>to</strong> travel longer distance <strong>to</strong> go <strong>to</strong> afacility <strong>and</strong> public transport are less present in <strong>Buner</strong> <strong>to</strong>o.Getting the medicinesRegarding medicines, in 99% of the cases, the patient is prescribed medicines <strong>and</strong> in only11% of the case, they get them at the health facility. This reflects the lack of medicines issueas the medicines should be available <strong>and</strong> given for free in public facilities. However this isonly in very few cases that people get the medicines at the health facility <strong>and</strong> most of the timethey have <strong>to</strong> go <strong>to</strong> the market or the dispenser <strong>to</strong> buy them <strong>and</strong> the price can be really high.Consequently, 3.3% in <strong>Buner</strong> <strong>and</strong> 1.7% in <strong>Swabi</strong> don’t get all the medicines but only one par<strong>to</strong>f them because they do not have enough money <strong>to</strong> buy all of them.Page | 46Médecins <strong>du</strong> <strong>Monde</strong>
Where the money comes fromGraph 20: Origin of the money60%50%40%30%39%54%47%34%30%32%<strong>Buner</strong><strong>Swabi</strong>TOTAL20%10%0%Savings/salaryBorrowedfriends/relatives9% 9% 9% 8%5% 4% 5%2% 3% 4% 2% 4%Cut down expensesLoan from shopkeeperDo extra labor work Sell cattle / l<strong>and</strong> /crops / jewelry1% 0% 1%OtherHalf of the households in <strong>Swabi</strong> are using their savings or salary <strong>to</strong> pay for their healthexpenses. In <strong>Buner</strong>, the situation is significantly different as only one third of the people canafford their health expenses by using their savings or salary. Another third is borrowing themoney from the rest of the community which is usually relatives <strong>and</strong> friends in the village.Another practice which is mainly specific <strong>to</strong> <strong>Buner</strong> is the loan from the shop keeper. Peoplehave a bill at the shop keeper <strong>and</strong> pay after the sale of the crops, once or twice a year.Table 11: Origin of the moneyCaracteristicsSavings/SalaryBorrowedfriends/relativesCut downexpensesLoan from shopkeeperDo extra laborworkSell cattle / l<strong>and</strong> /crops / jewelryOther Total Number<strong>Access</strong>bilityNon accessible 35% 36% 16% 2% 7% 4% 0% 100% 170<strong>Access</strong>ible 50% 30% 7% 6% 3% 3% 1% 100% 594E<strong>du</strong>cationUne<strong>du</strong>cated 36% 38% 12% 5% 5% 4% 0% 100% 444Primary 42% 38% 12% 2% 4% 1% 1% 100% 93Secondary 68% 21% 3% 5% 1% 3% 0% 100% 151Higher 77% 10% 3% 4% 0% 5% 1% 100% 73Monthly income< 5000rs 34% 41% 8% 6% 6% 4% 0% 100% 1575000rs - 10000rs 47% 37% 8% 4% 3% 1% 1% 100% 158> 10000rs 74% 15% 3% 2% 0% 4% 1% 100% 172Total47% 32% 9% 5% 4% 4% 1% 100% 764We observe the same tendency as in <strong>Buner</strong> for the remote places, une<strong>du</strong>cated households<strong>and</strong> poorer people. <strong>Access</strong>ible village, e<strong>du</strong>cated <strong>and</strong> richer people follow mainly the samepattern as for <strong>Swabi</strong> which means they use mainly their saving <strong>to</strong> pay for their healthexpenses.3. Maternal careFor the mothers or households with more than one child under 5 years old, the data refer only<strong>to</strong> the latest pregnancy.Ante Natal CarePrenatal care is important for the health of mother <strong>and</strong> child. It refers <strong>to</strong> pregnancy-relatedhealth care checkups provided at a medical facility or at home. Ideally, ANC comprises atleast three visits <strong>and</strong> includes moni<strong>to</strong>ring the pregnancy for signs of complications The accessMédecins <strong>du</strong> <strong>Monde</strong> Page | 47
<strong>to</strong> ANC can be assessed by the type of provider, the type of facility <strong>and</strong> the type of checkupthey got.Graph 21: Type of antenatal care providers50% 46% 47%Survey45% 40% 41%40%KPK35%30%25%20%15%15%10%5%5% 5%2%0% 1%0%Source: Demographic <strong>and</strong> Health Survey 2006-07 - National Institute of PopulationStudies Islamabad, Pakistan – June 200860% of the pregnant women in <strong>Swabi</strong> <strong>and</strong> <strong>Buner</strong> districts go for ANC. This figure is higherthan for the whole KPK. This could be explained by the fact that the numbers from KPK arealready 4 years old <strong>and</strong> since then the government in <strong>Swabi</strong> <strong>and</strong> <strong>Buner</strong> districts had put inplace a programme <strong>to</strong> train more medical staff, especially LHVs. That is why we notice thatthere are more check-ups done by nurses, LHV <strong>and</strong> midwives in <strong>Swabi</strong> <strong>and</strong> <strong>Buner</strong> districtsthan in KPK.Table 12: Type of antenatal care providersCaracteristicsNo oneDoc<strong>to</strong>rNurse/Midwife/LHVDai/TBA/LHW/DispenserDon’t know Total Number<strong>Access</strong>bilityNon accessible 47% 32% 19% 2% 0% 100% 469<strong>Access</strong>ible 37% 43% 14% 5% 1% 100% 156E<strong>du</strong>cationUne<strong>du</strong>cated 47% 35% 12% 6% 0% 100% 375Primary 32% 44% 22% 1% 1% 100% 72Secondary 29% 48% 18% 3% 2% 100% 120Higher 20% 57% 23% 0% 0% 100% 56Monthly income< 5000rs 55% 29% 13% 3% 0% 100% 1315000rs - 10000rs 40% 36% 19% 5% 0% 100% 126> 10000rs 27% 48% 21% 3% 1% 100% 138The accessibility seems <strong>to</strong> have an influence on the fact of going for an ANC or not. Also, themore e<strong>du</strong>cated <strong>and</strong> wealthier the household is, the more often the mother go for ANC.Also, the reason why the mother sees a doc<strong>to</strong>r is linked <strong>to</strong> the e<strong>du</strong>cation <strong>and</strong> the income. Thericher <strong>and</strong> more e<strong>du</strong>cated, the more often they are going <strong>to</strong> see a MBBS doc<strong>to</strong>r.Then, if we cross check between the type of provider <strong>and</strong> the facility, we can see a strongrelationship between both. Doc<strong>to</strong>rs are mostly visited in hospitals <strong>and</strong> private clinic whereasnurses, midwife <strong>and</strong> LHVs are more visited in BHUs, RHCs.Page | 48Médecins <strong>du</strong> <strong>Monde</strong>
Graph 22: Type of facility for antenatal care70%60%50%50%61%56%<strong>Buner</strong><strong>Swabi</strong>TOTAL40%30%20%10%24%20%22%22%10%16%8%5%6%0%Private ClinicGov. HealthCenterHospitalOtherLooking at the facility where the pregnant women go for their antenatal check up, we notice asignificant difference between <strong>Swabi</strong> <strong>and</strong> <strong>Buner</strong> districts. The antenatal checkups are donemore in private clinics in <strong>Swabi</strong> (61%) than in <strong>Buner</strong> (50%). In <strong>Swabi</strong>, the population isglobally wealthier so they can afford the price of a private clinic. Going <strong>to</strong> the hospital is morefrequent in <strong>Buner</strong> than in <strong>Swabi</strong>. That is the consequence of not going <strong>to</strong> a private clinic asoften as in <strong>Swabi</strong>.Table 13: Reasons for antenatal check-upCaracteristics For checkup For problem Total NumberE<strong>du</strong>cationUne<strong>du</strong>cated 35% 65% 100% 192Primary 46% 54% 100% 50Secondary 69% 31% 100% 80Higher 86% 14% 100% 43Monthly income< 5000rs 43% 57% 100% 585000rs - 10000rs 50% 50% 100% 76> 10000rs 70% 30% 100% 93Total50% 50% 100% 365The reason why the pregnant women go for ANC is strongly linked <strong>to</strong> the level of e<strong>du</strong>cation.The proportion of women going for routine check-up increases with the level of the e<strong>du</strong>cationof the household. On the contrary, women living in une<strong>du</strong>cated household have mainly ANConly when they have some complications. This shows that awareness is an important fac<strong>to</strong>rfor the ANC.We observe the same relationship between the reason why the pregnant women go for ANC<strong>and</strong> the level of monthly income. Women living in the poorest family mainly go for ANC if theyhave problem. This means that the financial aspect remains a limitation <strong>to</strong> a routine ANC.Médecins <strong>du</strong> <strong>Monde</strong> Page | 49
Graph 23: Proportion of moni<strong>to</strong>ring growth <strong>du</strong>ring the ANC visit70%60%62%62%SurveyKPK50%40%30%20%37%38%10%0%1%0%Yes No Don’t knowSource: Demographic <strong>and</strong> Health Survey 2006-07 - National Institute ofPopulation Studies Islamabad, Pakistan – June 2008<strong>Swabi</strong> <strong>and</strong> <strong>Buner</strong> districts are in line with KPK figures in terms of moni<strong>to</strong>ring growth. The mainreason of not having any moni<strong>to</strong>ring growth is because 40% of the time, there is noequipment available in the facility. We notice that the lack of equipment is more important in<strong>Buner</strong> than <strong>Swabi</strong> even though this difference is not significant.CostGraph 24: Average cost for antenatal check-up140012001000800<strong>Buner</strong>1030<strong>Swabi</strong>766Non accessible1193<strong>Access</strong>ible799Average892rs6004002000District<strong>Access</strong>ibilityThe only significant difference in terms of cost is linked <strong>to</strong> the location of the village: District<strong>and</strong> accessibility. In <strong>Buner</strong> the price for ANC is 25% higher than in <strong>Swabi</strong>. This is mainly <strong>du</strong>e<strong>to</strong> the lack of facility in remote places so that the health professionals have more freedom <strong>to</strong>set higher prices.Page | 50Médecins <strong>du</strong> <strong>Monde</strong>
This rejects the assumption that the e<strong>du</strong>cated <strong>and</strong> wealthier households would pay more onaverage for the ANC as it appears that the cost is not linked at all <strong>to</strong> the level of e<strong>du</strong>cation orthe income.Motives for not having ANCGraph 25: Reasons why no antenatal care60%50%40%30%44%56%50%30%25%27%<strong>Buner</strong><strong>Swabi</strong>TOTAL20%10%0%17%12%8% 8%6%3% 4%1% 2% 3% 3% 3%Among the 40% of pregnant women who do not go for ANC, the main reason is becausepeople “don’t bother” or they think “it is not necessary because the person is not sick”. Basedon this, we can see an important lack of awareness regarding ANC. Then, the reasons whypeople don’t go for ANC differ between <strong>Swabi</strong> <strong>and</strong> <strong>Buner</strong>. Financial, accessibility <strong>and</strong> facility<strong>and</strong> resource availability issues are significantly higher in <strong>Buner</strong> than <strong>Swabi</strong> whereas in <strong>Swabi</strong>cus<strong>to</strong>ms <strong>and</strong> awareness are more important.CaracteristicsNotnecessaryTable 14: Reasons why no antenatal careCost<strong>to</strong>o much Too far Notcus<strong>to</strong>maryFacility/ResourceavailabilityOther Total Number<strong>Access</strong>bilityNon accessible 35% 26% 20% 9% 5% 5% 100% 97<strong>Access</strong>ible 57% 28% 9% 4% 1% 1% 100% 214LiterateIlliterate 43% 34% 12% 6% 3% 2% 100% 232Literate 73% 8% 12% 4% 0% 4% 100% 77GenderMother 33% 36% 13% 10% 3% 5% 100% 139Men 64% 20% 12% 2% 2% 1% 100% 172Total50% 27% 12% 6% 2% 3% 100% 311<strong>Access</strong>ibility <strong>to</strong> the facility remains an important problem for the remote villages as 20% of thepeople living in non accessible villages say they don’t go for ANC because “the facility is <strong>to</strong>ofar”. Among the literate people who are usually e<strong>du</strong>cated <strong>and</strong> wealthier we can see a highpercentage of people answering this is because “it is not necessary” or “they don’t bother”. ItMédecins <strong>du</strong> <strong>Monde</strong> Page | 51
could be interpreted as it is not cus<strong>to</strong>mary as usually we can assume this people are awareabout the routine ANC. Then, there is a difference in opinion between mother <strong>and</strong> men as forthe mothers the financial issue is the main reason they don’t go for ANC whereas for the menit is because it is not necessary.All these observations have been confirmed <strong>du</strong>ring the FGDs. As awareness, accessibility<strong>and</strong> financial issues were always mentioned in the discussions.DeliveryGraph 26: Assistance <strong>du</strong>ring delivery70%60%50%61%52%SurveyKPK40%30%20%10%0%29% 31%19%7%1% 1% 0% 1%Source: Demographic <strong>and</strong> Health Survey 2006-07 - National Institute of Population StudiesIslamabad, Pakistan – June 2008The assistance <strong>du</strong>ring delivery by a medically skilled person is considered <strong>to</strong> have aneffective impact in the re<strong>du</strong>ction of the maternal <strong>and</strong> neonatal mortality. However, in <strong>Swabi</strong><strong>and</strong> <strong>Buner</strong> districts, there is still more than one delivery out of two that are attended by nonmedically skilled persons such as traditional birth attendants or friends <strong>and</strong> relatives. Thesefigures are in line with the whole KPK even if we can observe a small improvement compare<strong>to</strong> KPK in 2007. These days, there are more deliveries attended by nurses, midwifes or LHVsin <strong>Swabi</strong> <strong>and</strong> <strong>Buner</strong> compare <strong>to</strong> the whole KPK 3 years ago. The explanation is because thegovernment decided <strong>to</strong> train more LHVs over the past year in this province.Page | 52Médecins <strong>du</strong> <strong>Monde</strong>
CaracteristicsNo skilledpersonTable 15: Assistance <strong>du</strong>ring deliveryDoc<strong>to</strong>rNurse/Midwife/LHVNo one Total Number<strong>Access</strong>bilityNon accessible 67% 15% 17% 2% 100% 157<strong>Access</strong>ible 46% 34% 20% 1% 100% 463E<strong>du</strong>cationUne<strong>du</strong>cated 57% 25% 16% 1% 100% 374Primary 51% 15% 32% 1% 100% 74Secondary 42% 38% 20% 0% 100% 116Higher 33% 52% 15% 0% 100% 54Monthly income< 5000rs 57% 23% 18% 2% 100% 1295000rs - 10000rs 56% 24% 18% 2% 100% 126> 10000rs 44% 41% 15% 0% 100% 133Total52% 29% 19% 1% 100% 620As for ANC, people living in remote places, usually poorer households, don’t get theassistance of a medically skilled person. This is confirmed by the strong relationship betweenthe proportion of deliveries attended by a doc<strong>to</strong>r <strong>and</strong> the level of e<strong>du</strong>cation <strong>and</strong> income.Graph 27: Place of delivery80%70%60%56%70%SurveyKPK50%40%30%20%25%19%14% 15%10%0%Home Private clinic Public facility Other0%1%Source: Demographic <strong>and</strong> Health Survey 2006-07 - National Institute of PopulationStudies Islamabad, Pakistan – June 2008We notice a slight improvement <strong>du</strong>ring the past 3 years in terms of place of delivery. Usuallymother delivering home are delivering without any skilled person so this trend is in line withthe assistance <strong>du</strong>ring delivery. However, the biggest increase between <strong>Swabi</strong> <strong>and</strong> <strong>Buner</strong>districts <strong>and</strong> the whole KPK 3 years ago, goes for the private clinic <strong>and</strong> not really for thepublic facilities. However if we look more in<strong>to</strong> details regarding the public facilities, there is asignificant difference between <strong>Swabi</strong> <strong>and</strong> <strong>Buner</strong>: In <strong>Buner</strong>, people go more <strong>to</strong> the hospital <strong>and</strong>Médecins <strong>du</strong> <strong>Monde</strong> Page | 53
in <strong>Swabi</strong> they go more <strong>to</strong> the BHU This shows the lack of BHUs with delivery services in<strong>Buner</strong> as people have <strong>to</strong> go straight <strong>to</strong> the hospital.Table 16: Place of deliveryCaracteristicsHome Private clinic Public facility Total Number<strong>Access</strong>bilityNon accessible 72% 16% 12% 100% 155<strong>Access</strong>ible 51% 27% 22% 100% 460E<strong>du</strong>cationUne<strong>du</strong>cated 61% 21% 17% 100% 369Primary 58% 26% 16% 100% 73Secondary 49% 22% 29% 100% 117Higher 39% 46% 15% 100% 54Monthly income< 5000rs 67% 18% 15% 100% 1305000rs - 10000rs 62% 17% 21% 100% 126> 10000rs 49% 32% 20% 100% 132Total56% 24% 19% 100% 615As for the assistance <strong>du</strong>ring delivery, we find the same fac<strong>to</strong>rs that influence the place ofdelivery. The more e<strong>du</strong>cated <strong>and</strong> richer households go <strong>to</strong> a private clinic where there isusually a doc<strong>to</strong>r <strong>and</strong> the people living in remote place deliver more at home.Delivery in a facilityTable 17: Reasons why the delivery is in a facilityCaracteristicsProblems <strong>du</strong>ringpregnancySafer Cus<strong>to</strong>mary Other Total Number<strong>Access</strong>bilityNon accessible 77% 23% 0% 0% 100% 44<strong>Access</strong>ible 45% 45% 6% 4% 100% 220GenderMother 66% 30% 2% 1% 100% 116Men 30% 55% 9% 6% 100% 148Total50% 41% 5% 3% 100% 264The main reason why the people go <strong>to</strong> a facility for delivery is because of complication <strong>du</strong>ringthe pregnancy <strong>and</strong> it is not because there is a facility nearby that the people would go moreoften. In remote areas, 77% of the people go <strong>to</strong> a facility because the mother got somecomplication <strong>du</strong>ring pregnancy. Also the difference of opinion between men <strong>and</strong> mothersshows that the choice of going <strong>to</strong> a facility is not done for the same reason as for men, themain reason of going <strong>to</strong> a facility is because a facility is safer than home.Regarding the transportation <strong>to</strong> the facility, 74% of the people go by taxi, 10% with their owntransportation <strong>and</strong> 7% by walk. There is no significant difference between <strong>Swabi</strong> <strong>and</strong> <strong>Buner</strong>district. The only difference is that the rich people get their own transportation <strong>to</strong> the facility.Page | 54Médecins <strong>du</strong> <strong>Monde</strong>
Also, there is no relationship between the place of delivery <strong>and</strong> the distance <strong>to</strong> the facility. Thechoice of the place seems <strong>to</strong> depend more on trust in the doc<strong>to</strong>rs than the rest.Graph 28: Delivery cost when in a facilityGraph 29: Delivery cost / ANC / PNC includingtransportAverage6017 rs80006000400020000685263262680Private clinic Hospital Gov.health center12000100008000600040002000010215Non accessible6693<strong>Access</strong>ibleAverage7361 rsThe delivery cost is linked <strong>to</strong> the facility <strong>and</strong> is more expensive in private clinic. People usuallygo <strong>to</strong> the hospital if they need surgery <strong>and</strong> that is why the price is also high. But the othergovernment health centres are two third cheaper than the private clinic.The accessibility of the village has an important impact on the maternal cost (including ANC /PNC / Delivery / Transportation). The transportation cost is the main reason why the costdiffers that much. There is no significant difference between <strong>Swabi</strong> <strong>and</strong> <strong>Buner</strong>. However,people living in <strong>Buner</strong> spend more money in transportation cost <strong>to</strong> access the facility whilepeople living in <strong>Swabi</strong> spend more money because they choose <strong>to</strong> go <strong>to</strong> the private clinic.Delivery at homeGraph 30: Reasons why the delivery is at home50%45%40%35%30%25%20%15%10%5%0%45%38%31% 31%26%27%23%21%18%11%9%7%4% 5%Hosp. not necessary Cost <strong>to</strong>o much Too far Cus<strong>to</strong>mary Other<strong>Buner</strong><strong>Swabi</strong>TOTAL5%The main reason why people deliver home is because they think hospital is not necessary.During the FGDs, people explained that if the first delivery went well they usually assumethere will not be any problem in the other delivery so they don’t go <strong>to</strong> the hospital. Anotherexplanation given <strong>du</strong>ring the FGDs is that they prefer <strong>to</strong> stay home as it is more intimate <strong>and</strong>they don’t want the mother <strong>to</strong> be “shown” <strong>to</strong> many people they don’t know.However, the three main reasons why the mothers deliver home in <strong>Buner</strong> are the financialissue, the cus<strong>to</strong>m when they say that “hospital is not necessary” <strong>and</strong> the long distance <strong>to</strong> thefacility while in <strong>Swabi</strong>, the people talk mainly about the fact that the hospital is not necessary(cus<strong>to</strong>m). It means that it is not a financial problem or an accessibility problem for them <strong>to</strong> gobut more a choice.Médecins <strong>du</strong> <strong>Monde</strong> Page | 55
Table 18: Reasons why the delivery is at homeCaracteristicsHosp. notnecessaryCost <strong>to</strong>o much Too far Cus<strong>to</strong>mary Other Total Number<strong>Access</strong>bilityNon accessible 28% 26% 32% 10% 5% 100% 156<strong>Access</strong>ible 44% 26% 18% 8% 5% 100% 303GenderMother 31% 33% 17% 11% 8% 100% 201Men 43% 20% 27% 7% 2% 100% 258E<strong>du</strong>cationUne<strong>du</strong>cated 34% 33% 20% 10% 4% 100% 316Primary 38% 11% 34% 9% 9% 100% 47Secondary 50% 13% 27% 4% 6% 100% 70Higher 62% 4% 27% 4% 4% 100% 26Total38% 26% 23% 9% 5% 100% 459This table shows that accessibility <strong>and</strong> awareness (level of e<strong>du</strong>cation) are both theexplanations why the people deliver home. As the e<strong>du</strong>cated people are also the wealthiest, itmeans that the financial issue is also a reason why people deliver home.Graph 31: Delivery cost when at home18001600140012001000800600400200015341235180Skilled person Non skilled person Relatives/FriendsAverage552 rsThis confirms that the financial issue is also one of the main reasons why the people deliverhome as it is a lot cheaper even with a skilled person. The delivery in a facility costs onaverage 6017rs which is at least 5 times higher than a delivery at home. But looking at thisgraph, we can notice the tendency for the non skilled professional such as traditional birthattendant, LHWs or dispensers <strong>to</strong> charge almost as much as skilled persons which are mainlyLHVs when at home. Delivering with friends <strong>and</strong> relatives is still very popular <strong>and</strong> a lotcheaper as usually the people pay for some medicines or nothing if they don’t buy anything.Page | 56Médecins <strong>du</strong> <strong>Monde</strong>
Graph 32: Emergency savings100%90%80%70%60%50%40%30%20%10%0%40%32% 36%55% 67% 61%5% 1% 3%For check up For problemTOTALDon't remember No savings SavingsWhen we ask the people if they put some money aside <strong>du</strong>ring the pregnancy in case ofemergency, we can see that most of the time they don’t save any money even if there aresome complications <strong>du</strong>ring the pregnancy. Most of the time, the people cannot put somemoney aside so they wait until the last minute <strong>and</strong> borrow some money from their relatives<strong>and</strong> friends within the community. This is only a small part of the population who can savesome money <strong>and</strong> this is not linked <strong>to</strong> the fact of having a complication or not.Postnatal CareGraph 33: Type of postnatal care providers80%70%60%50%73% 73%SurveyKPK40%30%20%10%0%17% 19%8%8%2%0%Source: Demographic <strong>and</strong> Health Survey 2006-07 - National Institute of PopulationStudies Islamabad, Pakistan – June 2008Médecins <strong>du</strong> <strong>Monde</strong> Page | 57
Even though the numbers are in line with the whole KPK, the proportion of mother going for aPNC is very low. Only 27% of the mothers go for PNC <strong>and</strong> most of the time they go becauseof a problem which re<strong>du</strong>ce the proportion of mothers having a routine PNC <strong>to</strong> 14%.Table 19: Type of postnatal care providersCaracteristicsNo oneDoc<strong>to</strong>r/Nurse/Midwife/LHVTBA/LHW/DispenserOther Total NumberMonthly income< 5000rs 82% 10% 7% 1% 100% 1295000rs - 10000rs 72% 16% 11% 2% 100% 123> 10000rs 65% 29% 5% 2% 100% 131Facility in the villageYes 67% 22% 10% 2% 100%No 78% 14% 7% 1% 100%Financial issue seems <strong>to</strong> be a major problem <strong>to</strong> access <strong>to</strong> PNC as 29% of the wealthierpeople can afford <strong>to</strong> go <strong>to</strong> MBBS doc<strong>to</strong>rs while 82% of the poorest don’t see anyone. Also,people having a facility in their village go more often for PNC than the others. During thesurvey, we have been explained that in some villages with a facility, the LHV was visiting themothers’ home after delivery for a routine PNC. This is why there is a significant differencebetween the people living in a village with facility who have a PCN more often than the others.Graph 34: Place of postnatal care50%45%40%35%30%25%20%15%10%5%0%45%29%11% 11%4%Private clinic Your home Gov.healthcenterHospitalOtherAs for the ANC <strong>and</strong> the delivery, the private clinic seems <strong>to</strong> be the common place <strong>to</strong> go forPNC. Also, 29% of the PNC are done home with the visit most of the time of the LHVs. Thispractice seems adequate <strong>to</strong> the 40 days period after delivery where the mother is not allowed<strong>to</strong> go out. The place of PNC is not linked <strong>to</strong> any subgroup such as e<strong>du</strong>cation, district, etc.Page | 58Médecins <strong>du</strong> <strong>Monde</strong>
Table 20: Reasons for postnatal check-upCaracteristics For checkup For problem Total NumberDistrict<strong>Buner</strong> 42% 58% 100% 74<strong>Swabi</strong> 61% 39% 100% 84<strong>Access</strong>bilityNon accessible 31% 69% 100% 29<strong>Access</strong>ible 57% 43% 100% 129LiteracyIlliterate 36% 64% 100% 87Literate 73% 27% 100% 67Monthly income< 5000rs 23% 77% 100% 225000rs - 10000rs 54% 46% 100% 35> 10000rs 67% 33% 100% 43Total52% 48% 100% 158From the above table, we can see that people living in <strong>Buner</strong>, in remote villages, illiterate <strong>and</strong>poorer are going for a PNC only in case of problems. On the other h<strong>and</strong>, people living in<strong>Swabi</strong>, in accessible places, literate <strong>and</strong> wealthier are going more for a routine check-up. Thisshows that the main constraints <strong>to</strong> the access <strong>to</strong> PNC are accessibility, awareness <strong>and</strong>financial issues.Motives for not having any PNCGraph 35: Reasons why no postnatal care70%60%50%53%62%57%<strong>Buner</strong><strong>Swabi</strong>TOTAL40%30%20%18%18%18%10%0%NotnecessaryCost <strong>to</strong>o much11% 12%9% 10%8%4% 4%3% 4% 3%2% 3%1% 2%40 daysperiodToo farNotcus<strong>to</strong>maryFacility/ResourceavailabilityOther1%The main reason why people don’t go for ANC is because they think “it is not necessary” <strong>and</strong>“they don’t bother”. This reason includes both awareness <strong>and</strong> cus<strong>to</strong>m as the tradition of theMédecins <strong>du</strong> <strong>Monde</strong> Page | 59
40 days period after delivery where the mother does not go out is very well respected in<strong>Swabi</strong> <strong>and</strong> <strong>Buner</strong>. So it prevents also the mother <strong>to</strong> have a PNC unless it is done at home.During the FGDs, some s<strong>to</strong>ries explained that often, the family of the mother wait until thesituation gets very bad before taking her <strong>to</strong> a health facility in order <strong>to</strong> respect this traditionwhich could lead <strong>to</strong> some big damages in some cases. The reasons are mainly the samebetween <strong>Swabi</strong> <strong>and</strong> <strong>Buner</strong> apart from the distance <strong>to</strong> the facility (“<strong>to</strong>o far”) which is a biggerissue in <strong>Buner</strong> than in <strong>Swabi</strong>.Table 21: Reasons why no postnatal careCaracteristicsNotnecessaryCost <strong>to</strong>o much40 daysperiodToo farFacility/ResNo<strong>to</strong>urcecus<strong>to</strong>maryavailabilityOther Total Number<strong>Access</strong>bilityNon accessible 48% 19% 4% 18% 5% 4% 3% 100% 160<strong>Access</strong>ible 61% 17% 12% 4% 3% 2% 1% 100% 381GenderMother 48% 31% 1% 10% 6% 1% 2% 100% 250Man 66% 6% 17% 6% 1% 4% 0% 100% 291E<strong>du</strong>cationUne<strong>du</strong>cated 50% 24% 9% 9% 4% 2% 2% 100% 343Primary 61% 12% 5% 13% 5% 5% 0% 100% 61Secondary 70% 7% 13% 5% 1% 3% 1% 100% 99Higher 87% 0% 11% 0% 0% 3% 0% 100% 37Monthly income< 5000rs 48% 22% 7% 11% 7% 3% 3% 100% 1345000rs - 10000rs 56% 13% 14% 7% 2% 6% 2% 100% 121> 10000rs 75% 4% 11% 7% 1% 1% 1% 100% 101Facility in the villageNo 58% 18% 7% 10% 4% 2% 1% 100% 325Yes 57% 18% 13% 5% 2% 4% 1% 100% 216Total57% 18% 10% 8% 4% 3% 1% 100% 541The reasons why people do not go for PNC are the same as for ANC with the addition of the40 days period. We can notice that people living in remote area, une<strong>du</strong>cated <strong>and</strong> poorer goless often for PNC than the others because it is <strong>to</strong>o far <strong>and</strong> it costs <strong>to</strong>o much. The other groupof people living in accessible villages, e<strong>du</strong>cated <strong>and</strong> wealthier are more concerns aboutrespecting the 40 days period <strong>and</strong> the cus<strong>to</strong>m as they can access the facility but they areattached <strong>to</strong> their traditions.Actually, the 40 days period after delivery when the mother cannot go out is an importantfac<strong>to</strong>r as 67% of the mothers stay home <strong>du</strong>ring a minimum of 40 days <strong>and</strong> 60% bath for thefirst time after 40 days. This is the same for all the subgroups which means that e<strong>du</strong>cated,une<strong>du</strong>cated, rich, poor, they all respect this tradition the same way. Also, 7% of the peoplewho declared having done a PNC did it after 40 days after delivery in order <strong>to</strong> respect thetradition where the mother has <strong>to</strong> stay home.Page | 60Médecins <strong>du</strong> <strong>Monde</strong>
Postnatal care for the babyGraph 36: Reasons of postnatal check-up for the baby80%72%60%40%20%0%24%4%No check up For problem For check up onlyAs for the PNC for the mothers, the people usually do not bring the baby for a PNC unlessthere is a problem. Only 4% of the babies have a PNC <strong>and</strong> most of the time it is done whenthe mother has a routine check-up at home <strong>and</strong> the LHV checks also the baby.Graph 37: Person who brings the baby for PNC45%40%35%30%25%20%15%10%5%0%39%14% 14%11%9%7%4%2%This is mainly the husb<strong>and</strong>, the mother in law or another man who brings the baby for a PNCas the mother normally do not go out within 40 days after delivery.Médecins <strong>du</strong> <strong>Monde</strong> Page | 61
Motives for not having any PNC for the babyGraph 38: Reasons why no postnatal care for the baby80%70%60%50%40%30%20%10%0%72%14%6%3%5%Not necessary Cost <strong>to</strong>o much Too far Not cus<strong>to</strong>mary OtherEven though awareness is not the only reason included in “not necessary” as it could includealso the cus<strong>to</strong>m, this graph shows there is an important lack of awareness. Only 4% of thebabies have a routine PNC. There is no significant difference for the subgroups.4. ImmunizationAnother part of the health of mother <strong>and</strong> child is the immunization. EPI program is everywherein Pakistan <strong>and</strong> in all the villages where we did the survey an EPI team visits regularly,monthly <strong>to</strong> yearly basis, <strong>to</strong> vaccinate the children <strong>and</strong> the pregnant women.Children’s immunizationVaccination coverageGraph 39: Children’s vaccination100%90%80%70%60%50%40%30%20%10%0%86%CardNo card73%TOTAL55%40%25%14%5%0% 2%Up <strong>to</strong> date Not up <strong>to</strong> date No vaccinationPage | 62Médecins <strong>du</strong> <strong>Monde</strong>
During the interview, we asked the people <strong>to</strong> see the vaccination card of the children so wecould have a status on the immunization level for each child. In <strong>to</strong>tal, we manage <strong>to</strong> see thecard for 57% of the children. For the others, the answers are purely declarative so the resultsmight not reflect the exact status but mainly show a trend.Looking at the graph, we can see that people having a card underst<strong>and</strong> the true meaning ofvaccinating the children as compare <strong>to</strong> the people without any vaccination card that don’treally care about the vaccination of their children as 40% of them are not up <strong>to</strong> date. Also,another explanation is that people make a difference between drops <strong>and</strong> injections. So, 94%of the children are vaccinated against polio as it is administrated with drops <strong>and</strong> it hasapparently not the same impact on the population’s belief. But if we exclude the children whoonly got the polio drops, then there are 15% of the children who did not get any injection at all.Graph 40: Reasons why the vaccination are not completed35%30%25%20%15%10%5%0%30%11% 10% 10% 10% 9% 10%The main reason why people miss some vaccination for their children is because the facility is<strong>to</strong>o far. Then all the other reasons are mentioned with the same frequency. We can observethat people miss the date which means that they don’t really underst<strong>and</strong> the importance ofvaccination <strong>and</strong> do not really know why they should do it. Another reason is that it bringssickness. In this case, people s<strong>to</strong>p definitely the vaccination of their children as they think it isnot normal that the child becomes sick after an injection. This shows a lack of healthe<strong>du</strong>cation <strong>and</strong> awareness around the benefits of the vaccination <strong>and</strong> how it works. This couldbe combined <strong>to</strong>gether with the number of people who think it is not necessary. It is anotherpart of awareness. Usually people who mentioned this said that it is not necessary as theelder people in the family did not get any vaccination <strong>and</strong> they don’t have any health problemso they don’t underst<strong>and</strong> why they should do it. In this case, people change their mind usuallybecause of a past event that make them underst<strong>and</strong> the benefits of vaccinations.Médecins <strong>du</strong> <strong>Monde</strong> Page | 63
Graph 41: Children without any injectionTable 22: Children without any injection100%90%80%70%60%50%40%30%20%10%89%80%85%20%11%<strong>Buner</strong><strong>Swabi</strong>TOTAL15%Caracteristics Yes No Total Number<strong>Access</strong>bilityNon accessible 74% 26% 100% 155<strong>Access</strong>ible 89% 12% 100% 460E<strong>du</strong>cationUne<strong>du</strong>cated 79% 21% 100% 369Primary 90% 10% 100% 73Secondary 97% 3% 100% 117Higher 94% 6% 100% 54TOTAL85% 15% 100% 6130%YesNoIf we look at the subgroup for the polio drop, the coverage is the same among all the groupswhich means that we have the same percentage of children not getting any vaccination at alleven the polio drops. It does not depend on the level of e<strong>du</strong>cation, the monthly income, theplace of residence, the district, etc.Regarding injections only (excluding the polio drops), the remote places seem <strong>to</strong> be morereluctant <strong>to</strong> injection than the populations in the more accessible villages. This could be alsobecause these remote villages are more traditional. We observe the same if we focus on thee<strong>du</strong>cation level. Une<strong>du</strong>cated people are more reluctant <strong>to</strong> injections than e<strong>du</strong>cated people.Awareness seems <strong>to</strong> play a big part in the decision of getting injection or not.Regarding the BCG for babies, 58% of the babies get their injection within the first 6 weeksafter birth.Going for vaccinationGraph 42: Places of vaccination80%70%67%60%50%40%30%20%10%17%11%5%0%Gov.health center Your home Hospital OtherPage | 64Médecins <strong>du</strong> <strong>Monde</strong>
Two third of the vaccinations are done in BHUs or RHCs. People are then well aware onwhere <strong>to</strong> go <strong>to</strong> get free vaccination. The 17% of vaccination at home includes partly the EPIprogramme that visit the children home in each village.Graph 43: Distance <strong>to</strong> the facility80%70%60%64%76%70%<strong>Buner</strong><strong>Swabi</strong>50%TOTAL40%30%20%10%22%19%20%14%5%9%0% 2 hoursHouseholds living in <strong>Buner</strong> are definitely further away from the facilities for vaccination thanhouseholds living in <strong>Swabi</strong>.Table 23: Distance <strong>to</strong> the facilityCaracteristics 2hoursTotal Number<strong>Access</strong>bilityNon accessible 24% 43% 34% 100% 101<strong>Access</strong>ible 84% 14% 2% 100% 340E<strong>du</strong>cationUne<strong>du</strong>cated 64% 23% 13% 100% 254Primary 58% 29% 14% 100% 52Secondary 85% 13% 2% 100% 91Higher 91% 10% 0% 100% 42Total70% 20% 10% 100% 439People living in remote places <strong>and</strong> une<strong>du</strong>cated are living further away from the facility <strong>and</strong>need more time <strong>to</strong> access <strong>to</strong> facility.The mean of transportation <strong>to</strong> go <strong>to</strong> the facility for vaccination is significantly different between<strong>Swabi</strong> <strong>and</strong> <strong>Buner</strong>. People go more often <strong>to</strong> the facility with the own transportation in <strong>Swabi</strong><strong>and</strong> in <strong>Buner</strong>, people uses more public transport (30%) <strong>and</strong> taxis (6%).Médecins <strong>du</strong> <strong>Monde</strong> Page | 65
Motives for not having any vaccination at allGraph 44: Reasons why no vaccination30%25%20%15%10%5%0%27%18% 17%12%6%2%21%The reasons why some children do not get any vaccination at all are because the facility is<strong>to</strong>o far <strong>and</strong> then because it is not cus<strong>to</strong>mary. This statement includes all the belief that arebehind the vaccinations <strong>and</strong> also a lack of awareness which seems <strong>to</strong> be a big issue in termsof vaccination.Mother’s immunizationVaccination coverageGraph 45: Pregnant women’s vaccination against TT60%50%40%45%52%49%42%35%39%<strong>Buner</strong><strong>Swabi</strong>TOTAL30%20%10%8%5%7%8%4%6%0%Yes all Yes incomplete No Don't knowOnly 49% of the pregnant women are vaccinated completely against TT <strong>and</strong> the frequency isslightly higher in <strong>Swabi</strong> than in <strong>Buner</strong>. Also, as compare <strong>to</strong> the proportion of pregnant womenhaving an ANC (60%), the proportion of women getting the TT vaccination is lower. There isPage | 66Médecins <strong>du</strong> <strong>Monde</strong>
apparently a lack of health e<strong>du</strong>cation around this vaccination <strong>and</strong> people seem not <strong>to</strong> beaware they should do it.Table 24: Pregnant women’s vaccination against TTCaracteristicsYes allYesincompleteNoDon'tknowTotalNumber<strong>Access</strong>bilityNon accessible 33% 13% 54% 1% 100% 154<strong>Access</strong>ible 54% 4% 33% 8% 100% 455E<strong>du</strong>cationUne<strong>du</strong>cated 40% 7% 49% 5% 100% 366Primary 55% 12% 32% 1% 100% 73Secondary 64% 5% 22% 10% 100% 116Higher 71% 2% 14% 14% 100% 52Monthly income< 5000rs 35% 9% 49% 8% 100% 1305000rs - 10000rs 50% 8% 41% 1% 100% 125> 10000rs 55% 8% 27% 11% 100% 130Facility in the villageNo 42% 9% 42% 6% 100% 352Yes 57% 3% 34% 6% 100% 257Total49% 7% 39% 6% 100% 609From this table, we can see that people more e<strong>du</strong>cated, richer <strong>and</strong> living in accessiblevillages get the TT vaccination more frequently. This shows that accessibility <strong>and</strong> awarenessare the 2 main reasons why the people get TT vaccination.Going for vaccinationGraph 46: Place of vaccination60%58%50%40%30%20%15%13% 12%10%3%0%Gov.healthcenterHospital Your home Private clinic OtherMédecins <strong>du</strong> <strong>Monde</strong> Page | 67
This graph is interesting because if we compare it with the place for ANC (graph 22) we cansee that the ANC is <strong>to</strong>tally disconnected from the TT vaccination. Most of the ANCs are donein private clinics where there is no vaccine available or people have <strong>to</strong> pay for it, so thepeople who want <strong>to</strong> get vaccinated against TT have <strong>to</strong> go <strong>to</strong> a public facility.Motives for not having any vaccinationGraph 47: Reason why no vaccination for pregnant women35%30%29%27% 28%YesNo25%20%15%10%5%22%21%20%7%15%12%10% 10% 10%5%11%9%16%4%TOTAL12%8% 8%6% 6%5%2%0%Not aware Too far Don't know Not cus<strong>to</strong>mary Cost <strong>to</strong>omuch/NomoneyBelief againstinjectionGod shoulddecideOtherIn general, people seem not <strong>to</strong> be aware about this vaccination. Even if there is a facility inthe village, we have the same proportion of people saying they are not aware about thisvaccination as the people living in a village without any health facility. The second reason isbecause the facility is <strong>to</strong>o far even if there is a facility in the village.There is a difference in terms of behaviour between the people who have a facility in theirvillage <strong>and</strong> people who do not, especially if you look at the belief <strong>and</strong> the religious aspects.People who have the facility in their village declare that they have some belief againstinjections <strong>and</strong> that it is against their religion in third <strong>and</strong> fourth positions. The people living faraway from a facility declare more often that it is because of financial issue (transportationcost).Page | 68Médecins <strong>du</strong> <strong>Monde</strong>
5. ConclusionGraph 48: Main difficulties for access <strong>to</strong> health care for mother <strong>and</strong> child60%50%40%30%20%10%0%57%47%52%26%16%21%11%6%9% 7%10% 8%<strong>Buner</strong><strong>Swabi</strong>TOTAL3% 3% 3% 4%1% 2% 2% 2% 2% 1% 1% 1% 1% 1% 1%In general, when we ask the people what is the main difficulty for the access <strong>to</strong> healthcare formother <strong>and</strong> child, the main answer is the financial issue. Then we notice a significantdifference between <strong>Swabi</strong> <strong>and</strong> <strong>Buner</strong> for the lack of facility nearby which is another majorissue in <strong>Buner</strong> <strong>and</strong> transportation issue as well for <strong>Buner</strong>.Médecins <strong>du</strong> <strong>Monde</strong> Page | 69
APPENDIX 1: QUESTIONNAIRE<strong>Access</strong> <strong>to</strong> Health Care for Mother <strong>and</strong> ChildQUESTIONNAIRE FOR MEN or MOTHER IN LAWEligible Men or Mother in Law = Household with at least 1 child under 5. If mother in law, she should behead of family.SURVEY INFORMATION - BEFORE THE INTERVIEW1. Village ____________________________ 2. Household Number __ __3. Interviewer Name & Team NumberName ____________________________ ___S4. Supervisor NameName __________________________________6. House type5. Date of the interview ___ ___ / ___ ___ / 2010Mud 1 Bricks 3Mud & Bricks 2 Blocks/Cement 47. AreaUrban 1Rural/Remote 28. District<strong>Swabi</strong> 1<strong>Buner</strong> 29. Road from village <strong>to</strong> main cityKatcha 1Pukka 2SURVEY INFORMATION - AT THE END OF THE INTERVIEWResult of the interviewCompleted ...................................................................... 01Not completed ................................................................ 02Refused ........................................................................... 03Other (4Tspecify4T) ________________________________ 97Interview of the motherYes 1No 2Data entry clerk & Team NumberName _________________________ ___________ ___ ___Interview of the head of the familyYes 1No 2Comments from interviewerComments from Supervisor / ReviewerWE ARE FROM MDM. WE ARE WORKING ON A PROJECT CONCERNED WITH ACCESS TO HEALTH FOR MOTHER ANDCHILD. WE WOULD LIKE TO TALK TO YOU ABOUT THIS SUBJECT. THE INTERVIEW WILL TAKE ABOUT (NUMBER)MINUTES. ALL THE INFORMATION WE OBTAIN WILL REMAIN STRICTLY CONFIDENTIAL AND YOUR ANSWER WILLNEVER BE SHARED WITH ANYONE OTHER THAN OUR PROJECT TEAM.MAY I START NOW? Yes, permission is given Begin the interview. No, permission is not given Go <strong>to</strong> the next house.Page | 70Médecins <strong>du</strong> <strong>Monde</strong>
Family's backgroundWe are going <strong>to</strong> start this discussion with thestructure of your family.B1. How old are you? (years old) 1. < 20 2. 20 - 30 3. 30 – 40 4. 40 – 49 5. 50 - 60 6. > 60B2. Who is the responsible of the health in yourhousehold? 1. Elders 2. Father in law 3. Husb<strong>and</strong> 4. Wife 5. Mother in law 6. Herself7. Other (specify) _____________________________________________________________________________________More than one response can be selected.B3. Why is it this person?____________________________________________________________________B4. What is your e<strong>du</strong>cation level?1. Une<strong>du</strong>cated 2. Class ______10. Matric 11. Intermediate12. Bachelor & Higher 98. Don't know97. Other (specify) _________________________________________________________________B8. What is the main source of income in yourhousehold?1. No income 2. Farming/Harvesting3. Lives<strong>to</strong>ck 4. Vender5. Daily worker/labor 6. Family business7. Salary97. Other (specify) ___________________________________________________________________________More than one response can be selected.B9. What is approximately the monthly incomein your household? (help the person <strong>to</strong> calculate)___ ___ ___ ___ ___ Rs 2. Don’tknowB10. In the past year, did your householdreceive some money from abroad, thegovernment (not salary) or a humanitarianorganization?1. Yes, abroad 2. Yes, government3. Yes, humanitarian 4. No *More than one response can be selected.* Go <strong>to</strong> B12B11. How much did your household receive lastyear?___ ___ ___ ___ ___ Rs 2. Don’tknowB5. Can you read <strong>and</strong> write?1. Yes 2. NoB6. How many people are living in thishousehold?• 0-4 years old (babies) __ __• 5 – 14 years old (children) __ __• Men 15 – 49 years old (men) __ __• Women 15 – 49 years old (women) __ __• > 50 years old (elders) __ __• Total (people) __ __B7. How many people have died in thishousehold in the last 12 months?B12. Do you rent or own this house? 1. Rent 2. OwnB13. Does your household have? (tick when Yes) 1. Electricity 2. Radio 3. Telephone4. Television 5. FridgeB14. Any member of your household has? (tickwhen Yes) 1. Watch/Clock 2. Bicycle3. Mo<strong>to</strong>rcycle 4. Animal drawn cart5. Car/Truck/Trac<strong>to</strong>r7. Other (specify) _____________________________________________________________________Death #1Death #2Death #3TotalAgeReasonB15. During the June crisis last year, have youbeen displaced or did you host people in yourhouse? 1. Displaced 2. Host * 3. Nothing *** Go <strong>to</strong> B18 ** Go <strong>to</strong> B20
B16. Where did you go? (District <strong>and</strong> UC)____________________________________________________________________S2. Who was sick?1. Mother 2. ChildB17. How long were you displaced? (circle daysor months)___ ___ days weeks monthsGo <strong>to</strong> SicknessB18. How many people did you host?______________ peopleB19. How long did you host these people for?___ ___ days monthsS3. What was the sickness?1. Complicated delivery 2. Fever 3. Diarrhea4. Chest infection 5. Cough 6. Malaria7. Appendix97. Other (specify) ___________________________________________________________More than one response can be selected.S4. Did you think the sickness was so seriousthe person might die?1. Yes 2. No 8. Don’t knowB20. What is your marital status? Are youmarried, widowed, separated, divorced? 1. Married 2. Widowed 3. Divorced 4. Separated 5. Never Married 7. Other (specify)___________________________________________________________________S5. What did you do first <strong>to</strong> treat the person athome? (probe) Any traditional? Spiritual?Homemade medicine? 1. Give good food 2. Homemade medicines 3. Spiritual medicines 4. Traditional medicines 5. Modern medicines 6. Nothing 8. Did not wait 98. Don’t know97. Other (specify) _________________________________________________________________More than one response can be selected.B25. When was the last birth in your household(even if she or he has died)?Sickness___/___/______Now, we are going <strong>to</strong> talk about sickness likefever, diarrhea, headache, appendix, accident,severe trauma, etc.S1. When was the last time a mother or a chil<strong>du</strong>nder 5 in your household got sick?1. < 2 weeks ago 2. 2 <strong>to</strong> 3 week ago3. 1 month ago 4. 2 <strong>to</strong> 3 months ago5. 3 <strong>to</strong> 6 months ago 6. 6 months <strong>to</strong> 1 year ago7. > 1 year ago 98. Don’t know97. Other (specify) ___________________________________________________________________S10. Whom did you see? (probe) Anyone else?Spiritual? Traditional? 1. Doc<strong>to</strong>r (MBBS) 2. Medical staff 3. Health professional 4. Traditional 5. Spiritual 6. No one * 8. Don’t know7. Other (specify) ________________________________________________________________________More than one response can be selected.* Go <strong>to</strong> S50S11. In which order did you visit these people?(write numbers) 1. Doc<strong>to</strong>r (MBBS) 2. Medical staff 3. Health professional 4. Traditional 5. Spiritual 8. Don’t know7. Other (specify) _________________________________________________________________S7. How many days after the illness began didyou show the person <strong>to</strong> someone?___ ___ days
If no wait or few hours, write 0 <strong>and</strong> go <strong>to</strong> S9S8. Why did you wait? (probe) Anything else?1. Treat him ourselves 2. Money <strong>to</strong> be find3. Transport <strong>to</strong> be find 4. Husb<strong>and</strong> <strong>to</strong> come back5. Always wait6. No so serious7. Other (specify) ____________________________________________________________More than one response can be selected.S9. Who in the family <strong>to</strong>ok the person <strong>to</strong> thefacility?1. Elders 2. Father in law3. Husb<strong>and</strong>/Father 4. Brother in law5. Mother in law 6. Mother97. Other (specify) _____________________________________________________________S12. Where did you go first? 1. Your home * 2. Hospital 3. Gov. health center 4. Private clinic 5. Mobile clinic / NGO 6. Traditional 7. Spiritual 98. Don’t know97. Other (specify) ___________________________________________________________________________* Go <strong>to</strong> S20S13. Where is the first facility you went <strong>to</strong>?(Name & City)____________________________________________________________________S17. How did you go there? Whichtransportation?1. Walk *5. Suzuki van / Trac<strong>to</strong>r trolley2. Own transportation * 6. Tonga / Cattle cart3. Rickshaw7. Bus / Truck4. Taxi98. Don’t know97. Other (specify) ___________________________________________________________________More than one response can be selected.* Go <strong>to</strong> S20S18. How long did it take <strong>to</strong> find transportation?___ ___ minutes hoursS19. How much did you pay in <strong>to</strong>tal for thetransportation? (one way)___ ___ Rs.S20. How much did you pay for theconsultation?___ ___ Rs.S21. Did the person get some tests?1. Yes 2. No * * Go <strong>to</strong> S23S22. How much did you pay for the tests?___ ___ ___ ___ ___ Rs.Go <strong>to</strong> S24S14. Is it the closest facility? 1. Yes * 2. No 3. Don’t know* Go <strong>to</strong> S16S15. Why did not you go <strong>to</strong> the closest facility? 1. Doc<strong>to</strong>r not available 2. Facility not open 3. Medicines not available 4. Cost <strong>to</strong>o much/No money 5. Don’t trust the person/Service not good 6. Did not want <strong>to</strong> see a male doc<strong>to</strong>r 7. Long time waiting97. Other (specify) ___________________________________________________________More than one response can be selected.S16. How long does it take <strong>to</strong> go <strong>to</strong> this facility?(circle min or hours)___ ___ minutes hoursS23. Why did not you get any test?1. Cost <strong>to</strong>o much/No 2. No labora<strong>to</strong>rymoney3. Labora<strong>to</strong>ry closed 4. No electricity5. Test unavailable 6. No necessary97. Other (specify) ___________________________________________________More than one response can be selected.S24. Were the person prescribed somemedicines?1. Yes 2. No * * Go <strong>to</strong> S29S25. Did you get all, one part or none of theprescribed medicines?1. All 2. One part 3. None ** Go <strong>to</strong> S28
S26. Where did you get the medicines?1. At the health centre2. Another health centre3. Dispenser4. Market/Shop keeper97. Other (specify) ___________________________________________________S27. How much did you pay for the medicines?___ ___ ___ ___ ___ Rs.S28. (if none of not all medicines) Why did not youget all the medicines or none of them?1. Cost <strong>to</strong>o much/No money 2. Not available3. No trust4. Wrong prescription5. Prescription <strong>to</strong>o complicated97. Other (specify) _____________________________________________________More than one response can be selected.S29.For all the expenses, where is the moneycoming from?1. From savings/salary2. Cut down of the expenses3. Sell of the harvest of the crops4. Sell cattle5. Sell l<strong>and</strong>6. Do extra labor work7. Borrowed from friends/relatives/villagers8. Borrowed from relatives/friends abroadMore than one response can be selected.Go <strong>to</strong> S31S33. Whom did you see? (probe) Anyone else? 1. Doc<strong>to</strong>r (MBBS) 2. Medical staff 3. Health technician 4. Traditional 5. Spiritual 8. Don’t know7. Other (specify) ______________________________________________________________More than one response can be selected.S34. How long did it take <strong>to</strong> go <strong>to</strong> this facility?(One way)___ ___ ___ minutes hours daysS35. How did you go there? Whichtransportation?1. Walk * 5. Suzuki van / Trac<strong>to</strong>r trolley2. Own transportation * 6. Tonga / Cattle cart3. Rickshaw 7. Bus / Truck4. Taxi 98. Don’t know97. Other (specify) ___________________________________________________________________More than one response can be selected.* Go <strong>to</strong> S38S36. How long did it take <strong>to</strong> find transportation?(one way)______________ minutes hours daysS37. How much did you pay in <strong>to</strong>tal for thetransportation? (One way)___ ___ ___ ___ ___ Rs.S30. After this first facility, did you visit others?1. Yes 2. No * * Go <strong>to</strong> S51S38. How much did you pay for theconsultation?___ ___ ___ ___ ___ Rs.S31. What is the last facility you visited? 1. Your home * 2. Hospital 3. Gov. health center 4. Private clinic 5. Mobile clinic / NGO 6. Traditional 7. Spiritual 98. Don’t know97. Other (specify) _______________________________________________________________* Go <strong>to</strong> S33S39. How much did you pay for the facility cost?___ ___ ___ ___ ___ Rs.S40. How much did you pay for the surgery?___ ___ ___ ___ ___ Rs 2. No surgeryS41. Did the person get some tests?1. Yes 2. No * * Go <strong>to</strong> S44S32. Where is this facility? (City & Name)____________________________________________________________________S42. How much did you pay for the tests?___ ___ ___ ___ ___ RsGo <strong>to</strong> S44
S43. Why did not the person get any test?1. Cost <strong>to</strong>o much/No 2. No labora<strong>to</strong>rymoney3. Labora<strong>to</strong>ry closed 4. No electricity5. Test unavailable 6. No necessary7. Other (specify) ____________________________________________________________More than one response can be selected.S44. Were the person prescribed somemedicines?1. Yes 2. No * * Go <strong>to</strong> S49S45. Did you get all, one part or none of theprescribed medicines? 1. All 2. One part 3. None * * Go <strong>to</strong> S48S46. Where did you get the medicines?1. At the health centre2. Another health centre3. Dispenser4. Market/Shop keeper97. Other (specify) _____________________________________________________________Go <strong>to</strong> S51S50. Why did not you see anyone? (probe) Anyother reasons? 1. Illness not serious enough 2. Cost <strong>to</strong>o much/No money 3. Too far 4. No transport 5. No one <strong>to</strong> go with 6. Don't trust the person/Service not good 7. No time <strong>to</strong> go 8. Did not know where <strong>to</strong> go 9. Did not want <strong>to</strong> see a male doc<strong>to</strong>r10. Long time waiting11. Not allowed <strong>to</strong> go97. Other (specify) _____________________________________________________________More than one response can be selected.S51. In the end, was the person better?1. Yes 2. No3. Dead 4. Still sick97. Other (specify) _____________________________________________________S47. How much did you pay for the medicines?___ ___ ___ ___ ___ Rs.Go <strong>to</strong> S49S48. (if none of not all medicines) Why did not youget all the medicines or none of them?1. Cost <strong>to</strong>o much/No money 2. Not available3. No trust4. Wrong prescription5. Prescription <strong>to</strong>o complicated97. Other (specify) _____________________________________________________More than one response can be selected.S49. For all these expenses, where is the moneycoming from?1. From savings/salary2. Cut down of the expenses3. Sell of the harvest of the crops4. Sell cattle5. Sell l<strong>and</strong>6. Do extra labor work7. Borrowed from friends/relatives/villagers8. Borrowed from relatives/friends abroadMore than one response can be selected.
Maternity = Pregnancy / Delivery / Post natalcareNow, we are going <strong>to</strong> talk about the lastpregnancy in this household.M1. During her last pregnancy, what healthprofessional did she see? (Probe) Anyone else?Spiritual? Traditional? 1. Doc<strong>to</strong>r (MBBS) 2. Nurse/midwife 3. LHV 4. LHW 5. DAI/TBA 6. Health professional 7. Traditional 8. Spiritual 9. No one * 98. Don’t know97. Other (specify) ________________________________________________________________More than one response can be selected.* Go <strong>to</strong> M8M2. Where did she go <strong>du</strong>ring this pregnancy?(probe) Anywhere else? Traditional? Spiritual? 1. Your home * 2. Hospital 3. Gov. health center 4. Private clinic 5. Mobile clinic / NGO 6. Traditional 7. Spiritual 98. Don’t know 97. Other (specify)______________________________________________________________________________More than one response can be selected.* Go <strong>to</strong> M4M3. Where is this facility? (Name <strong>and</strong> place)____________________________________________________________________M4. During her pregnancy, did she go <strong>to</strong> thehealth professional because she had a problemor just for a check-up?1. For problem 2. For check-up onlyM5. Did she get any ultra-sound tests <strong>du</strong>ring hervisit?1. Yes * 2. No * Go <strong>to</strong> M7M6. Why did not she get any ultra sounds?(probe) Any other reasons?1. Cost <strong>to</strong>o2. God only should knowmuch/No money3. Not available 4. Not cus<strong>to</strong>mary8. Don’t know7. Other (specify) ___________________________________________________________________More than one response can be selected.M7. How much did she pay for the first visit(including tests, ultrasounds <strong>and</strong> medicines)?___ ___ ___ ___ ___ RsGo <strong>to</strong> M9M8. Why did not she see anyone? (probe) Anyother reasons? 1. Not necessary/Don't bother 2. Cost <strong>to</strong>o much/No money 3. Too far 4. No transport 5. No one <strong>to</strong> go with 6. Service not good/Don't trust facility 7. No time <strong>to</strong> go 8. Did not know where <strong>to</strong> go 9. Did not want <strong>to</strong> see a male doc<strong>to</strong>r10. Long time waiting11. Not allowed <strong>to</strong> go97. Other (specify) ___________________________________________________________________More than one response can be selected.M9. During her pregnancy, did your householdset aside any money in case of emergency?1. Yes 2. No3. Don't remember 8. Don't knowM10. During her delivery, who assisted her? 1. Doc<strong>to</strong>r (MBBS) 2. Nurse/midwife 3. LHV 4. LHW 5. DAI/TBA 6. Health professional 7. Traditional 8. Spiritual9. Relatives/Friends 10. "Old"/Experience women11. No one 98. Don’t know 97. Other (specify)______________________________________________________________________________More than one response can be selected
M11. During her last delivery, where did shegive birth <strong>to</strong>? 1. Your home * 2. Hospital 3. Gov. health center 4. Private clinic 5. Mobile clinic / NGO 6. Traditional 7. Spiritual 98. Don’t know97. Other (specify) ________________________________________________________________________* Go <strong>to</strong> M14M12. Where is this facility? (Name & City)____________________________________________________________________M13. During her last pregnancy, why did shedeliver in a health centre? (probe) Any otherreason?1. Safer2. Problem/Sick <strong>du</strong>ring pregnancy3. Needed C-section/Caesarian4. Cus<strong>to</strong>mary5. Husb<strong>and</strong> who decide6. Don’t know7. Other (specify) ___________________________________________________________________More than one response can be selected.Go <strong>to</strong> M15M14. During her last pregnancy, why did shedeliver home <strong>and</strong> not in a health centre? (probe)Any other reason? 1. Hospital not necessary 2. Cost <strong>to</strong>o much/No money 3. Too far 4. No transport 5. No one <strong>to</strong> go with 6. Service not good/ Don't trust facility 7. No time/Baby came <strong>to</strong>o fast 8. Did not know where <strong>to</strong> go 9. Did not want <strong>to</strong> see a male doc<strong>to</strong>r10. Long time waiting11. Not allowed <strong>to</strong> go12. Facility not open13. Not cus<strong>to</strong>mary15. More intimate16. Don’t go out because of security97. Other (specify) ___________________________________________________________________98. Don’t knowM15. (If health centre) How did she go there?(If home <strong>and</strong> a skilled person) How did you go <strong>and</strong>pick up the person?1. Walk *5. Suzuki van / Trac<strong>to</strong>r trolley2. Own transportation * 6. Tonga / Cattle cart3. Rickshaw7. Bus / Truck4. Taxi98. Don’t know97. Other (specify) ___________________________________________________________________More than one response can be selected.* Go <strong>to</strong> M18M16. In <strong>to</strong>tal, how much did you pay for thetransportation? (one way)___ ___ ___ ___ ___ Rs.M17. In <strong>to</strong>tal, how long did it take <strong>to</strong> go there?(one way)___ ___ Minutes Hours.M18. In <strong>to</strong>tal, how much did you pay for thedelivery including doc<strong>to</strong>rs' fees, facility cost<strong>and</strong> medicines (not transportation)?___ ___ ___ ___ ___ Rs.M19. Within the 40 days after delivery, whathealth professional did she see? (probe) Anyoneelse? Spiritual? Traditional? 1. Doc<strong>to</strong>r (MBBS) 2. Nurse/midwife 3. LHV 4. LHW 5. DAI/TBA 6. Health professional 7. Traditional 8. Spiritual 9. No one * 98. Don’t know97. Other (specify) _________________________________________________________________More than one response can be selected.* Go <strong>to</strong> M25M20. Where did she go? (probe) Anywhere else? 1. Your home * 2. Hospital 3. Gov. health center 4. Private clinic 5. Mobile clinic / NGO 6. Traditional 7. Spiritual 98. Don’t know97. Other (specify) ________________________________________________________________More than one response can be selected.* Go <strong>to</strong> M22More than one response can be selected.
M21. Where is this facility? (city <strong>and</strong> name)____________________________________________________________________M22. Within the 40 days after delivery, did shego because she had a problem or just for acheck-up?1. For problem 2. For check-up onlyM23. How many days after delivery did she firstgo?___ ___ daysM24. How much did she pay for the visit(including tests <strong>and</strong> medicines)?___ ___ ___ ___ ___ Rs.Go <strong>to</strong> M26M25. Why did not she see anyone? (probe) Anyother reason? 1. Not necessary/Don't bother 2. Cost <strong>to</strong>o much/No money 3. Too far 4. No transport 5. No one <strong>to</strong> go with 6. Service not good/Don't trust facility 7. No time <strong>to</strong> go 8. Did not know where <strong>to</strong> go 9. Did not want <strong>to</strong> see a male doc<strong>to</strong>r10. Long time waiting11. Not allowed <strong>to</strong> go12. 40 days period97. Other (specify) _________________________________________________________More than one response can be selected.M26. After how many days after delivery did shefirst go out?___ ___ days2. Not allowed <strong>to</strong> gooutM27. Within the 40 days after delivery, whathealth professional did the baby see? (probe)Anyone else? Spiritual? Traditional? 1. Doc<strong>to</strong>r (MBBS) 2. Nurse/midwife 3. LHV 4. LHW 5. DAI/TBA 6. Health professional 7. Traditional 8. Spiritual 9. No one * 98. Don’t know97. Other (specify) _________________________________________________________________More than one response can be selected.* Go <strong>to</strong> M34M28. Where did the baby go? (probe) Anywhereelse? 1. Your home * 2. Hospital 3. Gov. health center 4. Private clinic 5. Mobile clinic / NGO 6. Traditional 7. Spiritual 98. Don’t know97. Other (specify) _______________________________________________________________More than one response can be selected.* Go <strong>to</strong> M30M29. Where is this facility? (city <strong>and</strong> name)____________________________________________________________________M30.Who brought the baby <strong>to</strong> the healthprofessional?1. Elders 2. Father in law3. Father 4. Brother in law5. Mother in law 6. Mother97. Other (specify) _____________________________________________________________More than one response can be selected.M31. Did the baby go because he had a problemor just for a check-up?1. For problem 2. For check-up only 3. For vaccinationM32. How many days after birth did he first go?___ ___ daysM33. How much did you pay for the visit(including tests <strong>and</strong> medicines)?___ ___ ___ ___ ___ Rs.Go <strong>to</strong> Immunization
M34. Why did not he see anyone? (probe) Anyother reason? 1. Not necessary/Don't bother 2. Cost <strong>to</strong>o much/No money 3. Too far 4. No transport 5. No one <strong>to</strong> go with 6. Service not good/Don't trust facility 7. No time <strong>to</strong> go 8. Did not know where <strong>to</strong> go 9. Did not want <strong>to</strong> see a male doc<strong>to</strong>r10. Long time waiting11. Not allowed <strong>to</strong> go97. Other (specify) _________________________________________________________More than one response can be selected.ImmunizationNow, we are going <strong>to</strong> talk about immunizationfor you <strong>and</strong> your children.I1. Do you have a vaccination card for all thechildren under 5 in your household? (if yes) CanI see it?1. Yes * 2. No * Go <strong>to</strong> I3 or I4I2. Did these children under 5 have ever hadvaccination?1. Yes 2. No * * Go <strong>to</strong> I16I6. Among all these children under 5, did theyget other injections? (Penta & Measle)1. Yes 2. NoI7. Do you always follow the date of injection ordo you miss some?1. Follow date 2. Miss dateI8. (if incomplete or miss date) Why did you misssome vaccinations?1. Too far2. Cost <strong>to</strong>o much/No money3. No vaccines4. Not enough children <strong>to</strong> get vaccination5. EPI does not come back6. Forgot the next date97. Other (specify) __________________________________________________________More than one response can be selected.I9. Where do you go for the vaccination? 1. Your home * 2. Hospital 3. Gov. health center 4. Private clinic 5. Mobile clinic / NGO 6. Traditional 7. Spiritual 98. Don’t know 97. Other (specify)______________________________________________________________________________* Go <strong>to</strong> I17I3. If card available, fill in the form <strong>and</strong> go <strong>to</strong>question I7I10. Where is this facility? (City & Name)__________________________________Yes, complete Yes, incomplete No __________________________________BCGPolioPentaMeasleIf no card available, ask the following questionsI4. Among all these children under 5, did they allget injection on the shoulders one week afterbirth? (BCG)1. Yes 2. NoI5. Among all these children under 5, did they allget drops in their mouth? (Polio)1. Yes 2. NoI12. How long does it take <strong>to</strong> go <strong>to</strong> there? (oneway)______________ minutes hoursI13. How do you go <strong>to</strong> this facility?1. Walk *5. Suzuki van / Trac<strong>to</strong>r trolley2. Own transportation * 6. Tonga / Cattle cart3. Rickshaw7. Bus / Truck4. Taxi98. Don’t know97. Other (specify) ___________________________________________________________________More than one response can be selected.* Go <strong>to</strong> I15
I14. How much do you pay for thetransportation? (one way)___ ___ ___ ___ ___ Rs.I15. Who brings the children <strong>to</strong> the vaccination?1. Elders 2. Father in law3. Husb<strong>and</strong>/Father 4. Brother in law5. Mother in law 6. Mother7. Neighbors97. Other (specify) ___________________________________________________More than one response can be selected.I16. Why none of these children get any of theinjections? Anything else?1. Don’t know why we should do it2. Too far3. Cost <strong>to</strong>o much/No money4. Bring sickness/fever5. God should decide6. Afraid of infertility7. Not allowed <strong>to</strong>o97. Other (specify) ________________________________________________________More than one response can be selected.I17. Does EPI team come <strong>to</strong> your village?1. Yes 2. NoI18. How often the team comes <strong>to</strong> your village?1. Every month 2. Few times a year3. Twice a year 4. Every year5. Less often 6. NeverI19. During the last pregnancy in yourhousehold, did the mother get any vaccinationagainst tetanus?1. Yes, all * 2. Yes, incomplete * 3. NoMore than one response can be selected.I21. Where did she get the vaccination? 1. Your home * 2. Hospital 3. Gov. health center 4. Private clinic 5. Mobile clinic / NGO 6. Traditional 7. Spiritual 98. Don’t know 97. Other (specify)______________________________________________________________________________* Go <strong>to</strong> ConclusionI22. Where is this facility? (City & Name)____________________________________________________________________ConclusionTo conclude, I would like <strong>to</strong> ask you 1 morequestion.C1. In your opinion, what is the main difficulty <strong>to</strong>access <strong>to</strong> health care for mother <strong>and</strong> child?(read the answers) 1. Financial problem 2. No facility nearby 3. Transportation problem 4. E<strong>du</strong>cation / Awareness problem 5. No trust in the doc<strong>to</strong>rs 6. No time <strong>to</strong> go 7. Only male doc<strong>to</strong>rs available 8. Not allowed <strong>to</strong> go97. Other (specify) _______________Only 1 possible answerTHIS IS THE END OF THE SURVEY. I WANT TO THANK YOUFOR YOUR TIME AND YOUR SUPPORT IN OUR PROJECT.* Go <strong>to</strong> ConclusionI20. Why did not she get vaccination?1. Too far2. Cost <strong>to</strong>o much/No money3. Bring sickness/fever4. God should decide5. Afraid of infertility6. Not allowed <strong>to</strong>o6. Don’t want <strong>to</strong> have it from a male doc<strong>to</strong>r97. Other (specify) ________________________________________________________
For info :Médecins <strong>du</strong> <strong>Monde</strong> – FrancePakistan Mission - Survey Teamsurvey.kpk.mdmpakistan@gmail.comMEDECINS DU MONDE IN PAKISTANSince 1996 - Mother <strong>and</strong> child’s healthcare programmes in PunjabSince 2004 - Support <strong>to</strong> the provincial social women’s centre programme in Punjab2005 / 2006 - Surgical <strong>and</strong> primary healthcare <strong>to</strong> victims of earthquake in Northern PakistanSince 2009 - Primary healthcare <strong>to</strong> displaced <strong>and</strong> host population in Khyber Pakhtunkhwa2010 - Diarrhoea treatment <strong>and</strong> primary healthcare <strong>to</strong> flood victims in Khyber Pakhtunkhwa