Evaluation and analysis of criteria and sub-criteria of a ... - Emerald
Evaluation and analysis of criteria and sub-criteria of a ... - Emerald
Evaluation and analysis of criteria and sub-criteria of a ... - Emerald

Create successful ePaper yourself
Turn your PDF publications into a flip-book with our unique Google optimized e-Paper software.
A constructionexcellence model23Figure 1.<strong>Evaluation</strong> <strong>of</strong> constructionexcellence model
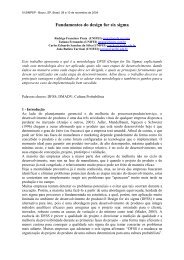
ECAM15,124<strong>sub</strong>-<strong>criteria</strong> <strong>of</strong> the model were measured in the analytical part <strong>of</strong> a questionnairesurvey. The <strong>criteria</strong> <strong>and</strong> <strong>sub</strong>-<strong>criteria</strong> were measured for both their importance <strong>and</strong>actual performance within the company <strong>of</strong> the respondent. Third, the data collectedwas prepared for further <strong>analysis</strong> through coding, missing data <strong>analysis</strong>, <strong>and</strong> dataexploration. Fourth, the questionnaire was evaluated as a measuring instrument interms <strong>of</strong> reliability <strong>and</strong> validity. Fifth, the <strong>criteria</strong> <strong>and</strong> <strong>sub</strong>-<strong>criteria</strong> were evaluatedthrough their importance measurement, via factor <strong>analysis</strong>, <strong>and</strong> through theireffectiveness measurement. Finally, weights <strong>of</strong> the model <strong>criteria</strong> were computed on anempirical basis using factor regression coefficients. The steps <strong>of</strong> evaluation arediscussed in the sections to follow.The proposed construction excellence modelThe construction excellence model under evaluation was developed <strong>and</strong> described inBassioni et al. (2004a, 2005) <strong>and</strong> is illustrated in Figure 2. The model is divided intoenabling <strong>and</strong> results <strong>criteria</strong>. The enabling <strong>criteria</strong> include: leadership; customers <strong>and</strong>stakeholder focus; strategic management; information <strong>and</strong> <strong>analysis</strong>; people,partnerships, suppliers, physical resources, intellectual capital, risk, work culture,<strong>and</strong> process management. The results <strong>criteria</strong> include: internal stakeholder; project,external stakeholder; <strong>and</strong> organisational business results. The logic <strong>of</strong> the model startswith leadership as the main driver for change <strong>and</strong> improvement in organisations.Leadership should guide the focus on customers, people <strong>and</strong> other relevantstakeholders, which in turn should guide the development <strong>of</strong> strategic plans. Thestrategic plans are further detailed into functional or programmatic business plans thatare translated into processes for implementation. Once implemented on projects <strong>and</strong>throughout the organisation, improved internal stakeholder results should start toappear (internal in terms <strong>of</strong> being under direct influence <strong>of</strong> management), such as that<strong>of</strong> employees, suppliers <strong>and</strong> other internal stakeholders. This will reflect on projectresults that would further affect customer <strong>and</strong> external stakeholder results not underthe direct management influence <strong>of</strong> the organisation. The outcome is business resultsbeing achieved on the organisational level. Work culture is seen to be driven byleadership, <strong>and</strong> affecting other enabling <strong>criteria</strong>, whereas information <strong>and</strong> <strong>analysis</strong> isalso driven by leadership <strong>and</strong> supports all other <strong>criteria</strong> throughout the model. Thebi-directional relationships between information <strong>and</strong> <strong>analysis</strong> <strong>and</strong> other <strong>criteria</strong>provide forward <strong>and</strong> backward loops <strong>of</strong> information among <strong>criteria</strong>.Measurement <strong>of</strong> model <strong>criteria</strong> <strong>and</strong> <strong>sub</strong>-<strong>criteria</strong>The measurement <strong>of</strong> the model’s <strong>criteria</strong> <strong>and</strong> <strong>sub</strong>-<strong>criteria</strong> was conducted through aquestionnaire survey. This section discusses the design <strong>of</strong> the questionnaire showinghow the <strong>criteria</strong> <strong>and</strong> <strong>sub</strong>-<strong>criteria</strong> were measured, <strong>and</strong> the sampling approach <strong>of</strong> thesurvey.Questionnaire designThe questionnaire is divided into three questions, as can be seen in the Appendix(Figure A1). The first question aims to identify the importance <strong>of</strong> each criterion inimproving organisational business performance results. It uses a five-point Likert scale
A constructionexcellence model25Figure 2.The suggestedconstruction excellencemodel
effectiveness scores <strong>of</strong> their underlying <strong>sub</strong>-<strong>criteria</strong>, thus giving an indication <strong>of</strong> theactual performance <strong>of</strong> each criterion.Missing values can cause problems with some statistical techniques <strong>and</strong> could beresolved by either deletion or replacement methods (Hair et al., 1998). A missing value<strong>analysis</strong> was conducted on the Statistical Package for Social Sciences (SPSS) s<strong>of</strong>twareto evaluate the magnitude <strong>of</strong> missing data before deciding how best to h<strong>and</strong>le them instatistical techniques. A maximum <strong>of</strong> two missing values were found in less than 3 percent <strong>of</strong> variables, which indicates a low percentage <strong>of</strong> missing values. The mean <strong>of</strong> thevariable was used to replace missing data (Hair et al., 1998). One respondent did notanswer any <strong>of</strong> the “<strong>sub</strong>-criterion importance” questions, <strong>and</strong> was therefore discardedfrom the <strong>analysis</strong>, thus leaving the sample <strong>of</strong> <strong>sub</strong>-<strong>criteria</strong> importance variables being49 responses.A constructionexcellence model27Data explorationThe mean <strong>and</strong> st<strong>and</strong>ard deviation <strong>of</strong> each observed variable were computed in themissing value <strong>analysis</strong>. The normality <strong>of</strong> the distribution <strong>of</strong> each variable wasassessed, where the skewness <strong>and</strong> kurtosis values were computed. The assessment <strong>of</strong>normality was initially based on the values <strong>of</strong> Z skewness <strong>and</strong> Z kurtosis that werecalculated from the following equations, as expressed by Hair et al. (1998, p. 72), interms <strong>of</strong> the sample size N:Z skewness ¼ skewness qffiffiZ kurtosis ¼ kurtosis qffiffiffi6NThese values were compared to 2.58 to assess the significance <strong>of</strong> the normalityassumption at the 0.01 level (Hair et al., 1998, p. 73). If the variable was found to benon-normal, it was further assessed for the degree <strong>of</strong> non-normality according to the<strong>criteria</strong> <strong>of</strong> Curran et al. (1996 in Byrne, 1998). Curran et al.’s <strong>criteria</strong> considereddistributions with skewness between 2 <strong>and</strong> 3 <strong>and</strong> kurtosis in the range <strong>of</strong> 7 to 21 to bemoderately non-normal, whereas skewness <strong>of</strong> above 3 <strong>and</strong> kurtosis <strong>of</strong> above 21 wereconsidered extremely non-normal. The reason for this assessment <strong>of</strong> degree <strong>of</strong>non-normality is that many statistical techniques are robust <strong>and</strong> can withholddeviations from the normality assumption (Stevens, 2002, p. 263). The only variablethat has shown extreme non-normality was the importance <strong>of</strong> leadership indetermining business performance (Question 1-a). It should be noted though that thevariables showing moderate or extreme deviation from normality are all negativelypeaked, which means they have higher concentrations towards their maximum values.<strong>Evaluation</strong> <strong>of</strong> measuring instrumentThe measurement <strong>of</strong> variables in a theoretical framework is an integral part <strong>of</strong>research, <strong>and</strong> abstract concepts should be measured through physical/actualmeasurement <strong>of</strong> their operational definitions (Sekaran, 2003). This concept <strong>of</strong>developing a measuring instrument in quality management research has been used toconfirm the abstract constructs/<strong>criteria</strong> <strong>of</strong> Excellence Models (Wilson <strong>and</strong> Collier, 2000)<strong>and</strong> TQM frameworks (Ahire et al., 1996; Anderson et al., 1995; Black <strong>and</strong> Porter, 1996;24N
improve reliability, SPSS provides an expected value <strong>of</strong> alpha if a certain item were tobe deleted. Item (<strong>sub</strong>-criterion) “d. Society <strong>and</strong> environmental impact <strong>of</strong> projects” wasfound to have the largest impact on reliability improvement <strong>and</strong> was, thus, deleted toimprove the reliability <strong>of</strong> the measuring instrument. The resulting Cronbach’s alphabecame 0.6406 as indicated in Table I. The deletion <strong>of</strong> this item is acceptable from acomputational st<strong>and</strong>point since five items were used to express the underlyingconstruct, <strong>and</strong> the deletion <strong>of</strong> one would leave four items to express the criterion.However, in the case <strong>of</strong> the construct “organisational business performance”,Cronbach’s alpha was found to be 0.5702, but this criterion was defined by only twoitems <strong>and</strong> deletion <strong>of</strong> an item would essentially separate the concept between financial<strong>and</strong> non-financial performance. Moreover, the alpha value is quite close to theacceptable value <strong>of</strong> 0.6. Accordingly, <strong>and</strong> in order to represent the concept in itsentirety, both items are retained.A constructionexcellence model29Validity <strong>of</strong> measuring instrumentAs previously discussed, validity indicates that the instrument is measuring what it issupposed to measure. Three types <strong>of</strong> validity are most common in business <strong>and</strong>organisational research: content validity; construct validity <strong>and</strong> criterion-relatedvalidity (Brewerton <strong>and</strong> Millward, 2001; Sekaran, 2003).Content validity. Defined as “the extent to which it provides adequate coverage <strong>of</strong>the topic under study” (Cooper <strong>and</strong> Emory, 1995, p. 149). This type <strong>of</strong> validity ismostly based on the <strong>analysis</strong> <strong>of</strong> the target domain required, <strong>and</strong> drawn on expertjudgement (Brewerton <strong>and</strong> Millward, 2001). Content validity is demonstrated in thisinstrument in two ways. First, the “<strong>analysis</strong> <strong>of</strong> the target domain” was achievedthrough the literature review conducted in previous papers, <strong>and</strong> the theoreticaldevelopment <strong>of</strong> the model based on well-established models (Bassioni et al., 2004a,b). Second, the “expert judgement” was based on the empirical evaluation <strong>of</strong> expertinterviews <strong>and</strong> case studies (Bassioni et al., 2005), <strong>and</strong> the evaluation <strong>of</strong> thequestionnaire in the pilot study.Construct validity. Shows the extent to which items <strong>of</strong> a construct measure the sameconstruct (Flynn et al., 1994), i.e. do not measure multiple constructs. Construct validitycan be demonstrated by a factor <strong>analysis</strong> on the items <strong>of</strong> each construct (Cooper <strong>and</strong>Emory, 1995; Flynn et al., 1994). Table II <strong>and</strong> Figure 3 show the factor <strong>analysis</strong> <strong>and</strong>associated Scree plot conducted on the <strong>sub</strong>-<strong>criteria</strong> <strong>of</strong> leadership using SPSS s<strong>of</strong>tware.ComponentInitialEigenvaluestotalPer cent<strong>of</strong>varianceCumulative%Extraction sums <strong>of</strong>squared loadingstotalPer cent<strong>of</strong>varianceCumulative%1 3.138 52.298 52.298 3.138 52.298 52.2982 0.964 16.071 68.3693 0.728 12.141 80.5104 0.542 9.027 89.5375 0.361 6.015 95.5526 0.267 4.448 100.000Table II.Factor <strong>analysis</strong> <strong>of</strong>leadership <strong>sub</strong>-<strong>criteria</strong>
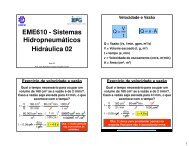
Importance <strong>of</strong> <strong>criteria</strong> in determining business performanceRespondents <strong>of</strong> the survey were asked to rate the importance <strong>of</strong> each criterion indetermining organisational business performance in Question 1 <strong>of</strong> the questionnaire.The results <strong>of</strong> this question are summarised in terms <strong>of</strong> the mean <strong>and</strong> lower 5 per centconfidence limit <strong>of</strong> each criterion, <strong>and</strong> illustrated in Figure 4. These results werecomputed on an Excel spreadsheet using its embedded functions. The line chart showsan above average rating <strong>of</strong> importance for all <strong>criteria</strong> <strong>and</strong> close to maximum rating formany <strong>of</strong> them. Leadership, customer focus <strong>and</strong> people management showed the highestrelevance, among all <strong>criteria</strong>, to improving organisational business performance. Theonly criterion having extreme non-normality (leadership), as discussed in the dataexploration <strong>sub</strong>-section was negatively peaked. Its computed confidence limit based onnormality is expected to provide an understatement <strong>of</strong> the actual lower confidence limits.A constructionexcellence model31Factor <strong>analysis</strong> <strong>of</strong> excellence <strong>criteria</strong>Confirmatory factor <strong>analysis</strong> differs than exploratory factor <strong>analysis</strong> in the postulation<strong>of</strong> a factor structure, whereas in exploratory factor <strong>analysis</strong> the factor structure isdetermined within the <strong>analysis</strong> (Cramer, 2003). To ensure that the items load on onlyone variable a preliminary “exploratory factor <strong>analysis</strong>” is conducted on SPSS, then aconfirmatory factor <strong>analysis</strong> (CFA) is conducted using a specialised statistical s<strong>of</strong>twareLISREL (LInear Structural RELationships).In the exploratory factor <strong>analysis</strong>, the method <strong>of</strong> principle component <strong>analysis</strong> wasused on SPSS <strong>and</strong> the scree plot <strong>of</strong> eigen values is illustrated in Figure 5. The scree plotindicates a single variable to be extracted as the eigen value <strong>of</strong> the first factor is 8.557<strong>and</strong> the second is 1.308. The difference between both factors is rather large <strong>and</strong> thechange in direction <strong>of</strong> the scree plot occurs after the first factor, thus indicating theappropriateness <strong>of</strong> extracting the first factor only.Figure 4.Mean <strong>and</strong> 5 per cent lowerconfidence limit <strong>of</strong>model <strong>criteria</strong>
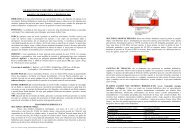
ECAM15,132Figure 5.Scree plot <strong>of</strong> eigen valuesfor <strong>criteria</strong> <strong>of</strong>excellence modelConfirmatory factor <strong>analysis</strong> is used to reassure the single factor structure asexpressed by the CFA Model in Figure 6, where the <strong>criteria</strong> <strong>of</strong> the ConstructionExcellence Model are related to a latent variable that is assumed to be “excellence”. Theterm “latent” refers to a variable that is not directly measured or is unobserved(Loehlin, 1998, p. 1). The CFA Model is expressed in the form <strong>of</strong> a path diagram withthe rectangles resembling items <strong>of</strong> the CFA Model <strong>and</strong> the latent variable portrayed asan ellipse. The arrows point from the latent variable to the items <strong>of</strong> the CFA Modelindicating that it is expressed in terms <strong>of</strong> the items (Cramer, 2003). A similarmanifestation <strong>of</strong> the EFQM Excellence Model as a CFA Model has been described inthe literature (Eskildsen et al., 2001, p. 788).The computations <strong>of</strong> the confirmatory factor <strong>analysis</strong> were conducted on theLISREL s<strong>of</strong>tware. The observed variables (<strong>criteria</strong>) were obtained by the summatedscores <strong>of</strong> <strong>sub</strong>-<strong>criteria</strong> effectiveness. A program written in the SIMPLIS language wasdeveloped <strong>and</strong> the covariance matrix was prepared as input to the program using thePRELIS program that accompanies the LISREL package. The appropriateness <strong>of</strong> theCFA Model is determined by goodness-<strong>of</strong>-fit indices that indicate how well the data fitthe model. A large number <strong>of</strong> indices exist in the literature <strong>and</strong> there is little agreementas to which one is appropriate (Cramer, 2003). Of these indices, the root mean squarederror <strong>of</strong> approximation (RMSEA) is gaining popularity (Loehlin, 1998, p. 76) <strong>and</strong> isconsidered the only index to satisfy the ideal properties described by Gerbing <strong>and</strong>
A constructionexcellence model33Figure 6.CFA model <strong>of</strong> excellence<strong>criteria</strong>Anderson (1992) <strong>of</strong> indicating the degree <strong>of</strong> fit along a continuum with bounded values;being independent <strong>of</strong> sample size; <strong>and</strong> having known distributional characteristics.The value <strong>of</strong> RMSEA in the LISREL output for the CFA Model is 0.099, which indicatesa good fit since it is below the acceptable threshold <strong>of</strong> 0.1 (Cramer, 2003, p. 34; Loehlin,1998, p. 77). Therefore, the empirical data confirm the CFA model in Figure 6, whichillustrates the expression <strong>of</strong> the latent variable “excellence” in terms <strong>of</strong> the model<strong>criteria</strong>.<strong>Evaluation</strong> <strong>of</strong> model <strong>sub</strong>-<strong>criteria</strong>The <strong>sub</strong>-<strong>criteria</strong> <strong>of</strong> the Construction Excellence Model as developed from previousresearch are depicted in the <strong>sub</strong>-<strong>criteria</strong> <strong>of</strong> the questionnaire. These <strong>sub</strong>-<strong>criteria</strong> were
ECAM15,134assessed in the Questions 2 <strong>and</strong> 3 <strong>of</strong> the questionnaire as to their importance indefining their underlying criterion, <strong>and</strong> their actual effectiveness in the companies <strong>of</strong>the respondents, as can be seen in the Appendix (Figure A1). The <strong>sub</strong>-<strong>criteria</strong> <strong>of</strong> themodel are confirmed in a manner very much similar to that <strong>of</strong> the model <strong>criteria</strong>,through assessing their importance <strong>and</strong> through a factor <strong>analysis</strong> to ensure the singleconstruct structure.Importance <strong>of</strong> <strong>sub</strong>-<strong>criteria</strong> in defining underlying criterionThe results <strong>of</strong> the importance <strong>of</strong> each <strong>sub</strong>-criterion in defining its criterion in the form<strong>of</strong> the means, st<strong>and</strong>ard deviations <strong>and</strong> 5 per cent lower confidence limits werecomputed on an Excel spreadsheet, using its built-in functions in a similar manner tothe model <strong>criteria</strong>. The results show that the mean <strong>and</strong> lower confidence limits <strong>of</strong><strong>sub</strong>-<strong>criteria</strong> were all above average <strong>and</strong> inclined towards the scale maximum <strong>of</strong> fivepoints, hence confirming the importance <strong>of</strong> each <strong>sub</strong>-criterion in defining its underlyingcriterion. Furthermore, the negative skewness <strong>of</strong> these items indicate that even if a few<strong>of</strong> these distributions are not normal, they are nevertheless peaked <strong>and</strong> negativelyconcentrated towards the upper end <strong>of</strong> the scale, as explained with the importance <strong>of</strong>the <strong>criteria</strong> previously. Thus, the actual confidence limits are expected to be higherthan those reported.Factor <strong>analysis</strong> <strong>of</strong> <strong>sub</strong>-<strong>criteria</strong> underlying a criterionThe results <strong>of</strong> the effectiveness assessment <strong>of</strong> each <strong>sub</strong>-criterion were used in factor<strong>analysis</strong> to determine the single factor structure, which was previously conducted inthe discussion <strong>of</strong> the content validity <strong>and</strong> was demonstrated in Table II <strong>and</strong> Figure 3for the Leadership criterion. The factor <strong>analysis</strong> in all other <strong>criteria</strong> showed only onefactor is to be extracted <strong>and</strong> thus confirms the single factor structure assumed in the<strong>criteria</strong> <strong>of</strong> the model.Calculation <strong>of</strong> model criterion weightsThe scoring system <strong>of</strong> the EFQM Excellence Model has been shown to vary acrossindustries <strong>and</strong> has been criticised as not corresponding to the way companies areworking (Eskildsen et al., 2001). Different methods for assessing the actual weights <strong>of</strong>the model’s <strong>criteria</strong> have been reported in literature. For example, Eskildsen et al. (2001)used factor regression coefficients. Cheng <strong>and</strong> Li (2001) used the analytic hierarchyprocess (AHP) to determine the weights <strong>of</strong> performance measures <strong>of</strong> a businessprocess. It is difficult to assess which method is more accurate. Nevertheless, any <strong>of</strong> theempirical approaches mentioned would be preferred to “an arbitrary weight structure,which has never been empirically tested” (Eskildsen et al., 2001, p. 783), as with thecase <strong>of</strong> EFQM. Furthermore, a method that has been previously applied to excellencemodels would be preferred. The factor regression coefficients method was chosen inthis research because it assesses the actual impact <strong>of</strong> each criterion on theorganisation’s performance, whereas with AHP requires expert judgement data thatcan be obtained from the importance rating <strong>of</strong> each criterion, but might affect theaccuracy <strong>of</strong> outcomes in the paired comparisons process, as well as reflecting theimportance perception rather than actual impact.
To compute the regression coefficients <strong>of</strong> the <strong>criteria</strong> relevant to one another, theyneed to be loaded on a single factor. Hence, the CFA Model <strong>of</strong> Figure 6, was used toreflect such a single factor structure. In this model, each <strong>of</strong> the <strong>criteria</strong> is loaded on alatent variable termed “excellence”. The regression coefficients are computed for eachcriterion in predicting the latent variable “excellence”. The computations were carriedout on SPSS, <strong>and</strong> the results are illustrated in Table III. Moreover, the coefficients intheir crude format might not be suitable for excellence scoring calculations <strong>and</strong> need tobe presented in a more workable format. Therefore, weights for each criterion werecalculated on an Excel spreadsheet such that the total weight <strong>of</strong> all <strong>criteria</strong> is 1,000.This was achieved by dividing the coefficient <strong>of</strong> each criterion by the total <strong>of</strong> allcoefficients <strong>and</strong> multiplying the result by 1,000.A constructionexcellence model35Benefits <strong>and</strong> limitationsThe main benefit <strong>of</strong> the Construction Excellence Model is that it provides an excellencemodel developed for <strong>and</strong> evaluated by construction companies. It has a morecomprehensive <strong>and</strong> wider coverage <strong>of</strong> performance <strong>criteria</strong> than other excellencemodels. Its underlying logic is also easier to underst<strong>and</strong> <strong>and</strong> more user friendly. Thelimitation <strong>of</strong> the suggested model is that, as in all other models, it is only as good aswhoever uses it. Thus, the model is merely a tool that clarifies what needs to bemeasured/improved, but in no way can guarantee success <strong>of</strong> the organisation. Forexample, if management pursues an inappropriate strategy or the economy takes adownturn, the organisation’s performance would most certainly be affected, no matterhow efficient the business models it uses. However, the use <strong>of</strong> the suggested model isexpected to raise the chances <strong>of</strong> success <strong>and</strong> increase organisational performance inrelation to competitors. Furthermore, the use <strong>of</strong> the Construction Excellence Model, byits nature, is targeted towards project-based industries, specifically construction, <strong>and</strong>Score coefficientsCriterion weightsLeadership 0.0967 71Customer focus 0.0928 68Other stakeholder focus 0.0738 54Information <strong>and</strong> <strong>analysis</strong> 0.0877 65Strategic management 0.0939 69Intellectual capital management 0.0914 67People management 0.0903 67Partnership <strong>and</strong> supplier management 0.0952 70Resource management 0.0779 57Risk management 0.0890 66Process management 0.0712 53Work culture 0.0610 45Project performance 0.0833 61Organisational performance 0.0833 61Internal stakeholder performance 0.0778 57External stakeholder performance 0.0931 69Total 1.3584 1,000Table III.Component scorecoefficients <strong>and</strong>criterion weights
ECAM15,136might not be applicable in other industries. This might limit the ability <strong>of</strong>organisations to benchmark across industries.Conclusion <strong>and</strong> further workThe evaluation <strong>and</strong> <strong>analysis</strong> <strong>of</strong> the <strong>criteria</strong> <strong>and</strong> <strong>sub</strong>-<strong>criteria</strong> <strong>of</strong> a ConstructionExcellence Model was presented in this paper. The evaluation <strong>and</strong> <strong>analysis</strong> was basedon similar evaluations <strong>and</strong> analyses <strong>of</strong> TQM frameworks <strong>and</strong> excellence models inquality management literature. The <strong>analysis</strong> addressed the issue <strong>of</strong> data preparation,where missing data were analysed <strong>and</strong> appropriate data replacement methods used tocomplete the data set. The questionnaire as a measuring instrument was evaluated interms <strong>of</strong> reliability using Cronbach’s alpha, which resulted in the omission <strong>of</strong> the“Society <strong>and</strong> environmental impact <strong>of</strong> projects” <strong>sub</strong>-criterion from the “Projectperformance” criterion. Reliability <strong>of</strong> the measuring instrument is a necessary but notsufficient condition for validity. The validity <strong>of</strong> the measuring instrument is furtherevaluated in terms <strong>of</strong> content, construct <strong>and</strong> criterion-related validity using techniquesas factor <strong>analysis</strong>, multiple correlation. The <strong>criteria</strong> <strong>and</strong> <strong>sub</strong>-<strong>criteria</strong> were confirmedthrough their importance ratings <strong>and</strong> actual effectiveness ratings employingconfidence intervals <strong>and</strong> exploratory <strong>and</strong> confirmatory factor <strong>analysis</strong>. Theevaluation <strong>and</strong> <strong>analysis</strong> <strong>of</strong> the model’s <strong>criteria</strong> <strong>and</strong> <strong>sub</strong>-<strong>criteria</strong> strengthens themodel’s validity. The weights <strong>of</strong> the <strong>criteria</strong> were calculated using empirical data <strong>and</strong>the method <strong>of</strong> factor regression coefficients.A number <strong>of</strong> future researches can be conducted in continuation <strong>of</strong> this researchpaper. The scope <strong>of</strong> the model could be exp<strong>and</strong>ed to suit the needs <strong>of</strong> other types <strong>of</strong>construction organisations, such as consultants <strong>and</strong> owner organisations.Modifications could include, for example, modifying the relative criterion weights inthe Construction Excellence Model, for different types <strong>of</strong> organisations. Theconsideration <strong>of</strong> organisation size is another area <strong>of</strong> possible research, wherespin-<strong>of</strong>f models could be developed for small <strong>and</strong> medium enterprises. In addition, thecriterion weights <strong>of</strong> national Excellence Models such as EFQM <strong>and</strong> Baldrige requireempirical justification. Finally, within the Construction Excellence Model, alternativemethods for computing criterion weights can be applied such as the analytic hierarchyprocess.ReferencesAhire, S.L., Golhar, D.Y. <strong>and</strong> Waller, M.A. (1996), “Development <strong>and</strong> validation <strong>of</strong> TQMimplementation constructs”, Decision Sciences, Vol. 27 No. 1, pp. 23-56.Ahmad, I.U. <strong>and</strong> Sein, M.K. (1997), “Implementing TQM principles in construction projects:difficulties <strong>and</strong> remedies”, International Conference on Leadership <strong>and</strong> Total QualityManagement in Construction <strong>and</strong> Building, CI Premier Conference, Singapore, pp. 47-54.Anderson, J.C., Rungtusanatham, M., Schroeder, R.G. <strong>and</strong> Devaraj, S. (1995), “A path analyticmodel <strong>of</strong> a theory <strong>of</strong> quality management underlying the Deming management model:preliminary empirical findings”, Decision Sciences, Vol. 26 No. 5, pp. 637-58.Bassioni, H.A., Price, A.D.F. <strong>and</strong> Hassan, T.M. (2004a), “Theoretical formulation <strong>of</strong> a frameworkfor measuring business performance in construction”, in Ruddock, L., Sexton, M.,
Amaratunga, D., Aouad, G. <strong>and</strong> Kagioglou, M. (Eds), 4th International PostgraduateResearch Conference, 1-2 April, University <strong>of</strong> Salford, Salford, pp. 419-30.Bassioni, H.A., Price, A.D.F. <strong>and</strong> Hassan, T.M. (2004b), “Performance measurement inconstruction”, Journal <strong>of</strong> Management in Engineering, Vol. 20 No. 2, pp. 42-50.Bassioni, H.A., Price, A.D.F. <strong>and</strong> Hassan, T.M. (2005), “Building a conceptual framework formeasuring business performance in construction: an empirical evaluation”, ConstructionManagement <strong>and</strong> Economics, Vol. 23 No. 5, pp. 495-507.Beatham, S.M., Anumba, C.J., Thorpe, A. <strong>and</strong> Murray, M.A.P. (2002), “Utilising the EFQMexcellence model to drive business improvement”, in Gancalves, A., Roy, M.A.P. <strong>and</strong>Steiger-Garcao, A. (Eds), Advances in Concurrent Engineering, 9th ISPE InternationalConference on Concurrent Engineering, Cranfield University, UK, A.A. BalkemaPublishers, Rotterdam, pp. 413-22.Black, S. <strong>and</strong> Porter, L.J. (1996), “Identification <strong>of</strong> the critical factors <strong>of</strong> TQM”, Decision Sciences,Vol. 27 No. 1, pp. 1-21.Brewerton, P. <strong>and</strong> Millward, L. (2001), Organisational Research Methods, Sage Publications,London.Byrne, B.M. (1998), Structural Equation Modeling with LISREL, PRELIS, <strong>and</strong> SIMPLIS: BasicConcepts, Applications <strong>and</strong> Programming, Lawrence Erlbaum Associates, Mahwah, NJ.Cheng, E.W.L. <strong>and</strong> Li, H. (2001), “Analytic hierarchy process: an approach to determine measuresfor business performance”, Measuring Business Excellence, Vol. 5 No. 3, pp. 30-7.Cooper, D.R. <strong>and</strong> Emory, C.W. (1995), Business Research Methods, Irwin, Chicago, IL.Cramer, D. (2003), Advanced Quantitative Data Analysis, Open University Press, McGraw-HillEducation, Maidenhead.Curran, P.J., West, S.G. <strong>and</strong> Finch, J.F. (1996), “The robustness <strong>of</strong> test statistics to non-normality<strong>and</strong> specification error in confirmatory factor <strong>analysis</strong>”, Psychological Methods, Vol. 1,pp. 16-29.Duhachek, A. <strong>and</strong> Iacobucci, D. (2004), “Alpha’s St<strong>and</strong>ard Error (ASE): an accurate <strong>and</strong> preciseconfidence interval estimate”, Journal <strong>of</strong> Applied Psychology, Vol. 89 No. 5, pp. 792-808.EFQM (2007), The EFQM Excellence Model, The European Foundation for Quality Management,available at: www.efqm.org (accessed July 2007).Eskildsen, J.K., Kristensen, K. <strong>and</strong> Juhl, H.J. (2001), “The criterion weights <strong>of</strong> the EFQMexcellence model”, International Journal <strong>of</strong> Quality & Reliability Management, Vol. 18 No. 8,pp. 783-95.Financial Analysis Made Easy (FAME) (2003), Company Database, Bureau van Dijk ElectronicPublishing, available at: http://fame.bvdep.com/ (accessed December 2003).Flynn, B.B., Schroeder, R.G. <strong>and</strong> Sakakibara, S. (1994), “A framework for quality managementresearch <strong>and</strong> an associated measurement instrument”, Journal <strong>of</strong> Operations Management,Vol. 11 No. 4, pp. 339-66.Gerbing, D.W. <strong>and</strong> Anderson, J.C. (1992), “Monte Carlo evaluations <strong>of</strong> goodness <strong>of</strong> fit indices forstructural equation models”, Sociological Methods & Research, Vol. 21, pp. 132-60.Gill, J. <strong>and</strong> Johnson, P. (2002), Research Methods <strong>of</strong> Managers, Sage Publications, London.Hair, J.F., Anderson, R.E., Tatham, R.L. <strong>and</strong> Black, W. (1998), Multivariate Data Analysis,Prentice-Hall, Englewood Cliffs, NJ.Hussey, J. <strong>and</strong> Hussey, R. (1997), Business Research: A Practical Guide to Undergraduate <strong>and</strong>Postgraduate Students, Macmillan Press, London.A constructionexcellence model37
ECAM15,138Kagioglou, M., Cooper, R. <strong>and</strong> Aouad, G. (2001), “Performance management in construction: aconceptual framework”, Construction Management <strong>and</strong> Economics, Vol. 19, pp. 85-95.Kaplan, R.S. <strong>and</strong> Norton, D.P. (1992), “The balanced scorecard – measures that driveperformance”, Harvard Business Review, January-February, pp. 71-9.Kaplan, R.S. <strong>and</strong> Norton, D.P. (1993), “Putting the balanced scorecard to work”, Harvard BusinessReview, September-October, pp. 134-47.Kaplan, R.S. <strong>and</strong> Norton, D.P. (1996), “Using the balanced scorecard as a strategic managementsystem”, Harvard Business Review, January-February, pp. 75-85.Loehlin, J.C. (1998), Latent Variable Models: An Introduction to Factor, Path, <strong>and</strong> StructuralAnalysis, Lawrence Erlbaum Associates, Mahwah, NJ.Makin, P.J., Cooper, C.L. <strong>and</strong> Cox, C.J. (1996), Organizations <strong>and</strong> the Psychological Contract:Managing People at Work, The British Psychological Society, Leicester.New Civil Engineer (2003), “NCE Contractors File”, New Civil Engineer, July.National Institute for St<strong>and</strong>ards <strong>and</strong> Technology (NIST) (2007), Baldrige National QualityProgram, National Institute for St<strong>and</strong>ards <strong>and</strong> Technology, available at: www.quality.nist.gov/ (accessed July 2007).Robinson, H.S., Anumba, C.J., Carrillo, P.M. <strong>and</strong> Al-Ghassani, A.M. (2005), “Businessperformance measurement practices in construction engineering organizations”,Measuring Business Excellence, Vol. 9 No. 1, pp. 13-22.Saraph, J.V., Benson, P.G. <strong>and</strong> Schroeder, R.G. (1989), “An instrument for measuring the criticalfactors <strong>of</strong> quality management”, Decision Sciences, Vol. 20 No. 4, pp. 810-29.Sekaran, U. (2003), Research Methods for Business: A Skill-building Approach, Wiley, New York,NY.Stevens, J.P. (2002), Applied Multivariate Statistics for the Social Sciences, Lawrence ErlbaumAssociates, Mahwah, NJ.Stockdale, D.J. (1997), “Can total quality management ‘add value’ in construction?”, in Harlow, P.(Ed.), Construction Papers, The Chartered Institute <strong>of</strong> Building, Ascot.Tabachnick, B.G. <strong>and</strong> Fidell, L.S. (2001), Using Multivariate Statistics, Allyn & Bacon, PearsonEducation, Needham Heights, MA.Tan, K.C. (2002), “A comparative study <strong>of</strong> 16 national quality awards”, The TQM Magazine,Vol. 14 No. 3, pp. 165-71.Watson, P. <strong>and</strong> Seng, L.T. (2001), “Implementing the European Foundation for QualityManagement Model in construction”, Construction Information Quarterly, Constructionpaper 130.Wilson, D.D. <strong>and</strong> Collier, D.A. (2000), “An empirical investigation <strong>of</strong> the Malcolm BaldrigeNational Quality Award causal model”, Decision Sciences, Vol. 31 No. 2, pp. 361-90.Further readingKelloway, E.K. (1998), Using LISREL for Structural Equation Modeling: A Researchers Guide,Sage Publications, Newbury Park, CA.
Appendix.A constructionexcellence model39Figure A1.Questionnaire
ECAM15,140Figure A1.
A constructionexcellence model41Figure A1.Corresponding authorH.A. Bassioni can be contacted at: hbassioni@yahoo.co.ukTo purchase reprints <strong>of</strong> this article please e-mail: reprints@emeraldinsight.comOr visit our web site for further details: www.emeraldinsight.com/reprints