Annual Report 2011 - Mandarin Oriental Hotel Group
Annual Report 2011 - Mandarin Oriental Hotel Group
Annual Report 2011 - Mandarin Oriental Hotel Group

Create successful ePaper yourself
Turn your PDF publications into a flip-book with our unique Google optimized e-Paper software.
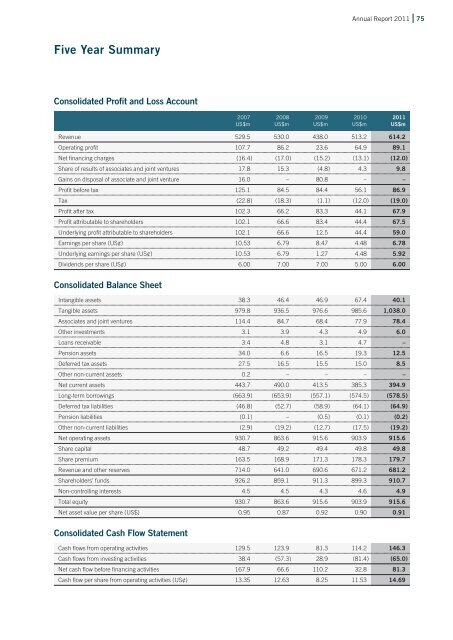
Five Year Summary<br />
Consolidated Profit and Loss Account<br />
<strong>Annual</strong> <strong>Report</strong> <strong>2011</strong> 75<br />
2007 2008 2009 2010 <strong>2011</strong><br />
US$m US$m US$m US$m US$m<br />
Revenue 529.5 530.0 438.0 513.2 614.2<br />
Operating profit 107.7 86.2 23.6 64.9 89.1<br />
Net financing charges (16.4 ) (17.0 ) (15.2 ) (13.1 ) (12.0 )<br />
Share of results of associates and joint ventures 17.8 15.3 (4.8 ) 4.3 9.8<br />
Gains on disposal of associate and joint venture 16.0 – 80.8 – –<br />
Profit before tax 125.1 84.5 84.4 56.1 86.9<br />
Tax (22.8 ) (18.3 ) (1.1 ) (12.0 ) (19.0 )<br />
Profit after tax 102.3 66.2 83.3 44.1 67.9<br />
Profit attributable to shareholders 102.1 66.6 83.4 44.4 67.5<br />
Underlying profit attributable to shareholders 102.1 66.6 12.5 44.4 59.0<br />
Earnings per share (US¢) 10.53 6.79 8.47 4.48 6.78<br />
Underlying earnings per share (US¢) 10.53 6.79 1.27 4.48 5.92<br />
Dividends per share (US¢) 6.00 7.00 7.00 5.00 6.00<br />
Consolidated Balance Sheet<br />
Intangible assets 38.3 46.4 46.9 67.4 40.1<br />
Tangible assets 979.8 936.5 976.6 985.6 1,038.0<br />
Associates and joint ventures 114.4 84.7 68.4 77.9 78.4<br />
Other investments 3.1 3.9 4.3 4.9 6.0<br />
Loans receivable 3.4 4.8 3.1 4.7 –<br />
Pension assets 34.0 6.6 16.5 19.3 12.5<br />
Deferred tax assets 27.5 16.5 15.5 15.0 8.5<br />
Other non-current assets 0.2 – – – –<br />
Net current assets 443.7 490.0 413.5 385.3 394.9<br />
Long-term borrowings (663.9 ) (653.9 ) (557.1 ) (574.5 ) (578.5 )<br />
Deferred tax liabilities (46.8 ) (52.7 ) (58.9 ) (64.1 ) (64.9 )<br />
Pension liabilities (0.1 ) – (0.5 ) (0.1 ) (0.2 )<br />
Other non-current liabilities (2.9 ) (19.2 ) (12.7 ) (17.5 ) (19.2 )<br />
Net operating assets 930.7 863.6 915.6 903.9 915.6<br />
Share capital 48.7 49.2 49.4 49.8 49.8<br />
Share premium 163.5 168.9 171.3 178.3 179.7<br />
Revenue and other reserves 714.0 641.0 690.6 671.2 681.2<br />
Shareholders’ funds 926.2 859.1 911.3 899.3 910.7<br />
Non-controlling interests 4.5 4.5 4.3 4.6 4.9<br />
Total equity 930.7 863.6 915.6 903.9 915.6<br />
Net asset value per share (US$) 0.95 0.87 0.92 0.90 0.91<br />
Consolidated Cash Flow Statement<br />
Cash flows from operating activities 129.5 123.9 81.3 114.2 146.3<br />
Cash flows from investing activities 38.4 (57.3 ) 28.9 (81.4 ) (65.0 )<br />
Net cash flow before financing activities 167.9 66.6 110.2 32.8 81.3<br />
Cash flow per share from operating activities (US¢) 13.35 12.63 8.25 11.53 14.69