Annual Report 2011 - Mandarin Oriental Hotel Group
Annual Report 2011 - Mandarin Oriental Hotel Group
Annual Report 2011 - Mandarin Oriental Hotel Group

Create successful ePaper yourself
Turn your PDF publications into a flip-book with our unique Google optimized e-Paper software.
52 <strong>Mandarin</strong> <strong>Oriental</strong> International Limited<br />
Notes to the Financial Statements Continued<br />
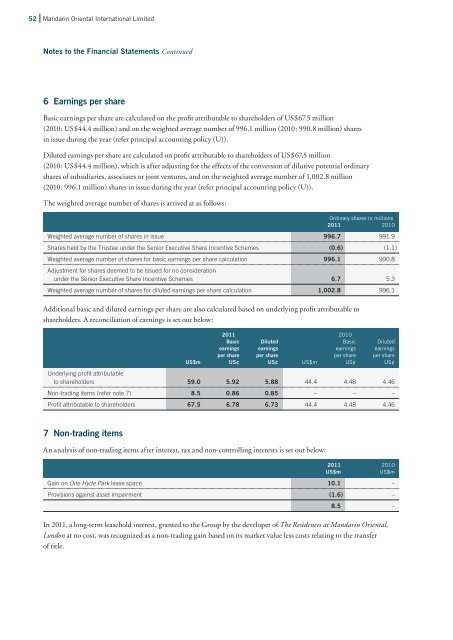
6 Earnings per share<br />
Basic earnings per share are calculated on the profit attributable to shareholders of US$67.5 million<br />
(2010: US$44.4 million) and on the weighted average number of 996.1 million (2010: 990.8 million) shares<br />
in issue during the year (refer principal accounting policy (U)).<br />
Diluted earnings per share are calculated on profit attributable to shareholders of US$67.5 million<br />
(2010: US$44.4 million), which is after adjusting for the effects of the conversion of dilutive potential ordinary<br />
shares of subsidiaries, associates or joint ventures, and on the weighted average number of 1,002.8 million<br />
(2010: 996.1 million) shares in issue during the year (refer principal accounting policy (U)).<br />
The weighted average number of shares is arrived at as follows:<br />
Ordinary shares in millions<br />
<strong>2011</strong> 2010<br />
Weighted average number of shares in issue 996.7 991.9<br />
Shares held by the Trustee under the Senior Executive Share Incentive Schemes (0.6 ) (1.1 )<br />
Weighted average number of shares for basic earnings per share calculation<br />
Adjustment for shares deemed to be issued for no consideration<br />
996.1 990.8<br />
under the Senior Executive Share Incentive Schemes 6.7 5.3<br />
Weighted average number of shares for diluted earnings per share calculation 1,002.8 996.1<br />
Additional basic and diluted earnings per share are also calculated based on underlying profit attributable to<br />
shareholders. A reconciliation of earnings is set out below:<br />
<strong>2011</strong> 2010<br />
Basic Diluted Basic Diluted<br />
earnings earnings earnings earnings<br />
per share per share per share per share<br />
US$m US¢ US¢ US$m US¢ US¢<br />
Underlying profit attributable<br />
to shareholders 59.0 5.92 5.88 44.4 4.48 4.46<br />
Non-trading items (refer note 7) 8.5 0.86 0.85 – – –<br />
Profit attributable to shareholders 67.5 6.78 6.73 44.4 4.48 4.46<br />
7 Non-trading items<br />
An analysis of non-trading items after interest, tax and non-controlling interests is set out below:<br />
<strong>2011</strong> 2010<br />
US$m US$m<br />
Gain on One Hyde Park lease space 10.1 –<br />
Provisions against asset impairment (1.6 ) –<br />
8.5 –<br />
In <strong>2011</strong>, a long-term leasehold interest, granted to the <strong>Group</strong> by the developer of The Residences at <strong>Mandarin</strong> <strong>Oriental</strong>,<br />
London at no cost, was recognized as a non-trading gain based on its market value less costs relating to the transfer<br />
of title.