Elementary Science Fair Planning Guide - Cobb County School ...
Elementary Science Fair Planning Guide - Cobb County School ...
Elementary Science Fair Planning Guide - Cobb County School ...

You also want an ePaper? Increase the reach of your titles
YUMPU automatically turns print PDFs into web optimized ePapers that Google loves.
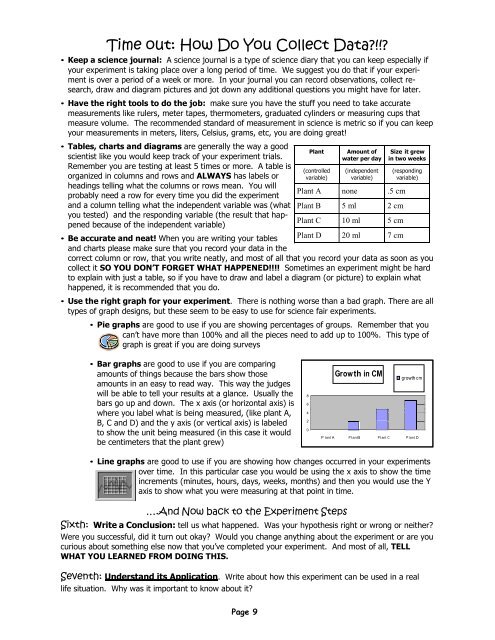
Time out: How Do You Collect Data?!!?• Keep a science journal: A science journal is a type of science diary that you can keep especially ifyour experiment is taking place over a long period of time. We suggest you do that if your experimentis over a period of a week or more. In your journal you can record observations, collect research,draw and diagram pictures and jot down any additional questions you might have for later.• Have the right tools to do the job: make sure you have the stuff you need to take accuratemeasurements like rulers, meter tapes, thermometers, graduated cylinders or measuring cups thatmeasure volume. The recommended standard of measurement in science is metric so if you can keepyour measurements in meters, liters, Celsius, grams, etc, you are doing great!• Tables, charts and diagrams are generally the way a goodscientist like you would keep track of your experiment trials.Plant Amount ofwater per daySize it grewin two weeksRemember you are testing at least 5 times or more. A table isorganized in columns and rows and ALWAYS has labels or(controlledvariable)(independentvariable)(respondingvariable)headings telling what the columns or rows mean. You willprobably need a row for every time you did the experimentPlant A none .5 cmand a column telling what the independent variable was (what Plant B 5 ml 2 cmyou tested) and the responding variable (the result that happenedbecause of the independent variable)Plant C 10 ml 5 cm• Be accurate and neat! When you are writing your tablesPlant D 20 ml 7 cmand charts please make sure that you record your data in thecorrect column or row, that you write neatly, and most of all that you record your data as soon as youcollect it SO YOU DON’T FORGET WHAT HAPPENED!!!! Sometimes an experiment might be hardto explain with just a table, so if you have to draw and label a diagram (or picture) to explain whathappened, it is recommended that you do.• Use the right graph for your experiment. There is nothing worse than a bad graph. There are alltypes of graph designs, but these seem to be easy to use for science fair experiments.• Pie graphs are good to use if you are showing percentages of groups. Remember that youcan’t have more than 100% and all the pieces need to add up to 100%. This type ofgraph is great if you are doing surveys• Bar graphs are good to use if you are comparingamounts of things because the bars show thoseamounts in an easy to read way. This way the judgeswill be able to tell your results at a glance. Usually the 8bars go up and down. The x axis (or horizontal axis) is 6where you label what is being measured, (like plant A,42B, C and D) and the y axis (or vertical axis) is labeled0to show the unit being measured (in this case it wouldbe centimeters that the plant grew)Grow th in CMgr owth cmP l ant A P l ant B P l ant C P l ant D• Line graphs are good to use if you are showing how changes occurred in your experimentsover time. In this particular case you would be using the x axis to show the timeincrements (minutes, hours, days, weeks, months) and then you would use the Yaxis to show what you were measuring at that point in time.….And Now back to the Experiment StepsSixth: Write a Conclusion: tell us what happened. Was your hypothesis right or wrong or neither?Were you successful, did it turn out okay? Would you change anything about the experiment or are youcurious about something else now that you’ve completed your experiment. And most of all, TELLWHAT YOU LEARNED FROM DOING THIS.Seventh: Understand its Application. Write about how this experiment can be used in a reallife situation. Why was it important to know about it?Page 9