- Page 2 and 3:
Faber and Kell's Heating andAir-con
- Page 4:
Faber and Kell's Heating andAir-con
- Page 9 and 10:
viiiContentsOther systems 396Altern
- Page 11 and 12:
This Page Intentionally Left Blank
- Page 13 and 14:
xiiPreface to the ninth editionadvi
- Page 15 and 16:
This Page Intentionally Left Blank
- Page 17 and 18:
This Page Intentionally Left Blank
- Page 19 and 20:
2 FundamentalsBefore any part of th
- Page 21 and 22:
4 FundamentalsSpecific heat capacit
- Page 23 and 24:
6 Fundamentalsas insulators have a
- Page 25 and 26:
8 FundamentalsTable 1.4 Examples of
- Page 27 and 28:
10 FundamentalsIt has been suggeste
- Page 29 and 30:
12 FundamentalsTable 1.7 Wind-chill
- Page 31 and 32:
14 Fundamentalsthermometer, used fo
- Page 33 and 34:
16 Fundamentalsmeasure them, applic
- Page 35 and 36:
18 FundamentalsInletventilationTher
- Page 37 and 38:
20 The building in wintercoincide a
- Page 39 and 40:
22 The building in winter20GlassTem
- Page 41 and 42:
24 The building in winterFor the in
- Page 43 and 44:
26 The building in winterTable 2.2
- Page 45 and 46:
28 The building in winter4.0Plan8.5
- Page 47 and 48:
30 The building in wintermost commo
- Page 49 and 50:
32 The building in winterExposed el
- Page 51 and 52:
34 The building in winterFigure 2.4
- Page 53 and 54:
36 The building in winterTable 2.4
- Page 55 and 56:
38 The building in winterInsulation
- Page 57 and 58:
40 The building in winterSurfaceAre
- Page 59 and 60:
42 The building in winterFrom Table
- Page 61 and 62:
44 The building in winterTemperatur
- Page 63 and 64:
46 The building in winterThe import
- Page 65 and 66:
48 The building in winterTable 2.10
- Page 67 and 68:
50 The building in winterIntermedia
- Page 69 and 70:
52 The building in winterInside tem
- Page 71 and 72:
54 The building in winterDesigntemp
- Page 73 and 74:
56 The building in winterFrom earli
- Page 75 and 76:
58 The building in winterTable 2.14
- Page 77 and 78:
60 The building in winterTemperatur
- Page 79 and 80:
62 The building in winterfollowing
- Page 81 and 82:
64 The building in winterIt has bee
- Page 83 and 84:
Chapter 3The building in summerThe
- Page 85 and 86:
68 The building in summerfrom simpl
- Page 87 and 88:
18070 The building in summerinforma
- Page 89 and 90:
72 The building in summerIncidence
- Page 91 and 92:
74 The building in summertime of pe
- Page 93 and 94:
76 The building in summerTable 3.2
- Page 95 and 96:
78 The building in summerTable 3.3
- Page 97 and 98:
80 The building in summerTable 3.4
- Page 99 and 100:
82 The building in summerTable 3.6
- Page 101 and 102:
84 The building in summerFigure 3.9
- Page 103 and 104:
86 The building in summerAB B C a1
- Page 105 and 106:
88 The building in summerConduction
- Page 107 and 108:
90 The building in summerTable 3.9
- Page 109 and 110:
92 The building in summerLossesMoto
- Page 111 and 112:
94 The building in summer(a)(b)Figu
- Page 113 and 114:
Chapter 4Survey of heating methodsH
- Page 115 and 116:
98 Survey of heating methodsTable 4
- Page 117 and 118:
100 Survey of heating methodsIndust
- Page 119 and 120:
102 Survey of heating methodsRadian
- Page 121 and 122:
104 Survey of heating methodsHeatex
- Page 123 and 124:
106 Survey of heating methodsReturn
- Page 125 and 126:
108 Survey of heating methodsReflec
- Page 127 and 128:
110 Survey of heating methodsCerami
- Page 129 and 130:
112 Survey of heating methodsTubula
- Page 131 and 132:
114 Survey of heating methodsthey a
- Page 133 and 134:
116 Survey of heating methodsFactor
- Page 135 and 136:
118 Survey of heating methodsrelian
- Page 137 and 138:
Chapter 5Electrical storage heating
- Page 139 and 140:
122 Electrical storage heatingTable
- Page 141 and 142:
124 Electrical storage heatingR 3
- Page 143 and 144:
126 Electrical storage heatingAs wi
- Page 145 and 146:
128 Electrical storage heatingWet c
- Page 147 and 148:
130 Electrical storage heatingStora
- Page 149 and 150:
132 Electrical storage heatingCasin
- Page 151 and 152:
134 Electrical storage heatingFinis
- Page 153 and 154:
136 Electrical storage heatingTable
- Page 155 and 156:
138 Electrical storage heatingVentI
- Page 157 and 158:
140 Electrical storage heatingUtili
- Page 159 and 160:
142 Electrical storage heatingExpan
- Page 161 and 162:
Chapter 6Indirect heating systemsIt
- Page 163 and 164:
146 Indirect heating systemsTable 6
- Page 165 and 166:
148 Indirect heating systemsin cont
- Page 167 and 168:
150 Indirect heating systemsHGIDEAC
- Page 169 and 170:
152 Indirect heating systemsLow tem
- Page 171 and 172:
154 Indirect heating systemsColdwat
- Page 173 and 174:
156 Indirect heating systemsRadiato
- Page 175 and 176:
158 Indirect heating systemsRadiato
- Page 177 and 178:
160 Indirect heating systemsCondens
- Page 179 and 180:
162 Indirect heating systems200800T
- Page 181 and 182:
164 Indirect heating systemssuccinc
- Page 183 and 184:
166 Indirect heating systemsTable 6
- Page 185 and 186:
168 Indirect heating systemsHigh ve
- Page 187 and 188:
170 Indirect heating systemsAs will
- Page 189 and 190:
172 Indirect heating systems0.080.0
- Page 191 and 192:
174 Indirect heating systems(a)(b)(
- Page 193 and 194:
Chapter 7Heat emitting equipmentWit
- Page 195 and 196:
178 Heat emitting equipmentTable 7.
- Page 197 and 198:
180 Heat emitting equipmentRadiant
- Page 199 and 200:
182 Heat emitting equipmentHeated g
- Page 201 and 202:
184 Heat emitting equipmentHangerIn
- Page 203 and 204:
186 Heat emitting equipmentpipes: e
- Page 205 and 206:
188 Heat emitting equipmentOpen fro
- Page 207 and 208:
190 Heat emitting equipment(a)(b)(d
- Page 209 and 210:
192 Heat emitting equipmentTable 7.
- Page 211 and 212:
194 Heat emitting equipmentConvecti
- Page 213 and 214:
196 Heat emitting equipmentDamperOu
- Page 215 and 216:
198 Heat emitting equipmentFilterOu
- Page 217 and 218:
200 Heat emitting equipmentSwivelno
- Page 219 and 220:
202 Heat emitting equipmentcovered
- Page 221 and 222:
204 Pumps and other auxiliary equip
- Page 223 and 224:
206 Pumps and other auxiliary equip
- Page 225 and 226:
208 Pumps and other auxiliary equip
- Page 227 and 228:
210 Pumps and other auxiliary equip
- Page 229 and 230:
212 Pumps and other auxiliary equip
- Page 231 and 232:
214 Pumps and other auxiliary equip
- Page 233 and 234:
216 Pumps and other auxiliary equip
- Page 235 and 236:
218 Pumps and other auxiliary equip
- Page 237 and 238:
220 Pumps and other auxiliary equip
- Page 239 and 240:
222 Pumps and other auxiliary equip
- Page 241 and 242:
224 Pumps and other auxiliary equip
- Page 243 and 244:
226 Pumps and other auxiliary equip
- Page 245 and 246:
228 Pumps and other auxiliary equip
- Page 247 and 248:
230 Pumps and other auxiliary equip
- Page 249 and 250:
Chapter 9Piping design for indirect
- Page 251 and 252:
234 Piping design for indirect heat
- Page 253 and 254:
236 Piping design for indirect heat
- Page 255 and 256:
238 Piping design for indirect heat
- Page 257 and 258:
240 Piping design for indirect heat
- Page 259 and 260:
242 Piping design for indirect heat
- Page 261 and 262:
244 Piping design for indirect heat
- Page 263 and 264:
246 Piping design for indirect heat
- Page 265 and 266:
248 Piping design for indirect heat
- Page 267 and 268:
250 Piping design for indirect heat
- Page 269 and 270:
252 Piping design for indirect heat
- Page 271 and 272:
254 Piping design for indirect heat
- Page 273 and 274:
256 Piping design for indirect heat
- Page 275 and 276:
258 Piping design for indirect heat
- Page 277 and 278:
Chapter 10Boilers and firing equipm
- Page 279 and 280:
262 Boilers and firing equipmentcom
- Page 281 and 282:
264 Boilers and firing equipmentEss
- Page 283 and 284:
266 Boilers and firing equipment100
- Page 285 and 286:
268 Boilers and firing equipmentAs
- Page 287 and 288:
270 Boilers and firing equipmentFlu
- Page 289 and 290:
272 Boilers and firing equipmentFlo
- Page 291 and 292:
274 Boilers and firing equipmentFig
- Page 293 and 294:
276 Boilers and firing equipmentof
- Page 295 and 296:
278 Boilers and firing equipment. a
- Page 297 and 298:
280 Boilers and firing equipmentIt
- Page 299 and 300:
282 Boilers and firing equipmentFue
- Page 301 and 302:
284 Boilers and firing equipmentNoz
- Page 303 and 304:
286 Boilers and firing equipmentof
- Page 305 and 306:
288 Boilers and firing equipmentNea
- Page 307 and 308:
290 Boilers and firing equipmentpor
- Page 309 and 310:
292 Boilers and firing equipmentSaf
- Page 311 and 312:
294 Boilers and firing equipmentIgn
- Page 313 and 314:
Chapter 11Fuels, storage and handli
- Page 315 and 316:
298 Fuels, storage and handlingvehi
- Page 317 and 318:
300 Fuels, storage and handlingRese
- Page 319 and 320:
302 Fuels, storage and handlingtank
- Page 321 and 322:
304 Fuels, storage and handlingTank
- Page 323 and 324:
306 Fuels, storage and handlingabcd
- Page 325 and 326:
308 Fuels, storage and handlingTabl
- Page 327 and 328:
310 Fuels, storage and handlingTabl
- Page 329 and 330:
312 Fuels, storage and handlingTabl
- Page 331 and 332:
314 Fuels, storage and handlingstor
- Page 333 and 334:
316 Fuels, storage and handlingTabl
- Page 335 and 336:
318 Combustion and chimneysTable 12
- Page 337 and 338:
320 Combustion and chimneysTable 12
- Page 339 and 340:
322 Combustion and chimneysHence, b
- Page 341 and 342:
324 Combustion and chimneys. The te
- Page 343 and 344:
326 Combustion and chimneys. Draugh
- Page 345 and 346:
328 Combustion and chimneysClean Ai
- Page 347 and 348:
330 Combustion and chimneysMechanic
- Page 349 and 350:
332 Combustion and chimneysFire bri
- Page 351 and 352:
334 Combustion and chimneysMaterial
- Page 353 and 354:
336 Combustion and chimneysCombusti
- Page 355 and 356:
338 Combustion and chimneysFlueterm
- Page 357 and 358:
Chapter 13VentilationThe act or art
- Page 359 and 360:
342 VentilationTable 13.1 Ventilati
- Page 361 and 362:
344 Ventilationnormal circumstance
- Page 363 and 364:
346 Ventilationof air which could b
- Page 365 and 366:
348 Ventilationsimilar plant. This
- Page 367 and 368:
350 VentilationFlueCrackleaksInduce
- Page 369 and 370:
352 VentilationCapSuction bandLouvr
- Page 371 and 372:
354 VentilationTable 13.6 Air volum
- Page 373 and 374:
356 VentilationCowlBelt driveHinged
- Page 375 and 376:
358 VentilationTo fans at roof leve
- Page 377 and 378:
360 Ventilationboiler plant in wint
- Page 379 and 380:
Dining hall362 VentilationCafeteria
- Page 381 and 382:
364 Ventilationthis arrangement, as
- Page 383 and 384:
366 Ventilationbe noted that, as a
- Page 385 and 386:
368 VentilationTable 13.9 Air veloc
- Page 387 and 388:
370 Ventilationvelocity. An increas
- Page 389 and 390:
372 VentilationLastly under this he
- Page 391 and 392:
374 Air-conditioningBecause refurbi
- Page 393 and 394:
376 Air-conditioningThe installatio
- Page 395 and 396:
378 Air-conditioningThe type of sys
- Page 397 and 398:
380 Air-conditioningAn extension of
- Page 399 and 400:
382 Air-conditioningZone unitsSuppl
- Page 401 and 402:
384 Air-conditioningSupply airOptio
- Page 403 and 404:
386 Air-conditioningoutput of the c
- Page 405 and 406:
388 Air-conditioningDischargeto spa
- Page 407 and 408:
390 Air-conditioningAirdischargeExt
- Page 409 and 410:
392 Air-conditioningin the wall in
- Page 411 and 412:
394 Air-conditioningPrimaryair2 Pip
- Page 413 and 414:
396 Air-conditioningThe induction s
- Page 415 and 416:
398 Air-conditioningsensor as an en
- Page 417 and 418:
400 Air-conditioningfan-coil system
- Page 419 and 420:
402 Air-conditioningVariable refrig
- Page 421 and 422:
404 Air-conditioningChilled water P
- Page 423 and 424:
406 Air-conditioningAir supply to h
- Page 425 and 426:
408 Air-conditioningTable 14.1 Fact
- Page 427 and 428:
410 Air distributionUpward systemTh
- Page 429 and 430:
412 Air distributionInlet at 50ºCm
- Page 431 and 432:
414 Air distributionExtract airSupp
- Page 433 and 434:
416 Air distributioninlet is at a h
- Page 435 and 436:
418 Air distribution(a)(b)Figure 15
- Page 437 and 438:
420 Air distributionconnections to
- Page 439 and 440:
422 Air distributionOpposed bladesD
- Page 441 and 442:
424 Air distributionVelocity profil
- Page 443 and 444:
426 Air distributionAir supplyPerfo
- Page 445 and 446:
428 Air distributionair temperature
- Page 447 and 448:
430 Air distributionTable 15.4 Typi
- Page 449 and 450:
432 Air distributionFrameSpring cli
- Page 451 and 452:
434 Air distributionenergy consumpt
- Page 453 and 454:
Chapter 16Ductwork designHaving dec
- Page 455 and 456:
438 Ductwork designthe duct with no
- Page 457 and 458:
440 Ductwork designFlat ovalStandar
- Page 459 and 460:
442 Ductwork designconstruction met
- Page 461 and 462:
444 Ductwork designDuctlengthDDRDDu
- Page 463 and 464:
446 Ductwork design6mm Plate damper
- Page 465 and 466:
448 Ductwork design+Pressure0Veloci
- Page 467 and 468:
450 Ductwork designatmospheric pres
- Page 469 and 470:
452 Ductwork designTable 16.2 Corre
- Page 471 and 472:
454 Ductwork design. Any allowances
- Page 473 and 474:
456 Ductwork designBy these means,
- Page 475 and 476:
458 Ductwork designTable 16.7 Minim
- Page 477 and 478:
460 Ductwork designxAmplitudeyFigur
- Page 479 and 480:
462 Ductwork designNoise criteriaIt
- Page 481 and 482:
464 Ductwork designL w ˆ 10 ‡ 10
- Page 483 and 484:
466 Ductwork design3 64Plant527 8 3
- Page 485 and 486:
468 Ductwork designwhereD ˆ perime
- Page 487 and 488:
470 Ductwork designArrows show dire
- Page 489 and 490:
472 Ductwork designALNORAJAFLOW(a)(
- Page 491 and 492:
Chapter 17Fans and air treatment eq
- Page 493 and 494:
476 Fans and air treatment equipmen
- Page 495 and 496:
478 Fans and air treatment equipmen
- Page 497 and 498:
480 Fans and air treatment equipmen
- Page 499 and 500:
PressurePowerPowerPressure482 Fans
- Page 501 and 502:
484 Fans and air treatment equipmen
- Page 503 and 504:
486 Fans and air treatment equipmen
- Page 505 and 506:
488 Fans and air treatment equipmen
- Page 507 and 508:
490 Fans and air treatment equipmen
- Page 509 and 510:
492 Fans and air treatment equipmen
- Page 511 and 512:
494 Fans and air treatment equipmen
- Page 513 and 514:
496 Fans and air treatment equipmen
- Page 515 and 516:
498 Fans and air treatment equipmen
- Page 517 and 518:
500 Fans and air treatment equipmen
- Page 519 and 520:
502 Fans and air treatment equipmen
- Page 521 and 522:
504 Fans and air treatment equipmen
- Page 523 and 524:
506 Fans and air treatment equipmen
- Page 525 and 526:
508 Fans and air treatment equipmen
- Page 527 and 528:
510 Fans and air treatment equipmen
- Page 529 and 530:
512 Fans and air treatment equipmen
- Page 531 and 532:
Chapter 18Calculations for air-cond
- Page 533 and 534:
Figure 18.1 Psychrometric chart (as
- Page 535 and 536:
518 Calculations for air-conditioni
- Page 537 and 538:
20mFoyer520 Calculations for air-co
- Page 539 and 540:
522 Calculations for air-conditioni
- Page 541 and 542:
524 Calculations for air-conditioni
- Page 543 and 544:
526 Calculations for air-conditioni
- Page 545 and 546:
528 Calculations for air-conditioni
- Page 547 and 548:
Chapter 19Refrigeration: water chil
- Page 549 and 550:
Absolute pressure MPa532 Refrigerat
- Page 551 and 552:
534 Refrigeration: water chillers a
- Page 553 and 554:
536 Refrigeration: water chillers a
- Page 555 and 556:
538 Refrigeration: water chillers a
- Page 557 and 558:
540 Refrigeration: water chillers a
- Page 559 and 560:
542 Refrigeration: water chillers a
- Page 561 and 562:
544 Refrigeration: water chillers a
- Page 563 and 564:
546 Refrigeration: water chillers a
- Page 565 and 566:
548 Refrigeration: water chillers a
- Page 567 and 568:
550 Refrigeration: water chillers a
- Page 569 and 570:
552 Refrigeration: water chillers a
- Page 571 and 572: 554 Refrigeration: water chillers a
- Page 573 and 574: 556 Refrigeration: water chillers a
- Page 575 and 576: 558 Refrigeration: water chillers a
- Page 577 and 578: 560 Refrigeration: water chillers a
- Page 579 and 580: 562 Refrigeration: water chillers a
- Page 581 and 582: 564 Hot water supply systemsObvious
- Page 583 and 584: 566 Hot water supply systemswith a
- Page 585 and 586: 568 Hot water supply systemswhich i
- Page 587 and 588: 600m m M in570 Hot water supply sys
- Page 589 and 590: 572 Hot water supply systemsThe meg
- Page 591 and 592: 574 Hot water supply systemsVentDra
- Page 593 and 594: 576 Hot water supply systemsPrimary
- Page 595 and 596: 578 Hot water supply systemsCistern
- Page 597 and 598: 580 Hot water supply systemsFor use
- Page 599 and 600: 582 Hot water supply systemsSteam-t
- Page 601 and 602: 584 Hot water supply systemsThe hea
- Page 603 and 604: 586 Hot water supply systemsTable 2
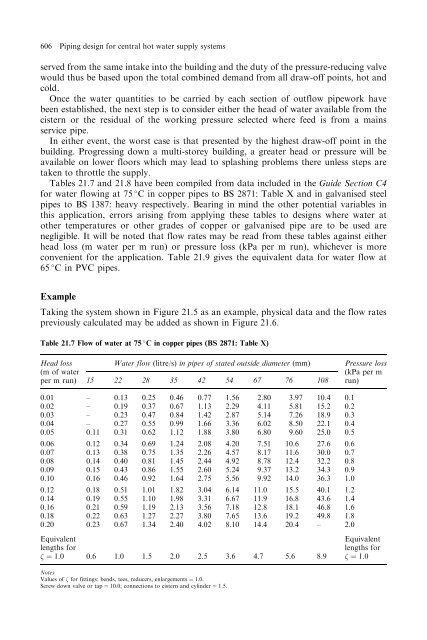
- Page 605 and 606: 588 Hot water supply systemsStorage
- Page 607 and 608: 590 Hot water supply systemsStorage
- Page 609 and 610: 592 Hot water supply systemsadequat
- Page 611 and 612: 594 Hot water supply systemsA compl
- Page 613 and 614: 596 Hot water supply systemsInsulat
- Page 615 and 616: Chapter 21Piping design for central
- Page 617 and 618: 600 Piping design for central hot w
- Page 619 and 620: 602 Piping design for central hot w
- Page 621: 604 Piping design for central hot w
- Page 625 and 626: 608 Piping design for central hot w
- Page 627 and 628: 610 Piping design for central hot w
- Page 629 and 630: Water flow rate in energy units kW/
- Page 631 and 632: 614 Piping design for central hot w
- Page 633 and 634: 616 Piping design for central hot w
- Page 635 and 636: 618 Piping design for central hot w
- Page 637 and 638: Chapter 22Automatic controls and bu
- Page 639 and 640: 622 Automatic controls and building
- Page 641 and 642: 624 Automatic controls and building
- Page 643 and 644: 626 Automatic controls and building
- Page 645 and 646: 628 Automatic controls and building
- Page 647 and 648: 630 Automatic controls and building
- Page 649 and 650: 632 Automatic controls and building
- Page 651 and 652: 634 Automatic controls and building
- Page 653 and 654: 636 Automatic controls and building
- Page 655 and 656: 638 Automatic controls and building
- Page 657 and 658: 640 Automatic controls and building
- Page 659 and 660: 642 Automatic controls and building
- Page 661 and 662: 644 Automatic controls and building
- Page 663 and 664: 646 Automatic controls and building
- Page 665 and 666: 648 Automatic controls and building
- Page 667 and 668: 650 Automatic controls and building
- Page 669 and 670: 652 Automatic controls and building
- Page 671 and 672: 654 Automatic controls and building
- Page 673 and 674:
656 Automatic controls and building
- Page 675 and 676:
658 Automatic controls and building
- Page 677 and 678:
660 Running costsPence per kWh4.03.
- Page 679 and 680:
662 Running costsAfter allowance ha
- Page 681 and 682:
664 Running costsTable 23.3 Part L
- Page 683 and 684:
666 Running costsTable 23.4 Degree-
- Page 685 and 686:
668 Running costsTable 23.5 Approxi
- Page 687 and 688:
670 Running costsaddition, consider
- Page 689 and 690:
672 Running costsRunning hours for
- Page 691 and 692:
674 Running costs20%. The variables
- Page 693 and 694:
Air temperature (ºC)Mass flow rate
- Page 695 and 696:
678 Running costsEnergy auditsAn en
- Page 697 and 698:
680 Running costs. Preventative. Pl
- Page 699 and 700:
682 Running costsTable 23.14 Econom
- Page 701 and 702:
3Oil consumption(litre / month x 10
- Page 703 and 704:
686 Running costsTable 23.15 Presen
- Page 705 and 706:
Chapter 24Combined heat and power (
- Page 707 and 708:
690 Combined heat and power (CHP)Fi
- Page 709 and 710:
692 Combined heat and power (CHP)Fi
- Page 711 and 712:
694 Combined heat and power (CHP)Fi
- Page 713 and 714:
696 Combined heat and power (CHP)Fi
- Page 715 and 716:
698 Combined heat and power (CHP)to
- Page 717 and 718:
700 Combined heat and power (CHP)we
- Page 719 and 720:
Appendix ITemperature levelsDegrees
- Page 721 and 722:
Appendix IIIConversion factorsImper
- Page 723 and 724:
This Page Intentionally Left Blank
- Page 725 and 726:
708 IndexAuxiliaryequipment (costs)
- Page 727 and 728:
710 Indexdegree-hour 676heat pumps
- Page 729 and 730:
712 Indexcleaning 489±93, 489±93d
- Page 731 and 732:
714 IndexIndirect hot water supplys
- Page 733 and 734:
716 IndexPharmaceuticalcleanrooms 4
- Page 735 and 736:
718 IndexSol-air temperatures 12sol
- Page 737:
720 Indexextract grilles 430±1indu