CCWD Master Plan Cover.ai - Contra Costa Water District
CCWD Master Plan Cover.ai - Contra Costa Water District
CCWD Master Plan Cover.ai - Contra Costa Water District

You also want an ePaper? Increase the reach of your titles
YUMPU automatically turns print PDFs into web optimized ePapers that Google loves.
AOne Walnut Creek Center100 Pringle Avenue, Suite 300Walnut Creek, CA 94596tel: 925 933-2900fax: 925 933-4174December 14, 2007Marie Valmores, P.E.Project Manager<strong>Contra</strong> <strong>Costa</strong> <strong>Water</strong> <strong>District</strong>2411 Bisso LaneConcord, CA 94520Subject:Treated <strong>Water</strong> <strong>Master</strong> <strong>Plan</strong> UpdateDear Marie:Camp Dresser & McKee (CDM) is pleased to submit the final 2007 Treated <strong>Water</strong> <strong>Master</strong> <strong>Plan</strong>(TWMP) Update. The TWMP identifies $169 million in treated water system improvementsneeded to both upgrade the existing distribution system to meet performance criteria undercurrent demand conditions and to expand the distribution system to accommodate futuregrowth.We have enjoyed this opportunity to work with you on this project, and have appreciated thecollaborative effort with the <strong>District</strong> in developing the TWMP.Very truly yours,Polly L. Boissev<strong>ai</strong>nProject ManagerCamp Dresser & McKee Inc.cc: Jeff Quimby, <strong>Contra</strong> <strong>Costa</strong> <strong>Water</strong> <strong>District</strong>consulting • engineering • construction • operations
Table of ContentsTable of Contents2007 Treated <strong>Water</strong> <strong>Master</strong> <strong>Plan</strong> Update - Draft Report
ContentsAcknowledgmentsExecutive SummarySection 1Introduction1.1 Study Purpose............................................................................................... 1-11.2 <strong>District</strong> Overview........................................................................................... 1-11.2.1 <strong>District</strong> Service Area...................................................................................................... 1-11.2.2 Study Area...................................................................................................................... 1-11.2.3 <strong>District</strong> Mission and Goals ............................................................................................ 1-21.3 Scope of Services ......................................................................................... 1-21.4 Relationship to Other <strong>District</strong> Studies ......................................................... 1-31.4.1 Future <strong>Water</strong> Supply Study ........................................................................................... 1-31.4.2 Seismic and Reliability Improvement Project .............................................................. 1-31.4.3 Treated <strong>Water</strong> Renewal/Replacement Study .............................................................. 1-41.5 Report Organization...................................................................................... 1-41.6 Acronyms ...................................................................................................... 1-5Section 2Existing <strong>Water</strong> System2.1 Untreated <strong>Water</strong> Supply ............................................................................... 2-12.2 Treated <strong>Water</strong> Supply................................................................................... 2-22.3 Distribution System ...................................................................................... 2-32.3.1 Pipelines ........................................................................................................................ 2-42.3.2 Storage Reservoirs ........................................................................................................ 2-42.3.3 Pump Stations ............................................................................................................... 2-62.4 Facilities Added Since the 2002 Treated <strong>Water</strong> <strong>Master</strong> <strong>Plan</strong> .................... 2-8Section 3Existing and Projected <strong>Water</strong> Demands3.1 Purpose of Demand Projections .................................................................. 3-13.2 Land Use Assumptions................................................................................. 3-13.2.1 Current <strong>Plan</strong>ning Area................................................................................................... 3-13.2.2 Former Concord Naval Weapons Station..................................................................... 3-13.3 Annual <strong>Water</strong> Demands .................................................................................................. 3-23.3.1 Historical Annual <strong>Water</strong> Use ......................................................................................... 3-23.3.2 Annual <strong>Water</strong> Demand Projections .............................................................................. 3-23.4 Peak <strong>Water</strong> Demands................................................................................... 3-53.4.1 Historical Maximum Day <strong>Water</strong> Use............................................................................. 3-53.4.2 Diurnal <strong>Water</strong> Use Patterns .......................................................................................... 3-63.4.3 Maximum Day and Peak Hour Demand Projections ................................................... 3-6A 2007 Treated <strong>Water</strong> <strong>Master</strong> <strong>Plan</strong> Update i
Contents3.5 Effects of Conservation ................................................................................ 3-73.6 Comparison of Demands with Other Studies .............................................. 3-8Section 4System Performance Criteria4.1 Summary of Criteria...................................................................................... 4-14.2 Pump Station Criteria ................................................................................... 4-14.3 Storage Reservoir Criteria ............................................................................ 4-14.4 Distribution System Criteria ......................................................................... 4-34.4.1 Distribution System Pressures ..................................................................................... 4-34.4.2 Fire Flows....................................................................................................................... 4-34.4.3 Pipeline Performance.................................................................................................... 4-34.4.4 System Reliability Criteria ............................................................................................. 4-34.4.5 <strong>Water</strong> Quality Goals....................................................................................................... 4-4Section 5System Analysis5.1 <strong>District</strong> Operations Input .............................................................................. 5-15.2 Pump Station Analysis.................................................................................. 5-15.3 Storage Analysis ........................................................................................... 5-35.4 Reliability Analysis ........................................................................................ 5-65.5 Multi-Purpose Pipeline Analysis ................................................................... 5-75.5.1 Recommendations ........................................................................................................ 5-85.6 Distribution System Analysis........................................................................ 5-95.6.1 Maximum Flow Scenarios...........................................................................................5-105.6.2 Normal Operations ......................................................................................................5-11Section 6Recommended Improvements, Costs and Phasing6.1 Methodology for Developing Improvement Sizes and Costs ...................... 6-16.1.1 Approach to Developing Improvements...................................................................... 6-16.1.2 Basis for Estimating and Allocating Costs................................................................... 6-16.2 Recommended Improvements, Costs and Phasing.................................... 6-26.2.1 Summary....................................................................................................................... 6-26.2.2 Pump Stations .............................................................................................................. 6-36.2.3 Reservoirs ..................................................................................................................... 6-46.2.4 Pipelines ....................................................................................................................... 6-66.2.5 Distribution System <strong>Water</strong> Quality Improvements....................................................6-126.2.6 MPP Long-Term Improvements .................................................................................6-126.2.7 Reliability Improvements ...........................................................................................6-126.2.8 Comparison with the 2002 Treated <strong>Water</strong> <strong>Master</strong> <strong>Plan</strong> ..........................................6-136.3 Capital Improvement Program ................................................................... 6-156.3.1 TWMP Improvement Cost Allocations for CIP Timeframes ......................................6-156.3.2 Ten-year Capital Improvement Program ...................................................................6-15ii 2007 Treated <strong>Water</strong> <strong>Master</strong> <strong>Plan</strong> Update A
ContentsReferencesAppendicesAppendix A Demand Projection MethodologyAppendix B Seismic Reliability Improvement Project Reliability CriteriaAppendix C Hydraulic Model CalibrationAppendix D MPP Long-term Alternatives EvaluationAppendix E Fire Flow Analysis ResultsAppendix F Cost EstimatingFigures1-1 Treated <strong>Water</strong> Service Area Map ........................................................................................... 1-22-1 Treated <strong>Water</strong> Distribution System Service Areas and Pressure Zones.............................. 2-42-2 Schematic Diagram ................................................................................................................ 2-43-1 Annual Historical <strong>Water</strong> Production..................................................................................on 3-23-2 Hourly Peaking Factors for Distribution System ..............................................................on 3-63-3 Comparison of Historical Average Day Treated <strong>Water</strong> Demand Projections withCurrent Projections............................................................................................................on 3-85-1 Fire Flow Av<strong>ai</strong>lability in the Distribution System .................................................................5-105-2 Distribution System Improvement Needs ..........................................................................5-126-1 Distribution System and Phasing Improvements............................................................6-2Tables1-1 Other <strong>District</strong> Studies and How They Are Used in the Treated <strong>Water</strong> Service Area <strong>Master</strong><strong>Plan</strong> Update ............................................................................................................................. 1-31-2 2007 Treated <strong>Water</strong> <strong>Master</strong> <strong>Plan</strong> Report Organization ........................................................ 1-42-1 Existing Treated <strong>Water</strong> Pressure Zones and Subzones ........................................................ 2-32-2 Existing Storage Reservoirs .................................................................................................... 2-52-3 Existing Pump Stations ........................................................................................................... 2-72-4 Facilities Added Since the 2002 Treated <strong>Water</strong> <strong>Master</strong> <strong>Plan</strong> .............................................. 2-83-1 Existing and Projected Annual Demand................................................................................. 3-33-2 <strong>Plan</strong>ning Assumptions Used to Develop Annual Demand Projections................................. 3-43-3 Historical Average and Maximum D<strong>ai</strong>ly <strong>Water</strong> Use ............................................................... 3-53-4 Maximum Day and Peak Hour <strong>Water</strong> Demand Projections .................................................. 3-74-1 <strong>Master</strong> <strong>Plan</strong> System Performance Criteria............................................................................. 4-25-1 Comparison of Existing and Required Pump Station Capacity ............................................. 5-25-2 Comparison of Existing and Required Storage Capacity....................................................... 5-45-3 Adjusted Storage Deficits Considering Backup Power.......................................................... 5-5A 2007 Treated <strong>Water</strong> <strong>Master</strong> <strong>Plan</strong> Update iii
Contents5-4 Backup Generators Installed Since the 2002 Treated <strong>Water</strong> <strong>Master</strong> <strong>Plan</strong> ......................... 5-65-5 Isolation Valves Installed Since the 2002 Treated <strong>Water</strong> <strong>Master</strong> <strong>Plan</strong> ............................... 5-75-6 Fault Crossing Connections Installed Since the 2002 Treated <strong>Water</strong> <strong>Master</strong> <strong>Plan</strong>............ 5-75-7 Summary of Long-Term Alternatives for MPP Service to TWSA............................................ 5-95-8 Locations with Fire Flow Deficiencies ..................................................................................5-116-1 Summary of Recommended Capital Improvements and Costs............................................ 6-36-2 Recommended Pump Capacity Improvements ..................................................................... 6-46-3 Recommended Reservoir Capacity Improvements ............................................................... 6-56-4 Recommended Pipeline Improvements................................................................................. 6-76-5 Recommended Distribution System <strong>Water</strong> Quality Improvements ....................................6-126-6 Recommended Backup Generators.....................................................................................6-136-7 Recommended Sites for Seismically Triggered Isolation Valves ........................................6-136-8 Recommended Fault Crossing Connections........................................................................6-136-9 Cost and Capacity Comparison with the 2002 Treated <strong>Water</strong> <strong>Master</strong> <strong>Plan</strong> ......................6-146-10 Development of 2002 Treated <strong>Water</strong> <strong>Master</strong> <strong>Plan</strong> Adjusted Costs and Capacity Costs ..6-146-11 Allocation of TWMP Improvement Costs to Ten-Year and Long-Term CapitalImprovement Program..........................................................................................................6-156-12 Ten-Year Capital Improvement Project Recommendations ...............................................6-16iv 2007 Treated <strong>Water</strong> <strong>Master</strong> <strong>Plan</strong> Update A
AcknowledgmentsCDM would like to acknowledge the many <strong>District</strong> staff members who assisted in preparing this <strong>Master</strong><strong>Plan</strong> Update Report. Their invaluable contributions are acknowledged, and their efforts are appreciatedin accomplishing this project successfully.<strong>District</strong> Project TeamJeff Quimby and Marie Valmores, Project Managers, <strong>Plan</strong>ningFrances Garland, Principal <strong>Plan</strong>nerJerry Brown, <strong>Plan</strong>ning Department DirectorGreg Gartrell, Assistant General Manager, <strong>Plan</strong>ning/CALFEDThomas J. Linville, Assistant General Manager, EngineeringRossana L. Riggs, Administrative SecretaryUser GroupScott Weddle, EngineeringRyan Freeborn, EngineeringDave Huey, Operations & M<strong>ai</strong>ntenanceAndrea Flores, Operations & M<strong>ai</strong>ntenanceCamp Dresser & McKee Inc. (CDM)Jon Toyoda, Officer-in-ChargePolly Boissev<strong>ai</strong>n, Project ManagerYoussif Hussein, Project EngineerKevin Trott, Staff EngineerJuan Tijero, GraphicsJulie Hinchcliff, Word ProcessingVanessa Asis, ClerkA 2007 Treated <strong>Water</strong> <strong>Master</strong> <strong>Plan</strong> Update 1
Executive SummaryExecutive Summary2007 Treated <strong>Water</strong> <strong>Master</strong> <strong>Plan</strong> Update - Draft Report
Executive SummaryES.1 Introduction and Key FindingsThe 2007 Treated <strong>Water</strong> <strong>Master</strong> <strong>Plan</strong> (TWMP) is an updateof the 2002 TWMP accepted by the Board in December2002. Consistent with <strong>District</strong> Regulation 7.20.030, theTWMP identifies treated water system improvementsneeded to both upgrade the existing distribution system tomeet performance criteria under current demandconditions and to expand the distribution system toaccommodate future growth.The 2007 TWMP incorporates current demand projections,uses an updated hydraulic model for system evaluations,and incorporates projects for improving system reliability.The key findings of the 2007 TWMP are summarizedbelow:• The total cost of recommended treated water servicearea (TWSA) improvements is approximately $169M.This plan is consistent with the 2002 TWMP asadjusted for inflation, and projects implemented since 2002.• Of the total, $79M is to correct existing deficiencies and would be funded through treated waterrates. The rem<strong>ai</strong>ning $90M is for growth and would be funded through Facilities Reserve Charges(FRC), a developer-funded program to pay for growth-related improvements.• TWMP projects were prioritized for inclusion in the <strong>District</strong>’s Ten-Year Capital Improvement Program(CIP). The Ten-Year CIP includes $18M for TWMP projects. Reliability improvements, fire flowimprovements, and other high priority projects were included.• An analysis of the Multi-Purpose Pipeline (MPP) was completed to identify long-term alternatives tomaximize efficiencies for servicing the Treated <strong>Water</strong> Service Area (TWSA). Based on the analysis, aproject was recommended and alternatives that would include coordination with the development ofthe Concord Naval Weapons Station were identified.• Recommended system improvements reflect a phased approach to meeting Board adopted criteriafor existing emergency storage. Instead of assuming that emergency storage would be addedimmediately to provide system reliability, a combination of storage, pumping and pipelineimprovements were identified in the 2002 TWMP to provide near-term “in-lieu” emergency storage.Many of these improvements have been implemented, and rem<strong>ai</strong>ning projects have been carriedforward in this Treated <strong>Water</strong> <strong>Master</strong> <strong>Plan</strong>. The long-term solution to the emergency storagedeficiency continues to be additional tank storage.ES.2 Key Assumptions and MethodsChapter Overview:This Executive Summary presents anoverview of the 2007 Treated <strong>Water</strong> <strong>Master</strong><strong>Plan</strong>. It includes:• Introduction and Key Findings• Assumptions and Methods• Recommended Improvements andCosts• Comparison to 2002 TWMP• Capital Improvement ProgramHighlights:• The total cost of recommendedimprovements for the TWSA is $169M.Of this total, $79M is to correct existingdeficiencies and $90M is for growth.• The 2007 TWMP is consistent with the2002 TWMPTwo critical factors drive the Treated <strong>Water</strong> <strong>Master</strong> <strong>Plan</strong> -- demands and system performance criteria.Based on these factors, the Treated <strong>Water</strong> <strong>Master</strong> <strong>Plan</strong> evaluates deficiencies in the system under bothcurrent and future demand conditions. Alternatives to remedy deficiencies are evaluated based on costeffectiveness, operating impacts and flexibility. Preferred alternatives are then prioritized according tothe significance of the deficiency.A 2007 Treated <strong>Water</strong> <strong>Master</strong> <strong>Plan</strong> Update ES-1
Executive SummaryStudy Area and <strong>Plan</strong>ning HorizonThe planning area for the TWMP is the boundary established by the <strong>Contra</strong> <strong>Costa</strong> County Local AgencyFormation Commission. The <strong>District</strong> developed planning projections for its Sphere of Influence usinggeneral plan information for each of the cities within the study area and for <strong>Contra</strong> <strong>Costa</strong> County forunincorporated areas. For the Marsh Creek area, projections are based on the Marsh Creek Specific<strong>Plan</strong>.The City of Concord, acting as the local re-use authority (LRA), has embarked on a process to identify redevelopmentopportunities for the former Concord Naval Weapons Station (CNWS). The <strong>District</strong> planningprojections do not account for potential development at the CNWS. A supplement to this <strong>Master</strong> <strong>Plan</strong> willbe prepared, once conceptual land use alternatives have been selected for the CNWS, to assess potentialimpacts to Treated <strong>Water</strong> Service Area facilities. This analysis will be at a conceptual level, identifyingsupply, conveyance, treatment and transmission needs to serve the CNWS, but not evaluating det<strong>ai</strong>ledwater system infrastructure needed to serve potential development.Demand ProjectionsTreated <strong>Water</strong> Service Area demand projections are determined using a land-use based approachoriginally developed in the 1997 TWMP, and updated in the 2002 Future <strong>Water</strong> Supply Study DemandUpdate. The existing land use database, and associated demand, was updated to account fordevelopment that has occurred since 2002. Demand projections were developed for dry year conditions,to account for years when overall water use would be higher due to lower r<strong>ai</strong>nfall, but water use would beunaffected by drought cutbacks.Demand projections were developed for three periods: existing; an intermediate planning scenario; andbuildout. The buildout planning horizon is assumed to be 2030, except for the Marsh Creek Specific <strong>Plan</strong>area, which has an assumed buildout planning horizon of 2050. An intermediate demand scenario,selected as 2020, was chosen to assist in the phasing of recommended improvements and to provideinput into the <strong>District</strong>'s Ten-Year CIP.Annual normalized demand for existing conditions is about 45,000 acre-feet (40 mgd equivalent averaged<strong>ai</strong>ly demand). Buildout demand is projected to increase by about 20 percent to 54,000 acre-feet (48mgd equivalent average d<strong>ai</strong>ly demand). The increase in demand is split throughout the <strong>District</strong>’s servicearea: about 30 percent in subzone 11, serving central Concord, 30 percent in the Concord-Clayton Valleyarea and 30 percent in the Marsh Creek area. The rem<strong>ai</strong>ning 10 percent is treated water service to BayPoint, served from the Bollman WTP via the Baypoint pipeline.Climate change is likely to have an effect on water supply, demand and system planning. The <strong>District</strong> iscurrently working with other water agencies to analyze the effects of climate change on planning criteriaand design standards, and findings will be incorporated in the next TWMP. Possible areas that may beaffected include storage criteria, peaking factors, and demand projection methodology.System Performance CriteriaSystem performance criteria are used to evaluate the existing and future system, identify deficiencies,and to determine the size of new facilities. The criteria identify performance standards for pump stations,storage reservoirs and distribution pipeline facilities under maximum day, peak hour, or fireflow demandconditions. The criteria used in this update of the TWMP were adopted by the <strong>CCWD</strong> Board of Directors inJanuary 1990 and are the same as those used in the 2002 TWMP. This TWMP includes water qualitygoals based on water quality objectives adopted by the Board in September 2006. <strong>Water</strong> qualityimprovement projects not implemented since the 2002 TWMP have been incorporated in therecommended improvements.ES-2 2007 Treated <strong>Water</strong> <strong>Master</strong> <strong>Plan</strong> Update A
Executive SummaryIdentification of ImprovementsImprovements were identified after evaluating pumping and storage requirements, conducting hydraulicanalysis of distribution system transmission capabilities, and surveying <strong>District</strong> staff to identifyoperational constr<strong>ai</strong>nts. An analysis of the MPP operations also defined improvements that wouldaddress the needs for both planned future growth and the CNWS.Recommended improvements are prioritized based on the severity of the deficiency and costeffectiveness. Reliability, fire flow, water quality and need for new storage are considered whenprioritizing improvements. The reliability improvements recommended in the previous TWMP and in thisTWMP provide an equivalent level of reliability as storage. They were developed, in part, because of thewater quality impacts of new storage and allow cert<strong>ai</strong>n storage projects to be deferred. Phasing ofrecommended TWMP improvements has been developed based on the prioritization. The actualschedule for the implementation of TWMP recommendations will be determined through the annual CIPupdate process.ES.3 Recommended Improvements and CostsFigure ES-1 summarizes recommended capital improvements and phasing. Table ES-1 summarizes thecosts associated with these improvements. The following sections provide narratives describing theimprovements.Table ES-1Summary of Recommended Capital Improvements and CostsFacilitiesAdditional Capacity (1) Capital Costs ($M) (4)Existing Future Total Existing Future GrandTotalStorage (mg) 1.75 14.05 15.80 $ 6.1 $42.9 $49.0Pumping (mgd) 1.9 25.0 26.9 $ 1.4 $10.4 $11.8Pipelines (feet) 34,000 75,000 109,000 $10.3 $37.0 $47.3Reliability(2) (2) (2) $ 2.1 - $ 2.1ImprovementsSubtotal $19.9 $90.3 $110.2DeferredEmergencyStorage (mg) (3)18.55 - 18.55 $ 58.6 - $ 58.6TOTAL $78.5 $90.3 $168.8(1) Capacity listed under Existing is that needed to eliminate existing deficiencies. Capacity listedunder Future is that needed for future growth.(2) Includes generators, seismic valves and fault crossing connections.(3) Storage that has been deferred because backup generators have been installed to provideequivalent reliability during emergencies. Storage would be constructed as existing tanks areexpanded for growth or replaced.(4) 2007 dollars based on San Francisco ENR November 2006 CC I of 9124.Storage ImprovementsA total of 34 million gallons (mg) of additional storage is identified at an estimated cost of approximately$108M. Of this total, 20 mg is necessary to bring the existing system into compliance with Boardadopted emergency storage criteria, and would be funded through rates ($65M). The rem<strong>ai</strong>ning 14 MG isfor future growth, and would be funded through FRCs ($43M).A 2007 Treated <strong>Water</strong> <strong>Master</strong> <strong>Plan</strong> Update ES-3
Executive SummaryES.4 Comparison to 2002 Treated <strong>Water</strong> <strong>Master</strong> <strong>Plan</strong>Table ES-2 compares costs and capacity for improvements recommended in the 2007 TWMP with the2002 TWMP. The total cost for all improvements identified in the 2007 TWMP is $169M. This comparesto a total cost of improvements recommended in the 2002 TWMP (adjusted for inflation and constructedor demolished facilities) of $162M.Table ES-2Cost and Capacity Comparison with the2002 Treated <strong>Water</strong> <strong>Master</strong> <strong>Plan</strong> Cost ComparisonFacilities 2002TWMPCosts $M(2007 $)ConstructedSince 2002$M (2007 $)Adjusted2002TWMPCosts $M (1)(2007 $)2007TWMPCosts $M(2007 $)DifferenceStorage $111.43 $4.80 $106.63 $107.66 $1.03Pumping $11.45 - $11.45 $11.79 $0.34Pipelines $45.86 $3.57 $42.29 $47.30 $5.01Reliability Improvements (2) $6.77 $4.69 $2.08 $2.08 $0.00Total $175.51 $13.06 $162.45 $168.83 $6.38Capacity ComparisonFacilities 2002TWMPConstructedSince 2002Adjusted2002TWMP2007TWMPDifferenceStorage (mg) 34.71 1.5 33.21 34.4 1.19Pumping (mgd) 24.2 0 24.2 26.9 2.7Pipelines (feet) 111,000 11,000 100,000 109,000 9,000(1) Adjusted for facilities built or removed from service since 2002, and for inflation since 2002.(2) See Tables 6-6 through 6-8 for recommended reliability improvements. Current TWMP includes all projectsrecommended in 2002 but not yet implemented.Differences between the 2002 TWMP adjusted costs and 2007 TWMP cost are:• Increase of $1M in pumping costs, due to the inclusion of a capital project to rep<strong>ai</strong>r Pleasant Hill PS.The project allows full utilization of the existing 1.0 mg of storage at Pleasant Hill Reservoir insubzone 11. 1• Increase of $4M in pipeline costs, due to the inclusion of new projects in subzone 11 where existingresidential areas are less than the minimum standards in the Uniform Fire Code ($2M), and increasein pipeline diameter for the future subzone 51 transmission improvements ($2M). The improvementsrequired to meet minimum fire flow standards will be included in the Pipeline Replacement andRenewal Program.• Addition of $1M for new MPP Pressure Sust<strong>ai</strong>ning Valve Station. 2Otherwise, the current TWMP is consistent with the 2002 TWMP.ES.5 Capital Improvement ProgramProjects from the TWMP were prioritized for inclusion in the <strong>District</strong>’s Ten-Year CIP. The rem<strong>ai</strong>ning highpriority reliability improvements and fireflow improvements were given the highest priority. Other projectswere included based on the severity of the deficiency and cost effectiveness.1 The pump station cost difference in Table ES-2 is less than $1M due to minor sizing differences2 The cost for this facility is included in the pipelines item in Table ES-2.A 2007 Treated <strong>Water</strong> <strong>Master</strong> <strong>Plan</strong> Update ES-5
Executive SummaryProjects recommended for implementation during the 10-year CIP window (2009 – 2018) are shown inTable ES-3. The actual schedule for the implementation of TWMP recommendations will be determinedthrough the annual CIP update process.Table ES-3Ten-Year Capital Improvement Project Recommendations from TWMPProjectReliability Improvements• Fault Crossing near Treat Blvd• Seminary Pump Station EmergencyGeneratorPipeline Fireflow Improvements• Near Via Estrella• Near Lane Dr. and San Miguel Rd.• At Arthur Rd.Project Cost Funding Source Schedule$M (2007 $)$ 0.72 Treated <strong>Water</strong> Rates FY09$ 1.97 Treated <strong>Water</strong> Rates FY10 +(depends uponschedule ofRenewal andReplacementProgram)Pleasant Hill Pump Station Rehabilitation $ 1.43 Treated <strong>Water</strong> Rates FY13MPP Pressure Sust<strong>ai</strong>ning Valve Station $ 0.90 Treated <strong>Water</strong> Rates and FRC FY16Port Chicago Pipeline Phase II $8.30 Treated <strong>Water</strong> Rates and FRC FY16 – FY19Subzone 34 Storage Reservoir (0.75 mg) $ 4.66 Treated <strong>Water</strong> Rates and FRC FY17 – FY19Total $17.98ES-6 2007 Treated <strong>Water</strong> <strong>Master</strong> <strong>Plan</strong> Update A
Section 1Introduction1. Introduction2007 Treated <strong>Water</strong> <strong>Master</strong> <strong>Plan</strong> Update - Draft Report
Chapter 1Introduction1.1 Study PurposeThis <strong>Master</strong> <strong>Plan</strong> is an update of <strong>Contra</strong> <strong>Costa</strong> <strong>Water</strong><strong>District</strong>’s (<strong>District</strong>’s) 2002 Treated <strong>Water</strong> <strong>Master</strong> <strong>Plan</strong>(TWMP). The <strong>Master</strong> <strong>Plan</strong> identifies necessaryimprovements to the <strong>District</strong>’s Treated <strong>Water</strong> Service Area(TWSA) to meet current and future customer needs. This<strong>Master</strong> <strong>Plan</strong> update provides an up-to-date,comprehensive look at the TWSA, using recent planninginformation and the current distribution system hydraulicmodel to assess <strong>District</strong> needs.As part of the master plan, demand projections weredeveloped, and distribution system facilities evaluated toidentify improvements through buildout. Information fromother relevant <strong>District</strong> studies was integrated into the listof recommended capital improvements developed as partof the <strong>Master</strong> <strong>Plan</strong>.1.2 <strong>District</strong> Overview1.2.1 <strong>District</strong> Service AreaThe <strong>District</strong> serves untreated and treated water toapproximately 550,000 people throughout north, central,and east <strong>Contra</strong> <strong>Costa</strong> County. Formed as a specialdistrict in 1936 to provide water for irrigation and industry,the <strong>District</strong> is now one of the largest urban water districtsin California (<strong>CCWD</strong>, 2007a). Its customers include 5municipal agencies, 10 major industries, 36 smallerindustries, and approximately 50 agricultural users. TheChapter Overview:This chapter provides an overview of theTreated <strong>Water</strong> <strong>Master</strong> <strong>Plan</strong> Update. Itdescribes the:• Study Purpose• <strong>District</strong> Overview• Study Scope of Work• Study’s Relationship to Other <strong>District</strong>Studies• Report OrganizationHighlights:<strong>Contra</strong> <strong>Costa</strong> <strong>Water</strong> <strong>District</strong>’s mission is toprovide a reliable supply of high qualitywater at the lowest cost possible, in anenvironmentally responsible manner. ThisTreated <strong>Water</strong> <strong>Master</strong> <strong>Plan</strong> Update identifiesdistribution system capital projectsnecessary to achieve this mission.The Treated <strong>Water</strong> <strong>Master</strong> <strong>Plan</strong> integratesinformation from other strategic <strong>District</strong>studies, including the Future <strong>Water</strong> Supply<strong>Plan</strong> (2002), Seismic and ReliabilityImprovement Project (1997) and Renewaland Replacement Study (2005).<strong>District</strong> operates untreated water distribution and storage facilities, water treatment plants, and treatedwater storage and distribution facilities.The <strong>District</strong> provides wholesale treated water to the city of Antioch, the Golden State <strong>Water</strong> Company inBay Point, Diablo <strong>Water</strong> <strong>District</strong> (from jointly owned treatment plant), and the city of Brentwood. 1 The<strong>District</strong> provides untreated water to Diablo <strong>Water</strong> <strong>District</strong> (Oakley), the cities of Antioch, Martinez andPittsburg, and the Golden State <strong>Water</strong> Company in Bay Point, as well as industrial and irrigationcustomers. These customers are outside of the <strong>District</strong>'s TWSA and are not addressed in this <strong>Master</strong><strong>Plan</strong>.1.2.2 Study AreaThe <strong>District</strong>’s treated water service area, the subject of this report, encompasses the cities andcommunities of Clayton, Clyde, Concord, Pacheco and Port <strong>Costa</strong>, and portions of Martinez, Pleasant Hill,and Walnut Creek. The population within the treated water service area is approximately 265,000.Treated water is provided from the <strong>District</strong>’s Ralph D. Bollman <strong>Water</strong> Treatment <strong>Plan</strong>t (Bollman WTP) andsupplemented from the Randall-Bold <strong>Water</strong> Treatment <strong>Plan</strong>t in Oakley, through the Multi-Purpose1 Golden State <strong>Water</strong> Company of Bay Point receives treated water via a connection to the TWSA from the Bollman WTPfacility. Their demand has been accounted for in the TWSA analysis. Antioch, DWD, and Brentwood receive their waterfrom RBWTP and their capacity allocations in that plant have been accounted for in the TWMP.A 2007 Treated <strong>Water</strong> <strong>Master</strong> <strong>Plan</strong> Update 1-1
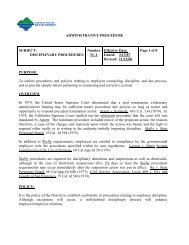
Chapter 1IntroductionPipeline, constructed in 2003. The areas served by the <strong>District</strong> and the treated water study areaboundary are shown on Figure 1-1. The <strong>Master</strong> <strong>Plan</strong> study area includes all of the TWSA except Port<strong>Costa</strong>, which has been addressed separately by the <strong>District</strong>.1.2.3 <strong>District</strong> Mission and GoalsThe mission of the <strong>District</strong> is to strategically provide a reliable supply of high quality water at the lowestcost possible, in an environmentally responsible manner. The mission can be fulfilled through theaccomplishment of the following <strong>District</strong> goals:• Ensure that the <strong>District</strong> delivers high quality and reliable water supplies for current and future needs.• Provide excellent customer service and high levels of customer satisfaction.• <strong>Plan</strong>, design and construct high quality facilities consistent with <strong>District</strong> needs, and industrystandards.• Effectively manage the <strong>District</strong>’s financial resources in conformance with Board policies.• Ensure that all <strong>District</strong> activities surpass all applicable laws and regulations.• Operate, m<strong>ai</strong>nt<strong>ai</strong>n and protect <strong>District</strong> facilities in a safe and cost-effective manner.• Provide leadership in water aff<strong>ai</strong>rs.• Actively enhance effective community relations and public information.• Create and m<strong>ai</strong>nt<strong>ai</strong>n a work environment that fosters teamwork and individual excellence.• Manage water and the <strong>District</strong>’s natural and recreation resources, and protect public safety andwater quality.The Treated <strong>Water</strong> <strong>Master</strong> <strong>Plan</strong> identifies the capital projects necessary to ensure adequate flows andpressures in the distribution system for existing and future customers, and to reliably supply water in anemergency.1.3 Scope of ServicesThe <strong>District</strong> ret<strong>ai</strong>ned Camp Dresser & McKee Inc. (CDM) to prepare the TWMP. The scope of workincluded the following major elements:• Develop <strong>Water</strong> Demand Projections. The <strong>District</strong> updated land use and water demand projectionsthrough buildout, anticipated to be about 2030. CDM used the <strong>District</strong>’s land use coverage, and unitwater use factors to establish locations of existing and future water use. Unit water use factors arebased on historical water use information by customer class.• Calibrate Hydraulic Model. CDM calibrated the existing hydraulic model of the <strong>District</strong> system,comparing model results with SCADA data from July 2006. The calibration focused on subzone 11,the largest subzone in the TWSA, and the subzone with the largest operational changes, with thetemporary re-zoning of the Port Chicago Phase 1 Pipeline from subzone 11 to subzone 21, to deliverwater from the Multi-Purpose Pipeline directly to subzone 21. The re-zoning has reduced subzone 11hydraulic capacity and increased discharge pressures at the Bollman High Lift Pump Station.• Identify <strong>Water</strong> System Improvements. CDM, in consultation with the <strong>District</strong>, evaluated the existingdistribution system hydraulic conditions ag<strong>ai</strong>nst system performance criteria established by <strong>CCWD</strong>and approved by the Board of Directors in January 1990 to identify deficiencies for existing andbuildout conditions. CDM then identified improvements needed to correct the identified distributionsystem hydraulic deficiencies.• Develop Long Range List of Improvements. CDM, in consultation with the <strong>District</strong>, prepared a list ofstaged, recommended capital improvements, including planning-level cost estimates, and additional1-2 2007 Treated <strong>Water</strong> <strong>Master</strong> <strong>Plan</strong> Update A
LES$NAVEWANLO OP D RHERDLYN RDCONTRA COSTA WATER DISTRICTBeniciaSAN JOAQUIN RIVERMALLARD SLOUGHRYER§¨¦ 680 ISLANDROEISLANDHONKER BAYSUISUN BAYBayPointClydeCONTRACOSTACANALCALMALLARDCITIESRESERVOIRWTP$T§¨¦ 680$$BOLLM ANWTPMARTINEZWERESERVOIRL£¤E242 CCC WD"PleasantCLAYTONC ODCANALHillL UTABANDONEDGRAYSON RDOConcord§¨¦ 680 ClaytonYGNACIO LOOPGEARY RDWalnutCreek£¤24§¨¦ 680DanvilleSan Ramon0 0.5 1 2 3 4PACHECO SLOUGHPort<strong>Costa</strong>CARQUINEZ STRAITCHIPPSISLAND$VAN SICKLEISLANDBROWNSISLANDCollinsvilleWINTERISLANDSHERMANISLANDKIMBALLISLAND$WEST ISLANDSHERMANISLAND&$DECKERISLANDPP1""""""ANTIOC H SERVICECENTER (ASC) PP4PP3PP2£¤4CC WDTRANSFERFA CILITYJERSEYISLANDBRADFORDISLANDROCKSLOUGHINTAKELITTLE FRANKSTRACTBETHELISLANDTRASHRACKWEBBTRACTSACRAMENTO RIVERKHerculesOA§¨¦ 780 £¤ 160SAN PABLO AVEKINNEY BLVDA S TOrinda£¤4LafayetteLAFAYETTERESERVOIRMARTINEZWTPMartinezMoraga£¤4PITTSBURGWTPPittsburgCONTRA LOMARESERVOIRANTIOCHWTPANTIOCHMUN ICIPALRESERVOIRAntioch£¤4LOS VAQUEROSPIPELINETRANSFER PIPELINELOS VAQUEROSRESERVOIROakleyRAN DAL LBOLDWTPBrentwoodKLEYWTPFRANKSTRACTCR O CKET T BLVDWATERFRONT RDW ILLOW PASS RDCANAL RDRAILROAD AVEAND RDBATESAVESOLANO WAYFRANKLIN CANYO N RDPACHECO BLVDHOLLANDTRACTBUCHANANRDOAKLEY RDSTPUTN AMLAUREL RDSOMER SVILLE RDILE Y RDC ENTER AVBAALHAMBRA AVEDPASS RDVEALETRACTDELTA RDNE ROLY RCLAYTON RDR DLELANDEAST LE LAND RDPO RT C HICAGO HWYARNOLD DRLIVE OAK AVEMUIR RDJAMES DO NLON BLVDWEST STPALMTRACTBYRON HWYDiscovery BayOLD RIVER PIPELINEBYRONTRACTORWOODTRACTWALNUT BLVDSELLERS AVELONE TREE WAYKI R KERCOWELL RDCONCORD BLV DSA N MIG UEL RDMONUMENT BLVDTAYL OR BLVFA IRVIEW AVEBOYD RDPORT CHICAGO HWYWATERFRONT RDPORT CHICAGO HWYRIVERVIEW DRWILLOW PASS RDCUMMINGS SKWAYWILLOW RDTAYLORRDEVORARDPIPER RDRIV ERVIE W DRJERSEY ISLAND RDOLIVERA RDDALLAS RANC H RDOHARA AVEGALINDO STMARK ET STDIAMOND BLVDOAKCONTRA COSTA BLVDGROVE RDGREGORY LNMI NERT RDTREAT BLVDCHESTNUT STMINE RDEM PIROAK STC A N AL RDAVILA RDALHAMBRA AVER DSTO NEJOHN MUIR PKWYBAYBERRY AVEWILBUR AVESOMERSVILLE RDCENTURY BLVDR DKINNEY BLVDIMHOFF DRSANDMOUND BLVDBETHEL ISLAND R DMAINSTFRA NKLIN CANYON RDBAI LEY RDWILLOW PASS RDPA CHECO BLVDDUTRA RDEAST CYPRESS RDCHRIST IE RDCYPRESSSOMERSVILLE RDSS RDKIRK ER PARD BLVDCLAYTON R DALHAMBRA VALLEY RDDELTA RDPEREIRA STBRENTWOOD BLVDOHARA AVELO NE T REE WAYDUARTEHAMPTON RDSELLERS AVEORWOOD ROADORWOOD RDBALFOUR RDEBALFO UR ROADALBERTA WAYOAK PARK BLVDBRIONES RDBEAR CREEK RDOLD SAN PABL O DAM RDC HAD BOUR N E ROADNIMITZ WAYBALFOUR RDOAK RDSAN PABLOBIXLER RDW AL NUT AVEDRDAM R DABRENTWOOD BLVDPARKSIDESELLERS AVEPAY NE AVEIONES VB RLLEY RDCAST LESEAVIE W TRLMARSH CREEK RDMARSH CREEK RDROCK RDW ALNUTBLVDEL TOYO N ALS PA RKMARS H CR EEKDRRDOLD RIVER P UMP STATIONNOR TH GATE ROADVASCO RDCAMINO DIABLOBALFOUR RDDEEREUREKA AVESPYG LASS DRIVELAF AYETTEVA LLEY RDMARIPOSARIDGENIMITZ WYPINE CREEK RDMINER RDiron horse TRLCANON DRIVESUNSET DRBAILEYFA LCON WAYJO H NMUIR PKWYBROWN STONERDCHELSEADRALHAMBRA VALLEY RDMICHAEL WYDU ARTECONCORD BLVDORWOOD ROADMI TCHELL DRBEAR CREE K R DBYRON HWYM ARSH CREEK R DNGATERDCAMINO DIABLOSEAVIEW TRLBIXLER RDWALNUT BLVDMARSH CREEK RDDEER VALLEY RDMA RSH CREEK RDGRIZZLY PEAK BLVDRDMA RSH CREE K RDN GATER DGBYRON HWYRDCLIFTONCOURTFOREBAYHOLEY RDVASC O R DARMSTRONWA L NUT B LVDLEO N WA YSAINT MARYS RDS U MMITEASY STCASTLE CREST RDOAKMONT DRCAMINO DIABLOSUM MIT RDRHEEM BLVDDONALD DRVALLEY HILL DRDIABLORDPINEHURST ROADMANZANITA DRLUCAS DRCAMINO DIABLOBILTMORE DRTICE CREEK DRVIA DIABLOAUGUSTADRCLIFTONCT RDKUSS RDBLACK HA WK RDMO NTA IR DRBRUNS RDNORTH BRUNS WAYCAMINO AMIGOAUGUSTA DRBYRON HWYARMST R ONG RDRDPINEH URST DRIVEVA S CO RDALAMEDA COUNTYCONTRA COSTA COUNTYM ORGAN TERRITORY R DFINLEYBLACKHAWK RDV A SCO R DJOHNSTON RDBOL LINGER CANYO N RDRDHIGHLANDVAS CO RDCAMINO TASSAJARALegendDERBYDRConcord U.S. Naval Weapons Station<strong>CCWD</strong> Treated <strong>Water</strong> Service Area<strong>Contra</strong> <strong>Costa</strong> <strong>Water</strong> <strong>District</strong> BoundaryUntreated <strong>Water</strong> Conveyance FacilitiesMilesFIGURE 1-1TREATED WATERSERVICE AREA MAP
Chapter 1Introductioninformation for establishing connection fees for future customers. The <strong>District</strong> then evaluatedrecommended improvements and timing in the context of its Capital Improvement Program planning.• Prepare <strong>Master</strong> <strong>Plan</strong> Report. This master plan report was prepared to summarize and document thework developed during the master planning effort.1.4 Relationship to Other <strong>District</strong> StudiesThe <strong>District</strong> has completed several other planning studies that identify facility needs for both theuntreated and treated water service areas. Information from these studies has been utilized in thisTWMP where appropriate. Table 1-1 summarizes how the TWMP relates to these studies. A briefsummary of each study is also provided in this section.Future <strong>Water</strong> Supply Study(2002)Table 1-1Other <strong>District</strong> Studies and How They Are Used in theTreated <strong>Water</strong> Service Area <strong>Master</strong> <strong>Plan</strong> UpdateStudy Purpose How UsedSeismic and ReliabilityImprovement Project (1997)Treated <strong>Water</strong> Renewal andReplacement Study Update(2005)Identifies potential supply andwater conservation options tomeet existing and future waterdemandsDevelops capital improvementsto provide reliable serviceduring emergencies, such asearthquakes and urbanwildland fires.Assesses cost of renewal vs.replacement, and prioritizesprojects for funding through the<strong>District</strong>’s ongoing Treated<strong>Water</strong> Facilities ImprovementProgram and Treated <strong>Water</strong>Reservoir RehabilitationProgramDemand projections developedin Future <strong>Water</strong> Supply Studywere used as a starting point inthe TWMPDistribution system capitalprojects recommended from thisstudy and not yet implementedare incorporated into the TWMPProjects identified in the TWMPat facilities with renewal/replacement needs willincorporate elements to addressboth capital improvement andrenewal/replacement needs.1.4.1 Future <strong>Water</strong> Supply Study<strong>CCWD</strong> updated the Future <strong>Water</strong> Supply Study (FWSS) in 2002 and is currently preparing another updateto identify alternatives to offer customers a high quality, reliable water supply for the next 50 years. TheFWSS examined water demand, conservation, and existing and potential supplies for a range of servicearea alternatives. The <strong>District</strong>'s Board of Directors adopted the initial FWSS in August 1996, including thePreferred Alternative and Implementation <strong>Plan</strong>. The Preferred Alternative would provide drought reliabilityand operational flexibility in the short-term while m<strong>ai</strong>nt<strong>ai</strong>ning long-term supply targets to meet projecteddemands of the year 2040. The <strong>District</strong> updated the FWSS demands in 2002. The updated demands forthe treated water service area, along with more recent land use changes based on new planninginformation, were used as a starting point for this study.1.4.2 Seismic and Reliability Improvement ProjectIn 1997, the <strong>District</strong> completed the Seismic and Reliability Improvement Project (SRIP). This studyidentified various improvements to the <strong>District</strong>’s untreated and treated water systems to provide reliableemergency service following extreme stress events such as fire following an earthquake, urban wildlandfire, industrial fire etc. Recommendations for both the untreated and treated water systems weredeveloped to offer customers cost-effective improvements that allow the <strong>District</strong> to reliably meet futuredemands and significantly improve the ability to respond to post-earthquake fire and domestic serviceA 2007 Treated <strong>Water</strong> <strong>Master</strong> <strong>Plan</strong> Update 1-3
Chapter 1Introductionneeds. The treated water seismic and reliability improvements are presented in Volume 3 of the threevolumereport. Recommendations from the SRIP for the TWSA have been incorporated into this <strong>Master</strong><strong>Plan</strong>.1.4.3 Treated <strong>Water</strong> Renewal/Replacement StudyThe Treated <strong>Water</strong> Renewal/Replacement Study was updated in 2005 and reviewed the evaluation andprioritization criteria used by the <strong>District</strong> in the 1996 and 1998 Treated <strong>Water</strong> Renewal and ReplacementStudies. Data was obt<strong>ai</strong>ned from a combination of site visits, interviews with <strong>District</strong> staff, and review ofexisting drawings and was used to identify specific capital improvement needs. Renewal costs werecompared with the cost of replacement and projects were prioritized for inclusion in the <strong>District</strong>’s Treated<strong>Water</strong> Facilities Improvements Program and Treated <strong>Water</strong> Reservoir Rehabilitation Program within the<strong>District</strong>’s Capital Improvement Program. Projects identified in the TWMP at facilities withrenewal/replacement needs will incorporate elements to address both capital improvement andrenewal/replacement needs.1.5 Report OrganizationThis report is organized into an Executive Summary, six chapters, and appendices, each of which is brieflydescribed in Table 1-2.Table 1-22007 Treated <strong>Water</strong> <strong>Master</strong> <strong>Plan</strong> Update Report OrganizationChapter/TitleDescriptionExecutive SummaryProvides report summary.1 – Introduction Provides an overview of study purpose and the <strong>Master</strong><strong>Plan</strong>’s relation to other <strong>District</strong> studies.2 – Existing <strong>Water</strong> System Provides an overview of existing facilities, includingsupply, treatment and distribution facilities to serve waterto Treated <strong>Water</strong> Service Area customers.3 – Existing and Projected <strong>Water</strong> Demands Describes demand projections used in the TWMP.4 – System Performance Criteria Describes system performance criteria used for theTWMP.5 – System Analysis Presents the analysis of the system and identifiesexisting and future deficiencies.6 – Recommended System Improvements and Costs Describes needed improvements, including the basis ofimprovements and recommended improvements,phasing and costs.AppendicesAppendix A – Demand Projection MethodologyAppendix B – Seismic Reliability CriteriaAppendix C – Model CalibrationAppendix D – Multi-Purpose Pipeline Long-termAlternatives EvaluationAppendix E – Fire Flow Analysis ResultsAppendix F – Cost Estimation CriteriaDescribes the det<strong>ai</strong>ls of the demand projectionmethodology and how demands were allocated to thehydraulic model.Seismic reliability criteria, as presented in Volume 3 ofthe Seismic and Reliability Improvement Project.Describes model calibration to compare model resultswith actual operating conditions.Presents the analysis of long-term alternatives for Multi-Purpose Pipeline service to the TWSA.Presents det<strong>ai</strong>led tabular results of the fire flowevaluation.Provides basis of costs developed in this TWMP.1-4 2007 Treated <strong>Water</strong> <strong>Master</strong> <strong>Plan</strong> Update A
Chapter 1Introduction1.6 AcronymsThe following abbreviations and acronyms are used in this report.ACAsbestos-cementAFAcre FeetCCIConstruction Cost Index<strong>CCWD</strong> <strong>Contra</strong> <strong>Costa</strong> <strong>Water</strong> <strong>District</strong>CDM Camp Dresser & McKee Inc.CIPCapital Improvement ProgramCNWS Concord Naval Weapons StationCPA1 Conservation Program Alternative 1CVPCentral Valley Project<strong>District</strong> <strong>Contra</strong> <strong>Costa</strong> <strong>Water</strong> <strong>District</strong>DWD Diablo <strong>Water</strong> <strong>District</strong>EBMUD East Bay Municipal Utility <strong>District</strong>ECCID East <strong>Contra</strong> <strong>Costa</strong> Irrigation <strong>District</strong>ENREngineering News RecordEPSExtended Period SimulationESPEngineering Standard PracticeftfeetFRCFacility Reserve ChargeFWSS Future <strong>Water</strong> Supply StudyFYFiscal YearGISGeographic Information Systemgpmgallons per minuteHPhorsepowerkWkilowattkWhkilowatt-hourLRALocal Re-use Authoritymgmillion gallonsmg/l milligrams per litermgdmillion gallons per dayMPP Multi-Purpose PipelinePRVpressure reducing valvePSpump stationpsipounds per square inchPVCpolyvinyl chlorideRBWTP Randall Bold <strong>Water</strong> Treatment <strong>Plan</strong>tSCADA Supervisory Control and Data AcquisitionSRIP Seismic and Reliability Improvement ProjectSWQ Safety and <strong>Water</strong> Quality ProjectTWMP Treated <strong>Water</strong> <strong>Master</strong> <strong>Plan</strong>TWSA Treated <strong>Water</strong> Service AreaWTP <strong>Water</strong> Treatment <strong>Plan</strong>t$M million dollarsA 2007 Treated <strong>Water</strong> <strong>Master</strong> <strong>Plan</strong> Update 1-5
Section 2Existing <strong>Water</strong> System2. Existing <strong>Water</strong> System2007 Treated <strong>Water</strong> <strong>Master</strong> <strong>Plan</strong> Update - Draft Report
Chapter 2Existing <strong>Water</strong> System2.1 Untreated <strong>Water</strong> SupplyThe <strong>District</strong> is almost entirely dependent on theSacramento-San Joaquin River Delta (Delta) for itsuntreated water supply. The <strong>District</strong>'s primary source isthe United States Bureau of Reclamation's (USBR)Central Valley Project (CVP). CVP water consists ofunregulated flows and regulated flows from storagereleases from Shasta, Folsom, and Cl<strong>ai</strong>r Englereservoirs into the Sacramento River. The 2005 Long-Term Renewal <strong>Contra</strong>ct with USBR provides for theoperation of the Los Vaqueros Project, and for amaximum delivery of 195,000 acre-feet per year fromthe CVP, with a reduction in deliveries during watershortages including regulatory restricted and droughtyears. The Long-Term Renewal <strong>Contra</strong>ct was executedin May 2005 and is consistent with the federal CentralValley Project Improvement Act of 1992, whichmandated changes in the management of the CVP,primarily <strong>ai</strong>med at protecting, restoring and enhancingfish and wildlife.Figure 1-1 shows the major untreated supply facilitiesserving the <strong>District</strong>. The primary conveyance facility forthe <strong>District</strong>’s untreated water supply is the <strong>Contra</strong><strong>Costa</strong> Canal, which carries water from Rock Slough andChapter Overview:This chapter provides an overview of the<strong>District</strong>, its supplies and treated waterfacilities. It includes:• Untreated <strong>Water</strong> Supply• Treated <strong>Water</strong> Supply• Distribution System• Facilities Added Since 2002 <strong>Master</strong> <strong>Plan</strong>Highlights:• The <strong>District</strong> serves untreated and treatedwater supply from the Sacramento-SanJoaquin Delta• The Treated <strong>Water</strong> Service Area conveyswater from the Bollman WTP and Randall-Bold WTP and Multi-Purpose Pipelinethrough distribution system facilities,including:- 780 miles of pipeline- 41 storage reservoirs- 31 pump stationsOld River intakes or Los Vaqueros Reservoir for deliveries throughout the <strong>District</strong>'s service area. Thecanal is approximately 48 miles long, with the major deliveries within the first 19 miles, from Rock Sloughto the Shortcut Pipeline near the Bollman <strong>Water</strong> Treatment <strong>Plan</strong>t. Four pumping plants, within the first7.1 miles of the canal, lift water 124 feet above sea level so that water can be conveyed by gravity for therem<strong>ai</strong>ning length of the canal. The Shortcut Pipeline conveys water from Milepost 25.7 of the canal tothe Bollman <strong>Water</strong> Treatment <strong>Plan</strong>t and to the City of Martinez and oil refineries as well as some smallerindustrial customers.In addition to its CVP supply, the <strong>District</strong> has water rights at Mallard Slough for a maximum diversion ofDelta water of up to 26,700 acre-feet per year. Diversions from Mallard Slough are unreliable due tofrequently poor water quality in the San Joaquin River at this point of diversion. The <strong>District</strong> replaced theMallard Slough Pump Station in 2002 as part of the Seismic and Reliability Improvements Project (SRIP).The <strong>District</strong> also constructed an additional pipeline to transport water directly into the <strong>Contra</strong> <strong>Costa</strong> Canalfrom Mallard Slough. Most of the original pipeline was abandoned in place, but the western part of thepipeline is still in use and supplies untreated water to a limited number of customers.The <strong>District</strong> has obt<strong>ai</strong>ned its water supply from the Delta since 1940. Delta water is subject to largevariations in salinity and mineral concentrations. This water supply has also made the <strong>District</strong> and itscustomers susceptible to man-made or natural sources that could degrade Delta water quality.Degradation in water quality is objectionable to <strong>District</strong> customers, costly to residential and industrialusers, and increases public health risk. In 1988, the voter-constituents of the <strong>District</strong> approved theissuance of bonds to finance the Los Vaqueros Project, to construct a 100,000 acre-foot reservoir, newintake at Old River that operates in conjunction with the Rock Slough diversion facilities, pipeline andpump station conveyance facilities, and other facilities. The Los Vaqueros Project improves the quality ofwater supplied to <strong>District</strong> customers, and minimizes seasonal water quality changes. It also improves theA 2007 Treated <strong>Water</strong> <strong>Master</strong> <strong>Plan</strong> Update 2-1
Chapter 2Existing <strong>Water</strong> Systemreliability of the emergency water supply av<strong>ai</strong>lable to the <strong>District</strong>. Diversion from the Old River intakebegan in the summer of 1997, and Los Vaqueros was first completely filled in January 1999.Additionally, the <strong>District</strong> has a contract with the East <strong>Contra</strong> <strong>Costa</strong> Irrigation <strong>District</strong> (ECCID) for untreatedwater that can be used in areas in East <strong>Contra</strong> <strong>Costa</strong> County within the boundaries of both the <strong>District</strong>and ECCID, and for additional drought supplies av<strong>ai</strong>lable through groundwater exchange. The <strong>District</strong> hasan ongoing program to obt<strong>ai</strong>n additional sources for use during drought and to provide for futuredemands.An intertie connecting the Los Vaqueros Pipeline with East Bay Municipal Utility <strong>District</strong>’s (EBMUD)Mokelumne Aqueducts in Brentwood is currently under construction and will enable the wheeling of3,200 AF annually of the <strong>District</strong>’s CVP water via the Freeport project and the Mokelumne Aqueducts. Theintertie will also function as a backup connection between EBMUD and the <strong>District</strong>, enabling the districtsto exchange water resources in an emergency or during planned outages. The intertie can be operated ineither direction, i.e. from <strong>CCWD</strong> to EBMUD or from EBMUD to <strong>CCWD</strong>.2.2 Treated <strong>Water</strong> SupplyThe TWSA is primarily supplied from the Ralph D. Bollman <strong>Water</strong> Treatment <strong>Plan</strong>t (Bollman WTP), locatedin north Concord, adjacent to Mallard Reservoir, as shown on Figure 1-1. The Bollman WTP, under specialagreement, also provides treated water to Bay Point. The Bollman WTP, which began operation in 1968,uses a conventional treatment process. The WTP has a rated capacity of 75 million gallons per day, anduses flocculation, sedimentation, filtration, ozonation and chloramines to produce high quality drinkingwater for the TWSA. Since its initial construction, there have been several major modifications andupgrades to the plant. These modifications include: vertical shaft flocculators, construction of anadditional sedimentation basin, rehabilitation of filters including replacement of the anthracite filtermedia by granular activated carbon, and the Safety and <strong>Water</strong> Quality Project (SWQ). The SWQ projectwas completed in 1997 and included conversion of gaseous chlorine to ozone as the primarydisinfectant, conversion from gaseous chlorine to sodium hypochlorite and the addition of aqueousammonia for making chloramines as the secondary disinfectant.The Randall-Bold <strong>Water</strong> Treatment <strong>Plan</strong>t in Oakley, supplements the TWSA, through the Multi-PurposePipeline (MPP), constructed in 2003. The Randall-Bold <strong>Water</strong> Treatment <strong>Plan</strong>t, jointly owned by the<strong>District</strong> and Diablo <strong>Water</strong> <strong>District</strong> (DWD), has a current capacity of 40 mgd, with future expansioncapabilities up to 80 mgd. The WTP includes conventional treatment processes as the result of a recentlycompleted project to add sedimentation basins and utilizes intermediate ozonation and chloraminationprocesses to provide high quality drinking water to customers. The plant provides treated water to DWD,the city of Brentwood and the city of Antioch, and to the TWSA for new growth in central <strong>Contra</strong> <strong>Costa</strong>County. The <strong>District</strong>'s current share of the Randall-Bold <strong>Water</strong> Treatment <strong>Plan</strong>t is 25 mgd.The MPP was completed in 2003 to deliver up to 25 mgd to the <strong>District</strong>’s TWSA. The pipeline is calledmulti-purpose because it can serve treated water to the treated water service area, or to the Randall-BoldWTP clearwell or <strong>Contra</strong> <strong>Costa</strong> Canal, in the event of a WTP or canal outage or emergency. In the event ofa regional disaster, such as a large earthquake, the pipeline is also designed to connect up to one of the<strong>District</strong>'s untreated water sources to provide water for fire fighting.The MPP was originally designed for service to subzone 11, with a connection to the subzone 11 PortChicago Phase 1 Pipeline, near the Bollman WTP. Hydraulic concerns associated with lower flows wereidentified during start-up testing in 2003 and required the <strong>District</strong> to temporarily re-zone the MPP tosubzone 21. To accomplish this, the Port Chicago Phase 1 Pipeline, which was intended to providetransmission capacity from the Bollman WTP to subzone 11, was re-zoned to subzone 21 to convey MPPwater directly to subzone 21. Currently, this configuration is envisioned to be an interim operation, sincethe Port Chicago Phase 1 Pipeline will eventually be needed to provide transmission capacity in subzone2-2 2007 Treated <strong>Water</strong> <strong>Master</strong> <strong>Plan</strong> Update A
Chapter 2Existing <strong>Water</strong> System11. In 2005, the <strong>District</strong> completed a preliminary assessment of long-term configuration options for theMPP. Building on this work, this TWMP further evaluated alternatives for the long-term configuration ofthe MPP, and includes capital facilities to address the long-term integration of MPP into the TWSA. Thefuture development of the Concord Naval Weapons Station (CNWS) would be a significant factor in howthe <strong>District</strong> integrates the MPP into the TWSA for the long term. Therefore this TWMP identified aproposed alternative should the CNWS development proceed.2.3 Distribution SystemThe TWSA distribution system includes pipelines, storage reservoirs, and pump stations to m<strong>ai</strong>nt<strong>ai</strong>npressure and distribute water to customers. The system includes 780 miles of pipeline, and 40 activestorage reservoirs, with a total treated water storage capacity of approximately 72 million gallons (mg).Thirty-one pump stations are used to distribute water from the water treatment plants, and to higherelevation areas within the distribution system. There are approximately 61,000 active serviceconnections to the treated water system (<strong>CCWD</strong>, 2007b).Customer service elevations within the TWSA range from sea level to approximately 1,000 feet. The TWSAis broken up into eight pressure zones, established based on customer elevation ranges served. Eachpressure zone has one or more subzones that serve customers within that elevation range. Table 2-1summarizes statistics for each of the pressure zones, including customer service elevations, reservoiroverflow elevations and static service pressures.Table 2-1Existing Treated <strong>Water</strong> Pressure Zones and SubzonesReservoirPressureZone Subzone General LocationCustomer ServiceElevations (ft)OverflowElevation (ft)Static Service Pressures(psi)111 Concord 0 - 110 220 48 - 9514 Port <strong>Costa</strong> 0 - 110 220 48 - 9521 Concord 110 - 215 324 47 - 9322 Walnut Creek 110 - 215 325 48 - 93223 Pleasant Hill 110 - 215 320 46 - 9124 Concord 110 - 180 (1) (1)25 Martinez 110 - 215 320 46 - 9131 Concord 215 - 325 440 50 - 98332 Pleasant Hill 215 - 325 440 50 - 9833 Martinez 215 - 325 (1) (1)34 Walnut Creek 215 - 325 440 50 - 9841 Concord, Clayton 325 - 420 534 49 - 91442 Martinez 325 - 460 (1) (1)43 Walnut Creek 325 - 420 534 49 - 9144 Concord 325 - 420 535 50 - 915 51 Concord, Clayton 420 - 600 685 37 - 11561 Clayton 600 - 760 873 49 - 118663 Clayton 600 - 760 873 49 - 11864 Clayton 600 - 760 (1) (1)69 Marsh Creek 600 - 760 (2) (2)71 Marsh Creek 760 - 880 990 48 - 100772 Clayton 760 - 880 990 48 - 10073 Clayton 760 - 880 990 48 - 10079 Marsh Creek 760 - 880 990 48 - 100882 Clayton 880 - 1000 1080 35 - 8783 Clayton 880 - 1000 (1) (1)Notes:(1) Hydropneumatic system(2) Pressure regulated systemA 2007 Treated <strong>Water</strong> <strong>Master</strong> <strong>Plan</strong> Update 2-3
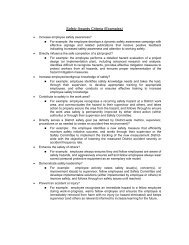
Chapter 2Existing <strong>Water</strong> SystemFigure 2-1 shows the locations of the <strong>District</strong>’s eight pressure zones, the 25 subzones, and key existingpump stations and storage reservoirs. Figure 2-2 is a schematic of treated water system facilities. Theschematic shows existing facilities, with solid lines, and planned future facilities identified in previousstudies and in this study, with dashed lines. As Figure 2-1 shows, subzone 11 is the largest within thesystem and serves water from the Bollman WTP to central Concord. Several pump stations located insubzone 11 supply the rem<strong>ai</strong>ning higher elevation subzones in three areas or “cascades”:• The Concord-Clayton Valley and Marsh Creek area, to the southeast (subzones 21, 31, 41, 51, 61,71, 79, 69 and smaller subzones served from these);• The Shell Ridge and Northgate areas of Walnut Creek, to the south (subzones 22, 34, 35 and 43);and• Portions of Pleasant Hill and Martinez to the west (subzones 23, 25, 32, 33, 42).The community of Port <strong>Costa</strong> is within the TWSA but is not directly connected to the distribution system.Port <strong>Costa</strong> receives water from the City of Martinez. To provide a treated water supply to Port <strong>Costa</strong>, the<strong>District</strong> has an agreement with the City of Martinez to supply Martinez with a quantity of watercomparable to that required for the Port <strong>Costa</strong> community. The <strong>Master</strong> <strong>Plan</strong> accounts for water suppliedto Port <strong>Costa</strong> through the distribution system via the City of Martinez, but does not include an assessmentof facilities in the Port <strong>Costa</strong> distribution system.2.3.1 PipelinesThe TWSA includes 780 miles of transmission and distribution pipelines, ranging from 2-inch diameter to66-inch diameter. Over two-thirds of the pipelines are asbestos-cement. The rem<strong>ai</strong>ning pipelines arepolyvinyl chloride, cement mortar lined and coated steel pipe, steel, ductile and cast iron. The distributionnetwork of pipelines is fed by the Bollman High Lift Pump Station, which supplies water from the BollmanWTP to subzone 11, and the MPP PS, which supplies water from the Randall-Bold WTP to subzone 11 orsubzone 21. The majority of the large diameter pipelines are within subzone 11, to distribute waterthroughout the subzone and to pump stations to feed higher subzones.2.3.2 Storage ReservoirsThe <strong>District</strong> has a total of 41 active treated waterreservoirs, with a total storage capacity of approximately72 million gallons. Twenty nine are concrete reservoirs(above and below ground) and twelve are above-groundsteel tanks. All <strong>District</strong> subzones, excepthydropneumatic subzones, include storage reservoirs tobalance the difference between supply and peakdemand, and to provide supply for fires or otheremergencies.Table 2-2 summarizes storage reservoir characteristics,including year of construction, dimensions, material andtype of construction, and capacity. The actual useablecapacity was determined for each of the reservoirs fromdimensional information, and the normal maximumwater surface elevation of the reservoir. Freeboardbetween the normal maximum water surface elevationand the overflow elevation in the reservoirs was excludedfrom the volumetric calculations. The actual useablecapacity, rather than the nominal capacity, was used indeterminations throughout this master plan.Refurbished Nob Hill Tank2-4 2007 Treated <strong>Water</strong> <strong>Master</strong> <strong>Plan</strong> Update A
Hwy 6800NFeet8,000’Multi-Purpose PipelinePITTSBURGBollman WTPBollman High LiftPump StationANTIOCHZ25Z33MidhillHwy 4Sun TerraceZ24Willow Pass Rd.B<strong>ai</strong>ley Rd.Z42ElderwoodZ23Z32TaylorCountry ClubPaso NogalPLEASANTHILLPleasant HillHwy 24Hwy 680 680Hwy 680Ave.ConcordZ11Gregory GardensWALNUTCREEKMarket St.Hwy 242CONCORDYgnacio PSDiablo HillsOak Grove Grove Rd.Lime RidgeSan MiguelValley Rd.YgnacioZ22Shell RidgeCastle RockWillow Pass PSZ21CanterburyCowell RanchZ44Arbolado PSComistas PSZ35Clayton Rd.Sand QuarryNewhallB<strong>ai</strong>leyZ43Z34Z31Z64Rancho Par<strong>ai</strong>soNorth Gate PSKirker PassPine HollowCrystyl RanchEastEagle Peak PSClayton ValleyKeller RanchZ41PowerlineCLAYTONClubhouse PSMurchioZ51Z63Kirker Pass Rd.OakhurstZ73Irish CanyonSeminaryZ82Z72Z83Z61Nob HillMarsh Marsh Creek Rd.Z71DivideMorgan Territory Rd.Z79Z69LegendZ##ServiceArea12345678Randall Bold WTPMulti-PurposePipeline PSModeled PipelinePump StationDistribution Reservoir<strong>Water</strong> Treatment <strong>Plan</strong>tPressure Regulating StationZone IdentifierServiceElevation Range0 - 110110 - 215215 - 325325 - 420420 - 600600 - 760760 - 880880 - 1,000Hwy 680 680W:\REPORTS\<strong>CCWD</strong>\<strong>Master</strong> <strong>Plan</strong>_Apr07\Figures\<strong>CCWD</strong> Treated <strong>Water</strong> Distribution System_Fig2-1.<strong>ai</strong> 05/14/07 JJTFigure 2-1Treated <strong>Water</strong> Distribution System Service Areas and Pressure Zones
W:\REPORTS\<strong>CCWD</strong>\<strong>Master</strong> <strong>Plan</strong>_Apr07\Figures\<strong>CCWD</strong> Schematic Diagram_Fig2-2.<strong>ai</strong> 06/27/07 JJTFIGURE 2-2
Chapter 2Existing <strong>Water</strong> SystemSubzoneYearConstructed/RefurbishedBottomElevation(feet)Table 2-2Existing Storage ReservoirsApproximate DimensionsCircDepth to Overflow (C)/Overflow Elevation Rect(feet) (feet) (R)AboveGround(AG) orBuried (B)NominalCapacity(mg)Dimensions TankName(feet) (1) MaterialCountry Club 1967 196.0 24 220.0 R 116.0 x 176.0 Concrete B 3.00 2.98Diablo Hills 1999 196.0 23.75 219.8 C 169.0 Concrete B 3.82 3.82ActualCapacity (2)(mg)Gregory Gardens 1967 167.3 30 197.3 C 110.5 Steel AG 2.00 2.11#211Lime Ridge #1 1969 196.0 24 220.0 R 136.0 x 156.0 Concrete B 3.00 3.12Lime Ridge #2 1974 196.0 24 220.0 R 156.0 x 296.0 Concrete B 7.00 7.05Pleasant Hill 1949 206.0 31 237.0 C 73.4 Steel AG 1.00 0.96San Miguel #1 1963 196.0 24 220.0 R 116.0 x 116.0 Concrete B 2.00 1.91San Miguel #2 1967 196.0 24 220.0 R 116.0 x 116.0 Concrete B 2.00 1.91Taylor Reservoir 1993 190.0 30 220.0 C 207.0 Concrete B 7.50 7.25Subzone 11 Total 31.32 31.1114 Port <strong>Costa</strong> 1968/2002 191.0 220 C 52.0 Steel AG 0.5021B<strong>ai</strong>ley #1 1963 301.0 24 325.0 R 116.0 x 116.0 Concrete B 2.00 1.96B<strong>ai</strong>ley #2 1971 301.0 24 325.0 R 116.0 x 254.0 Concrete B 4.50 4.41Canterbury #1 1954 295.0 34.5 329.5 C 50.0 Steel AG 0.50 0.50Canterbury #2 1954 296.0 34 330.0 C 72.5 Steel AG 1.00 1.03Subzone 21 Total 8.00 7.90Newhall 1965 304.2 21 325.2 R 136.0 x 156.0 Concrete B 3.00 2.9322 Shell Ridge 1981 301.0 24 325.0 C 133.2 Concrete B 2.50 2.40Subzone 22 Total 5.50 5.3323 Paso Nogal 1981 300.0 20 320.0 R 78.0 x 118.0 Concrete B 1.20 1.1424 Sun Terrace No Storage - Hydropneumatic Subzone25 Midhill 1973 301.0 19 320.0 C 115.9 Concrete AG 1.50 1.42Midhill #2 2007 303.4 19 322.4 R 160.0 x 66.0 Concrete PB (3) 1.50 1.42Subzone 25 Total 3.00 2.84Cowell Ranch 1980 415.0 25 440.0 C 99.8 Concrete B 1.40 1.3531 Pine Hollow #1 1966 416.0 24 440.0 R 96.0 x 136.0 Concrete B 2.00 1.92Pine Hollow #2 1973 416.0 24 440.0 R 96.0 x 134.0 Concrete B 2.00 1.92Subzone 31 Total 5.40 5.1932 Elderwood 1969 402.5 37.5 440.0 C 87.8 Steel AG 1.70 1.6533 Midhill No Storage - Hydropneumatic Subzone34 North Gate 1990 416.0 24 440.0 C 65.8 Concrete B 0.61 0.5835 Castle Rock 1987 416.0 25 441.0 C 59.9 Concrete B 0.50 0.51Clayton Valley #1 1959/2003 505.3 29.5 534.8 C 76.0 Steel AG 1.00 0.9841 Clayton Valley #2 1960/2003 505.3 29.5 534.8 C 76.0 Steel AG 1.00 0.98Kirker Pass 1979 508.6 25 533.6 R 138.0 x 138.0 Concrete B 3.00 2.88Subzone 41 Total 5.00 4.8442 Elderwood No Storage - Hydropneumatic Subzone43 Rancho Par<strong>ai</strong>so 1990 560.0 18 578.0 C 62.7 Concrete B 0.42 0.4244 Sand Quarry 1980 510.0 24 534.0 C 99.7 Concrete B 1.40 1.34East 1988 665.0 20 685.0 C 145.7 Concrete B 2.50 2.3751 Murchio #2 1975 665.0 19 684.0 C 115.6 Concrete B 1.50 1.41Seminary 1967 654.4 31.5 685.9 C 52.3 Steel AG 0.50 0.50Crystyl Ranch 1999 664.0 21 685.0 C 98.6 Concrete AG 1.14 1.14Subzone 51 Total 5.64 5.42A 2007 Treated <strong>Water</strong> <strong>Master</strong> <strong>Plan</strong> Update 2-5
Chapter 2Existing <strong>Water</strong> SystemSubzoneYearConstructed/RefurbishedBottomElevation(feet)Table 2-2Existing Storage ReservoirsApproximate DimensionsCircDepth to Overflow (C)/Overflow Elevation Rect(feet) (feet) (R)Dimensions(feet) (1)TankMaterialAboveGround(AG) orBuried (B)NominalCapacity(mg)Name61 Nob Hill 1967/2002 842.0 31.8 873.8 C 51.3 Steel AG 0.50 0.4863 Oakhurst 1990 846.0 27 873.0 C 68.0 Concrete B 0.75 0.7164 Crystyl Ranch No Storage - Hydropneumatic Subzone71/79/ Divide #1 1967/2002 960.0 29.5 989.5 C 38.0 Steel AG 0.25 0.2469 Divide #2 1967/2002 960.0 29.5 989.5 C 38.0 Steel AG 0.25 0.24Subzone 71/79/69 Total 0.50 0.4872 Irish Canyon 1991 970.0 20 990.0 C 85.8 Concrete B 0.83 0.8273 Keller Ranch 1994 967.0 23 990.0 C 59.9 Concrete B 0.55 0.4682 Powerline 1995 1058.0 22 1080.0 C 59.0 Concrete B 0.45 0.4583 Irish Canyon No Storage - Hydropneumatic SubzoneTOTAL - ALL SUBZONES 73.80 71.72Notes:(1) Dimensions shown are diameter for circular reservoirs and length and width for rectangular reservoirs.(2) Actual capacity is calculated based on normal maximum water surface elevation of the tank. Nominal capacity refers to the total storage.(3) Partially buried reservoir.ActualCapacity (2)(mg)2.3.3 Pump StationsThe Treated <strong>Water</strong> Service Area includes 31 pump stations that distribute water throughout the system.Table 2-3 summarizes pump stations, including year of construction, pump station capacity, and otheressential pump station features. <strong>Water</strong> is pumped from the Bollman WTP to subzone 11, and other pumpstations distribute water from subzone 11 to the rem<strong>ai</strong>ning subzones within the system. As part of theMulti-Purpose Pipeline Project, a new pump station was constructed at the Randall-Bold WTP to deliverwater from the plant to the Treated <strong>Water</strong> Service Area.Seminary Pump Station2-6 2007 Treated <strong>Water</strong> <strong>Master</strong> <strong>Plan</strong> Update A
Chapter 2Existing <strong>Water</strong> SystemTable 2-3Existing Pump StationsPump Station InformationServesSubzoneSourceSubzone Pump Station NameYearConstructed/RefurbishedNo. ofUnitsTotalCapacity(mgd)FirmCapacity(mgd)TotalDynamicHead (feet)TotalHorsepower(HP)Bollman WTP Bollman High Lift (1) 1968/1999 6 105.0 75.0 225 580011Randall-Bold MPP (2) 2003 6 40.9 31.8 360 3200WTP11 Pleasant Hill (3) 1949 1 1.9 1.9 24 10Subzone 11 Total 136.9 101.914 Martinez Port <strong>Costa</strong> 1968 2 0.3 0.1 60 42111 Willow Pass PS 2000 4 28.8 21.6 130 100011 Lime Ridge 1971/2006 4 23.0 17.3 150 800Subzone 21 Total 51.8 38.92211 San Miguel Zone 2 1963/1984 3 15.3 8.4 135 50011 Ygnacio 2001 2 5.8 2.9 196 200Subzone 22 Total 21.1 11.3Subzone 21/22 Total 72.9 50.223 11 Gregory Gardens 1981 3 4.3 2.9 132 18025 11 Country Club 1981 3 5.0 3.3 128 180Subzone 23/25 Total 9.3 6.224 11 Sun Terrace 1960 3 3.3 2.2 112 9021 B<strong>ai</strong>ley 1963/2000 6 21.6 18.0 150 75031 11 San Miguel Zone 3 1985 2 1.9 0.8 255 125Subzone 31 Total 23.5 18.832 23 Paso Nogal 1969/2004 3 4.1 2.7 125 12033 25 Midhill (4) 1984 3 0.9 0.6 180 4534 22 Arbolado 1990 3 1.3 0.9 210 7535 22 Comistas 1987 3 0.9 0.6 125 3041 31 Pine Hollow 1966/2000 5 14.4 11.5 110 37544 31 Cowell Ranch 1980 2 1.7 0.9 100 50Subzone 41/44 Total 16.1 12.442 32 Elderwood (4) 1969/2002 3 5.5 3.7 125 12043 34 Northgate 1990/2006 3 0.6 0.4 177 305141 Clayton Valley 1959/2003 4 9.6 7.2 190 40041 Kirker Pass 1988 3 4.3 2.9 180 180Subzone 51 Total 13.9 10.161 51 Seminary 1967 2 6.3 3.2 215 30063 51 Eagle Peak 1990 3 2.2 1.4 310 12064 51 Crystyl Ranch (5) 1999 3 1.7 1.2 140 18071 61 Nob Hill 1967 2 6.3 3.2 160 20072 51 Clubhouse 1991 3 1.1 0.8 440 9073 61 Oakhurst 1994 3 0.7 0.4 160 4582 72 Keller Ranch 1996 3 0.4 0.3 100 2383 72 Irish Canyon (4) 2001 2 0.3 0.1 118 10Total - All Subzones 308.6 221.6Notes:(1) Total capacity is estimated. Actual total and firm capacity are constr<strong>ai</strong>ned by plant and system conditions. Existing firm capacityestimated to range from 70 to 80 mgd.(2) Currently configured to serve subzone 21.(3) Currently not in service.(4) Serves hydropneumatic system. Totals do not include fire pump.(5) Serves hydropneumatic system. Pump station has dual speed pumps. Reported capacity is at low speed (normal operatingconditions). High speed used to provide fire flow.A 2007 Treated <strong>Water</strong> <strong>Master</strong> <strong>Plan</strong> Update 2-7
Chapter 2Existing <strong>Water</strong> System2.4 Facilities Added Since the 2002 Treated <strong>Water</strong> <strong>Master</strong> <strong>Plan</strong>Table 2-4 summarizes facilities added or designed since the 2002 Treated <strong>Water</strong> <strong>Master</strong> <strong>Plan</strong> Update.These facilities were considered existing facilities.Table 2-4Facilities Added Since the 2002 Treated <strong>Water</strong> <strong>Master</strong> <strong>Plan</strong>Project Subzone Installed Capacity YearPump Station ProjectsClayton Valley Pump Station Rehabilitation 51 2.4 mgd (1) 2003Multi-Purpose Pipeline Pump Station (new) 11 40.9 mgd 2003ReservoirsMidhill #2 Reservoir 25 1.5 mg 2007PipelinesClayton Transmission 51 1 mile of 24-inch diameter 2004Gregory Gardens PS/Taylor Reservoir PipelineImprovements for <strong>Water</strong> Quality11 1,400 feet of 16-inch diameter 2003Reliability Improvements (2)All high priority (six locations) and two medium priority backup generator projectsAll high priority (four locations) and one low priority seismic isolation valves at reservoirsThree fault crossing connections on large-diameter pipelines crossing the Concord Fault(1) Installation of 4 th pump to increase firm capacity from 4.8 mgd to 7.2 mgd(2) For det<strong>ai</strong>ls of reliability projects installed, see Tables 5-4 through 5-6.In addition, the following facilities were either removed from service or rehabilitated since 2002:• Two Clayton Valley tanks (each with a capacity of 1.0 million gallons) were rehabilitated in 2003.• Paso Nogal Pump Station was rehabilitated in 2004 and the capacity will be relocated to Country ClubPump Station in 2007, due to slope stability issues at the site.• Northgate Pump Station was rehabilitated in 2006 to increase firm capacity from 0.4 to 0.6 mgd.• Lime Ridge Pump Station was rehabilitated in 2006.2-8 2007 Treated <strong>Water</strong> <strong>Master</strong> <strong>Plan</strong> Update A
Section 3Existing and Projected <strong>Water</strong> Demands2007 Treated <strong>Water</strong> <strong>Master</strong> <strong>Plan</strong> Update - Draft Report3. Existing and Projected<strong>Water</strong> Demands
Chapter 3Existing and Projected <strong>Water</strong> Demands3.1 Purpose of Demand ProjectionsExisting and future water demands for the Treated<strong>Water</strong> Service Area (TWSA) are a key element indeveloping the Treated <strong>Water</strong> <strong>Master</strong> <strong>Plan</strong> (TWMP)Update. The water demand projections weredetermined using a land-use-based approachdeveloped in the 1997 TWMP. The existing and futureservice area demands were updated by the <strong>District</strong>based on the 2002 Future <strong>Water</strong> Supply StudyDemand Update, supplemented with more recentplanning data from jurisdictions within the <strong>District</strong>study area. The updated demands provide anaccurate, det<strong>ai</strong>led distribution of water demands and<strong>ai</strong>d in the assessment of existing and future capacityand deficiencies.Climate change is likely to have an effect on watersupply, demand and system planning. The <strong>District</strong> iscurrently working with other water agencies to analyzethe effects of climate change on planning criteria anddesign standards, and findings will be incorporated inthe next TWMP. Possible areas that may be affectedinclude storage criteria, peaking factors, and demandprojection methodology.Chapter Overview:This chapter provides an overview of the<strong>District</strong>’s existing and future demands. Itincludes:• Purpose of Demand Projections• Land Use Assumptions• Annual <strong>Water</strong> Demands• Peak <strong>Water</strong> Demands• Effects of <strong>Water</strong> Conservation• Comparison of Demands with OtherStudiesHighlights:• Treated water demands are estimated torange from 48 mgd (average day) to 97mgd (maximum day) at buildout. Theseprojections are consistent with the 2002Future <strong>Water</strong> Supply Study and 2002Treated <strong>Water</strong> <strong>Master</strong> <strong>Plan</strong>.• The buildout planning horizon for thisstudy is assumed to be 2030.3.2 Land Use Assumptions3.2.1 Current <strong>Plan</strong>ning AreaThe planning area for demand projections is the existing and future service area boundary for treatedwater service area customers (see Figure 1-1). The outermost boundary is based on the <strong>District</strong>’s Sphereof Influence, which is designated by the <strong>Contra</strong> <strong>Costa</strong> County Local Agency Formation Commission. The<strong>District</strong> developed planning projections using general plan information for each of the cities within thestudy area and for <strong>Contra</strong> <strong>Costa</strong> County for unincorporated areas. For the Marsh Creek area, projectionsare based on the Marsh Creek Specific <strong>Plan</strong>.Demand projections were developed for three periods; existing, intermediate and buildout. Theintermediate demand scenario was chosen to assist in the phasing of recommended improvements andto provide input into the <strong>District</strong>'s Capital Improvement Program. The buildout planning horizon for thestudy area is assumed to be 2030 based on general plan information for each city within the study areaand the <strong>Contra</strong> <strong>Costa</strong> County General <strong>Plan</strong>. The Marsh Creek Specific <strong>Plan</strong> area is assumed to have abuildout planning horizon of 2050. The intermediate demands scenario is assumed to be 2020 and wasdeveloped by interpolating between existing and buildout scenarios.3.2.2 Former Concord Naval Weapons StationThe City of Concord, acting as the local re-use authority, has embarked on a process to identify redevelopmentopportunities for the former Concord Naval Weapons Station (CNWS). The <strong>District</strong> planningprojections for water use include historical CNWS water demands but do not account for potentialdevelopment at the CNWS.A 2007 Treated <strong>Water</strong> <strong>Master</strong> <strong>Plan</strong> Update 3-1
Chapter 3Existing and Projected <strong>Water</strong> DemandsThe CNWS was constructed in 1944, as an annex to Mare Island Naval Shipyard in Vallejo. In 1999, theinland portion of the station, comprising approximately 5,200 acres, was de-commissioned. In 2006, theDepartment of Defense designated the Concord City Council as the Local Reuse Authority (LRA). The LRAis developing a re-use plan in a three-phase process. In Phase I, completed in 2006, a community-basedapproach was used to identify goals and guiding principles for the re-use plan. Phase II, initiated in spring2007 with a three-year timeline, will identify hazardous material cleanup requirements, methods andpotential costs, identify potential re-use plan alternatives, and conduct an environmental review of redevelopmentalternatives. The <strong>District</strong> is participating in Phase II as a member of the Technical AdvisoryGroup, which includes potential service providers, as well as local and regional agencies and jurisdictions.In Phase III, the LRA will prepare, finalize and adopt the det<strong>ai</strong>led re-use and community facilities plans.Det<strong>ai</strong>led infrastructure plans will be developed as part of Phase III.The LRA’s re-use planning team is currently preparing conceptual development alternatives, which will bepresented to the LRA in September 2007. The LRA will then direct the re-use planning team on the rangeof options to be evaluated in the environmental review. A supplement to this TWMP will be prepared onceconceptual alternatives have been selected, to assess potential impacts to TWSA facilities. This analysiswill be at a conceptual level, identifying water supply, conveyance, treatment, and transmission needs toserve the CNWS, but not evaluating det<strong>ai</strong>led water system infrastructure needed to serve potentialdevelopment.3.3 Annual <strong>Water</strong> Demands3.3.1 Historical Annual <strong>Water</strong> UseFigure 3-1 summarizes the <strong>District</strong>’s average d<strong>ai</strong>ly historical production from 1985 through 2006 for theTWSA. The figure shows average d<strong>ai</strong>ly production, in million gallons per day. As the figure indicates,water use has been40relatively constant in recent3837years, ranging from 35 to 3836 363535mgd. The figure also shows35 343333 333232the effects of drought313130 30reduction measures taken302928during the 1988 through1991 drought period, and2525the residual effects of thedrought on water use, which20continued into the late1990’s.3.3.2 Annual <strong>Water</strong>Demand ProjectionsThe <strong>District</strong> developedannual demand projectionsthrough 2030 using a landuse-basedapproachoriginally developed in the1997 TWMP, and updatedas part of the 2002 FutureAverage D<strong>ai</strong>ly Production (mgd)1510501985 1986 1987 1988 1989 1990 1991 1992 1993 1994 1995 1996 1997 1998 1999 2000 2001 2002 2003 2004 2005 2006Year<strong>Water</strong> Supply Study Demand Update. With this method, land useacreages for different customer types and unit water use factors forthese customer types are used to develop existing and buildout water use estimates.Table 3-1 presents annual water demands for existing, intermediate and buildout conditions.Figure 3-1Annual Historical <strong>Water</strong> Production3735373-2 2007 Treated <strong>Water</strong> <strong>Master</strong> <strong>Plan</strong> Update A
Chapter 3Existing and Projected <strong>Water</strong> DemandsTable 3-1Existing and Projected Annual DemandAverage Demand (acre-feet)Average Demand (MGD)Pressure Zone Subzone Existing Intermediate Buildout Existing Intermediate Buildout11 21,700 23,072 24,127 19.4 20.6 21.51 Subtotal 21,700 23,072 24,127 19.4 20.6 21.521 5,465 5,698 5,878 4.9 5.1 5.222 3,962 4,154 4,301 3.5 3.7 3.823 339 372 398 0.3 0.3 0.424 237 244 249 0.2 0.2 0.225 1,515 1,571 1,614 1.4 1.4 1.42 Subtotal 11,518 12,040 12,441 10.3 10.7 11.131 3,224 3,400 3,535 2.9 3.0 3.232 456 469 479 0.4 0.4 0.433 156 162 167 0.1 0.1 0.134 386 418 442 0.3 0.4 0.435 70 100 124 0.1 0.1 0.13 Subtotal 4,291 4,549 4,748 3.8 4.1 4.241 1,789 1,887 1,962 1.6 1.7 1.842 559 575 587 0.5 0.5 0.543 91 110 125 0.1 0.1 0.144 487 509 526 0.4 0.5 0.54 Subtotal 2,926 3,081 3,201 2.6 2.8 2.951 2,772 3,160 3,458 2.5 2.8 3.15 Subtotal 2,772 3,160 3,458 2.5 2.8 3.161 (1) 188 391 858 0.2 0.4 0.863 279 288 295 0.2 0.3 0.364 240 290 328 0.2 0.3 0.369 (1) 203 588 1,477 0.2 0.5 1.36 Subtotal 910 1557 2,959 0.8 1.5 2.671 (1) 4 61 192 0.0 0.1 0.272 135 137 138 0.1 0.1 0.173 92 94 96 0.1 0.1 0.179 (1) 169 370 835 0.2 0.3 0.77 Subtotal 400 662 1,261 0.4 0.6 1.182 157 161 164 0.1 0.1 0.183 53 53 54 0.0 0.0 0.08 Subtotal 209 214 218 0.2 0.2 0.2Port <strong>Costa</strong> 160 192 192 0.1 0.2 0.2Other Bay Point 150 1,120 1,120 0.1 1.0 1.0Total Demand 45,037 49,646 53,725 40.2 44.0 48.0(1) Buildout for Marsh Creek Specific <strong>Plan</strong> area is assumed to be 2050. For all other areas, buildout is assumed to be 2030These demands have been adjusted to reflect dry year conditions, when overall water use would behigher because of lower r<strong>ai</strong>nfall, but water use would be unaffected by drought cutbacks. Dry yeardemands shown for existing conditions are about 8 percent higher than year 2006 actual production.The table presents annual demand for each of the <strong>District</strong>’s pressure zones, in acre-feet and equivalentaverage d<strong>ai</strong>ly demand, in million gallons per day (mgd).A 2007 Treated <strong>Water</strong> <strong>Master</strong> <strong>Plan</strong> Update 3-3
Chapter 3Existing and Projected <strong>Water</strong> DemandsAnnual dry year demand for existing conditions is about 45,000 acre-feet. Buildout demand is projectedto increase by 20 percent to 54,000 acre-feet. The increase in demand is split throughout the <strong>District</strong>’sservice area: about 30 percent in subzone 11 (central Concord), 30 percent in the Concord-Clayton Valley(subzones 21, 31, 41, 51, 61 and smaller subzones served from them) and 30 percent in the MarshCreek Specific <strong>Plan</strong> area (subzones 71, 79 and 69). The rem<strong>ai</strong>ning 10 percent of the total increase is intreated water service to Bay Point, which is projected to grow from its current 150 acre-feet/year to 1,100acre-feet/year.General planning assumptions used in developing demand projections are summarized in Table 3-2.Appendix A includes more det<strong>ai</strong>ls of the demand methodology, and allocation of demands to the hydraulicmodel.Table 3-2<strong>Plan</strong>ning Assumptions Used to Develop Annual Demand ProjectionsGeneral• The study area boundary is the <strong>District</strong>’s Sphere of Influence (SOI) for the Treated <strong>Water</strong> Service Area plusthe SOI for the City of Clayton. The City of Clayton’s SOI extends beyond the <strong>District</strong>’s SOI in the Marsh CreekRoad area.• Demands used in this study were taken from the Future <strong>Water</strong> Supply Study 2002 Update, with adjustmentsbased on new planning information developed since completion of that study.• The unaccounted for water estimates were calculated by subzone, based on historical data.Existing Demands• Dry year factors for existing demands were developed based on data reflecting 1987 water use patterns.1987 is typical of a dry year in which water use is higher due to lower r<strong>ai</strong>nfall. <strong>Water</strong> use was not affected bydrought or water shortages.• Annual sale of treated water to the Golden State <strong>Water</strong> Company was assumed to be 150 af/yr based onrecent metering information.• Demand for the Port <strong>Costa</strong> System was based on meter readings for the City of Martinez Intertie and wasapplied as a point demand at the location of the intertie in subzone 42 (Elderwood Intertie).Future Demands• Future demands were based on individual city and County general plan land use designations and densitiesfor undeveloped parcels and planned redevelopment areas, as identified in the FWSS and updated withmore recent planning information.• Future demands were developed for intermediate, assumed at 2020, and buildout, assumed at 2030. Year2020 was chosen to bracket the <strong>District</strong>’s 10-year Capital Improvement Program and to assist in the phasingof capital improvements.• Intensification of existing land uses was assumed to occur through re-development of existing land uses, infilldevelopment of small parcels, and minor general plan amendments. The assumed intensification is basedon an increase in buildout demands equal to five percent of existing demands.• It was assumed that 85 percent of the lands designated as agricultural in the <strong>District</strong>’s SOI may requiretreated water service by buildout. The maximum allowable density of 1 dwelling unit per 5 acres wasassumed.• Buildout demand for the Golden State <strong>Water</strong> Company was estimated to be 1,100 af/yr.• Future demands do not include reductions to account for future conservation.• No other changes in land use were made from the 2002 TWMP other than as identified in updated Cityplanning documents such as master plans.3-4 2007 Treated <strong>Water</strong> <strong>Master</strong> <strong>Plan</strong> Update A
Chapter 3Existing and Projected <strong>Water</strong> Demands3.4 Peak <strong>Water</strong> DemandsFor water master plan analysis, it is customary to evaluate distribution system performance underanticipated peak demand conditions. Such conditions include maximum day demand, fire flow, and peakhour demand. This section summarizes peak water use estimates for the <strong>Master</strong> <strong>Plan</strong>.3.4.1 Historical Maximum Day <strong>Water</strong> UseTable 3-3 summarizes the <strong>District</strong>’s historical peak water use for 1985 through 2006 for the TWSA. Thetable shows average day and maximum day production and the maximum day to average day peakingfactors for these years. The highest production day occurred in 2006, with a maximum day production of71 mgd. Maximum day to average day peaking factors have ranged from 1.5 to 2.2. Higher peakingfactors tend to occur in average to wet hydrologic years, when irrigation demands are lower due to higheramounts of seasonal r<strong>ai</strong>nfall (e.g. 1993, 1998). Higher peaking factors have also been observed in somesubzones, with larger estate-type homes and more extensive landscaping. In particular, higher water usehas been observed in subzone 43. Analysis of operational records from summer 2006 indicates that themaximum day to average day peaking factor for this subzone is 2.8. Based on this, a peaking factor of2.0 was used for all subzones except subzone 43, where a 2.8 peaking factor was used.Table 3-3Historical Average and Maximum D<strong>ai</strong>ly <strong>Water</strong> UseYearAverage Day Production(mgd)Maximum Day Production(mgd)Maximum Day to Average Day PeakingFactor1985 33 66 2.01986 34 63 1.91987 35 61 1.71988 32 54 1.71989 33 57 1.71990 33 57 1.71991 25 38 1.51992 29 50 1.71993 30 65 2.21994 31 60 1.91995 30 58 1.91996 32 64 2.01997 31 50 1.61998 28 61 2.21999 35 63 1.82000 37 69 1.92001 38 66 1.72002 36 62 1.72003 36 64 1.82004 37 59 1.62005 35 66 1.92006 37 71 1.9Source: <strong>CCWD</strong> Operations and M<strong>ai</strong>ntenance Department, Treated <strong>Water</strong> Production Report.A 2007 Treated <strong>Water</strong> <strong>Master</strong> <strong>Plan</strong> Update 3-5
Chapter 3Existing and Projected <strong>Water</strong> Demands3.4.2 Diurnal <strong>Water</strong> Use PatternsDiurnal peaking factors are2.20used in the hydraulic model to2.00simulate the water distribution1.80system response to variationsin hourly demand. Hourly1.60peaking factors are multiplied1.40by the d<strong>ai</strong>ly demand todetermine the hourly demand1.20within the distribution system.1.00For the TWMP evaluation, thisanalysis is performed for the0.80maximum demand day, to0.60evaluate system capacity, andstorage reservoir fill and draw0.40under peak conditions.Ratio of Hourly to D<strong>ai</strong>ly Demand (max. or average day)0.202.001.831.701.731.611.521.411.281.121.051.070.940.810.730.63 0.64 0.67 0.69 0.630.560.550.380.250.20Figure 3-2 shows the diurnalcurve used for this study toestimate the hourly demandson the maximum day. Thediurnal curve was originallydeveloped in the 1997 TWMPfrom data for subzones 21, 22and 34 for July 31, 1996, one0.001 2 3 4 5 6 7 8 9 10 11 12 13 14 15 16 17 18 19 20 21 22 23 24of the top three production days in 1996. The diurnal curve shows peak water use in the day occurring at7 a.m. (2.0 times the d<strong>ai</strong>ly demand), and lowest water use at 1 a.m. (0.2 times the average d<strong>ai</strong>lydemand). For the 2007 TWMP, diurnal curves were developed from SCADA for subzones in pressurezones 1, 2 and 3 (the larger subzones within the system), and compared with the diurnal curve developedin the 1997 plan. Observed trends were similar, so the 1997 curve was used without adjustment.3.4.3 Maximum Day and Peak Hour Demand ProjectionsTable 3-4 presents maximum day and peak hour water demands for the <strong>District</strong>’s TWSA for existing,intermediate and buildout conditions. As noted in Section 3.3.2, the existing annual average dry yeardemands are about eight percent higher than annual production in recent years. The dry year maximumday demand of 81 mgd is about 14 percent higher than 2006 maximum day production of 71 mgd. Thislarger difference is because actual maximum day use in 2006 was 1.9 times average d<strong>ai</strong>ly use, while apeaking factor of 2.0 is used for developing the master plan demand estimates.For developing the master plan maximum day projections in Table 3-4, a peaking factor of 2.0 times theaverage d<strong>ai</strong>ly demand was used for all subzones, except subzone 43, where a peaking factor of 2.8 wasused due to the prevalence of estate-type residential development. Peak hour demand was estimated as2.0 times the maximum day demand for all subzones. The peaking factors are based on analysis ofhistorical day and peak hour peaking factors for the <strong>District</strong>.Golden State <strong>Water</strong> Company is served treated water from the Treated <strong>Water</strong> Service Area. Golden State<strong>Water</strong> Company is projected to have an average day demand of approximately 1 mgd at 2025. However,a maximum day demand of 2.9 mgd was projected, based on the existing agreement and ultimateconnection capacity of 1,980 gpm (2.9 mgd). Therefore, the maximum day peaking factor used for theGolden State <strong>Water</strong> Company treated water demand is 2.9.HourFigure 3-2Hourly Peaking Factors for Distribution System3-6 2007 Treated <strong>Water</strong> <strong>Master</strong> <strong>Plan</strong> Update A
Chapter 3Existing and Projected <strong>Water</strong> DemandsTable 3-4Maximum Day and Peak Hour <strong>Water</strong> Demand ProjectionsPressure SubzoneMaximum Day Demand (mgd)Peak Hour Demand (mgd)ZoneExisting Intermediate Buildout Existing Intermediate Buildout1 11 38.7 41.2 43.1 77.5 82.4 86.2Subtotal-1 38.7 41.2 43.1 77.5 82.4 86.22 21 9.8 10.2 10.5 19.5 20.3 21.022 7.1 7.4 7.7 14.1 14.8 15.423 0.6 0.7 0.7 1.2 1.3 1.424 0.4 0.4 0.4 0.8 0.9 0.925 2.7 2.8 2.9 5.4 5.6 5.8Subtotal-2 20.6 21.5 22.2 41.1 43.0 44.43 31 5.8 6.1 6.3 11.5 12.1 12.632 0.8 0.8 0.9 1.6 1.7 1.733 0.3 0.3 0.3 0.6 0.6 0.634 0.7 0.7 0.8 1.4 1.5 1.635 0.1 0.2 0.2 0.2 0.4 0.4Subtotal-3 7.7 8.1 8.5 15.3 16.2 17.04 41 3.2 3.4 3.5 6.4 6.7 7.042 1.0 1.0 1.0 2.0 2.1 2.143 0.2 0.3 0.3 0.5 0.6 0.644 0.9 0.9 0.9 1.7 1.8 1.9Subtotal-4 5.3 5.6 5.8 10.6 11.2 11.65 51 4.9 5.6 6.2 9.9 11.3 12.3Subtotal-5 4.9 5.6 6.2 9.9 11.3 12.36 61 0.3 0.7 1.5 0.7 1.4 3.163 0.5 0.5 0.5 1.0 1.0 1.164 0.4 0.5 0.6 0.9 1.0 1.269 0.4 1.1 2.6 0.7 2.1 5.3Subtotal-6 1.6 2.8 5.3 3.3 5.5 10.67 71 0.0 0.1 0.3 0.0 0.2 0.772 0.2 0.2 0.2 0.5 0.5 0.573 0.2 0.2 0.2 0.3 0.3 0.379 0.3 0.7 1.5 0.6 1.3 3.0Subtotal-7 0.7 1.2 2.3 1.4 2.3 4.58 82 0.3 0.3 0.3 0.6 0.6 0.683 0.1 0.1 0.1 0.2 0.2 0.2Subtotal-8 0.4 0.4 0.4 0.7 0.8 0.8Other Port <strong>Costa</strong> 0.3 0.3 0.3 0.6 0.7 0.7Bay Point 1.1 2.9 2.9 2.2 5.7 5.7Total Demand 81.3 89.6 96.9 162.6 179.1 193.73.5 Effects of ConservationThe future average annual demands in the TWSA will be affected by conservation. The <strong>District</strong>'sconservation program is referred to as Conservation Program Alternative 1 (CPA1) and is described in theFuture <strong>Water</strong> Supply Study (<strong>CCWD</strong>, 2002). CPA1 is consistent with the California Urban <strong>Water</strong> AgenciesBest Management Practices Memorandum of Understanding and includes water audits, distribution ofwater savings kits, plumbing retrofit incentives, public and school education programs, leak detection andrep<strong>ai</strong>r, and conservation pricing. CPA1 is expected to reduce average demand by 1 percent per decadefor a savings of 5 percent by 2050.Additional conservation will occur irrespective of any formal programs by the <strong>District</strong> due to Stateregulations, local ordinances, and the natural replacement of existing plumbing fixtures with moreefficient models. It is estimated that conservation irrespective of <strong>District</strong> programs will reduce averagedemand by an additional 2 percent per decade for an additional savings of 10% by 2050.A 2007 Treated <strong>Water</strong> <strong>Master</strong> <strong>Plan</strong> Update 3-7
Chapter 3Existing and Projected <strong>Water</strong> DemandsBuildout average annual demands developed for this study are projected to be 48.0 mgd and maximumday demands are 96.9 mgd. These demands do not include future conservation savings (CPA1 or non-<strong>District</strong> conservation). Use of the 96.9 mgd maximum day demand level for facilities planning isrecommended because it conservatively estimates future demands. This conservative approach ensuresthat future facilities are adequately sized to meet future demands.3.6 Comparison of Demands with Other StudiesFigure 3-3 shows a comparison of the averageday demand projections from various <strong>District</strong>studies. The 2002 TWMP Update projectedexisting (2002) dry year average day demandof 39 mgd and maximum day demand of 79mgd. Buildout (2025) demand in the 2002TWMP was estimated at 48 mgd for averageday and 97 mgd for maximum day. ThisTWMP estimates existing (2007) dry yearaverage day demand to be 40 mgd andmaximum day demand to be 81 mgd.Buildout (2030) demand is estimated at 48mgd for average day and 97 mgd formaximum day, virtually unchanged from the2002 <strong>Master</strong> <strong>Plan</strong>. Therefore, currentestimated demands are consistent with theestimates made in 2002. Demands areconsistent among all studies, showing thesame future demand, but shifted in time.Average Day Demand (mgd)60504030201001980 1985 1990 1995 2000 2005 2010 2015 2020 2025 2030 2035YearHistorical <strong>Water</strong> Use2002 Future <strong>Water</strong> Supply Study2002 Treated <strong>Water</strong> <strong>Master</strong> <strong>Plan</strong>2007 Treated <strong>Water</strong> <strong>Master</strong> <strong>Plan</strong>Figure 3-3Comparison of Historical Average Day Treated<strong>Water</strong> Demand Projections with Current Projections3-8 2007 Treated <strong>Water</strong> <strong>Master</strong> <strong>Plan</strong> Update A
4. System PerformanceCriteriaSection 4System Performance Criteria2007 Treated <strong>Water</strong> <strong>Master</strong> <strong>Plan</strong> Update - Draft Report
Chapter 4System Performance Criteria4.1 Summary of CriteriaSystem performance criteria were established and adopted bythe <strong>CCWD</strong> Board of Directors in 1990 and were used toevaluate the existing system, identify deficiencies, and todetermine the size of new facilities. Table 4-1 summarizesthe criteria for pump stations, storage reservoirs anddistribution pipeline facilities. The criteria are the same asthose used in the 2002 TWMP Update. Subsequent sectionsin this chapter discuss the criteria in more det<strong>ai</strong>l.4.2 Pump Station CriteriaFor subzones with storage reservoirs, the firm capacity ofHighlights:pump stations, with the single largest pumping unit out of • The system performance criteria areservice, must supply maximum day demand to the subzones the same as criteria used in theserved (either directly, or through pump stations to higher2002 Treated <strong>Water</strong> <strong>Master</strong> <strong>Plan</strong>.subzones). During peak hour conditions, balancing storagewould make up the difference between pump station supply and subzone demand.For hydropneumatic subzones, the firm capacity of pump stations, with the single largest pumping unitout of service, must meet peak hour demands and/or maximum day plus fire flow conditions, since nosubzone storage is av<strong>ai</strong>lable to supplement pumping supply to the subzone.4.3 Storage Reservoir CriteriaChapter Overview:This chapter presents the systemperformance criteria used for the <strong>Master</strong><strong>Plan</strong> evaluation. The chapter includes:• Summary of Criteria• Pump Station Criteria• Storage Reservoir Criteria• Distribution System CriteriaStorage sizing is comprised of capacity necessary to cover fluctuations in system demands, provide waterfor fire suppression, and capacity for emergency situations. The total storage required is determined bysumming the storage for the following three components:• Operational Storage (also called equalizing or balancing storage): 25 percent of maximum daydemand to provide the difference between peak subzone demands and pump station inflow on themaximum demand day.• Fire Reserve Storage: varies, depending on the fire flow requirements for land uses within thesubzone and the anticipated duration of the fire. Storage volume is based on the most critical landuse within the subzone and is based on the Uniform Fire Code and input from the <strong>Contra</strong> <strong>Costa</strong>County Fire Protection <strong>District</strong>. New tanks (either replacement of existing tanks or new growth relatedtanks) will be sized for the most critical land use designation in the subzone at the time ofconstruction.• Emergency Storage: 75 percent of maximum day demand, reserved for emergencies, such as pipelinef<strong>ai</strong>lures, pump station f<strong>ai</strong>lures, treatment facility f<strong>ai</strong>lures, electrical power outages or naturaldisasters. This criterion is used to identify deficiencies and to determine the size of new tanks. Thiscriterion overlaps to some extent with the reliability criteria described below. The current emergencystorage deficiency will be met with a combination of new storage and reliability improvements.Storage sizing calculations were based on the actual reservoir capacity, determined by actual dimensionsand calculated volume using the normal maximum water surface in the reservoir. Calculations alsoincluded demands for hydropneumatic subzones served from the subzone being evaluated.A 2007 Treated <strong>Water</strong> <strong>Master</strong> <strong>Plan</strong> Update 4-1
Chapter 4System Performance CriteriaFacility/DescriptionPump StationsFirm Capacity for subzones with storage (1)Firm Capacity for hydropneumatic subzones (1)Storage ReservoirsStorage VolumesOperational Storage VolumeEmergency Storage VolumeFire Reserve Volume (5)(6)Table 4-1<strong>Master</strong> <strong>Plan</strong> System Performance CriteriaCriterionMaximum Day DemandPeak Hour and Maximum Day Demand plus fireflow25% of Maximum Day Demand75% of Maximum Day DemandBased on volume required for most critical landuse within subzoneDistribution SystemSystem PressuresMinimum pressures for non-fire conditions (2)40 psiMinimum pressures for maximum day plus fire20 psiConditionsMaximum pressure (2)120 psiFire Flows (6)Existing residential development:1,000 gpm for 2 hoursNew developments requiring m<strong>ai</strong>n improvements:Single-family residential1,500 gpm for 2 hoursMulti-family, commercial, schools3,000 gpm for 3 hoursLight Industrial4,000 gpm for 4 hoursPipeline Performance (for sizing new pipelines only) (3)Maximum headloss, non fire conditions10 feet/ 1000 feetMaximum velocity during peak hour demand conditions 10 feet/secondMax velocity during max day plus fire flow conditions 12 feet/secondSystem Reliability Criteria (4)Reliability criteria that outline system reliability goals for Treated <strong>Water</strong> Reliability Criteria Nos. 1 through 20fighting fires and restoring service to residential,cont<strong>ai</strong>ned in the Seismic Reliability Improvementscommercial, industrial, agricultural, and municipalProject, Volume 3. These criteria are included ascustomers after a major seismic event. Appendix B of this TWMP report.<strong>Water</strong> Quality GoalDisinfectant residual0.2 mg/L – 3.0 mg/LTarget maximum reservoir water age under average day 10 daysdemand conditions. (7)Notes:(1) Firm capacity is the capacity with largest pumping unit out of service.(2) For customer services within the normal service elevation range. Customers outside of service range are assumed to havespecial service agreements. <strong>CCWD</strong> requires installation of pressure regulating valves for services with pressures that exceed80 psi.(3) Existing pipelines with high head losses or velocities were not considered deficient unless they also cause low customerpressures or the pipeline is a hydraulic constr<strong>ai</strong>nt to reservoir filling and dr<strong>ai</strong>ning.(4) Seismic Reliability Improvements Project Report Volume 3, Table 1-2, (M-W, 1997), included as Appendix B of this TWMPUpdate. SRIP criteria adopted by the Board in 1997.(5) New tanks (either replacement of existing tanks or new growth related tanks) will be sized for land use designation at thetime of construction.(6) Applied to new development. Fire storage volume and fire flows may be adjusted based on the Uniform Fire Code and inputfrom Central <strong>Contra</strong> <strong>Costa</strong> Fire Protection <strong>District</strong>.(7) This is not Board adopted criteria or goal. This has been used to evaluate system performance for distribution water quality.4-2 2007 Treated <strong>Water</strong> <strong>Master</strong> <strong>Plan</strong> Update A
Chapter 4System Performance Criteria4.4 Distribution System Criteria4.4.1 Distribution System PressuresAdequate system pressure is a basic indicator of acceptable distribution system performance. Theperformance criteria for pressures are: m<strong>ai</strong>nt<strong>ai</strong>ning pressures ranging from 40 psi to 120 psi under allnon-fire conditions, and providing minimum pressures of 20 psi under maximum day plus fire flowconditions. The performance criteria were applied to all areas that fall within normal customer serviceelevation ranges for subzones. Customers outside of the normal service elevations were assumed tohave special service agreements with the <strong>District</strong>.4.4.2 Fire FlowsFire flow requirements apply to new developments that require m<strong>ai</strong>n improvements. Fire flowrequirements are based on requirements of the <strong>Contra</strong> <strong>Costa</strong> County Fire Protection <strong>District</strong> for newdevelopment. Heavy industrial users, such as the oil refineries in Martinez, are assumed to have theirown fire protection systems.Some areas of the distribution system were designed for less stringent requirements in place at the timeof development, and may not be capable of meeting current fire standards. The <strong>District</strong>’s policy is toupgrade the existing system in response to new developments, when replacing under-sized m<strong>ai</strong>ns thatare in poor condition, or when installing m<strong>ai</strong>n improvements for other purposes. Discussion with the<strong>Contra</strong> <strong>Costa</strong> County Fire Protection <strong>District</strong> indicates that 1,000 gpm is the minimum fire flow requiredfor residential homes in the Uniform Fire Code, and is generally adequate in older residential areasdesigned for lower fire flow standards. The 1,000 gpm criterion was used to identify deficient areaswithin the existing system. All improvements identified in the master plan were sized based on fire flowrequirements for new developments.Past master plans have evaluated multiple fires for subzone 11 (the largest subzone), assessingsimultaneous commercial and residential fires in the subzones. These evaluations indicated that thenumber and distribution of storage reservoirs in subzone 11 provide adequate protection forsimultaneous commercial and residential fires in the subzone. Therefore, multiple fires were notevaluated in the 2007 TWMP.4.4.3 Pipeline PerformanceThe <strong>District</strong> uses pipeline performance criteria (maximum velocities and headlosses) for sizing newpipelines. The criteria include maximum headlosses of 10 feet per 1000 feet of pipeline under non-fireconditions; maximum velocities of 10 feet per second under non-fire conditions; and, maximum velocitiesof 12 feet per second under maximum day plus fire conditions.Existing pipelines that exceed velocity or headloss criteria would not be deemed deficient, unless theyalso result in low pressures. <strong>Master</strong> plan improvements were sized using these velocity and headlosscriteria.4.4.4 System Reliability CriteriaThe <strong>District</strong> adopted system reliability criteria in 1997 as part of the Seismic and Reliability ImprovementProject. SRIP Report, Volume 3, Table 1.2 (included as Appendix B of this TWMP) summarizes thesecriteria. The criteria were designed to help the <strong>District</strong> establish goals for the continued operation ofcritical facilities and to m<strong>ai</strong>nt<strong>ai</strong>n public health and safety following a significant seismic event.Recommendations for improvements to meet the reliability criteria were identified in the SRIP. Theserecommendations were reviewed and integrated into the 2002 TWMP. Projects that have not yet beenimplemented have been carried over into this TWMP.A 2007 Treated <strong>Water</strong> <strong>Master</strong> <strong>Plan</strong> Update 4-3
Chapter 4System Performance Criteria4.4.5 <strong>Water</strong> Quality GoalsThe TWMP includes water quality goals based on water quality objectives adopted by the Board inSeptember 2006, and the <strong>District</strong>’s experience with distribution system water quality issues. <strong>Water</strong>quality problems, in particular nitrification, are dependent on a number of factors, such as systeminfrastructure, water chemistry, water age and water temperature. <strong>Water</strong> age plays a significant role andprovides a general indicator of the potential for water quality problems.<strong>Water</strong> age represents the overall age of water in the system (from the treatment plant to any given point),including travel through the system and detention in lower subzone reservoirs. In 2002, the hydraulicmodel was used to perform water quality calculations to evaluate overall water age within the distributionsystem. The 2002 TWMP incorporated a water age of 10 days at average day demand conditions as atarget age based on calculated total water age at reservoirs where the <strong>District</strong> has experienced lowturnover and/or has implemented structural and operational solutions. The target value of 10 daysmaximum water age was chosen based on <strong>District</strong> experience. Reservoirs with higher water ages than 10days were identified as candidates for improvements to increase reservoir turnover, if they do not alreadyhave water quality improvements. Since water age is considered only a general indicator of potentialwater quality problems, it was recommended that operational experience also be taken into account inprioritizing and implementing water quality improvements. Several water quality improvements wereincorporated into the 2002 TWMP and one project (a new pipeline from Taylor Reservoir to GregoryGardens PS) was completed.<strong>Water</strong> quality analysis was not performed as part of this <strong>Master</strong> <strong>Plan</strong>. However, projects not implementedsince the 2002 TWMP have been incorporated into the recommended improvements and are listed inTable 6-5. Additionally, a Preliminary Booster Disinfection Siting Study was completed in 2006, andrecommendations were made for chlorine booster stations. In 2008, the chlorine booster station at thePine Hollow Pump Station will be replaced.4-4 2007 Treated <strong>Water</strong> <strong>Master</strong> <strong>Plan</strong> Update A
Section 5System Analysis5. System Analysis2007 Treated <strong>Water</strong> <strong>Master</strong> <strong>Plan</strong> Update - Draft Report
Chapter 5System Analysis5.1 <strong>District</strong> Operations InputPrior to conducting the analysis, the TWMP team met with<strong>District</strong> operations staff to review current systemoperations and operational constr<strong>ai</strong>nts. The following keyissues were identified:• Operators currently operate Bollman High Lift PS onSan Miguel Reservoir level, rather than Diablo HillsReservoir level. Operators avoid closing the altitudevalve at San Miguel – m<strong>ai</strong>n breaks in older asbestoscementm<strong>ai</strong>ns in the vicinity of the reservoir wereattributed to high pressures with the altitude valveclosed. Operators have difficulty filling Diablo HillsReservoir under higher demands.• The booster pump station that is used to re-fillPleasant Hill Tank (overflow elevation of 237 feet,bottom elevation 206 feet) compared with normalsubzone 11 overflow of 220 feet) has been out ofservice for the past few years. The reservoir floats onthe zone gradient, so much of the reservoir storagevolume is not usable.• Ygnacio Pump Station is currently configured to drawsuction directly from Diablo Hills Reservoir, rather thanboth the reservoir and the system. This configurationwas implemented to increase reservoir turnover duringlower demand months. A re-chlorination station isplanned at the pump station. Operations staff wouldlike to increase the capacity of the pump station in thefuture, if feasible.• Transmission constr<strong>ai</strong>nts in subzone 51 inhibit the filling of Crystyl Ranch Reservoir. Operatorschecked for but did not identify any closed valves in the transmission lines between Clayton Valley PSand the reservoir. The operational constr<strong>ai</strong>nt influences water quality at the reservoir.All issues were investigated, and where feasible and cost effective, will be addressed by therecommended improvements.5.2 Pump Station AnalysisChapter Overview:This chapter describes the analysis toidentify system deficiencies for existing,intermediate and buildout conditions. Itincludes:• <strong>District</strong> Operations Input• Pump Station Analysis• Storage Analysis• Distribution System AnalysisHighlights• Identified deficiencies are consistentwith those identified in the 2002TWMP. Recommended improvementsto correct deficiencies are presentedin Section 6.• Operation of MPP to Zone 11 withinstallation of a pressure sust<strong>ai</strong>ningvalve station at the Antioch Turnout isrecommended once system maximumday demand approaches 80 mgd.Future service to Zone 21 will beevaluated in conjunction withpotential service to the Concord NavalWeapons Station. This will beperformed as a subsequentsupplement to the Treated <strong>Water</strong><strong>Master</strong> <strong>Plan</strong>.As described in Chapter 4, for subzones with storage reservoirs, pump stations must have a firm capacityequal to maximum day demand. For hydropneumatic subzones, pump stations must have a firm capacityequal to peak hour demand and must also be able to meet maximum day demand plus fire flows in thesubzone. Typically, hydropneumatic pump stations have separate pumps to meet normal demands andfire flows. Firm capacity is defined as the capacity with the largest pumping unit at the pump stationdesignated as a standby unit.Table 5-1 compares existing firm pumping capacity with required firm capacity for existing, intermediateand buildout demand conditions. For hydropneumatic subzones, pump station firm capacity is shown forpeak hour conditions.A 2007 Treated <strong>Water</strong> <strong>Master</strong> <strong>Plan</strong> Update 5-1
Chapter 5System AnalysisDischarge SubzoneTable 5-1Comparison of Existing and Required Pump Station CapacityExisting PumpingCapacity (mgd)Required Firm Pumping Capacity(mgd)Firm Capacity Needed(mgd)Total(mgd)Firm(mgd)Existing Intermediate Buildout Existing Intermediate Buildout11 (1) 145.9 100 81.3 90.8 96.9 -- -- --21 (1) 51.8 38.9 27.2 31.8 35.3 -- -- --22 21.1 11.3 8.1 8.3 9.0 -- -- --Subzone 21/22 Total (2) 72.9 50.2 35.3 40.1 44.3 -- -- --23 (6) 4.3 2.9 2.7 0.7 0.7 -- -- --25 5 3.3 3.0 3.2 3.3 -- -- --Subzone 23/25 Total (2) 9.3 6.2 5.7 3.9 4.0 -- -- --24 (5) 3.3 2.2 0.8 0.9 0.9 -- -- --31 23.5 18.8 17.4 21.5 24.8 -- 2.7 6.032 4.1 2.7 2.1 2.2 2.2 -- -- --33 (5) 0.9 0.6 0.6 0.6 0.6 -- -- --34 (7) 1.3 0.9 0.9 1 1.1 -- 0.1 0.235 0.9 0.6 0.1 0.2 0.2 -- -- --41 14.4 11.5 10.9 14.7 17.6 -- 3.2 6.144 1.7 0.9 0.9 0.9 0.9 -- -- --Subzone 41/44 Total (2) 16.1 12.4 11.8 15.6 18.5 -- 3.2 6.142 (3) (5) 5.5 3.7 3.0 3.3 3.4 -- -- --43 0.6 0.4 0.2 0.3 0.3 -- -- --51 (4) 13.9 10.1 7.7 11.3 14.1 -- 1.2 4.061 6.3 3.2 1.0 2.5 6.0 -- -- 2.863 2.2 1.4 0.9 1.0 1.0 -- -- --64 (5) 1.7 1.2 0.9 1.0 1.2 -- -- --71 6.3 3.2 0.7 1.8 4.5 -- -- 1.372 1.1 0.8 0.3 0.3 0.3 -- -- --73 (7) 0.7 0.4 0.4 0.5 0.5 -- 0.1 0.182 0.4 0.3 0.3 0.3 0.3 -- -- --83 (5) (7) 0.3 0.1 0.2 0.2 0.2 0.1 0.1 0.1Total 317.2 219.3 171.6 199.3 225.2 0.1 7.4 20.5Notes:(1) Subzone 11 demand includes Bay Point. Total pumping plant capacity is variable. Firm capacity based on existing WTP capacityfor Bollman WTP and Randall-Bold WTP. Pumping capacity does not include Pleasant Hill Pump Station. Calculations use MPP tosubzone 11 and Willow Pass PS to subzone 21. MPP is currently configured to serve subzone 21, and Willow Pass PS isdesignated standby.(2) Subzones hydraulically interconnected.(3) Subzone 42 includes Port <strong>Costa</strong> demand, delivered to Martinez intertie.(4) Includes planned pump being installed for Treated <strong>Water</strong> Facility Improvement Program as part of ongoing CIP.(5) Hydropneumatic subzone. Demand shown is peak hour demand.(6) Intermediate and buildout scenarios include re-location of Paso Nogal PS capacity to Country Club PS.(7) Hydraulic analysis, and operating data indicate that existing pumps can meet future needs in subzones 34 and 73. Hydraulicanalysis indicates that existing pumps can meet future needs in subzone 83. Operational data should be reviewed to confirm thisfinding.The table shows existing maximum day demand slightly exceeds firm pumping capacity in subzone 83,and that new pumping capacity is required. New capacity will be required for subzones 31, 34, 41, 51,61 and 73 by the intermediate scenario and for subzone 71 by buildout to satisfy future growth in thesesubzones.5-2 2007 Treated <strong>Water</strong> <strong>Master</strong> <strong>Plan</strong> Update A
Chapter 5System AnalysisThree subzones (34, 73, and 83) have small deficiencies ranging from 0.1 to 0.2 MGD. Additionalhydraulic analysis was conducted to determine if additional capacity is needed to rectify the smalldeficiencies.Subzone 34 is served by Arbolado Pump Station. Operating data from July 2001 shows that these pumpsare no longer operating on their manufacturer’s curves. During the 2002 model calibration, modeledpump curves were adjusted downward to match operating data. Even with these adjustments, modelresults indicate that pumps are operating at a higher flowrate and lower head than design conditions, andthat pump station firm production at buildout slightly exceeds subzone demands. Since the pumps areoperating at a higher flowrate than originally designed and can meet buildout demands, no additionalpumping capacity is recommended.Subzone 73 is served by the Oakhurst Pump Station. The pump station has a firm flow capacity of 0.4mgd at 160 feet of head. The hydraulic model indicates that pumps are operating with a higher flowoutput at a lower head, and can meet demands through buildout. Operating data from July 2001 isconsistent with this finding, showing the pumps are operating with a dynamic head of about 100 feet,compared with a design head of 160 feet. Since the pumps are operating at a higher flowrate thanoriginally designed and can meet buildout demands, no additional pumping capacity is recommended.Subzone 83 is served by the Irish Canyon Hydropneumatic Pump Station. The pump station has twopumps for normal operations and two pumps for fire service. The pump station firm flow capacity is 0.1mgd at 118 feet of head with one pump operating and one as a standby. The hydraulic analysis indicatesthat at buildout conditions, the pump is capable of producing 0.2 mgd at a dynamic head of 90 feet. Atthese head conditions, no additional pumping is required. No operating data were av<strong>ai</strong>lable to comparewith model performance. Confirmation of pump station operating performance is needed before a finalrecommendation can be made.5.3 Storage AnalysisReservoir storage volume is based on operational, fire and emergency storage needs for each subzone.The current <strong>District</strong> criterion is to provide storage equal to maximum day demand for operational (25percent of maximum day demand) and emergency (75 percent of maximum day demand) needs plus firereserve as described in Chapter 4. Table 5-2 summarizes storage needs using the current criterion. Asthe table shows, additional storage is required to meet the existing storage criterion for all subzonesexcept subzones 41/44, 72/83 and 73.Existing operational and fire suppression storage within each subzone comply with the criterion, butemergency storage does not. In subzones that do not meet the storage criterion, a total of 83 milliongallons of storage for existing conditions is necessary to conform to the current storage criterion. The<strong>District</strong> currently has 63 mg of total storage in these subzones. Therefore, approximately 20 milliongallons of storage would be required to bring the existing system into compliance with the currentcriterion at a cost of about $59M.Because of the high cost of required storage and potential impacts on customer water quality by addingsignificant storage volume in the system, the 2002 TWMP evaluated other ways to improve emergencyreliability to customers. The <strong>Master</strong> <strong>Plan</strong> developed a strategy to mitigate the current storage deficit byinvesting in a combination of cost-effective alternatives, including providing backup power at criticalpump stations and treatment facilities, the “hardening” of pipelines and facilities to withstand seismicevents and the ability to valve around f<strong>ai</strong>led pipelines. These improvements achieve a similar level ofemergency response reliability as adding storage, without the potential negative impacts on water quality.These alternative improvements are being implemented as an interim measure, in lieu of near-termstorage improvements. The <strong>District</strong>’s long-term goal rem<strong>ai</strong>ns to provide the full amount of storage toaddress operational, fire and emergency needs, based on the current <strong>District</strong> criterion.A 2007 Treated <strong>Water</strong> <strong>Master</strong> <strong>Plan</strong> Update 5-3
Chapter 5System AnalysisTable 5-2Comparison of Existing and Required Storage CapacityExistingStorage,Operational Storage, mg Emergency Storage, mg Fire Storage, mg (1) Storage Required, mg (2) Deficit, mgSubzone mg Existing Intermed. Buildout Existing Intermed. Buildout Existing Intermed. Buildout Existing Intermed. Buildout Existing Intermed. BuildoutSubzones with a storage surplus41/44 6.19 1.02 1.07 1.11 3.05 3.21 3.33 1.08 1.08 1.08 5.15 5.36 5.52 -1.04 -0.83 -0.6772/83 0.82 0.08 0.08 0.09 0.25 0.25 0.26 0.18 0.18 0.18 0.51 0.52 0.52 -0.31 -0.31 -0.2973 0.46 0.04 0.04 0.04 0.12 0.13 0.13 0.18 0.18 0.18 0.34 0.35 0.35 -0.12 -0.11 -0.11Total 7.47 1.14 1.20 1.24 3.42 3.59 3.72 1.44 1.44 1.44 6.00 6.23 6.40 -1.47 -1.25 -1.07Subzones with a storage deficit11/24 (4) 30.15 9.79 10.41 10.88 29.37 31.22 32.64 0.96 0.96 0.96 40.12 42.59 45.19 9.97 12.44 15.0421/22 13.22 4.21 4.40 4.54 12.62 13.19 13.63 1.08 1.08 1.08 17.91 18.67 19.25 4.69 5.45 6.0323/25/33 4.00 0.90 0.94 0.97 2.69 2.82 2.92 1.08 1.08 1.08 4.67 4.84 4.97 0.67 0.84 0.9731 5.18 1.44 1.52 1.58 4.32 4.55 4.73 0.54 0.54 0.54 6.30 6.61 6.85 1.12 1.43 1.6732/42 (5) 1.65 0.45 0.47 0.48 1.36 1.40 1.43 0.54 0.54 0.54 2.35 2.41 2.45 0.70 0.76 0.8034 0.58 0.17 0.19 0.20 0.52 0.56 0.59 0.54 0.54 0.54 1.23 1.29 1.33 0.65 0.71 0.7535 0.51 0.03 0.04 0.06 0.09 0.13 0.17 0.54 0.54 0.54 0.66 0.71 0.77 0.15 0.20 0.2643 0.42 0.06 0.07 0.08 0.17 0.21 0.23 0.54 0.54 0.54 0.77 0.82 0.85 0.35 0.40 0.4351/64 5.42 1.34 1.54 1.69 4.03 4.62 5.07 0.54 0.54 0.54 5.91 6.70 7.30 0.49 1.28 1.8861 0.5 0.08 0.17 0.38 0.25 0.54 1.15 0.54 0.54 0.54 0.87 1.55 2.07 0.37 1.05 1.5763 0.71 0.12 0.13 0.13 0.37 0.39 0.40 0.54 0.54 0.54 1.03 1.06 1.07 0.32 0.35 0.3669/71/79 0.46 0.17 0.08 1.12 0.50 0.25 3.35 0.54 0.54 0.54 1.21 3.35 5.01 0.75 2.89 4.5582 0.45 0.07 0.07 0.07 0.21 0.22 0.22 0.18 0.18 0.18 0.46 0.47 0.47 0.01 0.02 0.02 (3)Total 63.25 18.83 20.03 22.18 56.50 60.10 66.53 8.16 8.16 8.16 83.49 91.07 97.58 20.24 27.82 34.33Notes:(1) Fire storage based on the most critical in subzone (Residential: 1,500 gpm for 2 hours, Commercial/School: 3,000 gpm for 3 hours, Industrial: 4,000 gpm for 4 hours)(2) Storage required includes operational storage (25 percent MDD), emergency storage (75 percent MDD), and fire storage.(3) This is a very small deficiency, and improvements are not recommended.(4) Pleasant Hill Reservoir is excluded from subzone 11 storage volume totals, because the pump station used to re-fill the tank is currently not in operation. Storage requirement calculations do notinclude Bay Point in either operational storage calculations or emergency storage calculations, as Bay Point is assumed to have its own operational and emergency storage.(5) Deliveries to Martinez are made through the Elderwood Intertie (subzone 42), in exchange for Martinez service to Port <strong>Costa</strong>. Port <strong>Costa</strong> deliveries by exchange are not included in subzone 42 storagecalculations because the Port <strong>Costa</strong> system has its own storage.5-4 2007 Treated <strong>Water</strong> <strong>Master</strong> <strong>Plan</strong> Update A
Chapter 5System AnalysisThe emergency storage criterion of 75 percent of the maximum day demand assumes that the Bay Areamay be without power for up to three days following an emergency event. The emergency criterion wasbased on a 1982 study that predicted that virtually all of the Bay Area would temporarily be without powerfor up to 3 days following a major seismic event. It was assumed that 25 percent of maximum daydemand would meet essential needs during the 3 day period, and the criteria for emergency storage of75 percent maximum day demand was adopted.With a backup generator, the pumping capacity at a pump station that is supported by backup power canbe considered emergency storage capacity in the subzone served by the pump station, in lieu of providingthe storage in tanks. For those subzones with backup generators at pump stations, an emergency powercredit of 25 percent of the maximum day demand was considered part of the near-term storage capacity,i.e., 25 percent per day over three days for a total of 75 percent of the maximum day demand. Backupgenerators were assumed to be sized for firm capacity of the pump station. However, the emergencypower credit of 25 percent recognizes that pumped supply may not be as reliable as storage. In someinstances, smaller generators were actually installed. In these instances, the emergency storage creditwas reduced.For the existing scenario, the existing storage deficits shown on Table 5-2 were re-calculated to includethe emergency power credit for in-lieu storage. As shown on Table 5-3, this adjustment eliminated orreduced all existing deficits to less than approximately 0.5 mg, except in subzone 21/22, subzone 34 andsubzone 79/69. Near-term storage is recommended in subzones 21/22, 34 and intermediate storage insubzone 79/69:• Subzone 21/22: Ayers Reservoir (2.0 mg). This storage volume is more than the calculateddeficiency of 1.33 mg. Ayers Reservoir would be phased in with other northern backbonetransmission facilities, required for the intermediate scenario.• Subzone 34: 0.75 mg. This volume of storage meets needs through buildout.• Subzone 79/69: Divide Reservoir (0.5 mg). Although the storage deficit is 0.73, the Divide Reservoirsite can accommodate a 0.5 mg reservoir. Storage would be added as demands in the area growand water quality concerns can be mitigated. Additional long-term storage is also required for thissubzone, and is included in the list of capital projects in Section 6.Table 5-3Adjusted Storage Deficits Considering Backup PowerSubzone Existing Deficit, mg Emergency Power Credit (1) , mg Adjusted Existing Deficit, mg11/24 (2) 9.97 9.79 0.1821/22 (3) 4.69 3.36 1.3323/25/33 0.69 0.90 --31 (3) 1.12 1.39 --32/42 0.70 0.45 0.2534 0.65 -- 0.6535 0.15 -- 0.1541/44 (3) -- 0.68 --43 0.35 -- 0.3551/64 0.50 1.34 --61 0.39 0.08 0.3163 0.33 0.12 0.2179/69 0.73 -- 0.7372/83 -- -- --73 -- -- --82 0.01 -- 0.01Total 20.29 18.11 3.45(1) Emergency power credit is 25 percent of maximum day demand.(2) Pleasant Hill Reservoir excluded from storage calculations since pump station used to re-fill the reservoir is out ofservice, and reservoir capacity is currently not being utilized.(3) Installed generator capacity is less than firm capacity of pump station, so emergency power credit is reduced.A 2007 Treated <strong>Water</strong> <strong>Master</strong> <strong>Plan</strong> Update 5-5
Chapter 5System Analysis5.4 Reliability AnalysisThe <strong>District</strong> has committed to a combination of pumping, pipeline and storage improvements to improvesystem reliability during emergencies. The 2002 TWMP started with reliability improvements recommended inthe Seismic and Reliability Improvement Project, and incorporated additional projects to supplement these.Recommended improvements in the 2002 TWMP included the installation of:• Backup generators at nine pump stations.• Seismic isolation valves at eleven reservoirs.• Nine fault crossing connections for 24-inch and larger pipelines that cross the Concord Fault.Many of the reliability improvements recommended in the 2002 TWMP have been implemented. Tables 5-4through 5-6 summarize the status of these improvements. Improvements not yet implemented have beenincorporated into the current TWMP list of recommended capital improvements.Priority in 2002TWMPTable 5-4Backup Generators Installed Since the 2002 Treated <strong>Water</strong> <strong>Master</strong> <strong>Plan</strong>Pump Station Site(subzone served)Av<strong>ai</strong>lablePumpingCapacity (mg)Generator Capacity(kW)Type of GeneratorHigh Lime Ridge (21/22) 11.5 400 PermanentHigh San Miguel (21/22) 8.4 300 PermanentHigh B<strong>ai</strong>ley (31) 14.4 450 PermanentHigh Clayton Valley (51) 7.2 300 PermanentHigh Pine Hollow (41) 5.8 150 PermanentHigh Gregory Gardens (23) 1.4 150 PermanentMedium Paso Nogal/Country Club (32) 2.7 100 PortableMedium Eagle Peak (62) (1) - PortableGenerators Not Yet InstalledMedium Seminary (61) (2) - PortableTotal Capacity 51.4 1,850Notes:(1) Eagle Peak Pump Station is to be served by existing portable generators.(2) Seminary Pump Station will be rehabilitated in FY09 and a portable generator will be included in the project.5-6 2007 Treated <strong>Water</strong> <strong>Master</strong> <strong>Plan</strong> Update A
Chapter 5System AnalysisTable 5-5Isolation Valves Installed Since the 2002 Treated <strong>Water</strong> <strong>Master</strong> <strong>Plan</strong>Reservoir Location (Subzone) Volume, MG Subzone Diameter, Priority in 2002 TWMPinchesTaylor (11) 7.5 11 24 HighLime Ridge I and II (11) 10 11 36 HighB<strong>ai</strong>ley I and II (21) 6.5 21 24 HighKirker Pass (41) 3 41 24 HighClayton Valley (41) 2 41 24 LowValves Not Yet InstalledSan Miguel (11) 4 11 36 LowCanterbury (21) 1.5 21 12 LowMidhill (25) 1.5 25 12 LowNorthgate (34) 0.61 34 12 LowOakhurst (63) 0.75 63 12 LowDivide (71/79/69) 0.5 71 12 LowTable 5-6Fault Crossing Connections Installed Since the 2002 Treated <strong>Water</strong> <strong>Master</strong> <strong>Plan</strong>PipeDiameter,Subzone inches Priority Approximate Location (1)11 30 High South of Highway 4 near Walnut Creek11 36 High Feed line to San Miguel Reservoir near <strong>Contra</strong> <strong>Costa</strong> Canal11 20 High Clayton Road Near Amador AvenueFault Crossing Connections Not Yet Installed11 24/42 (Not Yet On Treat Boulevard near <strong>Contra</strong> <strong>Costa</strong> CanalInstalled)11 36 Low Near corner of Systron Drive and San Miguel11 24 Low Near Bisso Lane and Stanwell Drive11 24 Low Near corner of Market Street and Concord Avenue22 24 Low Near <strong>Contra</strong> <strong>Costa</strong> Canal and Newhall ReservoirNotes:(1) Locations are based on a reconn<strong>ai</strong>ssance level review of the Concord fault zone and the distribution system.In addition to these improvements, implementation of Phase 2 and 3 of the Port Chicago Pipeline asnear-term improvements was also recommended, to complete the backbone transmission m<strong>ai</strong>n throughthe eastern side of subzone 11.5.5 Multi-Purpose Pipeline AnalysisThe Multi-Purpose Pipeline (MPP), originally designed to deliver water to subzone 11, is currentlyconfigured to serve subzone 21, due to near-term hydraulic issues associated with low flows. Thisconfiguration is an interim configuration, and improvements will be required for reliable long-termoperation of the MPP. This TWMP update assessed long-term options for the MPP, building on a <strong>District</strong>study completed in December 2005 (<strong>CCWD</strong>, 2005). A summary of the evaluation is presented in thissection. More det<strong>ai</strong>ls of the evaluation are presented in Appendix D.A 2007 Treated <strong>Water</strong> <strong>Master</strong> <strong>Plan</strong> Update 5-7
Chapter 5System AnalysisThe MPP was completed in 2003 based on the design requirement of delivering up to 25 MGD to the<strong>District</strong>’s TWSA subzone 11. The pipeline is called multi-purpose because it can serve treated water toboth the TWSA, <strong>Contra</strong> <strong>Costa</strong> Canal or Randall-Bold WTP in the event of an outage or emergency. In theevent of a regional disaster, such as a large earthquake, the pipeline is also designed to connect up toone of the <strong>District</strong>'s raw water sources to provide water for fire fighting.Operational complications encountered during start-up testing in 2003 required the <strong>District</strong> to evaluatealternatives for MPP service to the TWSA. Pumps were designed for a very conservative subzone 11gradient, based on maximum day buildout conditions. Under lower demand conditions, or reverse flowconditions (TWSA to Randall-Bold WTP), the hydraulic grade line (HGL) is too low to reliably deliver waterto Antioch or to m<strong>ai</strong>nt<strong>ai</strong>n a minimum pressure of 5 psi at the pipeline highpoint, as required by Title 22 ofthe California Code of Regulations.As an interim measure, the <strong>District</strong> re-zoned the subzone 11 Port Chicago Phase 1 Pipeline to subzone21, and installed a bypass at Willow Pass PS, to allow delivery of MPP water to subzone 21. This interimoperational configuration has mitigated all of the above identified problems. The only negative impactfrom this operation is that the re-zoning of the Port Chicago Phase 1 Pipeline to subzone 21 has reducedtransmission capacity in subzone 11, consequently increasing discharge pressures at the Bollman HighLift Pump Station. A hydraulic analysis of the existing maximum day scenario found that this scenario isthe upper limit of operation in the interim configuration. Demand in this upper limit scenario is 81 mgd,which is about 14 percent higher than the actual 2006 maximum day production of 71 mgd.Potential deliveries from the MPP to the CNWS were estimated for maximum day buildout conditions, withthe MPP configured to subzone 11 (Options A and B), and to subzone 21 (Option C). MPP PS wasmodeled as a constant inject and CNWS deliveries were modeled as a constant takeout, at Bates Avenueand Port Chicago Highway. The analysis found that for Options A and B, a maximum delivery of 24 mgdis feasible, and for Option C, a maximum delivery of 17 mgd is feasible. Maximum flowrates are dictatedby m<strong>ai</strong>nt<strong>ai</strong>ning operating pressures that don’t exceed the design pressure of the pipeline, which rangesfrom 200 psi to 300 psi. Once planning information becomes av<strong>ai</strong>lable on CNWS development options, amore det<strong>ai</strong>led hydraulic evaluation will be conducted to evaluate conceptual alternatives for service to theCNWS.Table 5-7 summarizes the three long-term alternatives identified and evaluated. The table includes adescription of required components, and estimated capital and life-cycle costs. Energy costs for pumpingMPP directly to subzone 21 (Option C) are somewhat lower than pumping MPP to Subzone 11 (Options Aand B), and then boosting water to subzone 21 through existing TWSA pump stations because the <strong>District</strong>has a contract to receive Western Area Power Association/Modesto Irrigation <strong>District</strong> power at theRandall-Bold WTP, while TWSA pump stations are served by PG&E. 1 The bottom portion of the tablesummarizes pros and cons of each alternative.5.5.1 RecommendationsBased on the hydraulic, cost and implementability analyses, Option A, construction of the pressuresust<strong>ai</strong>ning valve station at the Antioch turnout is recommended. This project has an estimated capitalcost of $0.9M.Because of its potential for coordination both with the CNWS and the proposed northern backbone in theConcord-Clayton Valley, Option C should be re-visited as part of the CNWS evaluation, which will beprepared as a supplement to this <strong>Master</strong> <strong>Plan</strong>. The current planning schedule for the CNWS is to identifypotential development alternatives by fall 2007, and select specific alternatives for environmental1 A blended rate of $0.085/kwh was used for WAPA/MID power and a blended rate of $0.125/kwh was used for PG&Epower. Blended rates reflect a composite of seasonal energy charges, demand charges and other charges.5-8 2007 Treated <strong>Water</strong> <strong>Master</strong> <strong>Plan</strong> Update A
Chapter 5System Analysisanalysis. Once potential CNWS development alternatives are identified, a supplement to this TWMP willbe prepared, evaluating potential service to the CNWS.Table 5-7Summary of Long-Term Alternatives for MPP Service to TWSAOption A: Service To Subzone 11 Option B: Service to Subzone 11 with Option C: Service to Subzone 21with PR Station at Antioch Turnout Booster Station at Antioch TurnoutRequired Improvements:• Install 25 mgd pressuresust<strong>ai</strong>ning valve station atAntioch Turnout• Microtunnel 900 feet of pipeline atRidgeline Drive, to lower pipeline• Replace pump impellers for improvedlow-flow performance• Install a 10 mgd booster pump stationat the Antioch Turnout• Install approximately 16,000feet of new 36-inch diameterpipeline to connect MPP toSubzone 21• Return Port Chicago Phase 1PL to subzone 11 serviceEstimated Capital Costs (Million $) (1)$0.9 $8.8 $18.7 – 20.3Estimated Annual Energy Costs (Million $)$1.1 $1.1 $0.8Estimated Present Worth Life-Cycle Costs (Million $)$23 $34 $43 – 45Alternative Pros and ConsPro:• Lowest capital and operationalcost• Easiest to implement• Higher potential flowrate toCNWS than Option C.Con:• Requires continuous operationof MPP pump to serve Antioch• Requires at least 3 pumpsoperating at Bollman High LiftPS to supply Randall-Bold WTPclearwell and m<strong>ai</strong>nt<strong>ai</strong>n 5 psi athigh point.Pro:• More flexibility to supply Randall-BoldWTP than Option A.• Higher potential flowrate to CNWS thanOption CCon:• Less flexibility to supply Randall-BoldWTP than Option C• Highest operational cost(1) Low and high cost for Option C based on possible alignment alternatives for pipeline. See text for det<strong>ai</strong>ls.Pro:• Opportunity to coordinateproject with potentialdevelopment at ConcordNaval Weapons Station• Most flexibility to supplyRandall-Bold WTPCon:• Highest capital cost• Longest implementation time• Lower flowrate to CNWS thanOptions A and B.5.6 Distribution System AnalysisHydraulic evaluations were performed to assess distribution system performance and to identifynecessary system improvements. The analysis included the following modeling scenarios to assesssystem performance:• Fire flow scenario for existing system maximum demand day to assess av<strong>ai</strong>lable fire flow, and identifyimprovements where fire flows are less than 1,000 gpm.• Extended period (hour-by-hour) hydraulic simulations on the maximum demand day to evaluatesystem pressures and reservoir re-fill for existing, intermediate and buildout planning scenarios.A 2007 Treated <strong>Water</strong> <strong>Master</strong> <strong>Plan</strong> Update 5-9
Chapter 5System Analysis5.6.1 Maximum Flow ScenariosThe distribution system was evaluated for its ability to meet maximum day demands plus fire flow at alldemand junctions within each subzone. A comprehensive fire flow analysis was performed, evaluating allmodel junctions with demands. As noted in Chapter 4, <strong>District</strong> policy is to upgrade the system inresponse to new development. Some areas of the distribution system were designed for less stringentrequirements in place at the time of development, and may not be capable of meeting current firestandards. Discussions with the <strong>Contra</strong> <strong>Costa</strong> County Fire Protection <strong>District</strong> indicate that 1,000 gpm isgenerally adequate in older residential areas, designed for lower fire flow standards. Therefore, the1,000 gpm criterion was used to identify deficient areas within the system. All improvements identifiedwere sized based on fire flow requirements for new developments, as described in Chapter 4.The model user specifies which model junctions are to be tested, and provides a pressure criterion thatmust be m<strong>ai</strong>nt<strong>ai</strong>ned within the pressure zone while flowing the hydrant. The model then runs multiplesimulations, testing each junction in succession, reporting on the av<strong>ai</strong>lable flow at the junction whilem<strong>ai</strong>nt<strong>ai</strong>ning the minimum pressure throughout the zone. A minimum pressure of 20 psi was used for theanalysis. Fire flows for non-residential land uses, which have higher flow requirements, are typically metusing multiple hydrants. The methodology used does not allow the selection of multiple hydrants forsimultaneous testing. Therefore, while av<strong>ai</strong>lable fire flows were also reported for non-residential areas,the results somewhat understate fire flow av<strong>ai</strong>lability, since multiple hydrants would be used.Static model runs were performed under the existing maximum day demand scenario (81 mgd) withreservoirs set to 75 percent full (bottom of normal operating zone) 2 and with pumps supplying the zoneturned off, with the exception of Bollman High Lift PS, the MPP PS and pumps serving hydropneumaticsubzones. All junctions with demands were tested, with the assumption that demand nodes representlocations in developed areas within the normal customer service elevations within a pressure zone. GIStools were then used to intersect the junction locations with the land use map to identify type of land useserved by the junction.After initial assessments of av<strong>ai</strong>lable flow were made, deficient locations were reviewed in more det<strong>ai</strong>lusing the hydraulic model. This additional analysis included adding smaller diameter pipeline loopswhere appropriate; excluding short cul-de-sac locations, where hydrants may not be present or could besupplemented with hydrants on adjacent streets; and, reviewing current uses and identifying areas thatare part of proposed re-development plans or have future improvements for other reasons. After thesesteps, areas where fire flows were still less than 1,000 gpm were identified for improvement.Figure 5-1 shows the results of the model testing. Junctions with av<strong>ai</strong>lable flows between 1,000 gpm and1,500 gpm are shown in light blue. Junctions with av<strong>ai</strong>lable flow less than 1,000 gpm are shown in red.Locations where fire flows are less than 1,000 gpm are reported in Table 5-8. Complete tabular results ofthe fire flow analysis are included as Appendix E.2 Pleasant Hill Reservoir is at higher elevation than other Zone 11 reservoirs, and the booster pump station that suppliesthe reservoir is currently not in use. Therefore, the reservoir was set to a level corresponding to 75 percent full in othersubzone 11 reservoirs.5-10 2007 Treated <strong>Water</strong> <strong>Master</strong> <strong>Plan</strong> Update A
Ave.ConcordMorgan Territory Rd.Marsh Marsh Creek Rd.Kirker Pass Rd.Multi-Purpose Pipeline PipelineB<strong>ai</strong>ley Rd.Clayton Rd.Willow Pass Rd.Valley Rd.YgnacioOak Grove Rd.Hwy 680Z33Hwy 4 4Z25Z42Z32Hwy 242CONCORDHwy 680Market St.Z23Z11PLEASANTHILLHwy 680WALNUTCREEKZ22Z24Z21Z44Z43Z34Z35Z31Z64Z41CLAYTONZ63Z73Z51PITTSBURGZ82Z72Z83Z61ANTIOCHZ79Z69Figure 5-1Fire Flow Av<strong>ai</strong>lability in the Distribution SystemZ71NHwy 24Hwy 680W:\REPORTS\<strong>CCWD</strong>\<strong>Master</strong> <strong>Plan</strong>_Apr07\Figures\Fire Flow Av<strong>ai</strong>lability in the Distribution System_Fig5-1.<strong>ai</strong> 06/27/07 JJTLegendModeled PipelineAv<strong>ai</strong>lable Flow
Chapter 5System AnalysisTable 5-8Locations with Maximum Flow DeficienciesJunction ID Zone Location Land Use Type Av<strong>ai</strong>lable FlowNotes(gpm)12038 11 Lane Dr. (1) Residential,Commercial960 BART m<strong>ai</strong>ntenance yard.Improvements addressed in Table 6-4.13792 11 Via <strong>Plan</strong>eta, off Via Estrella Residential 815 Uniform Fire Code (UFC) requiresminimum of 1,000 gpm for residentialsingle family homes. Improvementsaddressed in Table 6-4.13810 11 End of Arthur Road Residential 805 Uniform Fire Code (UFC) requiresminimum of 1,000 gpm for residentialsingle family homes. Improvementsaddressed in Table 6-4.69024 69 Unnamed St. off MarshCreek Rd.69002 69 Marsh Creek Rd. at RoyalOaks Dr.79002 79 Morgan Territory Rd. atLeon Dr.Commercial 1370 Part of Marsh Creek Specific <strong>Plan</strong>.Fire flow deficiencies will beaddressed as development occurs inthe area. Future improvementsaddressed in Table 6-4.Residential 860 Part of Marsh Creek Specific <strong>Plan</strong>.Fire flow deficiencies will beaddressed as development occurs inthe area. Future improvementsaddressed in Table 6-4.Residential 600 Part of Marsh Creek Specific <strong>Plan</strong>.Fire flow deficiencies will beaddressed as development occurs inthe area. Future improvementsaddressed in Table 6-4.(1) This is the only location that was not also identified in the 2002 TWMP due to the more comprehensive fire flow analysis in this TWMP.5.6.2 Normal OperationsExtended period simulations were performed to evaluate distribution system performance on themaximum demand day. Pumps were operated based on reservoir levels using set point data for currentsummertime operations. For the extended period simulation, the model was run on an hourly time stepfor three consecutive maximum days to evaluate system operating trends.Because the current TWSA demand projections have changed very little from the 2002 TWMP demandprojections, only the existing scenario was analyzed without any improvements. For the buildout andintermediate scenario used for phasing, improvements identified in the 2002 TWMP were used as astarting point, and additional adjustments made as needed. Different scenarios were also evaluated toassess how MPP long-term operation to Zone 21 affects required distribution system improvements.System pressures, pump operations and reservoir filling characteristics were reviewed to identify areaswhere pumps were operating back on their curves, pump discharge pressures were high and/orreservoirs were not operating within the top 25 percent of their volume, indicating that emergency or firestorage was being used for maximum day operations.General FindingsFindings were generally consistent with the 2002 TWMP. Figure 5-2 shows improvements identified bythe analysis. Changes from the 2002 TWMP are highlighted. Changes in facility sizing are shown inyellow. Changes in phasing of facilities are shown in blue. Other findings from the analysis are describedin the bullets below. Recommended improvements are discussed in Chapter 6.A 2007 Treated <strong>Water</strong> <strong>Master</strong> <strong>Plan</strong> Update 5-11
Chapter 5System Analysis• With the current strategy of operating Bollman High Lift PS on San Miguel level, Diablo Hills Reservoir,which is furthest south in the zone, operates at lower levels than the normal operating range of 75percent full or higher. Although re-configuration of the piping at the reservoir to allow the reservoir tofloat on the system improved filling, normal operating levels could not be m<strong>ai</strong>nt<strong>ai</strong>ned withoutoperating Bollman High Lift PS on Diablo Hills Reservoir level. Based on the analysis, it wasdetermined that expansion of Ygnacio PS would not be feasible, as it would exacerbate operatingproblems at Diablo Hills Reservoir.• In the 2002 TWMP, additional pumping capacity was recommended at both Kirker Pass PS andClayton Valley PS at buildout. Both pump stations would need to be operated on Seminary Reservoirlevel to m<strong>ai</strong>nt<strong>ai</strong>n adequate levels in Seminary Reservoir. In this operating configuration, the hydraulicgradient in the vicinity of the Kirker Pass PS is high enough that East Reservoir rem<strong>ai</strong>ns full. In thisTWMP, all pumping improvements were shifted to Clayton Valley PS, and the future 20-inch diameterpipeline from the pump station to Seminary Reservoir was upsized to 30-inch. With theseimprovements, Kirker Pass PS would not need to be expanded.• The hydraulic analysis did not confirm system hydraulic constr<strong>ai</strong>nts that affect the filling of CrystylRanch Reservoir. The reservoir is closer to Clayton Valley PS than other Zone 51 reservoirs, and isserved by 16-inch and 12-inch diameter transmission m<strong>ai</strong>ns. Hydraulic constr<strong>ai</strong>nts in yard piping,and at the reservoir altitude valve should be investigated.• Buildout demands in subzone 51 are higher than in the 2002 TWMP. As a result, someimprovements in subzone 51 designated for buildout in the 2002 TWMP are required by theintermediate scenario.Specific Findings - Existing Scenario• The Port Chicago Phase 1 pipeline will need to be re-zoned to subzone 11 by the time demandreaches 81 mgd.• The Port Chicago Phase 2 extension to Lime Ridge Reservoir is also required for subzone 11 toensure that the system has adequate hydraulic capacity to refill southern reservoirs on the maximumdemand day.Specific Findings – Intermediate Scenario• Additional pumping and transmission capacity is required for subzones 31 and 41. Previous studiesidentified a new northern backbone transmission for subzones 21, 31 and 41, which was used forthis evaluation. Potential for coordination of these facilities with potential development on the CNWSwill be investigated in a supplemental analysis to be performed once re-use scenarios are identifiedfor the CNWS.• Additional pumping and transmission capacity is required for subzone 51. This pumping andtransmission was identified as needed by buildout in the 2002 TWMP.• Additional transmission capacity is needed near Shell Ridge Reservoir to alleviate a hydraulicbottleneck, and for re-fill of Shell Ridge Reservoir.• Additional storage is required for subzones 31 and 51 to m<strong>ai</strong>nt<strong>ai</strong>n operating levels within the top 25percent of storage volumes. Additional storage was sited at Myrtle Reservoir (subzone 31) andSeminary Reservoir (subzone 51).5-12 2007 Treated <strong>Water</strong> <strong>Master</strong> <strong>Plan</strong> Update A
0NFeet8,000’Hwy 680PITTSBURGBollman WTPBollman High LiftPump StationZ23/25 (TBD)Hwy 4Willow Pass Rd.B<strong>ai</strong>ley Rd.Z32 (TBD)PLEASANTHILLPleasant HillHwy 24Hwy 680 680Hwy 680Ave.ConcordWALNUTCREEKMarket St.Hwy 242CONCORDZ11 (TBD)Oak Grove Grove Rd.Valley Rd.YgnacioValley VistaZ34 (TBD)Arbolado PSZ44 (TBD)Z35 (TBD)Z21/22 (TBD)Clayton Rd.AyersZ64Z43 (TBD)Rancho Par<strong>ai</strong>soMyrtleZ63 (TBD)Eagle Peak PSMulti-Purpose PipelineANTIOCHZ33Z25MidhillSun TerraceZ24Z42ElderwoodZ23Z32TaylorCountry ClubPaso NogalZ11Gregory GardensYgnacio PSDiablo HillsZ22Shell RidgeCastle RockWillow Pass PSZ21Lime RidgeCanterburySan MiguelCowell RanchZ44Comistas PSSand QuarryNewhallZ35B<strong>ai</strong>leyZ43North Gate PSZ34Z31Keller RanchZ41Pine HollowPowerlineCLAYTONClubhouse PSClayton ValleyCrystyl RanchKirker PassEastMurchioZ51Z63Kirker Pass Rd.Z73OakhurstIrish CanyonSeminaryZ82Z72Z83Z61Nob HillMarsh Marsh Creek Rd.Z71DivideMorgan Territory Rd.Z79Z69LegendZ##(TBD)Randall Bold WTPMulti-PurposePipeline PSValve Stationat Antioch TurnoutModeled PipelineProposed ImprovementsPump StationProposed Pump StationDistribution ReservoirProposed Distribution Reservoir<strong>Water</strong> Treatment <strong>Plan</strong>tPressure Regulating StationZone IdentifierSite to be DeterminedNew Improvement (Not in 2002 TWMP)Improvement Size ChangePhase ChangeHwy 680 680W:\REPORTS\<strong>CCWD</strong>\<strong>Master</strong> <strong>Plan</strong>_Apr07\Figures\<strong>CCWD</strong> Distribution System Improvement Needs_Fig5-2.<strong>ai</strong> 06/12/07 JJTFigure 5-2Distribution System Improvement Needs
Chapter 5System AnalysisSpecific Findings – Buildout Scenario• Port Chicago Pipeline Phase 3 extension from Lime Ridge Reservoir to San Miguel Reservoir isrequired for subzone 11 to re-fill southern reservoirs. Although not required until buildout based onsystem hydraulics, the Port Chicago Pipeline enhances system reliability by providing a backbonetransmission system as recommended in the SRIP. Therefore, the Port Chicago Pipeline Phase 3 isrecommended as a near-term improvement.• Additional storage is required for subzones 61 and 71 to m<strong>ai</strong>nt<strong>ai</strong>n storage levels within the top 25percent of reservoir volume.• Additional pumping and transmission capacity is required for Zones 61, 71, 79 and 69.Additional Findings/Recommendations• Re-habilitation of Pleasant Hill PS is recommended, to fully utilize storage in Pleasant Hill Reservoir.A capital project has been included for this item, and is recommended as a near-term improvement.• Under peak demand conditions, valving at Ygnacio PS/Diablo Hills Reservoir should be configured toallow Diablo Hills Reservoir to float on the system, to facilitate re-fill of the reservoir.• In the future, operation of Bollman High Lift PS on Diablo Hills Reservoir level will be required underpeak demand conditions to adequately re-fill the reservoir. Pressure relief should be considered atSan Miguel Reservoir, to allow closure of the altitude valve to r<strong>ai</strong>se the gradient above the reservoiroverflow, but to control maximum pressures allowed. The site configuration and piping would need tobe reviewed to identify a discharge point for the relief valve.• Yard piping and the altitude valve operation at Crystyl Ranch Reservoir should be investigated toidentify potential hydraulic bottlenecks that inhibit reservoir filling.• Portions of the <strong>District</strong> have wharf-style fire hydrants, which have lower flow capacity than standardhydrants. Review/replacement of these hydrants should be coordinated with pipeline improvementprojects.A 2007 Treated <strong>Water</strong> <strong>Master</strong> <strong>Plan</strong> Update 5-13
Section 6Recommended Improvements,Costs and Phasing6. RecommendedImprovements, Costsand Phasing2007 Treated <strong>Water</strong> <strong>Master</strong> <strong>Plan</strong> Update - Draft Report
Chapter 6Recommended Improvements, Costs and Phasing6.1 Methodology for DevelopingImprovement Sizes and Costs6.1.1 Approach to Developing ImprovementsImprovements were developed to correct deficienciesidentified in the analysis of the distribution systempresented in Chapter 5. To determine sizing attributableto current system needs versus future system growth,pipeline improvements required for the existing scenariowere sized first for existing needs, and then re-sized forthe buildout scenario. The following assumptions wereused in developing capital improvements:• Pipeline improvements were sized to conform tostandard pipeline diameters: 8, 12, 16, 20, 24, 30,36, 42 and 48 inches. No improvements were sizedless than 8-inch diameter.Chapter Overview:This chapter presents recommendedimprovements, their phasing and costs.Improvements are identified to correctexisting deficiencies and for future growth.The chapter describes the:• Methodology for DevelopingImprovement Sizes and Costs• Recommended Improvements, Cost andPhasing• Capital Improvement ProgramHighlights:• The total cost for recommended capitalimprovements is $169M. Costs areconsistent with the 2002 TWMP and theTen Year Capital Improvement Programfor Fiscal Years 2008 - 2017.• Previous <strong>Master</strong> <strong>Plan</strong>s identified a new transmissionproject for subzones 21, 31 and 41 on the northern side of the Concord-Clayton Valley to provide newpumping and transmission capacity and partial redundancy to the current backbone transmissionsystem on the south side of the valley. This concept was ret<strong>ai</strong>ned. Potential coordination withproposed development on the former Concord Naval Weapons Station (CNWS) will be evaluated in asupplement to this <strong>Master</strong> <strong>Plan</strong>, once planning information for potential development options at theCNWS is av<strong>ai</strong>lable.• The 2002 Treated <strong>Water</strong> <strong>Master</strong> <strong>Plan</strong> identified several reliability and water quality improvements.Projects identified in the 2002 plan but not yet implemented have been carried forward to this<strong>Master</strong> <strong>Plan</strong>.• Inlet/outlet pipelines and seismic valves required for storage reservoir projects are included witheach individual reservoir project.• Valves and piping required for water quality improvements are included with pipeline improvements.• Existing tanks requiring replacement at the end of their useful lives will be designed to meet currentstorage criteria. The cost of meeting existing deficiencies for these tanks is included in the <strong>Master</strong><strong>Plan</strong>.6.1.2 Basis for Estimating and Allocating CostsCosts were estimated for each system improvement and are presented in Section 6.2. This sectionsummarizes the cost estimating approach. Det<strong>ai</strong>ls of the approach, including det<strong>ai</strong>led cost breakdowntables for pipelines, reservoirs and pump stations, are presented in Appendix F.All costs for the current TWMP update are based on the November 2006 Engineering News Record (ENR)Construction Cost Index (CCI) of 9,123 for the San Francisco Bay Area. Pipeline construction costs haveoutpaced CCI trends, especially for larger-diameter pipelines. Pipeline unit costs were developed basedon recently completed <strong>District</strong> projects, other utility construction estimates, and CDM’s recentconstruction division experience in pipeline cost trends. Based on this review, pipeline unit costs rangeA 2007 Treated <strong>Water</strong> <strong>Master</strong> <strong>Plan</strong> Update 6-1
Chapter 6Recommended Improvements, Costs and Phasingfrom 30 to 60 percent higher than 2002 TWMP construction costs. Pump station and reservoir costshave also outpaced CCI trends, and unit costs were updated by approximately 50 percent from 2002TWMP construction costs, based on the <strong>District</strong>’s experience with escalation in reservoir and pumpstation projects. The CCI change from 2002 to 2007 has been less than 20 percent.Construction costs were based on the following assumptions:• All new reservoirs will be buried concrete type, and will require land acquisition.• Pipeline costs to connect new reservoirs to the distribution system were included in the estimatedcost for the reservoir facilities. The cost of required seismic valves is included with each individualreservoir project.• Pump station building costs are based on a 1,000 square foot building, and estimated at $185,000per new facility, based on a unit cost of $185 per square foot. New pump stations will require landacquisition.A 30 percent construction contingency was applied to base construction costs to develop total facilitiesconstruction costs, to account for unforeseen construction costs not anticipated in a planning levelevaluation. A 35 percent implementation multiplier was applied to total facilities construction costs todevelop a project capital cost. The project implementation multiplier includes planning, environmental,design, construction management, legal and other miscellaneous costs. Costs for land acquisition wereincluded for new facility sites, and were added to the total project capital cost without applying aconstruction contingency or implementation multiplier.Costs for improvements were allocated to existing and future customers, based on whether they meetexisting deficiencies, or are required for future growth. For improvements solely to mitigate existingsystem deficiencies, all costs are allocated to existing users. For improvements solely for future growth,all costs are allocated to future users. For projects that are needed both to correct existing systemdeficiencies and meet future growth, costs were split between existing and future users. The costallocation methodology for projects that serve both existing and future customers was based on anapproach in which costs are allocated proportionately to capacity needs at existing and future conditions.The capacity increase needed for future customers is obt<strong>ai</strong>ned by subtracting capacity required to serveexisting customers from the total capacity required at buildout. Pipeline costs were proportioned basedon the ratio of cross-sectional area, between the pipeline diameters required for existing and futureconditions, because area directly relates to the capacity of the pipeline.6.2 Recommended Improvements, Costs and Phasing6.2.1 SummaryTable 6-1 summarizes improvement costs for the <strong>Master</strong> <strong>Plan</strong>. Figure 6-1 depicts requiredimprovements, and the phasing for implementation of improvements. Improvements were identified tomitigate existing system deficiencies, and to meet future growth through buildout, estimated to be 2030.The buildout maximum day system demand is 97 mgd. An intermediate scenario, estimated to be 2020,was also used to assist in the phasing of recommended improvements and to provide input into the<strong>District</strong>’s Capital Improvement Program.The total cost of recommended improvements is approximately $169M. Of this amount, $79M isrequired to correct existing deficiencies and $90M is for growth. Of the $79M in existing deficiencies,$65M is required for storage improvements, $10M for pipelines, $2M for reliability improvements, and$2M for pump station improvements. Of the storage improvements, $59M is needed to correct existingstorage deficiencies, which have been deferred by the installation of backup power at key pump stations,providing a similar level of service. As a result, these storage improvements would not be required for6-2 2007 Treated <strong>Water</strong> <strong>Master</strong> <strong>Plan</strong> Update A
Hwy 6800NFeet8,000’Multi-Purpose PipelinePITTSBURGBollman WTPBollman High LiftPump StationANTIOCHZ23/25 (TBD)MidhillHwy 4Sun TerraceWillow Pass Rd.B<strong>ai</strong>ley Rd.ElderwoodZ32 (TBD)TaylorCountry ClubPaso NogalHwy 680 680Ave.ConcordGregory GardensMarket St.Hwy 242CONCORDWillow Pass PSLime RidgeCanterburyZ21/22 (TBD)Clayton Rd.B<strong>ai</strong>leyAyersMyrtleKirker PassEastZ31 (TBD)Kirker Pass Rd.Z63 (TBD)Randall Bold WTPMulti-PurposePipeline PSValve Stationat Antioch TurnoutPleasant HillHwy 24PLEASANTHILLHwy 680WALNUTCREEKYgnacio PSZ11 (TBD)Diablo HillsOak Grove Grove Rd.Valley Rd.YgnacioShell RidgeCowell RanchZ34 (TBD)Arbolado PSCastle RockSan MiguelComistas PSSand QuarryZ44 (TBD)NewhallValley VistaZ35 (TBD)Z43 (TBD)Rancho Par<strong>ai</strong>soNorth Gate PSPine HollowClayton ValleyCrystyl RanchEagle Peak PSPowerlineCLAYTONClubhouse PSMurchioOakhurstKeller RanchIrish CanyonSeminaryNob HillMarsh Marsh Creek Rd.DivideMorgan Territory Rd.Z71 (TBD)LegendExisting FaciltiesZ##Modeled PipelinePump StationDistribution Reservoir<strong>Water</strong> Treatment <strong>Plan</strong>tPressure Regulating StationZone IdentifierProposed Facilties/PhasingExistingIntermediateBuildoutHwy 680 680(TBD)Site to be DeterminedW:\REPORTS\<strong>CCWD</strong>\<strong>Master</strong> <strong>Plan</strong>_Apr07\Figures\<strong>CCWD</strong> Distribution System Improvements_Fig6-1.<strong>ai</strong> 12/11/07 JJTFigure 6-1Distribution System and Phasing Improvements
Chapter 6Recommended Improvements, Costs and Phasingmany years. Of the $90M required for future growth to buildout, approximately $43M is required forstorage improvements, $10M for pumping improvements and $37 for pipeline improvements.Table 6-1Summary of Recommended Capital Improvements and CostsService Area Components Additional Capacity (1) Capital Costs ($M) (4)Existing Future Total Existing Future GrandTotalStorage (mg) 1.75 14.05 15.80 $ 6.1 $ 42.9 $ 49.0Pumping (mgd) 1.9 25.0 26.9 $ 1.4 $ 10.4 $ 11.8Pipelines (feet) 34,000 75,000 109,000 $10.3 $ 37.0 $ 47.3Reliability Improvements (2) (2) (2) $ 2.1 - $ 2.1Subtotal $19.9 $90.3 $110.2Deferred Emergency 18.55 - 18.55 $58.6 - $ 58.6Storage (mg) (3)TOTAL $78.5 $90.3 $ 168.8(1) Capacity listed under Existing is that needed to eliminate existing deficiencies. Capacity listed under Future isthat needed for future growth.(2) Includes generators, seismic valves and fault crossing connections.(3) Storage that has been deferred because backup generators have been installed to provide equivalentreliability during emergencies. Storage would be constructed as existing tanks are expanded for growth orreplaced.(4) 2007 dollars based on San Francisco ENR November 2006 CC I of 9124.6.2.2 Pump StationsTable 6-2 summarizes required pump station installed capacity and costs for the existing, intermediateand buildout scenarios. A total of $11.8M in pump station improvements is needed, $1.4M for existingdeficiencies, and $10.4 for future growth. The installed capacity for new pump stations was determinedby adding 33 percent to the required firm buildout capacity, assuming four units total (three duty, and onestandby).Pleasant Hill PS is an existing pump station that is used to re-fill Pleasant Hill Reservoir. The pumpstation is currently not in operation, so the reservoir is also not considered to be in service. Reconstructionof this pump station is recommended as an existing scenario improvement, to restore thefull capacity of Pleasant Hill Reservoir.Additional pumping capacity is required in the Clayton Valley area by the intermediate scenario, with theinstallation of pump stations for the new northern backbone transmission project in subzones 31 and 41.Pumping capacity is phased. Slightly more than half of the required capacity is needed by theintermediate scenario, so three of the four units required by buildout would be installed initially. Asupplement to the TWMP will evaluate coordination of these facilities with potential development at theConcord Naval Weapons Station. One of two units needed at the existing Clayton Valley PS andexpansion of the existing Seminary PS with two units would also be required by the intermediate scenario.Additional pumping capacity is required by buildout for subzones 51, 61 and 71 to meet the largeprojected increase in demands in the Marsh Creek area.A 2007 Treated <strong>Water</strong> <strong>Master</strong> <strong>Plan</strong> Update 6-3
Chapter 6Recommended Improvements, Costs and PhasingTable 6-2Recommended Pump Capacity ImprovementsPhasing ofRecommended Additional RequiredAdditional Installed CapacityCapacity (mgd)(mgd)Cost AllocationFirmTotalExistingIntermediateBuildoutTotalProjectCosts ($M)ExistingCustomers($M)FutureCustomers($M)Subzone Facility Name11 Pleasant Hill PS (1) 1.9 1.9 1.9 - - $1.43 $1.43 $ -31 Ayers PS 6.0 8.0 - 6.0 2.0 $3.09 $ - $3.0941/ 44 Myrtle PS 6.1 8.1 - 6.1 2.0 $3.12 $ - $3.1251 Clayton Valley PS 4.8 4.8 - 2.4 2.4 $1.86 $ - $1.8661 Seminary PS 2.8 2.8 - 2.8 - $1.31 $ - $1.3171 Nob Hill PS 1.3 1.3 - - 1.3 $0.98 $ - $0.9822.9 26.9 1.9 17.3 7.7 $11.79 $1.43 $10.36(1) Re-build existing pump station so that Pleasant Hill Reservoir storage is fully usable.6.2.3 ReservoirsTable 6-3 summarizes recommended reservoir capacity improvements and costs. Total reservoirimprovement costs are $108M. The reservoir capacity improvements include those needed to correctexisting system deficiencies, and for future growth. The table shows existing and future deficiencies,phasing of projects, and allocation of costs between existing and future users.Storage projects to meet existing deficiencies of emergency storage capacity have been deferred becausebackup generators have been installed to provide equivalent reliability during emergencies (“in-lieu”emergency storage). Storage would be constructed as existing tanks are expanded for growth orreplaced. Therefore, while the existing system deficiency is 20 mg, construction of most of this storage isdeferred to the intermediate or buildout timeframe. Although the phasing of these projects is deferred,allocation of costs to existing and future customers is based on calculated deficiencies.Three storage projects are identified to remedy existing deficiencies of emergency storage capacity. Onestorage project is identified for implementation in the near-term: a new subzone 34 (North Gate) reservoirof 0.75 mg. A new subzone 21/22 reservoir (Ayers) of 2.0 mg would be phased in to coordinate with theplanning for the CNWS and other northern backbone improvements in the Clayton Valley, and would beimplemented in the intermediate time frame. A new subzone 79/69 (Divide) reservoir of 0.5 mg is alsorecommended in the intermediate time frame and the schedule will depend on actual growth in theMarsh Creek Road area. This project is being deferred from near-term because of water quality concernsassociated with additional storage facilities in the Divide subzone.The rem<strong>ai</strong>ning storage projects would be implemented in the intermediate or buildout timeframe, asshown on Table 6-3. Transmission pipelines required for reservoir projects are included with reservoirproject costs in Table 6-4.6-4 2007 Treated <strong>Water</strong> <strong>Master</strong> <strong>Plan</strong> Update A
Chapter 6Recommended Improvements, Costs and PhasingSubzoneNew (N)/Expansion (E)/Replacement (4)Table 6-3Recommended Reservoir Capacity ImprovementsCapacityNeeded(mg)Deficiency (mg)ExistingFutureExistingPhasing (mg)Intermediate (3)Buildout (4)TotalProjectCosts ($M)Facility NameCountry Club E 3.00 - 3.0 $7.28Pleasant Hill (1) -- 1.00 1.0 - -San Miguel E 5.00 - 5.0 $10.58Cost Allocation($M)11 Site(s)UndeterminedR 4.00 4.0 $9.04Site(s)R 2.00 - 2.0 $5.72UndeterminedSubzone 11 Total 15.00 10.00 5.00 1.0 14.0 $32.62 $21.75 $10.8721 Ayers N 2.00 2.0 - $6.8022 Valley Vista N 2.00 - 2.0 - $7.0321/22 Site(s)R 2.00 - 2.0 $5.81UndeterminedSubzone 21/22 Total 6.00 4.70 1.30 - 4.0 2.0 $19.64 $15.38 $4.26SubzoneE 1.00 0.70 0.30 - 1.0 $3.93 $2.75 $1.1823/25 (2) Site(s)UndeterminedMyrtle N 1.00 - 1.0 $4.4831 SiteR 0.70 - 0.7 $3.91UndeterminedSubzone 31 Total 1.70 1.10 0.60 - 1.0 0.7 $8.39 $5.43 $2.9632 Martinez Ridge N 0.50 - 0.5 $3.2332 SiteR 0.30 - 0.3 $1.69UndeterminedSubzone 32 Total 0.80 0.70 0.10 - 0.8 $4.92 $4.31 $0.61Subzone SiteN 0.75 0.65 0.10 0.75 - $4.66 $4.04 $0.6234 UndeterminedSubzone SiteN 0.25 0.15 0.10 - 0.3 $1.94 $1.16 $0.7835 UndeterminedSubzone SiteN 0.45 0.35 0.10 - 0.5 $2.98 $2.32 $0.6643 Undetermined51 Murchio E 0.50 - 0.5 $2.67Seminary E 1.40 - 1.4 $5.18Subzone 51 Total 1.90 0.50 1.40 - 1.4 0.5 $7.85 $2.07 $5.7861 Nob Hill N 1.60 0.40 1.20 - 1.6 $5.65 $1.41 $4.2463 SiteN 0.40 0.30 0.10 - 0.4 $2.81 $2.11 $0.70Undetermined71 Divide E 0.50 0.5 - $2.76SiteN 4.00 - 4.0 $9.51UndeterminedSubzone 71 Total 4.55 0.75 3.80 0.5 4.0 $12.27 $2.02 $10.25Subzone 72/83 -- 0.00 - - - - - - -Subzone-- 0.00 - - - - - - -73Subzone-- 0.02 - - - - - - -82Total 34.42 20.30 14.10 1.75 6.9 25.7 $107.66 $64.75 $42.91(1) Assumes Pleasant Hill Reservoir PS rehabilitated, so full reservoir is usable. Cost accounted for in pump improvements table.(2) Assumes Paso Nogal relocation to Country Club(3) Intermediate and buildout scenarios include storage to meet existing deficiencies, but has been deferred. Backup generators have been installed toprovide equivalent reliability during emergencies.(4) New reservoirs include land costs. Expansion or replacement of existing reservoirs assumes no land purchase.Existing CustomersFuture CustomersA 2007 Treated <strong>Water</strong> <strong>Master</strong> <strong>Plan</strong> Update 6-5
Chapter 6Recommended Improvements, Costs and Phasing6.2.4 PipelinesTable 6-4 summarizes recommended distribution system pipeline improvements and costs. Totalpipeline improvement costs are estimated at $47M, of which $10M is required to remedy existingdeficiencies, and $37M is required for future growth. The table shows improvements for existing,intermediate and buildout conditions. For improvements required to meet existing deficiencies, the tableincludes both the pipe size needed to satisfy existing system deficiencies and the size needed by buildoutto accommodate future growth. The cost is allocated to existing ratepayers and future growth based onthe cross sectional area of the pipeline, since the area relates directly to pipeline capacity.Key projects are highlighted below:• Port Chicago Pipeline Phase 2 and 3 extensions are included to provide additional transmissioncapacity to southern reservoirs in subzone 11 and to meet <strong>District</strong>’s reliability criteria for a backbonetransmission m<strong>ai</strong>n as described in Chapter 5. Phase 2 and 3 are required for existing capacitydeficiency, reliability and future growth.• New transmission capacity is included for subzone 51, to complete the backbone transmissionbetween Clayton Valley Pump Station and Seminary Reservoir.• New transmission capacity is required for virtually all pipelines in subzones 61, 71, 79 and 69, due tothe large projected increase in demands for the Marsh Creek Specific <strong>Plan</strong> area. All of thesepipelines are needed in the buildout time frame.• A project has been included to re-zone high elevation customers along Regency Drive in the southernpart of subzone 51, southwest of Seminary Tank. Customer elevations are 600 to 605 feet in thisarea, at or slightly above the top of zone elevation of 600 feet. Although friction losses are very low inthis area, static pressures at these elevations range from 35 psi to 37 psi when Seminary Reservoir isfull. Given the difficulty of re-filling Seminary Reservoir under high demand conditions, this projectwas included. Pipeline improvements of 2,600 feet of new 12-inch diameter pipe are included forthis re-zoning project. Since this project is needed only for peak hour pressure conditions, it may bepossible to use smaller diameter pipeline for normal service and continue to use subzone 51hydrants for fire service to this area. A preliminary evaluation (actual elevations and servicepressure) should be conducted to determine whether project needs to be incorporated in future CIPupdate or can be deferred or eliminated. The cost of this improvement, if required, is included inTable 6-5 under existing improvements.• Projects are included in subzone 11 to remedy fire flow deficiencies, where av<strong>ai</strong>lable flows are lessthan 1,000 gpm, the minimum flow required for residential service in the Uniform Fire Code. Projectswere sized to meet current fire flow standards, which are higher than the 1,000 gpm minimum flow(see Chapter 4). Note that the projects are not intended to replace the existing pipelines, but newpipelines would be installed parallel to the existing m<strong>ai</strong>ns.• Some projects are included for water quality and for the MPP, as discussed in the sections below.6-6 2007 Treated <strong>Water</strong> <strong>Master</strong> <strong>Plan</strong> Update A
Chapter 6Recommended Improvements, Costs and PhasingTable 6-4Recommended Pipeline ImprovementsSubzoneLocation Between streets Existing Diameter needed for: Cost Cost AllocationDia.(in.)Existing(in.)Future(in.)Length (ft) Estimate($ Mil)Existing($ Mil)Future($ Mil)Improvements Recommended for Existing Scenario11 Port Chicago PL Phase 2 - Along 6th St., to Willow Pass 12 24 36 7,177 $ 6.23 $ 2.77 $ 3.46at OliveraPort Chicago PL Phase 2 - Mohr Ln.between Monument 16 20 24 741 $ 0.40 $ 0.28 $ 0.12Blvd. and Diaz Dr.Port Chicago PL Phase 2 - Cowell Rd. between Coventry 12 and 16 24 30 2,374 $ 1.67 $ 1.07 $ 0.60Rd. and Mesa St.11 Arthur Rd.Pacheco Blvd. and8 8 8 195 $ 0.04 $ 0.04 $ -Karen Ln.Arthur Rd.Pacheco Blvd. and8 8 8 244 $ 0.04 $ 0.04 $ -Karen Ln.Arthur Rd.Karen Cir. and8 8 8 401 $ 0.07 $ 0.07 $ -Anderson WayArthur Rd.Karen Cir. and Freeway 8 8 8 676 $ 0.12 $ 0.12 $ -OfframpArthur Rd.Central Ave. and8 8 8 898 $ 0.16 $ 0.16 $ -Amalia Ave.Arthur Rd.Rodriques Ave. and8 8 8 962 $ 0.17 $ 0.17 $ -Central Ave.Arthur Rd.Service Rd. and6 8 8 414 $ 0.07 $ 0.07 $ -Rodriques Ave.Arthur Rd. after Service Rd. 8 8 8 1,974 $ 0.36 $ 0.36 $ -11 Camino del SolCamino Vinedo and8 12 12 741 $ 0.17 $ 0.17 $ -Pacheco Blvd.Camino del SolVia Estrella and8 12 12 1,151 $ 0.26 $ 0.26 $ -Camino VinedoVia EstrellaCorte Cielo and8 12 12 225 $ 0.05 $ 0.05 $ -Camino del SolVia EstrellaVia <strong>Plan</strong>eta and Corte 8 12 12 708 $ 0.16 $ 0.16 $ -CieloVia Estrella after Via <strong>Plan</strong>eta 8 12 12 244 $ 0.05 $ 0.05 $ -11 Lane Dr. End of Lane Dr. andSan Miguel Rd.11 MPP Antioch Turnout Install pressure sust<strong>ai</strong>ning valvestation for deliveries to Antioch31 Cowell Ranch Reservoir Install valve at CowellRanch PS to draw fromtank35 Castle Rock Reservoir Install valve at Comistas PS to bleedwater back to Zone 22ReasonTransmissioncapacity forsubzone 11reservoir re-fill.Fireflow at node13810, 600 gpmav<strong>ai</strong>lable in thearea, Northwestdeadend legFireflow at node13790, 700 gpmav<strong>ai</strong>lable,Northwest deadend4 12 12 1,109 $ 0.25 $ 0.25 $ - Fireflow at nodes12038 with 960gpm av<strong>ai</strong>lable$ 0.90 $ 0.80 $ 0.10 MPP Improvementn/a $ 0.06 $ 0.06 $ - <strong>Water</strong> qualityimprovement.$ 0.06 $ 0.06 $ - <strong>Water</strong> qualityimprovement.A 2007 Treated <strong>Water</strong> <strong>Master</strong> <strong>Plan</strong> Update 6-7
Chapter 6Recommended Improvements, Costs and PhasingTable 6-4Recommended Pipeline ImprovementsSubzoneLocation Between streets Existing Diameter needed for: Cost Cost AllocationReasonDia.(in.)Existing(in.)Future(in.)Length (ft) Estimate($ Mil)Existing($ Mil)Future($ Mil)41 Kirker Pass Reservoir Install valve at KirkerPass PS to draw fromn/a $ 0.06 $ 0.06 $ - <strong>Water</strong> qualityimprovement.tank44 Sand Quarry Reservoir Install valve at Cowell Ranch PS tobleed water back to Zone 31$ 0.06 $ 0.06 $ - <strong>Water</strong> qualityimprovement.51 East Reservoir Install a connection at Kirker Pass PSto bleed back to Zone 41.$ 0.06 $ 0.06 $ - <strong>Water</strong> qualityimprovement.51 Regency Drive Rialto Drive and Mt.Everest Courtn/a 12 12 2,600 $ 0.58 $ 0.58 $ - Rezoning - to befurther studied.Subtotal – Existing 22,834 $ 12.05 $ 7.77 $ 4.28Improvements Recommended for Intermediate Scenario11 Port Chicago PL Phase 3 - San Miguel Rd. betweenHanford Ave. and Treat Blvd.n/a - 24 6,861 $ 3.74 $ - $ 3.74 Subzone 11transmission.21 B<strong>ai</strong>ley Pump Station suction line 24 -- 24 281 $ 0.15 $ - $ 0.15 TransmissionB<strong>ai</strong>ley Pump Station suctionline24 -- 24 590 $ 0.32 $ - $ 0.32 capacity toalleviate bottleneck31 B<strong>ai</strong>ley PS discharge line 24 -- 20 59 $ 0.03 $ - $ 0.0322 Hutchinson Rd. Walnut Ave. andPontiac Dr.8 -- 20 2,086 $ 0.97 $ - $ 0.97 Transmission capto alleviatebottleneck nearShell Ridge Res.n/a -- 8 1,032 $ 0.19 $ - $ 0.19 New development.25 (none) past Midhill Rd. afterMidway Dr.31 Ayers Rd.Sutherland Dr. and 8 and 12 - 24 1,637 $ 0.89 $ - $ 0.89Clayton Rd.Concord Blvd. at B<strong>ai</strong>ley Rd. n/a - 24 30 $ 0.02 $ - $ 0.02Myrtle Dr.Judith Pl. and Myrtle n/a - 24 1,427 $ 0.78 $ - $ 0.78ReservoirConcord Blvd.Concord Ct. and8 - 24 300 $ 0.16 $ - $ 0.16Hames Dr.Concord Blvd.Concord Ct. and6 - 24 856 $ 0.47 $ - $ 0.47Hames Dr.Ayers Rd.Concord Blvd. and16 - 24 863 $ 0.47 $ - $ 0.47Laurel Dr.Ayers Rd.Laurel Dr. and Myrtle 16 - 24 859 $ 0.47 $ - $ 0.47Dr.Concord Blvd.Thornwood Dr. and n/a - 24 1,235 $ 0.67 $ - $ 0.67B<strong>ai</strong>ley Rd.Concord Blvd.Hames Dr. and Ayers n/a - 24 615 $ 0.34 $ - $ 0.34Rd.41 Myrtle Dr.Saddlewood Dr. and 16 - 12 297 $ 0.07 $ - $ 0.07Sagewood Ct.Myrtle Dr.Myrtle Reservoir and 8 - 20 2,470 $ 1.14 $ - $ 1.14Saddlewood Dr.Northern Concord-Clayton Valleybackbonetransmissionproject.6-8 2007 Treated <strong>Water</strong> <strong>Master</strong> <strong>Plan</strong> Update A
Chapter 6Recommended Improvements, Costs and PhasingTable 6-4Recommended Pipeline ImprovementsSubzoneLocation Between streets Existing Diameter needed for: Cost Cost AllocationDia.(in.)Existing(in.)Future(in.)Length (ft) Estimate($ Mil)Existing($ Mil)Future($ Mil)41 Clayton Valley PS suction line from Pine Hollow Rd. at 16 - 24 1,720 $ 0.94 $ - $ 0.94Missouri Dr.Clayton Valley PS suction line 14 - 20 148 $ 0.07 $ - $ 0.0751 Del Trigo Ln.Amaranth Way and 20 - 30 922 $ 0.65 $ - $ 0.65Mitchell Canyon Rd.Amaranth WayLewis Way and Del20 - 30 730 $ 0.51 $ - $ 0.51Trigo Ln.Lewis WayIronwood Way and20 - 30 1,085 $ 0.76 $ - $ 0.76Amaranth WayLewis WayBlue Lake Way and 20 - 30 1,618 $ 1.14 $ - $ 1.14Ironwood WayVia EnsenadaCamino Solano and 20 - 30 1,714 $ 1.20 $ - $ 1.20K<strong>ai</strong>ser Quarry Rd.Clayton Valley PS discharge near Via Ensenada 20 - 30 507 $ 0.36 $ - $ 0.36lineSubtotal – Intermediate 29,942 $ 16.51 $ - $ 16.51Improvements Recommended for Buildout Scenario11 Bollman Discharge Line near Bates Ave. n/a - 36 143 $ 0.12 $ - $ 0.12Nelson Ave. near Laura Alice Way. Bollman Discharge n/a - 36 41 $ 0.04 $ - $ 0.04improvement.21 Denkinger Rd. at Wilson Ln. 12" valve - 24 20 $ 0.01 $ - $ 0.01Concord Blvd. at Clayton Way 10" valve - 24 20 $ 0.01 $ - $ 0.01West St. at Wilson Ln. 12" valve - 24 20 $ 0.01 $ - $ 0.01ReasonTransmissionSubzone 51transmissionSubzone 11transmission.Subzone 21transmission,Willow Pass PSdischarge.22 Ygnacio Valley Blvd. near Newhall Reservoir 20 - 20 680 $ 0.32 $ - $ 0.32 Subzone 22transmission51 Marsh Creek Rd.Regency Dr. and20 - 30 1,054 $ 0.74 $ - $ 0.74Seminary PSMarsh Creek Rd.Easley Dr. and Regency 20 - 30 3,112 $ 2.18 $ - $ 2.18Dr.Marsh Creek Rd.Zinfandel Cir. and20 - 30 1,356 $ 0.95 $ - $ 0.95 Subzone 51Easley Dr.transmissionMarsh Creek Rd.Zinfandel Cir. and HighSt.20 - 30 1,353 $ 0.95 $ - $ 0.95Clayton Valley PS dischargeline24 - 30 197 $ 0.14 $ - $ 0.1461 Marsh Creek Rd.Russelman Park Rd. 12 - 16 3,975 $ 1.16 $ - $ 1.16and Nob Hill PSMarsh Creek Rd.Pine Ln. and Oakpoint 12 - 16 1,704 $ 0.50 $ - $ 0.50Ct.Subzone 61Marsh Creek Rd.Regency Dr. and PineLn.12 - 16 767 $ 0.22 $ - $ 0.22 transmissionMarsh Creek Rd.Regency Dr. and PineLn.12 - 16 1,061 $ 0.32 $ - $ 0.31A 2007 Treated <strong>Water</strong> <strong>Master</strong> <strong>Plan</strong> Update 6-9
Chapter 6Recommended Improvements, Costs and PhasingTable 6-4Recommended Pipeline ImprovementsSubzoneLocation Between streets Existing Diameter needed for: Cost Cost AllocationReasonDia.(in.)Existing(in.)Future(in.)Length (ft) Estimate($ Mil)Existing($ Mil)Future($ Mil)69 Unnamed St. off Marsh Creek PR Tank and Aspara 8 - 12 89 $ 0.02 $ - $ 0.02Rd.Dr.Unnamed St. off Marsh CreekRd.PR Tank and AsparaDr.8 - 12 1,072 $ 0.24 $ - $ 0.24 Subzone 69TransmissionUnnamed St. off Marsh CreekRd.PR Tank and AsparaDr.8 - 12 112 $ 0.03 $ - $ 0.0369 Unnamed St. off Marsh CreekRd.PR Tank and AsparaDr.8 12 16 1,573 $ 0.46 $ 0.26 $ 0.20 Subzone 69Transmission, fire69 Marsh Creek Rd.Royal Oaks Dr. and8 12 12 3,985 $ 0.90 $ - $ 0.90Aspara Dr.Marsh Creek Rd.Royal Oaks Dr. and 10 12 16 149 $ 0.04 $ 0.02 $ 0.02Aspara Dr.Marsh Creek Rd.Royal Oaks Dr. and8 12 16 878 $ 0.26 $ 0.15 $ 0.11Aspara Dr.Marsh Creek Rd.Royal Oaks Dr. and8 12 16 268 $ 0.08 $ 0.04 $ 0.04Aspara Dr.Subzone 69Transmission, FireMarsh Creek Rd.Royal Oaks Dr. and8 12 16 1,081 $ 0.31 $ 0.18 $ 0.14FlowAspara Dr.Marsh Creek Rd.Royal Oaks Dr. and8 12 16 100 $ 0.03 $ 0.02 $ 0.01Aspara Dr.Marsh Creek Rd. West of Aspara Dr. 8 12 16 1,518 $ 0.44 $ 0.25 $ 0.19Marsh Creek Rd. West of Aspara Dr. 8 12 16 319 $ 0.09 $ 0.05 $ 0.04Marsh Creek Rd. West of Aspara Dr. 10 12 16 85 $ 0.02 $ 0.01 $ 0.01Marsh Creek Rd. West of Aspara Dr. 8 12 16 2,118 $ 0.62 $ 0.35 $ 0.2769 Marsh Creek Rd.downstream of12 - 16 2,159 $ 0.63 $ - $ 0.63Pressure Relief TankMarsh Creek Rd.between PRV andPressure Relief Tank12 - 16 1,120 $ 0.33 $ - $ 0.33 Subzone 69transmissionMarsh Creek Rd.downstream ofPressure Relief Tank12 - 16 81 $ 0.02 $ - $ 0.0271 Marsh Creek Rd.West of Divide12 - 16 1,770 $ 0.52 $ - $ 0.52ReservoirMarsh Creek Rd.West of DivideReservoir12 - 16 389 $ 0.11 $ - $ 0.11 Subzone 71transmissionMarsh Creek Rd.Divide Reservoir andNob Hill Reservoir12 - 16 2,704 $ 0.79 $ - $ 0.796-10 2007 Treated <strong>Water</strong> <strong>Master</strong> <strong>Plan</strong> Update A
Chapter 6Recommended Improvements, Costs and PhasingTable 6-4Recommended Pipeline ImprovementsSubzoneLocation Between streets Existing Diameter needed for: Cost Cost AllocationDia.(in.)Existing(in.)Future(in.)Length (ft) Estimate($ Mil)Existing($ Mil)Future($ Mil)79 Morgan Territory Rd.Leon Dr. and Curry8 8 12 2,110 $ 0.47 $ 0.21 $ 0.26Canyon Rd.Morgan Territory Rd.Leon Dr. and Curry8 8 12 120 $ 0.03 $ 0.01 $ 0.02Canyon Rd.Morgan Territory Rd. near Curry Canyon Rd. 8 8 12 1,658 $ 0.38 $ 0.17 $ 0.21Morgan Territory Rd.Tumbleweed Ct. and 8 8 12 953 $ 0.22 $ 0.10 $ 0.12Curry Canyon Rd.Morgan Territory Rd.Shale Cliff Ct. and8 8 12 773 $ 0.18 $ 0.08 $ 0.10Tumbleweed Ct.Morgan Territory Rd.Whispering Pines Rd. 8 8 12 703 $ 0.16 $ 0.07 $ 0.09and Shale Cliff Ct.Morgan Territory Rd.Oak Hill Ln. and8 8 12 477 $ 0.11 $ 0.05 $ 0.06Whispering Pines Rd.Morgan Territory Rd. North of Oak Hill Ln. 8 8 16 2,178 $ 0.64 $ 0.16 $ 0.48Morgan Territory Rd. North of Oak Hill Ln. 8 8 16 612 $ 0.18 $ 0.04 $ 0.14Morgan Territory Rd. North of Oak Hill Ln. 8 8 16 846 $ 0.25 $ 0.06 $ 0.19Morgan Territory Rd. North of Oak Hill Ln. 8 8 16 259 $ 0.08 $ 0.02 $ 0.06Morgan Territory Rd. North of Oak Hill Ln. 10 8 8 83 $ 0.02 $ 0.02 $ -Morgan Territory Rd.Marsh Creek Rd. and 8 8 16 2,982 $ 0.87 $ 0.22 $ 0.65Oak Hill Ln.79 Marsh Creek Rd.Morgan Territory Rd. 12 - 16 2,292 $ 0.67 $ - $ 0.67and PRVMarsh Creek Rd.Divide Reservoir and 12 - 16 2,974 $ 0.87 $ - $ 0.87Morgan Territory Rd.Subtotal – Buildout 56,093 $ 18.74 $ 2.54 $ 16.20TOTAL - All Scenarios 108,869 $ 47.30 $ 10.31 $ 36.99ReasonSubzone 79transmissionSubzone 79transmissionA 2007 Treated <strong>Water</strong> <strong>Master</strong> <strong>Plan</strong> Update 6-11
Chapter 6Recommended Improvements, Costs and Phasing6.2.5 Distribution System <strong>Water</strong> Quality ImprovementsTable 6-5 summarizes recommended water quality improvements for the distribution system. The costsof these improvements are included with pipeline improvements, listed in Table 6-4. All of the waterquality improvements are required for the existing scenario.Table 6-5Recommended Distribution System <strong>Water</strong> Quality ImprovementsSubzone Reservoir Benefited Proposed <strong>Water</strong> Quality Improvements (All Required for Existing Scenario)31 Cowell Ranch Install valving at Cowell Ranch PS to draw directly from tank.35 Castle Rock Install valving at Comistas PS to bleed water back to Subzone 22.41 Kirker Pass Valving at Kirker Pass PS to pump directly from tank.44 Sand Quarry Install a valve connection at Cowell Ranch PS to bleed back to Subzone 31.51 East New valve connection at Kirker Pass PS to bleed water to Subzone 41.Recommended improvements involve the installation of valves to provide more operational flexibility todraw down and re-fill reservoirs for water quality purposes, as identified in the 2002 Treated <strong>Water</strong><strong>Master</strong> <strong>Plan</strong>. Projects included on the table are those identified in 2002 that have not yet beenimplemented. The costs for these improvements are included in Table 6-4, summarizing pipelineimprovements and costs. An allowance of $60,000 is made at each site to install automatic valvesrequired for subzones 31, 35, 41, 44 and 51. A total of $300,000 is allocated for water qualityimprovements. The <strong>District</strong> should prioritize and implement these projects, based on actual operatingexperience with the reservoirs.6.2.6 MPP Long-term ImprovementsInstallation of a pressure sust<strong>ai</strong>ning valve station at Antioch Turnout, along with returning the Multi-Purpose Pipeline (MPP) to subzone 11 service, is recommended for the long-term configuration of theMPP. The pressure sust<strong>ai</strong>ning valve station has an estimated capital cost of $0.9M. The cost for thisproject is included in Table 6-4.6.2.7 Reliability ImprovementsThe 2002 Treated <strong>Water</strong> <strong>Master</strong> <strong>Plan</strong> identified several reliability improvements consisting of backupgenerators, seismic isolation valves at reservoirs, and Concord fault crossing connections on pipelines24-inch diameter and greater. The majority of the high priority generator, seismic isolation valve, andfault crossing projects have already been implemented. Rem<strong>ai</strong>ning projects will be implemented as partof planned future capital projects and as funding becomes av<strong>ai</strong>lable.Tables 6-6 through 6-8 summarize recommended improvements and costs. The total cost of reliabilityimprovements is estimated at $2.1M. Installation of seismic valves will be incorporated into reservoirreplacement projects, and their costs are included in future reservoir projects, listed in Table 6-3. All ofthe costs for fault crossing connections are allocated to the existing customers. The cost of fault crossingconnections included in Table 6-8 is for flexible connections and expansion sleeves or manifolds andtemporary hose connections. However, this type of connection may not be applicable for all sites. Thecost of fault crossing connections can vary widely depending on fault zone characteristics at the particularpipeline crossing. Other measures such as installation of welded steel pipeline or polyethylene (welded)or the ability to isolate the pipelines should be considered on a case-by-case basis. The cost of theseimprovements should be determined during the pre-design stage, and can vary widely depending uponthe facilities constructed.6-12 2007 Treated <strong>Water</strong> <strong>Master</strong> <strong>Plan</strong> Update A
Chapter 6Recommended Improvements, Costs and PhasingPump Station Site(subzone served)Table 6-6Recommended Backup GeneratorsFirm PumpingCapacity (HP)Generator Capacity(kW) (1)Type of GeneratorTotal Project Cost$MSeminary (61) 150 115 Portable $0.2Total 115 $0.2(1) Generator capacity rating includes sufficient power for firm pumping capacity plus other necessary utility loads such as motor operated valves,lighting panel, SCADA and ancillary equipment. Also, generator size selected conforms to the av<strong>ai</strong>lable commercial size. The size of eachgenerator will be optimized during the final design, if needed.Table 6-7Recommended Sites for Seismically Triggered Isolation ValvesReservoir Location Volume, MG Subzone Diameter, Total Project Cost ($M)inchesSan Miguel 5.0 11 36Undetermined 2.0 21 12Undetermined 1.0 25 12Undetermined 0.75 34 12Clayton Valley (1) 2.0 41 24Undetermined 0.4 63 12Divide 0.5 71 12Costs estimated at $50,000 perinstallation. Costs are allocatedto future customers. Valves willbe installed in the future whenadditional reservoirs are built inthe Zone. The costs for thesevalves are included in eachindividual storage projects (seeAppendix F, Table F-8).(1) Subzone has no storage deficiency. Project would be implemented as part of existing storage rehabilitation.Table 6-8Recommended Fault Crossing ConnectionsTotalSubzonePipe Diameter,inches Approximate Location (1)Project Cost($M) (2) Priority11 24/42 On Treat Blvd. near <strong>Contra</strong> <strong>Costa</strong> Canal $0.52 High11 24 Near Bisso Lane and SPRR Right of Way $0.34 Low11 24 Near corner of Market Street and Concord Avenue $0.34 Low11 36 Near corner of Systron Drive and San Miguel $0.34 Low22 24 Near <strong>Contra</strong> <strong>Costa</strong> Canal and Newhall Reservoir $0.34 LowTotal $1.88(1) Locations are based on a reconn<strong>ai</strong>ssance level review of the Concord fault zone and the distribution system.(2) All costs are in current dollars (January 2007). All costs allocated to existing customers.6.2.8 Comparison with the 2002 Treated <strong>Water</strong> <strong>Master</strong> <strong>Plan</strong>Table 6-9 provides a comparison between recommended improvements and costs in the current TWMPwith the 2002 TWMP. The table shows 2002 TWMP costs, as updated to current dollars, and adjusted toaccount for treated water service area capital projects constructed since 2002. Table 6-10 shows howadjustments were made to the 2002 TWMP costs and capacity, for comparison with the 2007 TWMP.2002 costs and capacities, shown on the left, were escalated to 2007 dollars. Then the costs andcapacities were adjusted to reflect projects implemented since 2002, to get the adjusted 2002 TWMP.A 2007 Treated <strong>Water</strong> <strong>Master</strong> <strong>Plan</strong> Update 6-13
Chapter 6Recommended Improvements, Costs and PhasingTable 6-9Cost and Capacity Comparison with the 2002 Treated <strong>Water</strong> <strong>Master</strong> <strong>Plan</strong>COST COMPARISONAdjusted 2002 TWMP Costs, $M (2007 $) 2007 TWMP Costs $M (2007 $)Existing Future Total Existing Future TotalStorage $63.44 $43.19 $106.63 $64.75 $42.91 $107.66Pumping $0.00 $11.45 $11.45 $1.43 $10.36 $11.79Pipelines $10.63 $31.66 $42.29 $10.31 $36.99 $47.30Reliability (1) $2.08 $0.00 $2.08 $2.08 0 $2.08Total $76.15 $86.30 $162.45 $78.57 $90.26 $168.83CAPACITY COMPARISONService Area Adjusted 2002 TWMP Recommendations 2007 TWMP RecommendationsComponent Existing Future Total Existing Future TotalStorage (mg) 19.26 13.95 33.21 20.35 14.05 34.4Pumping0 24.2 24.2 1.9 25 26.9(mgd)Pipelines (ft) 25,000 75,000 100,000 34,000 75,000 109,000(1) See Tables 6-6 through 6-8 for recommended reliability improvements. Current TWMP includes all projectsrecommended in 2002 but not yet implemented.Table 6-10Development of 2002 Treated <strong>Water</strong> <strong>Master</strong> <strong>Plan</strong> Adjusted Costs and Capacity CostsServiceArea2002 TWMP Cost Allocation,$M (2002 $)2002 TWMP Cost Allocation,$M (2007 $)Construction Since 2002,$M (2007 $)Adjusted 2002 TWMP Costs, $M(2007 $)Component Existing Future Total Existing Future Total Existing Future Total Existing Future TotalStorage $43.53 $28.31 $71.84 $67.52 $43.91 $111.43 $4.08 $0.72 $4.80 $63.44 $43.19 $106.63Pumping $0.00 $6.92 $6.92 $0.00 $11.45 $11.45 $0.00 $0.00 $0.00 $0.00 $11.45 $11.45Pipelines $9.29 $22.98 $32.27 $12.97 $32.89 $45.86 $2.34 $1.23 $3.57 $10.63 $31.66 $42.29Reliability(1)$4.86 $0.00 $4.86 $6.77 $0.00 $6.77 $4.69 $0.00 $4.69 $2.08 $0.00 $2.08Total $57.68 $58.21 $115.89 $87.26 $88.25 $175.51 $11.11 $1.95 $13.06 $76.15 $86.30 $162.45CapacityServiceArea2002 TWMP RecommendedCapacityConstruction Since 2002Adjusted 2002 TWMPRecommendationsComponent Existing Future Total Existing Future Total Existing Future TotalStorage 20.53 14.18 34.71 1.27 0.23 1.5 19.26 13.95 33.21(mg)Pumping0 24.2 24.2 0 0 0 0 24.2 24.2(mgd)Pipelines 32,000 79,000 111,000 7,000 4,000 11,000 25,000 75,000 100,000(ft)(1) See Tables 6-6 through 6-8 for recommended reliability improvements. Current TWMP includes all projectsrecommended in 2002 but not yet implemented.The findings of the 2007 Update are consistent with the findings of the 2002 TWMP.The total cost for all improvements identified in the 2007 TWMP is $169M of which $79M is allocated toexisting customers and $90M is allocated to future customers. This compares to a total cost ofimprovements recommended in the 2002 TWMP (adjusted for inflation and constructed or demolishedfacilities) of $162M of which $76M was allocated to existing customers and $86M was allocated tofuture customers.6-14 2007 Treated <strong>Water</strong> <strong>Master</strong> <strong>Plan</strong> Update A
Chapter 6Recommended Improvements, Costs and PhasingThe total cost of improvements identified in the 2007 TWMP is approximately $6M more thanrecommended in the 2002 TWMP as adjusted. The increase is the result of the following factors:• Increase of $1M in pump station costs, due to the inclusion of a capital project to rep<strong>ai</strong>r Pleasant HillPS.• Increase of $4M in pipeline costs, due to the inclusion of new projects in subzone 11 where existingresidential areas are less than the minimum standards in the Uniform Fire Code ($2M), and increasein pipeline diameter for the future subzone 51 transmission improvements ($2M).• Addition of MPP Pressure Sust<strong>ai</strong>ning Station ($1M) in 2007 TWMP. The cost for this facility issummarized under the pipelines line item. 1Otherwise, the 2007 TWMP is consistent with the 2002 TWMP.6.3 Capital Improvement ProgramThis section discusses improvement recommendations generated from the TWMP and how they relate tothe <strong>District</strong>’s overall Capital Improvement Program (CIP) planning. The <strong>District</strong>’s CIP provides acomprehensive picture of the <strong>District</strong>’s capital improvement needs. The TWMP is one of severalprograms that the <strong>District</strong> uses as input to the CIP planning process. Capital projects that requireimmediate implementation are incorporated into the <strong>District</strong>’s Ten-Year CIP. Capital projects that have alonger implementation time-frame are designated as long-term CIP projects.6.3.1 TWMP Improvement Cost Allocations for CIP TimeframesTable 6-11 shows the allocation of TWMP improvements to the Ten-Year CIP and Long-term CIP. Theestimated total cost for new TWMP facilities during the ten-year CIP timeframe is approximately $18.0Mof which $13.1M is allocated to existing customers (rates) and $4.9M is allocated to future customers(via FRCs).Table 6-11Allocation of TWMP Improvement Costs to Ten-Year andLong-Term Capital Improvement ProgramFacilities10-Year Allocation $M Long-term Allocation $M Total Cost $MExisting Future Total Existing Future Total Existing Future GrandTotalStorage (mg) $ 4.1 $ 0.6 $ 4.7 $ 2.0 $42.3 $44.3 $ 6.1 $42.9 $ 49.0Pumping (mgd) $ 1.4 - $ 1.4 - $10.4 $10.4 $ 1.4 $ 10.4 $ 11.8Pipelines (feet) $ 6.9 $4.3 $11.2 $ 3.4 $32.7 $36.1 $10.3 $37.0 $ 47.3Reliability Improve. $ 0.7 - $ 0.7 $ 1.4 - $ 1.4 $ 2.1 - $ 2.1Subtotal $13.1 $4.9 $18.0 $ 6.8 $85.4 $92.2 $19.9 $90.3 $ 110.2Deferred Emergency - - - $58.6 - 58.6 $58.6 - $ 58.6Storage (mg)TOTAL $13.1 $4.9 $18.0 $65.4 $85.4 $150.8 $78.5 $90.3 $ 168.86.3.2 Ten-Year Capital Improvement ProgramProjects identified in this chapter were prioritized for inclusion in the <strong>District</strong>’s Ten-Year CapitalImprovement Program. The rem<strong>ai</strong>ning high priority reliability improvements and fireflow improvementswere given the highest priority. Other projects were included based on the severity of the deficiency andcost effectiveness.1 There were also minor capacity changes at planned facilities, so pump station comparison totals in Table 6-10 show a pumpingdifference of less than $1.0M.A 2007 Treated <strong>Water</strong> <strong>Master</strong> <strong>Plan</strong> Update 6-15
Chapter 6Recommended Improvements, Costs and PhasingProjects recommended for implementation during the 10-year CIP window (2009 – 2018) are shown inTable 6-12. The actual schedule for the implementation of TWMP recommendations will be determinedthrough the annual CIP update process.Table 6-12Ten-Year Capital Improvement Project RecommendationsProject CostScheduleProject Description ($M) (1) Funding SourceReliability Improvements Fault Crossing near Treat Blvd. and$ 0.72 Treated <strong>Water</strong> Rates FY09Seminary Pump Station EmergencyGeneratorPipeline Improvements near Construct 3,100 ft of 12 inch pipeline $ 0.69 Treated <strong>Water</strong> Rates FY10Via EstrellaPipeline Improvements near Construct 1,100 ft of 12 inch pipeline $ 0.25 Treated <strong>Water</strong> Rates FY11Lane Dr. and San MiguelRoadPipeline Improvements at Construct 5,600 ft of 8 inch pipeline $ 1.03 Treated <strong>Water</strong> Rates FY12Arthur Rd.Pleasant Hill Pump Station Rehabilitate/Replace booster pump station $ 1.43 Treated <strong>Water</strong> Rates FY13RehabMPP Pressure Sust<strong>ai</strong>ning Install pressure sust<strong>ai</strong>ning valve station for $ 0.90 Treated <strong>Water</strong> Rates FY16ValveMPP deliveries to Subzone 11Port Chicago Pipeline Phase II Construct 10,300 ft of 24” to 36” pipeline $8.30 Treated <strong>Water</strong> Rates FY16 – FY19and FRCSubzone 34 Storage Construct 0.75 MG buried concrete$ 4.66 Treated <strong>Water</strong> Rates FY17 – FY19Reservoirreservoirand FRCTotal $17.98Costs are in 2007 dollars (San Francisco ENR CCI 9123).6-16 2007 Treated <strong>Water</strong> <strong>Master</strong> <strong>Plan</strong> Update A
ReferencesReferences2007 Treated <strong>Water</strong> <strong>Master</strong> <strong>Plan</strong> Update - Draft Report
ReferencesAvila and Associates, Consulting Engineers, 2005. Treated <strong>Water</strong> Renewal and Replacement Study –Final Report, August 2005.Brady & Associates <strong>Plan</strong>ners and Landscape Architects, 1995. Marsh Creek Area Specific <strong>Plan</strong>, June1995.<strong>Contra</strong> <strong>Costa</strong> <strong>Water</strong> <strong>District</strong>, 1994. Cost Manual (Final Draft), December 1994_______________________, 2002. Final Treated <strong>Water</strong> <strong>Master</strong> <strong>Plan</strong>, December 2002._______________________, 2005. Long Term MPP Service Alternatives, December 2005._______________________, 2007a. 2006 Annual Report, 2007._______________________, 2007b. <strong>Contra</strong> <strong>Costa</strong> <strong>Water</strong> <strong>District</strong> website, <strong>District</strong> Profile.http://www.ccwater.com. Accessed April 2007._______________________, 2007c. Ten-Year Capital Improvement Program (FY2008-2017), February2007.___________, 2002. Future <strong>Water</strong> Supply Study Update Final Report, November 2002.HDR Engineering, Inc., August, 2006. Preliminary Booster Disinfection Siting Memorandum.Montgomery Watson, 1997. Seismic and Reliability Improvements Project – Volume 3, ______ 1997.MWH, 2004. MPP Delivery to Zone 2, October 2004.A 2007 Treated <strong>Water</strong> <strong>Master</strong> <strong>Plan</strong> Update 1
AppendicesAppendices2007 Treated <strong>Water</strong> <strong>Master</strong> <strong>Plan</strong> Update - Draft Report
Appendix ADemand Projection Methodology
Appendix ADemand Projection MethodologyA.1 Demand MethodologyThe <strong>District</strong> developed annual demand projections through buildout using a land-use-based approachoriginally developed in the 1997 Treated <strong>Water</strong> <strong>Master</strong> <strong>Plan</strong>. Treated <strong>Water</strong> <strong>Master</strong> <strong>Plan</strong> demands wereupdated using demands from the 2002 Future <strong>Water</strong> Supply Study Demand Update, along with morerecent planning data av<strong>ai</strong>lable from local planning agencies.The demand method used considers land use acreages for different customer types and unit water useestimates for these uses to develop existing and buildout water use estimates. The water use factors,originally developed for the 1997 Treated <strong>Water</strong> <strong>Master</strong> <strong>Plan</strong> Update, use 1996 consumption data.Formulas to compute overall annual water use take into account the following factors:• Land Use. Acreages by land use classification were identified for a number of different customerclasses, including residential uses of various densities, commercial, business park and light industrialuses, parks, public uses (e.g. churches, theaters) open space, schools and vacant lands. Acreagesfrom the 2002 Treated <strong>Water</strong> <strong>Master</strong> <strong>Plan</strong> were updated by the <strong>District</strong> to reflect new developmentsince completion of the last Treated <strong>Water</strong> <strong>Master</strong> <strong>Plan</strong>. Future land use acreages were based onadopted General <strong>Plan</strong>s and subsequent amendments.• Unit <strong>Water</strong> Uses. Unit water uses were developed for each of the defined land use classifications forboth existing and future conditions. The existing and future unit water use factors developed as partof the 1997 Treated <strong>Water</strong> <strong>Master</strong> <strong>Plan</strong> Update were used for this study. Unit water uses aremultiplied by land use acreages to develop total use estimates by customer class. Unit use factorsfor existing and future land uses are provided in Table A-1 and Table A-2.• Large <strong>Water</strong> Users. Large users, referred to as "topusers" were separately assigned, based on actualconsumption history to provide greater accuracy. <strong>Water</strong> use for these customers was revised, asneeded, based on recent billing data.• Dry Year of <strong>Water</strong> Use. Unit water uses were scaled up to estimate water use for a drier year, notinfluenced by drought conditions. Factors were developed separately for different use classes, basedon a review of water usage from 1996 (wet year, post-drought) and 1987 (dry year, pre-drought). Theconsumption from 1996 was compared to consumption for 1987 to determine the percentage bywhich the 1996 unit use factors should be adjusted. Commercial unit consumption was larger by12.9 percent in 1987 while irrigation consumption was larger by 12.0 percent. Single-familyresidential consumption was 21.1 percent larger. These adjustments were applied to the unit usefactors to reflect dry year demands, not affected by drought shortages.• Unaccounted for <strong>Water</strong>. Existing and buildout water use estimates were scaled to includeunaccounted for water. Unaccounted for water represents system losses including leaks, unmeteredhydrant use, m<strong>ai</strong>n flushing, and other unmetered water usage and was calculated as a percentage ofproduction. The unaccounted for water factors used in this study are listed in Table A-3 and werederived from consumption and production data for 1996 through 1999.• <strong>Water</strong> Use Intensification. Buildout demands for areas of existing development were scaled up by 5percent to account for water use intensification. This is to account for re-development andintensification of urbanized lands (such as in redevelopment areas), new demand from developmentof vacant parcels too small to be designated as vacant in the existing land use database, and minorgeneral plan amendments. The intensification estimate was developed during the preparation of the1997 TWMP and was based on discussions with the <strong>Plan</strong>ning departments of Cities within the TWSA.A 2007 Treated <strong>Water</strong> <strong>Master</strong> <strong>Plan</strong> Update A-1
Appendix ADemand Projection MethodologyThe <strong>District</strong> compared existing dry year demand estimates with recent water use trends for each of the<strong>District</strong>’s eight service zones. This comparison confirmed that the use of unit water use rates based on1996 consumption is still appropriate for current water use estimates.Intermediate demands, representing year 2020, were developed from existing and buildout demandsusing linear interpolation.Land Use Code WUF UnitsINTERAGENCYTable A-1Existing <strong>Water</strong> Use FactorsDry Year Use Land UseFactor GroupingDescriptionPort <strong>Costa</strong> 160 Af/yr 1.00 MixedActual metered deliveries to the Port <strong>Costa</strong>systemSCWC (Bay Point) 100 Af/yr 1.00 Wholesale Treated water deliveries to Bay PointTOP USERSTop Res. Users 312.32 Af/yr 1.00 Topuser Apartment complexes and mobile home parksTop NonRes Users 1,348.80 Af/yr 1.03 TopuserGolf course, parks, high rise offices, hotels,misc. industryEXISTING LAND USESXBP 1.30 Af/ac/yr 1.13 Office Business ParkXBPCAMPUS 2.10 Af/ac/yr 1.13 Office Business park w/campus design (a lot of lawns)XC 2.20 Af/ac/yr 1.13 Commercial Ret<strong>ai</strong>l CommercialXCONST 0.00 Af/ac/yr 1.00 Construction Land under constructionXHOS 2.50 Af/ac/yr 1.00 Commercial HospitalXHOT 7.80 Af/ac/yr 1.00 Commercial HotelXHRO 3.00 Af/ac/yr 1.00 Office High Rise OfficeXIL 0.10 Af/ac/yr 1.00 Industrial Industrial Low <strong>Water</strong> UseXIR 3.00 Af/ac/yr 1.12 Parks Residential IrrigationXM 2.20 Af/ac/yr 1.00 SF High Mobile Home ParkXOS 0.00 Af/ac/yr 1.00 Open Space Open SpaceXP 1.00 Af/ac/yr 1.00 Public Public/Quasi PublicXPCANAL 0.00 Af/ac/yr 1.00 Parks Park on Canal <strong>Water</strong>XPRIZ1 3.00 Af/ac/yr 1.12 Parks Public Recreation Irrigated (potable), Zone 1XPRIZ2 2.50 Af/ac/yr 1.12 Parks Public Recreation Irrigated (potable), Zone 2XPRIZ3 5.00 Af/ac/yr 1.12 Parks Public Recreation Irrigated (potable), Zone 3XPRIZ4 4.00 Af/ac/yr 1.12 Parks Public Recreation Irrigated (potable), Zone 4XPRIZ5 4.00 Af/ac/yr 1.12 Parks Public Recreation Irrigated (potable), Zone 5XPRIZ6 3.50 Af/ac/yr 1.12 Parks Public Recreation Irrigated (potable), Zone 6XPRIZ7 3.50 Af/ac/yr 1.12 Parks Public Recreation Irrigated (potable), Zone 7XPWELLS 0.00 Af/ac/yr 1.00 Parks Park on wellsXR1 1.00 Af/ac/yr 1.21 SF Very Low Very Low Res. 0-2.9 du/gross acreXR1CANAL 0.00 Af/ac/yr 1.21 SF Very Low Very Low Res. 0-2.9 du/gross acre CastlerockXR1Z41 0.30 Af/ac/yr 1.21 SF Very Low Rural Res 0-2.9 du/gross acre zone 41XR1Z43 1.50 Af/ac/yr 1.21 SF Low Affluent new low density in Northgate areaXR2Z1 1.45 Af/ac/yr 1.21 SF Medium Low Res 3-6 du/gross acre, Zone 1XR2Z2 1.48 Af/ac/yr 1.21 SF Medium Low Res 3-6 du/gross acre, Zone 2XR2Z2325 1.40 Af/ac/yr 1.21 SF Medium Low res 3-6 du/gross acre Zones 23& 25XR2Z3 1.45 Af/ac/yr 1.21 SF Medium Low Res 3-6 du/gross acre, Zone 3XR2Z4 2.20 Af/ac/yr 1.21 SF Medium Low Res 3-6 du/gross acre, Zone 4XR2Z41 1.43 Af/ac/yr 1.21 SF Medium Low res. 3-6 du/gross acre zone 41A-2 2007 Treated <strong>Water</strong> <strong>Master</strong> <strong>Plan</strong> Update A
Appendix ADemand Projection MethodologyTable A-1Existing <strong>Water</strong> Use FactorsXR2Z5 1.67 Af/ac/yr 1.21 SF Medium Low Res 3-6 du/gross acre, Zone 5XR2Z6 1.90 Af/ac/yr 1.21 SF Medium Low Res 3-6 du/gross acre, Zone 6XR2Z7 2.20 Af/ac/yr 1.21 SF Medium Low Res 3-6 du/gross acre, Zone 7XR3 3.00 Af/ac/yr 1.21 MF Low Medium Res 6.1-12 du/gross acreXR3Z2325 3.00 Af/ac/yr 1.21 MF Low Medium res 6.1-12 du/gross ac Zones 23 & 25XR4 4.50 Af/ac/yr 1.00 MF Medium High Res 12.1-20 du/gross acreXR5 6.50 Af/ac/yr 1.00 MF High Very High Res 20+ du/gross acreXRR 0.30 Af/ac/yr 1.21 SF Very Low Rural Res 0-2.9 du/gross acre zones 23&25XRRE 0.39 Af/ac/yr 1.21 SF Very Low Rural Res 0-2.9 du/gross acre East (MCR)XS 1.00 Af/ac/yr 1.00 Public Schools (excludes playing fields)XV 0.00 Af/ac/yr 1.00 Vacant VacantLand Use Code WUF UnitsTable A-2Future <strong>Water</strong> Use FactorsDry Year UseFactorLand UseGroupingDescriptionINTERAGENCYPort <strong>Costa</strong> 184.17 Af/yr 1.00 MixedActual metered deliveries plus av<strong>ai</strong>lable General<strong>Plan</strong> land useSCWC (Bay Point) 1,000 Af/yr 1.00 Wholesale Treated water deliveries to Bay PointTOP USERSTop Res. Users 312.32 Af/yr 1.00 Topuser Apartment complexes and mobile home parksTop NonRes Users 1,348.80 Af/yr 1.03 TopuserGolf course, parks, high rise offices, hotels, misc.industryFUTURE LAND USESCCAG 0.50 Af/ac/yr 0.85 AgCounty: Agriculture (assumed 85% of av<strong>ai</strong>lableland developed)CCC 2.48 Af/ac/yr 1.00 Commercial County CommercialCCIL 0.10 Af/ac/yr 1.00 Industrial County Industrial Low UseCCMFHD 6.50 Af/ac/yr 1.00 MF High County: Multifamily High Density 18.9-29.9CCMFLD 3.63 Af/ac/yr 1.00 MF LowCounty: Multifamily Low Density 6.6-10.7 du/grossacreCCMFMD 4.50 Af/ac/yr 1.00 MF MediumCounty: Multifamily Medium Density 10.8-18.8du/gross acreCCMFVHD 6.50 Af/ac/yr 1.00 MF HighCounty: Multifamily Very High Density 27-40.4du/gross acreCCMFVHSD 6.50 Af/ac/yr 1.00 MF HighCounty: Multifamily Very High Special 40.5-89.9du/gross acreCCSFHD 3.10 Af/ac/yr 1.00 SF MediumCounty: Single Family High Density 4.5-6.5du/gross acreCCSFLD 2.73 Af/ac/yr 1.00 SF LowCounty: Single Family Low Density 0.9-2.61du/gross acreCCSFMD 3.10 Af/ac/yr 1.00 SF MediumCounty: Single Family Medium Density 2.7-4.41du/gross acreCCSFVLD 0.90 Af/ac/yr 1.00 SF Very LowCounty: Single Family Very Low Density .18-.81du/gross acreCBP 1.53 Af/ac/yr 1.00 Office Concord: Business ParkCC 2.48 Af/ac/yr 1.00 Commercial Concord: Commercial Ret<strong>ai</strong>lCHDR 6.50 Af/ac/yr 1.00 MF HighConcord: High Density Residential 24-100 du/grossacreCHRO 3.13 Af/ac/yr 1.00 Office Concord High Rise OfficeCIL 0.10 Af/ac/yr 1.00 Industrial Concord: Industrial Low UseCLDR 3.63 Af/ac/yr 1.00 MF LowConcord: Low Density Residential 3-10 du/grossacreCLC 2.48 Af/ac/yr 1.00 Commercial Clayton CommercialCLHD 3.10 Af/ac/yr 1.00 SF Medium Clayton: High Density 5-7.5 du/gross acreA 2007 Treated <strong>Water</strong> <strong>Master</strong> <strong>Plan</strong> Update A-3
Appendix ADemand Projection MethodologyLand Use Code WUF UnitsTable A-2Future <strong>Water</strong> Use FactorsDry Year UseFactorLand UseGroupingDescriptionCLLD 2.73 Af/ac/yr 1.00 SF Low Clayton: Low Density 1-3 du/gross acreCLMCRSP-LDR 0.90 Af/ac/yr 1.00 SF Very LowClayton Low Density Res. 1.11-1.5 du/gross acre(MCRSP)CLMCRSP-MDR 2.73 Af/ac/yr 1.00 SF LowClayton Medium Density Res. 1.51-2.2 du/grossacre (MCRSP)CLMCRSP-SDR 2.73 Af/ac/yr 1.00 SF LowClayton Suburban Density Res. 2.21-3.0 du/grossacre (MCRSP)CLMD 3.10 Af/ac/yr 1.00 SF Medium Clayton: Medium Density 3-5 du/gross acreCLMFLD 3.63 Af/ac/yr 1.00 MF LowClayton: Multifamily Low Density 7.5-10 du/grossacreCLMFMD 4.50 Af/ac/yr 1.00 MF MediumClayton: Multifamily Medium Density 10-15du/gross acreCLP 1.00 Af/ac/yr 1.00 Public Clayton Public/Semi PublicCLRE 0.90 Af/ac/yr 1.00 SF Very Low Clayton: Rural Estate 0.2-1 du/gross acreCLSC 0.20 Af/ac/yr 1.00 SF Very Low Clayton: Slope Conservation 0-0.1 du/gross acreCMDR 4.50 Af/ac/yr 1.00 MF MediumConcord: Medium Density Residential 10-24du/gross acreCNWS 0.00 Af/ac/yr 1.00 CNWS Concord Naval Weapons StationCPQ 1.00 Af/ac/yr 1.00 Public Concord: Public/Quasi PublicCPRI 3.36 Af/ac/yr 1.00 Parks Concord: Public Recreation IrrigationCRO 1.53 Af/ac/yr 1.00 Office Concord Regional OfficeCRR 2.73 Af/ac/yr 1.00 SF Low Concord: Rural Residential 0-2.5 du/gross acreMBP 1.53 Af/ac/yr 1.00 Office Martinez Business ParkMC 2.48 Af/ac/yr 1.00 Commercial Martinez CommercialMCRR 0.00 Af/ac/yr 1.00 SF Very LowMCRSP Ranchette with no future connection tosystemMHP 2.20 Af/ac/yr 1.00 SF High Mobile Home ParkMIL 0.10 Af/ac/yr 1.00 Industrial Martinez Industrial Low UseMMFLD 3.63 Af/ac/yr 1.00 MF LowMartinez Multifamily Low Density 7-12 du/grossacreMO 1.53 Af/ac/yr 1.00 Office Martinez OfficeMR 3.10 Af/ac/yr 1.00 SF Medium Martinez Residential 0-6 du/gross acrePHCR 2.48 Af/ac/yr 1.00 Commercial Pleasant Hill: Commercial/Ret<strong>ai</strong>lPHMFLD 4.50 Af/ac/yr 1.00 MF MediumPleasant Hill: Multi Family Low Density 6.3-17.9du/gross acrePHMFMD 6.50 Af/ac/yr 1.00 MF HighPleasant Hill: Multi Family Medium Density 18-26.9du/gross acrePHO 1.53 Af/ac/yr 1.00 Office Pleasant Hill: OfficePHP 1.00 Af/ac/yr 1.00 Public Pleasant Hill: Semi-Public and InstitutionalPHPRI 3.36 Af/ac/yr 1.00 Parks Pleasant Hill: Public Recreation IrrigatedPHS 1.00 Af/ac/yr 1.00 Public Pleasant Hill: SchoolsPHSFHD 3.10 Af/ac/yr 1.00 SF MediumPleasant Hill: Single Family High Density 4.1-6.2du/acrePHSFLD 2.73 Af/ac/yr 1.00 SF LowPleasant Hill: Single Family Low Density 1.17-2.7du/acrePHSFMD 3.10 Af/ac/yr 1.00 SF Medium Pleasant Hill: Single Family Medium Density 2.8-4.1WCBP 1.53 Af/ac/yr 1.00 Office Walnut Creek: Business ParkWCMFL 3.63 Af/ac/yr 1.00 MF LowWalnut Creek: Multifamily Low 5.4-12.6 du/grossacreWCMFM 4.50 Af/ac/yr 1.00 MF MediumWalnut Creek: Multifamily Medium 12.6-19.8du/gross acreWCMFMH 6.50 Af/ac/yr 1.00 MF HighWalnut Creek: Multifamily High 19.8-27 du/grossacreWCMFVH 6.50 Af/ac/yr 1.00 MF HighWalnut Creek: Multifamily Very High 27-45du/gross acreWCPRI 3.36 Af/ac/yr 1.00 Parks Walnut Creek: Public Recreation IrrigatedA-4 2007 Treated <strong>Water</strong> <strong>Master</strong> <strong>Plan</strong> Update A
Appendix ADemand Projection MethodologyLand Use Code WUF UnitsTable A-2Future <strong>Water</strong> Use FactorsDry Year UseFactorLand UseGroupingDescriptionWCPU 1.00 Af/ac/yr 1.00 Public Walnut Creek: Public/Semi PublicWCSC 2.48 Af/ac/yr 1.00 Commercial Walnut Creek: Service CommercialWCSFL 2.73 Af/ac/yr 1.00 SF LowWalnut Creek: Single Family Low 0.9-2.7 du/grossacreWCSFM 3.10 Af/ac/yr 1.00 SF MediumWalnut Creek: Single Family Medium 2.7-5.4du/gross acreWCSFVL 0.90 Af/ac/yr 1.00 SF Very LowWalnut Creek: Single Family Very Low 0.09-0.9du/gross acrePHBART11_12 177.00 Af/yr 1.00 MF HighPH BART Area Specific <strong>Plan</strong> Amendments ScenarioIIPHBART14A 4.00 Af/yr 1.00 CommercialPH BART Area Specific <strong>Plan</strong> Amendments ScenarioIIPHBART15 71.00 AF/yr 1.00 MF HighPH BART Area Specific <strong>Plan</strong> Amendments ScenarioIITable A-3Unaccounted for <strong>Water</strong> EstimatesService AreaUnaccounted For <strong>Water</strong>1 10.6%2 7.7%3 4.9%4 0.3%5 0.3%6 26.6%7 20.9%8 31.9%Bay Point 10.6%Notes:1. Unaccounted for water estimates were based on consumption and production data from 1996-1999. Calculated as percent of production.2. Service Areas 6, 7, and 8 have high unaccounted for water due to operational practice ofbleeding water back from the higher zones to m<strong>ai</strong>nt<strong>ai</strong>n water quality.3. Bay Point is delivered treated water from a pipeline extending from Zone 1. Zone 1unaccounted for water was assumed for SCWC demands.A.2 Demand Allocation to the Hydraulic ModelThe updates to the hydraulic model demand allocation used the following information in GIS format:• Existing and future land use coverage;• Demand polygon layer;• Pressure zone boundary layer; and• Current H2ONET hydraulic model.The water demands were allocated to the hydraulic model nodes (junctions) for existing, intermediate andbuildout demand scenarios using the GIS land use information. The process of updating the spatialdistribution of water demands for the <strong>District</strong>’s hydraulic model included the following procedures:A 2007 Treated <strong>Water</strong> <strong>Master</strong> <strong>Plan</strong> Update A-5
Appendix ADemand Projection Methodology• Checking the existing demand polygon layer using the Cal-Grid Maps as a reference and makingupdates as necessary to include new developments since the last Treated <strong>Water</strong> <strong>Master</strong> <strong>Plan</strong> updateand resolving major gaps around the edges due to digitizing discrepancies.• Excluding nodes from the demand allocation process for locations where there are no customerservice connections. Such locations include: major transmission lines 20-inch diameter and larger;nodes at high elevations near reservoirs; and, nodes at the suction and discharge side of pumpstations.• Using the Thiessen polygon method to allocate demands within each demand polygon. The Thiessenpolygon method draws a service area around each node based on the mid-point distance of theadjacent nodes.• Using GIS tools to intersect the Thiessen polygons with the land use to determine the area of eachland use type served by a node.• Calculating demands by node, by multiplying the normalized unit demand factors with the area ofeach land use type allocated to that node, and then summing all the demands.• Adding large user demands to nodes after the initial land-use based demand allocation.• This GIS demand allocation approach was applied to the existing and buildout scenarios. Theintermediate demands were interpolated linearly using existing and buildout demands.A-6 2007 Treated <strong>Water</strong> <strong>Master</strong> <strong>Plan</strong> Update A
Appendix BSeismic Reliability ImprovementProject Reliability Criteria
Appendix CHydraulic Model Calibration
Appendix CHydraulic Model CalibrationC.1 Calibration OverviewThe <strong>District</strong>’s model of the treated water system was tested by simulating historic operating conditions forJuly 9, 2006. Due to the fact that Zone 1 represents approximately half of the total demand and the<strong>District</strong>’s confidence in the model, only Zone 1 facilities were calibrated. Model results were comparedwith actual operating data from SCADA to see how well the model reproduced actual system operation.The calibration process consisted of two m<strong>ai</strong>n activities:• CDM imported SCADA Data from July 9, 2006. July 9 was selected because it was a relatively hotsummer day, with a maximum temperature in Concord of 100°F. Therefore, demands and flow ratesshould approximate max-day conditions. For Zone 1 facilities, time-based pump “on” and “off”controls and Bollman clearwell water level were imported from SCADA. Initial reservoir levels andpump statuses were also set to match the SCADA data. Demands for Zone 1 were calculated fromSCADA data and subsequently imported into the model below. All upper zone demand multiplierswere assumed to be the same to the Zone 1 multiplier.• CDM ran the model, and compared model results with Zone 11 SCADA data, and adjusted the modelwhere possible. This process was an iterative one. Hourly SCADA pump flow rates, dischargepressures, and tank levels were compared with model outputs to guide calibration efforts. CDMadjusted pump controls, pump curves, and tank max/min levels.The principal finding of the model calibration effort was that system pressures were slightly over-predictedin Zone 11. Bollman High Lift Pump Station pressures were about 5 psi higher than observed values.This result is consistent with 2002 calibration findings. Due to uncert<strong>ai</strong>nties in the accuracy of the flowmeter at the Bollman High Lift Pump Station, no adjustments were made.This appendix provides det<strong>ai</strong>ls on the data and methods used, and the model calibration results. Plots ofBollman High Lift pump station discharge pressure and flow, pump flows for pumps pumping out of Zone11, and Zone 11 reservoir levels are included at the end of this appendix section.C.2 Av<strong>ai</strong>lable SCADA Data<strong>CCWD</strong> provided CDM with the following SCADA output from July 9, 2006:• Hourly flow rates and discharge pressure data for Bollman High Lift Pump Station.• Hourly flow rates data at each Zone 1 to Zone 2/Zone 3 pump station.• Hourly tank level data from each Zone 1 reservoir.• Timing of status changes (on/off) for each Bollman High Lift pump. The initial status of each pumpwas inferred from this data.• Timing of status changes (on/off) for each Zone 1 to Zone 2/Zone 3 pump. The initial status of eachpump was inferred from this data.C.3 Calculating DemandsThe demand set used for model calibration is a modified version of the demand set calculated for the“Existing” model scenario. The “Existing” scenario demands were calculated based on land use data foreach parcel of property in the <strong>District</strong>, and they can be summed up by zone using the first two digits of theNode ID as the zone identifier. To adjust these demands for the “Calibration” scenario, CDM firstA 2007 Treated <strong>Water</strong> <strong>Master</strong> <strong>Plan</strong> Update C-1
Appendix CHydraulic Model Calibrationcalculated demands for Zone 11 from the SCADA hourly pumping and tank level data, using the followingsimple relationship for each hour:(Zone Demand) = (Pumped Inflow) – (Pumped Outflow) – (Change in Storage)These hourly demands were then normalized to produce a demand pattern and an average demand thatcould be used to appropriately scale the zone demands up or down, as needed.Wash water demands for the treatment plant (Node 11006) were set independently, using a flow rate of10 MGD. The washwater demand was modeled every four hours, and was set so that washwater demandwould not coincide with the peak hour demand period.The total estimated system demand of Zone 1 for July 9, 2006 is 33 mgd. This is 85% of the MaximumDay demand for Zone 11 used in the existing scenario.C.4 Model Setup and EvaluationInitial tank levels, initial pump and valve statuses, and pump and valve status changes reported in SCADAwere imported into the model so that model simulation would mimic actual operation. Upper Zonepumps were allowed to operate based on the level in their respective Zone tanks. The model was run fora 24-hour extended period simulation, with a hydraulic time step of 1 hour. To visually assess how wellthe modeled output compared with the SCADA output, tank levels, discharge pressures, and total pumpstation flow rates from both the model and the SCADA system were compared.C.5 Model ResultsIn Zone 11, the same trends were observed in both the model and SCADA output and tanks generallywere within 1 to 2 feet of recorded values. A few tanks and pump stations tracked almost perfectly.Since Zone 11 demands were calculated directly from pump station flow rates, the model mustaccurately reproduce these flows, or the zone storage tanks will fill or dr<strong>ai</strong>n over time. Where SCADA datawere known to be suspect (e.g. Country Club Pump Station flow rates) or missing, pump on/off data andpump station rated flow capacities were used to infer flow.The primary finding of the evaluation was that the model overpredicts Bollman High Lift Pump Stationpressures by about 5 psi, and appears to correspondingly somewhat underpredict pump station flow. Allreservoirs track reasonably with SCADA data, except Taylor Reservoir and Diablo Hills Reservoir, whichshow more dr<strong>ai</strong>ning in the model than reported in SCADA. Because of uncert<strong>ai</strong>nties in the accuracy ofthe flow meter at the Bollman High Lift Pump Station, no adjustments were made. The model is areasonable, possibly slightly conservative, representation of Zone 11 operations.C.6 RecommendationsCDM recommends checking and re-calibrating Country Club Pump Station flow meter. Recorded values inSCADA were only 11 percent of rated pump capacity.C-2 2007 Treated <strong>Water</strong> <strong>Master</strong> <strong>Plan</strong> Update A
Appendix DMPP Long-term Alternatives Evaluation
Appendix DMulti-Purpose Pipeline Long-term Configuration AnalysisThe Multi-Purpose Pipeline (MPP), originally designed to deliver water to subzone 11, is currentlyconfigured to serve subzone 21, due to problems encountered during startup. This configuration is aninterim configuration. Improvements will be required for reliable long-term operation of the MPP. ThisTreated <strong>Water</strong> <strong>Master</strong> <strong>Plan</strong> update assessed long-term options for the MPP. The work builds on a <strong>District</strong>study completed in December 2005. The analysis addressed the following questions:• How long can the MPP interim operational configuration be used before adversely affecting subzone11 operation?• What improvements would be required for long-term operation of MPP to subzone 11 or subzone 21?• Which is the recommended long-term configuration?D.1 BackgroundThe MPP was completed in 2003 based on the design requirement of delivering up to 25 MGD to the<strong>District</strong>’s Treated <strong>Water</strong> Service Area (TWSA) subzone 11. The pipeline is called multi-purpose because itcan serve treated water to both the treated water service area and <strong>Contra</strong> <strong>Costa</strong> Canal wholesalecustomers in the event of a canal outage or emergency. The pipeline also is capable of serving water inthe reverse direction, from the treated water service area towards the Randall-Bold WTP. In the event ofa regional disaster, such as a large earthquake, the pipeline is also designed to connect up to one of the<strong>District</strong>'s raw water sources to provide water for fire fighting.Problems encountered during start-up testing in 2003 required the <strong>District</strong> to evaluate alternatives forMPP service to the TWSA. Pumps were designed for a very conservative subzone 11 gradient, based onmaximum day buildout conditions, and several problems were encountered during initial operation,including:• Low pressures, less than the 5 psi mandated by California Code of Regulations, Title 22, at the MPPhigh point located at Ridgeline Drive in Antioch.• A lower than expected hydraulic grade line (HGL) at the Antioch Turnout, making reliable delivery toAntioch difficult, especially at lower demand conditions.• The MPP pumps operate off of the manufacturer published curves at low flow conditions. Minimumsystem pressures at low flow conditions are lower than the minimum operating heads for one, two orthree small MPP pumps operating.As an interim measure, the <strong>District</strong> re-zoned the subzone 11 Port Chicago Phase 1 Pipeline to subzone21, and installed a bypass at Willow Pass PS, to allow delivery of MPP water to subzone 21. This interimoperational configuration has mitigated all of the above identified problems. The only negative impactfrom this operation is that the re-zoning of the Port Chicago Phase 1 Pipeline to subzone 21 has reducedtransmission capacity in subzone 11, consequently increasing discharge pressures at the Bollman HighLift Pump Station. This has both reduced the capacity of the pump station, and caused higher operatingpressures in the northern part of subzone 11, where customer service elevations are lowest andoperating pressures are already high. The pump station has a pressure relief valve that discharges waterback to the WTP clearwell, to avoid over-pressurizing areas around the WTP.Operation of the MPP at higher flowrates (more than 10 mgd), also causes pressures in the Port ChicagoPhase 1 Pipeline that are 10 to 20 psi higher than the design working pressure of 140 psi, in the reachbetween Bates Avenue and Arnold Industrial Way. The pipeline is steel, which is typically designed with aA 2007 Treated <strong>Water</strong> <strong>Master</strong> <strong>Plan</strong> Update D-1
Appendix DMulti-Purpose Pipeline Long-term Configuration Analysissurge allowance of 150% of design working pressure. Therefore, this modest over-pressure is likely not asignificant issue. However, the <strong>District</strong> should verify that operating pressures are below the test pressurethat was used to test the pipeline during installation.D.2 Interim OperationOne question to be addressed by the analysis is how long can the <strong>District</strong> continue to operate in thecurrent interim configuration. As noted above, the primary negative impact with this configuration is theloss of conveyance capacity in subzone 11, which results in higher discharge pressures at the BollmanHigh Lift Pump Station, and a corresponding reduction in pump station flow capacity. Indirectconsequences include the more frequent operation of the relief valve at the pump station, to avoid overpressurizinglow-lying areas in the zone, and difficulty re-filling Diablo Hills Reservoir, in the southern endof subzone 11, furthest from the Bollman WTP.The highest maximum demand day in the treated water service area was in 2006, when demand was 71mgd. To assess interim operation, an extended period simulation of the existing maximum day scenariowas performed to assess subzone 11 operation. The existing maximum day scenario uses normalizeddemands, which are higher to reflect drought years without cutbacks, and has a base demand of 81 mgd,about 14% higher than the maximum day demand in 2006.The hydraulic analysis of the existing maximum day scenario identified the following constr<strong>ai</strong>nts in subzone11:• Bollman High Lift Pump Station discharge pressures range from 89 psi to 117 psi. A threshold of110 psi was used in the analysis. This pressure was exceeded 14 of 24 hours in the simulation(operation of the relief valve was not simulated).• Diablo Hills Reservoir operates between 50% and 60% full in its current configuration. The reservoirpiping is currently configured so that Ygnacio Pump Station draws suction only from the reservoir, notfrom the system. This configuration was implemented for water quality purposes, to improvereservoir turnover during lower demand months. With the configuration revised so that the reservoirfloats on the system, the operating levels increased to 60% to 80% full.Based on these constr<strong>ai</strong>nts, 81 mgd was identified as the threshold at which the MPP could no longer beoperated in the current interim configuration.D.3 Long-term AlternativesThe second question to be addressed by the analysis is what are potential long-term configuration for theMPP? Table D-1 summarizes the three long-term alternatives identified and evaluated. The tableincludes a description of required components, and estimated capital and life-cycle costs. The life-cyclecost analysis used an interest rate of 6 percent, an inflation rate of 3 percent, and a 30-year life. Annualcosts estimated the energy cost for operation of the alternatives. Energy costs for pumping MPP directlyto subzone 21 are somewhat lower than pumping MPP to subzone 11, and then boosting water tosubzone 21 through existing TWSA pump stations because the <strong>District</strong> has a contract to receive WesternArea Power Association/Modesto Irrigation <strong>District</strong> power at the Randall-Bold WTP, while TWSA pumpstations are served by PG&E. 11 A blended rate of $0.085/kwh was used for WAPA/MID power and a blended rate of $0.125/kwh was used for PG&Epower. Blended rates reflect a composite of seasonal energy charges, demand charges and other charges.D-2 2007 Treated <strong>Water</strong> <strong>Master</strong> <strong>Plan</strong> Update A
Appendix DMulti-Purpose Pipeline Long-term Configuration AnalysisOption A: Service to Subzone11 with PR Station at AntiochTurnoutRequired Improvements:• Install 25 mgd pressuresust<strong>ai</strong>ning valve stationat Antioch TurnoutTable D-1Summary of MPP Long-Term Configuration AlternativesOption B: Service to Subzone 11with Booster Station at AntiochTurnout• Microtunnel 900 to 1,800feet of pipeline at RidgelineDrive, to lower pipeline• Replace pump impellers forimproved low-flowperformance• Install a 10 mgd boosterpump station at the AntiochTurnoutOption C: Service to Subzone21• Install approximately16,000 feet of new 36-inch diameter pipeline toconnect MPP to subzone21• Return Port Chicago Phase1 PL to subzone 11serviceEstimated Capital Costs (Million $) (1)$0.9 $8.8 $18.7 – 20.3Estimated Annual Energy Costs (Million $)$1.1 $1.1 $0.8Estimated Present Worth Life-Cycle Costs (Million $)$23 $34 $43 – 45(1) Low and high cost for Option C based on possible alignment alternatives for pipeline. See text for det<strong>ai</strong>ls.D.3.1 Option A: MPP to Subzone 11 with Pressure Reducing Station at Antioch TurnoutAn alternative configuration which would allow the Port Chicago Phase 1 Pipeline to be re-zoned tosubzone 11 was identified by the <strong>District</strong> as part of the December 2005 analysis. This configurationwould involve construction of a pressure sust<strong>ai</strong>ning valve station at the Antioch turnout. The valve wouldbe throttled to m<strong>ai</strong>nt<strong>ai</strong>n a back-pressure on the initial reach of the MPP, allowing the pumps to operate ontheir curves, and to serve Antioch at the required HGL.This operation would require continuous operation of at least one MPP pump to m<strong>ai</strong>nt<strong>ai</strong>n backpressure toserve Antioch turnout.Worst-case conditions for m<strong>ai</strong>nt<strong>ai</strong>ning pressure at Ridgeline Drive are when no MPP pumps are operatingand the MPP is being supplied from the TWSA, either to supply Antioch (normal operations), or theRandall-Bold WTP clearwell (emergency or outage conditions). Figure D-1 shows the Bollman High Lift PSsystem curve, with pump operation curves overl<strong>ai</strong>n. Points shown in blue indicate discharge pressures atthe pump station prior to the rezoning of the Port Chicago Pipeline to subzone 21. Points shown in yellowindicate discharge pressures after the rezoning of the pipeline. The chart also shows horizontal linesindicating feasible MPP pipeline reverse flowrates from subzone 11 while m<strong>ai</strong>nt<strong>ai</strong>ning 5 psi at RidgelineDrive. As the figure indicates, reverse flow in the MPP is only feasible with three small pumps or onesmall and one large pump at Bollman High Lift PS operating.Because of these constr<strong>ai</strong>nts, this option would most effective as a seasonal alternative, implementedduring high demand periods, when the Port Chicago Phase 1 Pipeline is needed for subzone 11 capacity.This configuration has a capital cost of $0.8 million.A 2007 Treated <strong>Water</strong> <strong>Master</strong> <strong>Plan</strong> Update D-3
Legend110SL5SSL6SL5SSSSL6SSL5SSSSL5L6SSL6SSSL5SL5L6SSSL6SSSSL5SSSSL6SSSL5L6SSSSL5L6PCPL Phase 1 to Zone 21PCPL Phase 1 to Zone 11Existing SystemPort Chicago PL Phase 1Port Chicago PL Phase 1 & 2Port Chicago PL Phase 1,2 & 3105Current Relief Valve SettingsS = 700 Hp "Small" Pump 1,2,3,& 4100L5 = 1500 Hp "Large" Pump 5L6 = 1500 Hp "Large" Pump 6Discharge Pressure (psi)959085807570Deliveries with CurrentPL High Point (203.5 feet)Deliveries with LowerPL High Point (183.5 feet)10 MGD0 MGD10 MGD0 MGD65600 10 20 30 40 50 60 70 80 90 100 110 120Flow (mgd)60 psi = 179 feet HGLW:\REPORTS\<strong>CCWD</strong>\<strong>Master</strong> <strong>Plan</strong>_Apr07\Figures\Zone 11 Operating Conditions for Service to RBWTP_FigD-1.<strong>ai</strong> 05/11/07 JJTFigure D-1Zone 11 Operating Conditions for Service to Randall-Bold WTP
Appendix DMulti-Purpose Pipeline Long-term Configuration AnalysisD.3.2 Option B: MPP to Subzone 11 with Booster Pump Station at Antioch TurnoutOption B involves structural improvements to return MPP to subzone 11 operation, including installing abooster pump station to serve Antioch, microtunneling through the high point at Ridgeline Drive, andreplacing MPP PS impellers to improve low flow performance.A booster pump station would be needed to reliably supply Antioch. The <strong>District</strong> has a contract to provideup to 10 mgd to Antioch. A gradient of 248 feet to 260 feet is required at the Antioch turnout to serveAntioch’s Larkspur Tank (overflow 248 feet). Deliveries cannot be reliably met even with MPP pumpsrunning and only one or two Bollman High Lift pumps running.Microtunneling through the pipeline highpoint is required to lower the pipeline. The pipeline has amaximum elevation of 203.5 feet, requiring a minimum hydraulic gradient of 215 feet to m<strong>ai</strong>nt<strong>ai</strong>n 5 psiat the pipeline high point. The <strong>District</strong> has an operations plan for required protocols should the pipelinedrop below 5 psi that includes providing notification to the Department of Health Services and additionalwater quality monitoring. When the MPP pump station is off and the Bollman High Lift PS is off or runningonly one pump, the gradient drops below the minimum required gradient.The <strong>District</strong> MPP evaluation (<strong>CCWD</strong>, December 2005) assessed lowering the pipeline 20 feet, to amaximum elevation of 183.5, with a required minimum gradient of 195 feet to m<strong>ai</strong>nt<strong>ai</strong>n 5 psi at the highpoint. This would require microtunneling for about 900 feet of pipeline length. Figure D-1 shows feasibleMPP pipeline reverse flowrates from subzone 11 while m<strong>ai</strong>nt<strong>ai</strong>ning 5 psi at Ridgeline Drive at the lowerelevation, compared with the current elevation.The <strong>Master</strong> <strong>Plan</strong> analysis evaluated further lowering the pipeline. As Figure D-2 shows, the MPP pipelineis within the <strong>Contra</strong> <strong>Costa</strong> Canal alignment as it crosses Ridgeline Drive. This reach is also where thecanal is tunneled through the hillside. Although a det<strong>ai</strong>led review was not performed, potentialconstr<strong>ai</strong>nts to tunneling deeper in this location were identified. The pipeline is on the south side of thetunneled section of the canal in this reach. Microtunneling would likely be to the north of the tunnel, butthe alignment is relatively narrow on the east end of the tunneled section, and could potentially encroachtoo closely to the existing canal tunnel, constructed in the 1940’s. A second alignment, along Wild HorseRoad, was also investigated. This alternative is considerably longer, and would require several bends tofollow the road right-of-way. Construction costs would be considerably higher for this alignment, so it wasnot considered further. Capital costs presented in Table 5.6 are provided for microtunneling along thecanal route at the assumed depth indicated in the December 2005 study.D.3.3 Option C: MPP to Subzone 21Option C involves installing approximately 16,000 feet of new 36-inch diameter pipeline from the MPPterminus at Bates Avenue and Port Chicago Highway to the Willow Pass Pump Station. Port ChicagoPhase 1 Pipeline would be re-zoned to subzone 11.Two alternative alignments were considered for this option. One alternative follows the route of theexisting Port Chicago Phase 1 Pipeline. The existing pipeline runs along Port Chicago Highway to theNorth Concord Bay Area Rapid Transit (BART) station, where it crosses through the BART station to theeast, and runs along the western edge of the Concord Naval Weapons Station. South of the existingmilitary housing on East Olivera Road, the pipeline runs west to East Olivera Road, and then along OliveraRoad and Willow Pass Road to the Willow Pass Pump Station. Of the 16,000 feet, approximately 10,000feet would be in surface streets, requiring traffic control. The pipeline would also cross under Highway 4and underneath the BART tracks. Jack and bore crossings were assumed at each location.D-4 2007 Treated <strong>Water</strong> <strong>Master</strong> <strong>Plan</strong> Update A
Ridgeline DriveProposed Ridgeline Ridgeline Drive Drive ImprovementImprovementMendota Way WayWild Horse RoadMenona CourtEllis CourtTemblor WayElev. 146’Elev. 134’Figure D-2MPP Alignment at Ridgeline DrivePalisades Way WayMulti-Purpose Pipeline Pipeline (MPP) (MPP)W:\REPORTS\<strong>CCWD</strong>\<strong>Master</strong> <strong>Plan</strong>_Apr07\Figures\MPP Alignment at Ridgeline Drive_FigD-2.<strong>ai</strong> 05/14/07 JJT0400NFeet
Appendix DMulti-Purpose Pipeline Long-term Configuration AnalysisAnother alignment alternative is to coordinate the pipeline with potential development of the formerConcord Naval Weapons Station (CNWS). A specific alignment was not identified, but was assumed tohave the same length of 16,000 feet, with 6,000 feet in existing streets, from the MPP tie-in to south ofHighway 4, and then 10,000 feet of pipeline through the CNWS, coordinated with potential development.The location and sizing of this pipeline could also be coordinated/integrated with the proposed northernbackbone in the Clayton Valley that is proposed for the northern side of subzones 21, 31 and 41.The estimated capital cost for the option through the CNWS is slightly lower in cost, due to the opportunityto coordinate placement of the pipeline with construction of new roads within the CNWS.D 3.4 Potential Deliveries to the CNWSPotential deliveries from the MPP to the CNWS were estimated with the MPP configured to subzone 11(Options A and B) and to subzone 21 (Option C). The analysis included the following assumptions:• Buildout maximum day demand conditions with 10 mgd to Antioch• MPP PS modeled as a constant inject• CNWS deliveries modeled as a constant takeout, at Bates Avenue and Port Chicago Highway• Maximum allowable pressures in the MPP based on pipeline design pressure, which ranges from 200psi, along the canal, to 300 psi near the pump stationMPP PS flows and CNWS were increased until pressures were at or near the pipeline design pressure.Subzone 11 and 21 storage reservoirs were reviewed to make sure that zone storage was balancing overthe 24-hour simulation period.The analysis found that for MPP delivery to subzone 11, a maximum delivery of 24 mgd was feasible. Fordelivery to subzone 21, a maximum delivery of 17 mgd was feasible.Once planning information becomes av<strong>ai</strong>lable on CNWS development options, a more det<strong>ai</strong>led hydraulicevaluation will be conducted to evaluate conceptual alternatives for service to the CNWS.D.4 Key Findings and RecommendationsD4.1 Key FindingsOption A has the lowest implementation cost and shortest implementation time-frame. The primarydrawback with Option A is the need to continuously operate one or more MPP pumps, to m<strong>ai</strong>nt<strong>ai</strong>nbackpressure in the MPP to supply Antioch. The MPP also could not be used for reverse flow under lowdemand conditions. Option A and B also have the highest potential delivery flowrates to the CNWS, withan estimated 24 mgd possible under maximum day buildout conditions.Option B has higher implementation costs than Option A and a somewhat longer implementation time.Energy costs for Option B would be lower than Option A. While all flow to Antioch would need to beboosted, MPP pumps would operate at a lower TDH than for Option A, with the pressure sust<strong>ai</strong>ningstation.Option C has the highest implementation costs and the longest implementation time frame. The primaryadvantages of Option C are: the potential for coordination with future CNWS development, and with theproposed northern backbone for subzones 21, 31 and 41; and, more operational flexibility to reliablymeet the different operational needs of the MPP. The biggest drawback to this option is the uncert<strong>ai</strong>nimplementation time. As discussed in Chapter 3, the Concord City Council, which is serving as the LocalA 2007 Treated <strong>Water</strong> <strong>Master</strong> <strong>Plan</strong> Update D-5
Appendix DMulti-Purpose Pipeline Long-term Configuration AnalysisRe-development Authority for the re-use planning of the CNWS has just initiated the second phase of theproject, in which alternative development options will be developed and assessed for environmentalimpacts. The Phase 2 planning process has a three-year time-frame, after which a specific developmentoption will be selected and more det<strong>ai</strong>led plans will be developed. Although no timeline has beendeveloped for completion of Phase 3, the overall process is expected to take several years.Implementation of this option would likely be on a longer time frame than is needed, unless the interimoption of constructing the pressure sust<strong>ai</strong>ning valve station at Antioch turnout to return the MPP tosubzone 11 service, and re-zone the Port Chicago Pipeline to subzone 11 is implemented. Option C has adelivery potential of 17 mgd to the CNWS at buildout maximum day conditions.D4.2 RecommendationsBased on the analysis and discussions with <strong>District</strong> management staff, Option A, construction of thepressure sust<strong>ai</strong>ning valve station at the Antioch turnout is recommended. This project has an estimatedcapital cost of $0.8M.Because of its potential for coordination both with the CNWS and the proposed northern backbone in theConcord-Clayton Valley, Option C should be re-visited as part of the CNWS evaluation, which will beprepared as a supplement to this <strong>Master</strong> <strong>Plan</strong>. The current planning schedule for the CNWS is to identifypotential development alternatives by fall 2007, and select specific alternatives for environmentalanalysis. Once potential development alternatives are identified, a supplement to this <strong>Master</strong> <strong>Plan</strong> will beprepared, evaluating potential service to the CNWS.D-6 2007 Treated <strong>Water</strong> <strong>Master</strong> <strong>Plan</strong> Update A
Appendix EFire Flow Analysis Results
Appendix EFire Flow Analysis ResultsModel ID Zone Elevation(ft)Table E-1Av<strong>ai</strong>lable Fire Flow Less than 1000 gpmAv<strong>ai</strong>lable Fireflow(gpm)Description12038 11 70 960 Bart m<strong>ai</strong>ntenance yard, upgrading a 4" line to an 12"12040 11 70 990 Bart m<strong>ai</strong>ntenance yard, upgrading a 4" line to an 12"12042 11 100 660 Bart m<strong>ai</strong>ntenance yard, upgrading a 4" line to an 12"130112 11 75 110 Short 2" deadend13790 11 135 740 Via <strong>Plan</strong>eta13792 11 130 810 Via <strong>Plan</strong>eta13794 11 120 890 Via <strong>Plan</strong>eta13806 11 30 940 Arthur Rd13808 11 32 870 Arthur Rd13810 11 35 800 Arthur Rd13812 11 25 800 Arthur Rd13814 11 35 700 Arthur Rd13850 11 80 920 Arthur Rd340872 34 234 780 Dead End510056 51 556 950 Dead End510060 51 538 970 Dead End51118 51 545 670 Dead End51120 51 560 610 Dead End610280 61 600 970 Dead End64000 64 578 830 Dead End64020 64 649 840 Dead End64030 64 575 990 Dead End69002 69 600 860 Marsh Creek Transmission Upgrades79002 71 820 600 Marsh Creek Transmission Upgrades79004 71 825 590 Marsh Creek Transmission Upgrades79006 71 800 720 Marsh Creek Transmission Upgrades79008 71 800 730 Marsh Creek Transmission Upgrades79010 71 730 980 Marsh Creek Transmission Upgrades79012 71 725 1000 Marsh Creek Transmission UpgradesA 2007 Treated <strong>Water</strong> <strong>Master</strong> <strong>Plan</strong> Update E-1
Appendix EFire Flow Analysis ResultsTable E-2Av<strong>ai</strong>lable Fireflow, All Locations (1)Model ID Model Description Zone Elevation (ft) Av<strong>ai</strong>lable Fireflow(gpm)100004 Brittany Hills Unit 1 11 50 1,380100006 Brittany Hills Unit 1 11 60 1,320100016 Brittany Hills Unit 1 11 69 1,300100018 Brittany Hills Unit 1 11 61 1,000100020 Brittany Hills Unit 1 11 65 1,030100022 Brittany Hills Unit 1 11 69 1,110100024 Brittany Hills Unit 1 11 55 1,140100026 Brittany Hills Unit 1 11 60 1,200100028 Brittany Hills Unit 1 11 68 1,280110002 398003-4 inch FS Willow Pass Road 11 65.5 3,000110004 398003-4 inch FS Willow Pass Road 11 71 3,000110006 398003-4 inch FS Willow Pass Road 11 71 3,000110008 398003-4 inch FS Willow Pass Road 11 71 2,25011006 Junction 11 40 4,00011014 Junction 11 47 4,00011016 Junction 11 40 4,00011020 Junction 11 35 4,00011026 Junction 11 51 4,00011030 Junction 11 50 4,00011032 Junction 11 61 4,00011034 Junction 11 65 4,00011036 Junction 11 80 4,00011038 Junction 11 80 3,00011042 Junction 11 40 4,000110422 398034-1920 Mark Court 11 40 3,000110424 398034-1920 Mark Court 11 42.5 3,000110426 398034-1920 Mark Court 11 42.25 2,340110428 398034-1920 Mark Court 11 42.25 2,110110430 398034-1920 Mark Court 11 41.5 3,000110432 398034-1920 Mark Court 11 43.75 3,000110434 398037-Glen View 11 76 3,000110436 398037-Glen View 11 66 1,500110438 398037-Glen View 11 70 1,50011044 Junction 11 27 4,00011052 Junction 11 30 4,00011064 Junction 11 10 4,00011066 Junction 11 12 3,00011068 Junction 11 16 1,50011070 Junction 11 23 4,00011072 Junction 11 23 3,00011074 Junction 11 23 3,00011076 Junction 11 15 3,00011084 Junction 11 38 3,00011086 Junction 11 44 3,86011088 Junction 11 47 3,00011090 Junction 11 48 3,000110900 398032-2 FH near Arnold Indust. Way 11 34 4,000110902 398032-2 FH near Arnold Indust. Way 11 38 4,000110904 398032-2 FH near Arnold Indust. Way 11 34 4,000110906 398032-2 FH near Arnold Indust. Way 11 38 4,00011092 Junction 11 80 4,00011094 Junction 11 80 3,00011096 Junction 11 60 4,000E-2 2007 Treated <strong>Water</strong> <strong>Master</strong> <strong>Plan</strong> Update A
Appendix EFire Flow Analysis ResultsTable E-2Av<strong>ai</strong>lable Fireflow, All Locations (1)Model ID Model Description Zone Elevation (ft) Av<strong>ai</strong>lable Fireflow(gpm)11098 Junction 11 82 4,00011100 Junction 11 60 4,000111002 198602-Proposed fire service for Navy Ad 11 30 1,500111004 198602-Proposed fire service for Navy Ad 11 30 1,500111006 198602-Proposed fire service for Navy Ad 11 35 1,500111010 198602-Proposed fire service for Navy Ad 11 19 1,50011102 Junction 11 70 3,00011104 Junction 11 20 3,00011106 Junction 11 26 3,00011108 Junction 11 25 4,00011110 Junction 11 20 1,50011112 Junction 11 17 1,50011114 Junction 11 30 3,00011116 Junction 11 18 1,50011118 Junction 11 30 1,50011120 Junction 11 19 1,50011126 11 70 1,50011128 11 55 1,50011130 24 91 3,00011166 Junction 11 20 3,00011168 Junction 11 20 3,00011170 <strong>Water</strong> User #2 11 20 3,00011172 Junction 11 20 3,00011174 Junction 11 30 3,00011176 Junction 11 39 3,00011178 Junction 11 38 3,00011180 Junction 11 44 3,00011182 Junction 11 48 3,00011184 Junction 11 90 3,00011186 Junction 11 103 4,00011188 Junction 11 48 3,00011190 Junction 11 26 4,00011192 Junction 11 20 4,00011206 Junction 11 29 4,00011208 Junction 11 28 3,990112082 398017-Winton Jones Development 11 28 3,410112084 398017-Winton Jones Development 11 28 3,070112086 398017-Winton Jones Development 11 28 2,98011210 Junction 11 36 3,00011212 Junction 11 36 3,00011214 Junction 11 30 3,00011216 Junction 11 24 3,00011218 <strong>Water</strong> User #4 11 23 4,00011222 Junction 11 17 3,00011224 Junction 11 17 3,00011226 Junction 11 28 3,00011228 Junction 11 19 3,00011234 Junction 11 30 3,00011236 Junction 11 36 3,00011238 Junction 11 47 3,00011240 Junction 11 70 3,00011242 Junction 11 72 3,00011244 Junction 11 72 3,00011250 Junction 11 47 3,000A 2007 Treated <strong>Water</strong> <strong>Master</strong> <strong>Plan</strong> Update E-3
Appendix EFire Flow Analysis ResultsTable E-2Av<strong>ai</strong>lable Fireflow, All Locations (1)Model ID Model Description Zone Elevation (ft) Av<strong>ai</strong>lable Fireflow(gpm)11252 Junction 11 20 3,00011256 11 35 3,00011258 11 32 3,00011260 Junction 11 31 1,50011264 Junction 11 58 3,00011266 Junction 11 58 3,00011268 Junction 11 55 3,00011270 Junction 11 53 1,50011272 Junction 11 60 3,00011274 Junction 11 58 3,00011276 Junction 11 58 1,50011278 Junction 11 43 1,50011280 Junction 11 40 1,50011282 Junction 11 46 3,00011284 Junction 11 42 3,00011286 Junction 11 40 3,00011288 Junction 11 38 1,50011290 Junction 11 40 3,00011292 Junction 11 55 1,50011294 Junction 11 59 1,50011298 11 19 4,00011314 Junction 11 97 2,03011316 Junction 11 96 1,50011318 Junction 11 60 1,50011320 Junction 11 72 2,12011322 Junction 11 70 2,28011324 Junction 11 62 1,50011326 Junction 11 60 1,50011328 Junction 11 58 1,50011330 Junction 11 60 1,50011332 Junction 11 60 1,50011334 Junction 11 76 1,50011336 Junction 11 77 1,50011338 Junction 11 70 1,50011340 Junction 11 70 1,50011342 Junction 11 70 1,50011344 Junction 11 67 1,50011346 Junction 11 70 1,50011348 Junction 11 70 1,50011350 Junction 11 70 1,50011354 Junction 11 60 3,00011356 Junction 11 61 3,00011358 Junction 11 70 3,00011360 Junction 11 73 1,50011364 Junction 11 77 1,50011366 Junction 11 73 3,00011370 Junction 11 59 1,50011372 Junction 11 58 1,50011374 Junction 11 56 1,50011376 Junction 11 57 3,00011378 Junction 11 58 3,00011380 Junction 11 75 1,50011382 Junction 11 52 3,00011384 Junction 11 48 3,000E-4 2007 Treated <strong>Water</strong> <strong>Master</strong> <strong>Plan</strong> Update A
Appendix EFire Flow Analysis ResultsTable E-2Av<strong>ai</strong>lable Fireflow, All Locations (1)Model ID Model Description Zone Elevation (ft) Av<strong>ai</strong>lable Fireflow(gpm)11386 Junction 11 65 1,50011388 Junction 11 65 1,50011390 Junction 11 70 1,50011392 Junction 11 75 1,50011394 Junction 11 76 1,50011396 Junction 11 72 1,50011398 Junction 11 72 1,50011400 Junction 11 65 1,500114002 197615-Mt. View M<strong>ai</strong>n Replacement 11 52 3,000114004 197615-Mt. View M<strong>ai</strong>n Replacement 11 50 3,000114006 197615-Mt. View M<strong>ai</strong>n Replacement 11 48 3,000114008 197615-Mt. View M<strong>ai</strong>n Replacement 11 52 1,500114010 197615-Mt. View M<strong>ai</strong>n Replacement 11 55 1,500114012 197615-Mt. View M<strong>ai</strong>n Replacement 11 46 3,000114016 197615-Mt. View M<strong>ai</strong>n Replacement 11 71 1,500114018 197615-Mt. View M<strong>ai</strong>n Replacement 11 77 1,50011402 Junction 11 60 1,500114020 197615-Mt. View M<strong>ai</strong>n Replacement 11 65 1,500114022 197615-Mt. View M<strong>ai</strong>n Replacement 11 45 3,000114024 197615-Mt. View M<strong>ai</strong>n Replacement 11 44 3,000114026 197615-Mt. View M<strong>ai</strong>n Replacement 11 46 1,500114028 197615-Mt. View M<strong>ai</strong>n Replacement 11 46 1,500114030 197615-Mt. View M<strong>ai</strong>n Replacement 11 47 1,500114036 197615-Mt. View M<strong>ai</strong>n Replacement 11 41 3,00011404 Junction 11 62 1,500114040 197615-Mt. View M<strong>ai</strong>n Replacement 11 42 1,500114042 197615-Mt. View M<strong>ai</strong>n Replacement 11 43 1,500114044 197615-Mt. View M<strong>ai</strong>n Replacement 11 43 1,500114046 197615-Mt. View M<strong>ai</strong>n Replacement 11 44 1,500114048 197615-Mt. View M<strong>ai</strong>n Replacement 11 42 1,500114050 197615-Mt. View M<strong>ai</strong>n Replacement 11 43 1,50011406 Junction 11 61 1,50011408 Junction 11 75 1,50011410 Junction 11 67 2,73011412 Junction 11 68 1,50011414 Junction 11 70 2,61011416 Junction 11 73 1,50011418 Junction 11 75 1,50011420 Junction 11 75 1,50011422 Junction 11 84 3,00011424 Junction 11 69 1,50011426 Junction 11 76 1,50011428 Junction 11 77 1,50011430 Junction 11 76 1,50011434 Junction 11 77 1,50011436 Junction 11 76 1,50011438 Junction 11 76 1,50011440 Junction 11 60 1,50011442 Junction 11 60 1,50011444 Junction 11 62 1,50011450 Junction 11 28 3,00011454 Junction 11 20 3,00011458 Junction 11 38 4,00011464 Junction 11 25 3,000A 2007 Treated <strong>Water</strong> <strong>Master</strong> <strong>Plan</strong> Update E-5
Appendix EFire Flow Analysis ResultsTable E-2Av<strong>ai</strong>lable Fireflow, All Locations (1)Model ID Model Description Zone Elevation (ft) Av<strong>ai</strong>lable Fireflow(gpm)11466 Junction 11 20 4,00011468 Junction 11 24 4,00011470 Junction 11 25 3,00011472 Junction 11 24 3,00011474 Junction 11 24 3,00011478 Junction 11 25 3,00011480 Junction 11 29 3,00011482 Junction 11 30 4,00011484 Junction 11 26 4,00011488 Junction 11 34 4,00011494 Junction 11 48 3,00011496 Junction 11 50 3,00011498 Junction 11 50 3,00011500 Junction 11 50 3,00011502 Junction 11 45 1,50011504 Junction 11 40 1,50011506 Junction 11 42 3,00011508 Junction 11 58 2,92011510 Junction 11 62 3,00011512 Junction 11 63 2,79011516 Junction 11 56 1,50011518 Junction 11 56 1,50011520 Junction 11 55 1,50011522 Junction 11 65 1,50011524 Junction 11 60 1,50011526 Junction 11 72 1,50011528 Junction 11 70 1,50011530 Junction 11 70 1,50011532 Junction 11 105 1,50011534 Junction 11 72 1,50011536 Junction 11 105 2,09011538 Junction 11 100 1,50011540 Junction 11 75 1,17011542 Junction 11 75 1,10011544 Junction 11 75 1,12011546 Junction 11 79 3,00011548 Junction 11 98 2,32011550 Junction 11 78 3,00011552 Junction 11 75 3,00011554 Junction 11 81 3,00011556 Junction 11 95 3,00011558 Junction 11 98 1,50011560 Junction 11 95 1,50011562 Junction 11 87 3,00011564 Junction 11 95 3,00011570 Junction 11 95 1,50011572 Junction 11 90 3,00011574 Junction 11 92 3,00011578 Junction 11 96 1,50011580 Junction 11 100 3,00011582 Junction 11 102 3,00011584 Junction 11 98 3,00011590 Junction 11 70 3,00011592 Junction 11 70 2,850E-6 2007 Treated <strong>Water</strong> <strong>Master</strong> <strong>Plan</strong> Update A
Appendix EFire Flow Analysis ResultsTable E-2Av<strong>ai</strong>lable Fireflow, All Locations (1)Model ID Model Description Zone Elevation (ft) Av<strong>ai</strong>lable Fireflow(gpm)11596 Junction 11 67 3,00011600 Junction 11 60 3,00011602 Junction 11 56 3,00011604 Junction 11 56 3,00011606 Junction 11 52 2,84011608 Junction 11 61 1,43011610 Junction 11 62 3,00011612 Junction 11 65 3,00011614 Junction 11 60 3,00011616 Junction 11 69 1,55011618 Junction 11 65 3,00011622 Junction 11 63 3,00011624 Junction 11 63 3,00011626 Junction 11 64 3,00011628 Junction 11 65 3,00011630 Junction 11 69 3,00011634 Junction 11 73 3,00011636 Junction 11 72 3,00011638 Junction 11 72 3,00011646 Junction 11 40 3,00011658 Junction 11 65 2,02011660 Junction 11 58 2,96011662 Junction 11 45 2,51011664 Junction 11 38 2,18011666 Junction 11 60 3,00011668 Junction 11 48 3,00011670 Junction 11 32 3,00011674 Junction 11 48 3,00011676 Junction 11 45 3,00011678 Junction 11 39 3,00011680 Junction 11 38 4,00011686 Junction 11 45 4,00011688 Junction 11 42 3,00011690 Junction 11 52 3,00011692 Junction 11 58 3,00011694 Junction 11 56 3,00011696 Junction 11 75 3,00011698 Junction 11 88 3,00011700 Junction 11 88 3,00011702 Junction 11 85 3,00011704 Junction 11 84 3,00011706 Junction 11 83 3,00011708 Junction 11 82 3,00011712 Junction 11 101 1,50011714 Junction 11 100 1,50011716 Junction 11 101 1,50011718 Junction 11 99 1,50011720 Junction 11 100 1,50011722 Junction 11 95 3,00011724 Junction 11 100 3,00011726 Junction 11 97 3,00011728 Junction 11 97 3,00011730 Junction 11 100 3,00011732 Junction 11 100 1,500A 2007 Treated <strong>Water</strong> <strong>Master</strong> <strong>Plan</strong> Update E-7
Appendix EFire Flow Analysis ResultsTable E-2Av<strong>ai</strong>lable Fireflow, All Locations (1)Model ID Model Description Zone Elevation (ft) Av<strong>ai</strong>lable Fireflow(gpm)11734 Junction 11 94 1,50011736 Junction 11 82 3,00011738 <strong>Water</strong> User #8 11 68 3,00011744 Junction 11 67 3,00011746 Junction 11 71 3,00011748 Junction 11 71 3,00011750 Junction 11 65 3,00011752 Junction 11 40 3,00011754 Junction 11 41 3,00011756 Junction 11 35 3,00011758 Junction 11 32 3,00011760 Junction 11 30 3,00011762 Junction 11 30 3,00011768 Junction 11 32 3,00011770 Junction 11 32 2,84011772 Junction 11 31 2,78011780 Junction 11 30 3,00011784 Junction 11 31 1,50011790 Junction 11 30 1,81011792 Junction 11 25 4,00011796 Junction 11 25 4,00011798 Junction 11 25 4,00011800 Junction 11 26 4,000118000 398009-6 inch FH Concord Storage 11 34 4,000118002 398009-6 inch FH Concord Storage 11 31 1,500118004 398009-6 inch FH Concord Storage 11 31 3,000118006 398009-6 inch FH Concord Storage 11 31 3,00011802 Junction 11 27 4,00011804 Junction 11 28 3,00011806 Junction 11 29 4,00011808 Junction 11 25 4,00011810 Junction 11 27 4,00011812 Junction 11 27 4,00011814 Junction 11 28 4,00011816 Junction 11 35 3,00011820 Junction 11 65 3,00011822 Junction 11 65 3,00011824 Junction 11 30 4,00011826 Junction 11 30 3,00011828 Junction 11 31 3,00011830 Junction 11 31 3,00011832 Junction 11 32 3,00011842 Junction 11 32 3,00011844 Junction 11 33 3,00011850 Junction 11 33 3,00011852 Junction 11 34 3,00011858 Junction 11 33 1,50011860 Junction 11 34 1,50011862 Junction 11 34 1,50011866 Junction 11 34 3,00011870 Junction 11 34 1,50011872 Junction 11 35 1,50011874 Junction 11 35 1,50011876 Junction 11 32 1,500E-8 2007 Treated <strong>Water</strong> <strong>Master</strong> <strong>Plan</strong> Update A
Appendix EFire Flow Analysis ResultsTable E-2Av<strong>ai</strong>lable Fireflow, All Locations (1)Model ID Model Description Zone Elevation (ft) Av<strong>ai</strong>lable Fireflow(gpm)11878 Junction 11 31 1,50011880 <strong>Water</strong> User #9 11 36 3,00011882 Junction 11 40 3,00011884 Junction 11 40 3,00011888 Junction 11 35 3,01011890 Junction 11 40 2,61011892 Junction 11 40 2,39011894 Junction 11 40 3,00011896 Junction 11 40 3,00011898 Junction 11 50 3,00011900 Junction 11 45 3,00011902 Junction 11 43 3,00011906 Junction 11 41 4,00011908 Junction 11 46 4,00011910 Junction 11 58 3,00011912 Junction 11 40 3,49011914 Junction 11 44 4,00011916 Junction 11 43 4,00011918 Junction 11 42 4,00011920 Junction 11 43 4,00011924 Junction 11 42 4,00011926 Junction 11 44 3,00011928 Junction 11 48 3,00011930 Junction 11 58 3,00011932 Junction 11 54 3,00011934 Junction 11 60 3,00011936 <strong>Water</strong> User #49 11 45 3,00011940 Junction 11 60 3,00011942 Junction 11 60 3,00011944 Junction 11 95 1,50011950 Junction 11 95 1,50011960 Junction 11 62 3,00011962 Junction 11 60 3,00011966 Junction 11 68 2,88011968 Junction 11 75 1,99011970 Junction 11 60 4,00011972 Junction 11 52 4,00011976 Junction 11 59 3,00011978 Junction 11 55 4,00011980 Junction 11 52 3,45011982 Junction 11 45 4,00011984 Junction 11 44 3,00011986 Junction 11 40 2,98011988 Junction 11 45 3,00011990 Junction 11 45 3,00011992 Junction 11 43 3,00011994 Junction 11 40 3,00011996 Junction 11 40 2,40011998 Junction 11 47 3,00012000 Junction 11 45 3,000120002 398007-Cornerstone 11 58 3,000120004 398007-Cornerstone 11 60 1,250120006 398007-Cornerstone 11 56 1,160120008 398007-Cornerstone 11 59 1,390A 2007 Treated <strong>Water</strong> <strong>Master</strong> <strong>Plan</strong> Update E-9
Appendix EFire Flow Analysis ResultsTable E-2Av<strong>ai</strong>lable Fireflow, All Locations (1)Model ID Model Description Zone Elevation (ft) Av<strong>ai</strong>lable Fireflow(gpm)120010 398007-Cornerstone 11 59 1,370120012 398007-Cornerstone 11 66 1,130120016 398007-Cornerstone 11 59 1,36012002 Junction 11 48 3,00012004 Junction 11 46 3,00012006 Junction 11 46 3,00012008 Junction 11 45 4,00012010 Junction 11 48 3,44012012 Junction 11 50 2,890120192 197621-Sunshine Dr. M<strong>ai</strong>n Replacement 11 39 2,900120194 197621-Sunshine Dr. M<strong>ai</strong>n Replacement 11 40 2,58012020 Junction 11 58 4,00012024 Junction 11 50 4,00012030 Junction 11 55 4,00012036 Junction 11 60 4,00012038 Junction 11 70 96012040 Junction 11 70 99012042 Junction 11 100 66012044 Junction 11 65 1,50012046 Junction 11 68 1,50012048 Junction 11 69 1,50012050 Junction 11 72 1,50012054 Junction 11 56 3,00012056 Junction 11 55 1,50012058 Junction 11 57 1,50012060 Junction 11 55 3,00012062 Junction 11 52 4,00012064 Junction 11 49 3,00012066 Junction 11 48 3,00012068 Junction 11 48 3,00012070 Junction 11 48 3,00012072 Junction 11 47 3,00012074 Junction 11 49 3,00012076 Junction 11 52 3,00012078 Junction 11 55 1,50012080 Junction 11 52 3,00012082 Junction 11 54 1,50012084 Junction 11 60 1,50012086 Junction 11 57 1,50012088 Junction 11 48 3,00012090 Junction 11 47 3,00012092 Junction 11 46 3,00012094 Junction 11 45 3,00012096 Junction 11 43 4,00012098 Junction 11 43 4,00012100 Junction 11 53 3,00012102 Junction 11 49 3,00012104 Junction 11 54 3,00012106 Junction 11 55 4,00012108 Junction 11 54 3,00012110 Junction 11 53 3,00012112 Junction 11 50 2,02012114 Junction 11 50 1,50012116 Junction 11 50 1,820E-10 2007 Treated <strong>Water</strong> <strong>Master</strong> <strong>Plan</strong> Update A
Appendix EFire Flow Analysis ResultsTable E-2Av<strong>ai</strong>lable Fireflow, All Locations (1)Model ID Model Description Zone Elevation (ft) Av<strong>ai</strong>lable Fireflow(gpm)12118 Junction 11 55 4,00012120 Junction 11 55 3,00012122 Junction 11 50 3,00012124 Junction 11 49 3,00012126 Junction 11 51 1,50012128 Junction 11 50 3,00012130 Junction 11 54 1,50012132 Junction 11 54 1,50012134 Junction 11 59 1,50012136 Junction 11 53 2,18012138 Junction 11 68 1,50012140 Junction 11 68 1,50012142 Junction 11 67 1,50012144 Junction 11 71 1,50012146 Junction 11 72 1,50012148 Junction 11 75 1,50012150 Junction 11 75 1,50012152 Junction 11 75 1,50012154 Junction 11 78 1,50012156 Junction 11 74 1,50012160 Junction 11 66 1,50012162 Junction 11 67 1,50012164 Junction 11 73 1,50012166 Junction 11 70 1,50012170 Junction 11 78 1,50012172 Junction 11 82 1,50012174 Junction 11 81 1,50012176 Junction 11 80 1,50012182 Junction 11 82 1,50012188 Junction 11 86 1,50012190 Junction 11 85 1,50012192 Junction 11 86 1,50012194 Junction 11 86 1,50012196 Junction 11 87 1,50012198 Junction 11 74 1,50012200 Junction 11 81 3,00012204 Junction 11 92 3,00012206 Junction 11 88 3,00012208 Junction 11 90 3,00012210 Junction 11 91 1,50012212 Junction 11 90 1,50012214 Junction 11 90 1,50012216 Junction 11 96 1,50012218 Junction 11 95 1,50012220 Junction 11 91 1,50012222 Junction 11 94 3,00012224 Junction 11 96 1,50012226 Junction 11 94 1,50012228 Junction 11 94 1,50012230 Junction 11 94 1,50012232 Junction 11 99 1,50012234 Junction 11 100 1,48012236 Junction 11 72 1,50012238 Junction 11 75 1,500A 2007 Treated <strong>Water</strong> <strong>Master</strong> <strong>Plan</strong> Update E-11
Appendix EFire Flow Analysis ResultsTable E-2Av<strong>ai</strong>lable Fireflow, All Locations (1)Model ID Model Description Zone Elevation (ft) Av<strong>ai</strong>lable Fireflow(gpm)12240 Junction 11 98 1,50012242 Junction 11 98 1,50012244 Junction 11 97 1,50012246 Junction 11 97 1,50012248 Junction 11 100 1,50012250 Junction 11 90 3,00012252 Junction 11 83 3,00012254 Junction 11 83 3,00012256 Junction 11 83 3,00012258 Junction 11 82 3,00012260 Junction 11 80 3,00012262 Junction 11 80 3,00012264 Junction 11 60 1,50012266 Junction 11 67 3,00012268 Junction 11 63 2,04012270 Junction 11 71 1,50012272 Junction 11 72 1,50012274 Junction 11 72 3,00012276 Junction 11 72 1,50012278 Junction 11 72 1,50012280 Junction 11 68 1,50012282 Junction 11 68 1,50012284 Junction 11 68 1,50012286 Junction 11 65 1,50012288 Junction 11 64 1,45012290 Junction 11 64 1,46012292 Junction 11 73 3,00012294 Junction 11 74 1,50012296 Junction 11 73 1,50012298 Junction 11 78 2,09012300 Junction 11 73 1,69012302 Junction 11 75 1,96012304 Junction 11 79 1,50012306 Junction 11 78 2,37012308 Junction 11 80 3,00012310 Junction 11 82 3,00012312 Junction 11 80 3,00012314 Junction 11 81 1,50012316 Junction 11 78 1,50012318 Junction 11 72 1,50012320 Junction 11 74 1,50012322 Junction 11 77 1,50012324 Junction 11 72 1,50012326 Junction 11 77 1,50012328 Junction 11 78 1,50012330 Junction 11 68 1,50012332 Junction 11 68 1,50012334 Junction 11 68 1,50012336 Junction 11 63 1,50012338 Junction 11 69 1,47012340 Junction 11 65 1,42012342 Junction 11 62 1,51012344 Junction 11 84 3,00012346 Junction 11 82 3,000E-12 2007 Treated <strong>Water</strong> <strong>Master</strong> <strong>Plan</strong> Update A
Appendix EFire Flow Analysis ResultsTable E-2Av<strong>ai</strong>lable Fireflow, All Locations (1)Model ID Model Description Zone Elevation (ft) Av<strong>ai</strong>lable Fireflow(gpm)12348 Junction 11 90 3,00012354 Junction 11 95 1,50012356 Junction 11 95 3,00012358 Junction 11 99 1,50012360 Junction 11 100 1,50012362 Junction 11 98 1,50012364 Junction 11 98 2,60012366 Junction 11 91 1,50012368 Junction 11 87 1,50012370 Junction 11 83 1,50012372 Junction 11 85 3,00012374 Junction 11 86 1,50012376 Junction 11 87 1,50012378 Junction 11 84 1,50012380 Junction 11 90 1,50012382 Junction 11 91 1,50012384 Junction 11 77 1,50012386 Junction 11 80 1,50012388 Junction 11 82 1,50012390 Junction 11 84 1,50012392 Junction 11 80 1,50012394 Junction 11 79 3,00012396 Junction 11 78 1,50012398 Junction 11 77 1,50012400 Junction 11 79 1,50012402 Junction 11 78 1,50012406 Junction 11 78 1,50012408 Junction 11 89 2,92012410 Junction 11 90 2,54012412 Junction 11 90 2,82012414 Junction 11 97 1,50012416 Junction 11 97 2,43012418 Junction 11 97 1,88012420 Junction 11 97 3,00012424 Junction 11 97 1,50012426 Junction 11 72 1,50012428 Junction 11 73 1,50012430 Junction 11 75 1,50012432 Junction 11 75 1,50012434 Junction 11 80 1,50012436 Junction 11 84 1,50012438 Junction 11 81 3,00012440 Junction 11 85 3,00012442 Junction 11 85 3,00012444 Junction 11 88 3,00012446 Junction 11 82 3,00012450 Junction 11 83 1,50012452 Junction 11 81 3,00012454 Junction 11 82 2,49012456 Junction 11 83 1,50012458 Junction 11 75 1,50012460 Junction 11 75 1,50012462 Junction 11 73 1,50012464 Junction 11 72 1,500A 2007 Treated <strong>Water</strong> <strong>Master</strong> <strong>Plan</strong> Update E-13
Appendix EFire Flow Analysis ResultsTable E-2Av<strong>ai</strong>lable Fireflow, All Locations (1)Model ID Model Description Zone Elevation (ft) Av<strong>ai</strong>lable Fireflow(gpm)12466 Junction 11 70 1,50012468 Junction 11 65 3,00012470 Junction 11 65 2,74012472 Junction 11 65 3,00012474 Junction 11 63 3,00012476 Junction 11 64 3,00012478 Junction 11 63 3,00012480 Junction 11 60 1,50012482 Junction 11 60 1,50012484 Junction 11 59 1,50012486 Junction 11 60 3,00012488 Junction 11 62 3,00012490 Junction 11 63 3,00012492 Junction 11 57 3,00012494 Junction 11 78 1,50012496 Junction 11 75 1,50012498 Junction 11 75 1,50012500 Junction 11 74 3,00012502 Junction 11 73 3,00012504 Junction 11 70 3,00012506 Junction 11 67 1,50012508 Junction 11 68 3,00012510 Junction 11 70 1,50012512 Junction 11 73 1,50012514 Junction 11 69 1,50012516 Junction 11 67 1,50012518 Junction 11 64 3,00012520 Junction 11 65 1,50012522 Junction 11 64 1,50012524 Junction 11 64 3,00012526 Junction 11 62 3,00012530 Junction 11 85 1,50012546 Junction 11 95 1,50012548 Junction 11 88 1,50012550 Junction 11 91 1,50012552 Junction 11 91 1,50012554 Junction 11 92 1,50012556 Junction 11 93 1,50012558 Junction 11 95 1,50012562 Junction 11 93 3,00012570 Junction 11 92 3,00012572 Junction 11 93 3,00012574 Junction 11 91 3,00012578 Junction 11 95 3,00012580 Junction 11 91 3,00012582 Junction 11 91 3,00012584 Junction 11 91 3,00012590 Junction 11 89 3,00012592 11 82 3,00012594 Junction 11 92 3,00012596 Junction 11 93 3,00012598 Junction 11 93 3,00012602 Junction 11 67 3,00012604 Junction 11 67 3,000E-14 2007 Treated <strong>Water</strong> <strong>Master</strong> <strong>Plan</strong> Update A
Appendix EFire Flow Analysis ResultsTable E-2Av<strong>ai</strong>lable Fireflow, All Locations (1)Model ID Model Description Zone Elevation (ft) Av<strong>ai</strong>lable Fireflow(gpm)12606 Junction 11 95 3,00012608 Junction 11 93 3,00012610 Junction 11 93 3,00012612 Junction 11 90 2,09012614 Junction 11 92 3,00012616 Junction 11 93 3,00012618 Junction 11 89 3,00012620 Junction 11 106 2,11012626 Junction 11 91 3,00012628 Junction 11 91 3,00012630 Junction 11 95 2,94012632 Junction 11 95 2,46012634 Junction 11 95 2,21012636 Junction 11 96 1,88012638 Junction 11 97 1,79012640 Junction 11 97 1,72012642 Junction 11 100 1,43012644 Junction 11 95 2,98012646 Junction 11 95 3,00012648 Junction 11 94 3,00012650 Junction 11 99 2,29012652 Junction 11 100 1,78012654 Junction 11 100 2,08012656 Junction 11 102 1,60012658 Junction 11 102 1,94012660 Junction 11 104 1,86012662 Junction 11 104 1,87012664 Junction 11 104 1,90012666 Junction 11 105 1,85012668 Junction 11 109 1,29012670 Junction 11 87 3,00012672 Junction 11 88 3,00012674 Junction 11 88 3,00012678 Junction 11 85 3,00012680 Junction 11 84 3,00012682 Junction 11 85 3,00012690 Junction 11 84 3,00012692 Junction 11 82 3,00012696 Junction 11 95 3,00012698 Junction 11 105 4,00012700 Junction 11 100 4,00012702 Junction 11 95 3,00012706 Junction 11 85 4,00012708 Junction 11 95 3,40012710 Junction 11 105 2,09012714 Junction 11 32 3,00012716 Junction 11 32 3,00012720 Junction 11 34 3,00012728 Junction 11 35 3,00012732 Junction 11 35 3,00012734 Junction 11 35 3,00012736 Junction 11 35 1,50012738 Junction 11 35 3,00012740 Junction 11 35 3,000A 2007 Treated <strong>Water</strong> <strong>Master</strong> <strong>Plan</strong> Update E-15
Appendix EFire Flow Analysis ResultsTable E-2Av<strong>ai</strong>lable Fireflow, All Locations (1)Model ID Model Description Zone Elevation (ft) Av<strong>ai</strong>lable Fireflow(gpm)12742 Junction 11 35 3,00012746 Junction 11 33 3,00012748 Junction 11 32 3,00012750 Junction 11 31 3,00012752 Junction 11 29 3,00012754 Junction 11 30 3,00012756 Junction 11 28 3,00012758 Junction 11 34 3,00012764 Junction 11 32 3,00012766 Junction 11 30 3,00012768 Junction 11 29 3,00012770 Junction 11 27 3,00012780 Junction 11 50 3,00012782 Junction 11 49 3,00012784 Junction 11 48 2,90012786 Junction 11 50 3,00012788 Junction 11 48 3,00012790 Junction 11 45 3,00012792 Junction 11 45 3,00012794 Junction 11 47 3,00012796 Junction 11 48 3,00012798 Junction 11 45 3,00012802 Junction 11 50 1,50012804 Junction 11 44 3,00012806 Junction 11 44 3,00012808 Junction 11 45 3,00012810 Junction 11 45 3,00012812 Junction 11 40 3,00012814 Junction 11 40 3,00012816 Junction 11 40 3,00012818 Junction 11 40 3,00012820 Junction 11 40 3,00012822 Junction 11 42 3,00012824 Junction 11 42 3,00012826 Junction 11 40 3,00012828 Junction 11 40 3,00012830 Junction 11 42 3,00012832 Junction 11 35 3,00012834 Junction 11 33 3,00012836 Junction 11 32 1,50012838 Junction 11 31 3,00012840 Junction 11 29 3,00012842 Junction 11 21 3,00012844 Junction 11 35 3,00012846 Junction 11 60 1,50012848 Junction 11 27 3,00012850 Junction 11 34 3,00012852 Junction 11 34 2,62012854 Junction 11 35 2,27012856 Junction 11 35 2,21012858 Junction 11 35 1,97012860 Junction 11 37 3,00012862 Junction 11 37 3,00012864 Junction 11 38 3,000E-16 2007 Treated <strong>Water</strong> <strong>Master</strong> <strong>Plan</strong> Update A
Appendix EFire Flow Analysis ResultsTable E-2Av<strong>ai</strong>lable Fireflow, All Locations (1)Model ID Model Description Zone Elevation (ft) Av<strong>ai</strong>lable Fireflow(gpm)12866 Junction 11 38 3,00012868 Junction 11 37 3,00012870 Junction 11 38 3,00012872 Junction 11 37 3,00012874 Junction 11 39 3,00012876 Junction 11 42 3,00012878 Junction 11 39 3,00012880 Junction 11 39 3,00012882 Junction 11 40 3,00012884 Junction 11 38 3,00012886 Junction 11 38 1,50012888 Junction 11 50 1,62012890 Junction 11 50 1,50012894 Junction 11 40 3,00012896 Junction 11 38 3,00012898 Junction 11 70 3,00012900 Junction 11 80 3,00012902 Junction 11 92 3,00012904 Junction 11 70 3,00012908 Junction 11 80 3,00012910 Junction 11 50 3,00012916 Junction 11 75 1,50012918 Junction 11 85 1,50012920 Junction 11 95 1,50012922 Junction 11 120 3,00012924 Junction 11 90 1,50012926 Junction 11 100 1,50012928 Junction 11 120 1,50012930 Junction 11 110 1,500129300 398022-Treat Towers 11 80 3,000129302 398022-Treat Towers 11 80 3,000129304 398022-Treat Towers 11 80 3,000129306 398022-Treat Towers 11 80 3,000129308 398022-Treat Towers 11 80 3,000129310 398022-Treat Towers 11 80 1,960129312 398022-Treat Towers 11 80 1,610129314 398022-Treat Towers 11 80 1,380129316 398022-Treat Towers 11 82 3,000129318 398022-Treat Towers 11 87 3,00012932 Junction 11 95 3,000129320 398022-Treat Towers 11 85 3,000129322 398022-Treat Towers 11 85 3,00012934 Junction 11 66 1,50012936 Junction 11 82 1,50012938 Junction 11 80 1,50012940 Junction 11 65 1,50012942 Junction 11 50 3,00012944 Junction 11 65 2,84012946 Junction 11 60 2,57012948 Junction 11 31 1,89012950 Junction 11 30 1,71012952 Junction 11 62 3,00012954 Junction 11 50 1,50012956 Junction 11 50 1,500A 2007 Treated <strong>Water</strong> <strong>Master</strong> <strong>Plan</strong> Update E-17
Appendix EFire Flow Analysis ResultsTable E-2Av<strong>ai</strong>lable Fireflow, All Locations (1)Model ID Model Description Zone Elevation (ft) Av<strong>ai</strong>lable Fireflow(gpm)12958 Junction 11 50 1,50012962 Junction 11 60 1,50012972 Junction 11 75 1,50012974 Junction 11 45 1,50012976 Junction 11 41 1,50012978 Junction 11 35 3,00012980 Junction 11 35 1,50012982 Junction 11 43 3,00012984 Junction 11 42 3,00012986 Junction 11 40 1,50012988 Junction 11 40 1,50012990 Junction 11 41 1,50012992 Junction 11 44 1,50012994 Junction 11 47 1,50012996 Junction 11 50 1,50012998 Junction 11 42 1,50013000 Junction 11 40 1,500130000 398004-Pleasant Hill Adult Center 11 82 1,500130002 398004-Pleasant Hill Adult Center 11 82 1,94013002 Junction 11 40 2,17013004 Junction 11 45 1,52013006 Junction 11 65 1,50013008 Junction 11 62 1,50013010 Junction 11 75 2,040130102 398004-Pleasant Hill Adult Center 11 75 1,500130104 398004-Pleasant Hill Adult Center 11 75 1,500130106 398004-Pleasant Hill Adult Center 11 75 1,500130108 398004-Pleasant Hill Adult Center 11 73 1,500130110 398004-Pleasant Hill Adult Center 11 75 1,500130112 398004-Pleasant Hill Adult Center 11 75 110130114 398004-Pleasant Hill Adult Center 11 75 2,750130116 398004-Pleasant Hill Adult Center 11 77 2,59013012 Junction 11 70 1,500130120 398004-Pleasant Hill Adult Center 11 75 2,300130122 398004-Pleasant Hill Adult Center 11 75 2,280130124 398004-Pleasant Hill Adult Center 11 75 2,320130126 398004-Pleasant Hill Adult Center 11 75 2,620130132 398036-Pleasant Hill Downtown 11 53 3,00013014 Junction 11 72 1,50013016 Junction 11 80 1,49013018 Junction 11 79 1,28013020 Junction 11 80 1,87013022 Junction 11 75 1,50013024 Junction 11 65 1,50013026 Junction 11 32 3,00013028 Junction 11 33 3,00013030 Junction 11 33 3,000130302 Junction 11 82 3,00013032 Junction 11 31 3,00013034 Junction 11 56 3,00013036 Junction 11 56 3,00013038 Junction 11 57 3,00013040 Junction 11 61 3,000130400 398004-Pleasant Hill Adult Center 11 72 3,000E-18 2007 Treated <strong>Water</strong> <strong>Master</strong> <strong>Plan</strong> Update A
Appendix EFire Flow Analysis ResultsTable E-2Av<strong>ai</strong>lable Fireflow, All Locations (1)Model ID Model Description Zone Elevation (ft) Av<strong>ai</strong>lable Fireflow(gpm)130402 398004-Pleasant Hill Adult Center 11 70 3,000130404 398004-Pleasant Hill Adult Center 11 77 3,000130406 398004-Pleasant Hill Adult Center 11 82 3,000130408 398004-Pleasant Hill Adult Center 11 82 3,000130410 398004-Pleasant Hill Adult Center 11 80 2,430130412 398004-Pleasant Hill Adult Center 11 80 1,470130414 398004-Pleasant Hill Adult Center 11 80 2,410130416 398004-Pleasant Hill Adult Center 11 75 1,500130418 398004-Pleasant Hill Adult Center 11 82 2,520130420 398004-Pleasant Hill Adult Center 11 82 2,150130422 398004-Pleasant Hill Adult Center 11 82 1,79013046 Junction 11 55 1,50013048 Junction 11 54 3,00013050 Junction 11 55 3,00013052 Junction 11 55 3,00013054 Junction 11 55 3,000130554 Junction 11 71 3,00013056 Junction 11 55 3,00013058 Junction 11 55 3,00013060 Junction 11 60 3,000130600 398021-Aegis Assisted Living 11 68 1,500130602 398021-Aegis Assisted Living 11 68 1,500130604 398021-Aegis Assisted Living 11 68 1,500130606 398021-Aegis Assisted Living 11 68 1,500130608 398021-Aegis Assisted Living 11 68 1,500130610 398021-Aegis Assisted Living 11 68 1,500130612 398021-Aegis Assisted Living 11 68 1,500130614 398021-Aegis Assisted Living 11 68 1,50013062 Junction 11 55 3,00013064 Junction 11 65 3,00013066 Junction 11 65 3,00013068 Junction 11 65 3,00013070 Junction 11 62 3,00013078 Junction 11 65 3,00013080 Junction 11 70 3,00013082 Junction 11 65 3,00013084 Junction 11 64 3,00013086 Junction 11 65 3,00013088 Junction 11 65 1,50013092 Junction 11 72 3,00013094 Junction 11 76 1,50013096 Junction 11 68 1,50013098 Junction 11 67 3,00013100 Junction 11 65 3,00013102 Junction 11 70 1,50013104 Junction 11 69 2,13013106 Junction 11 65 1,50013110 Junction 11 67 3,00013114 Junction 11 72 3,00013118 Junction 11 74 3,00013122 Junction 11 78 3,00013124 Junction 11 75 3,00013128 Junction 11 79 3,00013130 Junction 11 80 3,000A 2007 Treated <strong>Water</strong> <strong>Master</strong> <strong>Plan</strong> Update E-19
Appendix EFire Flow Analysis ResultsTable E-2Av<strong>ai</strong>lable Fireflow, All Locations (1)Model ID Model Description Zone Elevation (ft) Av<strong>ai</strong>lable Fireflow(gpm)13132 Junction 11 80 3,00013134 Junction 11 83 3,00013136 Junction 11 82 3,00013138 Junction 11 86 3,00013140 Junction 11 85 3,00013142 Junction 11 83 3,00013144 Junction 11 90 4,00013146 Junction 11 94 1,50013148 Junction 11 78 3,00013150 Junction 11 71 3,00013152 Junction 11 75 3,00013158 Junction 11 73 3,00013160 Junction 11 71 3,00013162 Junction 11 70 1,50013164 Junction 11 70 1,50013168 Junction 11 60 3,00013170 Junction 11 62 3,00013172 Junction 11 60 3,00013174 Junction 11 59 3,00013178 Junction 11 57 3,00013180 Junction 11 57 3,00013182 Junction 11 54 3,00013184 Junction 11 53 3,00013186 Junction 11 57 3,00013188 Junction 11 55 3,00013192 Junction 11 52 3,00013194 Junction 11 50 3,00013196 Junction 11 50 3,00013198 Junction 11 48 3,00013200 Junction 11 48 3,00013202 Junction 11 48 3,00013204 Junction 11 50 3,00013206 Junction 11 70 3,00013208 Junction 11 75 3,00013210 Junction 11 75 2,99013212 Junction 11 75 2,67013214 Junction 11 80 2,51013216 Junction 11 90 2,35013218 Junction 11 88 2,15013220 Junction 11 65 2,61013222 Junction 11 75 3,00013224 Junction 11 66 3,00013226 Junction 11 58 1,50013228 Junction 11 56 3,00013230 Junction 11 57 3,00013232 Junction 11 63 1,50013234 Junction 11 70 1,50013236 Junction 11 68 3,00013238 Junction 11 78 2,63013240 Junction 11 55 3,00013242 Junction 11 56 2,29013244 Junction 11 57 2,11013246 Junction 11 57 2,17013248 Junction 11 71 1,500E-20 2007 Treated <strong>Water</strong> <strong>Master</strong> <strong>Plan</strong> Update A
Appendix EFire Flow Analysis ResultsTable E-2Av<strong>ai</strong>lable Fireflow, All Locations (1)Model ID Model Description Zone Elevation (ft) Av<strong>ai</strong>lable Fireflow(gpm)13250 Junction 11 69 1,50013252 Junction 11 71 1,50013254 Junction 11 63 2,08013256 Junction 11 68 1,50013258 Junction 11 68 1,50013260 Junction 11 74 3,00013262 Junction 11 68 1,50013264 Junction 11 74 3,00013266 Junction 11 74 3,00013268 Junction 11 77 3,00013270 Junction 11 82 3,00013272 Junction 11 58 1,50013274 Junction 11 73 1,50013276 Junction 11 76 1,50013278 Junction 11 80 3,00013280 Junction 11 80 3,00013282 Junction 11 102 1,50013284 Junction 11 105 1,50013286 Junction 11 85 1,50013288 Junction 11 85 2,69013290 Junction 11 101 3,00013292 Junction 11 101 3,00013294 Junction 11 100 3,00013296 Junction 11 98 2,74013298 Junction 11 100 3,00013300 Junction 11 120 1,500133002 398015-Village Square, 150 Hookston Rd. 11 61 3,000133004 398015-Village Square, 150 Hookston Rd. 11 61 3,000133006 398015-Village Square, 150 Hookston Rd. 11 65 2,400133008 398015-Village Square, 150 Hookston Rd. 11 61 3,000133012 398015-Village Square, 150 Hookston Rd. 11 61 3,000133014 398015-Village Square, 150 Hookston Rd. 11 61 3,000133016 398015-Village Square, 150 Hookston Rd. 11 59 3,000133018 398015-Village Square, 150 Hookston Rd. 11 61 2,41013302 Junction 11 102 1,500133020 398015-Village Square, 150 Hookston Rd 11 61 2,580133022 398015-Village Square, 150 Hookston Rd 11 61 2,430133024 398015-Village Square, 150 Hookston Rd. 11 61 2,370133026 398015-Village Square, 150 Hookston Rd. 11 61 1,920133028 398015-Village Square, 150 Hookston Rd. 11 61 1,990133030 398015-Village Square, 150 Hookston Rd. 11 62 1,920133032 398015-Village Square, 150 Hookston Rd. 11 62.5 1,750133034 398015-Village Square, 150 Hookston Rd. 11 62 1,69013304 Junction 11 102 1,50013306 Junction 11 108 1,50013312 Junction 11 100 1,50013314 Junction 11 85 1,50013316 Junction 11 85 1,50013318 Junction 11 81 3,00013320 Junction 11 80 1,50013322 Junction 11 77 3,00013324 Junction 11 75 3,00013326 Junction 11 92 1,50013328 Junction 11 112 1,500A 2007 Treated <strong>Water</strong> <strong>Master</strong> <strong>Plan</strong> Update E-21
Appendix EFire Flow Analysis ResultsTable E-2Av<strong>ai</strong>lable Fireflow, All Locations (1)Model ID Model Description Zone Elevation (ft) Av<strong>ai</strong>lable Fireflow(gpm)13330 Junction 11 112 1,47013332 Junction 11 112 1,45013334 Junction 11 120 1,25013336 Junction 11 122 1,11013338 Junction 11 120 1,23013340 Junction 11 122 1,07013342 Junction 11 30 3,00013344 Junction 11 30 3,00013346 <strong>Water</strong> User #30 11 30 3,00013350 Junction 11 29 3,48013352 Junction 11 29 3,00013354 Junction 11 29 3,00013356 Junction 11 31 3,00013358 Junction 11 30 3,00013360 Junction 11 29 3,00013362 Junction 11 30 3,00013364 Junction 11 25 3,00013366 Junction 11 25 3,00013368 Junction 11 25 3,00013372 Junction 11 25 3,00013376 Junction 11 25 3,00013378 Junction 11 24 3,00013380 Junction 11 25 3,00013382 Junction 11 32 3,00013384 Junction 11 35 3,00013388 Junction 11 25 3,00013390 Junction 11 25 3,00013392 Junction 11 38 3,00013396 Junction 11 40 3,00013400 Junction 11 20 3,00013402 Junction 11 25 3,00013404 Junction 11 25 3,00013406 Junction 11 26 3,00013408 Junction 11 24 3,00013410 Junction 11 26 3,00013412 Junction 11 25 3,00013414 Junction 11 26 3,00013416 Junction 11 26 3,00013418 Junction 11 26 3,00013420 Junction 11 27 3,00013422 Junction 11 28 3,00013424 Demand 11 29 3,00013426 <strong>Water</strong> User #11 11 29 3,00013428 Junction 11 28 3,00013430 Junction 11 28 3,00013432 Junction 11 25 3,00013434 Junction 11 24 3,00013436 Junction 11 23 3,00013438 Junction 11 23 3,00013442 Junction 11 23 4,00013448 Junction 11 23 3,00013450 Junction 11 22 4,00013452 Junction 11 20 4,00013454 Junction 11 22 3,630E-22 2007 Treated <strong>Water</strong> <strong>Master</strong> <strong>Plan</strong> Update A
Appendix EFire Flow Analysis ResultsTable E-2Av<strong>ai</strong>lable Fireflow, All Locations (1)Model ID Model Description Zone Elevation (ft) Av<strong>ai</strong>lable Fireflow(gpm)13456 Junction 11 20 4,00013458 Junction 11 21 3,78013460 Junction 11 21 4,00013462 Junction 11 20 4,00013466 Junction 11 20 3,42013468 Junction 11 15 4,00013470 Junction 11 16 4,00013472 Junction 11 15 4,00013476 Junction 11 16 1,50013478 Junction 11 16 1,50013480 Junction 11 15 3,00013482 Junction 11 17 3,00013484 Junction 11 18 4,00013486 Junction 11 15 4,00013488 Junction 11 15 3,00013490 Junction 11 16 3,00013494 Junction 11 15 3,00013498 Junction 11 20 3,00013500 Junction 11 20 3,00013502 Junction 11 20 3,00013504 Junction 11 22 3,00013506 Junction 11 40 3,00013508 Junction 11 40 3,00013514 Junction 11 95 3,00013516 Junction 11 60 3,00013518 Junction 11 90 3,00013520 Junction 11 80 3,00013522 Junction 11 100 3,00013524 Junction 11 60 3,00013532 Junction 11 140 3,00013534 Junction 11 120 1,77013536 Junction 11 95 3,00013540 Junction 11 70 3,00013542 Junction 11 38 3,00013544 Junction 11 40 3,00013546 Junction 11 40 3,00013548 Junction 11 35 3,00013550 Junction 11 35 3,00013552 Junction 11 26 3,00013554 Junction 11 23 1,500135542 197607-Second Avenue South M<strong>ai</strong>n11 23 2,540Replacem135544 197607-Second Avenue South M<strong>ai</strong>n11 23 1,500Replacem135546 197607-Second Avenue South M<strong>ai</strong>n11 29 1,490Replacem135548 197607-Second Avenue South M<strong>ai</strong>n11 29 3,000Replacem135552 197607-Second Avenue South M<strong>ai</strong>n11 29 3,000Replacem13556 Junction 11 28 3,00013558 Junction 11 32 3,00013560 Junction 11 35 3,00013562 Junction 11 42 3,000A 2007 Treated <strong>Water</strong> <strong>Master</strong> <strong>Plan</strong> Update E-23
Appendix EFire Flow Analysis ResultsTable E-2Av<strong>ai</strong>lable Fireflow, All Locations (1)Model ID Model Description Zone Elevation (ft) Av<strong>ai</strong>lable Fireflow(gpm)13564 Junction 11 38 3,00013566 Junction 11 50 1,50013568 Junction 11 55 3,00013570 Junction 11 65 3,00013572 Junction 11 65 3,00013574 Junction 11 75 3,00013576 Junction 11 80 3,00013578 Junction 11 80 3,00013580 Junction 11 70 3,00013582 Junction 11 102 1,50013584 Junction 11 105 1,50013586 Junction 11 110 1,50013588 Junction 11 115 1,50013590 Junction 11 115 3,00013592 Junction 11 115 1,50013594 Junction 11 95 1,50013596 Junction 11 90 2,35013598 Junction 11 58 3,00013600 Junction 11 28 3,00013602 Junction 11 29 3,00013604 Junction 11 26 3,00013606 Junction 11 26 3,00013608 Junction 11 23 3,00013610 Junction 11 22 1,50013612 Junction 11 22 3,00013614 Junction 11 28 3,00013618 Junction 11 20 3,00013622 Junction 11 22 3,00013624 Junction 11 22 3,00013626 Junction 11 20 3,00013632 Junction 11 15 4,00013634 Junction 11 15 4,00013636 Junction 11 15 4,00013638 Junction 11 20 3,00013640 Junction 11 20 2,49013642 Junction 11 34 1,50013644 Junction 11 32 3,00013646 Junction 11 40 3,00013648 Junction 11 20 4,00013650 Junction 11 35 4,00013652 Junction 11 42 1,50013654 Junction 11 60 1,50013656 Junction 11 60 1,50013658 Junction 11 38 1,50013666 Junction 11 19 1,50013668 Junction 11 19 1,50013670 Junction 11 15 4,00013674 Junction 11 16 4,00013676 Junction 11 17 4,00013678 Junction 11 17 4,00013680 Junction 11 17 1,50013682 Junction 11 17 1,50013690 Junction 11 16 4,00013700 Junction 11 20 4,000E-24 2007 Treated <strong>Water</strong> <strong>Master</strong> <strong>Plan</strong> Update A
Appendix EFire Flow Analysis ResultsTable E-2Av<strong>ai</strong>lable Fireflow, All Locations (1)Model ID Model Description Zone Elevation (ft) Av<strong>ai</strong>lable Fireflow(gpm)13702 Junction 11 17 3,00013704 Junction 11 28 3,00013708 Junction 11 20 3,00013712 Junction 11 20 1,50013714 Junction 11 28 3,00013716 Junction 11 22 3,00013718 Junction 11 22 3,00013720 Junction 11 58 4,00013722 Junction 11 20 4,00013724 Junction 11 39 4,00013726 Junction 11 23 4,00013728 Junction 11 23 4,00013730 Junction 11 22 4,00013732 Junction 11 25 4,00013736 Junction 11 40 3,00013738 Junction 11 40 3,00013740 Junction 11 40 4,00013744 Junction 11 38 4,00013746 Junction 11 40 4,00013750 Junction 11 60 4,00013756 Junction 11 14 4,00013758 Junction 11 10 4,00013760 Junction 11 15 4,00013762 Junction 11 12 4,00013764 Junction 11 14 4,00013766 Junction 11 18 4,00013768 Junction 11 38 2,72013770 Junction 11 25 4,00013772 Junction 11 30 4,00013774 Junction 11 30 3,00013776 Junction 11 25 2,44013778 Junction 11 30 3,00013780 Junction 11 50 3,00013782 Junction 11 15 4,00013784 Junction 11 45 2,90013786 Junction 11 70 1,50013788 Junction 11 75 1,50013790 Junction 11 135 74013792 Junction 11 130 81013794 Junction 11 120 89013796 Junction 11 60 1,30013798 Junction 11 40 1,24013800 Junction 11 60 1,01013802 Junction 11 30 1,05013804 Junction 11 25 1,14013806 Junction 11 30 94013808 Junction 11 32 87013810 Junction 11 35 80013812 <strong>Water</strong> User #10 11 25 80013814 Junction 11 35 70013816 Junction 11 78 2,55013818 Junction 11 30 3,00013820 Junction 11 30 3,00013822 Junction 11 60 2,200A 2007 Treated <strong>Water</strong> <strong>Master</strong> <strong>Plan</strong> Update E-25
Appendix EFire Flow Analysis ResultsTable E-2Av<strong>ai</strong>lable Fireflow, All Locations (1)Model ID Model Description Zone Elevation (ft) Av<strong>ai</strong>lable Fireflow(gpm)13824 Zone 11/ Zone 25 11 62 1,83013826 Junction 11 30 3,00013828 Junction 11 22 3,00013830 Junction 11 20 3,00013832 Junction 11 20 3,00013834 Junction 11 30 3,00013842 Junction 11 60 1,36013844 Junction 11 60 1,31013848 Junction 11 58 1,15013850 Junction 11 80 92013854 11 85 1,50013856 11 81 1,50013858 11 80 1,50013860 11 76 1,50013862 11 78 1,50013864 11 95 1,79013866 11 55 3,00013868 11 70 3,00013870 11 68 1,50013872 11 76 3,00013874 11 72 3,00013876 11 58 1,50013878 11 60 1,50013880 11 60 2,75013882 11 60 3,00013884 11 60 3,00013886 11 60 2,78013888 11 60 1,50013890 11 70 1,50013892 11 75 1,50013894 11 55 3,00013896 11 54 3,47013900 11 48 3,00013902 11 48 3,00013904 11 75 3,00013906 11 79 3,00013908 11 84 3,00013910 11 88 1,50013912 11 99 2,56013914 11 106 1,50013916 11 125 1,03013918 11 126 1,12013920 11 101 1,50013921 New Junction 11 105 1,55013922 11 104 1,58013923 New Junction 11 103 1,19013924 11 93 1,50013925 New Junction 11 101 3,00013926 11 70 1,50013928 11 72 3,00013930 11 68 1,50013932 11 91 3,00013934 11 67 1,50013936 11 90 3,000E-26 2007 Treated <strong>Water</strong> <strong>Master</strong> <strong>Plan</strong> Update A
Appendix EFire Flow Analysis ResultsTable E-2Av<strong>ai</strong>lable Fireflow, All Locations (1)Model ID Model Description Zone Elevation (ft) Av<strong>ai</strong>lable Fireflow(gpm)13938 11 90 3,00013940 11 95 3,00013942 11 95 3,00013944 11 95 3,00013946 11 93 3,00013948 11 103 1,49013950 11 103 1,48013952 Junction 11 103 1,91013954 Junction 11 100 2,35013956 Junction 11 95 1,50013957 11 1,50013958 Junction 11 95 1,50013960 Junction 11 95 1,48013962 Junction 11 100 1,16013964 Junction 11 95 1,46013966 Junction 11 95 2,73013968 Junction 11 67 3,00013970 Junction 11 67 3,00013972 Junction 11 67 3,00013974 Junction 11 67 1,50013976 11 82 3,00013978 11 75 1,50013980 11 78 1,96013982 11 68 1,50013984 11 65 3,00013986 11 62 1,60013988 11 61 3,00013990 11 59 3,00013992 11 56 3,00013994 11 65 3,00013996 11 65 3,00013998 11 65 3,00014000 11 70 1,50014004 11 77 3,00014006 11 71 1,50014008 11 73 1,50014010 11 76 3,00014012 11 85 1,50014014 11 86 1,50014016 11 87 3,00014018 11 98 3,00014020 11 98 2,32014022 11 98 2,77014024 11 98 2,10014026 11 83 1,50014028 11 97 1,50014030 11 97 1,50014032 11 96 1,50014034 11 87 3,00014036 11 79 3,00014038 11 85 3,00014040 11 89 3,00014042 11 85 3,00014044 11 85 1,500A 2007 Treated <strong>Water</strong> <strong>Master</strong> <strong>Plan</strong> Update E-27
Appendix EFire Flow Analysis ResultsTable E-2Av<strong>ai</strong>lable Fireflow, All Locations (1)Model ID Model Description Zone Elevation (ft) Av<strong>ai</strong>lable Fireflow(gpm)14046 11 85 1,50014048 11 85 3,00014050 11 85 3,00014052 11 83 3,00014054 11 92 3,00014056 11 90 2,55014058 11 76 3,00014060 11 90 1,50014062 11 95 1,50014064 11 50 3,00014066 11 52 3,00014068 11 58 1,50014070 11 60 2,03014072 11 60 1,94014074 11 56 4,00014078 11 58 2,53014079 New Junction 11 60 1,06014080 11 56 1,50014082 11 52 3,00014084 11 52 2,64014086 11 54 3,00014088 11 49 3,00014090 11 51 3,00014091 11 55 4,00014092 11 51 4,00014094 11 49 3,00014096 11 46 1,50014098 11 43 1,69014100 11 44 3,00014102 11 32 3,00014104 11 42 1,50014106 11 44 1,50014108 11 47 1,50014110 11 48 3,00014112 11 25 3,00014114 11 30 3,00014116 11 16 4,00014120 Junction 11 82 1,13014121 11 50 4,00014122 Junction 11 80 4,00014124 11 52 3,00014126 11 57 2,97014128 11 48 1,50014130 11 97 1,50014132 11 98 3,00014134 11 95 1,50014136 11 98 3,00014138 11 97 3,00014140 11 97.5 3,00014142 11 100 3,00014144 11 100 1,50014146 11 82 3,00014148 11 78 3,00014150 11 78 3,000E-28 2007 Treated <strong>Water</strong> <strong>Master</strong> <strong>Plan</strong> Update A
Appendix EFire Flow Analysis ResultsTable E-2Av<strong>ai</strong>lable Fireflow, All Locations (1)Model ID Model Description Zone Elevation (ft) Av<strong>ai</strong>lable Fireflow(gpm)14152 11 82 3,00014154 11 83 3,00014156 11 91 3,00014158 11 82 3,00014160 11 110 2,23014162 11 52 3,00014164 11 90 1,59014166 11 91 3,00014168 11 91 3,00014172 11 53 3,00014174 11 90 3,00014176 11 55 1,50014178 Junction 11 59 3,00014180 11 52 1,50014182 11 16 3,00014184 11 15 3,00014186 11 13 3,00014188 11 15 3,00014190 11 15 3,00014192 11 15 3,00014194 11 15 3,00014196 11 50 3,00014198 11 55 4,00014200 11 53 3,00014206 Junction 11 70 1,50014208 Junction 11 70 1,50014210 Junction 11 70 1,50014212 Junction 11 60 1,500143190 398038-FH@Brandoon Dr. 11 90 2,05015010 Junction 11 35 3,00015012 Junction 11 50 3,000150136 398028-Concord Industrial Park II 11 23 3,000150138 398028-Concord Industrial Park II 11 24 3,000150140 398028-Concord Industrial Park II 11 24 3,000150142 398028-Concord Industrial Park II 11 23 3,000150144 398028-Concord Industrial Park II 11 26 3,000150146 398036-Pleasant Hill Downtown 11 56 3,000150150 398036-Pleasant Hill Downtown 11 53 3,000150152 398036-Pleasant Hill Downtown 11 52 3,000150154 398036-Pleasant Hill Downtown 11 52 2,130150156 398036-Pleasant Hill Downtown 11 48 3,00015018 Junction 11 26 1,50015020 11 51 3,00015022 Junction 11 23 4,00015024 Junction 11 37 1,80015026 Junction 11 40 1,50015028 Junction 11 37 3,00015030 Junction 11 39 3,00015032 Junction 11 35 1,50015034 Junction 11 39 3,00015036 Junction 11 85 2,34015038 Junction 11 89 3,00015040 Junction 11 87 3,00015042 Junction 11 87 3,000A 2007 Treated <strong>Water</strong> <strong>Master</strong> <strong>Plan</strong> Update E-29
Appendix EFire Flow Analysis ResultsTable E-2Av<strong>ai</strong>lable Fireflow, All Locations (1)Model ID Model Description Zone Elevation (ft) Av<strong>ai</strong>lable Fireflow(gpm)15044 Junction 11 90 3,00015046 Junction 11 90 3,00015048 Junction 11 90 3,00015050 Junction 11 90 3,00015052 Junction 11 90 3,000150520 399001-Station Park Apartments 11 85 3,000150522 399001-Station Park Apartments 11 85 2,69015054 Junction 11 90 3,00015056 Junction 11 90 3,00015058 Junction 11 90 1,50015060 Junction 11 85 3,00015062 Junction 11 90 3,00015064 Junction 11 90 3,00015066 Junction 11 90 3,00015068 Junction 11 90 3,00015070 Junction 11 83 3,00015072 Junction 11 85 3,00015074 Junction 11 85 3,00015076 Junction 11 80 3,00015078 Junction 11 80 3,00015080 Junction 11 75 3,00015082 Junction 11 72 3,00015084 Junction 11 72 3,00015086 Junction 11 72 3,00015088 Junction 11 72 1,50015090 Junction 11 75 3,00015092 Junction 11 80 3,00015094 Junction 11 80 3,00015096 Junction 11 70 1,50015098 Junction 11 85 1,50015100 Junction 11 85 3,00015102 Junction 11 85 1,50015104 Junction 11 80 1,50015106 Junction 11 80 1,50015108 Junction 11 80 1,50015110 Junction 11 80 1,50015112 Junction 11 85 1,500151130 399001-Station Park Apartments 11 85 3,00015114 Junction 11 85 3,00015116 Junction 11 90 3,00015118 Junction 11 80 1,50015120 Junction 11 88 3,00015122 Junction 11 70 1,50015124 Junction 11 85 3,00015126 Junction 11 52 3,00015128 Junction 11 53 3,00015130 Junction 11 53 3,00015132 Junction 11 53 3,00015134 11 50 3,00016000 11 80 3,00016002 Junction 11 42 3,00016004 Junction 11 45 3,00016006 Junction 11 71 3,00016008 Junction 11 42 1,500E-30 2007 Treated <strong>Water</strong> <strong>Master</strong> <strong>Plan</strong> Update A
Appendix EFire Flow Analysis ResultsTable E-2Av<strong>ai</strong>lable Fireflow, All Locations (1)Model ID Model Description Zone Elevation (ft) Av<strong>ai</strong>lable Fireflow(gpm)16012 <strong>Water</strong> User #3 & #6 11 77 1,50016014 <strong>Water</strong> User #5 11 28 3,00016016 <strong>Water</strong> User #35 11 46.86 3,00016018 <strong>Water</strong> User #12 11 64.5 1,50016020 <strong>Water</strong> User #33 11 54 2,62016022 <strong>Water</strong> User #29 and #34 11 83 3,00016024 <strong>Water</strong> User #14 11 95 3,00016026 <strong>Water</strong> User #17 11 22 3,00016050 Junction 11 42 3,00018003 Junction 11 95 1,50021000 Junction 21 123 2,42021002 Junction 21 120 2,78021004 Junction 21 119 2,70021006 Junction 21 120 3,00021008 Junction 21 120 3,00021010 Junction 21 121 3,00021012 Junction 21 122 3,00021014 Junction 21 121 3,00021016 Junction 21 125 1,50021018 Junction 21 118 3,00021020 Junction 21 118 3,00021022 Junction 21 116 3,00021024 Junction 21 125 3,00021026 Junction 21 132 3,00021028 21 134 1,50021030 Junction 21 137 1,50021032 Junction 21 155 3,00021034 Junction 21 155 1,50021036 Junction 21 153 1,50021038 Junction 21 162 3,00021040 Junction 21 162 3,00021042 Junction 21 162 3,00021044 Junction 21 159 3,00021046 Junction 21 158 3,00021048 Junction 21 155 2,96021050 Junction 21 162 3,00021052 Junction 21 160 3,00021054 Junction 21 156 3,00021056 Junction 21 130 1,50021058 Junction 21 132 2,39021060 Junction 21 134 2,24021062 Junction 21 130 1,50021064 Junction 21 139 1,50021066 Junction 21 141 1,50021068 Junction 21 142 1,50021070 Junction 21 137 1,50021072 Junction 21 132 1,50021074 Junction 21 132 1,50021076 Junction 21 144 2,08021078 Junction 21 148 1,50021080 Junction 21 151 1,50021082 Junction 21 158 1,90021084 Junction 21 161 1,50021086 Junction 21 164 1,590A 2007 Treated <strong>Water</strong> <strong>Master</strong> <strong>Plan</strong> Update E-31
Appendix EFire Flow Analysis ResultsTable E-2Av<strong>ai</strong>lable Fireflow, All Locations (1)Model ID Model Description Zone Elevation (ft) Av<strong>ai</strong>lable Fireflow(gpm)21088 Junction 21 165 3,00021090 Junction 21 176 1,50021092 Junction 21 180 3,00021094 Junction 21 180 3,00021096 Junction 21 180 3,00021098 Junction 21 185 3,00021100 Junction 21 185 1,50021102 Junction 21 185 1,50021104 Junction 21 185 1,50021106 Junction 21 178 2,12021108 Junction 21 188 1,50021110 Junction 21 193 1,50021112 Junction 21 185 3,00021114 Junction 21 185 3,00021116 Junction 21 185 1,50021118 Junction 21 188 1,50021120 Junction 21 190 1,50021122 Junction 21 190 1,50021124 Junction 21 195 1,50021126 Junction 21 190 1,50021128 Junction 21 195 3,00021130 Junction 21 200 1,50021132 Junction 21 195 1,50021134 Junction 21 190 1,50021136 Junction 21 190 1,50021138 Junction 21 185 1,50021140 Junction 21 187 1,50021142 Junction 21 187 2,15021144 Junction 21 187 1,50021146 Junction 21 186 1,50021148 Junction 21 185 3,00021150 Junction 21 188 1,50021152 Junction 21 192 1,50021154 Junction 21 188 1,50021156 Junction 21 195 1,50021158 Junction 21 195 1,50021160 Junction 21 200 1,50021162 Junction 21 200 1,50021164 Junction 21 200 1,50021166 Junction 21 205 1,50021168 Junction 21 205 1,50021170 Junction 21 215 1,50021172 Junction 21 215 1,50021174 Junction 21 205 1,50021176 Junction 21 205 1,50021178 Junction 21 210 1,50021180 Junction 21 205 1,50021182 Junction 21 210 1,50021184 Junction 21 210 1,50021186 Junction 21 210 1,50021188 Junction 21 215 1,50021190 Junction 21 215 1,50021192 Junction 21 220 1,50021196 Junction 21 220 1,500E-32 2007 Treated <strong>Water</strong> <strong>Master</strong> <strong>Plan</strong> Update A
Appendix EFire Flow Analysis ResultsTable E-2Av<strong>ai</strong>lable Fireflow, All Locations (1)Model ID Model Description Zone Elevation (ft) Av<strong>ai</strong>lable Fireflow(gpm)21198 Junction 21 220 1,50021200 Junction 21 220 1,50021202 Junction 21 215 3,00021204 Junction 21 215 1,50021206 Junction 21 215 1,50021208 Junction 21 215 1,50021210 Junction 21 215 1,50021212 Junction 21 215 1,50021214 Junction 21 215 1,50021216 Junction 21 210 1,50021218 Junction 21 205 3,00021220 Junction 21 205 1,50021222 Junction 21 205 1,50021224 Junction 21 200 1,50021226 Junction 21 200 1,50021228 Junction 21 205 3,00021230 Junction 21 205 1,50021232 Junction 21 215 1,50021234 Junction 21 205 1,50021236 Junction 21 205 1,50021238 Junction 21 215 3,00021240 Junction 21 215 3,00021242 Junction 21 216 3,00021244 Junction 21 210 3,00021246 Junction 21 214 3,00021248 Junction 21 215 3,00021250 Junction 21 215 3,00021256 Junction 21 210 2,64021258 Junction 21 210 1,50021260 Junction 21 205 1,50021262 Junction 21 205 1,50021264 Junction 21 205 3,00021266 Junction 21 215 3,00021268 Junction 21 205 1,50021270 Junction 21 205 1,50021272 Junction 21 195 1,50021274 Junction 21 195 1,50021276 Junction 21 205 1,50021278 Junction 21 205 1,50021280 Junction 21 200 1,50021282 Junction 21 205 3,00021284 Junction 21 200 3,00021286 Junction 21 195 3,00021288 Junction 21 195 3,00021290 Junction 21 195 1,50021292 Junction 21 195 1,50021294 Junction 21 195 1,50021296 Junction 21 186 3,00021298 Junction 21 185 3,00021300 Junction 21 185 3,00021302 Junction 21 190 3,00021304 Junction 21 190 3,00021308 Junction 21 182 1,50021310 Junction 21 182 1,500A 2007 Treated <strong>Water</strong> <strong>Master</strong> <strong>Plan</strong> Update E-33
Appendix EFire Flow Analysis ResultsTable E-2Av<strong>ai</strong>lable Fireflow, All Locations (1)Model ID Model Description Zone Elevation (ft) Av<strong>ai</strong>lable Fireflow(gpm)21312 Junction 21 185 1,50021314 Junction 21 180 3,00021316 Junction 21 173 1,50021318 Junction 21 176 1,50021320 Junction 21 174 3,00021322 Junction 21 177 1,50021324 Junction 21 183 1,50021326 Junction 21 180 1,50021328 Junction 21 177 1,50021330 Junction 21 177 1,50021332 Junction 21 177 1,50021334 Junction 21 167 1,50021336 Junction 21 166 3,00021338 Junction 21 166 1,50021340 Junction 21 165 3,00021342 Junction 21 165 3,00021344 Junction 21 165 3,00021346 Junction 21 175 3,00021348 Junction 21 176 1,50021350 Junction 21 190 1,50021352 Junction 21 195 1,50021354 Junction 21 193 3,00021358 Junction 21 200 3,00021360 Junction 21 195 3,00021362 Junction 21 200 3,00021364 Junction 21 195 3,00021366 Junction 21 190 3,00021368 Junction 21 195 3,00021370 Junction 21 195 3,00021372 Junction 21 195 3,00021374 Junction 21 195 3,00021376 Junction 21 190 3,00021378 Junction 21 190 3,00021380 Junction 21 195 3,00021382 Junction 21 192 3,00021384 Junction 21 240 3,00021392 Junction 21 200 1,50021396 Junction 21 190 3,00021398 Junction 21 180 3,00021400 Junction 21 167 3,00021402 Junction 21 65 3,00021404 Junction 21 162 3,00021406 Junction 21 166 3,00021408 Junction 21 165 1,50021410 Junction 21 183 1,50021412 Junction 21 185 1,50021414 Junction 21 170 1,50021416 Junction 21 173 1,50021418 Junction 21 165 3,00021420 Junction 21 148 1,50021422 Junction 21 142 1,50021424 Junction 21 152 3,00021426 Junction 21 155 3,00021428 Junction 21 154 3,000E-34 2007 Treated <strong>Water</strong> <strong>Master</strong> <strong>Plan</strong> Update A
Appendix EFire Flow Analysis ResultsTable E-2Av<strong>ai</strong>lable Fireflow, All Locations (1)Model ID Model Description Zone Elevation (ft) Av<strong>ai</strong>lable Fireflow(gpm)21430 Junction 21 153 3,00021432 Junction 21 146 1,50021434 Junction 21 145 1,50021436 Junction 21 139 1,50021438 Junction 21 136 1,50021440 Junction 21 124 2,99021442 Junction 21 123 1,50021444 Junction 21 117 2,73021446 Junction 21 116 1,50021448 Junction 21 115 2,77021450 Junction 21 115 2,90021452 Junction 21 134 1,50021454 Junction 21 129 1,50021456 Junction 21 123 1,50021458 Junction 21 123 1,50021460 Junction 21 122 1,50021462 Junction 21 121 1,50021464 Junction 21 122 1,50021466 Junction 21 125 1,50021468 Junction 21 125 1,50021470 Junction 21 134 1,50021472 Junction 21 138 1,50021474 Junction 21 133 1,50021476 Junction 21 136 1,50021478 Junction 21 137 1,50021480 Junction 21 128 1,50021482 Junction 21 124 1,50021484 Junction 21 126 1,50021486 Junction 21 130 1,50021488 Junction 21 140 1,50021490 Junction 21 141 1,50021492 Junction 21 150 2,00021494 Junction 21 150 1,50021496 Junction 21 152 1,50021498 Junction 21 156 1,50021500 Junction 21 156 1,500215002 197606-Maynard and Chestnut M<strong>ai</strong>n21 125 3,000Replace215004 197606-Maynard and Chestnut M<strong>ai</strong>n21 127 3,000Replace215006 197606-Maynard and Chestnut M<strong>ai</strong>n21 130 3,000Replace215008 197606-Maynard and Chestnut M<strong>ai</strong>n21 135 1,500Replace215010 197606-Maynard and Chestnut M<strong>ai</strong>n21 135 1,500Replace215012 197606-Maynard and Chestnut M<strong>ai</strong>n21 140 1,500Replace215016 197606-Maynard and Chestnut M<strong>ai</strong>n21 125 3,000Replace21502 Junction 21 160 2,94021506 Junction 21 162 3,00021508 Junction 21 154 1,50021510 Junction 21 144 3,000A 2007 Treated <strong>Water</strong> <strong>Master</strong> <strong>Plan</strong> Update E-35
Appendix EFire Flow Analysis ResultsTable E-2Av<strong>ai</strong>lable Fireflow, All Locations (1)Model ID Model Description Zone Elevation (ft) Av<strong>ai</strong>lable Fireflow(gpm)21512 Junction 21 139 3,00021514 Junction 21 155 1,50021516 Junction 21 160 3,00021518 Junction 21 165 3,00021520 Junction 21 160 3,00021522 Junction 21 170 3,00021524 Junction 21 180 3,00021526 Junction 21 165 3,00021528 Junction 21 160 3,00021530 Junction 21 160 1,50021532 Junction 21 160 1,50021534 Junction 21 160 3,00021536 Junction 21 157 3,00021538 Junction 21 125 1,50021540 Junction 21 123 1,50021542 Junction 21 116 1,50021544 Junction 21 120 1,50021546 Junction 21 122 1,50021548 Junction 21 125 1,50021550 Junction 21 123 1,50021552 Junction 21 115 3,00021554 Junction 21 103 3,00021556 Junction 21 105 2,77021558 Junction 21 104 3,00021560 Junction 21 105 3,00021562 Junction 21 118 3,00021564 Junction 21 125 1,50021566 Junction 21 137 3,00021568 Junction 21 130 3,00021570 Junction 21 115 3,00021572 Junction 21 134 3,00021574 Junction 21 130 3,00021576 Junction 21 120 1,50021578 Junction 21 120 1,50021580 Junction 21 120 3,00021582 Junction 21 125 3,00021584 Junction 21 160 3,00021586 Junction 21 145 3,00021588 Junction 21 135 3,00021590 Junction 21 165 3,00021592 Junction 21 170 2,97021594 Junction 21 103 2,86021596 Junction 21 103 1,50021598 Junction 21 103 1,50021600 Junction 21 105 1,50021602 Junction 21 110 3,00021604 Junction 21 105 3,00021606 Junction 21 105 1,50021608 Junction 21 105 1,50021610 Junction 21 105 1,50021618 Junction 21 210 1,50021620 Junction 21 200 1,50021622 Junction 21 250 1,50021624 Junction 21 250 1,500E-36 2007 Treated <strong>Water</strong> <strong>Master</strong> <strong>Plan</strong> Update A
Appendix EFire Flow Analysis ResultsTable E-2Av<strong>ai</strong>lable Fireflow, All Locations (1)Model ID Model Description Zone Elevation (ft) Av<strong>ai</strong>lable Fireflow(gpm)21626 Junction 21 205 1,50021628 Junction 21 180 1,50021630 Junction 21 155 1,50021632 Junction 21 200 1,50021634 Junction 21 180 1,50021636 Junction 21 160 1,50021638 Junction 21 115 3,00021640 Junction 21 120 1,50021642 Junction 21 135 1,50021644 Junction 21 140 1,50021646 Junction 21 105 1,50021648 Junction 21 105 1,50021654 Junction 21 110 1,50021656 Junction 21 135 1,09021658 Junction 21 135 1,06021660 LIME RIDGE 21 205 3,00021662 Junction 21 130 3,00021664 Junction 21 130 3,00021670 Junction 21 200 1,50021672 Junction 21 180 1,50021674 Junction 21 175 1,50021676 Junction 21 155 1,50021678 Junction 21 240 1,50021680 Junction 21 125 3,00021682 Junction 21 140 1,50021684 Junction 21 140 1,50021686 Junction 21 140 1,50021688 Junction 21 135 1,50021690 Junction 21 130 1,50021692 Junction 21 130 1,50021694 Junction 21 145 3,00021696 Junction 21 150 1,50021698 Junction 21 150 1,50021700 Junction 21 145 1,50021704 Junction 21 135 1,50021706 Junction 21 140 1,50021708 Junction 21 145 1,50021710 Junction 21 135 1,50021712 Junction 21 220 1,50021714 Junction 21 190 1,50021716 Junction 21 170 1,50021718 Junction 21 170 1,50021720 Junction 21 180 1,50021722 Junction 21 210 1,50021724 Junction 21 240 1,50021726 Junction 21 220 1,50021728 Junction 21 220 1,50021730 Junction 21 180 3,00021732 Junction 21 180 3,00021734 Junction 21 175 1,50021736 Junction 21 175 1,50021738 Junction 21 165 3,00021740 Junction 21 165 3,00021742 Junction 21 160 1,500A 2007 Treated <strong>Water</strong> <strong>Master</strong> <strong>Plan</strong> Update E-37
Appendix EFire Flow Analysis ResultsTable E-2Av<strong>ai</strong>lable Fireflow, All Locations (1)Model ID Model Description Zone Elevation (ft) Av<strong>ai</strong>lable Fireflow(gpm)21744 Junction 21 170 1,50021746 Junction 21 170 3,00021748 Junction 21 170 3,00021750 Junction 21 180 3,00021752 Junction 21 180 3,00021754 Junction 21 175 3,00021756 Junction 21 175 3,00021758 Junction 21 175 3,00021760 Junction 21 185 3,00021762 Junction 21 180 3,00021764 Junction 21 180 3,00021766 Junction 21 210 1,50021768 Junction 21 200 1,50021770 Junction 21 195 1,50021776 Junction 21 220 1,50021780 Junction 21 215 3,00021784 Junction 21 215 3,00021786 Junction 21 220 3,00021788 Junction 21 210 3,00021790 Junction 21 210 3,00021792 Junction 21 200 1,50021794 Junction 21 190 1,50021796 Junction 21 185 1,50021798 Junction 21 180 1,50021800 Junction 21 190 1,500218004 398026-4 inch FS Burger King 21 185 3,000218006 398026-4 inch FS Burger King 21 185 3,00021802 Junction 21 190 1,50021804 Junction 21 180 1,50021806 Junction 21 180 1,50021808 Junction 21 175 1,50021810 Junction 21 200 1,50021812 Junction 21 180 3,00021814 Junction 21 185 3,00021816 Junction 21 180 3,00021818 Junction 21 185 3,00021820 Junction 21 185 3,00021822 Junction 21 185 3,00021826 21 110 2,74021832 21 130 1,50021834 21 103 3,00021836 21 120 4,00021838 21 155 3,00021840 21 150 1,50021842 21 100 1,50021844 21 80 1,50021848 21 220 3,00021850 21 123 1,50021852 21 130 3,00021854 21 135 1,50021856 21 140 1,50021858 21 150 3,00021860 21 155 1,50021862 21 115 2,790E-38 2007 Treated <strong>Water</strong> <strong>Master</strong> <strong>Plan</strong> Update A
Appendix EFire Flow Analysis ResultsTable E-2Av<strong>ai</strong>lable Fireflow, All Locations (1)Model ID Model Description Zone Elevation (ft) Av<strong>ai</strong>lable Fireflow(gpm)21864 21 104 3,00021866 21 175 1,50021868 21 193 1,50021870 21 170 3,00021872 21 177 3,00021874 Junction 21 220 3,00021902 Junction 21 190 3,00021904 Junction 21 190 2,74021906 Junction 21 190 3,00022002 Junction 22 125 1,50022008 Junction 22 180 1,50022010 Junction 22 200 1,50022012 Junction 22 202 1,50022016 Junction 22 130 1,50022018 Junction 22 140 1,50022020 Junction 22 102 1,50022022 Junction 22 142 1,50022024 Junction 22 190 1,50022028 Junction 22 190 1,50022032 Junction 22 180 1,50022034 Junction 22 102 1,50022036 Junction 22 110 1,50022038 Junction 22 112 1,50022040 Junction 22 130 1,50022042 Junction 22 185 1,50022044 Junction 22 182 1,50022046 Junction 22 139 1,50022048 Junction 22 125 3,00022050 Junction 22 127 1,50022052 Junction 22 125 1,50022054 Junction 22 123 1,50022056 Junction 22 113 1,50022058 Junction 22 116 1,50022060 Junction 22 117 1,50022062 Junction 22 120 3,00022064 Junction 22 107 1,50022066 Junction 22 102 1,50022068 Junction 22 104 1,50022070 Junction 22 102 1,50022072 Junction 22 104 1,50022074 Junction 22 102 1,50022076 Junction 22 107 3,00022078 Junction 22 108 1,50022080 Junction 22 124 1,50022082 Junction 22 125 1,50022084 Junction 22 123 3,00022086 Junction 22 120 3,00022088 Junction 22 118 3,00022090 Junction 22 114 3,00022092 Junction 22 113 3,00022094 Junction 22 114 3,00022096 Junction 22 118 3,00022098 Junction 22 118 3,00022100 Junction 22 129 3,000A 2007 Treated <strong>Water</strong> <strong>Master</strong> <strong>Plan</strong> Update E-39
Appendix EFire Flow Analysis ResultsTable E-2Av<strong>ai</strong>lable Fireflow, All Locations (1)Model ID Model Description Zone Elevation (ft) Av<strong>ai</strong>lable Fireflow(gpm)22102 Junction 22 108 1,50022104 Junction 22 107 3,00022106 Junction 22 114 3,00022108 Junction 22 114 3,00022110 Junction 22 112 3,00022112 Junction 22 103 1,50022114 Junction 22 100 3,00022116 Junction 22 107 3,00022118 Junction 22 107 3,00022120 Junction 22 114 3,00022122 Junction 22 115 3,00022124 Junction 22 115 3,00022126 Junction 22 107 3,00022128 Junction 22 108 3,00022130 Junction 22 106 3,00022132 Junction 22 123 3,00022138 Junction 22 123 1,50022140 Junction 22 123 3,00022142 Junction 22 118 1,50022144 Junction 22 118 3,00022146 Junction 22 111 3,00022148 Junction 22 107 1,50022150 Junction 22 98 1,50022152 Junction 22 98 3,00022154 Junction 22 98 1,50022160 Junction 22 124 3,00022162 Junction 22 131 3,00022164 Junction 22 133 3,00022166 Junction 22 134 1,50022168 Junction 22 125 3,00022172 Junction 22 133 3,00022176 Junction 22 137 1,50022178 Junction 22 139 3,00022180 Junction 22 138 1,50022182 Junction 22 138 1,50022184 Junction 22 139 3,00022186 Junction 22 143 1,50022188 Junction 22 137 1,50022192 Junction 22 137 1,50022194 Junction 22 147 3,00022196 Junction 22 148 1,50022200 Junction 22 163 1,50022202 Junction 22 157 1,50022204 Junction 22 157 1,50022206 Junction 22 165 1,50022208 Junction 22 157 1,50022210 Junction 22 158 3,00022212 Junction 22 153 3,00022216 Junction 22 149 3,00022222 Junction 22 170 3,00022226 Junction 22 178 3,00022228 Junction 22 175 1,50022230 Junction 22 188 1,50022232 Junction 22 185 1,500E-40 2007 Treated <strong>Water</strong> <strong>Master</strong> <strong>Plan</strong> Update A
Appendix EFire Flow Analysis ResultsTable E-2Av<strong>ai</strong>lable Fireflow, All Locations (1)Model ID Model Description Zone Elevation (ft) Av<strong>ai</strong>lable Fireflow(gpm)22234 Junction 22 182 1,50022236 Junction 22 192 1,50022238 Junction 22 218 3,00022240 Junction 22 225 1,50022242 22 116 3,00022244 Junction 22 191 1,50022246 Junction 22 215 1,50022248 Junction 22 200 1,50022250 Junction 22 220 1,50022252 Junction 22 220 1,50022254 Junction 22 205 1,50022256 Junction 22 195 1,50022258 Junction 22 260 1,50022260 Junction 22 176 1,50022262 Junction 22 183 1,50022264 Junction 22 199 1,50022266 Junction 22 218 1,50022268 Junction 22 200 1,50022270 Junction 22 180 1,50022272 Junction 22 175 1,50022274 Junction 22 171 1,50022276 Junction 22 167 1,50022278 Junction 22 171 1,50022280 Junction 22 162 1,50022282 Junction 22 157 1,50022284 Junction 22 154 3,00022286 Junction 22 164 1,50022288 Junction 22 162 1,50022290 Junction 22 156 1,50022292 Junction 22 154 3,00022294 Junction 22 153 3,00022296 Junction 22 146 1,50022298 Junction 22 146 1,50022300 Junction 22 147 1,50022302 Junction 22 148 1,50022304 Junction 22 136 1,50022306 Junction 22 132 3,00022308 Junction 22 129 3,00022310 Junction 22 136 1,50022312 Junction 22 143 1,50022314 Junction 22 139 1,50022316 Junction 22 137 1,50022318 Junction 22 132 1,50022320 Junction 22 129 1,500223202 398030-Evangelical Free Church 22 128 3,000223216 398030-Evangelical Free Church 22 120 3,00022322 Junction 22 129 3,000223228 Junction 22 129 3,000223234 FH 22 122 1,82022324 Junction 22 130 1,50022326 Junction 22 140 3,00022328 Junction 22 137 1,50022330 Junction 22 123 1,50022332 Junction 22 130 1,500A 2007 Treated <strong>Water</strong> <strong>Master</strong> <strong>Plan</strong> Update E-41
Appendix EFire Flow Analysis ResultsTable E-2Av<strong>ai</strong>lable Fireflow, All Locations (1)Model ID Model Description Zone Elevation (ft) Av<strong>ai</strong>lable Fireflow(gpm)22336 Junction 22 125 3,00022338 Junction 22 107 1,50022340 Junction 22 107 1,50022342 Junction 22 106 3,00022344 Junction 22 111 3,00022346 Junction 22 118 1,50022348 Junction 22 118 1,50022350 Junction 22 118 1,50022358 Junction 22 127 3,00022360 Junction 22 128 3,00022362 Junction 22 118 3,00022364 Junction 22 118 3,00022366 Junction 22 121 3,00022368 Junction 22 117 3,00022370 Junction 22 116 3,00022372 Junction 22 110 3,00022376 Junction 22 110 3,00022380 Junction 22 100 2,80022382 Junction 22 120 2,17022384 Junction 22 140 2,13022386 Junction 22 100 4,00022390 Junction 22 116 3,00022392 Junction 22 113 3,00022394 Junction 22 111 3,00022396 Junction 22 107 3,00022398 Junction 22 104 3,00022400 Junction 22 101 3,00022402 Junction 22 101 3,00022404 Junction 22 100 3,00022406 Junction 22 111 3,00022408 Junction 22 111 3,00022410 Junction 22 133 1,50022414 Junction 22 165 1,50022416 Junction 22 133 3,00022418 Junction 22 146 3,00022430 Junction 22 205 1,50022432 Junction 22 198 1,50022434 Junction 22 182 3,00022436 Junction 22 220 1,50022438 Junction 22 220 1,50022440 Junction 22 175 1,50022442 Junction 22 170 1,50022444 Junction 22 162 1,50022446 Junction 22 155 1,50022448 Junction 22 154 1,50022450 Junction 22 147 1,50022452 Junction 22 138 3,00022454 Junction 22 141 1,50022456 Junction 22 152 1,50022458 Junction 22 165 1,50022460 Junction 22 166 1,50022462 Junction 22 168 1,50022464 Junction 22 168 1,50022466 Junction 22 158 1,500E-42 2007 Treated <strong>Water</strong> <strong>Master</strong> <strong>Plan</strong> Update A
Appendix EFire Flow Analysis ResultsTable E-2Av<strong>ai</strong>lable Fireflow, All Locations (1)Model ID Model Description Zone Elevation (ft) Av<strong>ai</strong>lable Fireflow(gpm)22468 Junction 22 157 1,50022470 Junction 22 175 1,50022472 Junction 22 184 1,50022476 Junction 22 195 1,50022478 Junction 22 215 1,50022480 Junction 22 220 1,50022482 Junction 22 200 3,00022488 Junction 22 220 1,50022492 Junction 22 210 3,00022494 Junction 22 210 1,50022496 Junction 22 215 1,50022498 Junction 22 215 1,50022500 Junction 22 218 1,50022502 Junction 22 210 1,50022504 Junction 22 215 1,50022506 Junction 22 220 2,55022508 Junction 22 210 1,50022510 Junction 22 220 2,45022512 Junction 22 220 1,50022514 Junction 22 220 3,00022516 Junction 22 220 3,00022524 Junction 22 168 1,50022526 Junction 22 171 1,50022528 Junction 22 168 1,50022530 Junction 22 167 1,50022534 Junction 22 182 3,00022536 Junction 22 195 3,00022542 Junction 22 258 3,00022546 Junction 22 238 3,00022548 Junction 22 210 3,00022550 Junction 22 210 1,50022552 Junction 22 205 1,50022554 Junction 22 200 3,00022556 Junction 22 210 1,50022558 Junction 22 218 1,50022560 Junction 22 187 3,00022566 Junction 22 178 1,50022568 Junction 22 184 2,90022570 22 111 1,50022572 22 143 1,50022576 22 124 1,50022578 22 195 1,50022580 22 145 3,00022582 22 178 1,50022584 22 156 1,50022586 22 178 1,50022588 22 208 1,50022590 22 205 1,50022592 22 108 3,00022594 22 205 1,50022596 22 210 1,51022598 22 118 3,00022602 22 108 3,00022604 22 164 1,500A 2007 Treated <strong>Water</strong> <strong>Master</strong> <strong>Plan</strong> Update E-43
Appendix EFire Flow Analysis ResultsTable E-2Av<strong>ai</strong>lable Fireflow, All Locations (1)Model ID Model Description Zone Elevation (ft) Av<strong>ai</strong>lable Fireflow(gpm)22902 Junction 22 103 3,00022904 Junction 22 103 3,00022908 Junction 22 107 3,00022910 Junction 22 107 3,00023000 Junction 23 190 3,00023002 Junction 23 180 1,50023004 Junction 23 170 1,50023006 Junction 23 245 1,13023008 Junction 23 228 1,66023010 Junction 23 170 1,50023014 Junction 23 180 1,50023016 Junction 23 160 1,50023020 Junction 23 160 1,50023022 Junction 23 120 1,50023024 Junction 23 110 1,50023026 Junction 23 120 1,50023028 Junction 23 110 1,50023030 Junction 23 200 1,50023032 Junction 23 218 1,50023034 Junction 23 118 3,00023038 Junction 23 135 3,00023040 Junction 23 100 3,00023042 Junction 23 118 3,00023044 Junction 23 130 3,00023046 Junction 23 140 3,00023048 Junction 23 190 3,00023050 Junction 23 179 3,00023052 Junction 23 169 3,00023056 Junction 23 137 1,50023058 Junction 23 180 1,50023060 Junction 23 140 3,00023062 Junction 23 190 3,00023064 Junction 23 170 3,00023066 Junction 23 190 3,00023068 Junction 23 145 1,50023070 Junction 23 95 1,50023150 398039-Double Eagle 23 121 023152 398039-Double Eagle 23 112 024000 Sun Terrace PS 24 85 1,50024002 Junction 24 80 1,50024004 Junction 24 100 1,50024006 Junction 24 135 1,50024008 Junction 24 182 1,50024010 Junction 24 170 1,50024012 Junction 24 170 1,50024014 Junction 24 150 1,50024016 Junction 24 145 1,50024018 Junction 24 185 1,50024020 Junction 24 185 1,50024022 Junction 24 120 1,50024024 Junction 24 182 1,50024026 Junction 24 170 1,50024028 Junction 24 90 1,50024030 Junction 24 135 1,500E-44 2007 Treated <strong>Water</strong> <strong>Master</strong> <strong>Plan</strong> Update A
Appendix EFire Flow Analysis ResultsTable E-2Av<strong>ai</strong>lable Fireflow, All Locations (1)Model ID Model Description Zone Elevation (ft) Av<strong>ai</strong>lable Fireflow(gpm)24032 Junction 24 178 1,50024034 Junction 24 185 1,50024036 Junction 24 110 1,50024038 Junction 24 122 1,50024040 Junction 24 120 1,50024042 Junction 24 125 1,50024044 Junction 24 130 1,50024046 24 148 1,50024048 Junction 24 70 1,500250000 398024-Brittany Hills Unit 3 25 77 3,000250002 398024-Brittany Hills Unit 3 25 77 3,000250004 398024-Brittany Hills Unit 3 25 77 4,000250006 398024-Brittany Hills Unit 3 25 84 3,000250008 398024-Brittany Hills Unit 3 25 89 3,000250010 398024-Brittany Hills Unit 3 25 94.5 3,000250012 398024-Brittany Hills Unit 3 25 96.5 2,860250014 398024-Brittany Hills Unit 3 25 106 3,000250016 398024-Brittany Hills Unit 3 25 114.5 3,000250018 398024-Brittany Hills Unit 3 25 125.5 3,00025002 Junction 25 85 1,500250020 Brittany Hills Unit 2 25 132 3,000250022 Brittany Hills Unit 2 25 130 3,000250023 398023-Brittany Hills Unit 2 25 165 2,600250024 Brittany Hills Unit 2 25 175 1,920250027 398023-Brittany Hills Unit 2 25 124 3,000250028 Brittany Hills Unit 2 25 117 3,000250029 Brittany Hills Unit 2 25 122 3,000250030 Brittany Hills Unit 2 25 105 3,000250032 Brittany Hills Unit 2 25 80 3,000250034 Brittany Hills Unit 2 25 89 2,210250036 Brittany Hills Unit 2 25 108 2,180250038 Brittany Hills Unit 2 25 85 2,32025004 Junction 25 105 1,500250040 Brittany Hills Unit 2 25 108 2,080250046 Brittany Hills Unit 2 25 147 3,000250048 Brittany Hills Unit 2 25 78 3,000250050 Brittany Hills Unit 2 25 78 1,20025006 Junction 25 125 1,50025008 Junction 25 118 1,50025010 Junction 25 110 1,50025012 Junction 25 120 1,50025014 Junction 25 135 1,50025016 Junction 25 170 1,39025018 Junction 25 75 4,00025020 Junction 25 100 1,50025022 Junction 25 105 1,50025024 Junction 25 138 3,00025026 Junction 25 150 3,00025028 Junction 25 78 4,00025030 Junction 25 80 1,50025032 Junction 25 110 1,50025034 Junction 25 100 1,50025036 Junction 25 105 1,50025038 Junction 25 98 1,500A 2007 Treated <strong>Water</strong> <strong>Master</strong> <strong>Plan</strong> Update E-45
Appendix EFire Flow Analysis ResultsTable E-2Av<strong>ai</strong>lable Fireflow, All Locations (1)Model ID Model Description Zone Elevation (ft) Av<strong>ai</strong>lable Fireflow(gpm)25040 Junction 25 98 1,50025042 Junction 25 98 1,50025044 Junction 25 100 3,00025046 Junction 25 120 3,00025048 Junction 25 118 3,00025050 Junction 25 110 3,00025052 Junction 25 110 3,00025054 Junction 25 110 3,00025056 Junction 25 125 3,00025058 Junction 25 160 3,00025060 Junction 25 105 3,00025062 Junction 25 140 4,00025064 Junction 25 160 3,00025066 Junction 25 140 3,00025068 Junction 25 155 3,00025070 Junction 25 160 3,00025072 Junction 25 165 3,00025074 Junction 25 150 3,00025076 Junction 25 162 3,00025078 Junction 25 155 3,00025080 Junction 25 162 3,00025082 Junction 25 162 1,50025084 Junction 25 138 1,50025086 Junction 25 157 1,50025088 Junction 25 150 1,50025090 Junction 25 158 1,50025092 Junction 25 160 1,50025094 Junction 25 145 3,00025096 Junction 25 100 1,50025098 Junction 25 100 1,50025100 Junction 25 140 1,50025102 Junction 25 100 3,00025104 Junction 25 130 3,00025106 Junction 25 120 3,00025108 Junction 25 145 2,91025110 Junction 25 90 1,50025112 Junction 25 90 1,50025114 Junction 25 105 3,00025118 Junction 25 78 3,00025120 Junction 25 70 1,50025122 Junction 25 62 1,50025124 Junction 25 70 1,50025126 Junction 25 70 1,50025128 Junction 25 80 1,50025130 Junction 25 85 1,50025132 Junction 25 190 1,50025134 Junction 25 82 1,50025136 Junction 25 93 1,50025138 Junction 25 95 1,50025140 Junction 25 98 1,50025142 Junction 25 198 1,50025144 Junction 25 142 1,50025146 Junction 25 180 1,50025148 Junction 25 138 1,500E-46 2007 Treated <strong>Water</strong> <strong>Master</strong> <strong>Plan</strong> Update A
Appendix EFire Flow Analysis ResultsTable E-2Av<strong>ai</strong>lable Fireflow, All Locations (1)Model ID Model Description Zone Elevation (ft) Av<strong>ai</strong>lable Fireflow(gpm)25154 Junction 25 242 3,00025160 Junction 25 200 3,00025162 Junction 25 170 3,00025164 Junction 25 142 3,00025166 Junction 25 150 3,00025168 Junction 25 165 3,00025170 Junction 25 200 2,24025172 Junction 25 140 3,00025174 Junction 25 162 3,00025178 Junction 25 125 3,00025180 Junction 25 140 3,00025182 Junction 25 140 3,00025184 Junction 25 143 3,00025186 Junction 25 145 3,00025188 Junction 25 142 3,00025190 Junction 25 116 4,00025192 Junction 25 140 3,00025194 Junction 25 140 3,00025196 Junction 25 150 3,00025200 Junction 25 140 3,00025202 Junction 25 130 3,00025204 Junction 25 138 3,00025206 Junction 25 125 3,00025208 Junction 25 110 3,00025210 Junction 25 98 3,00025212 Junction 25 85 3,00025214 Junction 25 90 3,00025216 Junction 25 90 3,00025218 Junction 25 130 3,00025220 Junction 25 125 3,00025222 Junction 25 125 3,00025226 Junction 25 125 3,00025228 Junction 25 122 3,00025230 Junction 25 105 3,00025232 Junction 25 120 3,00025234 Junction 25 125 3,00025236 Junction 25 120 2,76025238 Junction 25 120 2,73025240 Junction 25 110 2,80025242 Junction 25 100 2,83025244 Junction 25 120 2,46025246 Junction 25 105 2,12025248 Junction 25 98 2,32025250 Junction 25 180 1,50025252 Junction 25 198 3,00025254 Junction 25 170 1,50025262 Junction 25 198 2,50025264 Junction 25 200 3,00025266 Junction 25 179 3,00025268 Junction 25 197 3,00025270 Junction 25 180 3,00025272 Junction 25 178 3,00025274 Junction 25 180 3,00025276 Junction 25 160 3,000A 2007 Treated <strong>Water</strong> <strong>Master</strong> <strong>Plan</strong> Update E-47
Appendix EFire Flow Analysis ResultsTable E-2Av<strong>ai</strong>lable Fireflow, All Locations (1)Model ID Model Description Zone Elevation (ft) Av<strong>ai</strong>lable Fireflow(gpm)25278 Junction 25 160 1,50025280 Junction 25 180 3,00025282 Junction 25 120 1,50025284 Junction 25 118 3,00025286 Junction 25 120 3,00025288 Junction 25 150 3,00025290 Junction 25 190 3,00025294 Junction 25 265 3,00025306 Junction 25 205 3,00025308 Junction 25 117 3,00025310 Junction 25 120 3,00025312 Junction 25 198 3,00025314 Junction 25 200 3,00025316 Junction 25 185 3,00025320 Junction 25 120 3,00025322 Junction 25 162 3,00025324 Junction 25 130 3,00025326 Junction 25 140 3,00025328 Junction 25 185 3,00025330 Junction 25 122 1,50025332 Junction 25 110 1,50025334 Junction 25 90 1,50025336 Junction 25 80 1,50025338 Junction 25 80 3,00025340 Junction 25 160 3,00025342 Junction 25 80 3,00025344 Junction 25 105 3,00025346 Junction 25 200 3,00025348 Junction 25 218 3,00025350 Junction 25 180 3,00025352 Junction 25 160 3,00025354 Junction 25 120 3,00025356 Junction 25 168 3,00025358 Junction 25 160 3,00025360 Junction 25 150 3,00025362 Junction 25 150 3,00025364 Junction 25 132 1,50025366 Junction 25 122 1,50025370 Junction 25 130 3,00025372 Junction 25 130 3,00025374 Junction 25 145 3,00025378 Junction 25 180 3,00025392 Junction 25 130 3,00025394 Junction 25 158 2,62025396 Junction 25 120 3,00025472 25 140 3,00025473 25 85 1,50031000 San Miguel to Zone 41 31 190 1,50031006 Junction 31 220 1,50031008 Junction 31 220 1,50031010 Junction 31 220 3,00031012 Junction 31 280 1,50031014 Treat Lake to Zone 31 31 410 -30031016 Junction 31 215 3,000E-48 2007 Treated <strong>Water</strong> <strong>Master</strong> <strong>Plan</strong> Update A
Appendix EFire Flow Analysis ResultsTable E-2Av<strong>ai</strong>lable Fireflow, All Locations (1)Model ID Model Description Zone Elevation (ft) Av<strong>ai</strong>lable Fireflow(gpm)31018 Junction 31 200 1,50031020 Junction 31 240 1,50031022 Junction 31 210 3,00031024 Junction 31 220 3,00031026 Junction 31 235 3,00031028 Junction 31 280 3,00031030 Junction 31 290 3,00031032 Junction 31 285 3,00031034 Junction 31 250 3,00031036 Junction 31 250 1,50031038 Junction 31 240 3,00031040 Junction 31 220 1,50031042 Junction 31 245 1,50031044 Junction 31 210 3,00031048 Junction 31 220 1,50031050 Junction 31 200 3,00031052 Junction 31 250 1,50031054 Junction 31 250 1,50031056 Junction 31 245 1,96031058 Junction 31 230 1,83031060 Junction 31 280 4,00031062 Junction 31 305 4,00031064 Junction 31 330 1,50031066 Junction 31 300 1,50031074 Junction 31 310 3,00031076 Junction 31 290 1,50031078 Junction 31 265 1,50031080 Junction 31 295 1,50031082 Junction 31 350 1,50031084 Junction 31 318 3,00031086 Junction 31 280 3,00031088 Junction 31 255 1,50031090 Junction 31 240 3,00031092 Junction 31 240 1,50031094 Junction 31 245 1,50031096 Junction 31 250 1,50031098 Junction 31 270 1,50031100 Junction 31 265 1,50031102 Junction 31 275 1,50031104 Junction 31 335 1,50031106 Junction 31 275.9 3,00031112 Junction 31 280 3,00031118 Junction 31 320 3,00031122 Junction 31 265 3,00031124 Junction 31 260 3,00031126 Junction 31 260 3,00031128 Junction 31 255 3,00031130 Junction 31 250 3,00031132 Junction 31 245 3,00031134 Junction 31 250 3,00031136 Junction 31 240 3,00031138 Junction 31 250 3,00031140 Junction 31 245 3,00031142 Junction 31 240 1,500A 2007 Treated <strong>Water</strong> <strong>Master</strong> <strong>Plan</strong> Update E-49
Appendix EFire Flow Analysis ResultsTable E-2Av<strong>ai</strong>lable Fireflow, All Locations (1)Model ID Model Description Zone Elevation (ft) Av<strong>ai</strong>lable Fireflow(gpm)31144 Junction 31 240 3,00031146 Junction 31 240 1,50031148 Junction 31 230 1,50031150 Junction 31 240 1,50031152 Junction 31 230 3,00031154 Junction 31 235 3,00031156 Junction 31 225 3,00031158 Junction 31 225 3,00031160 Junction 31 230 3,00031162 Junction 31 220 3,00031168 Junction 31 205 3,00031170 Junction 31 225 1,50031172 Junction 31 230 1,50031174 Junction 31 230 1,50031176 Junction 31 230 1,50031178 Junction 31 225 1,50031180 Junction 31 230 1,50031182 Junction 31 225 1,50031184 Junction 31 220 1,50031186 Zone 31 to 21 31 220 1,50031188 Junction 31 225 1,50031190 Junction 31 225 3,00031192 Junction 31 240 3,00031194 Junction 31 235 3,00031196 Junction 31 260 3,00031198 Junction 31 215 1,50031200 Junction 31 215 1,50031204 Junction 31 230 3,00031206 Junction 31 225 2,38031208 Junction 31 235 3,00031210 Junction 31 235 1,50031212 Junction 31 235 3,00031214 Junction 31 260 1,50031216 Junction 31 260 1,50031218 Junction 31 265 1,50031220 Junction 31 230 1,50031222 Junction 31 280 1,50031224 Junction 31 305 1,50031226 Junction 31 320 1,50031228 Junction 31 305 1,50031230 Junction 31 310 1,50031232 Junction 31 325 4,00031234 Junction 31 305 4,00031236 Junction 31 295 1,50031238 Junction 31 310 1,50031240 Junction 31 305 1,50031242 Junction 31 280 1,50031244 Junction 31 255 1,50031246 Junction 31 270 3,00031248 Junction 31 260 1,50031250 Junction 31 240 1,50031252 Junction 31 240 1,50031254 Junction 31 240 1,50031256 Junction 31 280 1,500E-50 2007 Treated <strong>Water</strong> <strong>Master</strong> <strong>Plan</strong> Update A
Appendix EFire Flow Analysis ResultsTable E-2Av<strong>ai</strong>lable Fireflow, All Locations (1)Model ID Model Description Zone Elevation (ft) Av<strong>ai</strong>lable Fireflow(gpm)31258 Junction 31 220 1,50031260 Junction 31 310 3,00031262 Junction 31 260 3,00031264 Junction 31 270 3,00031266 Junction 31 265 1,50031268 Junction 31 265 3,00031270 Junction 31 265 1,50031272 Junction 31 260 1,50031274 Junction 31 260 1,50031276 Junction 31 270 3,00031278 Junction 31 275 3,00031280 Junction 31 260 3,00031282 Junction 31 265 3,00031284 Junction 31 265 1,50031286 Junction 31 260 1,50031288 Junction 31 260 1,50031290 Junction 31 265 1,50031292 Junction 31 270 1,50031294 Junction 31 275 3,00031296 Junction 31 280 3,00031298 Junction 31 275 3,00031300 Junction 31 270 3,00031302 Junction 31 270 3,00031304 Junction 31 295 3,00031306 Junction 31 300 3,00031308 Junction 31 315 3,00031310 Junction 31 310 3,00031312 Junction 31 305 3,00031314 Junction 31 310 3,00031316 Junction 31 310 3,00031318 Junction 31 310 3,00031320 Junction 31 305 3,00031326 Junction 31 280 3,00031328 Junction 31 290 3,00031330 Junction 31 290 3,00031332 Junction 31 285 3,00031334 Junction 31 290 3,00031336 Junction 31 275 3,00031338 Junction 31 270 1,50031340 Junction 31 285 3,00031342 Junction 31 295 3,00031344 Junction 31 290 3,00031346 Junction 31 295 3,00031348 Junction 31 295 3,00031350 Junction 31 300 3,00031352 Junction 31 285 2,93031354 Junction 31 300 3,00031356 Junction 31 295 3,00031360 Junction 31 300 3,00031362 Junction 31 295 3,00031364 Junction 31 295 3,00031366 Junction 31 295 3,00031368 Junction 31 300 3,00031370 Zone 31 to 41 31 310 3,000A 2007 Treated <strong>Water</strong> <strong>Master</strong> <strong>Plan</strong> Update E-51
Appendix EFire Flow Analysis ResultsTable E-2Av<strong>ai</strong>lable Fireflow, All Locations (1)Model ID Model Description Zone Elevation (ft) Av<strong>ai</strong>lable Fireflow(gpm)31372 Junction 31 305 3,00031374 Junction 31 250 2,91031376 Junction 31 240 1,50031378 Junction 31 245 3,00031380 Junction 31 270 1,50031382 Junction 31 275 1,50031384 Junction 31 280 1,50031390 Junction 31 280 3,00031392 Junction 31 305 3,00031398 Junction 31 300 3,00031400 Junction 31 305 2,04031402 Zone 31 to 44 31 305 1,88031404 Junction 31 305 3,00031406 Junction 31 305 3,00031408 Junction 31 310 3,00031410 Junction 31 320 1,50031412 Junction 31 320 3,00031416 Junction 31 300 3,00031418 31 245 1,50031420 31 290 1,50031422 31 290 1,50031424 31 340 1,50031426 31 263 3,00031428 31 239 3,00031430 31 238 1,50031432 31 236 3,00031434 31 223 3,00031438 31 245 1,50031440 31 265 1,50031442 31 278 1,50031444 31 260 2,09031446 31 248 1,50031448 31 200 1,50031452 31 257 3,00031454 31 345 1,50031462 Junction 31 295 3,00031464 Junction 31 225 1,50031466 Junction 31 225 2,70032004 Junction 32 170 1,50032008 Junction 32 280 3,00032010 Junction 32 240 3,00032012 Junction 32 300 3,00032014 Junction 32 260 3,00032016 Junction 32 305 2,75032018 Junction 32 280 3,00032020 Junction 32 230 3,00032022 Junction 32 280 3,00032024 Junction 32 340 3,00032026 Junction 32 280 3,00032028 Junction 32 310 2,85032030 Junction 32 320 3,00032032 Junction 32 315 2,34032034 Junction 32 310 2,46032036 Junction 32 230 1,500E-52 2007 Treated <strong>Water</strong> <strong>Master</strong> <strong>Plan</strong> Update A
Appendix EFire Flow Analysis ResultsTable E-2Av<strong>ai</strong>lable Fireflow, All Locations (1)Model ID Model Description Zone Elevation (ft) Av<strong>ai</strong>lable Fireflow(gpm)32038 Junction 32 260 3,00032040 Junction 32 298 3,00032042 Junction 32 258 3,00032044 Junction 32 240 3,00032046 Junction 32 235 3,00032048 Junction 32 260 1,50032050 Junction 32 230 1,41032051 Junction 32 200 1,52032052 Junction 32 190 1,58032054 Junction 32 245 3,00032056 Junction 32 205 3,00032058 Junction 32 340 3,00032060 Junction 32 260 3,00032062 Junction 32 260 3,00032064 Junction 32 220 3,00032066 Junction 32 235 1,50032068 Junction 32 260 1,50032070 Junction 32 298 1,50032072 Junction 32 238 1,50032074 Junction 32 255 1,50032076 Junction 32 270 1,50032078 Junction 32 300 1,50032080 Junction 32 295 1,50032082 Junction 32 278 1,50032092 Junction 32 270 3,00032108 32 300 3,00033002 Junction 33 270 3,00033004 Junction 33 218 3,00033006 Junction 33 230 3,00033008 Junction 33 260 2,24033012 Junction 33 230 3,00033016 Junction 33 261 2,90033018 Junction 33 230 1,50033020 Junction 33 278 3,00033022 Junction 33 240 1,50033028 Junction 33 240 1,50033030 Junction 33 220 3,00033032 Junction 33 185 1,50033034 33 245 2,85033036 33 225 3,000340002 398027-620 Northgate 34 259 1,500340004 398027-620 Northgate 34 285 1,500340006 398027-620 Northgate 34 285 1,500340008 398027-620 Northgate 34 331 1,06034004 34 250 1,50034006 34 255 1,50034008 34 250 1,50034010 Junction 34 328 1,16034012 Junction 34 328 1,14034032 Junction 34 320 1,50034034 Junction 34 316 1,50034036 Junction 34 316 1,50034038 Junction 34 270 1,50034040 Junction 34 260 1,500A 2007 Treated <strong>Water</strong> <strong>Master</strong> <strong>Plan</strong> Update E-53
Appendix EFire Flow Analysis ResultsTable E-2Av<strong>ai</strong>lable Fireflow, All Locations (1)Model ID Model Description Zone Elevation (ft) Av<strong>ai</strong>lable Fireflow(gpm)34042 Junction 34 265 1,50034044 Junction 34 320 1,50034046 Junction 34 240 1,50034048 Junction 34 220 1,50034050 Junction 34 238 1,50034054 Junction 34 258 1,50034056 Junction 34 318 1,50034058 Junction 34 338 1,50034060 Junction 34 318 1,50034062 Junction 34 270 1,50034064 Junction 34 275 1,50034066 Junction 34 258 1,50034068 Junction 34 240 1,50034070 Junction 34 238 1,50034072 Junction 34 245 1,50034074 Junction 34 260 1,50034076 Junction 34 310 1,50034078 Junction 34 300 1,50034084 Junction 34 267 1,50034086 Junction 34 260 1,500340860 398031-The Vistas @ Boundary Oaks 34 258 3,000340864 398031-The Vistas @ Boundary Oaks 34 242 1,760340866 398031-The Vistas @ Boundary Oaks 34 248 2,790340868 398031-The Vistas @ Boundary Oaks 34 248 1,500340870 398031-The Vistas @ Boundary Oaks 34 248 2,100340872 398031-The Vistas @ Boundary Oaks 34 234 78034090 Junction 34 340 1,50034092 <strong>Water</strong> User #7 34 260 1,50035000 Zone Boundary 35 230 1,500350000 Junction 35 290 1,500350002 Junction 35 310 1,50035002 Junction 35 240 1,50035004 Junction 35 240 1,50035006 Junction 35 262 1,50035008 Junction 35 270 1,50035010 Site 123 - Shell Ridge 35 301 1,50035012 Junction 35 262 1,50035014 Junction 35 300 1,50035020 Junction 35 290 1,50035024 Junction 35 270 1,50035030 Junction 35 287 1,50035139 Junction 35 260 1,50041000 Zone 41 to Zone 51 41 435 1,50041002 Junction 41 420 1,50041004 Junction 41 415 3,00041008 Junction 41 380 2,76041010 Junction 41 380 2,74041012 Junction 41 345 3,00041014 Junction 41 350 1,50041016 Junction 41 345 1,50041018 Junction 41 350 1,50041022 Junction 41 410 3,00041024 Junction 41 415 3,00041026 Junction 41 415 3,000E-54 2007 Treated <strong>Water</strong> <strong>Master</strong> <strong>Plan</strong> Update A
Appendix EFire Flow Analysis ResultsTable E-2Av<strong>ai</strong>lable Fireflow, All Locations (1)Model ID Model Description Zone Elevation (ft) Av<strong>ai</strong>lable Fireflow(gpm)41028 Junction 41 385 3,00041030 Junction 41 395 3,00041032 Junction 41 415 1,50041034 Junction 41 380 1,50041036 Junction 41 375 1,50041038 Junction 41 385 1,50041040 Junction 41 420 1,50041042 Junction 41 400 1,50041044 Junction 41 400 1,50041046 Junction 41 440 1,50041048 Junction 41 400 1,50041050 Junction 41 425 1,50041052 Junction 41 420 1,50041054 Junction 41 345 1,50041056 Junction 41 330 1,50041058 Junction 41 360 1,50041060 Junction 41 415 1,50041062 Junction 41 350 1,50041064 Junction 41 345 1,50041066 Junction 41 335 1,50041068 Junction 41 330 1,50041070 Junction 41 345 1,50041072 Junction 41 335 1,50041074 Junction 41 385 1,50041076 Junction 41 415 3,00041078 Junction 41 400 3,00041080 Junction 41 400 3,00041084 Junction 41 390 1,50041086 Junction 41 400 1,50041088 Junction 41 400 1,50041090 Junction 41 425 1,50041092 Junction 41 440 1,42041094 Junction 41 440 1,50041096 Junction 41 420 1,50041098 Junction 41 415 1,50041100 Junction 41 400 1,50041102 Junction 41 395 1,50041104 Junction 41 360 1,50041106 Junction 41 390 1,50041110 Junction 41 440 1,40041118 Junction 41 345 3,00041122 Zone 4 to Zone 5 41 305 3,00041124 Junction 41 310 4,00041126 Junction 41 320 4,00041128 Junction 41 335 1,50041130 Junction 41 335 1,50041132 Junction 41 345 1,50041134 Junction 41 350 1,50041136 Junction 41 385 1,500411376 Junction 41 337 4,00041138 Junction 41 390 1,500411392 398025-Boatwright Sports Complex 41 307 4,000411394 398025-Boatwright Sports Complex 41 312 3,00041140 Junction 41 390 1,500A 2007 Treated <strong>Water</strong> <strong>Master</strong> <strong>Plan</strong> Update E-55
Appendix EFire Flow Analysis ResultsTable E-2Av<strong>ai</strong>lable Fireflow, All Locations (1)Model ID Model Description Zone Elevation (ft) Av<strong>ai</strong>lable Fireflow(gpm)41142 Junction 41 385 1,50041144 Junction 41 380 3,00041146 Junction 41 345 1,50041148 Junction 41 400 1,50041150 Junction 41 355 1,50041152 Junction 41 340 3,00041154 Junction 41 335 3,00041156 Junction 41 330 3,00041158 Junction 41 330 3,00041160 Junction 41 320 3,00041162 Junction 41 375 1,50041164 Junction 41 405 1,50041166 Junction 41 415 1,50041170 Junction 41 360 1,50041172 Junction 41 385 1,50041174 Junction 41 350 1,50041176 Junction 41 355 3,00041178 Junction 41 335 3,00041180 Junction 41 340 3,00041182 Junction 41 335 2,56041184 Junction 41 325 2,79041186 Junction 41 330 3,00041188 Junction 41 325 3,00041190 Junction 41 320 3,00041192 Junction 41 320 3,00041194 Boundry Node 41 310 3,00041196 Junction 41 305 3,00041198 41 390 2,20041200 Junction 41 300 3,00041204 Junction 41 300 3,00041206 Junction 41 305 3,00041208 Junction 41 375 3,00041210 Junction 41 330 3,00041212 Junction 41 340 3,00041214 Junction 41 390 2,85041216 Junction 41 340 1,50041218 Junction 41 340 1,50041220 Junction 41 330 1,50041222 Junction 41 320 1,50041224 Junction 41 320 3,00041226 Junction 41 320 1,50041228 Junction 41 330 1,50041230 Junction 41 320 3,00041232 Junction 41 320 1,50041234 Junction 41 320 1,50041236 Junction 41 320 1,50041238 Junction 41 340 1,50041240 Junction 41 340 1,50041244 Junction 41 355 3,00041246 Junction 41 345 3,00041252 Junction 41 400 1,50041256 Junction 41 375 3,00041258 Junction 41 400 3,00041260 Junction 41 380 1,500E-56 2007 Treated <strong>Water</strong> <strong>Master</strong> <strong>Plan</strong> Update A
Appendix EFire Flow Analysis ResultsTable E-2Av<strong>ai</strong>lable Fireflow, All Locations (1)Model ID Model Description Zone Elevation (ft) Av<strong>ai</strong>lable Fireflow(gpm)41262 Junction 41 370 3,00041264 Junction 41 390 3,00041270 Junction 41 360 1,50041272 Junction 41 355 1,50041274 Junction 41 360 1,50041276 Junction 41 320 1,50041278 Junction 41 360 1,38041280 41 385 3,00041282 41 350 4,00041284 41 395 3,00041286 41 385 3,00041288 41 375 3,00041290 41 415 1,50041292 41 400 1,50041294 41 375 3,00041296 41 360 1,50041298 41 340 3,00041300 41 330 3,00041302 41 325 3,00041304 41 340 1,50041306 41 350 1,50041308 41 358 1,50041310 41 340 1,50041312 41 350 1,50041314 41 347 1,50041316 41 390 1,50041318 41 385 1,50041320 41 365 2,97041322 41 400 3,00041334 Junction 41 425 1,50042000 Elderwood 42 391.5 1,50042002 Junction 42 360 1,50042004 Junction 42 380 1,50042006 Junction 42 318 1,50042008 Junction 42 300 1,50042010 Junction 42 280 1,50042012 Junction 42 320 1,50042014 Junction 42 395 1,50042016 Junction 42 325 3,00042018 Junction 42 330 3,00042020 Junction 42 362 2,90042022 Junction 42 362 1,50042024 Junction 42 366 1,50042026 Junction 42 381 1,50042028 Junction 42 318 1,50042030 Junction 42 282 1,50042032 Junction 42 380 1,50042034 Junction 42 385 3,00042036 Junction 42 373 3,00042038 Junction 42 300 3,00042040 Junction 42 324 1,50042042 Junction 42 257 1,50042044 Junction 42 266 1,50042046 Junction 42 360 1,500A 2007 Treated <strong>Water</strong> <strong>Master</strong> <strong>Plan</strong> Update E-57
Appendix EFire Flow Analysis ResultsTable E-2Av<strong>ai</strong>lable Fireflow, All Locations (1)Model ID Model Description Zone Elevation (ft) Av<strong>ai</strong>lable Fireflow(gpm)42048 Junction 42 360 2,78042050 Junction 42 340 1,50042052 Junction 42 310 2,65042054 Junction 42 360 2,33042056 Junction 42 411 3,00042058 Junction 42 411 2,53042060 Junction 42 405 3,00042062 Junction 42 360 3,00042064 Junction 42 320 1,50042066 Junction 42 360 1,50042068 Junction 42 300 3,00042070 Junction 42 320 1,50042072 Junction 42 320 1,50042074 Junction 42 315 1,50042076 Junction 42 305 1,50042078 Junction 42 290 1,50042080 Junction 42 320 1,50042082 Junction 42 340 1,50042084 Junction 42 340 1,50042086 Junction 42 360 1,50042096 42 329 1,50042098 42 310 3,00042100 42 317 1,50042106 New Junction 42 395 2,02042108 New Junction 42 402 1,92042110 New Junction 42 389 1,34043002 Zone Boundary 43 325 1,50043004 Junction 43 380 1,50043006 Junction 43 435 1,50043012 Junction 43 495 1,50043014 Junction 43 485 1,50043016 Junction 43 385 1,50043018 Junction 43 340 1,50043020 Junction 43 335 1,50044002 Junction 44 360 1,50044004 Junction 44 440 1,50044006 Junction 44 350 1,50044008 Junction 44 345 1,50044010 Junction 44 365 1,50044012 Junction 44 370 1,50044014 Junction 44 375 1,50044016 Junction 44 335 1,50044018 Junction 44 340 1,50044020 Junction 44 320 1,50044026 Junction 44 325 3,00044028 Junction 44 360 3,00044030 Junction 44 335 3,00044032 Junction 44 320 3,00044034 Junction 44 310 3,00044036 Junction 44 345 3,0005100020 397025-Crystyl Ranch 51 578 1,500510026 397025-Crystyl Ranch 51 594 1,500510038 397025-Crystyl Ranch 51 502 1,270510040 397025-Crystyl Ranch 51 468 1,500E-58 2007 Treated <strong>Water</strong> <strong>Master</strong> <strong>Plan</strong> Update A
Appendix EFire Flow Analysis ResultsTable E-2Av<strong>ai</strong>lable Fireflow, All Locations (1)Model ID Model Description Zone Elevation (ft) Av<strong>ai</strong>lable Fireflow(gpm)510042 397025-Crystyl Ranch 51 508 1,500510044 397025-Crystyl Ranch 51 478 1,500510046 397025-Crystyl Ranch 51 541 1,500510052 397025-Crystyl Ranch 51 508 1,500510056 397025-Crystyl Ranch 51 556 950510058 397025-Crystyl Ranch 51 562 1,500510060 397025-Crystyl Ranch 51 538 970510062 397025-Crystyl Ranch 51 560 1,500510072 397025-Crystyl Ranch 51 492 1,500510074 397025-Crystyl Ranch 51 493 1,500510076 397025-Crystyl Ranch 51 564 1,500510078 397025-Crystyl Ranch 51 545 1,50051008 Junction 51 555 1,500510080 397025-Crystyl Ranch 51 552 1,500510082 397025-Crystyl Ranch 51 548 1,500510084 397025-Crystyl Ranch 51 486.5 1,500510086 397025-Crystyl Ranch 51 517 1,500510088 397025-Crystyl Ranch 51 564.5 1,500510090 397025-Crystyl Ranch 51 570 1,460510092 397025-Crystyl Ranch 51 564 1,500510094 397025-Crystyl Ranch 51 570 1,310510096 397025-Crystyl Ranch 51 551 1,500510098 397025-Crystyl Ranch 51 558 1,50051010 Junction 51 585 1,470510100 397025-Crystyl Ranch 51 568 1,500510102 397025-Crystyl Ranch 51 570 1,500510104 397025-Crystyl Ranch 51 568 1,500510106 397025-Crystyl Ranch 51 476.5 1,500510108 397025-Crystyl Ranch 51 435.25 1,500510110 397025-Crystyl Ranch 51 423 1,500510112 397025-Crystyl Ranch 51 428.5 1,500510114 397025-Crystyl Ranch 51 523.5 1,500510116 397025-Crystyl Ranch 51 520 1,500510118 397025-Crystyl Ranch 51 538 1,50051012 Junction 51 580 1,330510126 397025-Crystyl Ranch 51 490 1,500510128 397025-Crystyl Ranch 51 533 1,500510130 397025-Crystyl Ranch 51 590 1,50051016 Junction 51 525 3,00051018 Junction 51 520 1,50051020 Junction 51 520 1,50051022 Junction 51 520 1,50051024 Junction 51 530 1,50051026 Junction 51 550 1,50051028 junction 51 550 1,50051030 Junction 51 540 1,50051032 Junction 51 545 1,50051034 Junction 51 560 1,50051036 Junction 51 510 1,50051038 Junction 51 560 1,50051040 Junction 51 580 1,50051042 Junction 51 580 1,50051044 Junction 51 520 1,50051046 Junction 51 505 1,500A 2007 Treated <strong>Water</strong> <strong>Master</strong> <strong>Plan</strong> Update E-59
Appendix EFire Flow Analysis ResultsTable E-2Av<strong>ai</strong>lable Fireflow, All Locations (1)Model ID Model Description Zone Elevation (ft) Av<strong>ai</strong>lable Fireflow(gpm)51048 Junction 51 520 1,50051050 Junction 51 535 1,50051052 Junction 51 565 1,50051054 Junction 51 545 1,50051058 Junction 51 515 1,50051060 Junction 51 500 1,50051062 Junction 51 480 1,50051064 Junction 51 460 1,50051066 Junction 51 540 1,50051068 Junction 51 600 1,50051070 Junction 51 600 1,35051072 Junction 51 605 1,23051074 Junction 51 550 1,50051076 Junction 51 540 1,50051078 Junction 51 585 1,50051080 Junction 51 585 1,50051082 Junction 51 560 1,50051084 Junction 51 550 1,50051086 Junction 51 550 1,50051088 Junction 51 575 1,50051090 Junction 51 560 1,50051092 Junction 51 550 1,50051094 Junction 51 540 1,50051096 Junction 51 550 1,50051098 Junction 51 560 1,50051100 Junction 51 540 3,00051102 Junction 51 520 3,00051104 Junction 51 510 3,00051106 Junction 51 495 1,50051108 Junction 51 520 1,50051110 Junction 51 480 1,50051112 Junction 51 525 3,00051118 Junction 51 545 67051120 Junction 51 560 61051122 Junction 51 520 1,50051124 Junction 51 480 1,50051128 Junction 51 540 3,00051130 Junction 51 440 1,50051132 Junction 51 500 3,00051134 Junction 51 460 3,00051136 Junction 51 500 1,50051138 Junction 51 560 1,50051140 Junction 51 565 1,50051144 Junction 51 460 1,50051146 Junction 51 500 1,50051148 Junction 51 440 3,00051150 Junction 51 450 3,00051154 Junction 51 495 1,50051156 Junction 51 470 3,00051158 Junction 51 545 1,50051160 Junction 51 535 1,50051162 Junction 51 530 1,50051164 Junction 51 480 1,50051166 Junction 51 540 1,500E-60 2007 Treated <strong>Water</strong> <strong>Master</strong> <strong>Plan</strong> Update A
Appendix EFire Flow Analysis ResultsTable E-2Av<strong>ai</strong>lable Fireflow, All Locations (1)Model ID Model Description Zone Elevation (ft) Av<strong>ai</strong>lable Fireflow(gpm)51168 Junction 51 520 1,50051170 Junction 51 485 1,500511700 398029-16" Clayton M<strong>ai</strong>n Replacement 51 420 3,000511702 398029-16" Clayton M<strong>ai</strong>n Replacement 51 422 3,000511706 398029-16" Clayton M<strong>ai</strong>n Replacement 51 424 1,500511712 398029-16" Clayton M<strong>ai</strong>n Replacement 51 440 3,000511716 398029-16" Clayton M<strong>ai</strong>n Replacement 51 424 3,00051172 Junction 51 470 1,50051174 Junction 51 420 3,00051176 Junction 51 400 3,00051182 Junction 51 545 3,00051188 Junction 51 430 1,50051190 Junction 51 425 3,00051192 Junction 51 435 3,00051196 Junction 51 460 1,50051198 Junction 51 440 1,50051200 Junction 51 420 1,50051202 Junction 51 395 3,00051204 Junction 51 400 3,00051206 Junction 51 395 3,00051208 Junction 51 530 1,50051210 Junction 51 490 1,50051212 Junction 51 465 1,50051214 Junction 51 430 1,50051216 Junction 51 520 1,50051218 Junction 51 485 1,50051220 Junction 51 490 1,50051222 Junction 51 495 1,50051224 Junction 51 465 1,50051226 Junction 51 460 3,00051228 Junction 51 470 1,50051230 Junction 51 460 1,50051232 Junction 51 445 3,00051234 Junction 51 445 1,50051236 Junction 51 430 1,50051240 Junction 51 424.5 3,00051244 Junction 51 440 3,00051246 51 415 3,00051248 Junction 51 430 3,00051250 Junction 51 440 3,00051252 Junction 51 440 3,00051254 Junction 51 585 1,50051258 Junction 51 560 3,00051260 Junction 51 545 3,00051262 Junction 51 520 1,50051264 Z5 to Z6 51 525 1,50051274 Junction 51 512 3,00051276 Junction 51 505 3,00051278 Junction 51 510 1,50051280 Junction 51 500 1,50051282 Junction 51 480 1,50051284 Junction 51 480 1,50051286 Junction 51 475 3,00051292 Junction 51 435 3,000A 2007 Treated <strong>Water</strong> <strong>Master</strong> <strong>Plan</strong> Update E-61
Appendix EFire Flow Analysis ResultsTable E-2Av<strong>ai</strong>lable Fireflow, All Locations (1)Model ID Model Description Zone Elevation (ft) Av<strong>ai</strong>lable Fireflow(gpm)51294 Junction 51 420 3,00051300 Junction 51 425 3,000513000 198601-Condor Way 51 535 1,500513002 198601-Condor Way 51 550 1,500513003 198601-Condor Way 51 570 1,50051302 Junction 51 475 1,50051304 Zone 5 to Zone 4 51 435 1,50051306 Junction 51 440 3,00051310 Junction 51 610 1,50051314 Junction 51 465 1,50051316 Junction 51 460 1,50051318 Junction 51 500 1,50051320 Junction 51 440 1,50051322 Zone 5 to Zone 4 51 440 1,50051324 Zone 4 to Zone 5 51 440 1,50051326 Junction 51 480 1,50051328 Junction 51 500 1,50051330 Junction 51 505 1,50051332 Junction 51 555 1,50051334 Junction 51 455 1,50051336 Junction 51 435 1,50051338 Zone 5 to Zone 4 51 430 1,50051340 Junction 51 460 1,50051342 Junction 51 465 1,50051344 Junction 51 520 1,50051346 Junction 51 500 1,50051348 Junction 51 520 1,50051350 Junction 51 500 3,00051352 Junction 51 500 1,50051354 Junction 51 495 1,50051356 Junction 51 440 1,50051358 Zone 5 to Zone 4 51 430 3,00051366 Junction 51 440 1,50051368 Junction 51 480 3,00051370 Junction 51 440 1,50051372 Junction 51 440 1,50051374 Junction 51 490 3,00051376 Junction 51 510 1,50051378 Junction 51 525 3,00051380 Junction 51 500 3,00051382 Zone 5 to Zone 4 51 415 3,00051386 Junction 51 421.5 1,50051388 Junction 51 420 1,50051390 Junction 51 400 1,50051392 Junction 51 400 1,50051394 Junction 51 460 1,50051400 Junction 51 410 3,00051402 51 415 3,00051404 51 420 3,00051406 51 605 1,50051408 51 455 1,50051410 51 430 1,50051412 51 444 1,50051414 51 530 1,500E-62 2007 Treated <strong>Water</strong> <strong>Master</strong> <strong>Plan</strong> Update A
Appendix EFire Flow Analysis ResultsTable E-2Av<strong>ai</strong>lable Fireflow, All Locations (1)Model ID Model Description Zone Elevation (ft) Av<strong>ai</strong>lable Fireflow(gpm)51416 51 490 1,50051418 51 510 1,50051420 <strong>Water</strong> User #1 51 550 1,50061002 Nob Hill Reservoir 61 800 3,00061004 Junction 61 720 1,50061006 Junction 61 620 1,50061008 Junction 61 620 1,50061010 Junction 61 620 1,50061012 Junction 61 620 1,50061014 Junction 61 620 1,50061016 Junction 61 660 1,50061018 Junction 61 640 1,50061020 Junction 61 620 3,00061022 Junction 61 590 3,00061024 Junction 61 600 1,50061026 Junction 61 640 1,50061028 Junction 61 600 3,000610280 Junction 61 600 97061030 Junction 61 590 1,50061036 Junction 61 545 1,50061038 Junction 61 600 2,97061040 Junction 61 600 1,50061088 61 660 3,00063050 Junction 63 596 1,50063054 Junction 63 680 1,50063056 Junction 63 655 1,50063058 Junction 63 720 1,50063060 Junction 63 715 1,50063068 Junction 63 710 1,50063070 Junction 63 625 1,50063074 Junction 63 600 1,50063076 Junction 63 640 1,50063078 Junction 63 715 1,50063082 Junction 63 760 1,28063084 Junction 63 760 1,27063086 Junction 63 770 1,14063090 Junction 63 665 1,50063092 Junction 63 665 1,50063094 Junction 63 715 1,50063096 Junction 63 680 1,50064000 397025-Crystyl Ranch 64 578 83064002 397025-Crystyl Ranch 64 590 1,50064004 397025-Crystyl Ranch 64 590 1,50064006 397025-Crystyl Ranch 64 599 1,50064008 397025-Crystyl Ranch 64 620 1,50064010 397025-Crystyl Ranch 64 627 1,50064012 397025-Crystyl Ranch 64 594 1,50064014 397025-Crystyl Ranch 64 604 1,50064016 397025-Crystyl Ranch 64 616 1,50064018 397025-Crystyl Ranch 64 630 1,12064020 397025-Crystyl Ranch 64 649 84064022 397025-Crystyl Ranch 64 624 1,50064024 397025-Crystyl Ranch 64 640 1,13064026 397025-Crystyl Ranch 64 612 1,500A 2007 Treated <strong>Water</strong> <strong>Master</strong> <strong>Plan</strong> Update E-63
Appendix EFire Flow Analysis ResultsTable E-2Av<strong>ai</strong>lable Fireflow, All Locations (1)Model ID Model Description Zone Elevation (ft) Av<strong>ai</strong>lable Fireflow(gpm)64028 397025-Crystyl Ranch 64 600 1,50064030 397025-Crystyl Ranch 64 575 99064032 397025-Crystyl Ranch 64 584 1,50064034 397025-Crystyl Ranch 64 594 1,50064042 397025-Crystyl Ranch 64 639 1,50069002 Junction 69 600 86069004 Junction 69 540 1,29069006 Junction 69 540 1,29069012 Junction 69 600 1,33069014 Junction 69 600 1,36069016 Junction 69 590 1,50069018 Junction 69 580 1,50069020 Junction 69 580 1,50069022 Junction 69 620 1,50069024 Junction 69 640 1,37069028 Junction 69 590 1,50069030 Junction 69 595 2,09069032 Junction 69 680 1,50069038 Junction 69 660 1,50071004 Junction 71 920 1,50071006 Junction 71 890 1,50071008 Junction 71 720 4,00071010 Nob Hill Reservoir 71 800 4,00072000 Junction 72 838 1,50072002 Junction 72 828 1,50072010 Junction 72 721 1,50072012 Junction 72 726 1,50072014 Junction 72 740 1,50072016 Junction 72 762 1,50072018 Junction 72 797 1,50072020 Junction 72 819 1,50072022 Junction 72 848 1,50072024 Junction 72 809 1,50072026 Junction 72 833 1,50072028 Junction 72 744 1,50072030 Junction 72 790 1,50072032 Junction 72 821 1,50072046 Junction 72 704 1,50073000 Zone 7 73 760 1,50073002 Junction 73 857 1,50073014 Junction 73 778 1,50073016 Junction 73 754 1,50073020 Junction 73 843 1,50079002 Junction 71 820 60079004 Junction 71 825 59079006 Junction 71 800 72079008 Junction 71 800 73079010 Junction 71 730 98079012 Junction 71 725 1,00079014 Junction 71 705 1,11079016 Junction 71 705 1,16079018 Junction 71 710 1,21079020 Junction 71 700 1,17079022 Junction 71 705 1,260E-64 2007 Treated <strong>Water</strong> <strong>Master</strong> <strong>Plan</strong> Update A
Appendix EFire Flow Analysis ResultsTable E-2Av<strong>ai</strong>lable Fireflow, All Locations (1)Model ID Model Description Zone Elevation (ft) Av<strong>ai</strong>lable Fireflow(gpm)79024 Junction 71 750 1,07079026 Junction 71 760 1,03079028 Junction 71 680 1,50079030 Junction 71 680 1,50079032 Junction 71 680 1,50079034 Junction 71 660 1,50079036 Junction 71 660 1,50079038 Junction 71 755 1,50079048 Junction 71 680 1,500820000 Junction 82 940 1,500820002 Junction 82 943 1,500820004 Junction 82 951 1,500820006 Junction 82 950 1,500820008 Junction 82 957 1,500820010 Junction 82 967 1,470820012 Junction 82 870 1,500820014 Junction 82 912 1,500820016 Junction 82 924 1,500820018 Junction 82 870 1,50082002 Junction 82 931 1,500820020 Junction 82 883 1,480820022 Junction 82 885 1,220830028 398035-Peacock Creek Unit 2 83 924 1,500830030 398035-Peacock Creek Unit 2 83 970 1,500830032 398035-Peacock Creek Unit 2 83 970 1,500830034 398035-Peacock Creek Unit 2 83 924 1,500830036 398035-Peacock Creek Unit 2 83 911 1,500830038 398035-Peacock Creek Unit 2 83 911 1,500830040 398035-Peacock Creek Unit 2 83 891 1,500830042 398035-Peacock Creek Unit 2 83 891 1,500830044 398035-Peacock Creek Unit 2 83 870 1,500(1) If junction meets fire flow requirement, the requirement is reported (Single Family Residential - 1,500gpm, Commercial, Multi-Family Residential, Schools - 3,000 gpm, Industrial - 4000 gpm)A 2007 Treated <strong>Water</strong> <strong>Master</strong> <strong>Plan</strong> Update E-65
Appendix FCost Estimating
Appendix FCost EstimatingF.1 IntroductionThe purpose of this appendix is to present the assumptions used in developing order of magnitude costestimates for facilities recommended in the 2007 Treated <strong>Water</strong> <strong>Master</strong> <strong>Plan</strong> Update.The current update of the Cost Estimation Criteria is based on the following:1. <strong>District</strong> experience with pipelines, reservoirs and pump station costs.2. 1994 <strong>CCWD</strong> Cost Manual (final draft).3. 1997 TWMP Update Cost Estimation Criteria (Appendix C of 1997 TWMP update).4. 2002 TWMP Update Cost Estimation Criteria (Appendix B of 2002 TWMP update).5. <strong>CCWD</strong> Cost Estimating Engineering Standard Practice (ESP).6. Land cost information for Central County from County assessor's office.Recommendations for cost criteria for pipelines, pump stations, reservoirs, and land are presented below.F.2 PipelinesBased on previous investigations (Chapter 6), pipeline improvements to the TWSA should range in sizefrom approximately 8-inch to 36-inch in diameter.Cost estimating criteria for the 1997 and 2002 TWMP Updates recommended that pipeline costestimation values from the <strong>CCWD</strong> Cost Manual (Tables 2 and 3 thereto) be used after adjusting forEngineering News Record (ENR) Construction Cost Index (CCI) indices (San Francisco Bay Area) to developunit costs with the application of appropriate multipliers. These conclusions were reached afterevaluating EBMUD cost data, the <strong>District</strong>’s cost estimating manual, and consultant (Carollo) cost data.Review of recent construction cost trends indicate that costs for pipelines have outpaced CCI trends.Instead of adjusting costs using the ENR-CCI, as has been done in previous TWMP updates, an increaseof 130 percent to 160 percent over 2002 TWMP costs was used, based on <strong>District</strong> recent constructionexperience, review with other utilities, and CDM construction division’s experience with recent pipelineconstruction trends. Future cost estimates will be made on a case-by-case basis. The unit costs includethe cost of furnishing and installing pipe, fittings, valves, appurtenances and corrosion control measures.The pipeline costs reflect installation in developed areas.It is recommended that the unit costs shown in Table F-1 be used for the current update of the <strong>Master</strong><strong>Plan</strong> with the application of appropriate multipliers. Future pipeline cost estimates should be reviewed ona case-by-case basis.A 2007 Treated <strong>Water</strong> <strong>Master</strong> <strong>Plan</strong> Update F-1
Appendix FCost EstimatingTable F-1Unit Pipeline Construction Costs2002 2007Diameter, inches Cost, $/ft Cost, $/ftENR CCI Index 7676 91238 79 10312 100 12816 127 16620 180 26424 212 31130 260 40036 308 494The actual construction costs for recently completed pipeline projects are included in Table F-2.Table F-2Pipeline Improvements – Cost BreakdownYearProjectDiameter,inchesConstructionCosts, $M Length, feet Unit Cost, $/ft2000 Port Chicago, Phase I (1) 48 $7,246,000 9,693 7482003 Clayton Transmission 24 $2,008,267 5,120 3922005 Patterson 8 $362,318 4,022 902005 Parkside Drive 8 $145,938 1,037 1412005 Gregory Gardens III 12 $242,279 1,894 1282005 Pleasant Hill Road 16 $220,446 1,450 152(1) This project had a project implementation factor of 32%. Data for the other projects was not av<strong>ai</strong>lable.F.3 Pump StationsIn the 2002 TWMP Update, pump station costs were escalated using the CCI indices. Review of recentconstruction cost trends indicates that pump station construction costs have outpaced CCI trends. CCItrends indicate about 3.5 percent increase per year since 2002. Instead, an increase of about 9 percentper year (total increase of about 50 percent in 5 years) was used, based on <strong>District</strong> recent constructionexperience. This conclusion was reached after evaluating the <strong>District</strong>’s actual construction costs, EBMUDcost curves and consultant’s cost curve data for new pump stations.Costs associated with new pump station facilities include electrical, instrumentation, pumps, internalpiping, valves, and other appurtenances required for a finished pump station. Costs are not included forfencing, landscaping, roadwork and yard piping. These items are not known at this time and are sitespecific. These costs are incorporated into the contingency. Land and building costs for new pumpstations are considered separately and are added to the final project cost. Pump station building costsare adjusted for ENR– Building Cost Index (BCI) indices and are based on a 1,000 square foot building.The estimate is $185,000 for a new facility, based on a unit cost of $185 per square foot.It is recommended that the unit costs given in Table F-3 be used for cost estimating purposes for newpump station projects with the application of appropriate multipliers.F-2 2007 Treated <strong>Water</strong> <strong>Master</strong> <strong>Plan</strong> Update A
Appendix FCost EstimatingTable F-3Unit Pump Station Construction Costs2002ENR CCI Index76762007ENR CCI Index9123 (1)Capacity, GPM Capacity, MGD Unit Cost, $M/MGD Unit Cost, $M/MGD1,000 1.44 0.28 0.432,000 2.88 0.16 0.263,000 4.32 0.14 0.224,000 5.76 0.12 0.185,000 7.20 0.10 0.166,000 8.64 0.10 0.1410,000 14.4 0.07 0.1215,000 21.6 0.07 0.1020,000 28.8 0.06 0.0925,000 36.0 0.06 0.0930,000 43.2 0.06 0.0935,000 50.4 0.06 0.09(1) Costs escalated at approximately 9 percent per year, rather than ratio of ENR CCI (which equates to 3.5 percent per year)based on recent <strong>District</strong> construction experience.The actual construction cost for recently completed pump station projects are included in Table F-4. Thedet<strong>ai</strong>led cost estimates for proposed pump station projects are included in Table F-5.YearServiceZoneFacility NameTable F-4Pump Station Improvements – Cost BreakdownNew/RehabilitationCapacity,MGDConstructionCosts, $MUnit Cost,$M/MGALProjectImplementationMultiplier2001 22 Ygnacio PS New 5.8 $0.96 0.17 45%2001 21Willow PassPS New 28.8 $3.60 0.13 26%2003 51Clayton ValleyPS Rehabilitation 9.6 $0.99 0.10 42%2004 32 Paso Nogal PS Rehabilitation 4.1 $0.64 0.16 49%2006 21 Lime Ridge PS Rehabilitation 23 $1.67 0.07 39%2008 Brentwood New 36 $5.13 0.14 n/aAverage~ 40%A 2007 Treated <strong>Water</strong> <strong>Master</strong> <strong>Plan</strong> Update F-3
Appendix FCost EstimatingNew/ExpansionRecommendedAdditionalCapacity (mgd)FirmTotalTable F-5Pump Station Det<strong>ai</strong>led CostBaseConstruction($M)TotalProjectCostsZone Facility Name($M)11 Pleasant Hill PS (1) - 1.9 1.9 $1.43 0.43 $0.82 $ - $0.82 $1.43$1.43-31 Ayers PS N 6 8 $3.09 0.16 $1.25 $0.19 $1.43 $2.51 $0.58 $3.0941/ 44 Myrtle PS N 6.1 8.1 $3,12 0.16 $1.26 $0.19 $1.45 $2.54 $0.58 $3.1251 Clayton Valley PS E 4.8 4.8 $1.86 0.22 $1.06 $ - $1.06 $1.86 - $1.8661 Seminary PS E 2.8 2.8 $1.31 0.26 $0.72 $ - $0.72 $1.31 - $1.3171 Nob Hill PS E 1.3 1.3 $1.41 0.43 $0.56 $ - $0.56 $0.98 - $0.98Total 22.90 26.90 $11.80 - $5.70 $0.37 $6.07 $10.64 $1.15 $11.80(1) Re-build of existing pump station so that Pleasant Hill Reservoir storage is fully usableUnit CostEquipment CostBuilding CostSubtotalTotal With Contingencyand ImplementationLandTotalF.4 ReservoirsIn the 2002 TWMP Update, reservoir costs were escalated using the CCI indices. Review of recentconstruction cost trends indicates that reservoir construction costs have outpaced CCI trends. CCI trendsindicate about 3.5 percent increase per year since 2002. Instead, an increase of about 9 percent peryear (total increase of about 50 percent in 5 years) was used, based on <strong>District</strong> recent constructionexperience. This conclusion was reached after evaluating consultant’s cost data from other similarburied concrete reservoir projects, and <strong>District</strong>’s actual construction costs of reservoir ranging in sizefrom 0.3 to 10.0 million gallons. The costs include structure, site preparation, valve vaults, seismicvalves, inlet/outlet piping, mechanical, SCADA and electrical costs. The unit costs exclude pipelinerequired to connect to distribution system and land acquisition costs. Land acquisition costs for newreservoirs were developed separately as described in F.5 below and added to the final project costs.Similarly, pipeline costs to connect to the distribution system were developed separately based on unitcost identified in Table F-1 and added to the final project costs.It is recommended that the unit costs listed Table F-6 below be used for the cost estimation purposes forthis update of the <strong>Master</strong> <strong>Plan</strong> with the application of appropriate multipliers.F-4 2007 Treated <strong>Water</strong> <strong>Master</strong> <strong>Plan</strong> Update A
Appendix FCost EstimatingCapacity,MGTable F-6Unit Reservoir Construction Costs2002ENR CCI Index7676Construction Costs, Unit Cost, $M/MGAL2007ENR CCI Index9123 (1)Unit Cost, $M/MGALConstruction Costs,MillionsMillions0.5 0.97 1.94 1.16 3.001.0 1.34 1.34 1.59 2.071.5 1.69 1.13 2.01 1.742.0 2.03 1.01 2.41 1.572.5 2.35 0.94 2.80 1.453.0 2.67 0.89 3.17 1.373.5 2.97 0.85 3.53 1,314.0 3.25 0.81 3.87 1.264.5 3.53 0.78 4.19 1.215.0 3.79 0.76 4.50 1.175.5 4.04 0.73 4.80 1.136.0 4.27 0.71 5.08 1.106.5 4.49 0.69 5.34 1.077.0 4.70 0.67 5.59 1.047.5 4.90 0.65 5.82 1.018.0 5.08 0.64 6.04 0.988.5 5.25 0.62 6.24 0.969.0 5.41 0.60 6.43 0.939.5 5.56 0.58 6.60 0.9010 5.69 0.57 6.76 0.88(1) Costs escalated at approximately 9 percent per year, rather than ratio of ENR CCI (which equates to 3.5 percent per year)based on recent <strong>District</strong> construction experience.The actual construction costs for recently completed storage reservoirs are included in Table F-7. Thedet<strong>ai</strong>led cost estimates for proposed storage reservoir projects are included in Table F-8.Table F-7Storage Improvements – Cost BreakdownConstruction Costs, $Year Reservoir Capacity, MG MillionsUnit Cost, $M/MGAL1993 Taylor 7.5 $4.252 0.57ProjectImplementationMultiplier1995 Powerline 0.45 $0.95 2.12 13%2000 Diablo Hills 4 $5.525 1.381 24%2000 Crystal Ranch 1.14 $2.791 2.45 38%2002 Port <strong>Costa</strong> 0.5 $0.462 0.924 40%2006 Midhill 1.5 $3.81 2.540 n/aAverage~35%A 2007 Treated <strong>Water</strong> <strong>Master</strong> <strong>Plan</strong> Update F-5
Appendix FCost EstimatingF.5 Land AcquisitionAcquisition of property, easement, and right-of-way (ROW) will be required for some of the recommendedprojects, particularly new pump stations and reservoir facilities. As stated in the <strong>CCWD</strong> Cost Manual, landcosts in <strong>Contra</strong> <strong>Costa</strong> County are not easily determined, particularly in the master-planning phase, andvariables affecting properties can result in widely varying land prices.To obt<strong>ai</strong>n current land costs data in the Central County, <strong>District</strong>'s Real Property Division contacted theappr<strong>ai</strong>sal section of the <strong>Contra</strong> <strong>Costa</strong> County assessor's office and inquired about land values for Clayton(including Marsh Creek area), Concord, Pleasant Hill, Martinez, and Walnut Creek. The Assessor's officeconfirmed that there was little difference in land values for these areas and gave a range of $120,000 to$485,000 per acre depending upon the location of a particular site.Land acquisition costs allowances for major facilities recommended with this study would be consistentwith the range of costs presented above. Land cost allowances will be considered separately and inaddition to facility costs. Where recommended facilities are to be located on public property, e.g. withinroad ROWs, no cost will be assigned for land acquisition.F.6 Construction Cost Index AdjustmentsCosts estimated with this study would be adjusted utilizing the Engineering News Record (ENR)construction cost index (CCI), except as noted for pump stations and reservoirs, where a higher escalationrate was used, based on recent construction experience. The ENR-CCI is the primary index utilized by thewater planning and engineering community to adjust cost estimates developed in different years,although other indices such as the Means CCI are sometimes used. The <strong>District</strong> has utilized the ENR-CCIwith previous planning studies, and utilizes the cost index developed for construction in the San FranciscoBay Area.The costs estimated for facilities with this study will be in 2007 dollars, based on the November 2006ENR-CCI index of 9123.F.7 MultipliersThe 1997 and 2002 TWMP Updates determined multipliers to be used for the planning level study. In2002, the construction contingency of 30 percent was applied to the initial estimate of facility cost(excluding land) to determine construction cost estimate. A project implementation multiplier of 35percent was then applied to construction cost estimate to determine total project cost. The projectimplementation multiplier included planning, environmental, design, construction management and legalcost.For the current update of the <strong>Master</strong> <strong>Plan</strong> both the construction contingency and a projectimplementation multiplier will be applied for all facilities, i.e., pipelines, pump stations, and reservoirsidentified in this study. The construction contingency will be applied at 30 percent (same as 1997 and2002 TWMP) of the initial estimate of facility cost to determine the construction estimate. Thecontingency is necessary due to planning level study where det<strong>ai</strong>led designs have not been developed forthe facilities. The contingency includes: additional work identified during design, unforeseen conditionsand change order allowance. The construction contingency does not apply to land costs. The land costsare considered separately and added to facilities cost to determine total construction costs.F-6 2007 Treated <strong>Water</strong> <strong>Master</strong> <strong>Plan</strong> Update A
Appendix FCost EstimatingNew (N) /Expansion (E)/Replacement (4)Table F-8Det<strong>ai</strong>led Recommended Reservoir Capacity ImprovementsDeficiency (mg) Phasing (mg) Cost Allocation ($M)ExistingFutureExistingIntermediate (3)Buildout (4)CapacityTotal ProjectZoneFacility NameNeeded (mg)Costs ($M)11 Country Club E 3.00 - - 3.0 1.37 4.12 24 110 - 0.03 - $7.28Pleasant Hill (1) -- 1.00 1.0 - - 2.07 2.07 - - - - - $-San Miguel E 5.00 - - 5.0 1.17 5.85 24 500 0.05 0.13 - $10.58Site(s) Undetermined R 4.00 - 4.0 1.26 5.03 24 500 - 0.13 - $9.04Site(s) Undetermined R 2.00 - - 2.0 1.57 3.13 24 500 - 0.13 - $5.72Zone 11 Total 15.00 10.00 5.00 1.0 - 14.0 7.43 20.20 - 1,610 0.05 0.41 - $32.62 $21.75 $10.8721 Ayers N 2.00 2.0 - 1.57 3.13 24 1,641 - 0.41 0.58 $6.8022 Valley Vista N 2.00 - 2.0 - 1.57 3.13 20 2,526 - 0.54 0.58 $7.0321/22 Site(s) Undetermined R 2.00 - - 2.0 1.57 3.13 24 500 0.05 0.13 - $5.81Zone 21/22 Total 6.00 4.70 1.30 - 4.0 2.0 4.70 9.40 - 4,667 0.05 1.08 1.16 $19.64 $15.38 $4.26Zone 23/25 (2) Site(s) Undetermined E 1.00 0.70 0.30 - - 1.0 2.07 2.07 24 500 0.05 0.13 - $3.93 $2.75 $1.18Myrtle N 1.00 - 1.0 2.07 2.07 24 618 - 0.16 0.58 $4.4831Site Undetermined R 0.70 - - 0.7 3.00 2.10 24 500 - 0.13 - $3.91Zone 31 Total 1.70 1.10 0.60 - 1.0 0.7 5.07 4.17 - 1,118 - 0.28 0.58 $8.39 $5.43 $2.9632 Martinez Ridge N 0.50 - - 0.5 3.00 1.50 12 85 - 0.01 0.58 $3.2332 Site Undetermined R 0.30 - - 0.3 3.00 0.90 12 500 - 0.06 - $1.69Zone 32 Total 0.80 0.70 0.10 - - 0.8 6.01 2.40 - 585 - 0.07 0.58 $4.92 $4.31 $0.61Zone 34 Site Undetermined N 0.75 0.65 0.10 0.75 - - 3.00 2.25 12 200 0.05 0.02 0.58 $4.66 $4.04 $0.62Zone 35 Site Undetermined N 0.25 0.15 0.10 - - 0.3 3.00 0.75 12 200 - 0.02 0.58 $1.94 $1.16 $0.78Zone 43 Site Undetermined N 0.45 0.35 0.10 - - 0.5 3.00 1.35 12 150 - 0.02 0.58 $2.98 $2.32 $0.66Murchio E 0.50 - - 0.5 3.00 1.50 12 150 - 0.02 - $2.6751Seminary E 1.40 - 1.4 2.07 2.89 12 500 - 0.06 - $5.18Zone 51 Totals 1.90 0.50 1.40 - 1.4 0.5 5.07 4.39 - 650 - 0.08 - $7.85 $2.07 $5.7861 Nob Hill N 1.60 0.40 1.20 - - 1.6 1.74 2.78 20 500 - 0.11 0.58 $5.65 $1.41 $4.2463 Site Undetermined N 0.40 0.30 0.10 - - 0.4 3.00 1.20 12 180 0.05 0.02 0.58 $2.81 $2.11 $0.70Divide E 0.50 - 0.5 - 3.00 1.50 12 190 0.05 0.02 - $2.76 $0.45 $2.3171Site Undetermined N 4.00 - - 4.0 1.26 5.03 12 500 - 0.06 0.58 $9.51 $1.57 $7.94Zone 71 Total 4.55 0.75 3.80 - 0.5 4.0 4.26 6.53 - 690 0.05 0.08 0.58 $12.27 $2.02 $10.25Zone 72/83 -- 0.00 - - - - - 3.00 - - - - - $- $- $-Zone 73 -- 0.00 - - - - - 3.00 - - - - - $- $- $-Zone 82 -- 0.02 - - - - - 3.00 0.06 - - - - $- $- $-Total 34.42 20.30 14.10 1.75 6.9 25.7 57.37 57.56 - 11,050 2.32 5.80 $107.66 $64.75 $42.91Implemented as Near-term Improvements 1.75 $4.66 $4.04 $0.62Implemented as Long-term Storage Improvements 32.60 $103.00 $60.71 $42.29Deferred Storage, Implemented as Long-term Improvements 18.55 $58.61 $58.61 $-Other Long-term Storage Improvements 14.05 $44.39 $2.10 $42.29Totals 34.42 34.40 34.35 $107.66 $64.75 $42.91(1) Assumes Pleasant Hill Reservoir PS rehabilitated, so full reservoir is usable. Cost accounted for in pump improvements table.(2) Assumes Paso Nogal relocation to Country Club(3) Intermediate and buildout scenarios include storage to meet existing deficiencies, but has been deferred. Backup generators have been installed to provide equivalent reliability during emergencies.(4) New reservoirs include land costs. Expansion of replacement of existing reservoirs assumes no land purchase.Unit CostReservoir costPipeline DiameterPipeline lengthSeismic Valve CostPipe costLand CostsExisting CustomersFuture CustomersA 2007 Treated <strong>Water</strong> <strong>Master</strong> <strong>Plan</strong> Update F-7
Appendix FCost EstimatingThe project implementation multiplier will be applied at 35 percent to the construction estimate. The<strong>District</strong> has a performance goal of continued reduction in the project implementation costs based on afive-year rolling average. This multiplier includes: <strong>Plan</strong>ning including Environmental Documents (2 to 5percent); Engineering including Pre-Design and Final Design (10 to 15 percent); ConstructionAdministration and Management including Engineering and Technical Services (material testing services)during Construction (8 to 10 percent); <strong>District</strong> Admin/Legal/Printing and Other Miscellaneous Services (2to 5 percent).Based on the review of the <strong>District</strong>’s current costs, it is recommended that the project implementationmultiplier of 35 (same as 2002 TWMP) percent be used for master planning level estimates.F.8 Cost Estimate AccuracyFacility project cost estimates, including construction contingencies and engineering multipliers, will berounded to the nearest $1,000. For facilities with total estimated costs of less than $10,000, twosignificant figure accuracy will be used.Facility cost estimates developed with this study are considered to be preliminary level, order ofmagnitude estimates appropriate for this master planning project. The accuracy of facility cost estimates,based on the assumptions and the methodology presented herein, should range from 50 percent greaterthan to 30 percent less than what will be the actual total cost of the facility. This accuracy range +50percent/-30 percent, is consistent with American Association of Cost Engineers guidelines for masterplanning studies and with the accuracy used for facilities included with the <strong>District</strong>’s CIP.F-8 2007 Treated <strong>Water</strong> <strong>Master</strong> <strong>Plan</strong> Update A